causes and consequences of tax morale: an … · crema gellertstrasse 18 ch - 4052 basel causes and...
TRANSCRIPT

CREMA
Center for Research in Economics, Management and the Arts
CREMA Gellertstrasse 18 CH - 4052 Basel www.crema-research.ch
Causes and Consequences of Tax Morale:
An Empirical Investigation
Benno Torgler
Markus Schaffner
Working Paper No. 2007 - 11
1
CAUSES AND CONSEQUENCES OF TAX MORALE:
AN EMPIRICAL INVESTIGATION
Benno Torgler∗ a,b,c
and Markus Schaffnera
a
The School of Economics and Finance, Queensland University of Technology, GPO Box
2434, Brisbane, QLD 4001, Australia
b CREMA – Center for Research in Economics, Management and the Arts, Gellertstrasse 18,
CH-4052 Basel, Switzerland
c CESifo, Poschingerstrasse 5, D-81679 Munich, Germany
Abstract: Many taxpayers truthfully declare their income to the tax administration. Why? In this paper
we have found a significant correlation between tax morale and tax evasion, controlling a variety of
factors. Furthermore we have analysed tax morale as dependent variable and studied the determinants
that shape it. The results indicate that factors such as the tax administration, tax system, tax awareness,
compliance perceptions, trust in officials and others, and the willingness to obey have a relatively
strong impact on tax morale.
JEL classification: H260
Keywords: tax morale, tax compliance, tax evasion, tax system, tax administration, social capital
I. INTRODUCTION
Adams’ book (1993) starts with the inscription over the entrance to the Internal Revenue
Service building: “Taxes are what we pay for a civilized society”. An essential question is to
which extent individuals are willing to pay this price. The probability of being audited by the
tax administration is rather low. Elffers (2000) points out that ”the gloomy picture of massive
∗
Corresponding author.
E-mail addresses: [email protected], [email protected].
2
tax evasion is a phantom” (p. 185). A big share of revenues is collected without a draconian
enforcement system. Co-operation in tax compliance experiments is higher than neoclassical
models would predict. What are the reasons? Is tax compliance influenced by tax morale?
What are the determinants that shape tax morale? The main purpose of this paper is to give
answers to these important questions.
To get empirical insights we are going to work with the Taxpayer Opinion Survey
(TOS). In general, surveys give the opportunity to study a variety of factors, especially
attitudes. It is even possible to integrate questions about taxpayers’ behaviour. On the other
hand, we find many critical aspects, as, e.g., possibly biased samples that are not
representative. Tax evasion is a sensitive area, and low response rates can create biases. Thus,
a certain response rate is essential to get good data. The problem with delicate questions is to
obtain honest answers. Jackson and Milliron (1986) point out that the technique used to solicit
responses and the way questions are framed have an effect on the respondents’ answers. One
way to deal with this problem is to conduct and to evaluate a variety of surveys to get a
general picture of the main variables. An excellent method would be to conduct panels or to
do regular surveys in different countries, similar to the structure of the TOS In the last years,
social researchers have intensively used surveys to investigate the causes and consequences of
social capital or compliance behaviour. One reason might be that survey research uses more
sophisticated statistical techniques and design compared to early years.
II. TAX MORALE AND TAX EVASION
Can we find a link between tax morale and tax evasion? Spicer and Lundstedt (1976) pointed
out that the choice between tax compliance and evasion is not only made on the grounds of
sanctions but also on the grounds of a set of attitudes and norms. According to Ajzen and
Fishbein (1980) and Lewis (1982) behaviour can be predicted from attitudes and subjective
norms. This might indicate that there is a connection between tax morale and tax compliance
behaviour. The tax compliance literature has shown the relevance of going beyond a
neoclassical approach when trying to understand why citizens pay taxes. Allingham and
Sandmo’s (1972) groundbreaking model which assumes that the extent of tax evasion is
negatively correlated with the probability of detection and the degree of punishment has been
widely criticized (e.g., Graetz and Wilde, 1985; Alm, McClelland, and Schulze, 1992). In
many countries, the level of deterrence is too low to explain the high degree of tax
3
compliance. To resolve this puzzle of tax compliance, many researchers have argued that tax
morale can help explain the high degree of tax compliance (for an overview see Torgler,
2007). Lewis (1982) points out that “it could be that tax evasion is the only channel through
which taxpayers can express their antipathy … we can be confident in our general prediction
that if tax attitudes become worse, tax evasion will increase” (p. 165, 177).
An increase in tax morale enhances the moral costs of behaving illegally and therefore
reduces the incentives to evade taxes. It is a relevant issue to investigate whether differences
in tax morale across countries are reflected in any differences in real, or observed, behaviours
in these countries. Torgler and Schneider (2007) extend the previous empirical models of the
shadow economy by showing that tax morale matters quite significantly in the determination
of the size of the shadow economy providing strong robustness tests using international and
within country panel data. Frey and Schneider (2000) point out that moral costs could act as a
disincentive to be active in the underground economy: “A good citizen has moral qualms to
undertake a forbidden activity. These moral costs are closely related to ‘tax morale’ which
motivates citizens to pay their dues to the state” (p. 6).
Another possibility could be to compare the tax compliance results from experiments
with a post-experiment questionnaire that helps to get information about subjects’ attitudes
(e.g., Bosco and Mittone 1997). The main disadvantage of such a method is that behaviour
during the experiment might influence people’s answers to the questions. Thus, such
questionnaires are not used in many experiments. Furthermore, in the case of tax compliance
we can not be certain whether subjects make the same choices in the experiment as they
would in the actual situations. On the other hand, researchers have done a great job in
improving the realism of the experiments and tried to analyse cognitive processes that might
be similar in reality (see Torgler 2002).
Other researchers use scenarios involving actions taken by federal income tax return
filers. People have to follow the scenarios and answer questions. Validated scales measure
respondents’ ethical perceptions, moral intensity, and behavioural intentions (see, e.g., Hays
2000). Compared to experiments, the subject samples are normally higher, which makes the
results more generalisable. On the other hand, it is difficult to isolate the effects of a variable
in the way experiments can do.
However, there is still a lack of empirical evidence on the link between attitudes and
behaviour in the tax compliance literature. Why is this so important? The state and the tax
administration have different possibilities to influence tax compliance. Traditional methods
are deterrence factors as, fines, audits, and the variation of the tax rates. But tax compliance
4
literature has shown the limitations of such instruments. Even researchers are not entirely sure
about the effects of lowering tax rates. Graetz and Wilde (1985) point out that lowering tax
rates is supported neither by theory nor by empirical evidence. Lower tax rates, for example,
have also the effect of reducing the costs of underreporting. It seems that taxpayers are more
compliant than traditional models would predict. Thus, knowledge about tax morale could
lead to a better income tax policy.
We are going to work with the Taxpayer Opinion Survey, collected in the United
States in 1987 and providing a broad set of taxpayers’ opinions and evaluations of aspects as,
the tax system, the Internal Revenue Service, tax evasion, cheating on taxes etc. The TOS
offers the possibility to separately analyse two determinants of tax evasion, overstating of
deduction or expenses and underreporting income, as dependent variable. From these
considerations the following hypotheses can be derived:
Hypothesis 1: The lower tax morale, the more individuals overstate deductions or expenses.
Hypothesis 2: The lower tax morale, the more individuals under-report their income.
III. EMPIRICAL EVALUATION
1. Main Variables
Surprisingly, the TOS has not been used by many researchers (see, e.g., Smith 1992, Sheffrin
and Triest 1992). Even if the data set is relatively old, the huge amount of questions and the
fact that not many papers have used the data set, makes it also attractive for newer research
projects (see, e.g., Forest and Sheffrin 2002, using the 1990 TOS). Furthermore, after 1990,
the TOS has not been conducted any more. The sample of 2003 observations is reduced by the
fact that taxpayers had sometimes the possibility to answer “not sure” or not to answer at all.
Tax morale can be defined as the attitude towards tax evasion. The advantage of the
TOS data set is that we find quite a few questions. We are going to use the following
questions (scale from 1 to 6, where 6 means not at all acceptable and 1 means perfectly
acceptable):
1. Trading or exchanging goods or services with a friend or neighbour and not reporting it on
your tax form (TM 1).
2. Reporting your main income fully, but not including some small outside income (TM 2).
5
3. Being paid in cash for a job and then not reporting it on your tax form (TM 3).
4. Not reporting some earnings from investments or interest that the government would not
be able to find out about (TM 4).
5. Stretching medical deductions to include some expenses which are not really medical (TM
5).
Furthermore, the following questions have been asked (6=strongly disagree, 1=strongly agree)
6. With what things cost these days, it’s okay to cut a few corners on your tax form just to
help make ends meet (TM 6).
7. It’s not so wrong to hold back a little bit of taxes since the government spends too much
anyway (TM 7).
8. The chances of getting caught are so low that it is worthwhile trying to cut corners a little
on (TM 8).
9. When you’re not really sure whether or not you deserve a tax deduction, it makes sense to
take a chance and take the deduction anyway (TM 9).
10. It is not so wrong to underreport certain income since it does not really hurt anyone (TM
10).
11. There is nothing wrong with interpreting the ambiguous or grey areas of the tax law to
your own advantage (TM 11).
The literature strongly uses the justifiability of evasion as proxy for tax morale (Torgler
2007). The advantage of these questions compared to other studies is a stronger realism due to
concrete examples, focusing on the income reporting process and the over-deduction
possibilities.
Tax evasion is measured with the following two questions:
1. Within the past five years or so, do you think you might have overstated any deductions or
expenses – like medical, charitable or business deductions, and so forth – even by just a
small amount? Would you say you definitely have, probably have, probably have not, or
definitely have not overstated any (OVERDEDUC)? (1. Definitely have not, 2. Probably
have not, 3. Probably have, 4. Definitely have)
2. Within the past five years or so, do you think you might have left some reportable income
off your federal tax return – even, just a minor amount (UNDERREP)? (1. Definitely
have not, 2. Probably have not, 3. Probably have, 4. Definitely have)
6
There are pros and cons on using such tax evasion measurements. Looking at the empirical
data, the advantage is that we hardly find data that tries to measure the extent of tax evasion in
a survey. So, little empirical evidence is available. Lewis (1982) points out: ”But why not just
ask respondents whether they evade tax or not? If they admit it, ask them how much this
amounts to and perhaps even why they do it? What could be simpler? (…) Maybe it is worth a
try. But some traditional wisdom (and a smattering of social psychology) recommends a
tempering of enthusiasm” (p. 140).
On the other hand, Lewis (1982) is aware of problems with such a procedure. People
might refuse to answer or to take part in such a survey or moderate their views to reduce the
possibility that information are used non-confidentially as, for example, to prosecute
taxpayers. As a consequence, such an approach would generate a tendency to overestimate tax
compliance. Lempert (1992) criticises the scale used in the TOS to catch over-deduction and
under-declarations. Using terms such as ‘probably’ and ‘minor amount’ encourages
individuals to state that tax evasion has been done. Finally, it is difficult to ask people about
their behaviour five years ago.
2. Estimation Results
1. Over-Deductions
First a basic model with mostly demographic variables is estimated. We are going to estimate
11 equations with different tax morale variables. This helps check the sensitivity of the
relationship between tax evasion and tax morale. Ordered probit equations are estimated to
analyse the ranking information of the scaled dependent variables tax evasion/tax morale. In a
second step additional variables are integrated into the analysis. Only one additional variable
has been added to control the problems of missing values, as we have decided not to replace
missing values with a sequence of regression estimates or with mean values. We used the
weighting variable provided by Harris and Associates to get a representative population size.
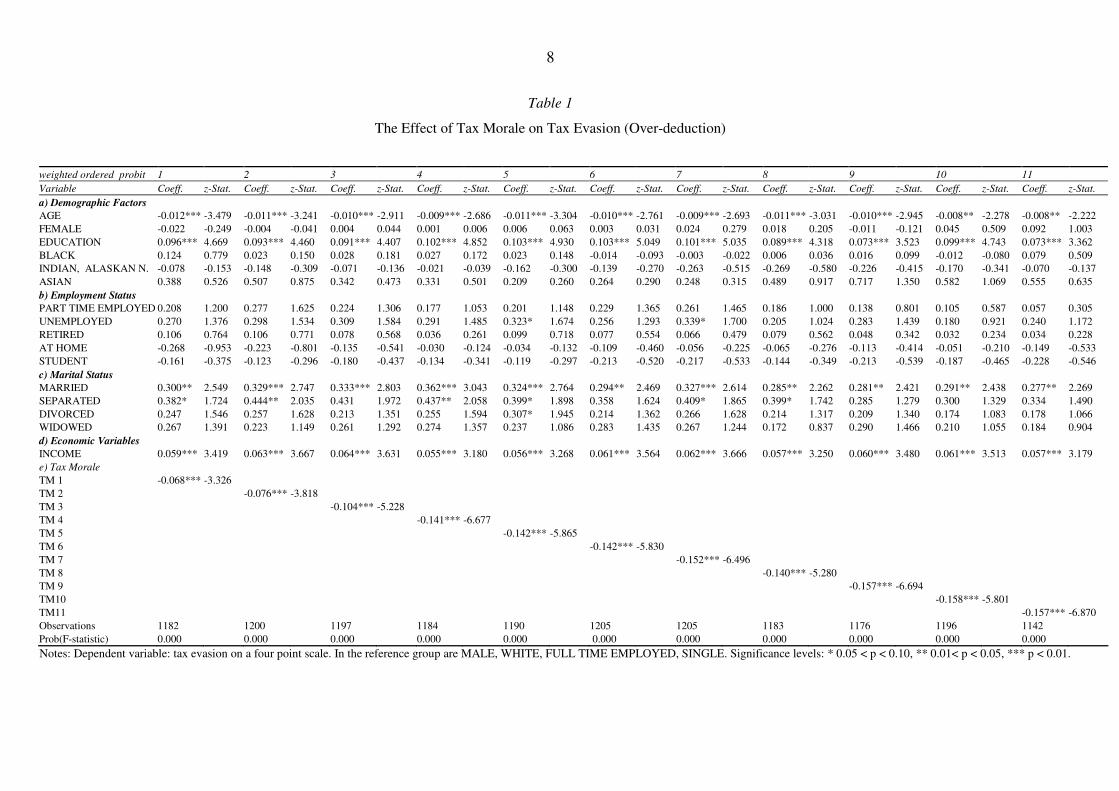
Table 1 presents the results using over-deduction as the dependent variable. All
regressions estimation results are consistent with our hypothesis 1 that the lower tax morale,
the more individuals overstate deductions or expenses. In all equations tax morale is
significant at the 1 percent significance level with a negative sign. To represent the
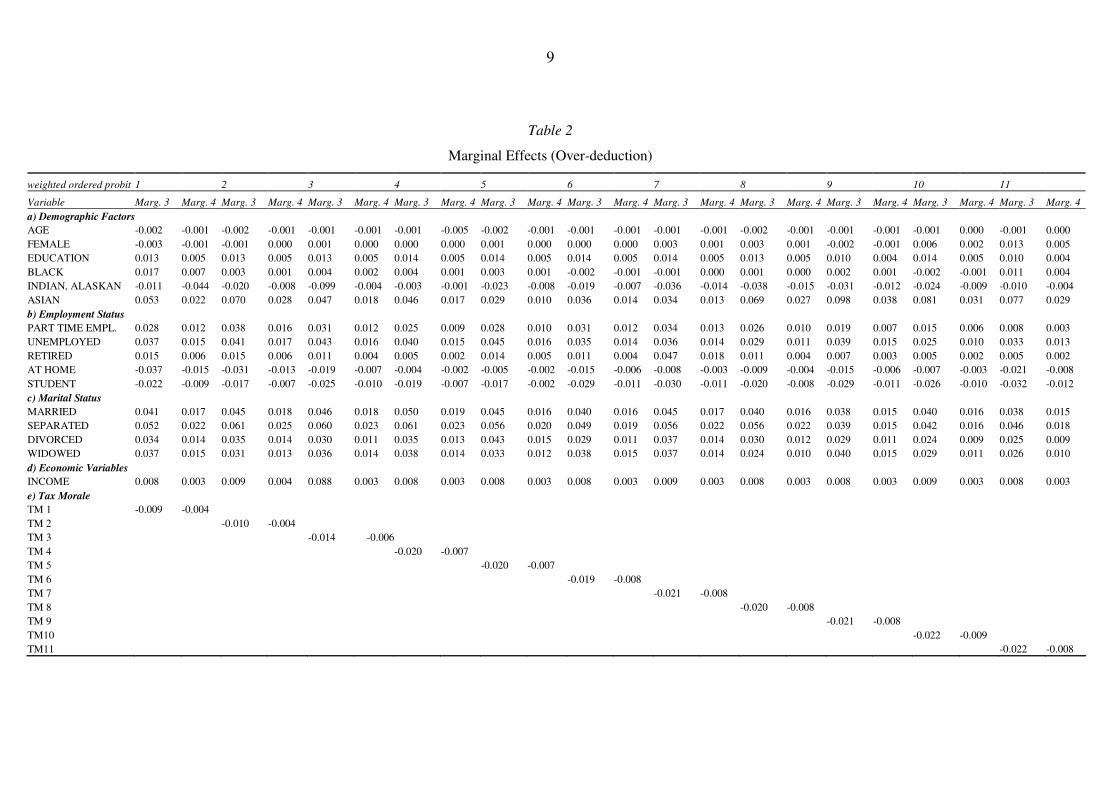
quantitative effects of the variables, Table 2 indicates the marginal effect for the score 3
(probably overstated) and 4 (definitely overstated). The marginal effect indicates the change
in the share of taxpayers (or the probability) belonging to a specific tax evasion level, when
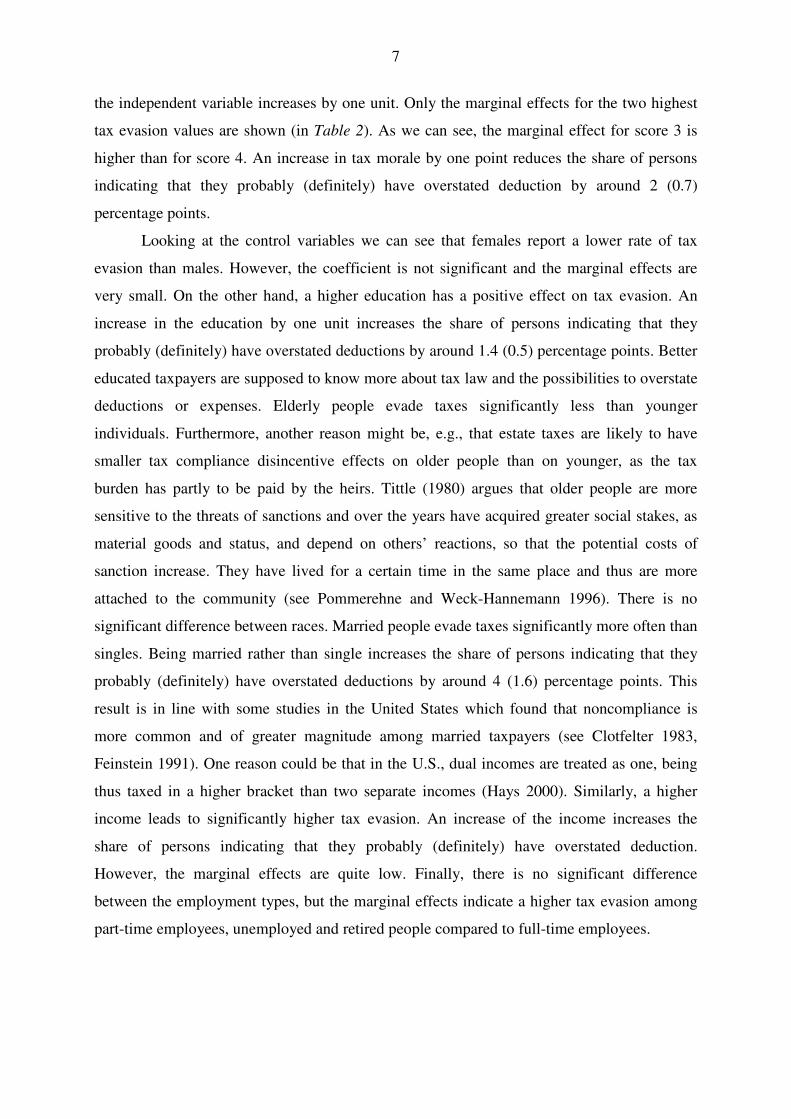
7
the independent variable increases by one unit. Only the marginal effects for the two highest
tax evasion values are shown (in Table 2). As we can see, the marginal effect for score 3 is
higher than for score 4. An increase in tax morale by one point reduces the share of persons
indicating that they probably (definitely) have overstated deduction by around 2 (0.7)
percentage points.
Looking at the control variables we can see that females report a lower rate of tax
evasion than males. However, the coefficient is not significant and the marginal effects are
very small. On the other hand, a higher education has a positive effect on tax evasion. An
increase in the education by one unit increases the share of persons indicating that they
probably (definitely) have overstated deductions by around 1.4 (0.5) percentage points. Better
educated taxpayers are supposed to know more about tax law and the possibilities to overstate
deductions or expenses. Elderly people evade taxes significantly less than younger
individuals. Furthermore, another reason might be, e.g., that estate taxes are likely to have
smaller tax compliance disincentive effects on older people than on younger, as the tax
burden has partly to be paid by the heirs. Tittle (1980) argues that older people are more
sensitive to the threats of sanctions and over the years have acquired greater social stakes, as
material goods and status, and depend on others’ reactions, so that the potential costs of
sanction increase. They have lived for a certain time in the same place and thus are more
attached to the community (see Pommerehne and Weck-Hannemann 1996). There is no
significant difference between races. Married people evade taxes significantly more often than
singles. Being married rather than single increases the share of persons indicating that they
probably (definitely) have overstated deductions by around 4 (1.6) percentage points. This
result is in line with some studies in the United States which found that noncompliance is
more common and of greater magnitude among married taxpayers (see Clotfelter 1983,
Feinstein 1991). One reason could be that in the U.S., dual incomes are treated as one, being
thus taxed in a higher bracket than two separate incomes (Hays 2000). Similarly, a higher
income leads to significantly higher tax evasion. An increase of the income increases the
share of persons indicating that they probably (definitely) have overstated deduction.
However, the marginal effects are quite low. Finally, there is no significant difference
between the employment types, but the marginal effects indicate a higher tax evasion among
part-time employees, unemployed and retired people compared to full-time employees.
8
Table 1
The Effect of Tax Morale on Tax Evasion (Over-deduction)
Notes: Dependent variable: tax evasion on a four point scale. In the reference group are MALE, WHITE, FULL TIME EMPLOYED, SINGLE. Significance levels: * 0.05 < p < 0.10, ** 0.01< p < 0.05, *** p < 0.01.
weighted ordered probit 1 2 3 4 5 6 7 8 9 10 11
Variable Coeff. z-Stat. Coeff. z-Stat. Coeff. z-Stat. Coeff. z-Stat. Coeff. z-Stat. Coeff. z-Stat. Coeff. z-Stat. Coeff. z-Stat. Coeff. z-Stat. Coeff. z-Stat. Coeff. z-Stat.
a) Demographic Factors
AGE -0.012*** -3.479 -0.011*** -3.241 -0.010*** -2.911 -0.009*** -2.686 -0.011*** -3.304 -0.010*** -2.761 -0.009*** -2.693 -0.011*** -3.031 -0.010*** -2.945 -0.008** -2.278 -0.008** -2.222
FEMALE -0.022 -0.249 -0.004 -0.041 0.004 0.044 0.001 0.006 0.006 0.063 0.003 0.031 0.024 0.279 0.018 0.205 -0.011 -0.121 0.045 0.509 0.092 1.003
EDUCATION 0.096*** 4.669 0.093*** 4.460 0.091*** 4.407 0.102*** 4.852 0.103*** 4.930 0.103*** 5.049 0.101*** 5.035 0.089*** 4.318 0.073*** 3.523 0.099*** 4.743 0.073*** 3.362
BLACK 0.124 0.779 0.023 0.150 0.028 0.181 0.027 0.172 0.023 0.148 -0.014 -0.093 -0.003 -0.022 0.006 0.036 0.016 0.099 -0.012 -0.080 0.079 0.509
INDIAN, ALASKAN N. -0.078 -0.153 -0.148 -0.309 -0.071 -0.136 -0.021 -0.039 -0.162 -0.300 -0.139 -0.270 -0.263 -0.515 -0.269 -0.580 -0.226 -0.415 -0.170 -0.341 -0.070 -0.137
ASIAN 0.388 0.526 0.507 0.875 0.342 0.473 0.331 0.501 0.209 0.260 0.264 0.290 0.248 0.315 0.489 0.917 0.717 1.350 0.582 1.069 0.555 0.635
b) Employment Status
PART TIME EMPLOYED 0.208 1.200 0.277 1.625 0.224 1.306 0.177 1.053 0.201 1.148 0.229 1.365 0.261 1.465 0.186 1.000 0.138 0.801 0.105 0.587 0.057 0.305
UNEMPLOYED 0.270 1.376 0.298 1.534 0.309 1.584 0.291 1.485 0.323* 1.674 0.256 1.293 0.339* 1.700 0.205 1.024 0.283 1.439 0.180 0.921 0.240 1.172
RETIRED 0.106 0.764 0.106 0.771 0.078 0.568 0.036 0.261 0.099 0.718 0.077 0.554 0.066 0.479 0.079 0.562 0.048 0.342 0.032 0.234 0.034 0.228
AT HOME -0.268 -0.953 -0.223 -0.801 -0.135 -0.541 -0.030 -0.124 -0.034 -0.132 -0.109 -0.460 -0.056 -0.225 -0.065 -0.276 -0.113 -0.414 -0.051 -0.210 -0.149 -0.533
STUDENT -0.161 -0.375 -0.123 -0.296 -0.180 -0.437 -0.134 -0.341 -0.119 -0.297 -0.213 -0.520 -0.217 -0.533 -0.144 -0.349 -0.213 -0.539 -0.187 -0.465 -0.228 -0.546
c) Marital Status
MARRIED 0.300** 2.549 0.329*** 2.747 0.333*** 2.803 0.362*** 3.043 0.324*** 2.764 0.294** 2.469 0.327*** 2.614 0.285** 2.262 0.281** 2.421 0.291** 2.438 0.277** 2.269
SEPARATED 0.382* 1.724 0.444** 2.035 0.431 1.972 0.437** 2.058 0.399* 1.898 0.358 1.624 0.409* 1.865 0.399* 1.742 0.285 1.279 0.300 1.329 0.334 1.490
DIVORCED 0.247 1.546 0.257 1.628 0.213 1.351 0.255 1.594 0.307* 1.945 0.214 1.362 0.266 1.628 0.214 1.317 0.209 1.340 0.174 1.083 0.178 1.066
WIDOWED 0.267 1.391 0.223 1.149 0.261 1.292 0.274 1.357 0.237 1.086 0.283 1.435 0.267 1.244 0.172 0.837 0.290 1.466 0.210 1.055 0.184 0.904
d) Economic Variables
INCOME 0.059*** 3.419 0.063*** 3.667 0.064*** 3.631 0.055*** 3.180 0.056*** 3.268 0.061*** 3.564 0.062*** 3.666 0.057*** 3.250 0.060*** 3.480 0.061*** 3.513 0.057*** 3.179
e) Tax Morale
TM 1 -0.068*** -3.326
TM 2 -0.076*** -3.818
TM 3 -0.104*** -5.228
TM 4 -0.141*** -6.677
TM 5 -0.142*** -5.865
TM 6 -0.142*** -5.830
TM 7 -0.152*** -6.496
TM 8 -0.140*** -5.280
TM 9 -0.157*** -6.694
TM10 -0.158*** -5.801
TM11 -0.157*** -6.870
Observations 1182 1200 1197 1184 1190 1205 1205 1183 1176 1196 1142
Prob(F-statistic) 0.000 0.000 0.000 0.000 0.000 0.000 0.000 0.000 0.000 0.000 0.000
9
Table 2
Marginal Effects (Over-deduction)
weighted ordered probit 1 2 3 4 5 6 7 8 9 10 11
Variable Marg. 3 Marg. 4 Marg. 3 Marg. 4 Marg. 3 Marg. 4 Marg. 3 Marg. 4 Marg. 3 Marg. 4 Marg. 3 Marg. 4 Marg. 3 Marg. 4 Marg. 3 Marg. 4 Marg. 3 Marg. 4 Marg. 3 Marg. 4 Marg. 3 Marg. 4
a) Demographic Factors
AGE -0.002 -0.001 -0.002 -0.001 -0.001 -0.001 -0.001 -0.005 -0.002 -0.001 -0.001 -0.001 -0.001 -0.001 -0.002 -0.001 -0.001 -0.001 -0.001 0.000 -0.001 0.000
FEMALE -0.003 -0.001 -0.001 0.000 0.001 0.000 0.000 0.000 0.001 0.000 0.000 0.000 0.003 0.001 0.003 0.001 -0.002 -0.001 0.006 0.002 0.013 0.005
EDUCATION 0.013 0.005 0.013 0.005 0.013 0.005 0.014 0.005 0.014 0.005 0.014 0.005 0.014 0.005 0.013 0.005 0.010 0.004 0.014 0.005 0.010 0.004
BLACK 0.017 0.007 0.003 0.001 0.004 0.002 0.004 0.001 0.003 0.001 -0.002 -0.001 -0.001 0.000 0.001 0.000 0.002 0.001 -0.002 -0.001 0.011 0.004
INDIAN, ALASKAN -0.011 -0.044 -0.020 -0.008 -0.099 -0.004 -0.003 -0.001 -0.023 -0.008 -0.019 -0.007 -0.036 -0.014 -0.038 -0.015 -0.031 -0.012 -0.024 -0.009 -0.010 -0.004
ASIAN 0.053 0.022 0.070 0.028 0.047 0.018 0.046 0.017 0.029 0.010 0.036 0.014 0.034 0.013 0.069 0.027 0.098 0.038 0.081 0.031 0.077 0.029
b) Employment Status
PART TIME EMPL. 0.028 0.012 0.038 0.016 0.031 0.012 0.025 0.009 0.028 0.010 0.031 0.012 0.034 0.013 0.026 0.010 0.019 0.007 0.015 0.006 0.008 0.003
UNEMPLOYED 0.037 0.015 0.041 0.017 0.043 0.016 0.040 0.015 0.045 0.016 0.035 0.014 0.036 0.014 0.029 0.011 0.039 0.015 0.025 0.010 0.033 0.013
RETIRED 0.015 0.006 0.015 0.006 0.011 0.004 0.005 0.002 0.014 0.005 0.011 0.004 0.047 0.018 0.011 0.004 0.007 0.003 0.005 0.002 0.005 0.002
AT HOME -0.037 -0.015 -0.031 -0.013 -0.019 -0.007 -0.004 -0.002 -0.005 -0.002 -0.015 -0.006 -0.008 -0.003 -0.009 -0.004 -0.015 -0.006 -0.007 -0.003 -0.021 -0.008
STUDENT -0.022 -0.009 -0.017 -0.007 -0.025 -0.010 -0.019 -0.007 -0.017 -0.002 -0.029 -0.011 -0.030 -0.011 -0.020 -0.008 -0.029 -0.011 -0.026 -0.010 -0.032 -0.012
c) Marital Status
MARRIED 0.041 0.017 0.045 0.018 0.046 0.018 0.050 0.019 0.045 0.016 0.040 0.016 0.045 0.017 0.040 0.016 0.038 0.015 0.040 0.016 0.038 0.015
SEPARATED 0.052 0.022 0.061 0.025 0.060 0.023 0.061 0.023 0.056 0.020 0.049 0.019 0.056 0.022 0.056 0.022 0.039 0.015 0.042 0.016 0.046 0.018
DIVORCED 0.034 0.014 0.035 0.014 0.030 0.011 0.035 0.013 0.043 0.015 0.029 0.011 0.037 0.014 0.030 0.012 0.029 0.011 0.024 0.009 0.025 0.009
WIDOWED 0.037 0.015 0.031 0.013 0.036 0.014 0.038 0.014 0.033 0.012 0.038 0.015 0.037 0.014 0.024 0.010 0.040 0.015 0.029 0.011 0.026 0.010
d) Economic Variables
INCOME 0.008 0.003 0.009 0.004 0.088 0.003 0.008 0.003 0.008 0.003 0.008 0.003 0.009 0.003 0.008 0.003 0.008 0.003 0.009 0.003 0.008 0.003
e) Tax Morale
TM 1 -0.009 -0.004
TM 2 -0.010 -0.004
TM 3 -0.014 -0.006
TM 4 -0.020 -0.007
TM 5 -0.020 -0.007
TM 6 -0.019 -0.008
TM 7 -0.021 -0.008
TM 8 -0.020 -0.008
TM 9 -0.021 -0.008
TM10 -0.022 -0.009
TM11 -0.022 -0.008
10
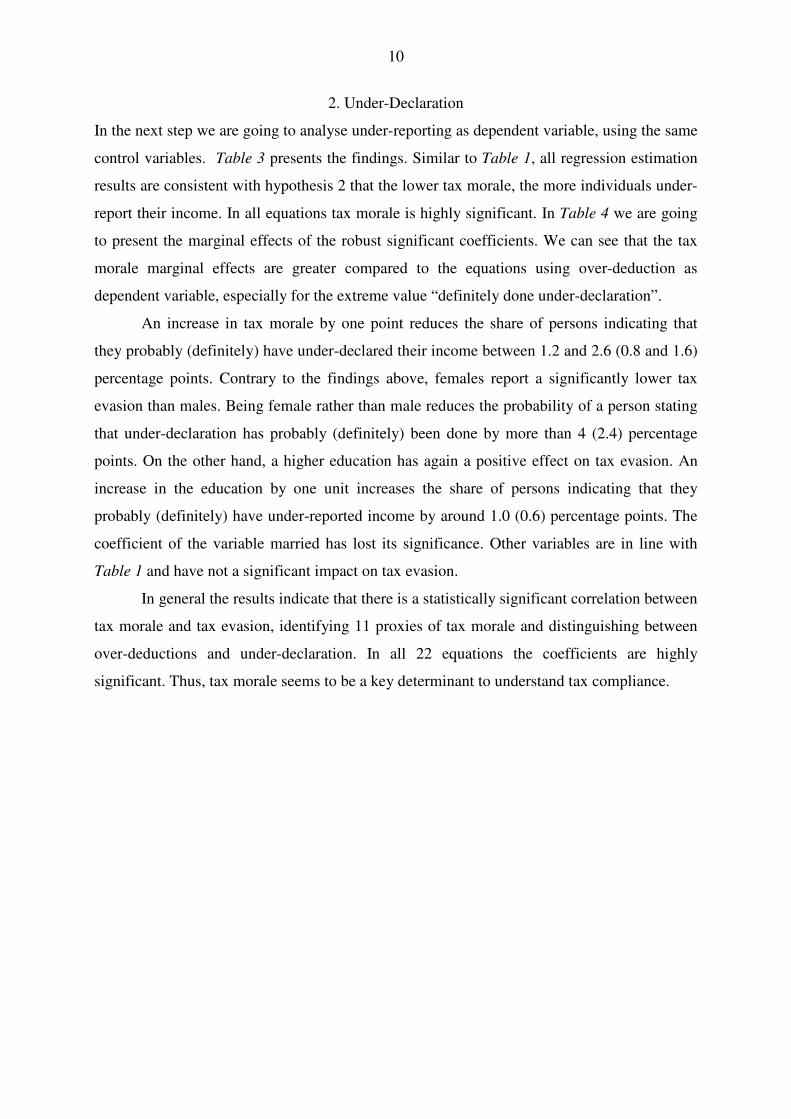
2. Under-Declaration
In the next step we are going to analyse under-reporting as dependent variable, using the same
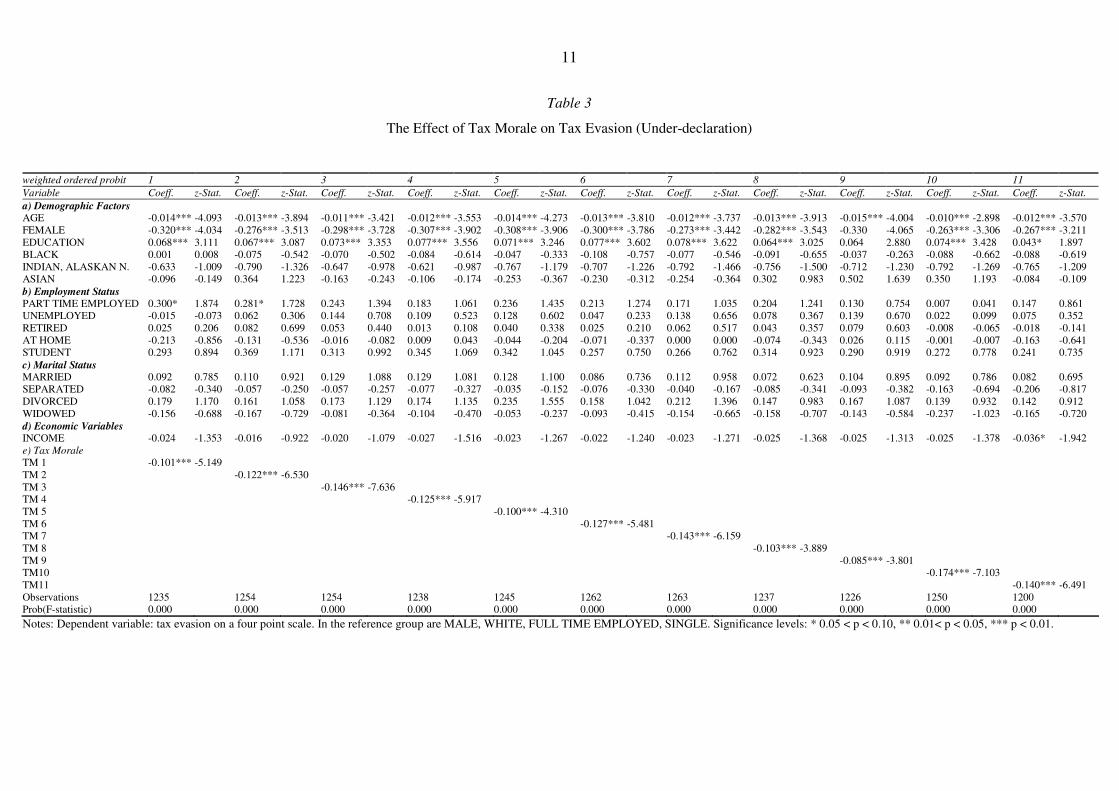
control variables. Table 3 presents the findings. Similar to Table 1, all regression estimation
results are consistent with hypothesis 2 that the lower tax morale, the more individuals under-
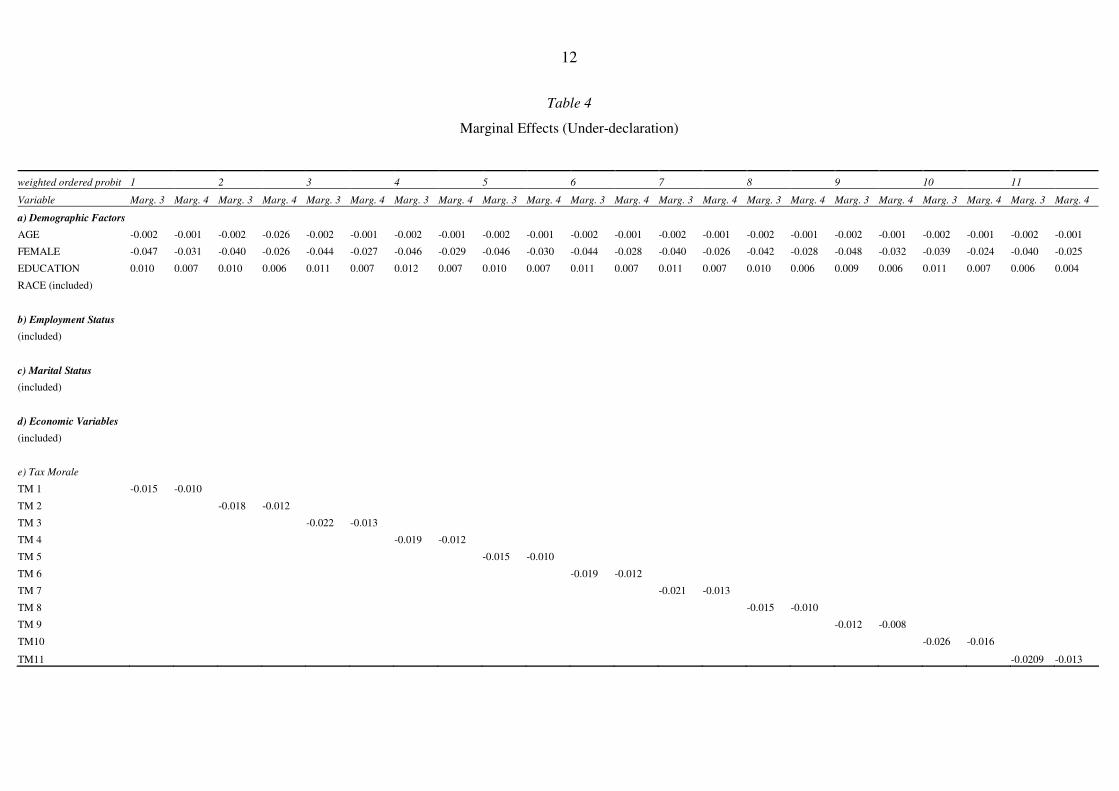
report their income. In all equations tax morale is highly significant. In Table 4 we are going
to present the marginal effects of the robust significant coefficients. We can see that the tax
morale marginal effects are greater compared to the equations using over-deduction as
dependent variable, especially for the extreme value “definitely done under-declaration”.
An increase in tax morale by one point reduces the share of persons indicating that
they probably (definitely) have under-declared their income between 1.2 and 2.6 (0.8 and 1.6)
percentage points. Contrary to the findings above, females report a significantly lower tax
evasion than males. Being female rather than male reduces the probability of a person stating
that under-declaration has probably (definitely) been done by more than 4 (2.4) percentage
points. On the other hand, a higher education has again a positive effect on tax evasion. An
increase in the education by one unit increases the share of persons indicating that they
probably (definitely) have under-reported income by around 1.0 (0.6) percentage points. The
coefficient of the variable married has lost its significance. Other variables are in line with
Table 1 and have not a significant impact on tax evasion.
In general the results indicate that there is a statistically significant correlation between
tax morale and tax evasion, identifying 11 proxies of tax morale and distinguishing between
over-deductions and under-declaration. In all 22 equations the coefficients are highly
significant. Thus, tax morale seems to be a key determinant to understand tax compliance.
11
Table 3
The Effect of Tax Morale on Tax Evasion (Under-declaration)
weighted ordered probit 1 2 3 4 5 6 7 8 9 10 11
Variable Coeff. z-Stat. Coeff. z-Stat. Coeff. z-Stat. Coeff. z-Stat. Coeff. z-Stat. Coeff. z-Stat. Coeff. z-Stat. Coeff. z-Stat. Coeff. z-Stat. Coeff. z-Stat. Coeff. z-Stat.
a) Demographic Factors
AGE -0.014*** -4.093 -0.013*** -3.894 -0.011*** -3.421 -0.012*** -3.553 -0.014*** -4.273 -0.013*** -3.810 -0.012*** -3.737 -0.013*** -3.913 -0.015*** -4.004 -0.010*** -2.898 -0.012*** -3.570
FEMALE -0.320*** -4.034 -0.276*** -3.513 -0.298*** -3.728 -0.307*** -3.902 -0.308*** -3.906 -0.300*** -3.786 -0.273*** -3.442 -0.282*** -3.543 -0.330 -4.065 -0.263*** -3.306 -0.267*** -3.211
EDUCATION 0.068*** 3.111 0.067*** 3.087 0.073*** 3.353 0.077*** 3.556 0.071*** 3.246 0.077*** 3.602 0.078*** 3.622 0.064*** 3.025 0.064 2.880 0.074*** 3.428 0.043* 1.897
BLACK 0.001 0.008 -0.075 -0.542 -0.070 -0.502 -0.084 -0.614 -0.047 -0.333 -0.108 -0.757 -0.077 -0.546 -0.091 -0.655 -0.037 -0.263 -0.088 -0.662 -0.088 -0.619
INDIAN, ALASKAN N. -0.633 -1.009 -0.790 -1.326 -0.647 -0.978 -0.621 -0.987 -0.767 -1.179 -0.707 -1.226 -0.792 -1.466 -0.756 -1.500 -0.712 -1.230 -0.792 -1.269 -0.765 -1.209
ASIAN -0.096 -0.149 0.364 1.223 -0.163 -0.243 -0.106 -0.174 -0.253 -0.367 -0.230 -0.312 -0.254 -0.364 0.302 0.983 0.502 1.639 0.350 1.193 -0.084 -0.109
b) Employment Status
PART TIME EMPLOYED 0.300* 1.874 0.281* 1.728 0.243 1.394 0.183 1.061 0.236 1.435 0.213 1.274 0.171 1.035 0.204 1.241 0.130 0.754 0.007 0.041 0.147 0.861
UNEMPLOYED -0.015 -0.073 0.062 0.306 0.144 0.708 0.109 0.523 0.128 0.602 0.047 0.233 0.138 0.656 0.078 0.367 0.139 0.670 0.022 0.099 0.075 0.352
RETIRED 0.025 0.206 0.082 0.699 0.053 0.440 0.013 0.108 0.040 0.338 0.025 0.210 0.062 0.517 0.043 0.357 0.079 0.603 -0.008 -0.065 -0.018 -0.141
AT HOME -0.213 -0.856 -0.131 -0.536 -0.016 -0.082 0.009 0.043 -0.044 -0.204 -0.071 -0.337 0.000 0.000 -0.074 -0.343 0.026 0.115 -0.001 -0.007 -0.163 -0.641
STUDENT 0.293 0.894 0.369 1.171 0.313 0.992 0.345 1.069 0.342 1.045 0.257 0.750 0.266 0.762 0.314 0.923 0.290 0.919 0.272 0.778 0.241 0.735
c) Marital Status
MARRIED 0.092 0.785 0.110 0.921 0.129 1.088 0.129 1.081 0.128 1.100 0.086 0.736 0.112 0.958 0.072 0.623 0.104 0.895 0.092 0.786 0.082 0.695
SEPARATED -0.082 -0.340 -0.057 -0.250 -0.057 -0.257 -0.077 -0.327 -0.035 -0.152 -0.076 -0.330 -0.040 -0.167 -0.085 -0.341 -0.093 -0.382 -0.163 -0.694 -0.206 -0.817
DIVORCED 0.179 1.170 0.161 1.058 0.173 1.129 0.174 1.135 0.235 1.555 0.158 1.042 0.212 1.396 0.147 0.983 0.167 1.087 0.139 0.932 0.142 0.912
WIDOWED -0.156 -0.688 -0.167 -0.729 -0.081 -0.364 -0.104 -0.470 -0.053 -0.237 -0.093 -0.415 -0.154 -0.665 -0.158 -0.707 -0.143 -0.584 -0.237 -1.023 -0.165 -0.720
d) Economic Variables
INCOME -0.024 -1.353 -0.016 -0.922 -0.020 -1.079 -0.027 -1.516 -0.023 -1.267 -0.022 -1.240 -0.023 -1.271 -0.025 -1.368 -0.025 -1.313 -0.025 -1.378 -0.036* -1.942
e) Tax Morale
TM 1 -0.101*** -5.149
TM 2 -0.122*** -6.530
TM 3 -0.146*** -7.636
TM 4 -0.125*** -5.917
TM 5 -0.100*** -4.310
TM 6 -0.127*** -5.481
TM 7 -0.143*** -6.159
TM 8 -0.103*** -3.889
TM 9 -0.085*** -3.801
TM10 -0.174*** -7.103
TM11 -0.140*** -6.491
Observations 1235 1254 1254 1238 1245 1262 1263 1237 1226 1250 1200
Prob(F-statistic) 0.000 0.000 0.000 0.000 0.000 0.000 0.000 0.000 0.000 0.000 0.000
Notes: Dependent variable: tax evasion on a four point scale. In the reference group are MALE, WHITE, FULL TIME EMPLOYED, SINGLE. Significance levels: * 0.05 < p < 0.10, ** 0.01< p < 0.05, *** p < 0.01.
12
Table 4
Marginal Effects (Under-declaration)
weighted ordered probit 1 2 3 4 5 6 7 8 9 10 11
Variable Marg. 3 Marg. 4 Marg. 3 Marg. 4 Marg. 3 Marg. 4 Marg. 3 Marg. 4 Marg. 3 Marg. 4 Marg. 3 Marg. 4 Marg. 3 Marg. 4 Marg. 3 Marg. 4 Marg. 3 Marg. 4 Marg. 3 Marg. 4 Marg. 3 Marg. 4
a) Demographic Factors
AGE -0.002 -0.001 -0.002 -0.026 -0.002 -0.001 -0.002 -0.001 -0.002 -0.001 -0.002 -0.001 -0.002 -0.001 -0.002 -0.001 -0.002 -0.001 -0.002 -0.001 -0.002 -0.001
FEMALE -0.047 -0.031 -0.040 -0.026 -0.044 -0.027 -0.046 -0.029 -0.046 -0.030 -0.044 -0.028 -0.040 -0.026 -0.042 -0.028 -0.048 -0.032 -0.039 -0.024 -0.040 -0.025
EDUCATION 0.010 0.007 0.010 0.006 0.011 0.007 0.012 0.007 0.010 0.007 0.011 0.007 0.011 0.007 0.010 0.006 0.009 0.006 0.011 0.007 0.006 0.004
RACE (included)
b) Employment Status
(included)
c) Marital Status
(included)
d) Economic Variables
(included)
e) Tax Morale
TM 1 -0.015 -0.010
TM 2 -0.018 -0.012
TM 3 -0.022 -0.013
TM 4 -0.019 -0.012
TM 5 -0.015 -0.010
TM 6 -0.019 -0.012
TM 7 -0.021 -0.013
TM 8 -0.015 -0.010
TM 9 -0.012 -0.008
TM10 -0.026 -0.016
TM11 -0.0209 -0.013
13
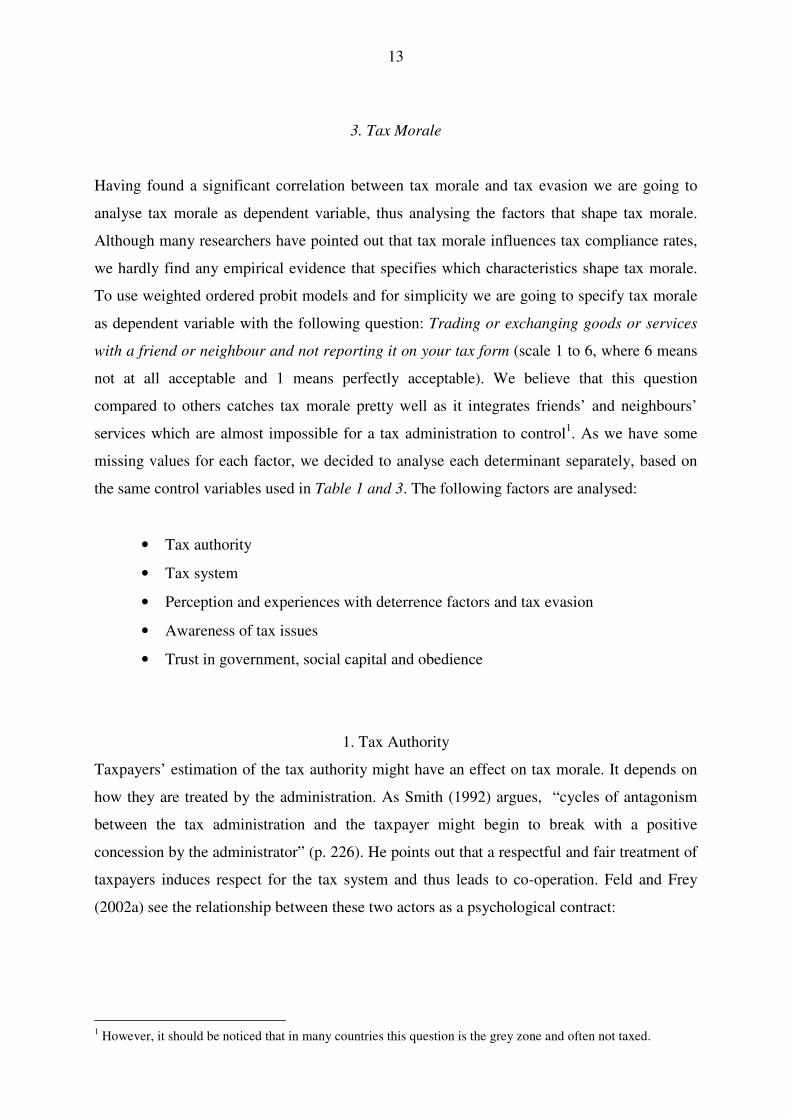
3. Tax Morale
Having found a significant correlation between tax morale and tax evasion we are going to
analyse tax morale as dependent variable, thus analysing the factors that shape tax morale.
Although many researchers have pointed out that tax morale influences tax compliance rates,
we hardly find any empirical evidence that specifies which characteristics shape tax morale.
To use weighted ordered probit models and for simplicity we are going to specify tax morale
as dependent variable with the following question: Trading or exchanging goods or services
with a friend or neighbour and not reporting it on your tax form (scale 1 to 6, where 6 means
not at all acceptable and 1 means perfectly acceptable). We believe that this question
compared to others catches tax morale pretty well as it integrates friends’ and neighbours’
services which are almost impossible for a tax administration to control1. As we have some
missing values for each factor, we decided to analyse each determinant separately, based on
the same control variables used in Table 1 and 3. The following factors are analysed:
• Tax authority
• Tax system
• Perception and experiences with deterrence factors and tax evasion
• Awareness of tax issues
• Trust in government, social capital and obedience
1. Tax Authority
Taxpayers’ estimation of the tax authority might have an effect on tax morale. It depends on
how they are treated by the administration. As Smith (1992) argues, “cycles of antagonism
between the tax administration and the taxpayer might begin to break with a positive
concession by the administrator” (p. 226). He points out that a respectful and fair treatment of
taxpayers induces respect for the tax system and thus leads to co-operation. Feld and Frey
(2002a) see the relationship between these two actors as a psychological contract:
1 However, it should be noticed that in many countries this question is the grey zone and often not taxed.
14
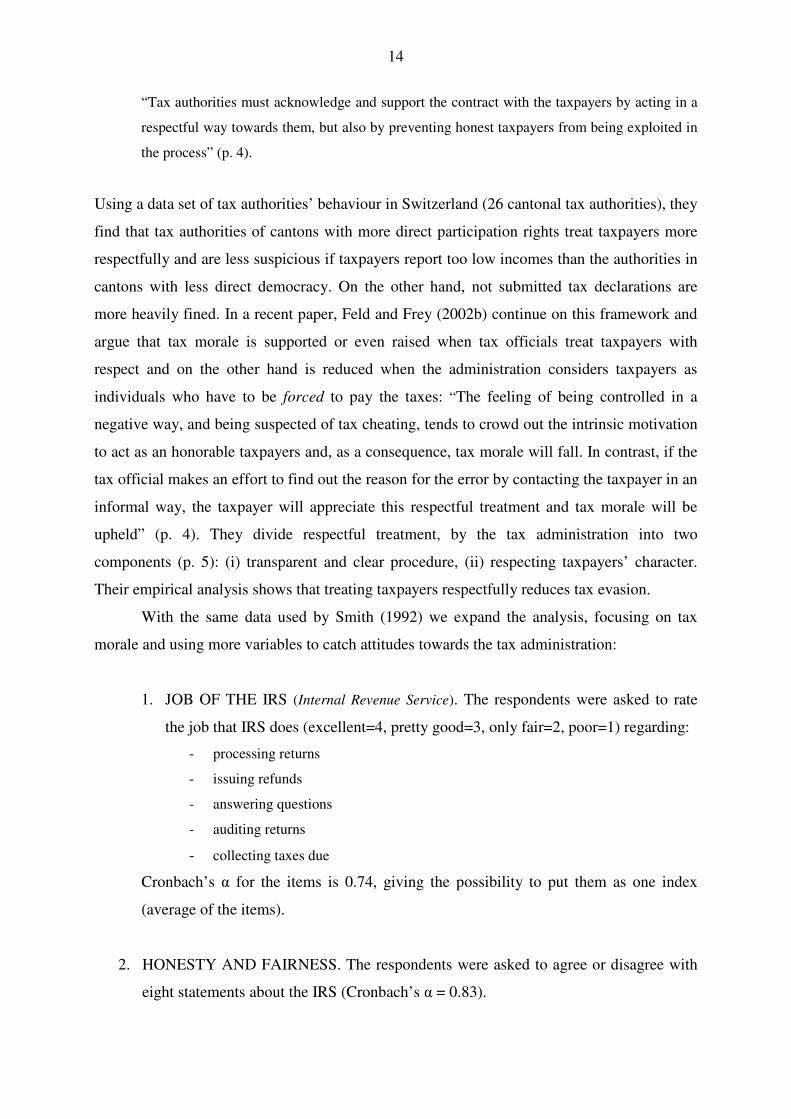
“Tax authorities must acknowledge and support the contract with the taxpayers by acting in a
respectful way towards them, but also by preventing honest taxpayers from being exploited in
the process” (p. 4).
Using a data set of tax authorities’ behaviour in Switzerland (26 cantonal tax authorities), they
find that tax authorities of cantons with more direct participation rights treat taxpayers more
respectfully and are less suspicious if taxpayers report too low incomes than the authorities in
cantons with less direct democracy. On the other hand, not submitted tax declarations are
more heavily fined. In a recent paper, Feld and Frey (2002b) continue on this framework and
argue that tax morale is supported or even raised when tax officials treat taxpayers with
respect and on the other hand is reduced when the administration considers taxpayers as
individuals who have to be forced to pay the taxes: “The feeling of being controlled in a
negative way, and being suspected of tax cheating, tends to crowd out the intrinsic motivation
to act as an honorable taxpayers and, as a consequence, tax morale will fall. In contrast, if the
tax official makes an effort to find out the reason for the error by contacting the taxpayer in an
informal way, the taxpayer will appreciate this respectful treatment and tax morale will be
upheld” (p. 4). They divide respectful treatment, by the tax administration into two
components (p. 5): (i) transparent and clear procedure, (ii) respecting taxpayers’ character.
Their empirical analysis shows that treating taxpayers respectfully reduces tax evasion.
With the same data used by Smith (1992) we expand the analysis, focusing on tax
morale and using more variables to catch attitudes towards the tax administration:
1. JOB OF THE IRS (Internal Revenue Service). The respondents were asked to rate
the job that IRS does (excellent=4, pretty good=3, only fair=2, poor=1) regarding:
- processing returns
- issuing refunds
- answering questions
- auditing returns
- collecting taxes due
Cronbach’s α for the items is 0.74, giving the possibility to put them as one index
(average of the items).
2. HONESTY AND FAIRNESS. The respondents were asked to agree or disagree with
eight statements about the IRS (Cronbach’s α = 0.83).
15
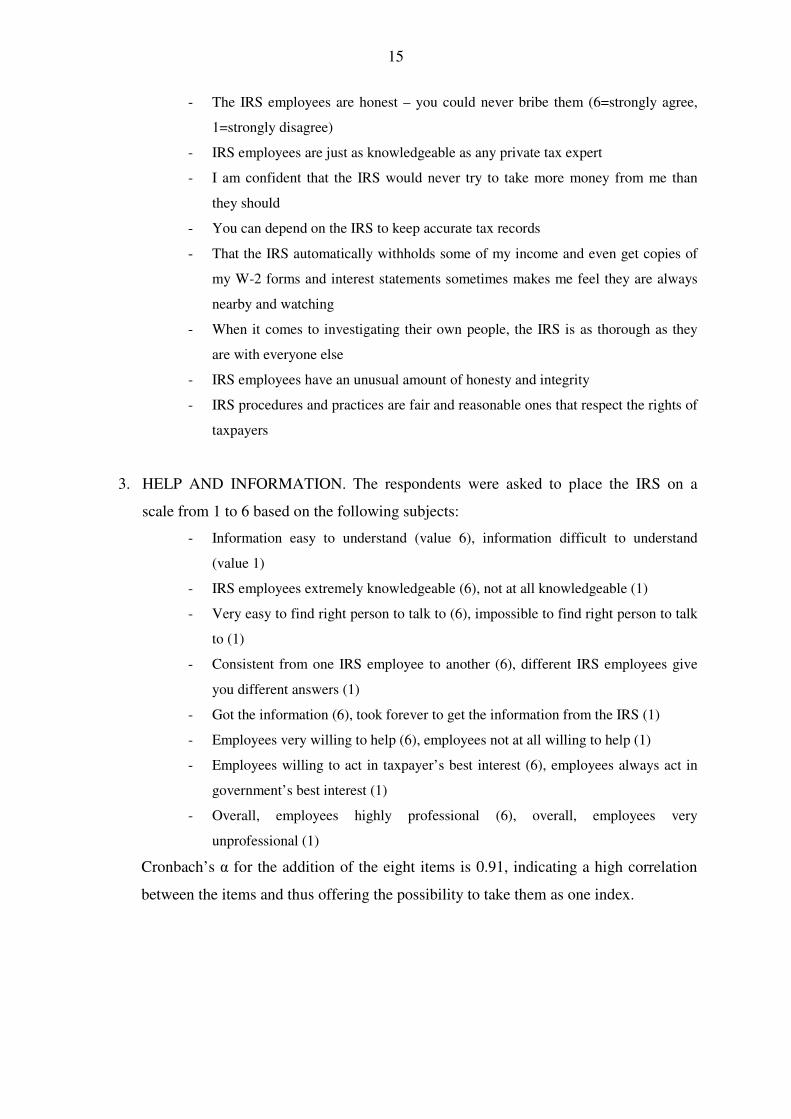
- The IRS employees are honest – you could never bribe them (6=strongly agree,
1=strongly disagree)
- IRS employees are just as knowledgeable as any private tax expert
- I am confident that the IRS would never try to take more money from me than
they should
- You can depend on the IRS to keep accurate tax records
- That the IRS automatically withholds some of my income and even get copies of
my W-2 forms and interest statements sometimes makes me feel they are always
nearby and watching
- When it comes to investigating their own people, the IRS is as thorough as they
are with everyone else
- IRS employees have an unusual amount of honesty and integrity
- IRS procedures and practices are fair and reasonable ones that respect the rights of
taxpayers
3. HELP AND INFORMATION. The respondents were asked to place the IRS on a
scale from 1 to 6 based on the following subjects:
- Information easy to understand (value 6), information difficult to understand
(value 1)
- IRS employees extremely knowledgeable (6), not at all knowledgeable (1)
- Very easy to find right person to talk to (6), impossible to find right person to talk
to (1)
- Consistent from one IRS employee to another (6), different IRS employees give
you different answers (1)
- Got the information (6), took forever to get the information from the IRS (1)
- Employees very willing to help (6), employees not at all willing to help (1)
- Employees willing to act in taxpayer’s best interest (6), employees always act in
government’s best interest (1)
- Overall, employees highly professional (6), overall, employees very
unprofessional (1)
Cronbach’s α for the addition of the eight items is 0.91, indicating a high correlation
between the items and thus offering the possibility to take them as one index.
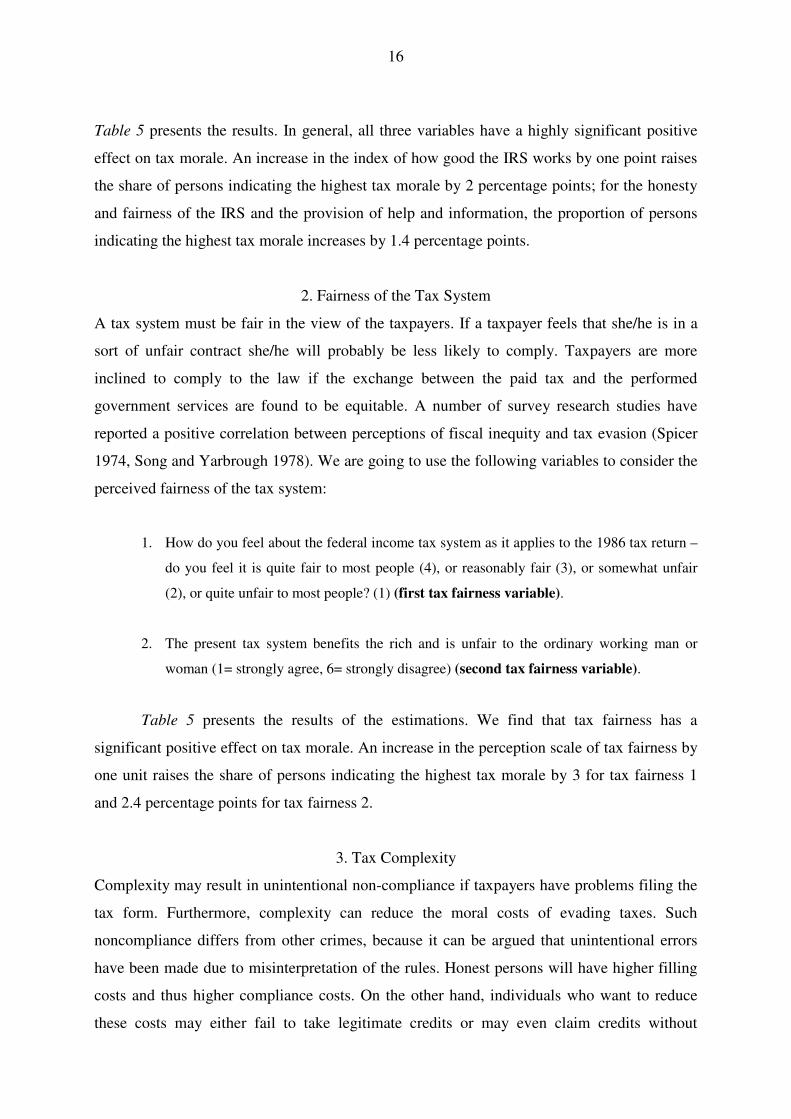
16
Table 5 presents the results. In general, all three variables have a highly significant positive
effect on tax morale. An increase in the index of how good the IRS works by one point raises
the share of persons indicating the highest tax morale by 2 percentage points; for the honesty
and fairness of the IRS and the provision of help and information, the proportion of persons
indicating the highest tax morale increases by 1.4 percentage points.
2. Fairness of the Tax System
A tax system must be fair in the view of the taxpayers. If a taxpayer feels that she/he is in a
sort of unfair contract she/he will probably be less likely to comply. Taxpayers are more
inclined to comply to the law if the exchange between the paid tax and the performed
government services are found to be equitable. A number of survey research studies have
reported a positive correlation between perceptions of fiscal inequity and tax evasion (Spicer
1974, Song and Yarbrough 1978). We are going to use the following variables to consider the
perceived fairness of the tax system:
1. How do you feel about the federal income tax system as it applies to the 1986 tax return –
do you feel it is quite fair to most people (4), or reasonably fair (3), or somewhat unfair
(2), or quite unfair to most people? (1) (first tax fairness variable).
2. The present tax system benefits the rich and is unfair to the ordinary working man or
woman (1= strongly agree, 6= strongly disagree) (second tax fairness variable).
Table 5 presents the results of the estimations. We find that tax fairness has a
significant positive effect on tax morale. An increase in the perception scale of tax fairness by
one unit raises the share of persons indicating the highest tax morale by 3 for tax fairness 1
and 2.4 percentage points for tax fairness 2.
3. Tax Complexity
Complexity may result in unintentional non-compliance if taxpayers have problems filing the
tax form. Furthermore, complexity can reduce the moral costs of evading taxes. Such
noncompliance differs from other crimes, because it can be argued that unintentional errors
have been made due to misinterpretation of the rules. Honest persons will have higher filling
costs and thus higher compliance costs. On the other hand, individuals who want to reduce
these costs may either fail to take legitimate credits or may even claim credits without
17
ascertaining eligibility. Krause (2000) states that when rules are complex, compliance and
enforcement will be imperfect. Costs are imposed on the taxpayers and the tax administration,
undermining the effectiveness of the tax policies. Tax examiners in the tax administration will
have greater problems to identify a case of noncompliance and to discern whether the
violation was deliberate or unintentional (Erard 1997). This can increase tax collection costs.
Furthermore, complicated tax laws are subject to a broad variety of interpretations (Krause
2000). However, other studies have failed to document a negative relation between
complexity and compliance (e.g., Yankelovich and Skelly 1984).
Complexity may affect taxpayers’ perceptions of the equity of the tax system. It can be
argued that tax complexity and equity are positively related. A more complex tax law can help
determine taxpayers’ ability to pay and could stop those who would be able to exploit tax
rules. On the other hand, additional compliance and administration costs incur (see Kaplow
1996) and taxpayers could be frustrated. A simpler tax law would reduce taxpayers’
expenditure in time and money to comply with the tax law (see Blumenthal and Slemrod
1992). Increasing tax complexity may move taxpayers’ trade-off between costly compliance
either by using own effort or external help (tax practitioners) and evading taxes towards the
“exit” decision. Smith (1992) found that complexity significantly reduces the perceived IRS
procedural fairness. On the other hand, Forest and Sheffrin (2002) did not find a systematic
link between perception of complexity and perception of unfairness, using data from the 1990
TOS with similar questions. Contrary to Smith (1992) we only took one item to measure the
complexity of the tax system:
Thinking about how easy or difficult it is to fill out your tax form, how complicated do you
think our federal income tax laws and rules are for your particular income situation (1= not at
all complicated/very easy to understand, 6 = extremely complicated/very difficult to
understand).
Table 5 presents the results. We can see that complexity has the tendency to reduce tax
morale. However, the marginal effects are small and the coefficient is not statistically
significant.
4. Perception regarding Tax Evasion
The intensity of moral constraints might depend on how widespread evasion behaviour is in a
group. The social constraint might be very small if individuals are aware that they are part of
a minority who pays taxes. People who used to pay taxes might get angry, which reduces the
18
moral costs of evasion and increases the incentive to engage in tax evasion. Individuals could
react emotionally and very strongly to such perceived attitudes. If a taxpayer believes that tax
evasion is common and notices that many individuals evade taxes, this could crowd out
intrinsic motivation to comply with taxes. Evasion is a signal that intrinsic motivation is not
recognised. Thus, taxpayers get the feeling that they can as well be opportunistic. Lewis
(1982, p. 144) argues for the possible existence of a “tax subculture, with its own set of
unwritten rules and regulations. Thus I am more likely to evade not only because I have
friends who, I know, have got away with it (so why shouldn’t I?) but also because evasion is
ethically acceptable among my friends … Furthermore, ‘no friends of mine can be criminals’
…‘What’s good enough for fine, upstanding citizens like Fred Bloggs, John Doe, Donald
Campbell, Herman Schmitt and Hans Anderson is good enough for me’”. Frey and Torgler
(2007) find using data for Western and Eastern European countries that taxpayers are strongly
influenced by their perceptions of the behaviour of other taxpayers. If taxpayers believe tax
evasion to be common, tax morale decreases. Alternatively, if they believe others to be
honest, tax morale increases. We would hypothesise that the higher the percentage of
taxpayers someone perceives to cheat on taxes, the lower his/her tax morale will be. The TOS
has asked the respondents the following question:
As you may know, an audit is when you have to go to an IRS office or they come to your
house or business or they may correspond with you, and you are asked to prove your
deductions or answer questions about your tax return. The question I have is: out of every 100
taxpayers at your income level, how many or what percent do you think were audited last year.
Table 5 indicates that this hypothesis cannot be rejected. The findings indicated that there
might be a crowding out effect of tax morale.
4. Awareness of Tax Issues
It might be interesting to analyse to which extent the awareness of tax issues has an impact
on tax morale. Information acquirement and discussion depend on individuals’ incentives.
Gaining information and discussing this topic with other people imposes time costs on
taxpayers. In a discussion people have the opportunity to exchange arguments which raises
the level of information of the participants. It also enhances the incentive to participate and to
incur additional information costs. People interact in a face-to-face situation and are able to
identify the others’ preferences. It could be argued that dissatisfaction with government or
generally negative attitude towards the tax system might increase the incentives to talk to
19
individuals to get a better idea about the opportunities to evade and the probability of getting
caught.
A low awareness is linked with a higher uncertainty regarding the IRS process. Scholz
and Pinney (1995) argue that the uncertainty about the probability of getting caught imposes
sufficient difficulties for citizens to make them rely on heuristics to behave honestly. Tax
compliance experiments have analysed the role of fiscal uncertainty by comparing the
compliance behaviour when key fiscal parameters are known with certainty to the behaviour
when these parameters are made uncertain. Alm, Jackson and McKee (1992) found in an
experiment that introducing uncertainty in the fiscal parameters, the fine rate and the
probability of detection increases tax compliance. Thus, better information and awareness of
the IRS activities might have a negative effect on tax morale.
We have used the following questions to catch the awareness of the IRS:
Do you ever talk about IRS and its activities with your family? (TALK WITH FAMILY)
Do you ever talk about IRS and its activities with your friends and co-workers? (TALK
WITH FRIENDS)
How much attention did you pay to discussions on the radio about IRS and its activities (a lot,
quite a bit, some, very little, or no attention)? (RADIO INFORMATION)
Table 5 presents the results. People with a higher awareness of IRS issues tendentially have a
lower tax morale. Talking with friends rather than with the family has a stronger negative
effect on tax morale. One reason might be that talking inside a family about all different
kinds of topics and thus also IRS issues is common practice, but it is not at all common to
discuss such a sensitive topic with friends. Thus, someone who discusses IRS issues with
friends does so with specific intentions. The coefficient for the effects of RADIO
INFORMATION is not significant. A radio is a medium that in general informs about
different topics, and there is a low probability that it informs regularly about the IRS.
Sensitive and specific topics are rather treated in a discussion among people than on the
radio. We have also estimated equations looking at other media like TV and newspaper. The
results are in line, not showing a significant effect on tax morale.
5. Trust and Obedience
5.1 Trust in Public Officials
20
In the last equations the relevance of trust and obedience to tax morale are analysed. In the tax
compliance literature economists have recently started to pay attention to the determinant of
trust (Slemrod 2002, Torgler 2007). However, the concept of trust is not new. John Locke has
already pointed out the relevance of trust in the interaction between citizens and the
government. Trust in public officials might tend to increase taxpayers’ positive attitudes and
commitment to the tax system and tax-payment, which has finally a positive effect on tax
compliance.
Taxes can be seen as a price paid for government’s positive actions. Thus, if taxpayers
trust the public officials, they are more willing to be honest. If the government acts
trustworthily, taxpayers might be more willing to comply with the taxes. Similar to the tax
administration, the relationship between taxpayers and government can be seen as a relational
contract or psychological contract, which involves strong emotional ties and loyalties. Such a
psychological tax contract can be maintained by positive actions, based on trust.
The variable has been developed from the following question:
Public officials can usually be trusted to do what’s right (strongly agree=4, mildly agree=3,
mildly disagree=2, strongly disagree=1).
The results are in line with our hypothesis that there is a significantly positive correlation
between trust in officials and tax morale. An increase in the trust scale by one unit increases
the share of subjects indicating the highest tax morale by 3.5 percentage points.
5.2 Trust in other People
The TOS measures trust in a general way, asking respondents if they trust other people. Paldam
and Svendsen (2000) point out that this might be the best available measure of social capital.
Slemrod (1998) stresses that ”in high-trust societies, individuals need to spend less to protect
themselves from being exploited in economic transactions” (p. 29).
Thus, a high level of social capital facilitates a high level of government. People who
trust each other are in a closer interaction, which might produce a positive attitude towards
contributing to the public good and paying the taxes. The results in Table 5 indicate that higher
social capital leads to a significantly higher tax morale. An increase in the scale of trust by one
unit increases the share of subjects indicating the highest tax morale by 2 percentage points.
5.3 Obedience
21
Rule obedience can be defined as the disposition of the members of a society to follow certain
rules. Obligation can be seen as a sort of internal institution. People have learnt the rules by
education and experience to a degree where they have developed an obligation to fulfil. The
rules are obeyed spontaneously without resourceful reflections. Taxpayers have turned the
rules into personal preferences and apply them consistently (for an analysis of internal rules
see Kasper and Streit 1999). Lindenberg (2001) explains obligation-based behaviour from a
framing point of view as the goal to act appropriately, which is acquired through socialisation.
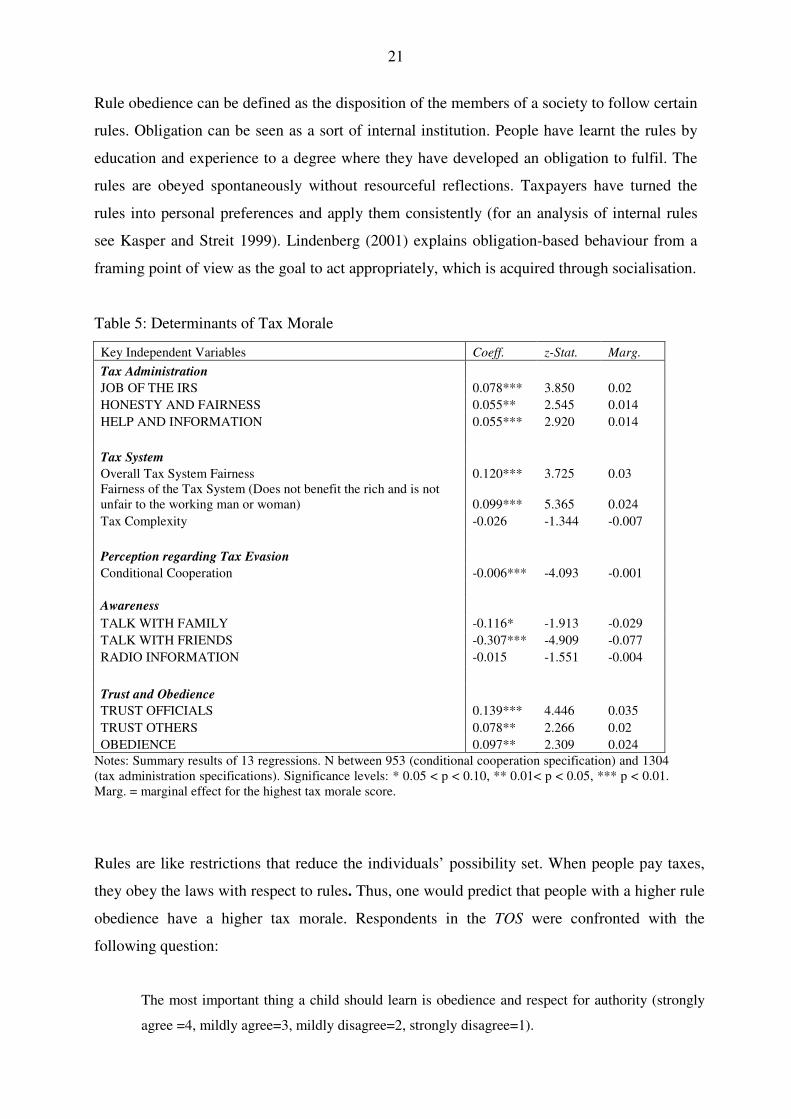
Table 5: Determinants of Tax Morale
Key Independent Variables Coeff. z-Stat. Marg.
Tax Administration
JOB OF THE IRS 0.078*** 3.850 0.02
HONESTY AND FAIRNESS 0.055** 2.545 0.014
HELP AND INFORMATION 0.055*** 2.920 0.014
Tax System
Overall Tax System Fairness 0.120*** 3.725 0.03
Fairness of the Tax System (Does not benefit the rich and is not
unfair to the working man or woman) 0.099*** 5.365 0.024
Tax Complexity -0.026 -1.344 -0.007
Perception regarding Tax Evasion
Conditional Cooperation -0.006*** -4.093 -0.001
Awareness
TALK WITH FAMILY -0.116* -1.913 -0.029
TALK WITH FRIENDS -0.307*** -4.909 -0.077
RADIO INFORMATION -0.015 -1.551 -0.004
Trust and Obedience
TRUST OFFICIALS 0.139*** 4.446 0.035
TRUST OTHERS 0.078** 2.266 0.02
OBEDIENCE 0.097** 2.309 0.024
Notes: Summary results of 13 regressions. N between 953 (conditional cooperation specification) and 1304
(tax administration specifications). Significance levels: * 0.05 < p < 0.10, ** 0.01< p < 0.05, *** p < 0.01.
Marg. = marginal effect for the highest tax morale score.
Rules are like restrictions that reduce the individuals’ possibility set. When people pay taxes,
they obey the laws with respect to rules. Thus, one would predict that people with a higher rule
obedience have a higher tax morale. Respondents in the TOS were confronted with the
following question:
The most important thing a child should learn is obedience and respect for authority (strongly
agree =4, mildly agree=3, mildly disagree=2, strongly disagree=1).
22
Table 5 shows that a higher obedience and respect for the authority leads to a significantly
higher tax morale.
IV. CONCLUSIONS
First of all our intention was to verify the correlation between tax compliance and tax morale.
A central question in the tax compliance literature is why so many people pay their taxes
although fines and audit probability are low. One key determinant might be tax morale, the
intrinsic motivation to pay taxes. With data from the TOS 1987 we have found a significant
correlation between tax evasion and tax morale. To check the sensitivity of the results, we
used over-deduction and under-declaration of the income as dependent variable. Furthermore
we used a broad variety of proxies to measure tax morale. In all cases, the coefficient was
significant, controlling for a variety of factors.
Furthermore, in the tax compliance literature tax morale is rarely discussed and
mostly as a residual explanation without referring to factors that shape tax morale. Although
the data from the TOS are not new, it offers almost the only possibility to study a large
variety of tax context factors. We provide evidence on the impact of factors that shape tax
morale. Positive attitudes towards tax authority and tax system significantly increase tax
morale. On the other hand, complexity has not a significant effect on tax morale. The
awareness of tax issues correlates with a lower tax morale. However, the coefficient was not
significant in all the cases. Trust in public officials and other people on the contrary had a
highly significant positive effect on tax morale. Finally, a higher sense of obedience leads to
a higher tax morale.
According to the results, tax morale seems to be a key determinant in enhancing tax
compliance. There are a variety of policies beside coercion that help to increase tax morale
and thus tax compliance. More empirical work is needed to better understand tax morale.
Similar to this paper, most of the empirical insights in the tax compliance literature have been
gained with data sets from the United States. It remains the question to which extent the
empirical findings from the United States can be generalised. The lack of empirical evidence
in the tax compliance literature integrating regions as Europe, Africa, Latin America and Asia
has to be reduced in the future. It could be hypothesised that the effects found in this paper
with U.S. data might be similar for the European countries, as many institutional components
23
are comparable to the United States. However, it would be interesting to check the robustness
of these results in developing countries where noncompliance and tax morale seem to be real
problems (Torgler 2003, Alm, Martinez-Vazquez and Torgler 2007). In general, an excellent
method would be to conduct panels or to do regular surveys in different countries, similarly
designed as the TOS.
In general, results and conclusions obtained in tax morale research are of considerable
importance. First, it can provide insight in a more efficient way of raising revenues since the
interaction between the taxpayer and the tax authority is taken into account. Second, this
research points to a broader understanding of tax compliance where aspects of deterrence
(audits and penalties), government regulation, opportunity costs (migration costs and
employment status), the quality of publicly provided goods, the tax system (complexity,
progressivity and incidence), treatment of taxpayers by the tax authority (transparency,
partnership and generosity) and the homogeneity or heterogeneity of the society should be
systematically evaluated.
REFERENCES
Adams, C. (1993) For Good and Evil. The Impact of Taxes on the Course of Civilization. London:
Madison Books.
Allingham, M. G. and A. Sandmo (1972). Income Tax Evasion: A Theoretical Analysis, Journal of
Public Economics. 1: 323-338.
Alm, J., B. R. Jackson and M. McKee (1992). Institutional Uncertainty and Taxpayer Compliance,
American Economic Review. 82: 1018-1026.
Alm, J., J. Martinez-Vazquez and B. Torgler (2006). Russian Attitudes Toward Paying Taxes –
Before, During, and After the Transition, International Journal of Social Economics. 33: 832-
857.
Alm, J. , G. H. McClelland and W. D. Schulze (1992). Why Do People Pay Taxes?, Journal of Public
Economics. 48: 21-48.
Ajzen, I. and M. Fishbein (1980). Understanding Attitudes and Predicting Social Behaviour.
Englewood Cliffs: Prentice-Hall.
Blumenthal, M. and J. Slemrod (1992). The Compliance Cost of the U.S. Individual Income Tax
System: A Second Look After Tax Reform, National Tax Journal. 45: 185-2002.
Bosco, L. and L. Mittone (1997). Tax Evasion and Moral Constraints: some Experimental Evidence,
KYKLOS. 50: 297-324.
Clotfelder, C. T. (1983). Tax Evasion and Tax Rate: An Analysis of Individual Return, The Review of
Economics and Statistics. 65: 363-373.
24
Elffers, H. (2000). But Taxpayers Do Cooperate!, in: M. Van Vught, M. Snyder, T. R. Tyler and
Anders Biel (eds.), Cooperation in Modern Society. Promoting the Welfare of Communities,
States and Organizations. London: Routledge: 184-194.
Erard, B. (1997). Self-Selection with Measurement Errors: A Microeconometric Analysis of the
Decision to Seek Tax Assistance and its Implication for Tax Compliance, Journal of
Econometrics. 81: 319-356.
Feinstein, J. S. (1991). An Econometric Analysis of Income Tax Evasion and its Detection,
RAND Journal of Economics. 22: 14-35.
Feld, L. P. and B. S. Frey (2002a). Trust Breeds Trust: How Taxpayers Are Treated, Economics of
Governance 3: 87-99.
Feld, L. P. and B. S. Frey (2002b). The Tax Authority and the Taxpayer. An Exploratory Analysis,
paper presented the 2002 Annual Meeting of the European Public Choice Society Belgirate.
Forest, A. and S. M. Sheffrin (2002). Complexity and Compliance: An Empirical Investigation,
National Tax Journal. 55:75-88.
Frey, B. S. and F. Schneider (2000). Informal and Underground Economy, in: Orley Ashenfelter (ed.),
International Encylopedia of Social and Behavioral Science, Bd. 12, Economics. Amsterdam:
Elsevier Science Publishing Company.
Frey, B. S. and B. Torgler (2007). Tax Morale and Conditional Cooperation, Journal of Comparative
Economics. 35: 136-159.
Graetz, M. J. and L. L. Wilde (1985). The Economics of Tax Compliance: Fact and Fantasy, National
Tax Journal. 38: 355-363.
Hays, S. (2000). An Empirical Analysis of Taxpayers’ Attitudes and Behavioral Intentions Regarding
Compliance with Federal Income Tax Laws, Dissertation, College of Administration and
Business, Louisiana Tech University.
Jackson, B. and V. C. Milliron (1986). Tax Compliance Research: Findings, Problems, and Prospects,
Journal of Accounting Literature. 5: 125-165.
Kasper, W. and M. E. Streit (1999). Institutional Economics. Social Order and Public Policy.
Cheltenham, UK: Edward Elgar.
Krause, K. (2000). Tax Complexity: Problem or Opportunity, Public Finance Review. 28: 395-414.
Lempert, R. (1992). Commentary of the paper: K. W. Smith (1992). Reciprocity and Fairness: Positive
Incentives for Tax Compliance, in: J. Slemrod (ed.), Why People Pay Taxes. Tax Compliance
and Enforcement, Ann Arbor: University of Michigan Press: 251-258.
Lewis, A. (1982). The Psychology of Taxation. Oxford: Martin Robertson.
Lindenberg, S. (2001). Intrinsic Motivation in a New Light, KYKLOS. 54: 317-342.
Paldam, M. and G. T. Svendsen (2001). Missing Social Capital and the Transition in Eastern Europe,
Journal for Institutional Innovation, Development and Transition. 5: 21-34.
Pommerehne, W. W. and H. Weck-Hannemann (1996). Tax Rates, Tax Administration and Income
25
Tax Evasion in Switzerland, Public Choice. 88: 161-170.
Sakurai, Y. and V. Braithwaite (2001). Taxpayers’ Perceptions of the Ideal Tax Adviser: Playing Safe
or Saving Dollars? Working Paper No 5, The Australian National University, Centre of Tax
System Integrity.
Scholz, J. T. and N. Pinney (1995). Duty, Fear, and Tax Compliance: The Heuristic Basis of
Citizenship Behavior, American Journal of Political Science. 39: 490-512.
Sheffrin, S. M. and R. K. Triest (1992). Can Brute Deterrence Backfire? Perceptions and Attitudes in
Taxpayer Compliance, in: J. Slemrod (ed.), Why People Pay Taxes. Tax Compliance and
Enforcement, Ann Arbor: University of Michigan Press: 193-218.
Slemrod, J. (1998). On Voluntary Compliance, Voluntary Taxes, and Social Capital, National Tax
Journal, LI: 485-492.
Slemrod, J. (2002). Trust in Public Finance, NBER Working Paper No. w9187.
Smith, K. W. (1992). Reciprocity and Fairness: Positive Incentives for Tax Compliance, in: J.
Slemrod (ed.), Why People Pay Taxes. Tax Compliance and Enforcement, Ann Arbor:
University of Michigan Press: 223-250.
Song, Y. and Y. E. Yarbrough (1978). Tax Ethics and Taxpayer Attitudes: A Survey, Public
Administration Review. 38: 442-457.
Spicer, M. W. (1974). A Behavioral Model of Income Tax Evasion. Dissertation, Ohio State
University.
Spicer, M. W. and S. B. Lundstedt (1976). Understanding Tax Evasion, Public Finance. 31: 295-304.
Economics. 26: 263-267.
Tittle, C. (1980). Sanctions and Social Deviance: The Question of Deterrence. New York: Praeger.
Torgler, B. (2002). Speaking to Theorists and Searching for Facts: Tax Morale and Tax Compliance in
Experiments, Journal of Economic Surveys. 16: 657-684
Torgler, B. (2003). Tax Morale in Transition Countries, Post-Communist Economies. 15: 357-381.
Torgler, B. (2007). Tax Compliance and Tax Morale: A Theoretical and Empirical Analysis.
Cheltenham, UK: Edward Elgar
Torgler, B. and F. Schneider (2007). Shadow Economy, Tax Morale, Governance and Institutional
Quality: A Panel Analysis, CREMA Working Paper Series, 2007-02, Center for Research in
Economics, Management and the Arts (CREMA
Yankelovich, Skelly and White, Inc. (1984). Taxpayer Attitudes Survey: Final Report, Public Opinion
Survey Prepared for the Public Affairs Division, Internal Revenue Service, New York.