causes of projects’ failure to deliver the
TRANSCRIPT

Author: NYAMUGABO KADENESI Eric Reg: 213004263
“A thesis submitted to the School of Business in the College of Business and Economics in
partial fulfillment of the requirements for the award of the degree of Masters of Business
Administration by the University of Rwanda”.
Supervisor: Prof. RAMA B. RAO
Kigali, 24th
June, 2016
Causes of projects’ failure to deliver the
value presented in their business cases.

i
DECLARATION
I hereby declare that the thesis study entitled, “Causes of projects’ failure to deliver the value
presented in their business cases” is my own original work carried out as a Master’s student at the
University of Rwanda-College of Business and Economics except to the extent that assistance from
others in the thesis study’s design and style, presentation and linguistic expression are duly
acknowledged.
All sources used for the thesis study have been fully and properly cited. It contains no material which
to a substantial extent has been accepted for the award of any other degree elsewhere for any other
purpose except where due acknowledgment is made in the thesis study.
NYAMUGABO KADENESI Eric

ii
CERTIFICATE
This is to certify that Mr. Eric NYAMUGABO KADENESI is a bonafide student of MBA in School
of Business. This research study entitled, “Causes of projects’ failure to deliver the value
presented in their business cases” is original work done by him under my supervision. This work
has not been presented elsewhere for any other purpose.
…………………. ………………… Signature Date Supervisor: Prof. RAMA B RAO

iii
DEDICATION
This thesis is dedicated to the following people:
My mother, M. Janet, who emphasizes the importance of education and helped me with school fees
and my lessons throughout her life.
My former lecturer at both first degree and Masters’ degree , Dr. Ibrahim MUSOBO, who has been
my role-model for hard work, persistence and personal sacrifices, and who instilled in me the
inspiration to set high goals and the confidence to achieve them.
My Brother in memory late. R. James the Businessman who emphasized the importance of education
and helped me with school fees and my lessons throughout her life.
My Brother Mr. Mark Charles K. who have been my emotional anchor through not only the vagaries
of graduate school, but my entire life.
My wife, N. Angel, who has been proud and supportive of my work and who has shared the many
uncertainties, challenges and sacrifices for completing this thesis.
My sons, Vela, Jaden, and Edric Rowland who have grown into a wonderful 14, and 2 years old, and 7
months old respectively in spite of their father spending so much time away from them working on
this thesis.
iv
ACKNOWLEDGEMENT
No book is the work only of its author. I greatly appreciate the value contribution of several people
who helped make this thesis possible. As always, I owe very special thanks to my elder brother Mark
Charles KATUNGYE and family, my Cassin David MUGUME and long time friend NGARAMBE
Stephen for their dedicated and valuable help provided during this often hectic project.
I owe substantial thanks KALINGANIRE Peter, MUGABO Jean Bosco and Joel staff at Ministry of
Finance and Economic Planning, BRD, AND RDB for their valuable kind attitude to research who
contributed in developing chapter three with project database.
I also thank MURASANDONYI Theophile an ICT professional who helped for preparing the end
work of formatting and styles for printing.
I also owe special thanks to my research moderator professor RAMA B. RAO of University of
Rwanda for valuable and skillful guidance in this research and also for his endurance character. Many
other individuals provided valuable comments and suggestions for this thesis including Mr.
MUTARINDWA Sam PhD student, KABERA Ben Project manager at UNDP, SABITI Fred Project
manager at MTN, NZARAMBA Stephen, Dr. Ibrahim MUSOBO Consultant, longtime friend, former
lecturer at both first and second degree.
I also owe great deal to people who provided fresh ideas throughout the research process. Project
Manager provided valuable assistance in managing the many issues of this complex project.
I owe many thanks to my family especially my wife Mrs. Angel for all her support and
encouragement. To them, I dedicate this thesis.

v
ABSTRACT
The study on causes of project failures was conducted with the objectives: To analyze effective
methodologies those contribute to reduce risk and increase value to projects. To understand the factors
that come into play to ensure that project deliverables are served as planned in the business case. To
identify the required decision making core elements turned into actions/efforts to correct high project
failure rates. To offer suggestions for improvements to the analyzed prevailing project management
environment.
A qualitative approach are used to reach the overall aim and objectives of the study as it is
characterized by its ability to provide a deeper understanding of the phenomenon being
investigated. Using case study as a research strategy enabled the researcher to explore project
management practices from different economic sectors and by using multiple sources of evidence,
including: questionnaires and document analysis. Data obtained throughout were analyzed using
the instruments a method which yielded from the grounded theory approach. Finally looks at the
validity, reliability and triangulation issues to rationalize the different decisions and processes
undertaken throughout the research journey.
The key findings of the study include: There is a relationship between the methodology used and the
success of projects or project delivery. Project deliverables must include the delivery time, budget,
quality, scope, risk in relation to what was promised in the original business case. It is recommended
that promised business benefits are cardinal measure of project success/failure that would probably not
be included on the project managers’ list of clients’ perception criteria of project success/failure
measures. Particular attention to this should be given by practitioners who do not include it.
Further research may be conducted on project evaluation processes to determine which processes are
appropriate, and the appropriate degree of rigor for each process. Project customer and supplier
should carefully address each process and its inputs and outputs. Any given project, the project
manager, in collaboration with the project customer, is always responsible for success/failure.

vi
LIST OF FIGURES
Figure 2.1 Project management triangle ................................................................................................. 16
Figure 2.2 Research Process ................................................................................................................... 17
Figure 2.3 The triple constraint relationship S↑ α T↑ C↑ ....................................................................... 19
Figure 2.4 Better, Faster, Cheaper-Is this really possible? ..................................................................... 20
Figure 2.5 Good-and-fast vs. good and cheap. ....................................................................................... 21
Figure 2.6 TRIJECT model .................................................................................................................... 23
Figure 2.7 Three stages of tailoring a project management methodology ........................................... 25

vii
LIST OF TABLES
Table 1.1 Table of project elements and suggested metrics ..................................................................... 7
Table 3.1 Data needs for the study ......................................................................................................... 32
Table 3.2 Projects population in Rwanda for the fiscal year 2014-2015 ............................................... 34
Table 3.3 Selected sample size, categories and numbers of respondents to each project in the sample
size. ................................................................................................................................................. 36
Table 3.4 Types of data and data analysis tools ................................................................................. 46
Table 4.1 Respondents’ views on activities involved at project work. .................................................. 54
Table 4.2 Respondents’ views on project deliverables. ......................................................................... 55
Table 4.3 Respondents’ views on project “value” indicators. ................................................................ 56
Table 4.4 Respondents’ views on projects’ focus. ................................................................................. 57
Table 4.5 Respondents’ views on incentives’ focus on projects’. .......................................................... 58
Table 4.6 Respondents’ views on customer/supplier relationships’ focus on projects. ......................... 58
Table 4.7 Respondents’ views on planning’ focus on projects. ............................................................. 59
Table 4.8 Respondents’ views on governance’s’ focus on projects. ...................................................... 60
Table 4.9 Respondents’ views on outcomes’ focus on projects. ............................................................ 61
Table 4.10 Respondents’ views on business model’s’ focus on projects. ............................................. 62
Table 4.11 Respondents’ views on organization model’s’ focus on projects. ....................................... 62
Table 4.12 Respondents’ views on roles played by project stakeholders. ............................................. 63
Table 4.13 Respondents’ views on reality perceptions of stakeholders on projects criteria. ................ 65
Table 4.14 Respondents’ views on turn around actions to correct project failure. ................................ 66
Table 4.15 Respondents’ views on impact of the methodology to project success/failure. ................... 68
Table 4.16 Respondents’ views on projects success with methodology. ............................................... 68
Table 4.17 Respondents’ views on projects professional management practices. ................................. 69

viii
TABLE OF CONTENTS
DECLARATION ....................................................................................................................................... i
DEDICATION ........................................................................................................................................ iii
ACKNOWLEDGEMENT ....................................................................................................................... iv
ABSTRACT ............................................................................................................................................. v
LIST OF FIGURES ................................................................................................................................. vi
LIST OF TABLES ................................................................................................................................. vii
TABLE OF CONTENTS ...................................................................................................................... viii
CHAPTER 1 INTRODUCTION.............................................................................................................. 1
1.1 Background ..................................................................................................................................... 1
1.2 Project Success and Failures ........................................................................................................... 3
Sydney Opera House: ........................................................................................................................... 3
2002 Olympic Winter Games: .............................................................................................................. 4
Batu Hijau Copper Concentrator: ......................................................................................................... 4
Project Orion: ........................................................................................................................................ 4
Corporate Intranet: ................................................................................................................................ 4
Plant Water Conservation: .................................................................................................................... 5
Manufacturing Plant Optimization: ...................................................................................................... 5
Laptop Upgrade: ................................................................................................................................... 5
Senior Citizens Center Relocation: ....................................................................................................... 5
1.3 Project Success - New Metrics and Measurements ........................................................................ 7
1.4 Problem Statement ........................................................................................................................ 10
1.5 Objectives ..................................................................................................................................... 11
1.6 Research questions ........................................................................................................................ 12
1.7 The need for the study/justification for the study ......................................................................... 12
1.8 Significance of the Study .............................................................................................................. 13
1.9 ORGANISATION OF THE STUDY ........................................................................................... 13
CHAPTER 2 LITERATURE REVIEW ................................................................................................. 14
2.1 INTRODUCTION ........................................................................................................................ 14
2.2 THE CONCEPT OF ‘PROJECT FAILURE’ ............................................................................... 14

ix
2.3 TRIPLE CONSTRAINT VARIABLES INFLUENCING PROJECT SUCCESS AND FAILURE
............................................................................................................................................................ 15
A. Dynamics of the triple constraint ................................................................................................... 18
B. Good, fast, or cheap? Pick two ..................................................................................................... 19
C. Supporting factors of the triple constraint variables: ..................................................................... 20
D. Power structure of the triple constraint; ......................................................................................... 21
E. Key attributes of the triple constraint Variables; .......................................................................... 22
F. Consolidated triple constraint model; ............................................................................................ 22
2.4 PROJECT MANAGEMENT METHODOLOGIES AND TAILORING .................................... 24
2.4.1 How to tailor a project management methodology ............................................................... 25
Initial tailoring .................................................................................................................................... 26
Assessment; ........................................................................................................................................ 26
Develop and document the methodology ........................................................................................... 26
Conduct continuous improvement. ..................................................................................................... 26
Pre-project tailoring ......................................................................................................................... 27
Intra-project tailoring ....................................................................................................................... 27
CONCLUSION................................................................................................................................... 28
CHAPTER 3 RESEARCH METHODOLOGY ..................................................................................... 30
3.1 INTRODUCTION ....................................................................................................................... 30
3.2 RESEARCH DESIGN .................................................................................................................. 30
3.2.1 Research type ........................................................................................................................ 30
3.2.2 Research approach ................................................................................................................. 31
3.2.4 Population .............................................................................................................................. 33
3.2.5 Sampling Techniques ............................................................................................................ 34
3.2.6 Sampling Methods and techniques ........................................................................................ 44
3.3 DATA ANALYSIS AND INTERPRETATION .......................................................................... 45
3.4 VALIDITY, RELIABILITY, TRIANGULATION AND GENERALIZATION ........................ 47
Validity: .............................................................................................................................................. 47
Reliability: .......................................................................................................................................... 47
Triangulation: ..................................................................................................................................... 48

x
Generalization: .................................................................................................................................... 48
3.5 RESEARCH LIMITATIONS AND DELIMITATIONS ............................................................. 49
CONCLUSION................................................................................................................................... 50
CHAPTER 4 DATA ANALYSIS AND INTERPRETATION ............................................................. 52
4.2 Profile of projects selected for study ............................................................................................ 52
4.3 Primary data analysis .................................................................................................................... 53
4.4 ANSWERS TO RESEARCH QUESTIONS ................................................................................ 69
CHAPTER 5 SUMMARY, CONCLUSIONS AND RECOMMENDATIONS .................................... 74
5.1 INTRODUCTION ........................................................................................................................ 74
5.2 SUMMARY ................................................................................................................................. 74
5.4 CONCLUSIONS .......................................................................................................................... 76
5.5 RECOMMENDATIONS ............................................................................................................. 82
Recommendations for practitioners .................................................................................................... 82
Recommendations for improving this study ....................................................................................... 82
References .............................................................................................................................................. 84
APPENDICES ........................................................................................................................................ 86

1
CHAPTER 1
INTRODUCTION
1.1 BACKGROUND
Traditionally, project management used to mainly with managing the project planning and
implementation process (Brain, 2006). This view of project management specifically deals with the
project as a task or process that needs to be completed following the specifications, budget and time
given. This approach has provided universally accepted metrics of cost, schedule and performance to
evaluate the success of the project. However, these metrics do not provide the necessary view of
success from the perspective of the organization and its stakeholders.
For example construction industry, in most scenarios, one individual, or group leads a project as
stakeholders, who then designate another individual or group, e.g. an architect or engineer, who
prepares the working drawings. The construction is then managed by a construction project manager
either employed directly or by a general contractor. This happened to Kigali Convention Centre the
architectural work of planning and drawings were done by Spacial Solutions International GmbH an
American Company, Project managers were the Ultimate Concepts Ltd, and Construction work done
by Beijing Construction Engineering Group (BCEG) (The New Times Saturday, April, 25th, 2009).
Information Technology (IT), on the other hand, tends to be in a unique situation as many projects are
actually created within the IT department. Projects in IT are mostly designed and developed within IT,
implemented, presented to the stakeholders for approval and then maintained all by the same staff.
This further points to the need for looking outside the "on time, on budget and to specs" paradigm
when IT may be defining one, two, or all three of the product responsibilities. Example here is the
Integrated Payroll and Personnel Information System (IPPIS) a software system that manages all
government payments in Rwanda was designed and developed from Ministry of Public Service and
Labour in the Single Project Implementation Unit by Engineer Roger Migabo a software developer.
To understand the changing roles of Project managers is necessary to have a brief, look at the history
of project management. "Historically, project management responded to the need to create civil and
building works of some complexity"(Wideman, R.M., 1996). Project management was primarily
founded on taking a clearly defined and approved project through implementation. That model works
fine under traditional construction implementation where an individual or group of individuals define

2
the finished product (structure) and hire architect(s) to define that structure. The project manager is
given the time, cost and blueprints and is then instructed to "Make it happen". Once completed, the
project manager moves on to the next project.
This is contrary to how a large number of business projects are now being created and implemented. In
this case the individual who will be the project manager sometimes identifies a problem or need. Then
that person develops a business case and submits it to management for approval. If approved, the
project manager then has to perform the standard role of implementing the project. After
implementation, the project manager may also be responsible for continued maintenance and support
of the process, product, system, etc. This scenario is especially true in IT implementations, where
rollout, training and ongoing support is either a part of implementation or follows it. The IPPIS project
mentioned above serve as the best example since it was introduced its trainings were and still done by
SPIU and managed Mr. Roger Migabo.
This change in approach to project creation has major implications. Project sponsors, stakeholders
and/or company management are looking to the project manager not just to successfully implement
each project, but also to estimate ROI/ROV (Return on Investment / Return on Value) and other
metrics during the project evaluation phase. This is so that the product can be monitored and evaluated
during and after implementation. Unfortunately, project teams rarely do a post implementation review.
Even if a post-implementation review is performed, ROI is rarely measured because "With IT
purchases, there's no set formula for ROI because the sum of the gains is difficult to quantify.
Project management is based on one overriding goal: achieving the best outcome from project
investments (Billows, Dick, 2014).It is designed to engender a value-driven (commercial,
entrepreneurial) organizational culture and to drive out the best behaviours, best decisions and best
methods of working in terms of achieving the best (i.e. highest business value) project outcomes.
Project management based on principles engenders a much more dynamic, commercially focused
project delivery environment. A project delivery organization that performs project management by
principles operates not as a cost centre or a profit centre but as a ‘value centre’ (i.e. its key role is to
generate value for the business it serves) and is in a ‘Virtual Joint Venture’ with the business it serves
(i.e. there is real financial risk and reward for both parties) According to 2005 survey conducted for
Oracle Corporation, 61 percent of their projects earned value to the business.

3
Project management is both supply-side’ internally focused (basically, deliver what was in the agreed
functional specification, on the date agreed and at the cost agreed); and demand-side’ externally
focused (basically, deliver what the customer actually needs and realize the desired project outcomes,
in terms of business benefits, beginning on the date agreed and at the cost agreed (if these last two are
critically important); in this way it seeks to maximize the business value of project investments. The
example oracle mentioned above serves best here.
The business value mentioned above includes financial benefits (as measured by ROI, EVA, NPV or
other techniques). These financial benefits will include: reductions in existing costs, reductions in
other business costs, savings from reduced business investment, additional business revenue, improved
cash flow, business revenue reductions avoided, business cost increases avoided, business strategic
benefits, competitive advantage gained .e.g. improving the company’s image, increasing customer or
retailer switching costs, increasing supplier leverage, facilitating business collaborations, introducing
new products/services, changing business competition from being cost based (i.e. a commodity) to
being based on sustainable differentiation or establishing new product distribution channels
competitive response (i.e. responding to competitive threat).
1.2 PROJECT SUCCESS AND FAILURES
While understanding the causes of project failure is important one determine if a project is successful?
Here are some examples to see if the traditional metrics are valid.
One of the difficulties is that most case studies and project management examples only provide
examples of success. Those that do show failure are usually ones that are government or public works
projects. (Calleam consulting Ltd.com).
The following are examples that were provided by Woodward, Hugh, 2005, in his Power Point
Presentation to NASA on March 23, 2005:
Sydney Opera House: With its graceful sails dominating Sydney Harbor, the Sydney Opera House
is arguably one of the most recognized buildings in the world. Yet, from a project management
perspective, it was a spectacular failure. When construction started in 1959, it was estimated to cost $7
million, and take four years to build. It was finally completed in 1973 for over $100million.
(Architecture Week, 2003).

4
2002 Olympic Winter Games: The 2002 Olympic Winter Games was a very successful project
from a project management perspective, winning designation as PMI's 2003 International Project of
the Year. (Foti, 2004).It achieved the key dates, of course. But it deviated from the conventional
approach to "success" with respect to its cost performance. The project managers boast that they
turned a $100 million deficit into a $400 million surplus, not just by eliminating "nice-to-have" items,
but also by securing additional funds. Clearly, success was measured by profitability, not by achieving
a specific cost target.
Batu Hijau Copper Concentrator: PT Newmont Nusa Tenggara's Batu Hijau copper concentrator
was the world's largest "green field" startup when it was commissioned in September 1999. (Enos &
Rogers, 2002). It was an extremely complex construction project located on the remote Indonesian
island of Sumbawa involving 1,704,000 design hours, 48,791,000 construction hours, 551 separate
systems, and 19,200 engineering drawings and documents. Nevertheless, it was completed one month
ahead of schedule and $100 million under budget. It was considered very successful, but not merely
because of its cost and schedule performance. Rather, it was viewed as successful because the
production ramp-up was faster than expected, producing a cash flow from operations exceeding 200%
of budget within a year after start-up. In this case, the project team focused on the real objective that
was to produce copper concentrate, not to achieve the cost and schedule targets.
Project Orion: This massive effort to develop Kodak's new Advantix photographic system was
reputedly very well managed from a project management perspective. PMI recognized it as the 1997
International Project of the Year, and Business Week selected the system as one of the best new
products of 1996 (Adams, 1998). But Kodak's stock price has fallen 67% since the introduction of the
Advantix system, in part because it failed to anticipate the accelerating switch to digital photography.
(Bandler, 2003).
Corporate Intranet: Finch describes a project that involved the implementation of a corporate
intranet to globalize and improve communications. From a traditional project perspective, it failed to
meet its success criteria, but not significantly. It was one month late and believed to have been
accomplished with a small budget overrun. But both the project manager and senior management
viewed the project as successful. The hardware and software had been installed successfully with a
minimum of disruption, thereby providing all staff members with access to the corporate intranet.
Following implementation, however, employees made only limited use of the intranet facilities. The

5
main objective of the project was therefore not achieved. In this case, both the project manager and
senior management focused on an objective that was too narrow.(Finch,2003).
Plant Water Conservation: A manufacturing plant in a semi-arid part of the USA was ordered to
reduce its water consumption by 10%. Although the plant was already one of the most water-efficient
facilities of its kind in the world, the project team compiled a list of additional recycling and
conservation measures, and began implementation. Several months later, the company decided to close
down an orange juice facility that happened to be located at the same site, thereby reducing water
consumption by almost enough to meet the mandated target. The project team was thus able to return
the unspent funds to the company. Had it been focused on implementing the project scope according to
the initial plan, this opportunity to achieve the real goal without additional spending would have been
missed. (Brain, 2006).
Manufacturing Plant Optimization: A paper manufacturing company with five plants across
North America decided to increase its manufacturing capacity by embarking on a de-bottlenecking
program. A project team was formed to install the necessary equipment, and charged with completing
the work in 18 months at a cost of $26 million. But almost immediately, the project team was asked to
defer major expenditures until an unrelated cash flow problem was resolved. Rather than stop work
completely, the team adopted a strategy of prototyping the technologies on which the de-bottlenecking
program was based, and actually developed some cheaper and more effective solutions. Even when the
project was authorized to proceed, the team continued this same approach. The project eventually
spanned five years, but the resulting capacity increase was three times the initial commitment. Not
surprisingly, the company immediately appropriated another $40 million to continue the program.
(Brain, 2006)
Laptop Upgrade: The IT division of major international company was upgrading all the employee
workstations to a new platform. Because the laptops used by the sales division were near the end of
their leases, the project manager decided to issue new laptops with the new platform already installed,
thus significantly reducing the overall project cost. Unfortunately, once this decision was made,
schedule became the critical project objective, and the fact that the new platform was incompatible
with some unique software used by the sales division was completely overlooked. The inevitable result
was an enormous productivity loss, for both the project team and the sales division. (Brain, 2006).
Senior Citizens Center Relocation: A senior citizens center in a small US city was granted a
parcel of land to construct a new state-of-the-art facility. They immediately began preparing to move,

6
and engaged an architect to develop the plans. They also recognized they would need additional
revenue to operate the new facility and that the necessary funds were available from government
sources provided the center was accredited. Therefore, they also engaged a consultant to pursue
accreditation. Both projects proceeded independently for several months, and would have continued
except for a chance meeting between the architect and the consultant. After discussing their respective
work, they realized that the accreditation criteria required certain building features that the architect
had not incorporated. Scarce funds had already been wasted, but that chance meeting narrowly averted
a further $500,000 in re-work. (Brain, 2006).
Therefore there is a need to conclude on which ones were truly successful? Examples like the 2002
Winter Olympics and the Batu Hijau Copper Concentrator would suggest that these are truly
successful because they not only met the traditional project managers' definition of success, but also
met the projects sponsors' perception of success.
Look at the examples like Project Orion, the Corporate Intranet and the Laptop Upgrade, we notice
that the traditional metrics start to fail. These projects are considered successes in project managers'
definition of success, but failed at meeting the sponsors' success criteria. The project Orion example is
quite astounding as this project was recognized by PMI (Project Management International) in 1997 as
the International project of the year. Yet it did not increase Kodak's revenue, because they did not
foresee the adoption of digital cameras.
Most interesting are the examples of the Manufacturing Plant Optimization and the Sydney Opera
House. They both failed to meet the traditional project managers' success metrics but were in fact
considered successes. This is particularly shocking observing that the Sydney Opera House had a "cost
overrun of 1300%" and a "schedule overrun of 250%".
Realize that projects can fail to meet the traditional metrics of success, but still be successful to the
stakeholders; this creates a quandary for the project manager. How does one really define success? Is it
possible that a "Challenged" project could be canceled that would have met the sponsors' needs? Is it
also possible to identify a project that should be canceled that is currently on time, on budget and
meeting the defined needs?

7
1.3 PROJECT SUCCESS - NEW METRICS AND MEASUREMENTS
While not suggesting that project managers should "throw the baby out with the bathwater" and
eliminate traditional Project Management metrics, it does become obvious that additional metrics and
measurements need to be added to the project managers' toolbox. Hence, project justification should
be expanded and refined. Simply looking at the ROI for project justification is also shortsighted and
usually incorrect. Metrics should be identified as to how an implementation will benefit the core
business directives or mission statement and consequently how success of the project will actually be
measured once implemented. Just as important, when will the measurements be taken?
It is urged conventionally that at the very beginning of a project; organizations, vendors and project
managers should spend adequate time defining metrics, monitoring techniques and timetables that
relate to the categories and possible metrics shown in Table 1.1
Table 1.1 Table of project elements and suggested metrics
Category Metrics
Project Management Project Time, Project Cost, Project Accuracy (Specifications met)
Change requests, Quality, Safety (If applicable)
Project Success Benefit(s) to the organization, Stakeholder satisfaction, Number of
issues recorded since implementation, Ease of use/quality of use,
Happiness/Willingness of end users, Solved problem(s) project was
intended to solve, Un-intentional improvement/complication to
processes/procedures
Business Success Cost savings/cost reductions, ROI (Return on investments), Return on
Advantages, Improved operating efficiencies, Opportunities in the
future, Expanding or improving core competencies, Enhance
productivity, Reducing paper work, Reducing manual processes, Real
time processing/real time reports, Increased accuracy/ Quality
improvements, Customer service improvements, Resource mgt
improvements, Support business growth, Building external linkages,
Increased flexibility, Empowerment.
Source: (Brian K. Willard, 2005, project success)
Many project managers do not conduct a post implementation review that is essential for establishing
the overall success, failures, challenges and lessons learned. For those who do, it is usually within a
month or two of completion of the project and usually focuses on the traditional metrics,
success/failures and how the project team did in performing the project implementation. However, for

8
many projects, including IT projects, this may be insufficient time to get a clear picture of the project's
business success or failure.
To illustrate how time plays a part in reflecting holistic project success/failure metrics, consider the
track record of the Empire State building (ESB). (Sacks, R. and Partouche, R. 2010).
"The building was the brain-child of John J. Raskob, the vice-president of General Motors, who
wanted this new building to exceed the height of the rival car manufacturer's Chrysler Building, still
under construction when the plans were released on August 29, 1929. The program given to the
architects called for a tight schedule of completion one and a half years after the start of the project."
"The Empire State Building in New York City was completed 'in One year and 45 days... (ahead of
schedule); Cost $40,948,900 (including land). The Building Alone cost $24,718,000 (the onset of the
depression halved the anticipate cost of the building.)'"
So the ESB was completed ahead of schedule, under budget, and was to the specifications as designed.
If the measurement were to be done on traditional PM metrics the project would be a complete
success! However, if the metrics also looked at rented space, it would tell a completely different story.
For the very reason that it came in at half the production cost (the great depression), rental rates at the
building's opening was a meager 20%. In fact it was nicknamed the "Empty State Building." So if
measured on rented space on completion of the project, it would be a failure. But let's expand the time-
line. You have to go to 1948 or 17 years later for the building to have enough tenants to turn a profit.
Yet, today it is again the tallest building in New York, has always been the icon for New York and, as
of 2002, was 97% occupied Brian K. Willard, 2005).
That example brings up an important point. Success metrics may have to be monitored over a lengthy
period of time to determine the true success/failure of the project, something that may not be
immediately apparent shortly after completion.
This Time factor of measurement is very import, as many projects are either creating something new,
or implementing a new process or/and system. Metrics that look at many of the goals of a system need
time to realize their true impact, "...despite management's introduction of an extensive set of
organizational change initiatives, managerial goals of improved flexibility and responsiveness are not
immediately attained."
9
One last important metric is "usage". Whether in construction, like the Empire State building described
above, or a computer system, it is the beneficial use of the product that ultimately determines the
success of most projects. Therefore, this should be an important metric that is identified during project
approval stage and one that should be monitored throughout product's life span.
Some organizations have project failure rates that threaten their existence. In some cases they
can’t deliver to a customer o r client profitably. In other cases they can't deliver new products
and services that allow them to successfully compete. Organizations that have problems doing
projects can experience failure rates as high as 70%) project failure rate. Project is defined as
successful when it produces the desired deliverables presented in the business case within budget and
on time. If any of those three are missed, the project is a failure. But project success and failure isn't
just about the facts, nor is it simply about what was delivered. It's also, crucially, about how the project
is perceived. That's a tough definition of success and organizations that are very good at projects
c a n achieve it 90% of the time at best. But that success rate gives those organizations an
enormous competitive advantage and yields high levels of profitability. (Dick Billows, 2014).
Using the above success definition, we find that 70% of projects fail in most organizations (Dick
Billows, 2015,). Example here would include new software in the IT department, and new equipment
that wouldn’t meet the specifications as result of a vague scope so no one knows what is NOT
included that the department wouldn’t give the software specifications and new equipment didn’t meet
the capital approval.
That failure rate wastes so much money and human resources that even a small increase in the success
rate is worth a lot. But the solution is not easy because these organizations must: first identify where
the fault lies. This study will find where the fault lies at several levels in the in the Rwandan
organization project management context:
Would it be? Executives who fail in their strategic role of prioritization and resource allocation,
Project sponsors who fail to define exactly what the projects should deliver, project managers who
fail to give executives the tools they need to do their jobs and fail to give project team members
clear performance expectations, project team members who fail to make accurate estimates or
honestly report the status of their assignments. Therefore, these issues need systematic and focused
research.
10
1.4 PROBLEM STATEMENT
Most Project Managers would accept that failings in one or more of these four ‘project failure criteria’
“Not delivering when it was expected (Scheduled), Not delivering it at the cost expected (budget), Not
delivering all the functionality that was expected (scope), and Not delivering the functionality with the
expected quality” at least contributes to a fair perception of ‘project failure’. What many Project
Managers would probably not put on their ‘project failure criteria’ list is the criterion that deems to be
the cardinal one, the single biggest factor on which the business will typically assess a project as a
failure, namely, “Not realizing the full business benefits, as presented in the original business case”.
(Billows Dick, PMP, 2014).
As far as the business is concerned the only reason for investing in the project in the first place was to
reap the promised financial and non-financial benefits (i.e. its value) and if it fails to live up to
these promises then it has failed, end of story.
The argument is that the target of successful project management must be achieving the best business
value outcome of projects. These will be fully achieved if the benefits promised in the project’s
business case are fully realized in the timescales predicted in the business case.
It is conventionally argued that the four traditional project success criteria of ‘delivery to agreed
budget’, ‘delivery to agreed schedule’, ‘delivery of agreed scope’ and ‘delivery to quality
needs’ are ‘value modifiers’ i.e. they may not affect the project achieving its objectives as
highlighted by these examples;
Project Orion, the Corporate Intranet and the Laptop Upgrade, It was noticed that these projects are
considered successes in project managers' definition of success, but failed at meeting the sponsors'
success criteria. The project Orion example is quite astounding as this project was recognized by PMI
(Project Management International) in 1997 as the International project of the year. Yet it did not
increase Kodak's revenue. (Brain, 2006).
In another example, a late or over- budget stock replenishment system has still achieved the objective
of ‘automating stock replenishment’) ,but they will almost inevitably affect the project achieving its
best outcome (of maximum business value) because late project delivery delays the start of realizing
business benefits, over budget delivery reduces the net benefits realized, reducing the scope reduces
the value- adding functionality delivered and poor commercial quality, by definition, reduces the
delivered system/service’s ability to generate business value.

11
Conventional project management methodologies are focused almost exclusively on improving the
rigorousness of project management processes, with a view to increasing the probability of delivering
projects to budget, schedule, scope and quality criteria, which is not the case since does not supersede
this need, but complements it by facilitating cultural, process and organizational changes in
order to increase the probability of delivering projects that realize the full business benefits, as
promised in the original business case.
Projects are founded on the principle that in order to get the best outcome for the project we need to
focus our limited time and energy on avoiding or mitigating the most common causes of project
failure, where project failure is defined as failing to fully realize the promised business benefits.
Therefore this study is intended to verify what really make a project a success or failure.
1.5 OBJECTIVES
The main objective of this study is to enable the researcher get to know technical causes of project
failure, and therefore propose appropriate solutions of improvement specifically to Rwandan economy
and to the entire project management environment.
Specific objectives:
To analyze effective methodologies those contribute to reduce risk and increase value to projects.
To understand the factors that come into play to ensure that project deliverables are served as planned
in the business case.
To identify the required decision making core elements turned into actions or turnaround efforts to
correct high project failure rates and to make project work succeed.
To offer suggestions for improvements to the analyzed prevailing project management environment.

12
1.6 RESEARCH QUESTIONS
Some organizations have project failure rates that threaten their existence. In some cases they can’t
deliver to a customer or client profitably. In other cases they can’t deliver new products and services
that allow them to successfully compete. This scenario, it instills in the minds of the researcher the
following questions that are expected to be underscored in this research.
1. Where does the fault of project failure lies at different elements of project within an organization?
This is so because (Dick Billows Project Pedia) provides that organizations with problems of doing
projects can experience failure rates as high as 70% of which wastes so much money and human
resources that even a small increase in the success rate is worth a lot. It is crucially important to carry
out this study so as to obtain information and data to address this scenario.
2. Why stakeholders in some case especially the client or customer perceive a project as a success yet
doesn’t live to business expectations? I.e. success rate doesn’t give those organizations competitive
advantage and yields high levels of profitability.
3. Is it possible in Project Management world for project to operate as a ‘value centre’ not a profit
centre? i.e. in a Virtual Joint Venture with the business it supports, is dominated by the ‘value ethic’
(project produce the desired deliverables presented in the business case within its five major variables:
delivery to agreed budget’, ‘delivery to agreed schedule’, ‘delivery of agreed scope’, ‘delivery to
quality needs’ and risk).
1.7 THE NEED FOR THE STUDY/JUSTIFICATION FOR THE STUDY
Some organizations have project failure rates that threaten their existence. In some cases they can’t
deliver to a customer or client profitably. In other cases they can’t deliver new products and services
that allow them to successfully compete. It is from this regard that this study is necessary for Rwanda
as a country to have deep knowledge on why does this happen in only some organizations?
This scenario happens in practice leads me to a need for a study with a purpose to address when – and
why – a project has failed? In many cases, the reason for failure is obvious. Project is defined as
successful when it produces the desired deliverables presented in the business case within budget and
on time. If any of those three are missed, the project is a failure. But project success and failure isn't
just about the facts, nor is it simply about what was delivered. It's also, crucially, about how the project
is perceived.

13
Efforts to correct high project failure rates must include action from research studies advice this one
inclusive to address this problem. But these turnaround efforts will not only fight the usual resistance
to change but also help in implementing processes to make the project management work happen and
they are worthy of academic investigation to contribute to the current knowledge around this problem.
1.8 SIGNIFICANCE OF THE STUDY
The research report from this study project shall become an asset to the University of Rwanda, College
of Business and Economics for students’ use; however it will also help the researcher to have the
opportunity to implement expertise in project management.
There researcher is a Rwandan with experience in Rwandan economy and established with extensive
network of contacts which helped optimize the researcher’s time by providing ready-made avenues for
best of research.
1.9 ORGANISATION OF THE STUDY
The thesis is presented in five chapters; chapter 1 is Introduction composed of: background; statement
of the problem; Objectives; Research questions; purpose of the study; contributions of the study,
limitations. chapter 2 Literature Review comprised of : chronological, categorical or related
theoretical viewpoints related to topic, chapter 3 Research Methodology composed of: research design
or approach (qualitative); population; Sampling frame work; Sample and sampling technique;
Instruments; collection and tabulation of data; and data analysis procedures, chapter 4 Research
findings, and discussion made of: presentation and discussion of the findings, Finally chapter 5
Summary, Conclusions, Recommendations comprised of: summary of the entire research effort;
address the initial purpose of the study (stated in the introduction); stress the importance of the work
accomplished; leaves a final impression on the reader, and also include suggestions for further work.

14
CHAPTER 2
LITERATURE REVIEW
2.1 INTRODUCTION
Some organizations have project failure rates that threaten their existence. In some cases they can’t
deliver to a customer o r client profitably. In other cases they can't deliver new products and
services that allow them to successfully compete. Why does this happen i n only some
organizations is the subject matter to analyze in the following literatures of different researchers in
project management fraternity by use the following objectives set herein.
To review the empirical and theoretical literature relevant to the project failure, To indicate what has
been done by other researchers including the methodologies used and identify gaps, To develop
hypothesized variables to form a framework that would help in analysis, To come up with a
conceptual framework that demonstrates an understanding of what variable influences what, To
criticize the existing literature relevant to the study, and To indicate the research gaps.
2.2 THE CONCEPT OF ‘PROJECT FAILURE’
Dick Billows (2014) wrote that Projects are generally undertaken because they are part of the plans to
meet business needs and charter organizations to new levels of performance. They need to be
constructed faster, cheaper and better. Around the world mission-critical projects are being launched
all the time involving significant capital investments and high-risk ventures. Projects are becoming
the way of the working world. What makes project delivery successful or failure is however a topic of
much academic debate, and depends by whom and against which value system the project is being
evaluated. Ultimately, the success or failure of a project is subjective: perceptions are reality. If the
Board perceives the project as a failure then it is a failure. If the project Sponsors and Stakeholders
perceive it as a failure, then it is a failure on what evidence do they base their perception of failure?
This will be based on one or more of the following, listed in the typically decreasing order of priority;
1. Not delivering when it was expected (Scheduled), 2. Not delivering it at the cost expected (budget),
3. Not delivering all the functionality that was expected (scope), 4. Not delivering the functionality
with the expected quality. The various project failure statistics are all based primarily on these four
criteria. They tend to act in a ‘push-pull’ relationship with one another, changes in one tending to
have an effect on one or more of the others. Most Project Managers would accept that failings in one

15
or more of these four ‘project failure criteria’ at least contributes to a fair perception of ‘project
failure’. What many Project Managers would probably not put on their ‘project failure criteria’ list is
the criterion that deems to be the cardinal one, the single biggest factor on which the business will
typically assess a project as a failure, namely, 5. Not realizing the full business benefits, as promised
in the original business case. As far as the business is concerned the only reason for investing in the
project in the first place was to reap the promised financial and non-financial benefits (i.e. its
value) and if it fails to live up to these promises then it has failed, end of story.
The recommendation here is that, there is a need to focus the limited time and energy on avoiding or
mitigating the most common causes of project failure, project failure is failing to fully realize the
promised business benefits. But this can be dealt away with the use of methodologies or project
management techniques as a way to reduce risk and increase value and the conflicting demands and
competing priorities within the project environment that constrain projects because Neglecting to
manage these constraints accurately and effectively may be sufficient to condemn a project even if all
other project management activities are performed to a high standard of excellence. In the following
discussion an integrated model is proposed to facilitate the strategic management of the triple
constraint trade-offs as a function of the project higher purpose and Tailored Project Management
Methodology are considered priorities to realize strategic decisions.
2.3 TRIPLE CONSTRAINT VARIABLES INFLUENCING PROJECT
SUCCESS AND FAILURE
Project Management Institute (2014) introduced a useful model to illustrate the consequences of
change on the triple constraint to key project stakeholders. The triangle reflects the fact that the three
constraints are interrelated and involve trade-offs – one side of the triangle cannot be changed without
impacting the others. Project quality takes root in all three variables of the triple constraint and is
affected by balancing the three factors. (Van Wyngaard 2012) introduces that triple constraint is a
critical project management concept that originates from the basis for undertaking a project and
provides direction for framing the project. The triple constraint constitutes one of the primary building
blocks of the project plan and is paramount to the monitoring and controlling process group. Project
time addresses the scheduling and duration of the project, cost addresses the budget and resources of
the project, and scope addresses the requirements and work of the project. A time-constrained project
is bounded by the completion agenda, whereas a cost-constrained project is bounded by the
scheduling of expenditure. Scope- constrained projects are bounded by the performance criteria of the

16
deliverables. Project quality constitutes an integral dimension of project management and is supported
by the triple constraint (Burke 2001).
Dobson, Feickert (2007) endorsed that every project is governed by the triple constraint variables,
which reflects a framework for evaluating these competing demands. (Project Management Institute
2014) Guides that practitioners have a broad and general introduction to ways an organization can
integrate its portfolio, program and project management practices into its overall organizational
management and How to Develop a Tailored Organizational Project Management Methodology,
presents a process to enable practitioners and organizations to develop their own tailored
methodology. It also spotlights project management methodologies tailored for organizational fit and
proposes a model and process for the initial and ongoing tailoring of a project management
methodology. Theory of constraints sets out to ensure that all of the non-constraints are fully
subordinated to the constraints. The following sections discuss the introduction of triple constraints
model, Research methods used, Theoretical framework, and Case study analysis.
Figure 2.1 Project management triangle
Source: ‘Implementing organizational project management’ (PMI 2014).
There is knowledge gap that results in project managers not being able to effectively prioritize and
exploit the triple constraint trade-offs. It is proposed that a thorough comprehension of the triple
constraint dynamics is paramount to effective project management. Another problem is that project
managers often create false impression of tangible progress by relying heavily upon traditional on-
time, on-budget and on-target measures – yet this tactic fails to address the strategy ambiguity or
establish appropriate project goals . It has also become commonplace in many projects to view the
triple constraint trade-offs as organizational problems that have a definitive solution (‘either/or’
choices) – yet this tactic fails to effectively negotiate the triple constraint and leads to destructive
conflict. Without the effective management of the triple constraint as an interrelated system, projects

17
run the risk of becoming separated from purpose. A mechanism is needed on how to manage this
seemingly contradictory task when it comes to constraint trade-offs. The hypothesis is that if these
constraints are managed properly, organizations will be successful in delivering projects and meeting
organizational goals.
Van Wyngaard, Pretorius (2011) examines the idea behind the project management triangle and
power structure of its constraints. An integrated model is proposed for managing relative flexibility
within the triple constraint towards a beneficial outcome in terms of project success.
The basic structure of the research process used in the study is presented in Fig. 2.
Figure 2.2 Research Process
Source: ‘Strategic Management of triple constraint trade-off dynamics’ (Van Wyngaard & Pretorius
2011, pp. 824-828).
The type of study associated with their paper was primarily non-empirical defined through an
extensive literature study, conceptual analysis and construction of an integrated model using secondary
data. Theory building in the research occurred through retroductive and deductive strategies.
Conceptual explication was used to derive the model through analysis and integration of concepts
discovered through the literature study. The research undertook basic case study analysis as a
mechanism to demonstrate that the derived model is valid and useful, which also introduced an
18
empirical element into the research design. The results from the case study analysis have been
generalized to refer back to the project management body of knowledge in terms of applicability.
The integrated model presented here is highly conceptual. The emphasis in the study was on
qualitative reasoning both in definition, explanation and application, rather than an emphasis on
empirical and other quantitative techniques. The findings of the research study should thus be
considered as preliminary rather than conclusive, pending further research.
Ward (203) provides theoretical overview of some of the key concepts surrounding the triple
constraint, and concludes with a consolidated triple constraint model.
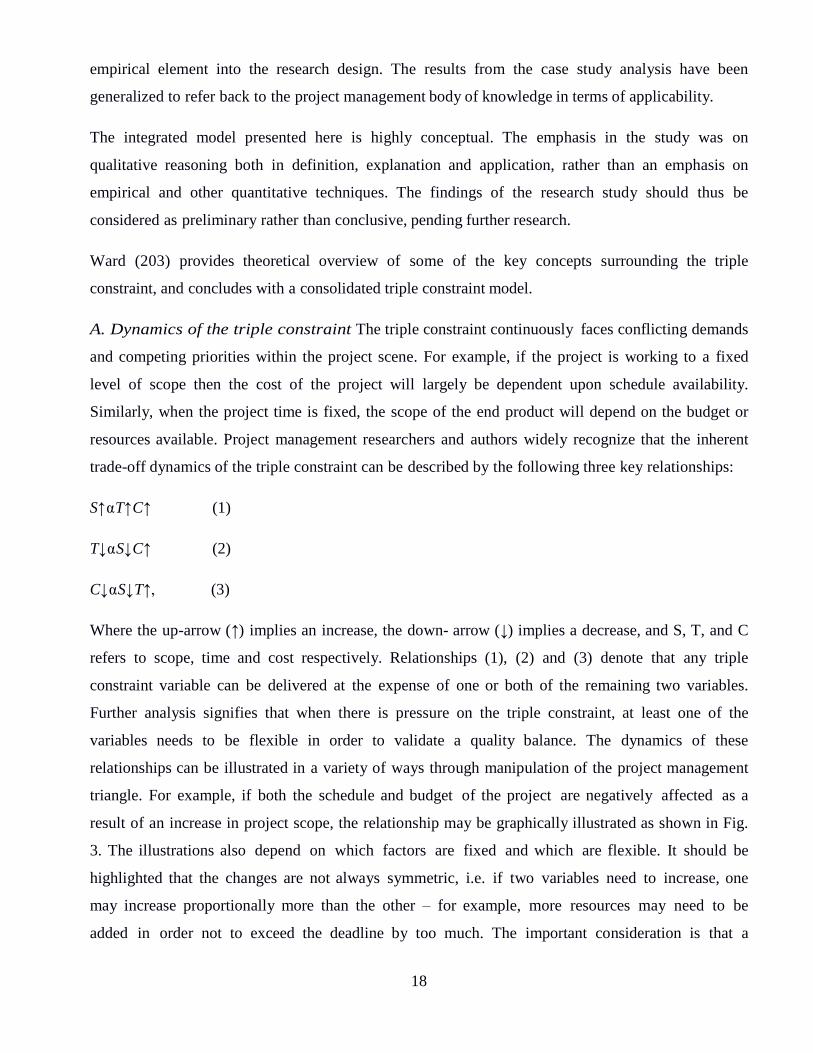
A. Dynamics of the triple constraint The triple constraint continuously faces conflicting demands
and competing priorities within the project scene. For example, if the project is working to a fixed
level of scope then the cost of the project will largely be dependent upon schedule availability.
Similarly, when the project time is fixed, the scope of the end product will depend on the budget or
resources available. Project management researchers and authors widely recognize that the inherent
trade-off dynamics of the triple constraint can be described by the following three key relationships:
S↑ α T↑ C↑ (1)
T↓ α S↓ C↑ (2)
C↓ α S↓ T↑, (3)
Where the up-arrow (↑) implies an increase, the down- arrow (↓) implies a decrease, and S, T, and C
refers to scope, time and cost respectively. Relationships (1), (2) and (3) denote that any triple
constraint variable can be delivered at the expense of one or both of the remaining two variables.
Further analysis signifies that when there is pressure on the triple constraint, at least one of the
variables needs to be flexible in order to validate a quality balance. The dynamics of these
relationships can be illustrated in a variety of ways through manipulation of the project management
triangle. For example, if both the schedule and budget of the project are negatively affected as a
result of an increase in project scope, the relationship may be graphically illustrated as shown in Fig.
3. The illustrations also depend on which factors are fixed and which are flexible. It should be
highlighted that the changes are not always symmetric, i.e. if two variables need to increase, one
may increase proportionally more than the other – for example, more resources may need to be
added in order not to exceed the deadline by too much. The important consideration is that a
19
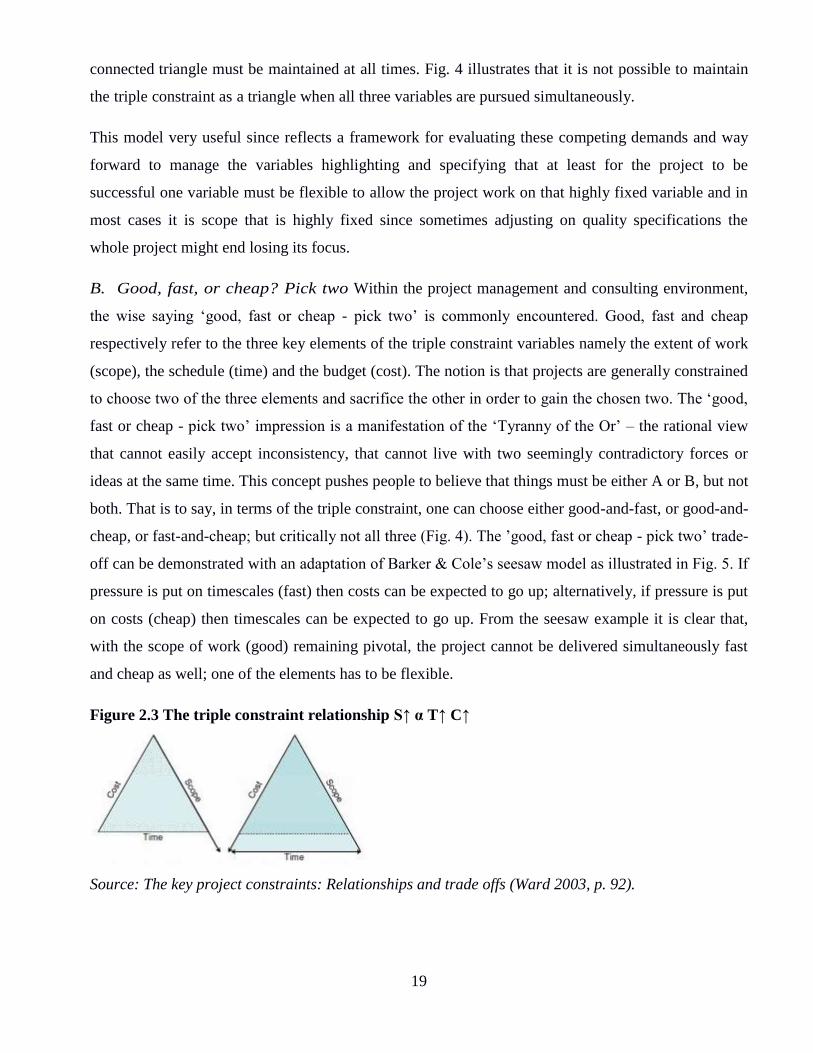
connected triangle must be maintained at all times. Fig. 4 illustrates that it is not possible to maintain
the triple constraint as a triangle when all three variables are pursued simultaneously.
This model very useful since reflects a framework for evaluating these competing demands and way
forward to manage the variables highlighting and specifying that at least for the project to be
successful one variable must be flexible to allow the project work on that highly fixed variable and in
most cases it is scope that is highly fixed since sometimes adjusting on quality specifications the
whole project might end losing its focus.
B. Good, fast, or cheap? Pick two Within the project management and consulting environment,
the wise saying ‘good, fast or cheap - pick two’ is commonly encountered. Good, fast and cheap
respectively refer to the three key elements of the triple constraint variables namely the extent of work
(scope), the schedule (time) and the budget (cost). The notion is that projects are generally constrained
to choose two of the three elements and sacrifice the other in order to gain the chosen two. The ‘good,
fast or cheap - pick two’ impression is a manifestation of the ‘Tyranny of the Or’ – the rational view
that cannot easily accept inconsistency, that cannot live with two seemingly contradictory forces or
ideas at the same time. This concept pushes people to believe that things must be either A or B, but not
both. That is to say, in terms of the triple constraint, one can choose either good-and-fast, or good-and-
cheap, or fast-and-cheap; but critically not all three (Fig. 4). The ’good, fast or cheap - pick two’ trade-
off can be demonstrated with an adaptation of Barker & Cole’s seesaw model as illustrated in Fig. 5. If
pressure is put on timescales (fast) then costs can be expected to go up; alternatively, if pressure is put
on costs (cheap) then timescales can be expected to go up. From the seesaw example it is clear that,
with the scope of work (good) remaining pivotal, the project cannot be delivered simultaneously fast
and cheap as well; one of the elements has to be flexible.
Figure 2.3 The triple constraint relationship S↑ α T↑ C↑
Source: The key project constraints: Relationships and trade offs (Ward 2003, p. 92).

20
Figure 2.4 Better, Faster, Cheaper-Is this really possible?
Source: ‘The key project constraints: Relationships and tradeoffs’ (Ward 2003, p. 95).
The following analogy may be drawn between the ‘good, fast or cheap - pick two’ permutations and
the key triple constraint relationships:1) Relationship 1, S↑ α T↑ C↑, implies that the effect of
increasing scope (S↑), or effort (pressure) to achieve scope, necessitates an increase in time (T↑)
and/or cost (C↑). If cost remains unchanged, then the project can be delivered good (because S↑) and
cheap (because C fixed as planned) but not fast (because T↑); 2) Relationship 2, T↓ α S↓ C↑,
implies that the effect of reducing time (T↓), or effort (pressure) to achieve time, necessitates a
reduction of scope (S↓) and/or an increase in cost (C↑). If scope remains unchanged, then the project
can be delivered fast (because T↓) and good (because S fixed as planned) but not cheap (because C↑);
3) Relationship 3, C↓ α S↓ T↑, implies that the effect of reducing cost (C↓), or effort (pressure)
to achieve cost, necessitates a reduction of scope (S↓) and/or an increase in time (T↑). If time remains
unchanged, then the project can be delivered cheap (because C↓) and fast (because T fixed as planned)
but not good (because S↓).
C. Supporting factors of the triple constraint variables: Within the context of this work the
three prime elements of scope, time and cost are considered central to the triple constraint. Project
management literature, however, from time to time indicates quality and performance as an attachment
to or substitutes for scope, and occasionally designates customer satisfaction and project risk as
ancillary constraints. Project scope put in a nutshell capability and grade attributes. Grade refers to the
set of attributes on which the quality of a product will be judged. Quality constitutes an
uncompromising and inherent objective of the project specification that takes root in all three
properties of the triple constraint.

21
Figure 2.5 Good-and-fast vs. good and cheap.
Source: ‘Brilliant project management’ (Barker & Cole 2007, p.102)
A lower-grade material, for example, is not necessarily a lower-quality material, as long as the
grade of material is appropriate for its intended use. Performance is an operational assessment
metric for the triple constraint in terms of project accomplishment, which should be continuously
monitored and controlled throughout the project. Performance and quality are hence not
substitutes for scope. Customer satisfaction is a fulfillment of the consumer requirements,
expectations and needs, and constitutes a performance measure in terms of quality or excellence.
Risk impacts the performance of the triple constraint, which may impetuous change in terms of the
triple constraint trade-off dynamics.
D. Power structure of the triple constraint; one of the challenges project managers face is the
iterative and infringing requirements of the customer. A good starting point is thus to understand the
customer’s priorities in order to identify the most important aspect of the project and obtain an
optimum balance between the constraints. (Dobson & Feickert 2007) defines a project by listing the
triple constraint variables in order of flexibility and proposes that exploitation of flexibility in the
weaker (more flexible) constraints can be used as a tool to meet the absolute requirement of the driver
(least flexible) constraint in order for the project to succeed. The driver constraint is derived from the
raison d’être of the project and is the constraint that has to be met otherwise the project fails.
There can only be one project driver at any given time. The weak constraint has the greatest
flexibility, but is not necessarily the least important. The middle constraint normally has a small
amount of flexibility and can either be very close to the driver in importance to the project mission, or
may sometimes have flexibility more similar to the weak constraint. It is important to note that
flexibility, and not importance, serves as the ranking criterion. Importance is the relative merit of the
constraints considering the long- term value of the project. Flexibility is the extent to which the
project manager can manipulate the constraints in order to successfully deliver the project.

22
It is presupposed that the effective management of the triple constraint power structure and its
dynamics is central to project success. Details pertaining to trade-off strategies and exploitation
considerations are documented below.
E. Key attributes of the triple constraint Variables; The following fundamental characteristics
were consolidated in support of the working of the consolidated triple constraint model. 1) Effective
projects bring form and function to ideas or needs, and yield beneficial change or added value. 2) The
higher purpose of a project is fundamentally the driver of the project. 3) The triple constraint
constitutes a balance of the three interdependent project elements of scope, time and cost as a
function of the project higher purpose. 4) The concepts of quality, customer satisfaction, performance
and risk have an impact on the triple constraint, but do not inherently constrain the project. 5) The
cause and effect of new or changing triple constraint requirements are constantly negotiated during
all phases of a project. 6) Change within the triple constraint is compensated through proportional
trade-offs.
7) Failure to deliver all three triple constraint variables on target does not necessarily imply project
failure. 8) Flexibility is a requisite triple constraint requirement in order to accommodate shifts in
project emphasis, and to ensure a beneficial project outcome. 9) The three key triple constraint
relationships signify that at least one of the triple constraint variables must be constrained (otherwise
there is no baseline for planning), and at least one of the variables must have capacity for
exploitation (otherwise quality may be affected). 10) The triple constraint can be prioritized into a
power structure by ranking the variables into a hierarchy of flexibility (capacity for exploitation). 11)
The power structure derives from the project objectives and higher purpose and may be influenced by
environmental change. 12) Capitalizing on the softness of the two more flexible constraints can be
used as a mechanism to achieve the essential demands of the primary triple constraint variable (the
driver).
F. Consolidated triple constraint model; The integrated model was realized through conceptual
amalgamation of the key derived triple constraint attributes discussed in the previous section. The
matured model is presented in Fig. 6. The consolidated model has been named the TRIJECT model
(an acronym created from the titles ‘TRIple constraint’ and ‘proJECT management’). The project
management triangle, which constitutes the heart of the TRIJECT model, is supported by the two
more flexible constraints (time and cost in this instance) and forms the foundation of the triangle.
The primary triple constraint variable (scope in this instance) aligns the triangle with the project

23
higher purpose. The triangle projection is dynamic and can pivot about its axis to accommodate
change within its power structure. The triple constraint hierarchy may be influenced by the project
environment, which impacts the higher purpose and objectives of the project. The model embodies
three dimensions, in which each facet of the triple constraint may drive the project.
The specific picture of this model towards to the improvement on project failure is that it brings about
“The project management triangle, which constitutes the heart of the TRIJECT model, supported by
the two more flexible constraints and forms the foundation of the triangle where as the primary triple
constraint variable aligns the triangle with the project higher purpose. The triangle projection is
dynamic and can pivot about its axis to accommodate change within its power structure a change that
is influenced by the project environment, which impacts the higher purpose and objectives of the
project.
Figure 2.6 TRIJECT model
Source: ‘Six dimensions of project management’ (Dobson & Feickert 2007 p.156).
The central presence of quality is signified by the outline shape of the TRIJECT model, which,
using some imagination, resembles a capital letter ‘Q’. The rationale of the TRIJECT model is based
on the achievement of the primary triple constraint variable through the exploitation of the two more
flexible constraints and alignment with the project higher purpose. The continuous cycle implied by
the model represents the ongoing and interrelated nature of this process as change is introduced into
the system. Monitoring and controlling hence manifest a requisite part of this cycle. The model also
accounts for the ancillary issues such as ‘the why’ of the project and change within the project
environment as well as quality and control.
Van Wyngaard, Pretorius (2011) analyses the case and say that evaluation of the TRIJECT model was
limited to the exploratory review of the theoretical model and protocol against a simplified case in

24
order to facilitate a conceptual understanding of the integrated model in practice. The observed case
was the building project of the Smithsonian Institution, National Air and Space Museum (NASM).
There is no claim that this case is representative of the general project management milieu.
The Case was paraphrased and defined as follows; The NASM project mission, essentially, was to
build a world-class aviation and space museum for a budget of approximately USD 40 million and
open it on July 4, 1976. The project mission statement satisfies the triple constraint, which is defined
as follows: Time constraint = July 4, 1976 Cost constraint = USD 40 million Scope constraint =
World-class museum. It is argued that in this case scope constraint, although probably the most
important, is also the most flexible (weak) constraint for this project. The USD 40 million federal
appropriation is a definite number, but not an exact one. Major construction projects often have a
contingency reserve of up to 10% of the budget for change orders and other problems. Considering
flexibility and following the process of elimination, cost may thus be identified as the middle
constraint for this project, the Time constraint has therefore been assigned in the lead position as the
driver for this project.
The Case was investigated and analyzed in this way; with the project mission and triple constraint
power structure defined, the TRIJECT model for the NASM project can be described as the
Exploitation of the project budget (C↑) lessens the pressure to rollback on the museum’s scope
requirements, and supplements the effort to ensure that the deadline for opening the museum is met.
The cost constraint includes both cash and non-cash resources. Exploitation of the project scope (S↓),
on the other hand, alleviates the pressure to add additional cost and resources to the museum budget,
but also supplements the effort to ensure that the deadline for opening the museum is met. What is
called for is a dynamic mechanism that may equilibrate the system as exploitation weight shifts and
trade-offs are compromised during the project as the effective management of NASM case.
2.4 PROJECT MANAGEMENT METHODOLOGIES AND TAILORING
PMI (2013b) report found that “organizations with developed project management practices, benefits
realization processes, portfolio management practices and program management practices and those
with high organizational agility all have significantly better project outcomes than their counterparts
who are less advanced in their project management practices” (p.11). This section spotlights project
management methodologies tailored for organizational fit, proposes a model and process for the initial
and ongoing tailoring of a project management methodology. The goal is to enable organizations and
project management practitioners to develop and tailor their own project management methodologies

25
to improve efficiency, effectiveness and the likelihood of project success. A Guide to the Project
Management Body of Knowledge (PMBOK® Guide) (PMI, 2013b) defines Project management
methodology as a defined, documented and discoverable set of policies, practices, processes, tools,
techniques and templates that provide guidance on how projects are run within an organization. A
methodology can be extensive or minimal; rigorous or lightweight; complex or simple; linear or highly
iterative; described in phases or described for the entire project lifecycle. There is no one, single
project management methodology that should be applied to all projects all of the time. A project
management methodology should reflect the size, duration and complexity of each individual project,
and be adapted to the industry, organizational culture and level of organizational project management
maturity of the organization. Tailoring is the process of referencing framework documents, standards
and other relevant sources and utilizing those elements that provide processes, tools and techniques
that are suitable for that particular organization. It also includes modifying existing processes currently
in use by the organization. As such, the process of tailoring is a process of customizing a project
management methodology. The result of tailoring is that the project management methodology will be
suitable for use in specific types of projects, and a tailored methodology will reflect the size,
complexity and duration of the project as appropriate for the organizational context along with
adaptation to the industry within which the project is undertaken.
2.4.1 How to tailor a project management methodology
PMI (2014) gives a broad outline of how to develop a tailored organizational project management
methodology. The nine-step process is categorized into assessment, development and improvement
phases as follows: These nine steps should not be seen as just a single, linear process, but a process
that is repeated at three distinct stages. These three interconnected stages are represented in Figure 10.
Figure 2.7 Three stages of tailoring a project management methodology
Source: ‘Implementing Organizational Project Management’ (PMI 2014)

26
Initial tailoring
The first stage in developing a custom-fit methodology is the initial tailoring. This develops and
selects those processes, tools, templates, techniques and practices that will form the elements of an
organizations’ particular baseline tailored project management methodology. Once this initial process
is complete, a baseline methodology is established. The value in doing this is that the organization has
guidance that will deliver more successful projects and real bottom-line value to the organization. A
checklist and Process Group that provides guidance on potential topics or areas for which to develop
material when deciding what to include or exclude in the initial development of the tailored project
management methodology is explained in the later discussions.
Assessment; The assessment processes seek to measure the current level of project management
maturity, and define the desired level within the organization. The purpose of this exercise is twofold:
First, to get a picture of where the organization is now, and where it should be in relation to project
management maturity and capability; second to provide a benchmark against which future change
(hopefully improvements) can be measured. (PMI 2013). PMI’s Standards Navigator (PMI, 2014)
provides guidance in developing a methodology using PMI standards as follows; Identify types of
projects, Identify inputs, .Identify constraints, Identify resources and;
Develop and document the methodology. Build the methodology iteratively by using project
management practitioners and project team members to document resources such as a process flow
chart, user guides, standardized templates, tools, techniques and other aspects of the methodology.
Don’t worry about building everything right away; focus on the most important aspects first. Then,
take into account the size of the organization, the size and types of projects undertaken, the
organizational and project team culture, the range of complexity of projects, the project duration, and
the level of organizational project management maturity. As a broad overview, start by developing an
outline or process flow chart using the Plan-Do-Check- Act cycle, or process groups of: initiating;
planning; executing; monitoring and controlling; and closing to define major parts of the process.
PMBOK® Guide (PMI, 2013b). Derive output. The output derived from this process is the
documented, discoverable, tailored project management methodology ready to be used across the
organization. Make sure everyone knows where to find the elements of the new methodology. Once
the methodology has been documented, go ahead and use it as planned. Note whether it is working as
expected and be prepared to make changes to improve its suitability.
Conduct continuous improvement. A commitment to continuous improvement is one of the
hallmarks of a high level of organizational project management maturity. In order to carry out any

27
activities associated with continuous improvement, an organization needs to have resources devoted to
the task. The process of continuous improvement includes audits to ensure that the project
management methodology is being used as intended—including the method for tailoring to specific
needs of the project—and that it is contributing to an increased level of project success. The audits will
reveal opportunities for continuous improvement as well. Update the methodology as required.
Monitor key performance indicators, Repeat for each of the different types of projects.
Pre-project tailoring
The second stage in tailoring recognizes that in addition to the efforts involved in tailoring a
comprehensive baseline project management methodology for the organization, there must also be
tailoring to individual projects—not just types of projects. This involves selecting the processes, tools
and templates that are applicable to the project at hand. This works best when the baseline
methodology includes guidance on how to further customize it, including a checklist of compulsory
and optional elements. This process is not about adding in new or unique elements, but is instead about
refining the existing baseline methodology to more perfectly suit each project. A central concept to the
idea of tailoring is that it must be fit for purpose. Prior to using the project management methodology
on any specific project, a project manager should take responsibility for tailoring it even further to suit
his or her project. The second stage is the tailoring done before starting a project to determine what
elements of the project management methodology should be used. An easy way to do this is to classify
projects as: very simple; simple; medium; and complex using a matrix.
Intra-project tailoring
The third stage reflects and confirms the customizing nature of tailored project management
methodologies throughout the project lifecycle. This intra-project tailoring is completed throughout
the project lifecycle by checking that the particular combination of elements selected is still
appropriate and the project is not being over- or undercooked. Tailoring is an iterative process done
throughout the entire project lifecycle. The Project Management Office, if one exists, should have an
input into this review process and oversee and approve any changes. Capturing lessons learned about
the application of the selected methodology helps other project managers in the future.(Snyder 2013).
28
CONCLUSION
The study of the project constraint variables is believed to be one of the most overlooked fundamentals
of project management. As a result of the various perspectives and interpretations across literature that
surround the project management triangle and triple constraint, the need for a unified model has been
identified. The TRIJECT model supports an understanding of predetermined resources and facilitates a
mechanism for managing the competing triple constraint requirements. The model encourages the
creative exploitation of the triple constraint to improve project performance by considering the relative
flexibility between the key elements. The goal of the model is to maintain the focus of the triple
constraint power structure on the project higher purpose.
The case study paraphrased and referenced demonstrated that the integrated model may equip the
instruments that enable project teams to manage their work in line with the absolute requirements for
project success. It should be taken in consideration that every project will experience its own unique
limitations to exploitation capacity, which needs to be assessed through appropriate ‘cost’ vs. value
impact analyses. Projects should however aim to always deliver to a much greater extent in terms of
value than the sacrifice of the exploitation effort.
Industry research suggests that there is a direct relationship between a tailored project management
methodology and project success. Undertaking the development of a tailored project management
methodology using the model presented here, and based on the processes discussed in Implementing
Organizational Project Management: A Practice Guide (PMI, 2014), can improve the efficiency and
consistency of project execution and improve project success. This is especially relevant to
practitioners who do not have a project management methodology because they don't know how to
build one. The model provides guidance to assist project management practitioners in building and
improving their own tailored project management methodology.
It also suggests that there is a relationship between the presence of a defined project management
methodology, and the degree of tailoring of that project management methodology, and project
success. A defined project management methodology tailored to suit the size, complexity, duration
and organizational context, as well as the organization’s industry, can contribute to a higher level of
organizational project management maturity and, as such, either directly or indirectly contribute to
higher levels of project success.

29
This research objectively study the creative exploitation of the triple constraint to improve project
performance by considering the relative flexibility between the key elements and examines how
Projects aim to always deliver to a much greater extent in terms of value than the sacrifice of the
exploitation effort and finally highlight the benefits of a suit project methodology such as a higher
level of organizational project management maturity and, as such, either directly or indirectly
contribute to higher levels of project success.

30
CHAPTER 3
RESEARCH METHODOLOGY
3.1 INTRODUCTION
This chapter gives an overview of the research approach adopted in the thesis. It identifies the
thesis’s nature. It further looks at the research methodology. Case study was used as a research
strategy as it is distinguished by its ability to investigate the phenomenon of project failure from
qualitative aspects and focus on relationships and processes. The chapter explores case study
(causes of project failure to deliver the value promised in their business cases in Rwanda) and
rationalizes the sampling strategies and the research methods used for collecting the data in case
study. Data was collected using two qualitative research methods: research questionnaires, and
document analysis. The chapter then looks at the qualitative analysis techniques which were used for
analyzing the data. It ends with a discussion of issues related to the validity, reliability,
triangulation and generalization of the results. In short it’s defining what the activity of research is,
procedures, measure progress, and what constitutes success.
3.2 RESEARCH DESIGN
3.2.1 Research type
This research is a descriptive, analyzed and developed from qualitative point of view to
accomplish the overall aim of the study, because as most of the business and environment literature
has largely focused on quantitative studies that lack deeper theoretical analyses (Stokes, 2000).
The qualitative approach helped to get a deeper understanding of the issues being investigated. It
is an approach that has enabled the research questions to be answered by providing a rich picture on
the actual conditions surrounding project management practices. As Gray (2004) showed,
qualitative research is distinguished as a highly-contextual approach where data is gathered over
long periods and in natural real life settings. It can answer how and why questions rather than
giving a brief view about the phenomenon studied. This research process started by identifying the
research problem, setting out the aim and objectives of the study, developing three research
questions, reviewing the related literature, selecting the research methodology and the methods
that would be effective in answering the research questions, gathering the data from the field using
multiple qualitative methods and finally analyzing the data. tried to understand and make sense of
the data collected in which a best practice model for the project management to encourage

31
better project management practices in Rwanda with a conclusion drawn based on the
participants’ views regarding the issues being investigated.
3.2.2 Research approach
General framework is a naturalistic/interpretative approach concerned with understanding the
meaning people give to the phenomena o f Project failure within project management milieu.
(Snape and Spencer (2003), It uses Analytical objective to describe variation, to describe and
explain relationships, to describe individual experiences, to describe group norms. it is the approach
which provides a deeper understanding of the project management milieu; Data format is textual
(obtained from Database reports and field notes) it is based on a small scale sample; it uses
interactive data collection methods, i.e. interviews; Flexibility in study design Some aspects of the
study are flexible (for example, the addition, exclusion or wording of particular interviews
questions), Participant responses affect how and which questions researchers ask next, Study
design is iterative, that is, data collection and research questions are adjusted according to what
is learned it allows new issues and concepts to be explored.
The current study is shaped with using inductive research design. Saunders et al. (2003) noted
that the inductive approach gives the chance to have more explanation of what is going on. This
research process started by exploring and collecting the data from different sources and by using
multiple sources of evidence: research questionnaires and document analysis in an attempt to
develop a best practice model for project management in Rwanda. The secondary sources of data
used in this research, involving: critically reviewing previous research, reports, records and
documents on project implementations, while primary data were collected by interviewing the
Project clients/beneficiaries, Project sponsors, Project managers, and Project team members on
several projects including both the ongoing and closed projects in Rwanda among the three sectors
of the economy i.e. Agriculture, Manufacturing, and service.
3.2.3 Data Needs
Qualitative research like is often associated with inductive research designs in which a range of
data are used from different sources available specifically from project management milieu that were
collected using multiple data collection tools to realize study objectives.
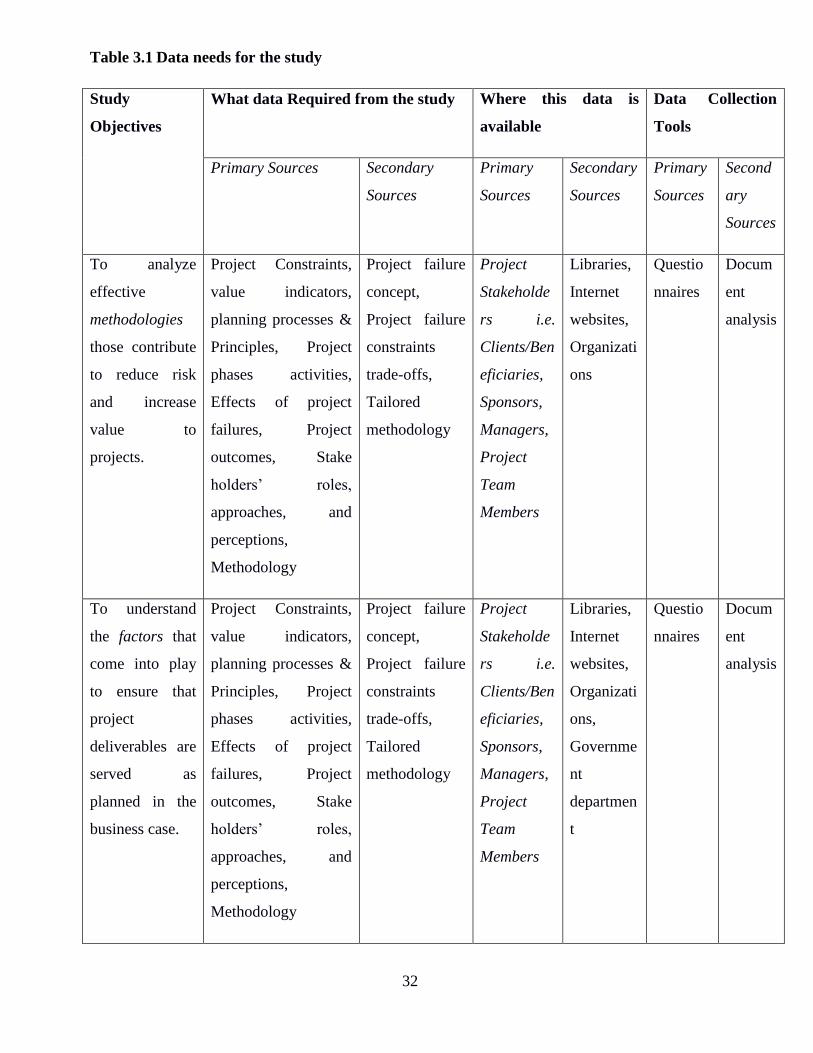
32
Table 3.1 Data needs for the study
Study
Objectives
What data Required from the study Where this data is
available
Data Collection
Tools
Primary Sources Secondary
Sources
Primary
Sources
Secondary
Sources
Primary
Sources
Second
ary
Sources
To analyze
effective
methodologies
those contribute
to reduce risk
and increase
value to
projects.
Project Constraints,
value indicators,
planning processes &
Principles, Project
phases activities,
Effects of project
failures, Project
outcomes, Stake
holders’ roles,
approaches, and
perceptions,
Methodology
Project failure
concept,
Project failure
constraints
trade-offs,
Tailored
methodology
Project
Stakeholde
rs i.e.
Clients/Ben
eficiaries,
Sponsors,
Managers,
Project
Team
Members
Libraries,
Internet
websites,
Organizati
ons
Questio
nnaires
Docum
ent
analysis
To understand
the factors that
come into play
to ensure that
project
deliverables are
served as
planned in the
business case.
Project Constraints,
value indicators,
planning processes &
Principles, Project
phases activities,
Effects of project
failures, Project
outcomes, Stake
holders’ roles,
approaches, and
perceptions,
Methodology
Project failure
concept,
Project failure
constraints
trade-offs,
Tailored
methodology
Project
Stakeholde
rs i.e.
Clients/Ben
eficiaries,
Sponsors,
Managers,
Project
Team
Members
Libraries,
Internet
websites,
Organizati
ons,
Governme
nt
departmen
t
Questio
nnaires
Docum
ent
analysis

33
To identify the
required
decision making
core elements to
be present for
actions as
turnaround
efforts to correct
high project
failure rates and
to make project
work succeed.
Project Constraints,
value indicators,
planning processes &
Principles, Project
phases activities,
Effects of project
failures, Project
outcomes, Stake
holders’ roles,
approaches, and
perceptions,
Methodology
Project failure
concept,
Project failure
constraints
trade-offs,
Tailored
methodology
Project
Stakeholde
rs i.e.
Clients/Ben
eficiaries,
Sponsors,
Managers,
Project
Team
Members
Libraries,
Internet
websites,
Organizati
ons
Questio
nnaires
Docum
ent
analysis
To offer suggestions for improvements to the analyzed prevailing project management environment.
Table 3.1 presents the data needs to realize the study objectives.
3.2.4 Population
This research was undertaken in Rwanda to know reasons why projects fail in response to Dick’s
(2014) research findings, which states that with over 300 organizations in Europe and America
experienced that 70% of projects fail. That failure rate wastes so much money and human
resources that even a small increase in the success rate is worth a lot for some organizations. In
some cases they can’t deliver to a customer o r client profitably. In other cases they can't
deliver new products and services that allow them to successfully compete and these project
failure rates threaten their existence. Therefore, this could be the same case with Rwanda since
projects are becoming the way of the working world, this proven by the total population of project
in Rwanda equal to 1711 in the fiscal year 2014-2015 represented by the data base from Ministry of
Finance and Economic planning, Rwanda Development Bank(BRD), and Rwanda Development
board (RDB).
A study of 30 projects chosen randomly (both ongoing and closed) representing three sectors of
economic analysis in Rwanda i.e. Ten (10) in Agriculture sector , Ten (10) in Manufacturing,
sector, and other Ten (10) in Service sector to investigate in-depth the challenges facing project
management milieu in Rwanda to adopt sustainable solutions. Using such strategy enabled the
researcher to use multiple research methods, including: document analysis. Moreover, to

34
understand the whole aspects of project failure in Rwanda, it was essential to examine the
understanding of different project stakeholders from the three economic sectors and explore the
inter-relationships with their perceptions and the real project management practices supports
project success. Denscombe (1998) reported that the case study approach is characterized by its
ability to focus on relationships and processes, which is of great importance to the current
research. He added that it can be effective in analyzing the complexity of the situation better
than other research strategies. It tends to be holistic rather than dealing with isolated factors.
The main rationale behind selecting the projects from three local institutions i.e. Ministry of
Finance and Economic planning, Rwanda Development Bank(BRD) and Rwanda Development
Board (RDB), as the main focus of the study was attributed to a number of factors, including:
they have the largest number of businesses projects, have the biggest projects in Rwanda and have
obtained the largest project funding compared to other local institutions in addition to funding
granted from the World bank, European Union, United Nations, International Monitory fund to
mention but a few. Table3.2 indicates the summary of study population of projects in Rwanda but
for the detailed data base of projects (see the appendices).
Table 3.2 Projects population in Rwanda for the fiscal year 2014-2015
Economic sectors of analysis in
Rwanda
Service Sector Manufacturing
Sector
Agriculture
Sector
Total
S/no 1259 164 288 1711
Source: Minecofin, BRD, & RDB (DataStream 2014-2015)
Table 3.2 presents a number of projects per their economic sectors of analysis to represent project
population in Rwanda.
3.2.5 Sampling Techniques
Denscombe (1998) stated that sampling frame should be relevant, complete, precise and up-to-date
while (Corbetta, 2003) stated that a non-probability/purposive approach reflects that the chances of
each person to be chosen in the sample is unknown but the features of the population are used as the
main measure for selection. A purposive approach is well-suited to small-scale and in-depth
studies (Ritchie et al., 2003). Particularly when the research questions seek an in-depth
investigation of a small population or when the researcher is performing a preliminary, exploratory

35
study (Schutt, 2006). This research adopted a non probability sampling strategy using random and
purposive techniques which enabled to select and study project cases that would serve the purpose
of the study and answer the research questions. Project cases from each economic sector involved
four main stakeholders. Table 3.3 indicates the list of projects selected randomly (specifically those
projects where the researcher was sure of accessing the information) from their economic sector
categories to be studied but also identifies the types and number of respondents selected using
purposive approach by identifying resourceful or knowledgeable people to the projects and this
particular study the following were project practitioners were identified and targeted to express their
views and beliefs inform of answering questionnaires to answer the objectives of the study.

36
Table 3.3 Selected sample size, categories and numbers of respondents to each project in the sample size.
AGENCY AND PROJECT NAME ECONOMIC SECTOR
PROJECT TOTAL COST
START DATE
END DATE
2014/15 Revised Budget
CATEGORY OF RESPONDENTS PER
PROJECT
NUMBER OF RESPONDE
NTS PER PROJECT
7000 KIGALI CITY 1. Clients/Beneficiaries (1) 2. Project Sponsors (1) 3. Project Managers (1) 4. Team Members (1)
4 02 EARMARKED TRANSFERS
(DISTRICTS)
RWANDA
1 70370142 ROADS INFRASTRUCTURES PROJECT
Service 2,001,132,377 1-Jul-
14 30-Jun-15
2,001,132,377
70370142 ROADS INFRASTRUCTURES PROJECT
Service 121,295,918 1-Jul-
14 30-Jun-15
121,295,918
NETHERLAND Service 273,900,000 273,900,000
70370142 ROADS INFRASTRUCTURES PROJECT
Service 273,900,000 1-Jul-
14 30-Jun-15
273,900,000
6900 GASABO DISTRICT
02 EARMARKED TRANSFERS (DISTRICTS)
1. Clients/Beneficiaries (1)
2. Project Sponsors (1) 3. Project Managers (1) 4. Team Members (1)
4
2 69550104 WATER AND SANITATION INFRASTRUCTURES PROJECT
Service 117,064,429 1-Jul-
14 30-Jun-15
117,064,429
08 EXTERNAL GRANTS
KFW
69550104 WATER AND SANITATION INFRASTRUCTURES PROJECT
Service 103,786,669 1-Jul-
14 30-Jun-15
103,786,669
2304 RWANDA GOVERNANCE BOARD (RGB)
08 EXTERNAL GRANTS 1. Clients/Beneficiaries (1) 2. Project Sponsors (1) 3. Project Managers (1) 4. Team Members (1)
4
UNDP
3
23130211 DEEPENING DEMOCRACY AND ACCOUNTABLE GOVERNANCE PROJECT
Service
2,560,305,000 1-Jul-13
30-Jun-18
275,600,338
2000 MIFOTRA

37
01 DOMESTIC FINANCING
1. Clients/Beneficiaries (1) 2. Project Sponsors (1) 3. Project Managers (1) 4. Team Members (1)
4
RWANDA
4 20060102 IPPPIS PROJECT Service
390,744,370 1-Jul-14
30-Jun-15
390,744,370
08 EXTERNAL GRANTS
SWEDISH INTERNATIONAL DEVELOPMENT AGENCY
1. Clients/Beneficiaries (1)
2. Project Sponsors (1) 3. Project Managers (1) 4. Team Members (1)
4
5 20070115 NEP/SWEDEN Service
8,400,503,780 1-Jul-14
30-Jun-17
2,777,835,752
1804 RWANDA HOUSING AUTHORITY(RHA)
01 DOMESTIC FINANCING 1. Clients/Beneficiaries (1) 2. Project Sponsors (1) 3. Project Managers (1) 4. Team Members (1)
4
RWANDA
6 18150408 REHABILITATION OF MINALOC/MIFOTRA/MININTER BUILDING
Service 1,920,529,961 1-Jul-
14 30-Jun-15
1,920,529,961
7 18150508 SITE DEVELOPMENT OF 1,200 AFFORDABLE HOUSES IN CITY OF KIGALI
Service
2,429,034,723 1-Jul-14
30-Jun-15
2,429,034,723 1. Clients/Beneficiaries (1) 2. Project Sponsors (1) 3. Project Managers (1) 4. Team Members (1)
4
1802 RWANDA TRANSPORT DEVELOPMENTAGENCY (RTDA)
01 DOMESTIC FINANCING 1. Clients/Beneficiaries (1) 2. Project Sponsors (1) 3. Project Managers (1) 4. Team Members (1)
4
RWANDA
8 18120112 ACCESS TO TUMBA COLLEGE
Service 1,567,775,838 1-Jul-
14 30-Jun-15
311,021,368
08 EXTERNAL GRANTS
JAPAN
18120112 ACCESS TO TUMBA COLLEGE
Service
2,956,332,942 7-Aug-13
31-Mar-15
1,702,016,486
1412 WORKFORCE DEVELOPMENT AUTHORITY(WDA)

38
01 DOMESTIC FINANCING
1. Clients/Beneficiaries (1) 2. Project Sponsors (1) 3. Project Managers (1) 4. Team Members (1)
4
RWANDA
9 14220111 HANDS-ON SKILLS AMONG YOUTH OUTSIDE REGULAR EDUCATION SYSTEM
Service 1,165,000,000 1-Jul-
14 30-Jun-15
1,165,000,000
08 EXTERNAL GRANTS
KOREA FUND
14220303 KOCA TRAINING OF TRAINERS PROJECT
Service 3,344,000,000 20-Sep-
13 20-Sep-17
1,022,000,000
10 14220304 SKILLS DEVELOPMENT PROJECT
Service 618,908,580 1-Jul-
14 30-Jun-15
618,908,580 1. Clients/Beneficiaries (1) 2. Project Sponsors (1) 3. Project Managers (1) 4. Team Members (1)
4
09 EXTERNAL LOANS
WORLD BANK
14220304 SKILLS DEVELOPMENT PROJECT
Service 22,080,000,000 29-Apr-
11 31-May-16
3,139,374,589
0900 MINAGRI
01 DOMESTIC FINANCING 1. Clients/Beneficiaries (1) 2. Project Sponsors (1) 3. Project Managers (1) 4. Team Members (1)
4
RWANDA
1 09060505 PROJECT: ONE COW PER FAMILY
Agriculture 1,085,000,000 1-Jul-
14 30-Jun-15
1,085,000,000
2 09060301 PROJECT: AGRICULTURAL MECHANISATION PROGRAMME
Agriculture
200,000,000 1-Jul-14
30-Jun-15
200,000,000 1. Clients/Beneficiaries (1) 2. Project Sponsors (1) 3. Project Managers (1) 4. Team Members (1)
4
3 09060401 PROJECT: PRIORITY CROPS INTENSIFICATION (INCLUDING FERTILIZER IMPORTS)
Agriculture
9,366,745,012 1-Jul-14
30-Jun-15
8,366,745,012 1. Clients/Beneficiaries (1) 2. Project Sponsors (1) 3. Project Managers (1) 4. Team Members (1)
4
4 09060514 GAKO BEEF FARM Agriculture 918,056,505 1-Jul-14
30-Jun-15
918,056,505 1. Clients/Beneficiaries (1) 2. Project Sponsors (1) 3. Project Managers (1) 4. Team Members (1)
4

39
5 09070303 SUPPORT TO STRATEGIC PLAN FOR AGRICULTURE TRANSFORMATION II (SPAT II)
Agriculture 216,941,567 1-Jul-
11 30-Jun-16
216,941,567 1. Clients/Beneficiaries (1) 2. Project Sponsors (1) 3. Project Managers (1) 4. Team Members (1)
4
08 EXTERNAL GRANTS
BELGIUM
09070303 SUPPORT TO STRATEGIC PLAN FOR AGRICULTURE TRANSFORMATION II (SPAT II)
Agriculture 16,872,456,600 1-Jul-
11 30-Jun-16
2,384,418,589
08 EXTERNAL GRANTS
INTERNATIONAL FUND FOR AGRICULTURAL DEVELOPMENT IFAD FIDA
1. Clients/Beneficiaries (1)
2. Project Sponsors (1) 3. Project Managers (1) 4. Team Members (1)
4
6 09070305 POST HARVEST AND AGRIBUSINESS SUPPORT PROJECT(PASP)
Agriculture 9,267,841,860 28-
Mar-14 31-Mar-19
2,761,105,109
0902 NATIONAL AGRICULTURAL EXPORT DEVELOPMENT BOARD (NAEB)
01 DOMESTIC FINANCING 1. Clients/Beneficiaries (1) 2. Project Sponsors (1) 3. Project Managers (1) 4. Team Members (1)
4
RWANDA
7 09080309 DEVELOPMENT OF NEW AGRICULTURE EXPORT CHAIN
Agriculture 127,440 1-Jul-
14 30-Jun-15
127,440
8
09080310 NAEB TEA EXPANSION Agriculture
1,500,000,000 1-Jul-14
30-Jun-15
1,500,000,000 1. Clients/Beneficiaries (1) 2. Project Sponsors (1) 3. Project Managers (1) 4. Team Members (1)
4
9
09080901 KIGALI WHOLESALES MARKET
Agriculture
141,867,824 1-Jul-14
30-Jun-15
141,867,824 1. Clients/Beneficiaries (1) 2. Project Sponsors (1) 3. Project Managers (1) 4. Team Members (1)
4
10 09080302 PROJECT: COMMODITY CHAIN PROGRAMME (HORTICULTURE INTENSIFICATION AND QUALITY MANAGEMENT)
Agriculture
351,405,912 1-Jul-14
30-Jun-15
351,405,912 1. Clients/Beneficiaries (1) 2. Project Sponsors (1) 3. Project Managers (1) 4. Team Members (1)
4
1807 WATER AND SANITATION CORPORATION (WASAC)

40
08 EXTERNAL GRANTS 1. Clients/Beneficiaries (1) 2. Project Sponsors (1) 3. Project Managers (1) 4. Team Members (1)
4
OTHER NGO - NON GOVERNMENT ORGANISATIONS
1 18140112 OPTIMIZED PRODUCTION OF NYABARONGO GROUND WATER TREATMENT PLANT
Manufacturing
20,000,000 1-Jul-14
30-Jun-15
20,000,000
OPEC FUND FOR INTERNATIONAL DEVELOPMENT
1. Clients/Beneficiaries (1)
2. Project Sponsors (1) 3. Project Managers (1) 4. Team Members (1)
4
2 18140184 IMPROVEMENT OF URBAN WATER SUPPLY
Manufacturing 1,079,213,700 1-Jul-
14 30-Jun-15
1,115,313,700
3 18140185 KIGALI BULK WATER SUPPLY
Manufacturing
83,000,000 1-Jul-14
30-Jun-15
82,461,386 1. Clients/Beneficiaries (1) 2. Project Sponsors (1) 3. Project Managers (1) 4. Team Members (1)
4
1806 ENERGY DEVELOPMENT CORPORATION (EDCL)

41
01 DOMESTIC FINANCING 1. Clients/Beneficiaries (1) 2. Project Sponsors (1) 3. Project Managers (1) 4. Team Members (1)
4 4 18130220 IMPROVING ACCESS TO
RELIABLE ON-GRID ELECTRICITY SERVICES FOR HOUSEHOLDS AND PRIORITY PUBLIC INSTITUTIONS - BELGIAN CONTRIBUTION TO EARP
Manufacturing
1,456,063,475 1-Jul-14
30-Jun-15
79,564,730
08 EXTERNAL GRANTS
BELGIAN TECHNICAL COOPERATION - BTC
18130220 IMPROVING ACCESS TO RELIABLE ON-GRID ELECTRICITY SERVICES FOR HOUSEHOLDS AND PRIORITY PUBLIC INSTITUTIONS - BELGIAN CONTRIBUTION TO EARP
Manufacturing
14,174,716,485 19-Dec-
07
18-Dec-
14 193,073,601
01 DOMESTIC FINANCING
5 18130222 400KV STANDARDIZATION LINE FOR KENYA-UGANDA -RWANDA INTERCONNECTION PROJECT
Manufacturing
475,700,000 1-Jul-14
30-Jun-15
475,700,000 1. Clients/Beneficiaries (1) 2. Project Sponsors (1) 3. Project Managers (1) 4. Team Members (1)
4
0108 RWANDA DEVELOPMENT BOARD (RDB)
09 EXTERNAL LOANS 1. Clients/Beneficiaries (1) 2. Project Sponsors (1) 3. Project Managers (1) 4. Team Members (1)
4
OPEC FUND FOR INTERNATIONAL DEVELOPMENT
6 01150103 AGRO-PROCESSING PARKS DEVELOPMENT
Manufacturing 173,000,000 1-Jul-
14 30-Jun-15
151,000,000
7 01150202 MANUFACTURING GROWTH PROJECT
Manufacturing
1,284,700,000 1-Jul-14
30-Jun-15
1,258,053,583 1. Clients/Beneficiaries (1) 2. Project Sponsors (1) 3. Project Managers (1) 4. Team Members (1)
4
1806 ENERGY DEVELOPMENT CORPORATION (EDCL)
8 18130113 RUKARARA I Manufacturing
555,362,767 1-Jul-14
30-Jun-15
555,362,767 1. Clients/Beneficiaries (1) 2. Project Sponsors (1) 3. Project Managers (1)
4

42
4. Team Members (1)
9
18130114 6 MICRO HYDRO POWER Manufacturing
641,249,049 1-Jul-14
30-Jun-15
641,249,049 1. Clients/Beneficiaries (1) 2. Project Sponsors (1) 3. Project Managers (1) 4. Team Members (1)
4
10
18130120 KIVUWATT Manufacturing
1,800,832,028 1-Jul-14
30-Jun-15
1,800,832,028 1. Clients/Beneficiaries (1) 2. Project Sponsors (1) 3. Project Managers (1) 4. Team Members (1)
4
Total 30*4= 120
Source: Minecofin, BRD, & RDB (DataStream 2014-2015)

43
With the purposive sampling the researcher has to use personal judgment to select cases that will
best meet the research questions and objectives (Saunders et al., 2003). Rubin and Rubin (1995)
named three main guidelines for selecting a purposive sample. The researcher should select the
informants who are knowledgeable about the issues being investigated, willing to talk and
representative of the range of points of view. As Schutt (2006) asserted about purposive
sampling: Each sample element is selected for a purpose, usually because of the unique position
of the sample elements. Purposive sampling may involve studying the entire population of some
limited group or a subset of a population (mid-level managers with a reputation for efficiency). Or a
purposive sample may be a “key informant survey”, which targets individuals who are particularly
knowledgeable about the issues under investigation. For the current study, particular project
stakeholders knowledgeable with reputation for efficiency about the issues under investigation among
project clients, sponsors, managers, and team members on the project were identified to participate
in the research, this was done consistently on each project in the sample size as addressed by
Glancey and Pettigrew (1997), Main et al. (1997) and Baker et al. (2000). Also, this gave the
opportunity to all economic sectors to be involved in the research boundary and get benefit from the
current study in relation to managing projects effectively and at the same time helping in awareness
of the project failure effects and improving on projects value measures. Participants were also selected
as those who had experienced the phenomenon being investigated, willing to cooperate and were able
to communicate their experiences without any bias and embarrassment.
Respondents were contacted using two different means: First, a written letter was printed and
submitted with a copy of received note to the institutions and project sites giving a brief introduction
about the researcher (i.e. name and university, research moderator), describing the aim of the
research, showing the importance of the study to the project management milieu, detaining the integrity
of the researcher about the confidentiality of the requested data and finally asking for the authorized
permission for data collection and to take part in the case study (see Appendix). The letter was printed
and authorized with the researcher’s signature. Second, within 24 hours of receiving the letters of
acceptance telephone contact arrangements were done with the persons who were to participate for
secondary data preparations and research questionnaires filling as per the convenience of respondents.
All the institutions and projects I contacted they allowed but, unfortunately, not all respondents
returned the questionnaires out of 120 issues only 85 represented 70.8% of the targeted population
were returned others were unable perhaps some were not interested in helping my research others did

44
not have time to fill them, all the required total population of projects in Rwanda were obtained as
panned and that was 100% population received.
3.2.6 Sampling Methods and techniques
Crotty (1998) defined research methods as: “The techniques or procedures used to gather and analyze
data related to some research questions or hypothesises”. (Easterby-Smith, 2002) and (Gray, 2004)
indicated that qualitative research is often associated with inductive research designs in which a range
of methods are used to collect the data and explore the problem. For the secondary data of this research
document analysis was used method of data collection. A document is any substance that gives
information about the investigated phenomenon and exists independently of the researcher’s actions.
It is normally produced for specific purposes other than those of the research but it can be used by the
researcher for cognitive purposes, e.g. letters, newspapers, diaries and websites. (Corbetta, 2003).
Yin (2003:87) asserted that “For case studies, the most important use of documents is to corroborate
and augment evidence from other sources”. Corbetta (2003) identified a number of advantages of the
documents over other research methods. (a) It is a non-reactive technique where the information
given in a document is not subject to a possible distortion as a result of the interaction between the
researcher and the respondent, e.g. as in interviews; (b) it helps the researcher to study the past; (c) it
is a cost-effective method as the information has already been produced (Denscombe, 1998).
However, documents may have some limitations in terms of the accuracy and completeness of the
data (Patton, 2002).
In this study, a number of documents were critically analyzed, including: the journal articles, books,
newspapers, the website of project management institute; the website of the larger waste companies
which took part in the study. Such documents were of great value to examine the study and enrich
the researcher’s knowledge about the strategies and actions to fix project failures, and before
planning for research instruments for collecting the primary data. This method enabled researcher to
highlight and pursue any contradiction in the evidence emerging as a result of the inconsistencies
between the data cleared in the documents and the questionnaires with the associated stakeholders.
Ministry of finance and economic planning don’t publish relevant information on its website yet in the
data base they have good information regarding public projects in Rwanda.
Research instruments: Annum (2016) defines them as “fact finding strategies”. They are the tools for
data collection. They include Questionnaire, Interview, Observation and Reading. Essentially the
researcher must ensure that the instrument chosen is valid and reliable. The validity and reliability of

45
any research project depends to a large extent on the appropriateness of the instruments. Whatever
procedure one uses to collect data, it must be critically examined to check the extent to which it is
likely to give you the expected results.
For this research questionnaire was used to collect primary data. This is a data collection instrument
mostly used in normative surveys. It is a systematically prepared form or document with a set of
questions deliberately designed to elicit responses from respondents or research informants for the
purpose of collecting data or information. It is a form of inquiry document, which contains a
systematically compiled and well organized series of questions intended to elicit the information
which will provide insight into the nature of the problem under study. It is a form that contains a set of
questions on a topic or group of topics designed to be answered by the respondent. The respondents
are the population samples of the study. The answers provided by the respondents constitute the data
for the research.
3.3 DATA ANALYSIS AND INTERPRETATION
Hatch (2002) Stated “Data analysis is a systematic search for meaning. It is a way to process
qualitative data so that what has been learned can be communicated to others. Analysis means
organizing and interrogating data in ways that allow researchers to see patterns, identify themes,
discover relationships, develop explanations, make interpretations, mount critiques, or generate
theories. It often involves synthesis, evaluation, interpretation, categorization, hypothesizing,
comparison, and pattern finding”. (Gray, 2004) identified two main approaches for analyzing
qualitative data: content analysis and grounded theory. The former method attempts to identify
specific categories and criteria of selection before the analysis process starts, while in the second
method (grounded theory), no criteria are prepared in advance. All the measures and themes come out
during the process of data collection and analysis. Hence, it can be recognized that grounded theory
is an inductive approach and content analysis is more deductive. (Strauss and Corbin, 1998) defined
grounded theory as a theory that is discovered, developed and provisionally verified through
systematic data collection and analysis of data pertaining to that phenomenon. Analysis of data
using grounded theory technique involves three stages: Open coding, in which the data is
categorized into units; Axial coding, in which the relationships between categories are identified and
finally selective coding, where the core categories are integrated to produce a theory (Strauss
and Corbin, 1998). In regards to this current study, the data obtained was processed and analyzed
using SPSS software an instrument which yielded from the grounded theory approach. The table
below shows ways in which the data was collected and analyzed for study objectives;

46
Table 3.4 Types of data and data analysis tools
S/no Types of Data Data Analysis tools
01 Primary (Data collected by the
researcher himself for the thesis
purpose)
Coding/Constant Comparison Analysis: To perform a
constant comparison analysis, the researcher first reads
through the entire set of data (this also could be a subset of
the data). After doing so, the researcher portions the data
into smaller meaningful parts. Then, the researcher labels
each portions with a descriptive title or a “code.” The
researcher takes pains to compare each new chunk of
data with previous codes, so similar chunks will be labeled
with the same code. After all the data have been coded,
the codes are grouped by similarity, and a theme is
identified and documented based on each grouping.
02 Secondary (Data collected by
someone else for some other
purpose but being utilized by
the researcher for another thesis
purpose)
Document analysis
Source: (Stokes, 2000).
The analysis process started with specific coding procedures used to process the data include –
Creation of appropriate codes for open end questions and close end questions, create file structures-
enter variables, perform data cleaning-Data transformation involve recoding variables, compute
variables-data manipulation-data analysis. Data analysis tools such as frequency mean, tables’ multiple
response sets, and descriptive statistics were used. Afterwards, the researcher critically analyzed the
responses of the formed categories with the aim of finding out the actual meaning of the data. The
themes used in the result chapters had been emerged from the questions posed and the analysis
process.

47
3.4 VALIDITY, RELIABILITY, TRIANGULATION AND GENERALIZATION
Validity: (Hammersley,1987) asserted that “an account is valid or true if it represents accurately those
features of the phenomena, that it is intended to describe, explain or theorize”. Insofar, validity is
concerned with two main issues: whether the instruments used for measurement are accurate and
whether they are actually measuring what they want to measure (Winter, 2000). (Ritchie and Lewis,
2003) indicated that the validity of research is conceived as the precision or correctness of the research
finding. (Arksey and Knight, 1999) and Winter (2000) identified two different dimensions to the
concept of validity, namely internal and external validity. Internal validity ensures that the researcher
investigates what he claims to be investigating. External validity concerned with the extent to which
the research findings can be generalized to wider population (discussed in table 3.3). Denscombe
(1998) added that the use of multi-methods for examining one issue confirms the findings of the
research and increases the validity of the data. In terms of this research, validity was achieved by
undertaking multiple methods to investigate the problem from different stakeholders and strengthen
the validity of the findings and increase the probability of generalization. Moreover, the questionnaire
was tailored to the phenomena being investigated i.e. all the questions were directly linked to the
research’s aim and objectives and covered all aspects of the topic. Data was also set down and
analyzed with a very high degree of accuracy. Finally, all secondary sources of data used were initially
assessed to determine the validity of the information given.
Reliability: Reliability is known as to what extent the research findings can be replicated, if another
study is undertaken using the same research methods (Ritchie and Lewis, 2003). They asserted that
“the reliability of the findings depends on the likely recurrence of the original data and the way they
are interpreted”. Marshall and Rossman (1999) and Seale (1999) argued that the absolute
replication of qualitative studies is very difficult to achieve since they reflect realities at the time
they were collected and in a situation which is likely to change. It is often referred to as an unrealistic
demand. Phenomenological research may be difficult to repeat because it depends generally on
unstructured data collection methods (Gray, 2004). Instead, a good practice of reliability can be
enhanced through an aspect of reflexivity, which is “showing the audience of research studies as
much as possible of the procedures that have led to a particular set of conclusions” (Seale, 1999).
A number of measures were undertaken to enhance the reliability of the current research, including:
all written down in a questionnaire to present more reliable evidence and avoid any bias which might
happen if the researcher attempted to what was being investigated. Also, all the questions were

48
worded-written clearly. If there was any misunderstanding the question respondents would request for
any clear explanations in order to enable the interviewee understand what s/he was asked for?
Moreover, all interviewees were given the opportunity to explain their own beliefs and thoughts freely
in terms of added comments in the questionnaire without any intervention either with comments or
gestures, which would create bias in the interviewee’s response to the question being asked. It is
recognized that the conditions surrounded the research might be different when replicating the
current study but in an attempt to help others understand the various decisions and processes adopted
along the research journey and increase the probability of replicating the present study, all decisions
and procedures were set clearly. The study provides detailed information about the aim and
objectives of the research, how the study was undertaken and the justifications of the adopted research
strategy and methods.
Triangulation: Triangulation is a strategy that can be used to strengthen the confidence of the
research findings (Arksey and Knight, 1999). ( Decrop, 1999) indicated that triangulation can
reduce and/or eliminate personal and methodological biases and increase the probability of
generalizing the findings of a study as the data is gathered from different angles and by different
methods. (Easterby-Smith, 1991) referred to data triangulation as the process of collecting data over
different times or by using multiple methods. Decrop (1999) asserted that “using multiple methods
pave the way for more credible and dependable information”. Denzin (1970) identified multiple
triangulations that can be used in the same investigation, these include: (1) Methodological
triangulation – the use of multiple methods to collect data. (2) Data triangulation – the use of a
variety of data sources in a study in terms of person, time and space. (3) Investigator triangulation –
whereby multiple researchers are employed to investigate the problem. (4) Theoretical triangulation –
the approaching of the research with varied perspectives and hypothesis.
In respect of this research, data and methodological triangulations were accomplished through
collecting the data from different sources and by using multiple methods, including: questionnaire
and document analysis. The use of multiple methods assisted in data triangulation and at the same
time was an effective way to overcome most of the weaknesses of each method used (Gray, 2004).
Generalization: Generalization can be defined as “the assertions of enduring value that are context-
free” (Lincoln and Guba, 1985). For qualitative researchers, generalizability can be perceived as the
“fit” between the cases studied and the other situations to the extent that make it possible to generalize
the findings of the research (Schofield, 1994). (Ritchie and Lewis, 2003) named this type of
generalization as ‘representational’. It can be assessed based on two main issues: firstly, the precision
49
of interpreting and capturing the phenomenon, i.e. quality of field work, analysis and interpretation.
Secondly, the extent to which the sample studied is representative to the original population. (Kalof,
2008) added two ways to achieve the generalizability of the research findings: clear description of the
sample selection criteria and rich description of the research site. Both tactics are used in the current
study where a thick description of sampling procedures and selection criteria are provided. This
chapter also provided detailed information about the research site in terms of the procedures
undertaken to achieve the aim and objectives of the research, the research methods used along with the
data analysis techniques.
3.5 RESEARCH LIMITATIONS AND DELIMITATIONS
Several issues are worked against the achievement of results as planned hence weaknesses in the study
since they confound the results. Examples of limitations include: few number of respondents who did
not return questionnaires, and interjection emanating from others issues to be handled by the
researcher within the period of research especially issues related to work, this interfered with research
at some occasions. Acknowledging limitations doesn't necessarily affect the validity of research paper.
Instead, it acts as a way to identify areas for further research and study. Research delimitation is that,
this research is limited to causes of project failure and proposed solutions to the phenomena it did not
go dig out the resultant effects of project failure on either sides the i.e. customer and supplier. It just
assumed that both are project failure victims.

50
CONCLUSION
This chapter has detailed the thesis’s theoretical and practical approach and rationalizes the different
decisions and processes undertaken throughout the research journey. A qualitative approach are used
to reach the overall aim and objectives of the study as it is characterized by its ability to provide a
deeper understanding of the phenomenon being investigated. Using case study research strategy
enabled the researcher to explore project management practices in from different economic sector and
by using multiple sources of evidence, including: questionnaires and document analysis. Data
obtained throughout were analyzed using the instruments a method which yielded from the grounded
theory approach. The chapter finally looks at the validity, reliability and triangulation issues. The next
chapter presents and discusses the results obtained from the case study.
With the purposive sampling the researcher has to use personal judgment to select cases that will
best meet the research questions and objectives (Saunders et al., 2003). Rubin and Rubin (1995)
named three main guidelines for selecting a purposive sample. The researcher should select the
informants who are knowledgeable about the issues being investigated, willing to talk and
representative of the range of points of view. As Schutt (2006) asserted about purposive
sampling: Each sample element is selected for a purpose, usually because of the unique position
of the sample elements. Purposive sampling may involve studying the entire population of some
limited group or a subset of a population (mid-level managers with a reputation for efficiency). Or a
purposive sample may be a “key informant survey”, which targets individuals who are particularly
knowledgeable about the issues under investigation. For the current study, particular project
stakeholders knowledgeable with reputation for efficiency about the issues under investigation among
project clients, sponsors, managers, and team members on the project were identified to participate
in the research, this was done consistently on each project in the sample size as addressed by
Glancey and Pettigrew (1997), Main et al. (1997) and Baker et al. (2000). Also, this gave the
opportunity to all economic sectors to be involved in the research boundary and get benefit from the
current study in relation to managing projects effectively and at the same time helping in awareness
of the project failure effects and improving on projects value measures. Participants were also selected
as those who had experienced the phenomenon being investigated, willing to cooperate and were able
to communicate their experiences without any bias and embarrassment.
Respondents were contacted using two different means: First, a written letter was printed and
submitted with a copy of received note to the institutions and project sites giving a brief introduction
about the researcher (i.e. name and university, research moderator), describing the aim of the

51
research, showing the importance of the study to the project management milieu, detaining the integrity
of the researcher about the confidentiality of the requested data and finally asking for the authorized
permission for data collection and to take part in the case study (see Appendix 1). The letter was
printed and authorized with the researcher’s signature. Second, within 24 hours of receiving the
letters of acceptance telephone contact arrangements were done with the persons who were to
participate for secondary data preparations and research questionnaires filling as per the convenience
of respondents. All the institutions and projects were contacted reacted positively but, unfortunately,
not all respondents returned the questionnaires out of 120 issues only 85 represented 70.8% of the
targeted sample.

52
CHAPTER 4
DATA ANALYSIS AND INTERPRETATION
4.1 INTRODUCTION
This chapter presents the tables of research findings, data interpretation, and data analysis. The
purpose of this study was to address the causes of project failure then analyzes to determine when –
and why – a project has failed. The objectives of the study were to; Analyze effective methodologies
those contribute to reduce risk and increase value to projects, Understand the factors that come into
play to ensure that project deliverables are served as planned in the business case, Identify the
required decision making core elements or basic efforts turned to actions to correct high project
failure rates, Offer suggestions for improvements to the analyzed prevailing project management
environment. These objectives were accomplished. The findings presented in this chapter
demonstrate the potential for merging theory and practice.
4.2 PROFILE OF PROJECTS SELECTED FOR STUDY
To make this research possible 30 projects were selected from three economic sectors, 10 were
selected manufacturing sector, 10 from service sector, and 10 from agriculture, out of this sample size
7 are ongoing projects while 23 are closed projects, in nutshell they have one overriding objective
which to “increase value to their respective organizations in terms competitive advantage and enhance
profits” as fundamental reason for their pursuit of investment. 12 of them attached the international
funding inform of grants, and loans due to their globalization nature of interests, and massive fund
required to have the projects done. Other are even cross boarder projects for instance 1813222 400KV
standardization line for Kenya-Uganda-Rwanda interconnection project.

53
4.3 PRIMARY DATA ANALYSIS
This chapter discusses the data analysis and findings and analysis derived from 85 questionnaires
completed from the targeted 120 potential respondents these included Client/Beneficiaries, Project
sponsors, Project managers, and Project team members, which constitutes a 70.8% response rate for
the survey. Out of 85 respondents, 96.4% have completed all of the questions that were required to be
answered and 3.62% have not attempted to answer some of the questions. The responses gathered
from the survey have been analyzed using the SPSS software version 21. This chapter solely focuses
on presenting the gathered data in a meaningful way to facilitate the discussion, The findings are
discussed according to the questions on project deliverables and project methodology of the
questionnaire and then with reference to the five variables. The questions on project deliverables and
the methodology used of the questionnaire were: Actions to correct project failure, Project value
indicators, Activities involved at project work, Project principles focus, Roles of different stakeholders
at the project, and Project management methodology. Other research findings were used to increase
the validity and contextualize findings. Variables affecting the likelihood of phenomena under
investigation were used to summarize the findings (Onega 2001).
It is urged conventionally that at the very beginning of a project; organizations, vendors and project
managers should spend adequate time defining variables to establish the overall success/ failures
(Brian K, 2005).
To illustrate how these variables play their part in reflecting holistic project success/failure one has to
consider their effects: Late project delivery delays the start of realizing business benefits, Over
budget delivery reduces the net benefits realized, Reducing the scope reduces the value- adding
functionality delivered and poor quality, reduces the delivered service’s ability to generate business
value (Sacks, and Partouche, 2010). Against this background the respondents were asked to reflect on
the activities involved in project. The results are presented in table 4.1.

54
Table 4.1 Respondents’ views on activities involved at project work.
Activities involved at project work? N Mean
Planning as an activity that is involved at any stages of project work 85 4.7765
Assessing project risk as an activity that is involved at any stages of project work 84 4.3214
Estimating resources required to accomplish the project work as an activity that is involved
at any stages of project work
85 4.8000
Organizing the project work as an activity that is involved at any stages of project work 85 4.7412
Acquiring project human and material resources as an activity that is involved at any
stages of project work
85 4.4000
Assigning project tasks as an activity that is involved at any stages of project work 85 4.5412
Directing project activities as an activity that is involved at any stages of project work 84 4.4881
Controlling project execution as an activity that is involved at any stages of project work 85 4.6353
Reporting project progress as an activity that is involved at any stages of project work 85 4.7529
analyzing the project results as an activity that is involved at any stages of project work 85 4.4588
Source: Primary Data
Table 4.1 shows that the average mean is 4.59154 which is a positive extreme. This result is an
indicator that most of the respondents’ views agree and strongly agree that these are project processes
activities that must be undergone through at any stages of project by stakeholders should expect from
any business project in general perspective. It is in agreement with Dick Billows (2014) typology of
projects’ elements. He urged that the first rule is a commitment by the organization to manage
everyone's project workload and prevent excessive levels of project work. As an example, the
organization's project protocol might specify that: first level supervisors (whom everyone wants on
their project team) can be assigned no more than12 hours of project work each week. The organization
must also track people's assignments and clearly communicate to them which projects they should
work on each week. That's based on the organization's priority decisions and it's far better than having
project team members decide which projects to work on first, based on who's yelling the loudest.
Organizations that consistently succeed with projects perform well at every level in the project
management process. They control the initiation of projects as well as the planning, approving,
prioritizing and monitoring of projects based on the business value those projects produce. They
manage the pool of project resources just as they manage their capital budgets, allocating people's
time and money to projects based on the payback. They follow a consistent methodology for all

55
projects, holding people accountable for playing their role correctly shall result in expected
deliverables.
Project deliverables: The views of respondents on project deliverables are presented in table 4.2.
Table 4.2 Respondents’ views on project deliverables.
Projects deliverables N Mean
Scope as a project deliverable 85 4.5176
Time as a project deliverable 85 4.4353
Cost as a project deliverable 85 5.1059
Quality as a project deliverable 85 4.3647
Risk as a project deliverable 85 4.5059
Source: Primary Data
According to table 4.2 the average mean is 4.58588 which is a positive extreme. This result is an
indicator that most of the respondents’ views agree and strongly agree that these variables are the
desired deliverables to any project measured to realize full benefits as promised in the project business
case. A project is successful when it produces the desired results within a budget, quality, scope, risk,
and time. The respondents have indicated a higher level positive concern to project deliverables. If any
of these is missing then the project is a failure. Project management is both supply-side’ internally
focused (basically, deliver what was in the agreed functional specification, on the date agreed and at
the cost agreed); and demand-side’ externally focused (basically, deliver what the customer actually
needs and realize the desired project outcomes, in terms of business benefits, beginning on the date
agreed and at the cost agreed. in this way it seeks to maximize the business value of project
investments and this “value” is realized in terms of both financial and strategic benefits reflected on in
table 4.3.
Project “Value” Indicators: The rating of project value indicators by the respondents are prescribed in
the table 4.3. It is meaningful to evaluate what project managers value in project activities and
deliverables.

56
Table 4.3 Respondents’ views on project “value” indicators.
Projects’ “value” indicators N Mean
Reductions in existing cost an indicator of business projects’ “value”. 84 3.9048
Reductions in other business cost an indicator of business projects’ “value”. 84 3.8095
Savings from reduced business investment an indicator of business projects’
“value"
84 3.0238
Additional business revenue an indicator of business projects’ “value" 84 4.0357
Improved cash flow an indicator of business projects’ “value" 84 4.2619
Business revenue reductions avoided an indicator of business projects’ “value" 82 3.9512
Business cost increases avoided an indicator of business projects’ “value" 83 3.9880
Competitive advantage gained e.g. improving the company’s image an indicator
of business projects’ “value"
84 4.6429
Increasing customer or retailer switching costs an indicator of business projects’
“value"
84 4.3810
Increasing supplier leverage an indicator of business projects’ “value" 84 3.8690
Facilitating business collaborations an indicator of business projects’ “value" 84 4.2143
Introducing new products/services an indicator of business projects’ “value" 84 4.5476
Changing business competition from being cost based to being based on
sustainable differentiation or establishing new product distribution channels
competitive response an indicator of business projects’ “value"
83 4.3253
Source: Primary data
Table 4.3 average mean of responses is 4.073462 which is a positive extreme. This result is an
indicator that most of the respondents’ views agree and strongly agree that these are real indicators of
“value” project stakeholders expect from any business project. Strategic benefits rank the highest in
the table with “competitive advantage gained” as the top scorer value with 4.6429 followed by
“introducing new products” with 4.5476, Increasing customer or retailer switching costs 4.3810,
Changing business competition from being cost based to being based on sustainable differentiation or
establishing new product distribution channels competitive response 4.3253 all the fist four are
strategic followed by financial value “Improved cash flow” with 4.2619 and the least score is “Savings
from reduced business investment” with 3.0238. To sum it all the result here indicate that projects
should be managed on a reasonably formal ‘objective’ Supply-side basically, deliver what was in the

57
agreed functional specification, on the date agreed and at the cost agreed; and demand-side basically,
deliver what the customer actually needs and realize the desired project outcomes, in terms of business
benefits, beginning on the date agreed and at the cost agreed (if these last two are critically important);
in this way it seeks to maximize the business value of project investments.
Project is founded on the principle that in order to get the best outcome for the project, organizations
need to focus their limited time and energy on avoiding or mitigating the most common causes of
project failure, where project failure is defined as failing to fully realize the promised business
benefits. The result is focusing on 8 principles as drivers of Project Success that were reflected on by
the respondents in the data findings presented below;
Projects’ focus: The rating of Projects’ focus by the respondents is prescribed in the table 4.4. It is
meaningful to critically evaluate what projects focus on throughout different project phases.
Table 4.4 Respondents’ views on projects’ focus.
Projects’ focus principles N Mean
Building commercially optimal portfolio of projects during development and
sustaining the value of that portfolio as a principle focused on projects
84 3.8929
Balance of business demand and supply through categorization, evaluation,
acceptance, rejection and prioritization of ‘Work Change Requests’ as a principle
focused on projects
85 3.7059
Formal, ‘objective’ process by which work is managed into the supplier,
understanding the true costs, true business benefits and the true risks of failing to
deliver and realize those benefits as a principle focused on projects
85 4.0941
If the Business Case won’t stand up to true commercial scrutiny at the start of the
project, no need to start it, certainly won’t stand up to this scrutiny by the end as a
principle focused on projects
85 4.0000
Source: Primary Data
According to table 4.4 the average mean is 3.923225 a score which is a positive extreme. This result is
an indicator that most of the respondents’ views agree and strongly agree that project managers should
focus on “right project” i.e. project demand is managed through balancing of business demand and
supply through the categorization, evaluation, acceptance, deferral/rejection and prioritization of
‘Work/Service/Change Requests’ based on cost, value and risk criteria, such that work is managed into

58
the supplier, understanding the true costs, true business benefits and the true risks of failing to deliver
and realize those benefits.
Project incentives’ focus: The views of respondents on Project incentives’ focus on project are
prescribed in the table 4.5.
Table 4.5 Respondents’ views on incentives’ focus on projects’.
Project Incentives’ focus principles N Mean
Project managers and staff set productive utilization targets, their remuneration being
partially driven by achievement of those targets but largely driven by the extent to
which their projects go on to actually realize their promised benefits as a principle
focused on incentives.
85 3.2706
Project managers and staff agree realistic costs and benefits in the business case and
focus their energies on sustaining the value of the project during development, not just
delivering it to budget and schedule targets as a principle focused on incentives.
85 4.1647
Source: Primary Data
According to table 4.5 the average mean is 3.71765 a score which is a positive extreme. This result
is an indicator that most of the respondents’ views agree and strongly agree that any projects’
incentives should largely be driven by the extent to which projects go on to actually realize
their promised benefits; in this way project managers and their staff they are incentivized to
agree realistic costs and benefits in the business case.
Customer/supplier relationships’ focus: The views of respondents on Customer/supplier
relationships’ focus on project are prescribed in the table 4.6.
Table 4.6 Respondents’ views on customer/supplier relationships’ focus on projects.
Customer/supplier relationships’ focus principles N Mean
Supplier and the business he supports entering into a pseudo-commercial relationship, with
shared risk and reward to seek a commercially optimal outcome from projects as a Principle
focused on customer/supplier relationship
84 3.5000
Project Sponsor becomes truly accountable for both the project costs incurred and the realization
of the benefits as a Principle focused on customer/supplier relationship
84 3.3571
Not so fixated on delivering the project to budget and schedule that it neglects the real goal of
delivering the promised benefits as a Principle focused on customer/supplier relationship
84 3.5952
Source: Primary Data

59
Table 4.6 shows an average mean of 3.4841 a score which is a positive extreme. This result is an
indicator that most of the respondents’ views agree and strongly agree that Projects are founded in
order to get the best outcome from the perspective of the customer. Project managers focus their
limited time and energy on avoiding or mitigating the most common causes of project failure, where
project failure is defined as failing to fully realize the promised business benefits. Dick (2014) Site an
example that IT Function is not so fixated on delivering the project to budget and schedule that it
neglects the real goal, viz. delivering the promised benefits; and the Project Sponsor becomes truly
accountable for both the project costs incurred and the realization of the benefits. Additionally, this
incentivizes the Project Sponsor to agree realistic costs and benefits in the business case.
Planning’ focus: The rating of planning’ focus by the respondents is prescribed in the table 4.7. It
is meaningful to critically evaluate what planning focus on throughout different project phases.
Table 4.7 Respondents’ views on planning’ focus on projects.
Planning of projects’ focus principles N Mean
Project work based on the key milestones that will deliver business value (as
opposed to inputs, tasks/activities and outputs) as a principle focused on planning
84 4.0476
What has to be achieved irrespective of how you are going to achieve it; the how
is addressed in the lower level task/activity plans to ensure that the ‘Big Picture’
(i.e. delivering the benefits) is not lost as a principle focused on planning
85 3.7765
Source: Primary Data
According to table 4.7 the average mean is 3.91205 a score which is a positive extreme. This result is
an indicator that most of the respondents’ views agree and strongly agree that Projects are founded on
the principle of “right planning”. Dick Billow (2014) urge that Project complements traditional
‘Gantt-style’ task/activity planning with ‘outcome-driven(essentially simple, commercially realistic,
easily understood by business people and can be applied to any size or complexity of project).
Milestones to deliver business value (as opposed to inputs, tasks/activities and outputs). It is focused
on what has to be achieved irrespective of how you are going to achieve it; the how is addressed in the
lower level task plans.
Governance’ focus: The rating of projects’ governance focus by the respondents is prescribed in the
table 4.8. It is meaningful to critically evaluate what planning project principles’ focus on throughout
different project phases.

60
Table 4.8 Respondents’ views on governance’s’ focus on projects.
Project governance’ focus principles N Mean
Ongoing appraisals of a project to review and agree significant proposed changes to
determine if the project should be continued, re-scoped or terminated as a principle
focused on projects’ governance
85 4.0588
During project delivery the business case for all or part of the project ‘goes
negative’, in terms of failing to pass the ‘value hurdles’ then the goal is to terminate
the development of that functionality to stop non-value-adding work at the earliest
time possible as a principle focused on projects’ governance
85 3.4706
Portfolio Managers, Project Directors/Sponsors and general Executives remain
focused on the ‘Big Picture’ and report project plans across the organization in a
consistent manner as a principle focused on projects’ governance
85 4.1059
Source: Primary Data
According to table 4.8 the average mean is 3.878433 a score which is a positive extreme. This result is
an indicator that most of the respondents’ views agree and strongly agree that Projects are founded on
the principle of “right governance”. The project delivery status is essentially the level of variance of
the project against the delivery plan, in particular the planned costs, schedule, scope and quality.
The benefits delivery status is essentially the level of variance of the project’s business case against
the original business case, in particular the promised benefits”. If during project delivery the
business case for all or part of the project ‘goes negative’, in terms of failing to pass the
‘value hurdles’ (e.g. forecasted competitive advantage, Return on Investment, strategic alignment),
then the goal is to terminate the development of that functionality (or re-scope to ‘rescue’ the
functionality that will pay its way). The name of the game is to cease throwing good money after bad
and stop non-value-adding work at the earliest time possible
Outcomes’ focus: The rating of Project outcomes’ focus by the respondents is presented in the table
4.9. It is meaningful to critically evaluate outcomes’ focus on the project.

61
Table 4.9 Respondents’ views on outcomes’ focus on projects.
Outcomes management focus principles N Mean
Project Managers take the view that whoever is responsible for realizing the
benefits from the project it certainly isn’t them; once the project is live and the
initial service bugs are ironed out, their job is at an end as a principle focused on
projects
84 3.5952
Business and supplier are supposed to be working together to realize the promised
business benefits; without the realization of the benefits the entire project is
pointless as a principle focused on as a principle focused on projects' out comes
mgt
85 3.8118
Primary incentive is to deliver the functionality set out in the Functional
Requirements Specification to budget and schedule, not to work with the customer
to commercially prioritize the functional requirements and design the system to
achieve the best commercial outcomes
85 3.2471
Source: Primary Data
According to table 4.9 the average mean is 3.551367 a score which is a positive extreme. This result is
an indicator that most of the respondents’ views agree and strongly agree that Projects are founded on
the principle of “right outcomes”. Project managers will often cite the fact that in the Project Mandate,
part of the ‘Project Sponsor’ role is defined as ‘responsible for harvesting the project benefits’,
so absolving them from responsibility. No matter what the ‘small print’ says in the Project Mandate,
it is skeptical and pointless to use that as a ‘get out of jail free’ card and expect that to ‘fix the
problem’. Therefore, business and supplier are supposed to be working together to realize the
promised business benefits; without the realization of the benefits the entire project was pointless. So
it should not be a matter of ‘restrictive practices’ being used to let benefits management fall between
the cracks. The primary incentive is to deliver the functionality set out in the Functional Requirements
Specification to budget and schedule, not to work with the customer to commercially prioritize the
functional requirements and design the system to achieve the best commercial outcomes.

62
Business model’ focus: The rating of Project Business model’ focus by the respondents is
presented in the table 4.10. It is meaningful to critically evaluate project business model’ focus
principles on the project.
Table 4.10 Respondents’ views on business model’s’ focus on projects.
Project Business model’ focus principles N Mean
Run the project as a ‘value centre’. It’s overriding objective being to add the
maximum value to the business it serves as a principle focused on projects’
business model
85 4.1765
Funding must largely be determined by affordability and success at projects’ value
realization, i.e. there is a causal effect between demonstrably adding value to the
business and funding levels as a principle focused on projects’ business model
85 4.2000
Source: Primary Data
According to table 4.10 the average mean is 4.18825 which is a positive extreme. This result is an
indicator that most of the respondents’ views agree and strongly agree that Projects are founded on the
principle of “right business model”. Project funding must largely be determined by affordability and
success/failure at projects’ value realization, i.e. there is a causal effect between demonstrably adding
value to the business and funding levels.
Organization model’ focus: The rating of Project Organization model’ focus by the respondents is
presented in the table 4.11. It is meaningful to critically evaluate project Organization model’ focus
principles on the project.
Table 4.11 Respondents’ views on organization model’s’ focus on projects.
Projects organization model’ focus principles N Mean
Projects must maintain a core ‘project management centre of excellence’ from
which project management professionals with minimal line management
responsibilities are seconded to projects as a principle focused on projects’
organization model
85 3.9529
According to table 4.11 the average mean is 3.9529 a score which is a positive extreme. This result is
an indicator that most of the respondents’ views agree and strongly agree that Projects are founded on
the principle of “right organization model”. Therefore, it’s true that projects must maintain a core

63
Project management centre of excellence from which project management professionals with minimal
line management responsibilities are seconded to projects.
Project stakeholders’ roles: The rating of roles of stakeholders by the respondents is presented in the
table 4.12. It is meaningful to critically evaluate project stakeholders’ roles when considering a new
project.
Table 4.12 Respondents’ views on roles played by project stakeholders.
Project stakeholders’ roles when considering a new project N Mean
Set priority it should have as a role played by executives 85 4.4235
Look at the available resources and lower the priority of other projects to make
room for the new one as a role played by executives
85 4.1412
Define the end result the project should produce and how he would measure it as a
role played by project sponsors to new projects
85 4.1294
Engages managers to define major deliverables to the end result as a role played
by project sponsors to new projects
85 4.0588
Use methodology where priority # 1 projects get first call on resources as a role
played by project managers to new projects
85 4.3294
Follow project protocol for planning, scheduling, staffing, and tracking projects as
a role played by project managers to new projects
85 4.4706
Make accurate estimates of the work and time as a role played by project team
members to new projects
85 3.8706
Organization track assignments and clearly communicate to them which projects
they should work on each week or project team members decide which projects to
work on first as an approach to new projects
85 3.4471
Source: Primary Data
According to table 4.12 the average mean is 4.108825 which is a positive extreme. This result is an
indicator that most of the respondents’ views agree and strongly agree that these are the roles played
by project stakeholders reduce risk and increase value when considering new projects. This particular
research in the interview explored that Executives play their role properly in the sense of considering
a new projects and the priority it should have by looking at the available hours and lowering the
priority of other projects to make room for the new one. When senior management docs their job

64
like this, “we don't wind up initiating projects that require 20,000 hours of work when we only have
l2,000 hours of availability to work on projects”. Executives are not setting priorities when
everything is priority number one.
Project sponsor playing his role correctly. He defines the end result the project should produce and
how he would measure, then he engage the managers in defining the major deliverables that would
lead them from where they are now to that end result. Last, he promise to work with department heads
to get them to lend people for the project team needed.
The experienced project manager advice new project managers for no pushing for best practices, they
perform like order-takers at a drive-in restaurant, giving little thought or energy to planning or how to
avoid problems before they occur. “Remember how our methodology works”. Priority # 1 projects get
first call on resources and then priority #2. So you're going to get your resources when those higher
priority projects don't need them. Then look at some previous projects that are similar to yours. Get
them out of the archives and you'll learn in detail how we do things and also gather some samples of
plans and documents and estimates that you may be able to use."
Finally that there should be project rules and an executive should communicate to everyone the
obligations of the project team members in their organization's system. The first rule is a commitment
by the organization to manage everyone's project workload and prevent excessive levels of project
work. As an example, the organization's project protocol might specify that: first level supervisors
(whom everyone wants on their project team) can be assigned no more than 12 hours of project work
each week. That's based on the organization's priority decisions and it's far better than having project
team members decide which projects to work on first, based on who's yelling the loudest.
Ultimately, the success or failure of a project is subjective: perceptions are reality. If the Board
perceives the project as a failure then it is a failure. If the programme/project Sponsors and
Stakeholders perceive it as a failure, then it is a failure. On what evidence do they base their
perception of failure? This will be based on one or more of the following criteria reflected on by the
respondents in this particular research.
The rating of stakeholders’ reality perceptions by the respondents is presented in the table 4.13. It is
meaningful to critically evaluate project stakeholders’ reality perceptions on Projects failure or success
based on evidence of 5 criteria.

65
Table 4.13 Respondents’ views on reality perceptions of stakeholders on projects criteria.
Projects failure or success subject to reality perceptions N Mean
Not delivering when it was expected as one of the 5 evidence criteria based on by
different stakeholders to measure the project as a failure or success
85 3.5412
Not delivering it at the cost expected as one of the 5 evidence criteria based on by
different stakeholders to measure the project as a failure or success
85 3.4941
Not delivering all the functionality that was expected as one of the 5 evidence
criteria based on by different stakeholders to measure the project as a failure or
success
85 3.5294
Not delivering the functionality with the expected quality as one of the 5
evidence criteria based on by different stakeholders to measure the project as a
failure or success
85 4.1882
Not realizing the full business benefits as one of the 5 evidence criteria based on
by different stakeholders to measure the project as a failure or success
85 4.1994
Source: Primary Data
According to table 4.13 the average mean is 3.77646 a score which is a positive extreme. This result is
an indicator that most of the respondents’ views agree and strongly agree that stakeholder perceptions
are reality criteria for measure of project success or failure. Dick Billows (2014) cited that ultimately,
the success or failure of a project is subjective: perceptions are reality. If the Board perceives the
project as a failure then it is a failure. If the project Sponsors and Stakeholders perceive it as a failure,
then it is a failure on what evidence do they base their perception of failure based on one or more of
the following, listed in the typically decreasing order of priority; 1. Not delivering when it was
expected (Scheduled), 2. Not delivering it at the cost expected (budget), 3. Not delivering all the
functionality that was expected (scope), 4. Not delivering the functionality with the expected quality.
Most Project Managers would accept that failings in one or more of these four ‘project failure criteria’
at least contributes to a fair perception of ‘project failure’. What many Project Managers would
probably not put on their ‘project failure criteria’ list is the criterion that deems to be the cardinal one,
the single biggest factor on which the business will typically assess a project as a failure, namely, 5.
Not realizing the full business benefits, as promised in the original business case. As far as the
business is concerned the only reason for investing in the project in the first place was to reap the

66
promised financial and non-financial benefits (i.e. its value) and if it fails to live up to these promises
then it has failed, end of story as evidenced by its score which higher than the rest of the variables.
Perhaps the most critical question those failing projects to ask themselves is whether or not they have
created the environment within which effective decisions can be made. Effective decisions yield to a
number of turnaround actions/efforts to correct project failure reflected on by the respondents
presented in the table 4.14.
Table 4.14 Respondents’ views on turn around actions to correct project failure.
Actions to correct project failure N Mean
Planning as efforts to correct project failure 85 4.74
Customer relationship as efforts to correct project failure 85 3.99
Set targets as efforts to correct project failure 85 4.42
Building optimal portfolio projects as efforts to correct project failure 84 4.04
ongoing appraisals & reviews of projects as efforts to correct project failure 84 4.7024
projects benefits realization as efforts to correct project failure 85 4.2471
Run projects as ‘value centre’ as efforts to correct project failure 85 4.3412
Maintain a core ‘project management centre of excellence as efforts to correct project
failure
80 4.4000
Source: Primary data
Table 4.14 presents the turnaround actions suggested by respondents to correct project failure rates.
The average mean is 4.36 which is a positive extreme. This result is an indicator that most of the
respondents’ views agree and strongly agree that these actions are turnaround efforts to correct project
failure. (Calleam Consulting 2008) identified them as decision making elements that reflects
Technical knowledge, Business domain knowledge, Engagement and Participation, Ownership and
commitment, Collaborative relationships, Shared understandings, Situational awareness, Clear
purpose and goal, and Quality focus . Further stressed that when they are missing/if the project is
challenged with these elements, such typical problems will arise; Poor design, low productivity, bad
estimates, technical defects, technical omissions, undetected defects, Functional errors and omissions,
incorrect assumptions, missing scope, missed opportunities, Delays in project start up, sporadic and
intermittent progress, delays waiting for key decisions to be made, volatility due to stakeholders
getting involved too late, “not my job” syndrome, buck passing, Silos, isolationism, politics,
misunderstandings, disputes, gaps or duplication of effort, Lack of clarity, confusion, rounds of

67
“clarifications”, Failure to see warning signs of trouble, lack of understanding of project’s true status,
simplistic perspectives, Building the wrong product, conflicting or shifting priorities, missteps and
false starts, Poor quality, product recalls, high levels of rework, extended periods lost investigating
problems, loss of customer confidence, Lack of direction, lack of coordination, failure to see or
address critical problems, general project breakdown.
Project Management Methodology: The researcher conducted a convenience survey of project
management practitioners to gauge their use and experience in utilizing tailored project management
methodologies. Asked a variety of questions that sought to determine whether or not they used a
project management methodology, the level of tailoring, the level of project success and the level of
organizational project management maturity. (See the Explanation and tables of findings for details
regarding the research.)
When asked whether their organizations have a defined project management methodology, the average
mean of 83 Respondents was 1.4578 a score which is a negative extreme. This result shows that
3.5422 (70.8%) of organizations do not have any form of defined project management methodology.
This means that there were no standardized processes, templates, tools or techniques to a greater or
lesser degree tailored, project management methodology. One of the reasons given for not having a
project management methodology and particularly a tailored project management methodology was
practitioners did not know how to develop and implement one.
Respondents who indicated that they had no project management methodology were asked whether or
not they believed a project management methodology would help them deliver projects more
successfully. But surprisingly, 88.8% of them indicated that they thought a defined project
management methodology would help them deliver their projects more successfully. This may indicate
that while individual practitioners see benefit in a defined project management methodology, the
organizational culture and senior decision makers do not see this benefit. (PMI, 2014) suggests that
successfully implementing a defined project management methodology requires support from a wide
range of stakeholders including practitioners, executives, senior technical staff and others who can
influence its adoption and use. A starting point may be to use research, such as presented here below,
that demonstrates the benefits a defined and tailored project management methodology brings to an
organization
A good one is obvious for it to deliver successfully, Because having it smoothens the project
performance appraisal, division of labor monitoring, evaluation and keeping on track the project

68
implementation oversight, Because it defines clearly where to begin and the end for us the project
practitioners, Because it is documented, Because the management of project is not done adhocly but
systematically and in effective way of which is provided in the methodology. This is evidenced by
their beliefs on methodology contributions to the success, or failure on projects presented in the table
4.15.
Table 4.15 Respondents’ views on impact of the methodology to project success/failure.
Rating of methodology contribution to the success, or failure of projects? Percentages
A methodology plays no role at all in whether or not a project will succeed or
fail
2%
Project success or failure depends entirely on the methodology being used 8%
A methodology plays a minor role in determining project success or failure 25%
A methodology plays a major role in determining project success or failure 65%
Source: Primary Data
When asked about the impact respondents thought their methodology had on the success or failure of
their projects, only 2% of respondents who indicated they used a defined project management
methodology indicated that it played no role at all in whether the project succeeded or failed. Table
4.15 shows that 65% of respondents who use a project management methodology believe that a
methodology plays a major role in determining project success or failure.
When asked to provide self- evaluation of project success with a Tailoring methodology their suggestions
were as follows as presented in the reflected on in the table 4.16.
Table 4.16 Respondents’ views on projects success with methodology.
Kind of a Tailoring methodology to projects success Percentages
No Methodology 12%
With Minor Tailoring 9.3%
With Moderate Tailoring 15.4%
With Mostly Tailored 53.3%
With Completely Tailored 77%
Source: Primary Data
Respondents were asked to provide a self- evaluation of project success, which was measured against
whether or not they had any form of methodology; and, if they did, how much tailoring or
customization was done to it. The data shown in table 4.16 indicates that having a moderate, mostly
and completely tailored project management methodology may be related to greater levels of project
success than not having a project management methodology. Furthermore, the data suggest that the
more tailoring of a project management methodology the greater the level of project success.

69
When asked to assess the level of their organizations in relation to professional project management
practices, their report results presented in the table 4.17.
Table 4.17 Respondents’ views on projects professional management practices.
Levels of methodology Tailoring in relation to organization professional
project management practices Percentages
No Methodology 4.3
Minor Tailoring 2.9
With Moderate Tailoring 9.5
With Mostly Tailored 21.3
With Completely Tailored 74.3
Source: Primary Data
When the respondents were asked to assess the level of organizational project management maturity of
their organizations, there appears to be a relationship between those with no methodology compared to
those with a defined methodology. Table 4.17 shows, those organizations that used a defined project
management methodology reported a higher level of maturity than those organizations that did not.
4.4 ANSWERS TO RESEARCH QUESTIONS
1. Where does the fault of project failure lies at different elements of project within an organization?
This is so because (Dick Billows 2014) provides that organizations with problems of doing projects
can experience failure rates as high as 70% of which wastes so much money and human resources that
even a small increase in the success rate is worth a lot. It is crucially important to carry out this study
so as to obtain information and data to address this scenario.
According to the research findings the fault of project failure lies at several levels in the organization
where the Executives fail in their strategic role of prioritization and resource allocation, Project
sponsors fail to define exactly what the projects should deliver, project managers fail to give
executives the tools they need to do their jobs and fail to give project team members clear performance
expectations project team members fail to make accurate estimates or honestly report the status of
their assignments.
The fault also lies at project “Decision Engine” because it captures turnaround efforts as actions
necessary for project success and the typical problems that arise if the project is “challenged” in a
certain element. These efforts to correct project failure rates must be present at all these levels to
accomplish project work since they reflect Technical knowledge, Business domain knowledge,
Engagement and Participation, Ownership and commitment, Collaborative relationships, Shared

70
understandings, Situational awareness, Clear purpose and goal, and Quality focus to the extent that
when they are missing/if the project is challenged with these elements, such typical problems will
arise; Poor design, low productivity, bad estimates, technical defects, technical omissions, undetected
defects, Functional errors and omissions, incorrect assumptions, missing scope, missed opportunities,
Delays in project start up, sporadic and intermittent progress, delays waiting for key decisions to be
made, volatility due to stakeholders getting involved too late, “not my job” syndrome, buck passing,
Silos, isolationism, politics, misunderstandings, disputes, gaps or duplication of effort, Lack of clarity,
confusion, rounds of “clarifications”, Failure to see warning signs of trouble, lack of understanding of
project’s true status, simplistic perspectives, Building the wrong product, conflicting or shifting
priorities, missteps and false starts, Poor quality, product recalls, high levels of rework, extended
periods lost investigating problems, loss of customer confidence, Lack of direction, lack of
coordination, failure to see or address critical problems, general project breakdown. Executives have
to give up some of their prerogatives. Specifically, they have to agree that they cannot start a project
whenever they wish. That's true even if the project involves only people in their area of accountability.
Department managers have to give project managers just a little bit of authority over people who are
loaned to their projects. Team members need to understand that project work counts just like the work
they do or their "real" jobs.
Last but not least the fault of project failure lies at project management methodology used. PMI
(2013b) defines Project management methodology as a defined, documented and discoverable set of
policies, practices, processes, tools, techniques and templates that provide guidance on how projects
are run within an organization. A methodology can be extensive or minimal; rigorous or lightweight;
complex or simple; linear or highly iterative; described in phases or described for the entire project
lifecycle. A project management methodology should reflect the size, duration and complexity of each
individual project, and be adapted to the industry, organizational culture and level of organizational
project management maturity of the organization. Tailoring is the process of referencing framework
documents, standards and other relevant sources and utilizing those elements that provide processes,
tools and techniques that are suitable for that particular organization. Data shows that 65% of
respondents who use a project management methodology believe that a methodology plays a major
role in determining project success or failure. Furthermore, the data suggest that the more tailoring of a
project management methodology the greater the level of project success. Finally those organizations
that used a defined project management methodology reported a higher level of maturity than those
organizations that did not. Project managers have to follow the organization's project methodology
whether they like it or not. Everyone needs to meet the requirements of their role as defined in an

71
organizational project protocol.
2. Why stakeholders in some case especially the client or customer perceive a project as a success yet
doesn’t live to business expectations? I.e. success rate doesn’t give those organizations competitive
advantage and yields high levels of profitability.
Eventually, the success or failure of a project is subjective: perceptions are reality. If the Board
perceives the project as a failure then it is a failure. If the programme/project Sponsors and
Stakeholders perceive it as a failure, then it is a failure based primarily on one or more of the
following four traditional criteria listed in the typically decreasing order of priority that tend to act in a
‘push-pull’ relationship with one another:1. Not delivering when it was expected (Scheduled) 2. Not
delivering it at the cost expected (budget) 3. Not delivering all the functionality that was expected
(scope) 4. Not delivering the functionality with the expected quality. Most Project Managers would
accept that failings in one or more of these four ‘project failure criteria’ at least contributes to a fair
perception of ‘project failure’.
The current research findings realized that What many Project Managers would probably not put on
their ‘project failure criteria’ list is the criterion that deems to be the cardinal one, the single biggest
factor on which the business will typically assess a project as a failure, namely, 5. Not realizing the
full business benefits, as promised in the original business case and fail to realize that as far as the
business is concerned the only reason for investing in the project in the first place was to reap the
promised financial and non-financial benefits (i.e. its value) that if it fails to live up to these promises
then it has failed, end of story.
This particular research contention is that the target of successful project management must be
achieving the best business value outcome of projects. These will be fully achieved if the benefits
promised in the project’s business case are fully realized in the timescales predicted in the business
case, reason being that the four traditional project success criteria of ‘delivery to agreed budget’,
‘delivery to agreed schedule’, ‘delivery of agreed scope’ and ‘delivery to quality needs’ are ‘value
modifiers’ i.e. they may not affect the project achieving its objectives (e.g. a late or over- budget stock
replenishment system has still achieved the objective of ‘automating stock replenishment’) but they
will almost inevitably affect the project achieving its best outcome (of maximum business value)
because late project delivery delays the start of realizing business benefits, over budget delivery
reduces the net benefits realized, reducing the scope reduces the value- adding functionality delivered

72
and poor commercial quality, by definition, reduces the delivered system/service’s ability to generate
business value.
Conventional project management methodologies are focused almost exclusively on improving the
rigorousness of project management processes, with a view to increasing the probability of delivering
projects to budget, schedule, scope and quality criteria, which is not the case since does not supersede
this need, but complements it by facilitating cultural, process and organizational changes in order to
increase the probability of delivering projects that realize the full business benefits, as promised in the
original business case.
3. Is it possible in Project Management world for project to operate as a ‘value centre’ not a profit
centre? i.e. in a Virtual Joint Venture with the business it supports, is dominated by the ‘value ethic’
(project produce the desired deliverables presented in the business case within its five major variables:
delivery to agreed budget’, ‘delivery to agreed schedule’, ‘delivery of agreed scope’, ‘delivery to
quality needs’ and risk).
Per the evaluation of different principles focus on the project the result shows that project management
based on principles engenders a much more dynamic, commercially focused project delivery
environment. A project delivery organization that performs project management by principles operates
not as a cost centre or a profit centre but as a ‘value centre’ (i.e. its key role is to generate value for the
business it serves) and is in a ‘Virtual Joint Venture’ with the business it serves (i.e. there is real
financial risk and reward for both parties). According to survey findings for this particular research
project delivery is not so fixated on delivering the project to budget and schedule that it neglects the
real goal, viz. delivering the promised benefits; and the Project Sponsor becomes truly accountable for
both the project costs incurred and the realization of the benefits. Results also shows that in any
projects incentives should largely be driven by the extent to which projects go on to actually
realize their promised benefits; in this way project managers and their staff they are incentivized to
agree realistic costs and benefits in the business case. Projects are focused to see the work being
managed into the supplier, understanding the true costs, true business benefits and the true risks of
failing to deliver and realize those benefits. Planning of projects is focused on Milestones to deliver
business value (as opposed to inputs, tasks/activities and outputs). It is focused on what has to be
achieved irrespective of how you are going to achieve it; the how is addressed in the lower level task
plans. Project governance should be focused on the benefits delivery status as essentially the level of
variance of the project’s business case against the original business case, in particular the promised
benefits”. If during project delivery the business case for all or part of the project ‘goes

73
negative’, in terms of failing to pass the ‘value hurdles’ (e.g. forecasted competitive advantage,
Return on Investment, strategic alignment), then the goal is to terminate the development of that
functionality (or re-scope to ‘rescue’ the functionality that will pay its way). The name of the game
is to cease throwing good money after bad and stop non-value-adding work at the earliest time
possible. Project outcomes focus should not be a matter of ‘restrictive practices’ being used to let
benefits management fall between the cracks. The primary incentive is to deliver the functionality set
out in the Functional Requirements Specification to budget and schedule, not to work with the
customer to commercially prioritize the functional requirements and design the system to achieve
the best commercial outcomes”. But, the latter is what the business actually most needs; the
latter is the only justification for doing the project in the first place. Business model focus is that
Project funding must largely be determined by affordability and success/failure at projects’ value
realization, i.e. there is a causal effect between demonstrably adding value to the business and funding
levels. And finally, organization model focus is that projects must maintain a core Project management
“centre of excellence” from which project management professionals with minimal line management
responsibilities are seconded to projects.

74
CHAPTER 5
SUMMARY, CONCLUSIONS AND RECOMMENDATIONS
5.1 INTRODUCTION
This chapter discusses the researcher’s interpretive stance to research and the consequent choice of a
qualitative approach. It also presents the researchers recommendations out of research to the project
practitioners, and general research scope to the conventional lessons.
5.2 SUMMARY
The overriding purpose of this study was to determine the causes of project failure, a failure crucially
perceived by the customer. This particular research contention is that the focus of successful project
management must be achieving the best business value outcome to the customer. This will be fully
achieved if the benefits promised in the project’s business case are fully realized in the timescales
predicted in the business case; delivery of the project to budget, schedule, scope and quality criteria
are equally important.
Specifically the case is that several projects do fail to deliver expected value as promised from the
original business case or (decision makers select such a project after the document explores the
feasible/viable approaches to the project. Some organizations have 70% project failure rates that
threaten their existence. In some cases they can’t deliver to customers or client profitability. In other
cases they don’t deliver new products or services that allow them to successfully compete. But also
what to be done remains another puzzle to these stakeholders and needs solutions to end the loses of
money and other resources they incur through these projects that fail to yield to the expected value the
individual businesses or society and this instilled in the minds of a researcher the curiosity to carry out
the research on this problem as a scholar of project management who is also inspired and a would be
professional project manager.
To accomplish that goal it became necessary to reach some prerequisite goals. The goal was to
ascertain what could be the causes of the failure to several projects and bring them out to the academic
researchers to review results of this particular study or even do more intensive researches to bring
solutions to this problem or entice potential students to do so. As a would be project management
practitioner I would like to improve practices in project management in general i.e. planning and
execution skills and become efficient future project management practitioner and run the projects that
75
would not lead into loses of money and other resources and use my proficient skills to intervene when
consulted to revamp the projects more especially those with direct hand to boost up the economies.
Once these fundamental steps were achieved, this research was able to go forward. This chapter
reports the conclusions and recommendations that resulted from this study. One version of a survey
questionnaire (research instrument) was developed and distributed to project stakeholders according to
the economic sectors of economy per the projects in the sample size in Rwanda. All respondents were
asked to rate the turnaround actions to correct project failure, They were asked to rate the value
indicators of the business projects, They were asked to rate the activities involved at any stages of
project work, They were asked to rate variables taken into account in project development processes,
They were asked to rate the focus of different principles in the project such as Customers/supplier
relationships, Incentives, Project, Planning, Governance, Outcomes, Business model, and organization
model, They were asked to rate roles of different stakeholders when considering new projects,
Finally, they were asked to rate a tailored project management methodology in relation to project
success and failure. Through the use of the survey instrument developed for this study, data were
collected which addressed the research problems posed in the first chapter of this thesis.
5.3 THE MAJOR FINDINGS ON THE ILLNESS BEHIND PROJECT FAILURE Ineffective decision making and the problems that inhibit effective communications by project
stakeholders are identified in this research as main problems that cause projects to fail in form of their
patterns they occur to represent the illnesses that trouble projects. Project Managers and teams who
understand these patterns and who have the skills needed to identify their associated symptoms are far
more likely to succeed than those that don’t. Projects are built from thousands if not millions of
individual decisions at the most basic level not as sets of inter-dependent tasks. Be it developing
project’s vision, planning, designing, vendor selection, technology choice, developing test cases, every
step along the requires a decision to be made.
Top led failures occurs when senior managers made strategic blunders that projects on course for
disaster and they include failure for them to allow adequate time for its development, and failure to
estimate project’s complexity for example design complexity, it’s a risk. Focal imbalance failures
occurs when management team fail to dedicate sufficient attention to one or more critical parts of the
project. They include underestimation of staff training & logistics necessary for opening. Disconnect
failures occurs when a project loses sight of its value proposition and ends up implementing a solution
that fails to meet its rightful goals. They represent break down in communications, and governance.

76
Bottom fed failures occurs when substandard work at the implementation level results in quality
problems.
Project Manager’s role is planning and control but also about arranging the team’s decision making
occurring within the team. By establishing the team, defining processes, planning roles and
responsibilities, and facilitating meetings. While Project Managers may not be experts in the
technology in use and may not fully understand the project’s every detail, successful Project Managers
are the ones who have developed a sense for whether or not the teams are making effective decisions.
By listening to how the team communicates and watching the interactions between individuals, groups
and stakeholders effective Project Managers are able to keep their finger on the rhythm of the project.
His awareness to this level of interaction enable him monitor the project’s heart beat to see if the
project is functioning in a healthy and sustainable way. Number of options the team has considered
when making critical decisions. One of the hallmarks of expertise is the ability to rapidly generate
alternative ideas about how to solve a problem. Unhealthy projects often lack that ability and rather
than considering alternatives, the first option thought of becomes the only option thought of. Teams
using such an approach are unlikely to be lucky enough to identify the best option first time, every
time, and first option adoption is a pattern of behaviour that is deeply rooted in many project failures.
The training regime used by most organizations places a heavy focus on the process of Project
Management and the supporting tools. While these are an invaluable part of the toolkit, they represent
Project Management level skills. The urgent need in many organizations lies in going beyond that
basic level of knowledge and developing the more advanced insights to be able to see the symptoms of
project failure and the strategies for securing success.
5.4 CONCLUSIONS
The relative degree of importance of turnaround actions to correct project failure rates as rated by
project stakeholders determined the response to research question 3 and objective 3. When considered
by all respondents in the context of the eight potential turn around actions offered for consideration,
planning was ranked first variable with 4.74 and the averages mean score of the all variables is 4.36
which is positive and nearing to the highest positive extreme. Based on the finding result the
researcher concludes that the potential turn around actions proposed are the best answer(s) to correct
project failure rates and increase the chances of projects to deliver the “value” that customers need as
urged by other researchers cited in chapter 4 to support the validity of this particular research finding
identified these actions as decision making elements that reflects Technical knowledge, Business

77
domain knowledge, Engagement and Participation, Ownership and commitment, Collaborative
relationships, Shared understandings, Situational awareness, Clear purpose and goal, and Quality.
The relative degree of importance of potential value indicators as rated by project stakeholders
determined the response to research question 2 and 3. When considered by all respondents in the
context of the seven financial benefits and six strategic benefits potential value indicators of project
offered for consideration, increased cash flow was ranked first variable with 4.26 and competitive
advantage gained with 4.64 respectively and the averages mean score of the all variables is 4.07 which
is positive and nearing to the highest positive extreme. Based on the finding result the researcher
concludes that the potential project value indicators proposed are the best answer(s) to measure the
“value” that customers need as urged by other researchers cited in chapter 4 to support the validity of
this particular research findings. Therefore, Project are managed on a reasonably formal ‘objective’
process by which work is managed into the supplier, understanding the true costs, true business
benefits and the true risks of failing to deliver and realize those benefits. Deliver what was in the
agreed functional specification, on the date agreed and at the cost agreed; and demand-side’ is
basically, Deliver what the customer actually needs and realize the desired project outcomes, in terms
of business benefits, beginning on the date agreed and at the cost agreed (if these last two are critically
important); in this way it seeks to maximize the business value of project investments.
The relative degree of importance of activities at project work as rated by project stakeholders
determined the response to research question 3 and objective 4. When considered by all respondents in
the context of the ten potential activities at project work offered for consideration, estimating the
required resources to accomplish the project work was ranked first variable with 4.80 and the averages
mean score of all variables is 4.59 which is positive and nearing to the highest positive extreme. Based
on the finding result the researcher concludes that the potential activities proposed are the best
answer(s) to be involved at project work as urged by other researchers cited in chapter 4 to support the
validity of this particular research finding.
Therefore, Organizations that consistently succeed with projects perform well at every level in the
project management process. They control the initiation of projects as well as the planning,
approving, prioritizing and monitoring of projects based on the business value those projects
produce. They manage the pool of project resources just as they manage their capital budgets,
allocating people's time and money to projects based on the payback. They follow a consistent
methodology for all projects, holding people accountable for playing their role correctly.

78
The relative degree of importance of project deliverables as rated by project stakeholders determined
the response to research question 3 and objectives 4 and 2. When considered by all respondents in the
context of the ten potential deliverables at project work offered for consideration, cost was ranked first
variable with 5.10 and the averages mean score of all variables is 4.58 which is positive and nearing to
the highest positive extreme. What is surprising on this result is cost being ranked number one
deliverable, but on the other hand one may not wonder so much since cost is the most variable to be
managed and delivered compared to scope and time, and this proves the fact that cost is the most
flexible constraint compared to scope which is the most high purpose variable in the project delivery
perspective. Based on the finding result the researcher concludes that the potential variables proposed
are the best answer(s) to be project variables as urged by other researchers cited in chapter 4 to support
the validity of this particular research finding. Therefore, a project is successful when it produces the
desired results within a budget, quality, scope, risk, and time. If any of these is missing then the project
is a failure. It is urged conventionally that at the very beginning of a project; organizations, vendors
and project managers should spend adequate time defining metrics to establish the overall success/
failures. To illustrate how these variables plays a part in reflecting holistic project success/failure
consider their effects: Late project delivery delays the start of realizing business benefits, Over
budget delivery reduces the net benefits realized, Reducing the scope reduces the value- adding
functionality delivered and poor quality, reduces the delivered service’s ability to generate business
value.
The relative degree of importance of potential principles’ focus to deliver projects as rated by project
stakeholders determined the response to research question 1 and objective 2. When considered by all
respondents in the context of the eight potential principles i.e. customer/supplier relationships, Staff
incentives, project focus, planning, governance, outcomes, business model, lastly organization model
offered for consideration, business model was ranked first with its variables score average mean 4.18
and the average means score of the all variables is 3.9 which is positive and nearing to the highest
positive extreme. Based on the finding result the researcher concludes that the potential project focus
principles to project proposed are critically important to reduce risk and increase value delivery to
projects as urged by other researchers cited in chapter 4 to support the validity of this particular
research finding. Therefore, it is true customer/supplier relationships incentivizes Project Sponsor
becomes truly accountable for both the project costs incurred and the realization of the benefits.
projects’ incentives should largely be driven by the extent to which projects go on to actually
realize their promised benefits; in this way project managers and their staff they are incentivized to

79
agree realistic costs and benefits in the business case. project Demand management is the balancing
of business demand and supply through the categorization, evaluation, acceptance, deferral/rejection
and prioritization of ‘Work/Service/Change Requests’ based on cost, value and risk criteria. Planning
is focused on what has to be achieved irrespective of how you are going to achieve it; the how is
addressed in the lower level task plans. If during project delivery the business case for all or part
of the project ‘goes negative’, in terms of failing to pass the ‘value hurdles’ (e.g. forecasted
competitive advantage, Return on Investment, strategic alignment), then the goal is to terminate the
development of that functionality (or re-scope to ‘rescue’ the functionality that will pay its way).
The name of the game is to cease throwing good money after bad and stop non-value-adding work at
the earliest time possible. The primary incentive is to deliver the functionality set out in the Functional
Requirements Specification to budget and schedule, not to work with the customer to commercially
prioritize the functional requirements and design the system to achieve the best commercial
outcomes”. Project funding must largely be determined by affordability and success/failure at projects’
value realization, i.e. there is a causal effect between demonstrably adding value to the business and
funding levels. Finally, urged that ‘project management centre of excellence’ from which project
management professionals with minimal line management responsibilities are seconded to projects.
The relative degree of importance of roles played by project practitioners as rated by project
stakeholders determined the response to research question 1. When considered by all respondents in
the context of the eight potential roles that are played by different practitioners i.e.
Clients/beneficiaries, sponsors, project managers, and project team members offered for consideration,
executives’ role was ranked first variable with 4.28 and the averages mean score of the all variables is
4.10 which is positive and nearing to the highest positive extreme. Based on the finding result the
researcher concludes that the potential roles proposed are the best answer(s) to justify relevance of
project practitioners in project success/failure with regard to their roles played at different levels of
organization as urged by other researchers cited in chapter 4 to support the validity of this particular
research finding. Therefore an organization's executives have to lay the foundation for project
success. They do that by setting clear project priorities that recognize the limits on available
resources. Then they set up mechanisms to allocate resources according to those priorities. Finally,
the executives agree to a project management protocol that defines how projects will be initiated,
planned, scheduled and tracked. This solid foundation prevents chaos from spreading in the lower
ranks.

80
Sponsors must set clear, measurable objectives for projects by defining the deliverables with metrics.
They must also work with the project manager to Control the scope of the project so that good ideas
that are unnecessary for achieving the deliverables aren't included in the project.
Project managers translate the sponsor's strategy into tactics. They should conceive, manage and
control projects using best practice techniques to ensure the projects deliver their planned outcomes
efficiently. They must also follow the organization’s project protocol for planning, scheduling,
staffing and tracking projects. Finally project Team members make accurate estimates of the work
and time, complete their assignments and report status accurately so problems can be identified
early.
The relative degree of importance of criteria to measure project success/failure as rated by project
stakeholders determined the response to research question 2 and objective 4. When considered by all
respondents in the context of the five potential project success/failure criteria offered for
consideration, realizing full benefits as promised was ranked first variable with 4.19 and the averages
mean score of the all variables is 3.77 which is above average and nearing to the highest positive
extreme. Based on the finding result the researcher concludes that the potential criteria proposed are
the critically important project success/failure with regard to their gravity in business case delivery as
urged by other researchers cited in chapter 4 to support the validity of this particular research finding.
Therefore, it is true sponsors and stakeholders’ perception of failure i s based on evidence of one or
more of the following, listed in the typically decreasing order of priority; 1. Not delivering when it was
expected (Scheduled), 2. Not delivering it at the cost expected (budget), 3. Not delivering all the
functionality that was expected (scope), 4. Not delivering the functionality with the expected quality.
Most Project Managers would accept that failings in one or more of these four ‘project failure
criteria’ at least contributes to a fair perception of ‘project failure’. What many Project Managers
would probably not put on their ‘project failure criteria’ list is the criterion that deems to be the
cardinal one, the single biggest factor on which the business will typically assess a project as a failure,
namely, 5. Not realizing the full business benefits, as promised in the original business case. As far as
the business is concerned the only reason for investing in the project in the first place was to reap the
promised financial and non-financial benefits (i.e. its value) and if it fails to live up to these
promises then it has failed, end of story.
Industry research suggests that there is a direct relationship between a tailored project management
methodology and project success. Undertaking the development of a tailored project management

81
methodology using the model attached on appendix here, and based on the processes outlined in
Implementing Organizational Project Management: A Practice Guide (PMI, 2014), can improve the
efficiency and consistency of project execution and improve project success. This is especially
relevant to practitioners who do not have a project management methodology because they don't know
how to build one. The model provides guidance to assist project management practitioners in building
and improving their own tailored project management methodology.
The data from the survey seems to support the conclusion that there is a benefit to organizations for
implementing a tailored project management methodology and suggests that the greater the level of
project management methodology tailoring, the greater the level of project success. Using the data
gathered, the following key points were observed:
Approximately 70.8% of organizations manage their projects with no defined project management
methodology.
Projects managed without a defined project management methodology reported project success only
12% of the time while projects managed with a defined project management methodology reported
project success at an average of 53.3%; while organizations using a fully tailored, or customized,
methodology reported 77% project success rate.
Over 88% of project management practitioners working without a defined project management
methodology believed a defined project management methodology would help them deliver projects
more successfully.
The data presented suggests that there is a relationship between the presence of a defined project
management methodology, and the degree of tailoring of that project management methodology, and
project success. A defined project management methodology tailored to suit the size, complexity,
duration and organizational context, as well as the organization’s industry, can contribute to a higher
level of organizational project management maturity and, as such, either directly or indirectly
contribute to higher levels of project success.

82
5.5 RECOMMENDATIONS
The following recommendations are offered for related research in the field of project management.
1. Given the changing nature of project management, a series of longitudinal studies, based on project
value metrics, and methodology models, would document trends and thereby increase the potential
that decisions regarding the project deliverables and methodology would be relatively current and less
exposed to personal bias.
2. Given that this study provides a basis for concluding research on project failure defining the
attributes that constitute project success/failure would prove to be of valuable to the project
management discipline. Such an effort would enable practitioners to derive project related course
content from a research base.
Recommendations for practitioners
The following recommendations are offered for practitioners in the field of project management.
1. Table 4.1 found in chapter 4 of this thesis provides a systematic approaches and methodologies for
project practitioners to deliverer projects as promised in their business cases for projects’ success. It is
recommended that practitioners use this information as a basis for running and evaluating project
value.
2. Based on the results of this research, it s recommended that promised business benefits are cardinal
measure of project success/failure that would probably not be included on the list of project managers’
list of clients’ perception criteria of project success/failure measures. Particular attention to this should
be given by practitioners who do not include it.
Recommendations for improving this study
The following recommendations are offered as possible ways to improve this study.
1. When inquiring about “required technical subjects,” more precisely define or delimit the term. This
could also include the possibility of adding a separate question about required areas of technical
specialization, or technical elective requirements that are not aimed at achieving technical proficiency
in any specific area.
2. E-mails and telephone calls are not enough medium to effectively use for contacting respondents. It
is recommended that personal influence contributes a lot.

83
3. Although it is costly, it may be more efficient to determine the respondent pool by calling each
department before selecting respondents. The Industrial Practitioners is a good beginning reference
but it lacked in information that was necessary for this research. Specifically, some of the
practitioners are not necessarily identified as specializing in project management area. Therefore, it is
recommended that researchers check the areas of specialization indicated sample. Further, clearly
identifying which practitioners members are involved with or knowledgeable about the project
management option may prove to be of value.

84
REFERENCES
1. Billows, Dick, why do so many projects fail. Available at :< http://www.4pm.com >. Accessed on
27th
, September, 2015.
2. C. J. Van Wyngaard, J. H. C. Pretorius, L. Pretorius, “Strategic management of the triple constraint
trade-off dynamics - a polarity management approach,” in Proc. IEEE International Conference on
Industrial Engineering and Engineering Management (IEEM), Singapore, pp. 824- 828, Dec. 2011.
3. C. J. Van Wyngaard, “Effective management of the triple constraint in project management through
polarity management techniques - a refreshed perspective,” M. Eng. Dissertation, Eng. Mgmt.
Program, Univ. of Johannesburg, South Africa, 2011.
4. Contino, & Diana S, 2004, what’s your project's ROI?, Nursing Management, 35 (2) pp. 39-40.
5. Cooke-Davies, Terry, 2004, consistently doing the right projects and doing them right: Journal of the
Australian Institute of Project Management, 24 (1) pp.6-8.
6. Dick Billows. (2012) ‘Why do so many projects fail’ available from: http://www.4pm.com{15th,
September, 2015}.
7. J. A. Ward, “The key project constraints: Relationships and tradeoffs,” in Proc. 13th International
Conference on Software Quality, Dallas, 2003.
8. M. S. Dobson, H. Feickert, The six dimensions of project management: Turning constraints into
resources. Vienna, VA: Management Concepts Inc., 2007.
9. Melville, Nigel, June 2004, Information Technology and Organizational Performance: An Integrative
Model of IT Business Value, MIS Quarterly, 28 (2) pp283-322.
10. Meredith, J.R. & Mantel, S., 2003, Project management: a managerial approach, Project Management
Journal, 19 (3); pp. 78-85.
11. PMI. (2013a) Pulse of the profession: The high cost of low performance. Newtown Square, PA:
Project Management Institute.
12. PMI. (2013b). A guide to the project management body of knowledge (PMBOK® Guide)—Fifth
Edition. Newtown Square, PA: Project Management Institute.
13. PMI. (2013c). Managing change in organizations: A practice guide. Newtown Square, PA: Project
Management Institute.
14. PMI. (2013d). Organizational project management maturity model (OPM3®)—Third Edition.
Newtown Square, PA: Project Management Institute.
15. PMI. (2014) Implementing organizational project management: A practice guide. Newtown Square,
PA: Project Management Institute.

85
16. Project Management Institute, A guide to the project management body of knowledge (PMBOK®
Guide). 3rd ed. Newtown Square, PA: Project Management Institute, 2004.
17. R. Burke, Project management techniques. Oxford, UK: Burke Publishing, 2007.
18. S. Barker, R. Cole, Brilliant project management: What the best project managers know, say and do.
Harlow, UK: Pearson Prentice Hall Business, 2007.
19. Schrage Michael, IT’s Hardest Puzzle, CIO, Available at:
http://www.cio.com/archive/071505/leadership.html July, 15th, 2005.
20. Shang, Shari & Seddon, Peter B., October 2002, , Assessing and managing the benefits of enterprise
systems: the business manager's perspective, Information Systems Journal, 12 (4) p277 (271-299).
21. Snyder, C. S. (2013). A project manager’s book of forms, 2nd edition: A companion to the PMBOK®
Guide. 5th edition. Hoboken, NJ: John Wiley & Sons.
22. Wideman, R.M, New York Skyscrapers - One Hundred Years of High-Rises. Available
from:http://www.greatgridlock.net/NYC/nyc2a.html.(2002).
23. Wideman, R.M., 1996, Improving PM: Linking Success Criteria to Project Type. Available
at:http://www.maxwideman.com/papers/improvingpm/improvingpm.pdf.
24. Woodward, H, 2005, PMP, Beyond Cost, Schedule and Performance: Project Success as the Customer
Sees It, PP 2-3.
25. Woodward, H, 2005, PMP, PowerPoint Presentation to NASA. Available at:
http://pmchallenge.gsfc.nasa.gov/Docs/Presentations2005.

86
APPENDICES
1. Questionnaires.
2. TRIJECT Model NASM case analysis
3. Data base for project population in Rwanda
4. Project Management Methodology checklist
5. Methodology Process Flow Chart

UNIVERSITY OF RWANDA
COLLEGE OF BUSINESS & ECONOMICS
FACULTY OF ECONOMICS & MGT
PROGRAM: MBA Project Mgt & Finance
Dear Respondent,
I am conducting a research examining Causes of projects failure to deliver the value presented in their
business cases. Case study: Rwanda as a requirement for the award of Master of Business Administration
option Project Management.
This study will attempt to determine the causes for failure of projects in organizations studied and also suggest the solutions to
those causes for academic purposes.
In connection with this, you’re identified as a resourceful person to provide me with the necessary data for my study, please feel
free to answer the questionnaires.
There is no right or wrong answers as long as you do it honesty. Rest assured that your answers to this survey-questionnaire
will be treated with utmost confidentiality. The survey results will be analyzed for academic purposes.
Thank you very much for your kind cooperation in the conduct of this study. Your responses will contribute to this academic
research.
Sincerely,
NYAMUGABO Eric
Researcher
Noted by:
Prof. RAMA
Research Moderator

Directions: Please provide this information by putting a tick in an appropriate box.
1. Personal profile
Name (optional):
Nationality:
Your Group
Category at the
Project
Project
Client/Beneficiary
Project Sponsor Project
Manager
Project Team
Member
Age Gender Education Level Economic Sector of your work
20-30yrs Male College Graduate Manufacturing
Sector
Service Sector Agriculture
Sector 31-40yrs
41-50yrs Female Master’s Degree
51yrs and
above
Doctorial Degree
Qn1. Do you consider the following actions as efforts to correct project failure and make project work succeed in your company?
S/no Actions Strongly Disagree
Disagree Neutral Agree Strongly agree
a Planning
b Customer relationship
c Set targets
d Building optimal portfolio projects
e ongoing appraisals & reviews of projects
f projects benefits realization
g Run projects as ‘value centre’
h Maintain a core project management centre of excellence

Qn2. Do your business projects’ “value” indicators reflected in terms of the following financial and strategic
benefits.
S/no Financial “Value” indicators Strongly
Disagree
Disagree Neutral Agree Strongl
y agree
a Reductions in existing costs
b Reductions in other business costs
c Savings from reduced business investment
d Additional business revenue
e Improved cash flow
f Business revenue reductions avoided
g Business cost increases avoided
Strategic “Value” indicators Strongly
Disagree
Disagree Neutral Agree Strongl
y agree
a Improving the company’s image
b Increasing customer or retailer switching costs
c Increasing supplier leverage
d Facilitating business collaborations
e Introducing new products/services
f Changing business competition from being cost based
to being based on sustainable differentiation or
establishing new product distribution channels
competitive response
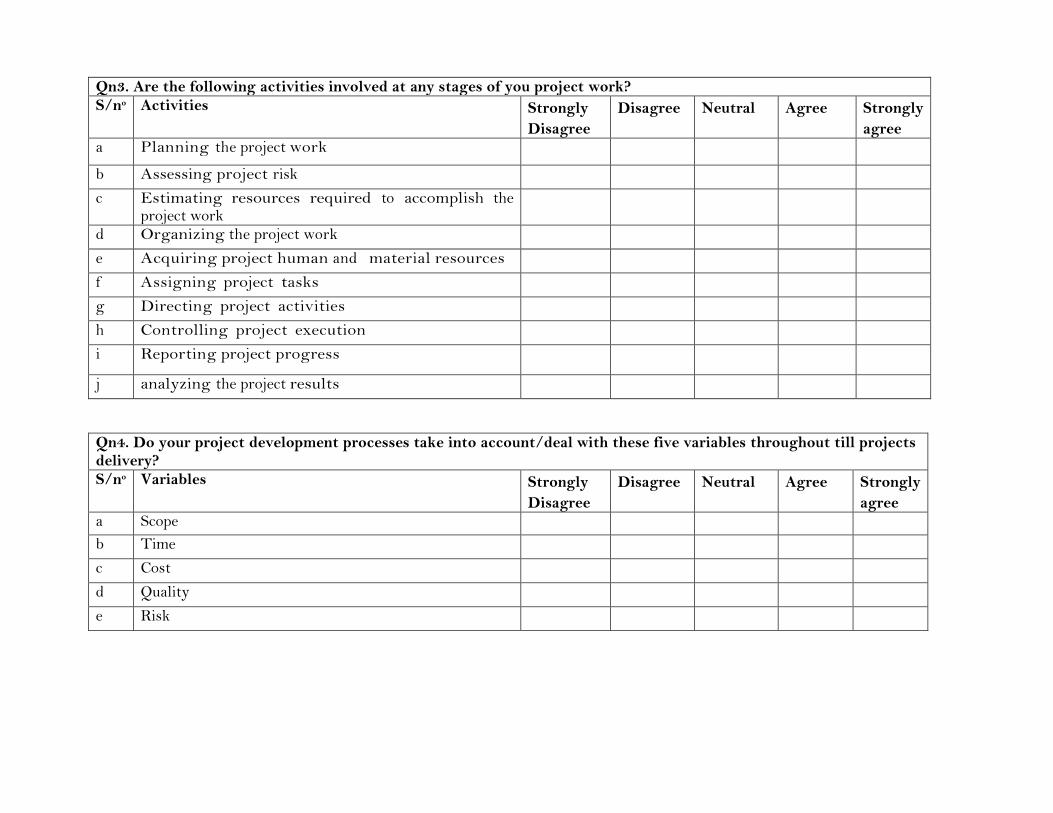
Qn3. Are the following activities involved at any stages of you project work?
S/no Activities Strongly
Disagree
Disagree Neutral Agree Strongly
agree a Planning the project work
b Assessing project risk
c Estimating resources required to accomplish the project work
d Organizing the project work
e Acquiring project human and material resources
f Assigning project tasks
g Directing project activities
h Controlling project execution
i Reporting project progress
j analyzing the project results
Qn4. Do your project development processes take into account/deal with these five variables throughout till projects delivery?
S/no Variables Strongly
Disagree
Disagree Neutral Agree Strongly
agree a Scope
b Time
c Cost
d Quality
e Risk

Qn
Qn5. Do your projects’ customer/supplier relationships focus on these principles?
S/no Principles Strongly
Disagree
Disagree Neutral Agree Strongly
agree a Supplier and the business he supports entering into a
pseudo-commercial relationship, with shared risk and reward to seek a commercially optimal outcome from projects.
b Not so fixated on delivering the project to budget and schedule that it neglects the real goal of delivering the promised benefits
c Project Sponsor becomes truly accountable for both the project costs incurred and the realization of the benefits.
Qn6. Do your projects’ incentives focus on the following principles?
S/no Principles Strongly
Disagree
Disagree Neutral Agree Strongly
agree a Project managers and staff set productive utilization
targets, their remuneration being partially driven by achievement of those targets but largely driven by the extent to which their projects go on to actually realize their promised benefits
b Project managers and staff agree realistic costs and benefits in the business case and focus their energies on sustaining the value of the project during development, not just delivering it to budget and schedule targets

Qn7. Do your projects focus on the following principles?
S/no Principles Strongly
Disagree
Disagree Neutral Agree Strongly
agree a Building commercially optimal portfolio of projects
during development and sustaining the value of that portfolio.
b Balance of business demand and supply through categorization, evaluation, acceptance, rejection and prioritization of ‘Work Change Requests’.
c Formal, ‘objective’ process by which work is managed into the supplier, understanding the true costs, true business benefits and the true risks of failing to deliver and realize those benefits.
d If the Business Case won’t stand up to true commercial scrutiny at the start of the project, no need to start it, certainly won’t stand up to this scrutiny by the end.
Qn8. Do your planning of projects focus on the following principles?
S/no Principles Strongly
Disagree
Disagree Neutral Agree Strongly
agree a Project work based on the key milestones that will
deliver business value (as opposed to inputs, tasks/activities and outputs)
b What has to be achieved irrespective of how you are going to achieve it; the how is addressed in the lower level task/activity plans to ensure that the ‘Big Picture’ (i.e. delivering the benefits) is not lost.

Qn9. Do your projects’ governance focus on these principles?
S/no Principles Strongly
Disagree
Disagree Neutral Agree Strongly
agree a Ongoing appraisals of a project to review and agree
significant proposed changes to determine if the project should be continued, re-scoped or terminated.
b During project delivery the business case for all or part of the project ‘goes negative’, in terms of failing to pass the ‘value hurdles’ then the goal is to terminate the development of that functionality to stop non-value-adding work at the earliest time possible
c Portfolio Managers, Project Directors/Sponsors and general Executives remain focused on the ‘Big Picture’ and report project plans across the organization in a consistent manner.
Qn10. Does your projects’ outcomes management focus on these principles?
S/no Principles Strongly
Disagree
Disagree Neutral Agree Strongly
agree a Project Managers take the view that whoever is
responsible for realizing the benefits from the project it certainly isn’t them; once the project is live and the initial service bugs are ironed out, their job is at an end
b Business and supplier are supposed to be working together to realize the promised business benefits; without the realization of the benefits the entire project is pointless
c Primary incentive is to deliver the functionality set out in the Functional Requirements Specification to budget and schedule, not to work with the customer to commercially prioritize the functional requirements and design the system to achieve the best commercial outcomes

Qn11. Does your projects’ business model focus on these principles?
S/no Principles Strongly
Disagree
Disagree Neutral Agree Strongly
agree a Run the project as a ‘value centre’. It’s overriding
objective being to add the maximum value to the business it serves
b Funding must largely be determined by affordability and success at projects’ value realization, i.e. there is a causal effect between demonstrably adding value to the business and funding levels
Qn12. Does your projects’ organization model focus on these principles?
S/no Principle Strongly
Disagree
Disagree Neutral Agree Strongly
agree a Projects must maintain a core ‘project management
centre of excellence’ from which project management professionals with minimal line management responsibilities are seconded to projects
Qn13. Do your executives play these roles when considering a new project?
S/no Roles Strongly
Disagree
Disagree Neutral Agree Strongly
agree a Set priority it should have
b Look at the available resources and lower the priority of other projects to make room for the new one

Qn14. Do your project sponsors use these approaches when considering a new project?
S/no Approaches Strongly
Disagree
Disagree Neutral Agree Strongly
agree a Define the end result the project should produce and how
he would measure it
b Engages managers to define major deliverables to the end result
Qn15. Do your project managers use the following approaches when considering a new project?
S/no approaches Strongly
Disagree
Disagree Neutral Agree Strongly
agree a Use methodology where priority # 1 projects get first
call on resources
b Follow project protocol for planning, scheduling, staffing, and tracking projects
Qn16. Do your project team members use these approaches when considering a new project?
S/no approaches Strongly
Disagree
Disagree Neutral Agree Strongly
agree a Make accurate estimates of the work and time
b Organization track assignments and clearly communicate to them which projects they should work on each week or project team members decide which projects to work on first

Qn17. Do your projects failure or success subject to reality perceptions from different stakeholders who perceive it as a failure, based on evidence of 5 criteria listed below? S/no Tailoring Extremes Strongly
Disagree
Disagree Neutral Agree Strongly
agree a Not delivering when it was expected
b Not delivering it at the cost expected
c Not delivering all the functionality that was expected
d Not delivering the functionality with the expected quality
e Not realizing the full business benefits
Qn18. Does your organization have a defined project management methodology!
Views
a i Yes ii No
b If No, Why?
Qn19. Do you think a project management methodology would help you deliver projects more successfully?
Views
a i Yes ii No
b Why?

Qn20. How much does your project management methodology contribute to the success, or failure, of your projects?
S/no Levels of Contribution Strongly
Disagree
Disagree Neutral Agree Strongly
agree a A methodology plays no role at all in whether or not a
project will succeed or fail
b A methodology plays a minor role in determining project success or failure
c A methodology plays a major role in determining project success or failure
d A project success or failure depends entirely on the methodology being used
Qn21. How often are your projects successful?
S/no Tailoring Extremes
With No Methodology
With Minor Tailoring
With Moderate Tailoring
With Mostly Tailored
With Completely Tailored
a Yes
b No
Qn22. How mature is your organization in relation to professional project management practices?
S/no Tailoring Extremes
With No Methodology
With Minor Tailoring
With Moderate Tailoring
With Mostly Tailored
With Completely Tailored
a Yes
b No
Thank You

Scope
Time Cost
ProjectHigher Purpose
Project Objectives
ProjectEnvironment
FlexibleConstraint
FlexibleConstraint
Driver Constraint
Fig. 6. TRIJECT model. The central presence of quality is signified by the outline shape of the TRIJECT model, which, using some imagination, resembles a capital letter ‘Q’. The rationale of the TRIJECT model is based on the achievement of the primary triple constraint variable through the exploitation of the two more flexible constraints and alignment with the project higher purpose. The continuous cycle implied by the model represents the ongoing and interrelated nature of this process as change is introduced into the system. Monitoring and controlling hence manifest a requisite part of this cycle. The model also accounts for the ancillary issues such as ‘the why’ of the project and change within the project environment as well as quality and control. In practice the TRIJECT model is expected to overlap and interact dynamically with the project management process groups. Details pertaining to the proposed protocol and application of the consolidated triple constraint model are documented in [7].
IV. CASE STUDY ANALYSIS
Evaluation of the TRIJECT model was limited to the exploratory review of the theoretical model and protocol against a simplified case in order to facilitate a conceptual understanding of the integrated model in practice. The observed case was the building project of the Smithsonian Institution, National Air and Space Museum (NASM) [6], [7]. There is no claim that this case is representative of the general project management milieu. A. Case paraphrases and system definition
The NASM project mission, essentially, was to build a world-class aviation and space museum for a budget of approximately USD 40 million and open it on July 4, 1976. The project mission statement satisfies the triple constraint, which is defined as follows: 1) Time constraint = July 4, 1976 2) Cost constraint = USD 40 million 3) Scope constraint = World-class museum.
A key part of the Smithsonian’s ability to get congressional funding unlocked for the project involved the national focus on the upcoming Bicentennial celebrations. National attention would be focused on Washington, D.C., and the National Mall during the festivities, and the President of the United States would be on hand to cut the ribbon. The consequences of missing the Bicentennial would have been hugely humiliating for the Smithsonian and for the NASM team. The time constraint has therefore been assigned in the lead position as the driver for this project. Before settling on the primary triple constraint variable, the critical question of why this project is being undertaken needs to be reviewed. The term ‘world-class’ may constitute a variety of potential meanings, each with different consequences for time and cost. For example, how many air and spacecraft should hang in the new building, or how complicated should the audiovisual exhibits be. The distinction between the work of the NASM and the project of the NASM needs to be considered. The project ends, but the work is ongoing. What must be done to meet the demands of opening day is only a prelude to the indefinite lifespan of the open museum. It can therefore be argued that the scope constraint, although probably the most important, is also the most flexible (weak) constraint for this project. The USD 40 million federal appropriation is a definite number, but not an exact one. Major construction projects often have a contingency reserve of up to 10% of the budget for change orders and other problems. Considering flexibility and following the process of elimination, cost may thus be identified as the middle constraint for this project. B. Case investigation and system analysis
The triple constraint compromise to manage was identified as the trade-off between the exploitation of the USD 40 million budget (the cost constraint), and the requirements / features that constitute a world-class museum (the scope constraint). The success of this project was driven by the deadline (the time constraint) to open the museum on the nation’s Bicentennial celebration July 4, 1976 in order to attain national focus (the higher purpose). With the project mission and triple constraint power structure defined, the TRIJECT model for the NASM project can be delineated as shown in Fig. 7.
Exploitation of the project budget (C↑) alleviates the pressure to rollback on the museum’s scope requirements, and supplements the effort to ensure that the deadline for opening the museum is met (more money and resources can be spent to get the same or more work accomplished within a limited period of time). The cost constraint includes both cash and non-cash resources. Exploitation of the project scope (S↓), on the other hand, alleviates the pressure to add additional cost and resources to the museum budget, but also supplements the effort to ensure that the deadline for opening the museum is met. Exploiting flexibility in the scope constraint should however not compromise quality, i.e. the museum’s
TRIJECT MODEL NASM CASE ANALYSIS

world-class criteria, which Congress values. One mechanism for exploiting the scope of the museum building program is to downsize selected objectives and quality metrics that do not add customer value.
Because it was simpler to exploit the ‘world-class’ scope requirements than it was to exploit the congressional budget, the system was initially located in the right half of Fig. 8, i.e. the flexibility of project scope outweighed the flexibility of project cost. The kinetics of Fig. 8 constitute a reverse congruency with respect to Fig. 5, focusing on exploitation causality rather than on constraints. The risk for the NASM case is that excessive manipulation of the scope requirements may eventually result in the benefits of this effort to disperse as the system moves into its downside (R-). This may put the project at risk to not deliver a world-class aviation and space museum, with inadequate artifacts and exhibits. As these disadvantages are being experienced, an increasing awareness may develop towards the advantages of budget exploitation (L+). This awareness may shift the focus of manipulation by sliding the exploitation weight up the seesaw from R- to L+. Accordingly, excessive manipulation of the budget requirements may again transition the system into its downside (L-). The consequent risk is that the project may be completed substantially over budget, and the project schedule may also be expected to slip due to the restoration of additional artifacts and the incorporation of complex exhibits. What is called for is a dynamic mechanism that may equilibrate the system as exploitation weight shifts and trade-offs are compromised during the project. C. Case discussion and system guidelines
In order to effectively manage the exploitation trade-off, the project manager needs to consider each of the benefits in the upper quadrants and define how to gain or maintain these advantages. A risk strategy is also required. The flexibility in the weaker constraints is not unlimited since there is always a minimum that must be achieved. The project manager needs to consider each of the disadvantages in the lower quadrants and define indicators that will alert the project team when the project dips into the red zone of over focusing the exploitation effort.
TimeT↓
CostC↑
ScopeS↓
NationalFocus
BicentennialCelebrations
ProjectEnvironment
Deadline Achieved
ExploitBudget
ExploitScope
Fig. 7. TRIJECT model for the NASM case.
Schedule
DEADLINE ACHIEVED
Exploit Budget
L+
L-
R+
R-
Exploit Scope
Fig. 8. System diagnosis of the NASM case [17].
The following considerations have been identified for obtaining and sustaining the positive results of the L+ quadrant of the NASM case: Find out what degree of budget overrun will be acceptable; Find out if contingency funds are available; Investigate if additional staff and equipment can be borrowed; Determine which costs will not be charged to the project; Establish how political influence can be achieved in order to pursue budget flexibility; Examine the consequences that the various interpretations of the ‘world-class’ requirement may have on the project; Identify the air and spacecraft which posses overwhelming historical significance; Discern how time and cost of artifact restorations can be optimized; Determine the appropriate requirement and level of complexity for the museum’s audiovisual exhibits; Take the law of diminishing returns into consideration. Retrospectively, the considerations to obtain and sustain the positive results of the R+ quadrant include: Establish effective and proven practices to efficiently manage and control the project budget; Identify those aspects of the project scope requirements that are not quality related; Target areas for exploitation where scope creep is detected; Reach a common understanding with the stakeholders on the importance they place on the delivery of each scope requirement, and ascertain the could-have’s and would-have’s; Ensure that the ‘world-class’ criterion is not dismissed due to excessive artifact and exhibit cutbacks; Investigate where initial objectives may be downsized, for example lowering the planned number of air and spacecraft for opening day; Determine quality metrics that do not add customer value, for example trimming back on complicated audiovisual exhibits. The following red zone indicators (early warnings) have been identified for when the project falls in the L- quadrant of the NASM case: Resistance from Congress regarding the increased project cost; Spending additional money and resources have reached the point where it no longer adds value to the project schedule, i.e. recognizing the law of diminishing returns; Artifact restorations and audiovisual exhibits fall behind schedule. The red zone indicators for when the project falls in the R- quadrant include: The ‘world-class’ requirement of the museum comes into question; Criticism regarding the appropriateness of artifacts and degree of exhibits. The project team needs to monitor these dynamics within the triple constraint power structure throughout the project life cycle. The timely identification of divergences

from the project higher purpose followed by the appropriate corrective actions is crucial. The NASM project might have benefited more by sustaining the positive results of both upper quadrants (green zone) and minimizing the time spent in the lower quadrants (red zone) – thus, delivering the project fast as well as relatively good and cheap (Fig. 9). A possible solution that effectively addresses this challenge is proposed in [17].
V. CONCLUSION The study of the triple constraint is believed to be one of the most overlooked fundamentals of project management. As a result of the various perspectives and interpretations across literature that surround the project management triangle and triple constraint, the need for a unified model has been identified. The TRIJECT model supports an understanding of finite resources and facilitates a mechanism for managing the competing triple constraint requirements. The model encourages the creative exploitation of the triple constraint to improve project performance by considering the relative flexibility between the key elements. The goal of the model is to maintain the focus of the triple constraint power structure on the project higher purpose. The case study presented has demonstrated that the integrated model may furnish the instruments that enable project teams to manage their work in line with the absolute requirements for project success. It should be taken in consideration that every project will experience its own unique limitations to exploitation capacity, which needs to be assessed through appropriate ‘cost’ vs. value impact analyses. Projects should however aim to always deliver to a much greater extent in terms of value than the sacrifice of the exploitation effort. An integrated framework is suggested in [17], which evolves the strategic management of the TRIJECT model using Polarity ManagementTM techniques. Supporting quantitative studies may be justified to conclude the real world pertinence of these conceptual models.
ACKNOWLEDGMENT
The support for research collaboration by the National Research Foundation (NRF) in South Africa is acknowledged.
ScheduleL- R-
DEADLINE ACHIEVED
L+ R+Exploit Budget Exploit Scope
Fig. 9. Effective management of the NASM case [17].
REFERENCES [1] G. M. Campbell, S. Baker, Project management. 4th ed.
New York, NY: Alpha, 2007. [2] P. W. Morris, G. H. Hough, The anatomy of major projects.
New York, NY: John Wiley & Sons, Inc., 1987. [3] J. T. Marchewka, Information technology project
management: Providing measurable organizational value. 2nd ed. Hoboken, NJ: John Wiley & Sons, Inc., 2006.
[4] Project Management Institute, A guide to the project management body of knowledge (PMBOK® Guide). 3rd ed. Newtown Square, PA: Project Management Institute, 2004.
[5] S. Barker, R. Cole, Brilliant project management: What the best project managers know, say and do. Harlow, UK: Pearson Prentice Hall Business, 2007.
[6] M. S. Dobson, H. Feickert, The six dimensions of project management: Turning constraints into resources. Vienna, VA: Management Concepts Inc., 2007.
[7] C. J. Van Wyngaard, “Effective management of the triple constraint in project management through polarity management techniques - a refreshed perspective,” M.Eng. dissertation, Eng. Mgmt. Program, Univ. of Johannesburg, South Africa, 2011.
[8] J. Kuster et al., “Project management handbook” (in German), Handbuch Projektmanagement. 2nd ed. Berlin, DE: Springer, 2008.
[9] J. Mihalic, “Fundamentals of project management,” course presentation, Professional Development Institute (PDI), Booz Allen Hamilton, American Society of Military Comptrollers (ASMC), 2007, unpublished.
[10] M. W. Newell, M. N. Grashina, The project management question and answer book. New York, NY: Amacom, 2003.
[11] J. A. Ward, “The key project constraints: Relationships and tradeoffs,” in Proc. 13th International Conference on Software Quality, Dallas, 2003.
[12] C. Chatfield, T. Johnson, “A short course in project management,” Microsoft Corporation, 2008, unpublished.
[13] R. Burke, Project management techniques. Oxford, UK: Burke Publishing, 2007.
[14] P. Flett, “The role of quality in the management of projects,” Ph.D. thesis, Univ. of Stirling, United Kingdom, 2001.
[15] J. L. Norrie, D. H. T. Walker, 2004, “A balanced scorecard approach to project management leadership,” Project Management Journal, vol. 35, no. 4, pp. 47-56, Dec. 2004.
[16] J. C. Collins, J. I. Porras, Built to last: Successful habits of visionary companies. New York, NY: HarperCollins Publishers, 1994.
[17] C. J. Van Wyngaard, J. H. C. Pretorius, L. Pretorius, “Strategic management of the triple constraint trade-off dynamics - a polarity management approach,” in Proc. IEEE International Conference on Industrial Engineering and Engineering Management (IEEM), Singapore, pp. 824-828, Dec. 2011.
[18] S. E. E. Elmaghraby, W. S. Herroelen, R. Leus, 2002, “Notes on the paper ‘Resource-constrained project management using enhanced theory of constraint’ by Wei et al.,” International Journal of Project Management, no. 21, pp. 301-305, 2003.
[19] A. S. Koch, “We cannot trade quality for schedule or budget,” Global Knowledge Training LLC, Expert Reference Series of White Papers, 2006, unpublished.
[20] J. R. Meridith, J. S. Mantel, Project Management: A managerial approach. 4th ed. New York, NY: John Wiley & Sons, Inc., 2000.

©2014 Project Management Institute, Inc.
� Project selection, justification and approval process
� Project phases, stage gates and/or milestones
� Project governance
� Project sponsorship
� Delegated authority limits
� Project roles and responsibilities
� Business case preparation
� Project charter preparation
� Project management software selection
� Requirements definition, management and control
� Work breakdown structure development and control
� Scope definition, management and control
� Cost estimating, management and control
� Budget development and control
� Project financial processes
� Schedule estimating, management and control
� Monitoring project performance, metrics/KPIs, reporting
� Managing project scope changes
� Project status reporting
� Quality assurance processes
� Process audit procedures
� Quality control processes
� Risk assessment, management and control
� Resource estimation, leveling and management
� Project team formation and development
Use this checklist to determine which elements the tailored project management methodology should have.
� Project communications development, distribution and control
� Stakeholder identification, engagement and management
� Customer engagement and management
� Procurement and contract assessment and management
� Vendor management
� Claims administration and resolution
� Health and safety
� Environmental management
� Deliverable acceptance procedure
� Operational handover process
� Project, or phase, closure process and checklist
� Gathering, documenting and evaluation of lessons learned
� Benefits realization and/or post implementation review process
� Methodology tailoring guidelines
� Project change management
� Project complexity assessment
� Form templates
Project Management Methodology Checklist

©2014 Project Management Institute, Inc.
Use this example process flow chart as a guide to develop the project management methodology process flow chart for the organization.
P7: Benefits Realization:
Examine and document outcomes and benefits
delivered. Do they match the original intended
benefits?
Output: Benefits realization report, post implementation
review, continuous improvement.
FinalDeliverables
P3: Execute the Plans:
Carry out the work described in the various
planning documents.
Output: Project and product deliverables
described in the plans.
Project Approval
P1: Project Selection and Justification:
Choose the right projects for the right reasons. Document expected
benefits.
Output: Business case, project charter, work order,
project approval documents, etc.
P2: Project Planning:
Complete the right amount of planning in all the
appropriate and relevant areas. Replan as required.
Output: Project management plan,
individual plans, baselines, project documents.
P6: Close the Project:
Complete project closure according to the planned
checklist.
Output: Project and product acceptance, lessons
learned.
P5: Report Progress:
Produce project reports detailing how the
projectis progressing against planned metrics.
Output: Project status reports.
P4: Check and Control Changes:
Check that what you planned to do matches what you are doing. Act
according to documented change control process if
they don’t match.
Output: Corrective actions, change requests, project plans, baseline,
and document updates.
Methodology Process Flow Chart

0900 MINAGRI 734,066,982,936 99,175,236,27601 DOMESTIC FINANCING 400,884,510,929 45,494,884,742RWANDA Agriculture 400,884,510,929 45,494,884,742
1 09060102 LWH : LAND HUSBANDRY HILLSIDE IRRIGATION AND WATER HARVESTING
Agriculture4,174,435,000 6-Feb-10 30-Jun-17 200,000,000
2 09060201 RSSP : RURAL SECTOR SUPPORT PROJECT (PHASE II) Agriculture 3,000,000,000 20-Jun-12 30-Oct-17 200,000,0003 09060202 PROJECT: IMMEDIATE ACTION IRRIGATION PROJECT (GFI) Agriculture 4,180,000,000 1-Jul-14 30-Jun-15 4,180,000,0004 09060204 PAIRB: PROJET D'APPUI AUX INFRASTRUCTURES RURALES DE LA
REGION NATURELLE DE BUGESERAAgriculture
150,000,000 16-Oct-09 31-Dec-15 150,000,000
08 EXTERNAL GRANTSAFRICAN DEVELOPMENT BANK ADB Agriculture 13,151,166,700 3,698,956,59109060204 PAIRB: PROJET D'APPUI AUX INFRASTRUCTURES RURALES DE LA REGION NATURELLE DE BUGESERA
Agriculture13,151,166,700 16-Oct-09 31-Dec-15 3,698,956,591
01 DOMESTIC FINANCING5 09060205 KWAMP: KIREHE WATERSHED MANAGEMENT PROJECT Agriculture 15,020,911,500 30-Apr-09 30-Jun-16 250,000,000
08 EXTERNAL GRANTSFIDA Agriculture 21,369,305,893 3,685,342,62009060205 KWAMP: KIREHE WATERSHED MANAGEMENT PROJECT Agriculture 21,369,305,893 30-Apr-09 30-Jun-16 3,685,342,62001 DOMESTIC FINANCING
6 09060208 FEEDER ROADS DEVELOPMENT PROJECT Agriculture 100,000,000 1-Jul-14 30-Jun-15 100,000,0007 09060209 RURAL COMMUNITY SUPPORT ( KOICA FUNDED PROJECT) Agriculture 20,000,000 1-Jul-14 30-Jun-15 20,000,0008 09060210 NGOMA 22( JICA FUNDED PROJECT) Agriculture 150,000,000 1-Jul-14 30-Jun-15 150,000,0009 09060301 PROJECT: AGRICULTURAL MECHANISATION PROGRAMME Agriculture 200,000,000 1-Jul-14 30-Jun-15 200,000,000
10 09060401 PROJECT: PRIORITY CROPS INTENSIFICATION (INCLUDING FERTILIZER
IMPORTS)Agriculture
9,366,745,012 1-Jul-14 30-Jun-15 8,366,745,012
11 09060514 GAKO BEEF FARM Agriculture 918,056,505 1-Jul-14 30-Jun-15 918,056,50512 09070303 SUPPORT TO STRATEGIC PLAN FOR AGRICULTURE TRANSFORMATION II
(SPAT II)Agriculture
216,941,567 1-Jul-11 30-Jun-16 216,941,567
08 EXTERNAL GRANTS 15,820,911,500 2,050,000,000BELGIUM Agriculture 16,872,456,600 2,384,418,58909070303 SUPPORT TO STRATEGIC PLAN FOR AGRICULTURE TRANSFORMATION II (SPAT II)
Agriculture16,872,456,600 1-Jul-11 30-Jun-16 2,384,418,589
01 DOMESTIC FINANCING13 09080304 PROJECT: SERICULTURE Agriculture 50,000,000 1-Jul-14 30-Jun-15 50,000,00014 09080305 PROJECT FOR RURAL INCOME THROUGH EXPORTS (PRICE) Agriculture 12,001,187,486 20-Dec-11 31-Dec-18 150,000,000
08 EXTERNAL GRANTSINTERNATIONAL FUND FOR AGRICULTURAL DEVELOPMENT IFAD FIDA Agriculture09080305 PROJECT FOR RURAL INCOME THROUGH EXPORTS (PRICE) Agriculture 12,863,660,944 20-Dec-11 31-Dec-18 1,925,577,77601 DOMESTIC FINANCING
15 09080902 NATIONAL STRATEGIC FOOD RESERVE PROJECT Agriculture 700,000,000 1-Jul-14 30-Jun-15 1,700,000,00016 09080903 LIVESTOCK INFRASTRUCTURE SUPPORT PROGRAM( LISP) Agriculture 20,261,356,000 16-Dec-11 31-Dec-15 2,250,000,00017
09060207 EXPORT TARGETED MODERN IRRIGATED AGRICULTURE PROJECT(ETI) Agriculture50,000,000 1-Jan-14 1-Jan-17 50,000,000
09 EXTERNAL LOANSINDIA Agriculture 82,429,800,000 1,377,600,000
09060207 EXPORT TARGETED MODERN IRRIGATED AGRICULTURE PROJECT(ETI) Agriculture82,429,800,000 1-Jan-14 1-Jan-17 1,377,600,000
01 DOMESTIC FINANCING18 09070305 POST HARVEST AND AGRIBUSINESS SUPPORT PROJECT(PASP) Agriculture 33,994,847,028 28-Mar-14 31-Mar-19 74,928,282
09 EXTERNAL LOANSINTERNATIONAL FUND FOR AGRICULTURAL DEVELOPMENT IFAD FIDA Agriculture 21,269,029,346 3,500,445,25909070305 POST HARVEST AND AGRIBUSINESS SUPPORT PROJECT(PASP) Agriculture 9,267,841,860 28-Mar-14 31-Mar-19 3,350,445,25908 EXTERNAL GRANTS 131,350,357,685 27,542,600,685INTERNATIONAL DEVELOPMENT ASSOCIATION Agriculture 57,825,925,688 13,087,200,000
19 09060102 LWH : LAND HUSBANDRY HILLSIDE IRRIGATION AND WATER HARVESTING
Agriculture57,825,925,688 6-Feb-10 30-Jun-17 13,087,200,000
INTERNATIONAL FUND FOR AGRICULTURAL DEVELOPMENT IFAD FIDA Agriculture 22,131,502,804 4,686,682,88520 09070305 POST HARVEST AND AGRIBUSINESS SUPPORT PROJECT(PASP) Agriculture 9,267,841,860 28-Mar-14 31-Mar-19 2,761,105,109
09 EXTERNAL LOANS 201,832,114,322 26,137,750,849FIDA Agriculture 12,863,660,944 1,925,577,775
21 09080305 PROJECT FOR RURAL INCOME THROUGH EXPORTS (PRICE) Agriculture 12,863,660,944 20-Dec-11 31-Dec-18 1,925,577,775INTERNATIONAL DEVELOPMENT ASSOCIATION Agriculture 89,148,936,912 17,422,315,348
22 09060102 LWH : LAND HUSBANDRY HILLSIDE IRRIGATION AND WATER
HARVESTINGAgriculture
30,416,436,912 6-Feb-10 30-Jun-17 8,659,612,362
23 09060201 RSSP : RURAL SECTOR SUPPORT PROJECT (PHASE II) Agriculture 58,732,500,000 20-Jun-12 30-Oct-17 8,762,702,986INTERNATIONAL FUND FOR AGRICULTURAL DEVELOPMENT IFAD FIDA Agriculture 17,389,716,467 5,412,257,726
24 09060205 KWAMP: KIREHE WATERSHED MANAGEMENT PROJECT Agriculture 8,121,874,607 30-Apr-09 30-Jun-16 2,061,812,4670901 RWANDA AGRICULTURAL BOARD (RAB) 9,665,104,816 8,763,498,39601 DOMESTIC FINANCING 6,546,599,281 6,546,599,281RWANDA Agriculture 6,546,599,281 6,546,599,281
25 09060402 ROJECT: PRIORITY CROPS INTENSIFICATION (INCLUDING FERTILIZER IMPORTS)
Agriculture2,691,563,276 1-Jul-14 30-Jun-15 2,691,563,276
26 09060505 PROJECT: ONE COW PER FAMILY Agriculture 1,085,000,000 1-Jul-14 30-Jun-15 1,085,000,00027 09060512 AQUACULTURE AND FISHERIES DEVELOPMENT PROJECT Agriculture 45,372,700 1-Jul-14 30-Jun-15 45,372,70028 09060513 LIVESTOCK INTENSIFICATION PROJECT Agriculture 757,663,305 1-Jul-14 30-Jun-15 757,663,30529 09060602 ONE CUP OF MILK PER CHILD Agriculture 1,950,000,000 1-Jul-14 30-Jun-15 1,950,000,00030 09070118 SAFEGUARDING NATIONAL GENETIC RESOURCES FOR FOOD SECURITY
AND SUSTAINABLE EVELOPMENTAgriculture
17,000,000 1-Jul-14 30-Jun-15 17,000,000
08 EXTERNAL GRANTS 2,216,899,115 2,216,899,115BASKET FUND FOR AGRICULTURE RESEARCH Agriculture 2,216,899,115 2,216,899,115
31 09070142 BASKET FUND FOR AGRICULTURE RESEARCH ACTIVITIES UNDER HARVEST PLUS PROGRAM SUPPORTED
Agriculture2,216,899,115 1-Jul-14 30-Jun-15 2,216,899,115
OTHER EXTRA BUDGETARY 901,606,420 0BASKET FUND FOR AGRICULTURE RESEARCH Agriculture 901,606,420 0
32 09070142 BASKET FUND FOR AGRICULTURE RESEARCH ACTIVITIES UNDER HARVEST PLUS PROGRAM SUPPORTED
Agriculture901,606,420 1-Jul-14 30-Jun-15
0902 NATIONAL AGRICULTURAL EXPORT DEVELOPMENT BOARD (NAEB) 3,817,806,323 3,817,806,32301 DOMESTIC FINANCING 3,817,806,323 3,817,806,323
2014/15 Revised Budget
AGENCY AND PROJECT NAME ECONOMIC SECTOR
PROJECT TOTAL COST START DATE END DATE

RWANDA Agriculture 3,817,806,323 3,817,806,32333 09080101 PROJECT: FLOWER PARK CONSTRUCTION Agriculture 696,913,607 1-Jul-14 30-Jun-15 696,913,60734 09080301 PROJECT: IMPROVING COFFEE PRODUCTION, PRODUCTIVITY AND
QUALITYAgriculture
427,031,030 1-Jul-14 30-Jun-15 427,031,030
35 09080302 PROJECT: COMMODITY CHAIN PROGRAMME (HORTICULTURE INTENSIFICATION AND QUALITY MANAGEMENT)
Agriculture351,405,912 1-Jul-14 30-Jun-15 351,405,912
36 09080307 TEA EXPANSION PROJECT Agriculture 642,645,660 1-Jul-14 30-Jun-15 642,645,66037
09080308 INCREASING PYRETHRUM PRODUCTION,PRODUCTIVITY AND QUALITY Agriculture57,814,850 1-Jul-14 30-Jun-15 57,814,850
38 09080309 DEVELOPMENT OF NEW AGRICULTURE EXPORT CHAIN Agriculture 127,440 1-Jul-14 30-Jun-15 127,44039 09080310 NAEB TEA EXPANSION Agriculture 1,500,000,000 1-Jul-14 30-Jun-15 1,500,000,00040 09080901 KIGALI WHOLESALES MARKET Agriculture 141,867,824 1-Jul-14 30-Jun-15 141,867,824
DEVELOPMENT BANK OF RWANDA (BRD) PROJECTS IN TOTAL NUMBER 248 FOR THE YEAR 2015 Agriculture 15,162,800,421 15,162,800,421
1803 ENERGY, WATER AND SANITATION AUTHORITY (EWSA) 37,512,741,240 37,512,741,24001 DOMESTIC FINANCING 37,512,741,240 37,512,741,240
RWANDA Manufacturing16,929,740,641 16,929,740,641
41 18130101 PROJECT: CONSTRUCTION OF NYABARONGO HYDRO POWER STATIONS (27 MW)
Manufacturing4,320,672,832 1-Jul-14 30-Jun-15 4,320,672,832
4218130105 ENERGY PROJECTS IMPLEMENTATION SUPPORT Manufacturing
406,752,160 1-Jul-14 30-Jun-15 406,752,160
4318130107 INCREASE OF RURAL ENERGY ACCESS TO ELECTRICITY THROUGH PPP Manufacturing
48,360,488 1-Jul-14 30-Jun-15 48,360,488
4418130108 GEOTHERMAL RESOURCE DEVELOPMENT Manufacturing
293,765,596 1-Jul-14 30-Jun-15 0
4518130109 DEVELOPMENT OF PEAT TO POWER PLANT Manufacturing
159,327,415 1-Jul-14 30-Jun-15 159,327,415
4618130113 RUKARARA I Manufacturing
59,164,378 1-Jul-14 30-Jun-15 59,164,378
4718130114 6 MICRO HYDRO POWER Manufacturing
194,750,951 1-Jul-14 30-Jun-15 194,750,951
4818130119 TAX EXPENDITURES FOR ENERGY PROJECTS Manufacturing
7,014,396,620 1-Jul-14 30-Jun-15 7,014,396,620
4918130120 KIVUWATT Manufacturing
199,167,972 1-Jul-14 30-Jun-15 199,167,972
50 18130122 FEASIBILITY STUDY FOR MULTPURPOSE DEVELOPMENT PROJECT
NYABARONGO IIManufacturing
109,835,949 1-Jul-14 30-Jun-15 109,835,949
51 18130152 REHABILITATION OF 3 HYDRO POWER STATIONS : MUKUNGWA 1, GIHIRA ET GISENYI (BADEA/OPEC)
Manufacturing66,147,000 1-Jul-14 30-Jun-15 359,912,596
5218130201 CONSTRUCTION OF NATIONAL WIDETRANSMISSION LINE Manufacturing
1,039,279,516 1-Jul-14 30-Jun-15 1,039,279,516
53 18130218 PROJECT: ELECTRICITY ROLL OUT PROGRAM (ELECTRICITY ACCESS
SCALE UP/WB&OFID)Manufacturing
328,989,115 1-Jul-14 30-Jun-15 328,989,115
5418130301 IMPROVE BIOMASS USE EFFICIENCY Manufacturing
523,431,072 1-Jul-14 30-Jun-15 523,431,072
5518140102 RURAL WATER SUPPLY AND SANITATION II (PRSC-PEAMER) Manufacturing
526,443,494 1-Jul-14 30-Jun-15 526,443,494
5618140104 WATER PROJECTS IMPLEMENTATION SUPPORT Manufacturing
258,883,303 1-Jul-14 30-Jun-15 258,883,303
5718140111 RULINDO CHALLENGE PROGRAMME Manufacturing
288,962,102 24-Oct-10 30-Jun-18 288,962,102
5818140116 TAX EXPENDITURES FOR WATER PROJECTS Manufacturing
176,896,709 1-Jul-14 30-Jun-15 176,896,709
59 18140101 NATIONAL RURAL WATER SUPPLY AND SANITATION PROGRAMME (PNEAR)
Manufacturing283,000,000 1-Jul-14 30-Jun-15 283,000,000
6018140103 WATER SANITATION AND HYGIENE Manufacturing
60,000,000 1-Jul-14 30-Jun-15 60,000,000
61 18140105 LAKE VICTORIA WATER SUPPLY AND SANITATION PROJECT PHASE II
(LVWATSAN II)Manufacturing
30,000,000 1-Jul-14 30-Jun-15 30,000,000
62 18140118 EXPROPRIATION FOR WATSAN IN BUGESERA-KARENGE AND OTHER INTERVENTIONS AREAS PROJECT
Manufacturing32,225,714 1-Jul-14 30-Jun-15 32,225,714
6318140174 WATER SUPPLY IN BUTARE 2EME PHASE Manufacturing
288,401,955 1-Jul-14 30-Jun-15 288,401,955
6418140184 IMPROVEMENT OF URBAN WATER SUPPLY Manufacturing
220,886,300 1-Jul-14 30-Jun-15 220,886,300
EXTERNAL SOVEREIGN BONDS 20,583,000,599 20,583,000,59965
18130108 GEOTHERMAL RESOURCE DEVELOPMENT Manufacturing5,647,219,786 1-Jul-14 30-Jun-15 5,647,219,786
6618130109 DEVELOPMENT OF PEAT TO POWER PLANT Manufacturing
3,567,651,170 1-Jul-14 30-Jun-15 3,567,651,170
6718130202 ELECTRIFICATION OF 6 DISTRICTS IN EASTERN PROVINCE WITH STEG Manufacturing
11,368,129,643 1-Jul-14 30-Jun-15 11,368,129,643
1806 ENERGY DEVELOPMENT CORPORATION (EDCL)
01 DOMESTIC FINANCING Manufacturing278,061,147,310 68,735,761,832
RWANDA Manufacturing278,061,147,310 68,735,761,832
68 18130101 PROJECT: CONSTRUCTION OF NYABARONGO HYDRO POWER STATIONS (27 MW)
Manufacturing12,036,000,000 20-May-09 30-Aug-14 5,935,437,405
09 EXTERNAL LOANS
IMPORT EXPORT BANK OF INDIA Manufacturing54,400,000,000 3,251,941,956
18130101 PROJECT: CONSTRUCTION OF NYABARONGO HYDRO POWER STATIONS (27 MW)
Manufacturing54,400,000,000 20-May-09 31-Mar-15 3,251,941,956
6918130105 ENERGY PROJECTS IMPLEMENTATION SUPPORT Manufacturing
559,459,041 1-Jul-14 30-Jun-15 559,459,041
7018130107 INCREASE OF RURAL ENERGY ACCESS TO ELECTRICITY THROUGH PPP Manufacturing
7,335,771,484 1-Jul-14 30-Jun-15 424,139,512

08 EXTERNAL GRANTSEUROPEAN UNION
18130107 INCREASE OF RURAL ENERGY ACCESS TO ELECTRICITY THROUGH PPP Manufacturing8,367,910,607 27-Apr-07 31-Dec-16 1,135,855,150
7118130108 GEOTHERMAL RESOURCE DEVELOPMENT Manufacturing
600,000,000 1-Jul-14 30-Jun-15 600,000,000
7218130109 DEVELOPMENT OF PEAT TO POWER PLANT Manufacturing
1,008,752,090 1-Jul-14 30-Jun-15 1,008,752,090
7318130110 SOLAR PV SYSTEM IN 60 RURAL SECONDARY SCHOOLS Manufacturing
342,000,000 1-Jul-14 30-Jun-15 342,000,000
7418130112 PROJECT: LAKE KIVU MONITORING AND MANAGEMENT PROJECT Manufacturing
403,000,000 1-Jul-14 30-Jun-15 403,000,000
08 EXTERNAL GRANTS
NETHERLAND Manufacturing7,536,856,153 3,363,196,922
18130112 PROJECT: LAKE KIVU MONITORING AND MANAGEMENT PROJECT Manufacturing6,981,493,386 29-Dec-11 31-Dec-17 2,807,834,155
7518130113 RUKARARA I Manufacturing
555,362,767 1-Jul-14 30-Jun-15 555,362,767
7618130114 6 MICRO HYDRO POWER Manufacturing
641,249,049 1-Jul-14 30-Jun-15 641,249,049
7718130119 TAX EXPENDITURES FOR ENERGY PROJECTS Manufacturing
3,564,753,380 1-Jul-14 30-Jun-15 3,564,753,380
7818130120 KIVUWATT Manufacturing
1,800,832,028 1-Jul-14 30-Jun-15 1,800,832,028
79 18130122 FEASIBILITY STUDY FOR MULTPURPOSE DEVELOPMENT PROJECT NYABARONGO II
Manufacturing1,239,583,848 1-Jul-14 30-Jun-15 1,239,583,848
80 18130152 REHABILITATION OF 3 HYDRO POWER STATIONS : MUKUNGWA 1, GIHIRA ET GISENYI (BADEA/OPEC)
Manufacturing2,491,635,000 1-Jul-14 30-Jun-15 993,765,596
09 EXTERNAL LOANS
ARAB DEVELOPMENT BANK BADEA Manufacturing5,036,780,000 1,033,200,000
18130152 REHABILITATION OF 3 HYDRO POWER STATIONS : MUKUNGWA 1,
GIHIRA ET GISENYI (BADEA/OPEC)Manufacturing
5,036,780,000 23-Feb-05 31-Mar-15 1,033,200,000
OPEC FUND FOR INTERNATIONAL DEVELOPMENT Manufacturing2,158,620,000 1,214,932,069
18130152 REHABILITATION OF 3 HYDRO POWER STATIONS : MUKUNGWA 1, GIHIRA ET GISENYI (OPEC)
Manufacturing2,158,620,000 23-Feb-05 31-Mar-15 1,214,932,069
01 DOMESTIC FINANCING81
18130154 CONSTRUCTION OF 50MW DIESEL (HFO) POWER PLANT Manufacturing1,600,000,000 1-Jul-14 30-Jun-15 1,600,000,000
8218130201 CONSTRUCTION OF NATIONAL WIDETRANSMISSION LINE Manufacturing
4,217,907,953 1-Jul-14 30-Jun-15 4,217,907,953
8318130217 STREET LIGHTING Manufacturing
2,664,958,249 1-Jul-14 30-Jun-15 2,664,958,249
84 18130218 PROJECT: ELECTRICITY ROLL OUT PROGRAM (ELECTRICITY ACCESS
SCALE UP/WB&OFID)Manufacturing
246,659,788 1-Jul-14 30-Jun-15 246,659,788
08 EXTERNAL GRANTSAFRICAN DEVELOPMENT BANK ADB18130218 PROJECT: ELECTRICITY ROLL OUT PROGRAM (ELECTRICITY ACCESS
SCALE UP/WB&OFID)Manufacturing
27,730,400,000 30-Jan-14 31-Aug-18 4,763,688,874
AFD 018130218 PROJECT: ELECTRICITY ROLL OUT PROGRAM (ELECTRICITY ACCESS SCALE UP/WB&OFID)
Manufacturing2,760,000,000 28-Sep-10 31-Dec-14
01 DOMESTIC FINANCING85 18130220 IMPROVING ACCESS TO RELIABLE ON-GRID ELECTRICITY SERVICES FOR
HOUSEHOLDS AND PRIORITY PUBLIC INSTITUTIONS - BELGIAN CONTRIBUTION TO
EARP
Manufacturing1,456,063,475 1-Jul-14 30-Jun-15 79,564,730
08 EXTERNAL GRANTS
BELGIAN TECHNICAL COOPERATION - BTC Manufacturing14,174,716,485 193,073,601
18130220 IMPROVING ACCESS TO RELIABLE ON-GRID ELECTRICITY SERVICES FOR HOUSEHOLDS AND PRIORITY PUBLIC INSTITUTIONS - BELGIAN CONTRIBUTION TO EARP
Manufacturing14,174,716,485 19-Dec-07 18-Dec-14 193,073,601
01 DOMESTIC FINANCING86 18130222 400KV STANDARDIZATION LINE FOR KENYA-UGANDA -RWANDA
INTERCONNECTION PROJECTManufacturing
475,700,000 1-Jul-14 30-Jun-15 475,700,000
8718130301 IMPROVE BIOMASS USE EFFICIENCY Manufacturing
172,619,409 1-Jul-14 30-Jun-15 172,619,409
8818130403 PROJECT: REHABILIATION OF RWABUYE FUEL STORAGE Manufacturing
686,274,234 1-Jul-14 30-Jun-15 686,274,234
8918130102 FEASISIBILITY STUDY AND CONSTRUCTION OF NEW MHPS Manufacturing
2,609,967,724 1-Jul-14 30-Jun-15 2,609,967,724
9018130108 GEOTHERMAL RESOURCE DEVELOPMENT Manufacturing
10,261,866,773 1-Jul-14 30-Jun-15 10,261,866,773
9118130109 DEVELOPMENT OF PEAT TO POWER PLANT Manufacturing
1,988,620,957 1-Jul-14 30-Jun-15 1,988,620,957
9218130115 CONSTRUCTION OF KEYA MICRO HYDROPOWER PLANT PROJECT Manufacturing
350,000,000 1-Jul-14 30-Jun-15 350,000,000
9318130202 ELECTRIFICATION OF 6 DISTRICTS IN EASTERN PROVINCE WITH STEG Manufacturing
976,416,945 1-Jul-14 30-Jun-15 976,416,945
94 18130227 MULTINATIONAL-INTERCONNECTION OF ELECTRICAL GRIDS OF NILE EQUATORIAL LAKES COUNTRIES(CONSTRUCTION OF 220KV ELECTRIC KIBUYE-
GISENYI-GOMA-SHANGO-BIREMBO AND ASSOCIATED SUBSTATIONS)
Manufacturing12,858,800,000 16-Mar-09 13-Dec-15 880,000,001
08 EXTERNAL GRANTS18130226 MULTINATIONAL-INTERCONNECTION OF ELECTRICAL GRIDS OF NILE EQUATORIAL LAKES COUNTRIES
Manufacturing15,340,143,408 16-Mar-09 31-Mar-16 14,923,580,047
KFW AND NERTHERLAND Manufacturing64,048,616,105 7,707,130,791

18130228 MULTINATIONAL-INTERCONNECTION OF ELECTRICAL GRIDS OF NILE EQUATORIAL LAKES COUNTRIES(CONSTRUCTION OF KIGOMA/RWANDA-NGOZI/BURUNDI 220/110KV ELECTRIC LINE AND ASSOCIATED SUBSTIONS)
Manufacturing64,048,616,105 16-Mar-09 31-Jan-16 7,707,130,791
NETHERLAND95 18130237 ELECTRICITY ACCESS ROLLOUT PROGRAM
Manufacturing32,454,022,175 25-Jun-09 31-Mar-15
09 EXTERNAL LOANS
OPEC AND SAUDI FUND Manufacturing22,170,080,000 2,718,133,643
18130237 ELECTRICITY ACCESS ROLLOUT PROGRAM/OPEC Manufacturing22,170,080,000 22-Jun-10 31-Mar-15 2,718,133,643
WORLD BANK Manufacturing11,160,400,000 2,410,800,000
9618130435 SUSTAINABLE ENERGY DEVELOPMENT (GEF) Manufacturing
11,160,400,000 28-Sep-10 31-Dec-15 2,410,800,000
WORLD BANK Manufacturing402,279,500,001 16,769,746,060
9718130104 CONSTRUCTION OF 90 MW RUSUMO FALLS HYDROPOWER PROJECT Manufacturing
312,756,300,001 4-Oct-13 31-Dec-20 3,298,899,948
9818130238 ELECTRICITY ACCESS ROLLOUT PROGRAMME / WB Manufacturing
89,523,200,000 9-Jun-10 30-Jun-16 13,470,846,112
1807 WATER AND SANITATION CORPORATION (WASAC)01 DOMESTIC FINANCINGRWANDA
9918140102 RURAL WATER SUPPLY AND SANITATION II (PRSC-PEAMER) Manufacturing
1,663,262,858 1-Jul-14 30-Jun-15 1,362,332,858
10018140104 WATER PROJECTS IMPLEMENTATION SUPPORT Manufacturing
341,116,697 1-Jul-14 30-Jun-15 341,116,697
10118140111 RULINDO CHALLENGE PROGRAMME Manufacturing
2,825,181,818 24-Oct-10 30-Jun-18 294,266,323
08 EXTERNAL GRANTS
OTHER NGO - NON GOVERNMENT ORGANISATIONS Manufacturing5,179,500,000 585,886,802
18140111 RULINDO CHALLENGE PROGRAMME Manufacturing5,179,500,000 24-Oct-10 30-Jun-18 585,886,802
102 18140112 OPTIMIZED PRODUCTION OF NYABARONGO GROUND WATER TREATMENT PLANT
Manufacturing20,000,000 1-Jul-14 30-Jun-15 0
10318140113 RURAL DRINKING WATER QUALITY CONTROL PROJECT Manufacturing
175,000,000 1-Jul-14 30-Jun-15 142,646,291
10418140116 TAX EXPENDITURES FOR WATER PROJECTS Manufacturing
485,594,647 1-Jul-14 30-Jun-15 485,594,647
105 18140118 EXPROPRIATION FOR WATSAN IN BUGESERA-KARENGE AND OTHER INTERVENTIONS AREAS PROJECT
Manufacturing68,778,416 1-Jul-14 30-Jun-15 68,778,416
10618140174 WATER SUPPLY IN BUTARE 2EME PHASE Manufacturing
3,112,579,000 1-Jul-14 30-Jun-15 1,282,191,943
OPEC FUND FOR INTERNATIONAL DEVELOPMENT Manufacturing3,000,733,316 691,425,375
18140174 WATER SUPPLY IN BUTARE 2EME PHASE Manufacturing3,000,733,316 31-Dec-08 31-Mar-15 691,425,375
107 18140175 STUDIES FOR CLEAN WATER SUPPLY IN 7 SECONDARY TOWNS:
MUHANGA, NGOMA, RUSIZI, GICUMBI, KARONGI, NYANZA ET RUBAVUManufacturing
50,000,000 1-Jul-14 30-Jun-15 13,900,000
10818140184 IMPROVEMENT OF URBAN WATER SUPPLY Manufacturing
1,079,213,700 1-Jul-14 30-Jun-15 1,115,313,700
10918140185 KIGALI BULK WATER SUPPLY Manufacturing
83,000,000 1-Jul-14 30-Jun-15 82,461,386
11018140201 IMPROVEMENT OF SANITATION IN URBAN AREAS Manufacturing
100,000,000 1-Jul-14 30-Jun-15 100,000,000
111 18140101 NATIONAL RURAL WATER SUPPLY AND SANITATION PROGRAMME (PNEAR)
Manufacturing3,505,104,950 1-Jul-14 30-Jun-15 517,000,000
08 EXTERNAL GRANTS
AFRICAN DEVELOPMENT BANK ADB Manufacturing30,062,112,350 4,525,664,000
18140101 NATIONAL RURAL WATER SUPPLY AND SANITATION PROGRAMME (PNEAR)
Manufacturing16,654,404,950 12-Mar-10 31-Mar-16 1,233,200,000
11218140103 WATER SANITATION AND HYGIENE Manufacturing
1,680,000,000 1-Jul-14 30-Jun-15 40,000,000
08 EXTERNAL GRANTS 46,426,212,350 5,311,550,802
NETHERLAND Manufacturing11,184,600,000 200,000,000
18140103 WATER SANITATION AND HYGIENE Manufacturing11,184,600,000 24-Aug-09 30-Jun-15 200,000,000
09 EXTERNAL LOANSOPEC FUND FOR INTERNATIONAL DEVELOPMENT
01150103 AGRO-PROCESSING PARKS DEVELOPMENT Manufacturing173,000,000 1-Jul-14 30-Jun-15 151,000,000
113 18140105 LAKE VICTORIA WATER SUPPLY AND SANITATION PROJECT PHASE II (LVWATSAN II)
Manufacturing13,407,707,400 14-Aug-09 31-Dec-16 3,292,464,000
09 EXTERNAL LOANS 3,000,733,316 691,425,375114
01150202 MANUFACTURING GROWTH PROJECT Manufacturing1,284,700,000 1-Jul-14 30-Jun-15 1,258,053,583
DEVELOPMENT BANK OF RWANDA (BRD) ENERGY
TOTAL NUMBER OF PROJECTS 5 FOR THE YEAR 2015 Manufacturing17,662,850,592 17,662,850,592
EXPORTTOTAL NUMBER OF PROJECTS 85 FOR THE YEAR 2015 34,619,432,932 34,619,432,932
0101 NATIONAL COMMISSION FOR UNITY AND RECONCILIATION(NURC)08 EXTERNAL GRANTS 914,250,480 271,164,244UNDP 914,250,480 271,164,244

115 01170204 PROMOTING ACCESS TO JUSTICE, HUMAN AND PEACE CONSOLIDATION IN RWANDA(NURC)
Service914,250,480 1-Oct-13 30-Jun-18 271,164,244
0108 RWANDA DEVELOPMENT BOARD (RDB)01 DOMESTIC FINANCINGRWANDA Service 20,577,068,739 19,920,012,130
116 01150204 EXPORT DIVERSIFICATION PROJECT Service 268,472,629 1-Jul-14 30-Jun-15 255,472,629117 01150302 PROJECT: DIVERSIFICATION OF TOURISM PRODUCTS AND PRODUCT
DEVELOPMENTService
1,650,726,803 1-Jul-14 30-Jun-15 2,415,471,001
11801150303 WILDLIFE PROTECTION AND CONSERVATION OF NATIONAL PARKS Service
566,843,260 1-Jul-14 30-Jun-15 468,008,525
119 01150304 PROJECT: TOURISM QUALITY MANAGENENT AND STANDARDASATION
OF NEW ACCOMMODATION ESTABLISHMENTService
100,000,000 1-Jul-14 30-Jun-15 96,000,000
120 01150305 RWANDA TOURISM MARKETING AND RESEARCH PROJECT Service 159,861,864 1-Jul-14 30-Jun-15 158,861,864121 01150402 RWANDA INVESTMENT AND TRACKING SYSTEM Service 385,799,576 1-Jul-14 30-Jun-15 359,989,068122 01150403 CORPORATE GOVERNANCE ADVISORY SERVICES PROJECT Service 226,892,438 1-Jul-14 30-Jun-15 203,919,900123 01150406 RWANDA BUSINESS LIFE CYCLE PROJECT Service 33,000,000 1-Jul-14 30-Jun-15 62,940,000
20 OTHER EXTRA BUDGETARY26 INVESTMENT CLIMATE FACILITY27 01150406 RWANDA BUSINESS LIFE CYCLE PROJECT Service 1,190,000,000 17-Jul-13 31-Jul-15 484,296,974
124 01150502 SERVICES DEVELOPMENT AND COMPETITIVENESS Service 240,768,795 1-Jul-14 30-Jun-15 237,668,795125 01150602 RWANDA SPECIAL ECONOMIC ZONE DEVELOPMENT PROJECT Service 250,000,000 1-Jul-14 30-Jun-15 237,200,000126 01160102 PROJECT: E-GOVERNMENT Service 3,781,270,521 1-Jul-14 30-Jun-15 3,302,832,681127 01160103 PROJECT: ICT SKILLS DEVELOPMENT Service 163,231,205 1-Jul-14 30-Jun-15 163,231,205128 01160104 NATIONAL CYBER SECURITY Service 3,119,475,240 1-Jul-14 30-Jun-15 3,064,483,180129 01160105 PROJECT : ICT PRIVATE SECTOR DEVELOPMENT Service 8,271,733,212 1-Jul-14 30-Jun-15 8,292,533,212130 01160106 PROJECT : ICT FOR COMMUNITY DEVELOPMENT Service 60,000,000 1-Jul-14 30-Jun-15 8,109,900131 01150302 PROJECT: DIVERSIFICATION OF TOURISM PRODUCTS AND PRODUCT
DEVELOPMENTService
108,993,196 1-Jul-14 30-Jun-15 108,993,196
132 'DOCUMENT TRACKING & WORKFLOW MANAGEMENT SYSTEM Service 1,217,537,325 2011 2017133 intallation of CCTV Service 15,680,000,000 2015 2016134 ' Cyber Security Capacity Building, Standards and Guidelines Service 5,000,000,000 2012 2020
135 Kigali Innovation City Service 19,972,769,861 2009 2020136 'Regional ICT Center of Excellence (RICTCE) Service 35,313,710,000 24-Feb-12 30th june 2016
137 Construction of Advance Factory Unit Service 7,600,000,000 'June,2014 2017138 'Kivu Belt development project Service 119,625,000,000 2014 2020139 'Kigali Cultural viallage Service 162,538,710,000.0 2012 2018140 ' Development of MICE Village and Branding project Service 9,447,922,855 2015 2018
08 EXTERNAL GRANTS141 STRENGTHENING LAW ENFORCEMENT CAPACITY IN PARKS Service 6,358,049,916 1-Jul-14 30-Jun-15 0
08 EXTERNAL GRANTSINTERNATIONAL DEVELOPMENT ASSOCIATION
142 01160108 REGIONAL COMMUNICATION INFRASTRUCTURE PROGRAMME Service 15,390,830,684 16-Jan-09 31-Jul-15 3,168,480,000OTHER EXTRA BUDGETARY Service 2,922,913,189 0
143 MACARTHUR FOUNDATION (MAF) Service 106,917,336 1-Jul-14 30-Jun-15144 BUFFET FOUNDATION Service 2,765,128,188 1-Nov-14 31-Dec-17145 NETHERLANDS INITIATIVE FOR CAPACITY DEVELOPMENT IN HIGHER EDUCATION
(NICHE)Service
44,643,672 1-Jul-14 30-Jun-15
146 NETWORK ENVIRONMENTAL AND FORESTRY TRAINING INSTITUTIONS IN CENTRAL AFRICA (NEFTICA)
Service6,223,993 1-Jul-14 30-Jun-15
09 EXTERNAL LOANSAFRICAN DEVELOPMENT BANK ADB
147 01160107 REGIONAL ICT CENTER FOR EXCELLENCE Service 7,616,720,000 29-Feb-12 30-Sep-17 1,649,449,9740200 SENATE
148 01 DOMESTIC FINANCINGRWANDA
149 02070110 PROJECT: MONUMENT AND SITES CONSTRUCTION Service 416,434,000 1-Jul-14 30-Jun-15 416,434,0000300 CHAMBER OF DEPUTIESOTHER EXTRA BUDGETARYUNITED NATIONS DEVELOPMENT PROGRAMME - UNDP Service 852,500,000 0
150PROMOTING ACCESS TO JUSTICE, HUMAN RIGHTS AND PEACE CONSOLIDATION Service
852,500,000 1-Jul-13 30-Jun-18
0303 NATIONAL HUMAN RIGHTS COMMISSION (NHRC)OTHER EXTRA BUDGETARYUNITED NATIONS DEVELOPMENT PROGRAMME - UNDP
151 03070418 PROMOTING ACCESS TO JUSTICE, HUMAN RIGHTS AND PEACE
CONSOLIDATIONService
43,545,200 1-Jul-14 30-Jun-15
0301 OFFICE OF THE AUDITOR GENERA (OAG) 6,369,308,987 1,955,697,67108 EXTERNAL GRANTS 6,369,308,987 1,955,697,671DFID 6,369,308,987 1,955,697,671
152 03110103 STRENGTHENING PUBLIC AUDIT IN RWANDA (SPAR) Service 6,369,308,987 15-Nov-11 30-Jun-16 1,955,697,6710303 NATIONAL HUMAN RIGHTS COMMISSION (NHRC) 43,545,200 0OTHER EXTRA BUDGETARY 43,545,200 0UNITED NATIONS DEVELOPMENT PROGRAMME - UNDP 43,545,200 0
153 03070418 PROMOTING ACCESS TO JUSTICE, HUMAN RIGHTS AND PEACE CONSOLIDATION
Service43,545,200 1-Jul-14 30-Jun-15 0
0500 SUPREME COURT 5,792,155,000 2,616,221,27901 DOMESTIC FINANCING 239,000,000 239,000,000RWANDA 239,000,000 239,000,000
154 05060202 RWANDA COMMERCIAL JUSTICE PROJECT Service 239,000,000 1-Jul-14 30-Jun-15 239,000,00008 EXTERNAL GRANTS 5,553,155,000 2,377,221,279INVESTMENT CLIMATE FACILITY 1,450,155,000 867,856,49805060202 RWANDA COMMERCIAL JUSTICE PROJECT Service 1,450,155,000 1-Sep-12 30-Jun-15 867,856,498NETHERLAND 4,103,000,000 1,509,364,781
155 05050106 CAPACITY BUILDING TO JUDICIARY AND PROSECUTION PROJECT Service 4,103,000,000 1-Dec-12 31-Dec-16 1,509,364,7810600 MINADEF 329,050,026 329,050,02601 DOMESTIC FINANCING 329,050,026 329,050,026RWANDA 329,050,026 329,050,026
157 06080202 SINGLE STREAM OF FUNDING FOR HIV/GF Service 329,050,026 1-Jul-14 30-Jun-15 329,050,0260601 RWANDA MILITARY HOSPITAL (RMH) 1,270,819,330 1,270,819,330

01 DOMESTIC FINANCING 1,270,819,330 1,270,819,330GLOBAL FUND 1,270,819,330 1,270,819,330
158 06070202 SINGLE STREAM OF FUNDING FOR HIV/GF-RMH Service 1,270,819,330 1-Jul-14 30-Jun-15 1,270,819,3300700 MININTER 192,603,854 157,079,85101 DOMESTIC FINANCING 157,079,851 157,079,851RWANDA 157,079,851 157,079,851
159 07130103 SINGLE STREAM FUNDING/HIV (SSF-HIV) Service 157,079,851 1-Jul-14 30-Jun-15 157,079,851OTHER EXTRA BUDGETARY 35,524,003 0GLOBAL FUND 35,524,003 007130103 SINGLE STREAM FUNDING/HIV (SSF-HIV) Service 35,524,003 1-Jul-14 30-Jun-15 00701 RWANDA NATIONAL POLICE (RNP) 5,445,914,631 1,753,234,35001 DOMESTIC FINANCING 3,271,747,768 1,450,234,350RWANDA 3,271,747,768 1,450,234,350
160 07150302 CONSTRUCTION OF RNP GHQS 2 NEW P/STATIONS AND REMERA P/STATION AND REMOVAL OF ASBESTOS
Service2,684,013,418 1-Jul-14 30-Jun-15 862,500,000
161 07160502 SINGLE STREAM OF FUNDING FOR HIV/GF Service 350,301,000 1-Jul-14 30-Jun-15 350,301,000162 07160604 SINGLE STREAM OF FUNDING FOR HIV/GF Service 237,433,350 1-Jul-14 30-Jun-15 237,433,350
08 EXTERNAL GRANTS 1,989,370,855 303,000,000UNDP 1,989,370,855 303,000,000
164 07140103 PROMOTING ACCESS TO JUSTICE, HUMAN AND PEACE CONSOLIDATION IN RWANDA(RNP)
Service1,989,370,855 1-Oct-13 30-Jun-18 303,000,000
OTHER EXTRA BUDGETARY 184,796,008 0NETHERLANDS 184,796,008 0
165 07160605 NATIONAL SCALE UP OF ISANGE ONE STOP CENTRE MODEL IN RWANDA
PROJECTService
184,796,008 1-Jul-14 30-Jun-15 0
0702 RWANDA CORRECTIONAL SERVICE(RCS) 816,711,298 816,711,29801 DOMESTIC FINANCING 816,711,298 816,711,298RWANDA 816,711,298 816,711,298
166 07180404 NSINDA PRISON PHASE I REHABILITATION Service 207,902,066 1-Jul-14 30-Jun-15 207,902,066167 07180405 REHABILITATION AND EXTENSION OF BIOGAS IN 10 PRISONS. Service 113,106,141 1-Jul-14 30-Jun-15 113,106,141168 07180407 CONSTRUCTION OF HUYE PRISON PHASE IV Service 278,129,854 1-Jul-14 30-Jun-15 278,129,854169 07180410 CONSTRUCTION OF RCS TRAINING SCHOOL Service 92,709,951 1-Jul-14 30-Jun-15 92,709,951170 07180302 Inmates minors and the children born in prisons welfare promoted Service 50,000,000 1-Jul-14 30-Jun-15 50,000,000
171 07180411 ENSURING SECURITY OF PRISONS INFRASTRUCTURES Service 74,863,286 1-Jul-14 30-Jun-15 74,863,2860800 MINAFFET 2,591,639,311 2,591,639,31101 DOMESTIC FINANCING 2,591,639,311 2,591,639,311RWANDA 2,591,639,311 2,591,639,311
172 08050103 EMBASSY INFRASTRUCTURE Service 2,591,639,311 1-Jul-14 30-Jun-15 2,591,639,3111000 MINICOM 18,623,257,401 13,393,186,86201 DOMESTIC FINANCING 11,817,884,500 11,817,884,500RWANDA 11,817,884,500 11,817,884,500
173 10060307 COMMODITY TRADING PLATFORM Service 700,000,000 1-Jul-14 30-Jun-15 1,405,000,000174 10070101 CONSTRUCTION OF 4 PROVINCIAL INDUSTRIAL PARKS Service 3,938,870,000 1-Jul-14 30-Jun-15 3,938,870,000175 10070103 PROJECT: RELOCATION OF GIKONDO INDUSTRIAL PARK Service 5,137,600,000 1-Jul-14 30-Jun-15 4,432,600,000176 10070201 RWANDA INTEGRATED TRADE LOGISTICS PROJECT Service 2,041,414,500 1-Jul-14 30-Jun-15 2,041,414,500
08 EXTERNAL GRANTS 2,004,778,524 705,580,864EUROPEAN UNION 2,004,778,524 705,580,864
177 10060304 PROJECT: EIF Service 1,008,424,800 1-Jul-09 31-Mar-16 202,500,000178 10070304 SUPPORT TO MICRO, SMALL AND MEDIUM ENTERPISES -PROGRAMME
ESTIMATE 2 (EU)Service
996,353,724 27-Jun-13 26-Jun-15 503,080,864
09 EXTERNAL LOANS 3,250,000,000 869,721,498WORLD BANK 3,250,000,000 869,721,498
179 10060302 GOVERNANCE FOR COMPETITIVENESS TECHNICAL ASSISTANCE ( G4CTA) PROJECT
Service3,250,000,000 4-Jan-12 30-Apr-16 869,721,498
OTHER EXTRA BUDGETARY 1,550,594,377 0UNEP 960,427,609 0
180 E-WASTE MANAGEMENT Service 960,427,609 1-Oct-14 30-Jun-17 0SIDA Service 273,000,000 0
181 RESOURCE EFFICIENT AND CLEANER PRODUCTION Service 273,000,000 1-Nov-12 30-Jun-16 0NEPAD Service 317,166,768 0
182 WOMEN IN INFORMAL CROSS BORDER TRADE PROJECT (WICBT) Service 317,166,768 7-Jan-13 30-Jun-151001 RWANDA STANDARDS BOARD (RSB) 855,461,589 855,461,58901 DOMESTIC FINANCING 790,774,942 790,774,942RWANDA Service 790,774,942 790,774,942
183 10050205 REHABILITATION OF ADMINISTRATIVE BUILDING AND LABORATORY
CHEMICAL STORESService
55,130,192 1-Jul-14 30-Jun-15 55,130,192
184 10090103 CIVIL ENGINEERING TESTING LABORATORIES AND LABORATORY ACCESSORIES
Service189,000,000 1-Jul-14 30-Jun-15 189,000,000
185 10090302 PLASTICS PACKAGING Service 350,000,000 1-Jul-14 30-Jun-15 350,000,000186 10100102 ESTABLISHMENT OF TIME AND FREQUENCY LABORATORY AND
ENHANCEMENT OF METROLOGY LABORATORIES IN PREPARATION FOR
ACCREDITATION
Service196,644,750 1-Jul-14 30-Jun-15 196,644,750
08 EXTERNAL GRANTS 64,686,647 64,686,647TRADE MARK EAST AFRICA 64,686,647 64,686,647
187 10080203 RESEARCH ON PRIORITY BASED STANDARDS TRAININING AND DISSEMINATION PROJECT
Service64,686,647 1-Jul-14 30-Jun-15 64,686,647
1002 RWANDA COOPERATIVES AGENCY (RCA) 1,000,000,000 1,000,000,00008 EXTERNAL GRANTS 1,000,000,000 1,000,000,000WORLD HEALTH ORGANIZATION - WHO 1,000,000,000 1,000,000,000
188 10110203 SACCOS CONSOLIDATED TOWARDS COOPERATIVE BANK PROJECT Service 1,000,000,000 1-Jul-14 30-Jun-15 1,000,000,000
1004 NATIONAL INDUSTRIAL RESEARCH AND DEVELOPMENT AGENCY (NIRDA)678,914,111 678,914,111
01 DOMESTIC FINANCING 678,914,111 678,914,111RWANDA 678,914,111 678,914,111
189 10070309 COMMUNITY PROCESSING CENTERS PROJECT Service 578,914,111 1-Jul-14 30-Jun-15 578,914,111190 10150105 NIRDA LABORATORY CONSTRUCTION Service 100,000,000 1-Jul-14 30-Jun-15 100,000,000
1200 MINECOFIN 15,097,147,970 12,251,205,76101 DOMESTIC FINANCING 2,655,129,139 2,655,129,139RWANDA 2,655,129,139 2,655,129,139
191 12070503 EXPORT PROMOTION PROJECT Service 1,565,129,139 1-Jul-14 30-Jun-15 1,565,129,139

192 12070504 PROJECT STUDY FUND Service 1,090,000,000 1-Jul-14 30-Jun-15 1,090,000,00008 EXTERNAL GRANTS 12,442,018,831 9,596,076,622AFRICAN DEVELOPMENT FUND FOR ADB 337,890,000 581,846,580
19312080129 AUTOMATED GOVERNMENT LOCAL REVENUE MANAGEMENT PROJECT Service
337,890,000 12-Dec-13 30-Sep-15 581,846,580
BASKET FUND 7,426,760,074 7,426,760,074194 12090103 PFM (BASKET FUND) Service 7,426,760,074 1-Jul-14 30-Jun-18 7,426,760,074
EUROPEAN UNION Service 294,000,000 294,000,000195 12080105 RWANDA INSTITUTIONAL SUPPORT TO STATISTICS AND PFM/ EDF
NATIONAL AUTHORISING OFFICEService
294,000,000 1-Jul-14 30-Jun-18 294,000,000
UNIFEM 364,462,342 68,053,440196 12090105 GENDER RESPONSIVE BUDGETING Service 364,462,342 1-Jul-11 30-Dec-13 68,053,440
UNITED NATIONS CAPITAL DEVELOPMENT FUND - UNCDF 4,018,906,415 1,225,416,528197 12070402 BUILDING AN INCLUSIVE FINANCIAL SECTOR IN RWANDA (BIFSIR) Service 4,018,906,415 1-Jan-10 31-Dec-15 1,225,416,528
1202 NATIONAL INSTITUTE OF STATISTICS OF RWANDA (NISR) 63,469,664,330 6,616,951,06401 DOMESTIC FINANCING 6,333,791,433 1,291,689,044RWANDA 6,333,791,433 1,291,689,044
198 12060206 NSDS BASKET FUND NIS Service 6,333,791,433 1-Jul-14 30-Jun-19 1,291,689,04408 EXTERNAL GRANTS 57,135,872,897 5,325,262,020BASKET FUND (WB, DFID, EU, UN, AfDB, PIH, WV, ICF) 57,004,122,897 5,290,262,020
199 12060206 NSDS BASKET FUND NIS Service 57,004,122,897 1-Jul-14 30-Jun-19 5,290,262,020UNITED NATIONS POPULATION FUND - UNFPA 131,750,000 35,000,000
200 12100201 NSDS BASKET FUND NIS Service 131,750,000 1-Jul-14 30-Jun-19 35,000,0001203 RWANDA REVENUE AUTHORITY(RRA) 2,220,364,080 571,085,08108 EXTERNAL GRANTS 2,220,364,080 571,085,081TRADE MARK EAST AFRICA 2,220,364,080 571,085,081
201 12060310 REGIONAL INTEGRATION AND TRADE FACILITATION (TMEA) Service 2,220,364,080 1-Sep-11 1-Sep-14 571,085,0811205 NATIONAL CAPACITY BUILDING SECRETARIAT (NCBS) 12,658,589,640 2,809,496,88208 EXTERNAL GRANTS 8,026,100,000 2,809,496,882BELGIAN TECHNICAL COOPERATION - BTC 3,740,000,000 1,401,086,858
202 12130123 SUPPORT TO THE STRATEGIC APPROACH TO CAPACITY BUILDIING Service 3,740,000,000 1-Jan-14 6-Feb-19 1,401,086,858NETHERLAND 4,286,100,000 1,408,410,024
203 12130108 CAPACITY BUILDING FOR FOOD SECURITY IN RWANDA Service 4,286,100,000 1-Jan-13 31-Dec-16 1,408,410,024OTHER EXTRA BUDGETARY 4,632,489,640 0OTHER RWANDA CORPORATE ENTITIES 2,721,745,412 0
204 12130165 TRAINING AND MENTORING IN RELEVANT PROFESSIONAL AREAS Service 2,721,745,412 1-Jul-14 30-Jun-15UNITED NATIONS DEVELOPMENT PROGRAMME - UNDP 1,910,744,228 0
205TRANSFORMATIONAL CAPACITY DEVELOPMENT FOR THE IMPLEMENTATION AND COORDINATION OF GOVERNMENT POLICIES AND PROGRAMMES
Service1,910,744,228 1-Jan-14 30-Jun-18
1207 CAPITAL MARKETS AUTHORITY (CMA) 484,357,868 484,357,86801 DOMESTIC FINANCING 484,357,868 484,357,868RWANDA 484,357,868 484,357,868
206 12140107 NATIONAL UNIT TRUST Service 484,357,868 1-Jul-14 30-Jun-15 484,357,8681300 MINIJUST 6,103,428,296 1,794,619,94408 EXTERNAL GRANTS 6,103,428,296 1,794,619,944NETHERLAND 977,953,341 977,953,341
207 13050397 NATIONAL SCALE UP OF ISANGE ONE STOP CENTRE MODEL IN RWANDA
PROJECTService
977,953,341 1-Jul-14 30-Jun-15 977,953,341
UNDP 5,125,474,955 816,666,603208 13100102 PROMOTING ACCESS TO JUSTICE, HUMAN AND PEACE CONSOLIDATION
IN RWANDA(MINIJUST)Service
4,884,569,237 30-Oct-13 30-Jun-18 816,666,603
209 13100211 NCHR CAPACITIES ARE STRENGTHENED TO PROMOTE AND MAINSTREAM HUMAN RIGHTS AND IMPLEMENT TREATY BODY AND UPR
Service240,905,718 1-Jul-13 30-Jun-18
1400 MINEDUC 47,238,751,029 4,017,114,36501 DOMESTIC FINANCING 325,980,707 325,980,707RWANDA 325,980,707 325,980,707
210 14170110 SINGLE STREAM FOR HIV/GB Service 53,000,000 1-Jul-14 30-Jun-15 53,000,000211 14180117 PROJECT: SUPPORT TO SKILLS DEVELOPMENT IN SCIENCE AND
TECHNOLOGYService
272,980,707 1-Jul-14 30-Jun-15 272,980,707
08 EXTERNAL GRANTS 6,128,872,282 3,002,333,658AFRICAN CAPACITY BUILDING FOUNDATION 166,827,282 166,827,28214180117 PROJECT: SUPPORT TO SKILLS DEVELOPMENT IN SCIENCE AND
TECHNOLOGYService
166,827,282 6-Mar-09 31-Oct-15 166,827,282
AFRICAN DEVELOPMENT BANK ADB Service 5,962,045,000 2,835,506,37614180117 PROJECT: SUPPORT TO SKILLS DEVELOPMENT IN SCIENCE AND
TECHNOLOGYService
5,962,045,000 6-Mar-09 31-Dec-16 2,835,506,376
OTHER EXTRA BUDGETARY 6,514,360,440 0BELGIUM 6,514,360,440 0
212 PROJET D'APPUI A LA FORMATION PROFESSIONNELLE Service 6,514,360,440 26-Jan-10 26-Jan-1609 EXTERNAL LOANS 34,269,537,600 688,800,000SOUTH KOREA 34,269,537,600 688,800,000
213 14210226 UNIVERSITY OF RWANDA-INFRASTRUCTURE DEVELOPMENT Service 34,269,537,600 14-Nov-14 14-May-18 688,800,0001401 RWANDA NATIONAL COMMISSION FOR UNESCO CNRU 182,400,000 182,400,00008 EXTERNAL GRANTS 182,400,000 182,400,000UNESCO 182,400,000 182,400,000
214 14180130 CNRU FINANCE SUPPORT SERVICES AND EFFICIENT MANAGEMENT OF RESOURCES PROJECT
Service182,400,000 1-Jul-14 30-Jun-15 182,400,000
1409 RUKARA NATIONAL COLLEGE OF EDUCATION 939,423,550 939,423,55001 DOMESTIC FINANCING 939,423,550 939,423,550RWANDA 939,423,550 939,423,550
215 14210215 RUKARA INFRASTRUCTURE DEVELOPMENT PROJECT Service 939,423,550 1-Jul-14 30-Jun-15 939,423,5501412 WORKFORCE DEVELOPMENT AUTHORITY(WDA) 47,325,421,246 20,264,768,43001 DOMESTIC FINANCING 12,986,228,615 12,986,228,615RWANDA 12,986,228,615 12,986,228,615
216 14220111 HANDS-ON SKILLS AMONG YOUTH OUTSIDE REGULAR EDUCATION SYSTEM
Service1,165,000,000 1-Jul-14 30-Jun-15 1,165,000,000
217 14220301 TVET SCHOOLS INFRASTRUCTURE DEVELOPMENT AND EQUIPMENT PROJECT
Service9,724,020,035 1-Jul-14 30-Jun-15 9,724,020,035
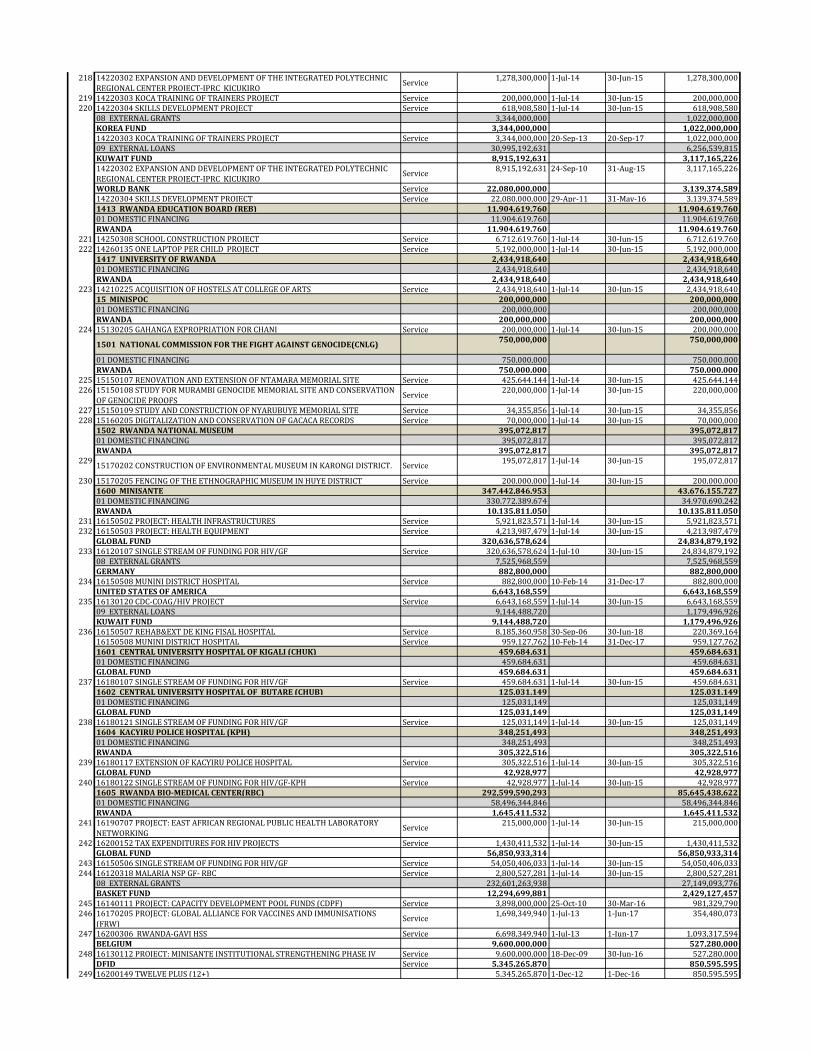
218 14220302 EXPANSION AND DEVELOPMENT OF THE INTEGRATED POLYTECHNIC REGIONAL CENTER PROJECT-IPRC KICUKIRO
Service1,278,300,000 1-Jul-14 30-Jun-15 1,278,300,000
219 14220303 KOCA TRAINING OF TRAINERS PROJECT Service 200,000,000 1-Jul-14 30-Jun-15 200,000,000220 14220304 SKILLS DEVELOPMENT PROJECT Service 618,908,580 1-Jul-14 30-Jun-15 618,908,580
08 EXTERNAL GRANTS 3,344,000,000 1,022,000,000KOREA FUND 3,344,000,000 1,022,000,00014220303 KOCA TRAINING OF TRAINERS PROJECT Service 3,344,000,000 20-Sep-13 20-Sep-17 1,022,000,00009 EXTERNAL LOANS 30,995,192,631 6,256,539,815KUWAIT FUND 8,915,192,631 3,117,165,22614220302 EXPANSION AND DEVELOPMENT OF THE INTEGRATED POLYTECHNIC REGIONAL CENTER PROJECT-IPRC KICUKIRO
Service8,915,192,631 24-Sep-10 31-Aug-15 3,117,165,226
WORLD BANK Service 22,080,000,000 3,139,374,58914220304 SKILLS DEVELOPMENT PROJECT Service 22,080,000,000 29-Apr-11 31-May-16 3,139,374,5891413 RWANDA EDUCATION BOARD (REB) 11,904,619,760 11,904,619,76001 DOMESTIC FINANCING 11,904,619,760 11,904,619,760RWANDA 11,904,619,760 11,904,619,760
221 14250308 SCHOOL CONSTRUCTION PROJECT Service 6,712,619,760 1-Jul-14 30-Jun-15 6,712,619,760222 14260135 ONE LAPTOP PER CHILD PROJECT Service 5,192,000,000 1-Jul-14 30-Jun-15 5,192,000,000
1417 UNIVERSITY OF RWANDA 2,434,918,640 2,434,918,64001 DOMESTIC FINANCING 2,434,918,640 2,434,918,640RWANDA 2,434,918,640 2,434,918,640
223 14210225 ACQUISITION OF HOSTELS AT COLLEGE OF ARTS Service 2,434,918,640 1-Jul-14 30-Jun-15 2,434,918,64015 MINISPOC 200,000,000 200,000,00001 DOMESTIC FINANCING 200,000,000 200,000,000RWANDA 200,000,000 200,000,000
224 15130205 GAHANGA EXPROPRIATION FOR CHANI Service 200,000,000 1-Jul-14 30-Jun-15 200,000,000
1501 NATIONAL COMMISSION FOR THE FIGHT AGAINST GENOCIDE(CNLG)750,000,000 750,000,000
01 DOMESTIC FINANCING 750,000,000 750,000,000RWANDA 750,000,000 750,000,000
225 15150107 RENOVATION AND EXTENSION OF NTAMARA MEMORIAL SITE Service 425,644,144 1-Jul-14 30-Jun-15 425,644,144226 15150108 STUDY FOR MURAMBI GENOCIDE MEMORIAL SITE AND CONSERVATION
OF GENOCIDE PROOFSService
220,000,000 1-Jul-14 30-Jun-15 220,000,000
227 15150109 STUDY AND CONSTRUCTION OF NYARUBUYE MEMORIAL SITE Service 34,355,856 1-Jul-14 30-Jun-15 34,355,856228 15160205 DIGITALIZATION AND CONSERVATION OF GACACA RECORDS Service 70,000,000 1-Jul-14 30-Jun-15 70,000,000
1502 RWANDA NATIONAL MUSEUM 395,072,817 395,072,81701 DOMESTIC FINANCING 395,072,817 395,072,817RWANDA 395,072,817 395,072,817
22915170202 CONSTRUCTION OF ENVIRONMENTAL MUSEUM IN KARONGI DISTRICT. Service
195,072,817 1-Jul-14 30-Jun-15 195,072,817
230 15170205 FENCING OF THE ETHNOGRAPHIC MUSEUM IN HUYE DISTRICT Service 200,000,000 1-Jul-14 30-Jun-15 200,000,0001600 MINISANTE 347,442,846,953 43,676,155,72701 DOMESTIC FINANCING 330,772,389,674 34,970,690,242RWANDA 10,135,811,050 10,135,811,050
231 16150502 PROJECT: HEALTH INFRASTRUCTURES Service 5,921,823,571 1-Jul-14 30-Jun-15 5,921,823,571232 16150503 PROJECT: HEALTH EQUIPMENT Service 4,213,987,479 1-Jul-14 30-Jun-15 4,213,987,479
GLOBAL FUND 320,636,578,624 24,834,879,192233 16120107 SINGLE STREAM OF FUNDING FOR HIV/GF Service 320,636,578,624 1-Jul-10 30-Jun-15 24,834,879,192
08 EXTERNAL GRANTS 7,525,968,559 7,525,968,559GERMANY 882,800,000 882,800,000
234 16150508 MUNINI DISTRICT HOSPITAL Service 882,800,000 10-Feb-14 31-Dec-17 882,800,000UNITED STATES OF AMERICA 6,643,168,559 6,643,168,559
235 16130120 CDC-COAG/HIV PROJECT Service 6,643,168,559 1-Jul-14 30-Jun-15 6,643,168,55909 EXTERNAL LOANS 9,144,488,720 1,179,496,926KUWAIT FUND 9,144,488,720 1,179,496,926
236 16150507 REHAB&EXT DE KING FISAL HOSPITAL Service 8,185,360,958 30-Sep-06 30-Jun-18 220,369,16416150508 MUNINI DISTRICT HOSPITAL Service 959,127,762 10-Feb-14 31-Dec-17 959,127,7621601 CENTRAL UNIVERSITY HOSPITAL OF KIGALI (CHUK) 459,684,631 459,684,63101 DOMESTIC FINANCING 459,684,631 459,684,631GLOBAL FUND 459,684,631 459,684,631
237 16180107 SINGLE STREAM OF FUNDING FOR HIV/GF Service 459,684,631 1-Jul-14 30-Jun-15 459,684,6311602 CENTRAL UNIVERSITY HOSPITAL OF BUTARE (CHUB) 125,031,149 125,031,14901 DOMESTIC FINANCING 125,031,149 125,031,149GLOBAL FUND 125,031,149 125,031,149
238 16180121 SINGLE STREAM OF FUNDING FOR HIV/GF Service 125,031,149 1-Jul-14 30-Jun-15 125,031,1491604 KACYIRU POLICE HOSPITAL (KPH) 348,251,493 348,251,49301 DOMESTIC FINANCING 348,251,493 348,251,493RWANDA 305,322,516 305,322,516
239 16180117 EXTENSION OF KACYIRU POLICE HOSPITAL Service 305,322,516 1-Jul-14 30-Jun-15 305,322,516GLOBAL FUND 42,928,977 42,928,977
240 16180122 SINGLE STREAM OF FUNDING FOR HIV/GF-KPH Service 42,928,977 1-Jul-14 30-Jun-15 42,928,9771605 RWANDA BIO-MEDICAL CENTER(RBC) 292,599,590,293 85,645,438,62201 DOMESTIC FINANCING 58,496,344,846 58,496,344,846RWANDA 1,645,411,532 1,645,411,532
241 16190707 PROJECT: EAST AFRICAN REGIONAL PUBLIC HEALTH LABORATORY
NETWORKINGService
215,000,000 1-Jul-14 30-Jun-15 215,000,000
242 16200152 TAX EXPENDITURES FOR HIV PROJECTS Service 1,430,411,532 1-Jul-14 30-Jun-15 1,430,411,532GLOBAL FUND 56,850,933,314 56,850,933,314
243 16150506 SINGLE STREAM OF FUNDING FOR HIV/GF Service 54,050,406,033 1-Jul-14 30-Jun-15 54,050,406,033244 16120318 MALARIA NSP GF- RBC Service 2,800,527,281 1-Jul-14 30-Jun-15 2,800,527,281
08 EXTERNAL GRANTS 232,601,263,938 27,149,093,776BASKET FUND 12,294,699,881 2,429,127,457
245 16140111 PROJECT: CAPACITY DEVELOPMENT POOL FUNDS (CDPF) Service 3,898,000,000 25-Oct-10 30-Mar-16 981,329,790246 16170205 PROJECT: GLOBAL ALLIANCE FOR VACCINES AND IMMUNISATIONS
(FRW)Service
1,698,349,940 1-Jul-13 1-Jun-17 354,480,073
247 16200306 RWANDA-GAVI HSS Service 6,698,349,940 1-Jul-13 1-Jun-17 1,093,317,594BELGIUM 9,600,000,000 527,280,000
248 16130112 PROJECT: MINISANTE INSTITUTIONAL STRENGTHENING PHASE IV Service 9,600,000,000 18-Dec-09 30-Jun-16 527,280,000DFID Service 5,345,265,870 850,595,595
249 16200149 TWELVE PLUS (12+) 5,345,265,870 1-Dec-12 1-Dec-16 850,595,595

GLOBAL ENVIRONMENT FUND 60,660,696 60,660,696250 16190706 SINGLE STREAM OF FUNDING FOR TB/GF Service 60,660,696 1-Jul-14 30-Jun-15 60,660,696
GLOBAL FUND 106,418,181,361 10,280,181,394251 16120310 SINGLE STREAM OF FUNDING FOR TB/GF Service 45,285,664,057 1-Jul-10 30-Jun-16 6,298,078,532252 16120317 SINGLE STREAM OF FUNDING FOR MALARIA PROJECT Service 61,045,425,457 1-Jul-10 30-Jun-16 3,895,011,015253 16200605 REDUCING THE MORTALITY, MOBILITY AND TRANSMISSION OF
TUBERCULOSIS AND DESEASE BURDEN DUE TO LEPROSYService
87,091,847 1-Jul-14 30-Jun-15 87,091,847
UNITED NATIONS CHILDREN'S FUND - UNICEF 1,491,659,003 1,491,659,003254 16190112 INCREASING ACCESS TO PEDIATRIC HIV TREATMENT IN RWANDA Service 1,491,659,003 1-Jul-14 30-Jun-15 1,491,659,003
UNITED NATIONS POPULATION FUND - UNFPA 156,716,556 156,716,556255 16200142 HIV QUALITY PREVENTION Service 156,716,556 1-Jul-14 30-Jun-15 156,716,556
UNITED STATES OF AMERICA 88,138,826,240 9,338,071,032256 16190503 RAPID STRENGTHENING OF BLOOD TRANSFUSION SERVICES Service 6,857,462,300 1-Oct-09 31-Mar-15 1,592,783,113257 16190721 PROJECT: STRENGTHENING THE CAPACITY OF THE GOVT OF RWANDA
IN HIV/AIDS DIAGNOSTICService
68,627,561,743 1-Oct-09 31-Mar-15 748,673,084
258 16200417 SUSTAINING INFLUENZA SURVEILLANCE NETWORKS AND RESPONSE TO SEASONAL AND PANDEMIC
Service5,848,250,000 1-Aug-11 1-Jul-16 265,627,338
259 16200103 CDC-COAG/HIV PROJECT Service 6,805,552,197 1-Oct-09 31-Mar-15 6,730,987,497
WORLD BANK 8,810,269,600 1,973,447,843
260 16130213 PROJECT: EAST AFRICAN REGIONAL PUBLIC HEALTH LABORATORY NETWORKING
Service8,810,269,600 25-Oct-10 30-Mar-16 1,973,447,843
WORLD HEALTH ORGANIZATION - WHO 284,984,731 41,354,200261 16200113 WHO HEALTH SUPPORT Service 284,984,731 1-Jul-14 30-Jun-15 41,354,200
OTHER EXTRA BUDGETARY 1,501,981,510 0UNITED KINGDOM 1,045,526,849 0
262 16170214 TESTING RWANDA'S COMPREHENSIVE STRATEGY TO REDUCE
CHILDHOOD STUNTINGService
559,974,400 1-Jul-14 30-Jun-15
263 16200218 END FUND PROJECT Service 268,455,020 1-Jul-14 30-Jun-15264 16200509 STRENGTHENING AND INTEGRATING PALLIATIVE CARE INTO NATIONAL
HEALTH SYSTEMS / THETService
217,097,429 1-Jul-14 30-Jun-15
UNITED NATIONS - UN Service 10,122,723 0265 16200148 STRENGTHEN INFANT MALE CIRCUMCISION Service 10,122,723 1-Jul-14 30-Jun-15
NETHERLAND 446,331,938 0266 MALARIA ELIMINATION PROGRAM FOR RUHUHA Service 446,331,938 1-Sep-12 1-May-15 0
1800 MININFRA 17,678,735,381 17,678,735,38101 DOMESTIC FINANCING 17,678,735,381 17,678,735,381RWANDA Service 17,678,735,381 17,678,735,381
267 18120202 BUGESERA AIRPORT Service 7,711,211,923 1-Jul-14 30-Jun-15 7,711,211,923268 18120204 REHABILITATION AND EXTENSION OF KAMEMBE AND RUBAVU
AIRPORT RUNWAYSService
2,500,000,000 1-Jul-14 30-Jun-15 2,500,000,000
269 18120205 KIGALI INTERNATIONAL AIRPORT Service 4,017,523,458 1-Jul-14 30-Jun-15 4,017,523,458270 18150410 CONSTRUCTION OF 3 NEW ARTIFICIAL FOOTBALL PLAYGROUNDS(2 IN
KIGALI AND 1 IN RUBAVU)Service
3,450,000,000 1-Jul-14 30-Jun-15 3,450,000,000
1802 RWANDA TRANSPORT DEVELOPMENTAGENCY (RTDA)01 DOMESTIC FINANCINGRWANDA
27118120101 EAST AFRICA TRADE & TRANSPORT FACILITATION PROJECT (EATTFP) Service
2,857,031,800 6-Jun-06 30-Sep-15 0
09 EXTERNAL LOANSWORLD BANK Service 66,500,000,000 3,941,960,092
18120101 EAST AFRICA TRADE & TRANSPORT FACILITATION PROJECT (EATTFP) Service10,500,000,000 6-Jun-06 30-Sep-15 2,066,400,000
272 18120104 CYANGUGU-NTENDEZI-MWITYAZO ROAD (50KM) LOT3 Service 10,000,000 1-Jul-14 30-Jun-15 2,673,10708 EXTERNAL GRANTS 57,796,564,666 32,807,917,643AFRICAN DEVELOPMENT BANK ADB 52,691,306,034 30,589,569,63218120104 CYANGUGU-NTENDEZI-MWITYAZO ROAD (50KM) LOT3 Service 44,952,432,940 8-Oct-10 30-Jun-16 26,816,343,706
273 18120105 KIGALI-GATUNA ROAD (80KM) REHABILITATION Service 3,848,114,153 1-Jul-14 30-Jun-15 1,839,433,15708 EXTERNAL GRANTSEUROPEAN UNION18120105 KIGALI-GATUNA ROAD (80KM) REHABILITATION Service 55,855,872,400 1-May-10 1-Apr-16 8,058,960,000
274 18120106 KITABI- CRETE CONGO/NIL (30KM) Service 3,890,758,941 1-Jul-14 30-Jun-15 1,933,792,76909 EXTERNAL LOANSARAB FUND18120106 KITABI- CRETE CONGO/NIL (30KM) AND HUYE URBAN ROADS Service 19,768,012,636 26-May-10 30-Jun-15 4,079,073,340
27518120107 KIVU-BELT (24.5 KM) LOT 6 REHABILITION-RUBENGERA-GISIZA ROAD Service
370,500,000 1-Jul-14 30-Jun-15 370,500,000
ARAB FUND (KUWAIT FUND, OPEC, SAUDI FUND) 36,890,000,000 7,148,395,677
18120107 KIVU-BELT (24.5 KM) LOT 6 REHABILITION-RUBENGERA-GISIZA ROAD Service36,890,000,000 30-Jul-12 30-Jun-16 7,148,395,677
09 EXTERNAL LOANS Service 133,462,116,761 39,393,388,575ARAB FUND
18120107 KIVU-BELT (24.5 KM) LOT 6 REHABILITION-RUBENGERA-GISIZA ROAD Service31,300,000,000 30-Jul-12 30-Jun-17 3,123,624,935
276 18120108 KIVU-BELT (66 KM) LOT 4 &5 REHABILITION- MWITYAZO -KARONGI ROAD
Service1,619,776,560 1-Jul-14 30-Jun-15 1,304,795,908
CHINA 68,272,356,839 12,378,832,97618120108 KIVU-BELT (66 KM) LOT 4 &5 REHABILITION- MWITYAZO -KARONGI ROAD
Service68,272,356,839 2-Jun-13 30-Jan-16 12,378,832,976
277 18120110 DETAILED STUDY OF NEW PLANNED ROADS Service 5,354,743,255 1-Jul-14 30-Jun-15 5,354,743,255278 18120111 CIMERWA - BUGARAMA (10 KM) ROAD UPGRADING Service 4,734,758,632 15-Oct-14 15-Sep-15 1,847,848,011279 18120112 ACCESS TO TUMBA COLLEGE Service 1,567,775,838 1-Jul-14 30-Jun-15 311,021,368
08 EXTERNAL GRANTSJAPAN18120112 ACCESS TO TUMBA COLLEGE Service 2,956,332,942 7-Aug-13 31-Mar-15 1,702,016,486
280 18120114 TRANSPORT SECTOR DEVELOPMENT( MASTERS DEGREE ON TRANSPORT STUDIES IN KIST)
Service1,146,976,542 1-Jul-14 30-Jun-15 2,123,604,944
18120117 RUSUMO BRIDGE & OSBP Service 124,899,566 1-Jul-14 30-Jun-15 124,899,56608 EXTERNAL GRANTS Service 550,594,861 232,530,361JAPAN

18120117 RUSUMO BRIDGE & OSBP Service 12,276,000,000 26-Mar-12 15-Nov-14 1,830,977,641281 18120119 KIGALI URBAN ROA Service 1,581,552,658 1-Jul-14 30-Jun-15 3,678,088,765282 18120127 NYABUGOGO-POIDS LOURD ROAD REHABILITATION (1.2KM) Service 600,000,000 1-Jul-14 30-Jun-15 603,890,614283 18120128 HUYE-KITABI ROAD REHABILITATION(53KM) Service 1,933,792,769 1-Jul-14 30-Jun-15 225,120,471284 18120130 TAX EXPENDITURES FOR TRANSPORT PROJECTS Service 5,367,603,016 1-Jul-14 30-Jun-15 5,367,603,016285 18120134 RUKOMO-BASE(LOT 2:51.5KM) Service 2,621,190,000 1-Jul-14 30-Jun-15 2,621,190,000
08 EXTERNAL GRANTSAFRICAN DEVELOPMENT BANK ADB18120134 RUKOMO-BASE(LOT 2:51.5KM) Service 21,569,600,000 1-Jan-15 1-Jan-19 3,444,000,000
286 18120136 KIBUNGO - NGOMA - NYANZA (130KM) ROAD UPGRADING Service 232,530,361 1-Jul-14 30-Jun-15 232,530,361287 18120137 GAHANGA STADIUM ACCESS ROAD Service 1,425,214,236 1-Jul-14 30-Jun-15 0288 18120138 KIGALI CONVENTION CENTER ACCESS ROAD(10KM) Service 4,140,866,247 29-Sep-14 29-Oct-15 2,348,696,092289 18120139 SP ACCESS ROAD(PETROLEUM FACILITIES) Service 2,013,912,602 1-Jul-14 30-Jun-15 1,086,936,131290 18120142 URBAN ROAD DEVELOPEMENT FOR SECONDARY CITIES Service 1,362,600,000 1-Jul-14 30-Jun-15 2,397,549,803291 18120143 RWAMAGANA INDUSTRIAL PARK ACCESS ROAD Service 391,230,000 1-Jul-14 30-Jun-15 391,230,000292 18120302 LAKE KIVU TRANSPORT Service 318,064,500 1-Jul-14 30-Jun-15 0293 18120501 ROAD SAFETY Service 334,976,560 1-Jul-14 30-Jun-15 722,292,475
09 EXTERNAL LOANSWORLD BANK18120501 TSDP - Kigali-Ruhengeri road rehabilitation project Service 56,000,000,000 10-May-07 31-Mar-15 1,875,560,09208 EXTERNAL GRANTSAFRICAN DEVELOPMENT BANK ADB18120109 KIVU-BELT (50 KM) LOT 7 REHABILITION RUBAVU-GISIZA ROAD Service 53,655,000,000 27-Jul-12 31-Dec-17 2,339,663,830EUROPEAN UNION18120144 FEEDER ROAD PROJECT Service 619,920,000 1-Feb-12 31-Mar-15 619,920,000AFRICAN DEVELOPMENT BANK ADB Service 1,824,182,000 468,384,000
294 18120402 DAR ES SALAAM-ISAKA-KIGALI/KEZA-MUSONGATI RAILWAY Service 1,824,182,000 1-Oct-10 31-Dec-15 468,384,000ARAB FUND
295 HUYE-KITABI ROAD REHABILITATION(53KM) Service 24,320,000,000 27-May-13 30-Jun-18 1,377,600,0001804 RWANDA HOUSING AUTHORITY(RHA) 8,899,879,961 8,899,879,96101 DOMESTIC FINANCING 8,899,879,961 8,899,879,961RWANDA 8,899,879,961 8,899,879,961
30018150101 ELABORATION AND IMPLEMENTATION OF URBAN PLANNING TOOLS Service
1,418,441,200 1-Jul-14 30-Jun-15 1,418,441,200
301 18150103 ELABORATION OF LOCAL URBAN DEVELOPMENT PLAN FOR EMERGING
CENTERS AND NATIONAL BORDER POSTS ELABORATEDService
199,789,524 1-Jul-14 30-Jun-15 199,789,524
302 18150104 PLOTS SERVICING IN KIGALI AND SECONDARY CITIES Service 400,000,000 1-Jul-14 30-Jun-15 400,000,000303 18150402 PUBLIC BUILDING MANAGEMENT Service 150,000,000 1-Jul-14 30-Jun-15 150,000,000304 18150408 REHABILITATION OF MINALOC/MIFOTRA/MININTER BUILDING Service 1,920,529,961 1-Jul-14 30-Jun-15 1,920,529,961305 18150501 DESIGN AND CONSTRUCTION OF PUBLIC BUILDINGS Service 1,346,558,800 1-Jul-14 30-Jun-15 1,346,558,800306
18150508 SITE DEVELOPMENT OF 1,200 AFFORDABLE HOUSES IN CITY OF KIGALI Service2,429,034,723 1-Jul-14 30-Jun-15 2,429,034,723
307 18150403 ACCOMODATION OF GOVERNMENT INSTITUTIONS Service 1,035,525,753 1-Jul-14 30-Jun-15 1,035,525,7531805 RWANDA METEOROLOGICAL AGENCY(RMA) 474,671,672 474,671,67201 DOMESTIC FINANCING 474,671,672 474,671,672RWANDA 474,671,672 474,671,672
308 18160312 WEATHER RADAR ACTIVITIES IMPLEMENTATION Service 474,671,672 1-Jul-14 30-Jun-15 474,671,6721900 MYICT 2,178,421,652 2,178,421,65201 DOMESTIC FINANCING 2,178,421,652 2,178,421,652RWANDA 1,575,338,741 1,575,338,741
309 19090403 ESTABLISHMENT OF GIRL`S REHABILITATION CENTER Service 11,897,526 1-Jul-14 30-Jun-15 11,897,526310 19090404 IMPLEMENTATION OF IWAWA MASTER PLAN Service 1,300,000,000 1-Jul-14 30-Jun-15 1,300,000,000311 19110203 SINGLE STREAM FUND FOR HIV PREVENTION IN YOUTH Service 263,441,215 1-Jul-14 30-Jun-15 263,441,215
GLOBAL FUND 603,082,911 603,082,91119110203 SINGLE STREAM FUND FOR HIV PREVENTION IN YOUTH Service 603,082,911 1-Jul-14 30-Jun-15 603,082,9111902 NATIONAL YOUTH COUNCIL (NYC) 724,850,000 724,850,00008 EXTERNAL GRANTS 724,850,000 724,850,000UNITED NATIONS CHILDREN'S FUND - UNICEF 724,850,000 724,850,000
312 19110202 PREVENTIVE INTERVENTION PROJECT/UNICEF Service 724,850,000 1-Jul-14 30-Jun-15 724,850,0002000 MIFOTRA 8,791,248,150 3,168,580,12201 DOMESTIC FINANCING 390,744,370 390,744,370RWANDA 390,744,370 390,744,370
313 20060102 IPPPIS PROJECT Service 390,744,370 1-Jul-14 30-Jun-15 390,744,37008 EXTERNAL GRANTS 8,400,503,780 2,777,835,752SWEDISH INTERNATIONAL DEVELOPMENT AGENCY 8,400,503,780 2,777,835,752
314 20070115 NEP/SWEDEN Service 8,400,503,780 1-Jul-14 30-Jun-17 2,777,835,7522100 MINEAC 661,512,720 661,512,72001 DOMESTIC FINANCING 661,512,720 661,512,720RWANDA 661,512,720 661,512,720
315 21040226 CONSTRUCTION OF EAC BUSINESS COUNCIL Service 661,512,720 1-Jul-14 30-Jun-15 661,512,7202200 MINIRENA 31,816,359,471 16,315,492,27701 DOMESTIC FINANCING 601,630,820 601,630,820RWANDA 601,630,820 601,630,820
316 22090105 STUDY ON PETROLEUM EXPLORATION(SNR DENTON) Service 101,630,820 1-Jul-14 30-Jun-15 101,630,820317 22090106 COUNTERPART FUND FOR FONERWA Service 500,000,000 1-Jul-14 30-Jun-15 500,000,000
08 EXTERNAL GRANTS 31,214,728,651 15,713,861,457DFID 22,707,254,751 11,311,499,695
318 22090109 CONSERVATION AND MANAGEMENT OF NATURAL RESOURCES(FONERWA)
Service13,798,626,911 1-Jul-14 30-Jun-15 6,873,713,525
319 22090110 RENEWABLE ENERGY,R&D AND CLIMATE RESILIENT TECHNOLOGIES(FONERWA)
Service8,331,708,679 1-Jul-14 30-Jun-15 4,150,396,920
320 22090112 ENVIRONEMENT AND CLIMATE CHANGE ISSUES(FONERWA) Service 576,919,161 1-Jul-14 30-Jun-15 287,389,250UNITED NATIONS DEVELOPMENT FUND FOR WOMEN - UNIFEM 434,262,230 434,262,230
321 22090111 FONERWA OPERATIONS Service 434,262,230 1-Jul-14 30-Jun-15 434,262,230UNDP 1,900,370,532 1,900,370,53222090111 FONERWA OPERATIONS Service 242,830,518 1-Jul-14 30-Jun-15 242,830,518
322 22090205 STRENGTHENING INSTITUTIONAL CAPACITY OF THE MINISTRY OF
NATURAL RESOURCES IN RWANDAService
1,587,540,014 1-Jul-14 30-Jun-15 1,587,540,014
323 22090213 EFFECTIVE PROGRAM MANAGEMENT Service 70,000,000 1-Jul-14 30-Jun-15 70,000,000

UNITED NATIONS FRAMEWORK CONVENTION ON CLIMATE CHANGE-UNFCCC6,172,841,138 2,067,729,000
324 22090206 REDUCING VULNERABILITY TO CLIMATE CHANGE IN NORTH WEST RWANDA THROUGH COMMUNITY BASED ADAPTATION
Service6,172,841,138 31-Dec-14 30-Jun-18 2,067,729,000
2201 RWANDA ENVIRONMENT MANAGEMENT AUTHORITY (REMA) 25,066,340,400 4,452,995,49008 EXTERNAL GRANTS 21,284,240,400 4,452,995,490UNDP 5,007,370,400 1,025,177,893
325 22100102 PROJECT : POVERTY ENVIRONMENT INITIATIVE(PEI) Service 3,590,000,000 1-Jul-14 30-Jun-18 373,829,669326 22100303 MANAGEMENT AND DISPOSAL OF PCBS IN RWANDA Service 1,417,370,400 12-Sep-12 2-Sep-15 651,348,224
WORLD BANK 8,996,970,000 1,752,540,597327 22100302 LAKE VICTORIA ENVIRONMENT & NR MANAGEMENT PROJECT (LVEMP
II)Service
8,996,970,000 29-Dec-11 1-Jun-17 1,752,540,597
UNITED NATIONS ENVRIONMENT PROGRAMME - UNEP 7,279,900,000 1,675,277,000328 22100304 OZONE Service 79,900,000 10-Jan-13 31-Dec-15 45,000,000329 22100307 STRENGTHENING INSTITUTIONAL CAPACITY OF THE MINISTRY OF
NATURAL RESOURCES IN RWANDAService
7,200,000,000 1-Jul-14 30-Jun-18 1,630,277,000
OTHER EXTRA BUDGETARY 3,782,100,000 0UNDP Service 3,782,100,000 0
330 SUPPORTING ECOSYSTEM REHABILITATION FOR PRO-POOR GREEN GROWTH (SERPG)
Service3,782,100,000 1-Jan-14 1-Dec-18
2202 RWANDA NATURAL RESOURCES AUTHORITY (RNRA) 73,387,061,888 11,713,440,46101 DOMESTIC FINANCING 2,544,663,075 2,544,663,075RWANDA 2,544,663,075 2,544,663,075
331 22110102 LAND TENURE REFORM PROJECT Service 291,837,675 1-Jul-14 30-Jun-15 291,837,675332 22120107 CONTRIBUTION TO THE IMPLEMENTATION OF AUTHORITY OF LAKE
KIVU BASIN AND RIVER RUSIZI-ABAKIRService
27,175,400 1-Jul-14 30-Jun-15 27,175,400
333 22120202 REDUCING VULNERABILITY TO CLIMATE CHANGE IN NORTH WEST RWANDA THROUGH COMMUNITY BASED ADAPTATION
Service36,000,000 1-Jul-14 30-Jun-15 36,000,000
334 22130106 PROJECT:CHINA BAMBOO Service 27,872,000 1-Jul-14 30-Jun-15 27,872,000335 22130110 GISHWATI AFFORESTATION Service 900,000,000 1-Jul-14 30-Jun-15 900,000,000336 22130111 SUPPORT TO NATIONAL FORESTRY RESEARCH AND EXTENSION Service 116,500,000 1-Jul-14 30-Jun-15 116,500,000337 22140103 DETAILED EXPLORATION: GEOLOGY, GEOPHYSICAL AND GEOCHEMICAL
SAMPLINGS IN 4PTASService
1,145,278,000 1-Jul-14 30-Jun-15 1,145,278,000
08 EXTERNAL GRANTS Service 70,842,398,813 9,168,777,386AFRICAN DEVELOPMENT BANK ADB Service 3,302,538,480 2,596,776,000
338 22130108 RWANDA SUSTAINABLE WOODLAND MANAGEMENT AND NATURAL FOREST RESTORATION
Service3,302,538,480 13-Feb-12 31-Dec-16 2,596,776,000
BELGIAN TECHNICAL COOPERATION - BTC 6,190,366,428 1,109,000,000339 22130105 PROJECT: SUPPORT REFORESTATION(PAREEF) Service 6,190,366,428 12-Jun-10 12-May-16 1,109,000,000
DFID and NETHERLAND 10,298,598,640 3,633,439,877340 22110104 LAND TENURE REGULARISATION SUPPORT PROJECT Service 10,298,598,640 1-Jun-14 30-Jun-16 3,633,439,877
INTERNATIONAL DEVELOPMENT ASSOCIATION 44,844,494,769 757,680,000341 22110204 LANDSCAPE APPROACH TO FOREST REST/CONSER (LDCF) PROJECT Service 44,844,494,769 27-Aug-14 31-Dec-19 757,680,000
INVESTMENT CLIMATE FACILITY 597,600,000 394,081,013342 22110106 LAND ADMNISTRATION SYSTEMS AND SUSTAINABILITY OF LTR Service 597,600,000 6-Jan-12 1-Nov-15 394,081,013
NETHERLAND 5,400,000,000 469,000,000343
22130112 SUPPORT PROGRAM TO THE REFORESTATION IN RWANDA (PAREF II) Service5,400,000,000 1-Aug-13 30-Jun-16 469,000,000
UNITED NATIONS FRAMEWORK CONVENTION ON CLIMATE CHANGE-UNFCCC208,800,496 208,800,496
344 22120202 REDUCING VULNERABILITY TO CLIMATE CHANGE IN NORTH WEST RWANDA THROUGH COMMUNITY BASED ADAPTATION
Service208,800,496 1-Jul-14 30-Jun-15 208,800,496
2304 RWANDA GOVERNANCE BOARD (RGB) 7,472,497,800 525,600,33808 EXTERNAL GRANTS 7,472,497,800 525,600,338UNDP Service 7,472,497,800 525,600,338
34523130211 DEEPENING DEMOCRACY AND ACCOUNTABLE GOVERNANCE PROJECT Service
2,560,305,000 1-Jul-13 30-Jun-18 275,600,338
34623130212 JOINT PROGRAMME ON STRENGTHENING CIVIL SOCIETY
ORGANIZATIONS FOR RESPONSIVE AND ACCOUNTABLE GOVERNANCE IN RWANDAService
4,912,192,800 27-May-14 27-May-18 250,000,000
2305 LOCAL DEVELOPMENT AGENCY (LODA) 2,810,132,916 2,810,132,91601 DOMESTIC FINANCING 1,800,000,000 1,800,000,000RWANDA 1,800,000,000 1,800,000,000
347 23091005 NUTRITION SUPPORT TO MALNOURISHED CHILDREN IS ENSURED Service 1,800,000,000 1-Jul-14 30-Jun-15 1,800,000,00008 EXTERNAL GRANTS 1,010,132,916 1,010,132,916DFID 420,000,000 420,000,000
348 23140101 SUPPORT SERVICES TO LG PROJECTS Service 420,000,000 1-Jul-14 30-Jun-15 420,000,000KFW 121,735,000 121,735,000
349 23140201 SUPPORT SERVICES TO LG PROJECTS Service 121,735,000 1-Jul-14 30-Jun-15 121,735,000NETHERLAND 450,032,916 450,032,916
350 23140201 SUPPORT SERVICES TO LG PROJECTS Service 450,032,916 1-Jul-14 30-Jun-15 450,032,916UNITED NATIONS CHILDREN'S FUND - UNICEF 18,365,000 18,365,000
351 23140202 SUPPORT TO LG IN THE IMPROVEMENT OF COMMUNITY PARTICIPATION IN DEVELOPMENT ACTVITIES
Service3,343,500 1-Jul-14 30-Jun-15 3,343,500
352 23140205 IMPROVEMENT OF COMMUNITY PARTICIPATION IN DEVELOPMENT ACTIVITIES
Service15,021,500 1-Jul-14 30-Jun-15 15,021,500
2306 NATIONAL COMMISION FOR DEMOBILISATIO AND REINTEGRATION (NCDR)
7,360,148,300 2,065,012,467
09 EXTERNAL LOANS 7,360,148,300 2,065,012,467WORLD BANK 7,356,948,300 2,061,812,467
353 23150102 DEMOBILISATION, REINTEGRATION AND REINSERTION Service 7,356,948,300 31-Dec-13 31-Dec-17 2,061,812,467WORLD FOOD PROGRAMME 3,200,000 3,200,000
354 23150203 REINTEGRATION Service 3,200,000 1-Jul-14 30-Jun-15 3,200,0002315 RWANDA BROADCASTING AGENCY 417,286,935 417,286,93501 DOMESTIC FINANCING 417,286,935 417,286,935RWANDA 417,286,935 417,286,935
355 23190402 MODERNISATION, DIGITALISATION AND EXTENSION Service 417,286,935 1-Jul-14 30-Jun-15 417,286,9352316 MEDIA HIGH COUNCIL 791,250,000 162,184,23608 EXTERNAL GRANTS 791,250,000 162,184,236UNDP 791,250,000 162,184,236

356 23200114 DEEPENING DEMOCRACY AND ACCOUNTABLE GOVERNANCE PROGRAMME.
Service791,250,000 1-Jul-13 30-Jun-18 162,184,236
2500 MIDIMAR 6,391,426,490 6,287,360,78408 EXTERNAL GRANTS 6,391,426,490 6,287,360,784UNDP 1,027,156,586 923,090,880
357 25060105 BUILDING NATIONAL AND LOCAL CAPACITIES FOR DISASTER RISK MANAGEMENT IN RWANDA
Service1,027,156,586 1-Sep-11 31-Dec-18 923,090,880
UNITED NATIONS HIGH COMMISSIONER FOR REFUGEES ( UNHCR) 5,364,269,904 5,364,269,904358 25050106 SUPPORT TO RWANDAN RETURN AND REINTEGRATION Service 3,485,547,050 10-Feb-14 31-Mar-15 3,485,547,050359 25050202 PROTECTION AND ASSISTANCE TO REFUGEES Service 1,878,722,854 10-Feb-14 31-Mar-15 1,878,722,854
2600 MIGEPROF 1,901,226,475 928,733,11708 EXTERNAL GRANTS 1,755,000,000 928,733,117WORLD BANK 1,755,000,000 928,733,117
360 26020107 RWANDA PROMOTING THE ECONOMIC EMPOWERMENT OF ADOLESCENT GIRLS AND YOUNG WOMEN PROJECT
Service1,755,000,000 19-May-11 31-Dec-14 928,733,117
OTHER EXTRA BUDGETARY 146,226,475 0NETHERLANDS 146,226,475 0
361 26020216 NATIONAL SCALE UP OF ISANGE ONE STOP CENTRE MODEL IN RWANDA PROJECT
Service146,226,475 1-Jul-14 30-Jun-15
2601 NATIONAL WOMEN COUNCIL(NWC) 418,277,622 418,277,62201 DOMESTIC FINANCING 418,277,622 418,277,622RWANDA 418,277,622 418,277,622
362 26030105 WOMEN EMPOWERMENT PROJECT Service 418,277,622 1-Jul-14 30-Jun-15 418,277,6222602 GENDER MONITORING OFFICE (GMO) 839,853,742 618,495,66808 EXTERNAL GRANTS 839,853,742 618,495,668SWEDISH INTERNATIONAL DEVELOPMENT AGENCY 839,853,742 618,495,668
363 26010402 ADVANCING AND SUSTAINING GENDER EQUALITY GAINS IN RWANDA(GMO)
Service839,853,742 7-Mar-14 30-Sep-15 618,495,668
2603 NATIONAL COMMISSION FOR CHILDREN (NCC) 3,583,251,407 3,583,251,40701 DOMESTIC FINANCING 2,741,749,391 2,741,749,391RWANDA 2,741,749,391 2,741,749,391
364 26050127 SINGLE STREAM OF FUNDING FOR HIV/GF Service 2,741,749,391 1-Jul-14 30-Jun-15 2,741,749,39108 EXTERNAL GRANTS 841,502,016 841,502,016UNITED NATIONS CHILDREN'S FUND - UNICEF 841,502,016 841,502,016
365 26050129 TUBARERE MU MURYANGO PROGRAM (TMM) Service 841,502,016 1-Jul-14 30-Jun-15 841,502,0164000 NGOMA DISTRICT 3,883,206,668 3,883,206,66802 EARMARKED TRANSFERS (DISTRICTS) 3,146,215,702 3,146,215,702ENERGY, WATER AND SANITATION AUTHORITY (EWSA) Service 28,800,000 28,800,000
366 40540201 IMPROVE BIOMASS USE EFFICIENCY Service 28,800,000 1-Jul-14 30-Jun-15 28,800,000RWANDA Service 35,123,740 35,123,740
367 40490211 SOCIAL PROTECTION PROVISION AND COORDINATION PROJECT Service 35,123,740 1-Jul-14 30-Jun-15 35,123,740RWANDA Service 3,082,291,962 3,082,291,962
368 40460129 DISTRICT CAPACITIES STRENGTHENING PROJECT Service 97,822,382 1-Jul-14 30-Jun-15 97,822,382369 40470210 EDUCATION INFRASTRUCTURES PROJECT Service 143,984,400 1-Jul-14 30-Jun-15 143,984,400370 40490208 SOCIAL PROTECTION PROJECT Service 235,501,770 1-Jul-14 30-Jun-15 235,501,770371 40500303 NATIONAL EMPLOYEMENT PROGRAM (NEP) PROJECTS Service 16,624,613 1-Jul-14 30-Jun-15 16,624,613372 40510105 MARKET ORIENTED INFRASTRUCTURES PROJECT Service 73,447,867 1-Jul-14 30-Jun-15 73,447,867373 40510107 MARKET ORIENTED INFRASTRUCTURES PROJECT Service 1,096,486,748 1-Jul-14 30-Jun-15 1,096,486,748374 40520103 AGRICULTURAL PRODUCTION SYSTEMS DEVELOPMENT PROJECT Service 159,328,900 1-Jul-14 30-Jun-15 159,328,900375 40520202 LIVESTOCK DEVELOPMENT PROJECT Service 81,183,299 1-Jul-14 30-Jun-15 81,183,299376 40530104 NATURAL RESOURCES SUSTAINABLE MANAGEMENT PROJECT Service 58,366,732 1-Jul-14 30-Jun-15 58,366,732377 40550104 WATER AND SANITATION INFRASTRUCTURES PROJECT Service 212,059,058 1-Jul-14 30-Jun-15 212,059,058378 40560201 URBAN AND RURAL SETTLEMENT PROJECT Service 82,045,836 1-Jul-14 30-Jun-15 82,045,836379 40570107 ROADS INFRASTRUCTURES PROJECT Service 825,440,357 1-Jul-14 30-Jun-15 825,440,357
08 EXTERNAL GRANTS 736,990,966 736,990,966DFID Service 327,261,739 327,261,73940490208 SOCIAL PROTECTION PROJECT Service 227,481,023 1-Jul-14 30-Jun-15 227,481,023
378 40520102 AGRICULTURAL PRODUCTION SYSTEMS DEVELOPMENT AND
INTENSIFICATION PROJECTService
10,692,600 1-Jul-14 30-Jun-15 10,692,600
379 40550104 WATER AND SANITATION INFRASTRUCTURES PROJECT Service 39,088,116 1-Jul-14 30-Jun-15 39,088,116380 40570102 ROADS INFRASTRUCTURE MANAGEMENT PROJECT Service 50,000,000 1-Jul-14 30-Jun-15 50,000,000
KFW 107,341,007 107,341,007381 40570107 ROADS INFRASTRUCTURES PROJECT Service 107,341,007 1-Jul-14 30-Jun-15 107,341,007
NETHERLAND Service 302,388,220 302,388,220382 40510107 MARKET ORIENTED INFRASTRUCTURES PROJECT Service 126,482,823 1-Jul-14 30-Jun-15 126,482,823383 40550104 WATER AND SANITATION INFRASTRUCTURES PROJECT Service 60,000,000 1-Jul-14 30-Jun-15 60,000,000384 40570107 ROADS INFRASTRUCTURES PROJECT Service 115,905,397 1-Jul-14 30-Jun-15 115,905,397
4100 BUGESERA DISTRICT 4,036,372,408 4,036,372,40802 EARMARKED TRANSFERS (DISTRICTS) 2,982,416,697 2,982,416,697ENERGY, WATER AND SANITATION AUTHORITY (EWSA) 37,800,000 37,800,000
385 41540203 IMPROVE BIOMASS USE EFFICIENCY Service 37,800,000 1-Jul-14 30-Jun-15 37,800,000RWANDA 2,944,616,697 2,944,616,697
386 41460130 DISTRICT CAPACITIES SUPPORT PROJECT Service 149,304,776 1-Jul-14 30-Jun-15 149,304,776387 41470211 EDUCATION INFRASTRUCTURES PROJECT Service 380,690,475 1-Jul-14 30-Jun-15 380,690,475388 41480204 HEALTH INFRASTRUCTURES PROJECT Service 40,183,050 1-Jul-14 30-Jun-15 40,183,050389 41490228 1. SOCIAL PROTECTION PROVISION AND COORDINATION PROJECT Service 28,458,592 1-Jul-14 30-Jun-15 28,458,592390 41490233 SOCIAL PROTECTION PROJECT Service 258,336,473 1-Jul-14 30-Jun-15 258,336,473391 41500305 NATIONAL EMPLOYEMENT PROGRAM (NEP) PROJECTS Service 12,950,752 1-Jul-14 30-Jun-15 12,950,752392 41510121 MARKET ORIENTED INFRASTRUCTURES PROJECT Service 45,451,371 1-Jul-14 30-Jun-15 45,451,371393 41510122 MARKET ORIENTED INFRASTRUCTURES PROJECT Service 232,106,000 1-Jul-14 30-Jun-15 232,106,000394 41520112 AGRICULTURAL PRODUCTION SYSTEMS DEVELOPMENT PROJECT Service 123,621,319 1-Jul-14 30-Jun-15 123,621,319395 41520203 LIVESTOCK DEVELOPMENT PROJECT Service 49,395,012 1-Jul-14 30-Jun-15 49,395,012396 41530106 NATURAL RESOURCES SUSTAINABLE MANAGEMENT PROJECT Service 2,898,720 1-Jul-14 30-Jun-15 2,898,720397 41530107 NATURAL RESOURCES SUSTAINABLE MANAGEMENT PROJECT Service 32,869,062 1-Jul-14 30-Jun-15 32,869,062398 41540103 ENERGY DEVELOPMENT AND ELECTRICITY PROVISION PROJECT Service 178,893,681 1-Jul-14 30-Jun-15 178,893,681399 41560203 URBAN AND RURAL SETTLEMENT PROJECT Service 55,760,472 1-Jul-14 30-Jun-15 55,760,472400 41570102 ROADS INFRASTRUCTURES PROJECT Service 1,322,214,942 1-Jul-14 30-Jun-15 1,322,214,942401 41570104 ROADS MAINTENANCE PROJECT Service 31,482,000 1-Jul-14 30-Jun-15 31,482,000
08 EXTERNAL GRANTS 1,053,955,711 1,053,955,711DFID 590,738,193 590,738,193
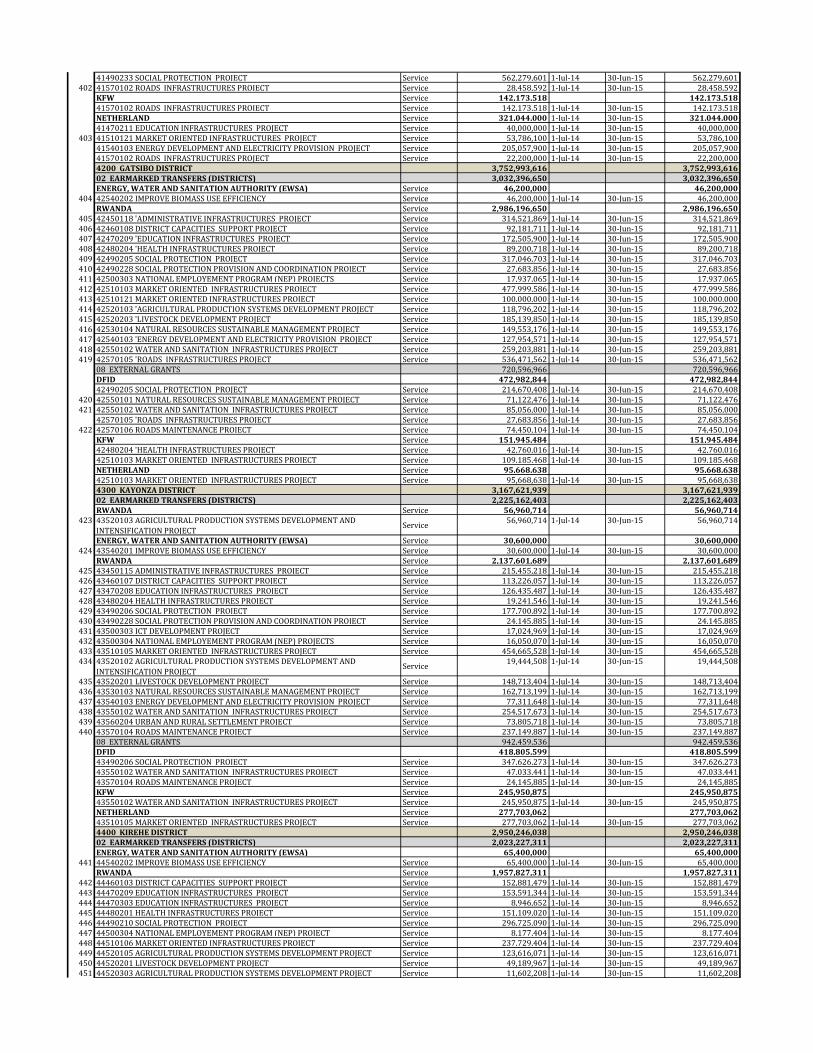
41490233 SOCIAL PROTECTION PROJECT Service 562,279,601 1-Jul-14 30-Jun-15 562,279,601402 41570102 ROADS INFRASTRUCTURES PROJECT Service 28,458,592 1-Jul-14 30-Jun-15 28,458,592
KFW Service 142,173,518 142,173,51841570102 ROADS INFRASTRUCTURES PROJECT Service 142,173,518 1-Jul-14 30-Jun-15 142,173,518NETHERLAND Service 321,044,000 1-Jul-14 30-Jun-15 321,044,00041470211 EDUCATION INFRASTRUCTURES PROJECT Service 40,000,000 1-Jul-14 30-Jun-15 40,000,000
403 41510121 MARKET ORIENTED INFRASTRUCTURES PROJECT Service 53,786,100 1-Jul-14 30-Jun-15 53,786,10041540103 ENERGY DEVELOPMENT AND ELECTRICITY PROVISION PROJECT Service 205,057,900 1-Jul-14 30-Jun-15 205,057,90041570102 ROADS INFRASTRUCTURES PROJECT Service 22,200,000 1-Jul-14 30-Jun-15 22,200,0004200 GATSIBO DISTRICT 3,752,993,616 3,752,993,61602 EARMARKED TRANSFERS (DISTRICTS) 3,032,396,650 3,032,396,650ENERGY, WATER AND SANITATION AUTHORITY (EWSA) Service 46,200,000 46,200,000
404 42540202 IMPROVE BIOMASS USE EFFICIENCY Service 46,200,000 1-Jul-14 30-Jun-15 46,200,000RWANDA Service 2,986,196,650 2,986,196,650
405 42450118 'ADMINISTRATIVE INFRASTRUCTURES PROJECT Service 314,521,869 1-Jul-14 30-Jun-15 314,521,869406 42460108 DISTRICT CAPACITIES SUPPORT PROJECT Service 92,181,711 1-Jul-14 30-Jun-15 92,181,711407 42470209 'EDUCATION INFRASTRUCTURES PROJECT Service 172,505,900 1-Jul-14 30-Jun-15 172,505,900408 42480204 'HEALTH INFRASTRUCTURES PROJECT Service 89,200,718 1-Jul-14 30-Jun-15 89,200,718409 42490205 SOCIAL PROTECTION PROJECT Service 317,046,703 1-Jul-14 30-Jun-15 317,046,703410 42490228 SOCIAL PROTECTION PROVISION AND COORDINATION PROJECT Service 27,683,856 1-Jul-14 30-Jun-15 27,683,856411 42500303 NATIONAL EMPLOYEMENT PROGRAM (NEP) PROJECTS Service 17,937,065 1-Jul-14 30-Jun-15 17,937,065412 42510103 MARKET ORIENTED INFRASTRUCTURES PROJECT Service 477,999,586 1-Jul-14 30-Jun-15 477,999,586413 42510121 MARKET ORIENTED INFRASTRUCTURES PROJECT Service 100,000,000 1-Jul-14 30-Jun-15 100,000,000414 42520103 'AGRICULTURAL PRODUCTION SYSTEMS DEVELOPMENT PROJECT Service 118,796,202 1-Jul-14 30-Jun-15 118,796,202415 42520203 'LIVESTOCK DEVELOPMENT PROJECT Service 185,139,850 1-Jul-14 30-Jun-15 185,139,850416 42530104 NATURAL RESOURCES SUSTAINABLE MANAGEMENT PROJECT Service 149,553,176 1-Jul-14 30-Jun-15 149,553,176417 42540103 'ENERGY DEVELOPMENT AND ELECTRICITY PROVISION PROJECT Service 127,954,571 1-Jul-14 30-Jun-15 127,954,571418 42550102 WATER AND SANITATION INFRASTRUCTURES PROJECT Service 259,203,881 1-Jul-14 30-Jun-15 259,203,881419 42570105 'ROADS INFRASTRUCTURES PROJECT Service 536,471,562 1-Jul-14 30-Jun-15 536,471,562
08 EXTERNAL GRANTS 720,596,966 720,596,966DFID 472,982,844 472,982,84442490205 SOCIAL PROTECTION PROJECT Service 214,670,408 1-Jul-14 30-Jun-15 214,670,408
420 42550101 NATURAL RESOURCES SUSTAINABLE MANAGEMENT PROJECT Service 71,122,476 1-Jul-14 30-Jun-15 71,122,476421 42550102 WATER AND SANITATION INFRASTRUCTURES PROJECT Service 85,056,000 1-Jul-14 30-Jun-15 85,056,000
42570105 'ROADS INFRASTRUCTURES PROJECT Service 27,683,856 1-Jul-14 30-Jun-15 27,683,856422 42570106 ROADS MAINTENANCE PROJECT Service 74,450,104 1-Jul-14 30-Jun-15 74,450,104
KFW Service 151,945,484 151,945,48442480204 'HEALTH INFRASTRUCTURES PROJECT Service 42,760,016 1-Jul-14 30-Jun-15 42,760,01642510103 MARKET ORIENTED INFRASTRUCTURES PROJECT Service 109,185,468 1-Jul-14 30-Jun-15 109,185,468NETHERLAND Service 95,668,638 95,668,63842510103 MARKET ORIENTED INFRASTRUCTURES PROJECT Service 95,668,638 1-Jul-14 30-Jun-15 95,668,6384300 KAYONZA DISTRICT 3,167,621,939 3,167,621,93902 EARMARKED TRANSFERS (DISTRICTS) 2,225,162,403 2,225,162,403RWANDA Service 56,960,714 56,960,714
423 43520103 AGRICULTURAL PRODUCTION SYSTEMS DEVELOPMENT AND INTENSIFICATION PROJECT
Service56,960,714 1-Jul-14 30-Jun-15 56,960,714
ENERGY, WATER AND SANITATION AUTHORITY (EWSA) Service 30,600,000 30,600,000424 43540201 IMPROVE BIOMASS USE EFFICIENCY Service 30,600,000 1-Jul-14 30-Jun-15 30,600,000
RWANDA Service 2,137,601,689 2,137,601,689425 43450115 ADMINISTRATIVE INFRASTRUCTURES PROJECT Service 215,455,218 1-Jul-14 30-Jun-15 215,455,218426 43460107 DISTRICT CAPACITIES SUPPORT PROJECT Service 113,226,057 1-Jul-14 30-Jun-15 113,226,057427 43470208 EDUCATION INFRASTRUCTURES PROJECT Service 126,435,487 1-Jul-14 30-Jun-15 126,435,487428 43480204 HEALTH INFRASTRUCTURES PROJECT Service 19,241,546 1-Jul-14 30-Jun-15 19,241,546429 43490206 SOCIAL PROTECTION PROJECT Service 177,700,892 1-Jul-14 30-Jun-15 177,700,892430 43490228 SOCIAL PROTECTION PROVISION AND COORDINATION PROJECT Service 24,145,885 1-Jul-14 30-Jun-15 24,145,885431 43500303 ICT DEVELOPMENT PROJECT Service 17,024,969 1-Jul-14 30-Jun-15 17,024,969432 43500304 NATIONAL EMPLOYEMENT PROGRAM (NEP) PROJECTS Service 16,050,070 1-Jul-14 30-Jun-15 16,050,070433 43510105 MARKET ORIENTED INFRASTRUCTURES PROJECT Service 454,665,528 1-Jul-14 30-Jun-15 454,665,528434 43520102 AGRICULTURAL PRODUCTION SYSTEMS DEVELOPMENT AND
INTENSIFICATION PROJECTService
19,444,508 1-Jul-14 30-Jun-15 19,444,508
435 43520201 LIVESTOCK DEVELOPMENT PROJECT Service 148,713,404 1-Jul-14 30-Jun-15 148,713,404436 43530103 NATURAL RESOURCES SUSTAINABLE MANAGEMENT PROJECT Service 162,713,199 1-Jul-14 30-Jun-15 162,713,199437 43540103 ENERGY DEVELOPMENT AND ELECTRICITY PROVISION PROJECT Service 77,311,648 1-Jul-14 30-Jun-15 77,311,648438 43550102 WATER AND SANITATION INFRASTRUCTURES PROJECT Service 254,517,673 1-Jul-14 30-Jun-15 254,517,673439 43560204 URBAN AND RURAL SETTLEMENT PROJECT Service 73,805,718 1-Jul-14 30-Jun-15 73,805,718440 43570104 ROADS MAINTENANCE PROJECT Service 237,149,887 1-Jul-14 30-Jun-15 237,149,887
08 EXTERNAL GRANTS 942,459,536 942,459,536DFID 418,805,599 418,805,59943490206 SOCIAL PROTECTION PROJECT Service 347,626,273 1-Jul-14 30-Jun-15 347,626,27343550102 WATER AND SANITATION INFRASTRUCTURES PROJECT Service 47,033,441 1-Jul-14 30-Jun-15 47,033,44143570104 ROADS MAINTENANCE PROJECT Service 24,145,885 1-Jul-14 30-Jun-15 24,145,885KFW Service 245,950,875 245,950,87543550102 WATER AND SANITATION INFRASTRUCTURES PROJECT Service 245,950,875 1-Jul-14 30-Jun-15 245,950,875NETHERLAND Service 277,703,062 277,703,06243510105 MARKET ORIENTED INFRASTRUCTURES PROJECT Service 277,703,062 1-Jul-14 30-Jun-15 277,703,0624400 KIREHE DISTRICT 2,950,246,038 2,950,246,03802 EARMARKED TRANSFERS (DISTRICTS) 2,023,227,311 2,023,227,311ENERGY, WATER AND SANITATION AUTHORITY (EWSA) 65,400,000 65,400,000
441 44540202 IMPROVE BIOMASS USE EFFICIENCY Service 65,400,000 1-Jul-14 30-Jun-15 65,400,000RWANDA Service 1,957,827,311 1,957,827,311
442 44460103 DISTRICT CAPACITIES SUPPORT PROJECT Service 152,881,479 1-Jul-14 30-Jun-15 152,881,479443 44470209 EDUCATION INFRASTRUCTURES PROJECT Service 153,591,344 1-Jul-14 30-Jun-15 153,591,344444 44470303 EDUCATION INFRASTRUCTURES PROJECT Service 8,946,652 1-Jul-14 30-Jun-15 8,946,652445 44480201 HEALTH INFRASTRUCTURES PROJECT Service 151,109,020 1-Jul-14 30-Jun-15 151,109,020446 44490210 SOCIAL PROTECTION PROJECT Service 296,725,090 1-Jul-14 30-Jun-15 296,725,090447 44500304 NATIONAL EMPLOYEMENT PROGRAM (NEP) PROJECT Service 8,177,404 1-Jul-14 30-Jun-15 8,177,404448 44510106 MARKET ORIENTED INFRASTRUCTURES PROJECT Service 237,729,404 1-Jul-14 30-Jun-15 237,729,404449 44520105 AGRICULTURAL PRODUCTION SYSTEMS DEVELOPMENT PROJECT Service 123,616,071 1-Jul-14 30-Jun-15 123,616,071450 44520201 LIVESTOCK DEVELOPMENT PROJECT Service 49,189,967 1-Jul-14 30-Jun-15 49,189,967451 44520303 AGRICULTURAL PRODUCTION SYSTEMS DEVELOPMENT PROJECT Service 11,602,208 1-Jul-14 30-Jun-15 11,602,208
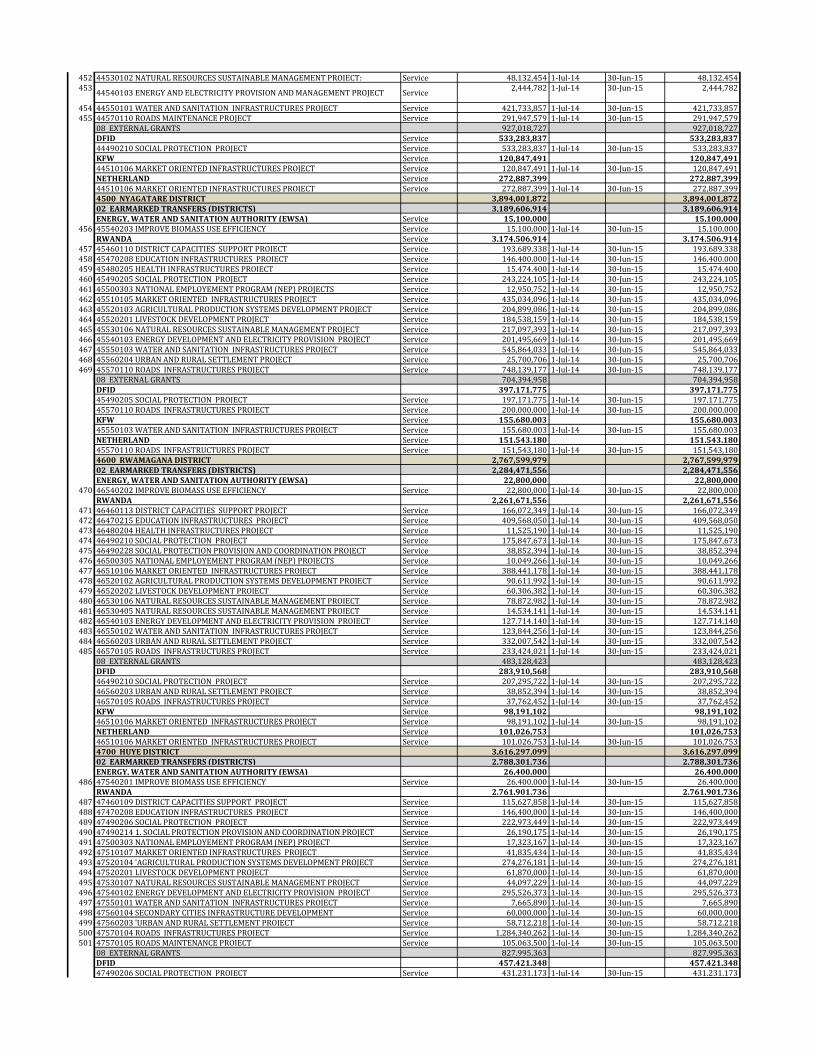
452 44530102 NATURAL RESOURCES SUSTAINABLE MANAGEMENT PROJECT: Service 48,132,454 1-Jul-14 30-Jun-15 48,132,454453
44540103 ENERGY AND ELECTRICITY PROVISION AND MANAGEMENT PROJECT Service2,444,782 1-Jul-14 30-Jun-15 2,444,782
454 44550101 WATER AND SANITATION INFRASTRUCTURES PROJECT Service 421,733,857 1-Jul-14 30-Jun-15 421,733,857455 44570110 ROADS MAINTENANCE PROJECT Service 291,947,579 1-Jul-14 30-Jun-15 291,947,579
08 EXTERNAL GRANTS 927,018,727 927,018,727DFID Service 533,283,837 533,283,83744490210 SOCIAL PROTECTION PROJECT Service 533,283,837 1-Jul-14 30-Jun-15 533,283,837KFW Service 120,847,491 120,847,49144510106 MARKET ORIENTED INFRASTRUCTURES PROJECT Service 120,847,491 1-Jul-14 30-Jun-15 120,847,491NETHERLAND Service 272,887,399 272,887,39944510106 MARKET ORIENTED INFRASTRUCTURES PROJECT Service 272,887,399 1-Jul-14 30-Jun-15 272,887,3994500 NYAGATARE DISTRICT 3,894,001,872 3,894,001,87202 EARMARKED TRANSFERS (DISTRICTS) 3,189,606,914 3,189,606,914ENERGY, WATER AND SANITATION AUTHORITY (EWSA) Service 15,100,000 15,100,000
456 45540203 IMPROVE BIOMASS USE EFFICIENCY Service 15,100,000 1-Jul-14 30-Jun-15 15,100,000RWANDA Service 3,174,506,914 3,174,506,914
457 45460110 DISTRICT CAPACITIES SUPPORT PROJECT Service 193,689,338 1-Jul-14 30-Jun-15 193,689,338458 45470208 EDUCATION INFRASTRUCTURES PROJECT Service 146,400,000 1-Jul-14 30-Jun-15 146,400,000459 45480205 HEALTH INFRASTRUCTURES PROJECT Service 15,474,400 1-Jul-14 30-Jun-15 15,474,400460 45490205 SOCIAL PROTECTION PROJECT Service 243,224,105 1-Jul-14 30-Jun-15 243,224,105461 45500303 NATIONAL EMPLOYEMENT PROGRAM (NEP) PROJECTS Service 12,950,752 1-Jul-14 30-Jun-15 12,950,752462 45510105 MARKET ORIENTED INFRASTRUCTURES PROJECT Service 435,034,096 1-Jul-14 30-Jun-15 435,034,096463 45520103 AGRICULTURAL PRODUCTION SYSTEMS DEVELOPMENT PROJECT Service 204,899,086 1-Jul-14 30-Jun-15 204,899,086464 45520201 LIVESTOCK DEVELOPMENT PROJECT Service 184,538,159 1-Jul-14 30-Jun-15 184,538,159465 45530106 NATURAL RESOURCES SUSTAINABLE MANAGEMENT PROJECT Service 217,097,393 1-Jul-14 30-Jun-15 217,097,393466 45540103 ENERGY DEVELOPMENT AND ELECTRICITY PROVISION PROJECT Service 201,495,669 1-Jul-14 30-Jun-15 201,495,669467 45550103 WATER AND SANITATION INFRASTRUCTURES PROJECT Service 545,864,033 1-Jul-14 30-Jun-15 545,864,033468 45560204 URBAN AND RURAL SETTLEMENT PROJECT Service 25,700,706 1-Jul-14 30-Jun-15 25,700,706469 45570110 ROADS INFRASTRUCTURES PROJECT Service 748,139,177 1-Jul-14 30-Jun-15 748,139,177
08 EXTERNAL GRANTS 704,394,958 704,394,958DFID 397,171,775 397,171,77545490205 SOCIAL PROTECTION PROJECT Service 197,171,775 1-Jul-14 30-Jun-15 197,171,77545570110 ROADS INFRASTRUCTURES PROJECT Service 200,000,000 1-Jul-14 30-Jun-15 200,000,000KFW Service 155,680,003 155,680,00345550103 WATER AND SANITATION INFRASTRUCTURES PROJECT Service 155,680,003 1-Jul-14 30-Jun-15 155,680,003NETHERLAND Service 151,543,180 151,543,18045570110 ROADS INFRASTRUCTURES PROJECT Service 151,543,180 1-Jul-14 30-Jun-15 151,543,1804600 RWAMAGANA DISTRICT 2,767,599,979 2,767,599,97902 EARMARKED TRANSFERS (DISTRICTS) 2,284,471,556 2,284,471,556ENERGY, WATER AND SANITATION AUTHORITY (EWSA) 22,800,000 22,800,000
470 46540202 IMPROVE BIOMASS USE EFFICIENCY Service 22,800,000 1-Jul-14 30-Jun-15 22,800,000RWANDA 2,261,671,556 2,261,671,556
471 46460113 DISTRICT CAPACITIES SUPPORT PROJECT Service 166,072,349 1-Jul-14 30-Jun-15 166,072,349472 46470215 EDUCATION INFRASTRUCTURES PROJECT Service 409,568,050 1-Jul-14 30-Jun-15 409,568,050473 46480204 HEALTH INFRASTRUCTURES PROJECT Service 11,525,190 1-Jul-14 30-Jun-15 11,525,190474 46490210 SOCIAL PROTECTION PROJECT Service 175,847,673 1-Jul-14 30-Jun-15 175,847,673475 46490228 SOCIAL PROTECTION PROVISION AND COORDINATION PROJECT Service 38,852,394 1-Jul-14 30-Jun-15 38,852,394476 46500305 NATIONAL EMPLOYEMENT PROGRAM (NEP) PROJECTS Service 10,049,266 1-Jul-14 30-Jun-15 10,049,266477 46510106 MARKET ORIENTED INFRASTRUCTURES PROJECT Service 388,441,178 1-Jul-14 30-Jun-15 388,441,178478 46520102 AGRICULTURAL PRODUCTION SYSTEMS DEVELOPMENT PROJECT Service 90,611,992 1-Jul-14 30-Jun-15 90,611,992479 46520202 LIVESTOCK DEVELOPMENT PROJECT Service 60,306,382 1-Jul-14 30-Jun-15 60,306,382480 46530106 NATURAL RESOURCES SUSTAINABLE MANAGEMENT PROJECT Service 78,872,982 1-Jul-14 30-Jun-15 78,872,982481 46530405 NATURAL RESOURCES SUSTAINABLE MANAGEMENT PROJECT Service 14,534,141 1-Jul-14 30-Jun-15 14,534,141482 46540103 ENERGY DEVELOPMENT AND ELECTRICITY PROVISION PROJECT Service 127,714,140 1-Jul-14 30-Jun-15 127,714,140483 46550102 WATER AND SANITATION INFRASTRUCTURES PROJECT Service 123,844,256 1-Jul-14 30-Jun-15 123,844,256484 46560203 URBAN AND RURAL SETTLEMENT PROJECT Service 332,007,542 1-Jul-14 30-Jun-15 332,007,542485 46570105 ROADS INFRASTRUCTURES PROJECT Service 233,424,021 1-Jul-14 30-Jun-15 233,424,021
08 EXTERNAL GRANTS 483,128,423 483,128,423DFID 283,910,568 283,910,56846490210 SOCIAL PROTECTION PROJECT Service 207,295,722 1-Jul-14 30-Jun-15 207,295,72246560203 URBAN AND RURAL SETTLEMENT PROJECT Service 38,852,394 1-Jul-14 30-Jun-15 38,852,39446570105 ROADS INFRASTRUCTURES PROJECT Service 37,762,452 1-Jul-14 30-Jun-15 37,762,452KFW Service 98,191,102 98,191,10246510106 MARKET ORIENTED INFRASTRUCTURES PROJECT Service 98,191,102 1-Jul-14 30-Jun-15 98,191,102NETHERLAND Service 101,026,753 101,026,75346510106 MARKET ORIENTED INFRASTRUCTURES PROJECT Service 101,026,753 1-Jul-14 30-Jun-15 101,026,7534700 HUYE DISTRICT 3,616,297,099 3,616,297,09902 EARMARKED TRANSFERS (DISTRICTS) 2,788,301,736 2,788,301,736ENERGY, WATER AND SANITATION AUTHORITY (EWSA) 26,400,000 26,400,000
486 47540201 IMPROVE BIOMASS USE EFFICIENCY Service 26,400,000 1-Jul-14 30-Jun-15 26,400,000RWANDA 2,761,901,736 2,761,901,736
487 47460109 DISTRICT CAPACITIES SUPPORT PROJECT Service 115,627,858 1-Jul-14 30-Jun-15 115,627,858488 47470208 EDUCATION INFRASTRUCTURES PROJECT Service 146,400,000 1-Jul-14 30-Jun-15 146,400,000489 47490206 SOCIAL PROTECTION PROJECT Service 222,973,449 1-Jul-14 30-Jun-15 222,973,449490 47490214 1. SOCIAL PROTECTION PROVISION AND COORDINATION PROJECT Service 26,190,175 1-Jul-14 30-Jun-15 26,190,175491 47500303 NATIONAL EMPLOYEMENT PROGRAM (NEP) PROJECT Service 17,323,167 1-Jul-14 30-Jun-15 17,323,167492 47510107 MARKET ORIENTED INFRASTRUCTURES PROJECT Service 41,835,434 1-Jul-14 30-Jun-15 41,835,434493 47520104 'AGRICULTURAL PRODUCTION SYSTEMS DEVELOPMENT PROJECT Service 274,276,181 1-Jul-14 30-Jun-15 274,276,181494 47520201 LIVESTOCK DEVELOPMENT PROJECT Service 61,870,000 1-Jul-14 30-Jun-15 61,870,000495 47530107 NATURAL RESOURCES SUSTAINABLE MANAGEMENT PROJECT Service 44,097,229 1-Jul-14 30-Jun-15 44,097,229496 47540102 ENERGY DEVELOPMENT AND ELECTRICITY PROVISION PROJECT Service 295,526,373 1-Jul-14 30-Jun-15 295,526,373497 47550101 WATER AND SANITATION INFRASTRUCTURES PROJECT Service 7,665,890 1-Jul-14 30-Jun-15 7,665,890498 47560104 SECONDARY CITIES INFRASTRUCTURE DEVELOPMENT Service 60,000,000 1-Jul-14 30-Jun-15 60,000,000499 47560203 'URBAN AND RURAL SETTLEMENT PROJECT Service 58,712,218 1-Jul-14 30-Jun-15 58,712,218500 47570104 ROADS INFRASTRUCTURES PROJECT Service 1,284,340,262 1-Jul-14 30-Jun-15 1,284,340,262501 47570105 ROADS MAINTENANCE PROJECT Service 105,063,500 1-Jul-14 30-Jun-15 105,063,500
08 EXTERNAL GRANTS 827,995,363 827,995,363DFID 457,421,348 457,421,34847490206 SOCIAL PROTECTION PROJECT Service 431,231,173 1-Jul-14 30-Jun-15 431,231,173

47570104 ROADS INFRASTRUCTURES PROJECT Service 26,190,175 1-Jul-14 30-Jun-15 26,190,175KFW Service 113,738,815 113,738,81547560203 'URBAN AND RURAL SETTLEMENT PROJECT Service 113,738,815 1-Jul-14 30-Jun-15 113,738,815NETHERLAND Service 256,835,200 256,835,20047570104 ROADS INFRASTRUCTURES PROJECT Service 256,835,200 1-Jul-14 30-Jun-15 256,835,2004800 NYAMAGABE DISTRICT 3,645,716,707 3,645,716,70702 EARMARKED TRANSFERS (DISTRICTS) 2,502,631,385 2,502,631,385ENERGY, WATER AND SANITATION AUTHORITY (EWSA) Service 34,500,000 34,500,000
502 48540201 IMPROVE BIOMASS USE EFFICIENCY Service 34,500,000 1-Jul-14 30-Jun-15 34,500,000RWANDA 35,425,550 35,425,550
503 48490232 SOCIAL PROTECTION PROVISION AND COORDINATION PROJECT Service 35,425,550 1-Jul-14 30-Jun-15 35,425,550RWANDA 2,432,705,835 2,432,705,835
504 48450140 ADMINISTRATIVE INFRASTRUCTURES PROJECT Service 315,920,000 1-Jul-14 30-Jun-15 315,920,000505 48460132 DISTRICT CAPACITIES SUPPORT PROJECT Service 118,111,258 1-Jul-14 30-Jun-15 118,111,258506 48460133 ICT DEVELOPMENT PROJECT Service 15,000,000 1-Jul-14 30-Jun-15 15,000,000507 48470210 EDUCATION INFRASTRUCTURES PROJECT Service 211,737,518 1-Jul-14 30-Jun-15 211,737,518508 48480201 HEALTH INFRASTRUCTURES PROJECT Service 81,994,677 1-Jul-14 30-Jun-15 81,994,677509 48490233 SOCIAL PROTECTION PROJECT Service 405,351,127 1-Jul-14 30-Jun-15 405,351,127510 48500321 NATIONAL EMPLOYEMENT PROGRAM (NEP) PROJECTS Service 15,307,022 1-Jul-14 30-Jun-15 15,307,022511 48510113 NATIONAL EMPLOYEMENT PROGRAM (NEP) PROJECTS Service 1,317,590 1-Jul-14 30-Jun-15 1,317,590512 48520101 AGRICULTURAL PRODUCTION SYSTEMS DEVELOPMENT PROJECT Service 343,448,225 1-Jul-14 30-Jun-15 343,448,225513 48520202 LIVESTOCK DEVELOPMENT PROJECT Service 76,037,750 1-Jul-14 30-Jun-15 76,037,750514 48530101 NATURAL RESOURCES SUSTAINABLE MANAGEMENT PROJECT Service 87,997,844 1-Jul-14 30-Jun-15 87,997,844515 48530103 NATURAL RESOURCES SUSTAINABLE MANAGEMENT PROJECT Service 54,256,681 1-Jul-14 30-Jun-15 54,256,681516 48540102 ENERGY DEVELOPMENT AND ELECTRICITY PROVISION PROJECT Service 140,399,732 1-Jul-14 30-Jun-15 140,399,732517 48550101 WATER AND SANITATION INFRASTRUCTURES PROJECT Service 169,000,000 1-Jul-14 30-Jun-15 169,000,000518 48560201 'URBAN AND RURAL SETTLEMENT PROJECT Service 183,898,736 1-Jul-14 30-Jun-15 183,898,736519 48570101 ROADS INFRASTRUCTURES PROJECT Service 198,427,675 1-Jul-14 30-Jun-15 198,427,675520 48570102 ROADS MAINTANANCE PROJECT Service 8,000,000 1-Jul-14 30-Jun-15 8,000,000521 48570104 ROADS INFRASTRUCTURE MANAGEMENT PROJECT Service 6,500,000 1-Jul-14 30-Jun-15 6,500,000
08 EXTERNAL GRANTS 1,143,085,322 1,143,085,322DFID 659,124,133 659,124,13348490233 SOCIAL PROTECTION PROJECT Service 624,475,340 1-Jul-14 30-Jun-15 624,475,340
522 48520105 AGRICULTURAL PRODUCTION SYSTEMS DEVELOPMENT AND
INTENSIFICATION PROJECTService
21,626,935 1-Jul-14 30-Jun-15 21,626,935
48550101 WATER AND SANITATION INFRASTRUCTURES PROJECT Service 1,056,820 1-Jul-14 30-Jun-15 1,056,820523 48560202 URBAN AND RURAL SETTLEMENT PROJECT Service 1,915,333 1-Jul-14 30-Jun-15 1,915,333
48570101 ROADS INFRASTRUCTURES PROJECT Service 10,049,705 1-Jul-14 30-Jun-15 10,049,705KFW Service 166,127,629 166,127,62948480201 HEALTH INFRASTRUCTURES PROJECT Service 36,143,858 1-Jul-14 30-Jun-15 36,143,858
524 48510109 MARKET ORIENTED INFRASTRUCTURES PROJECT Service 6,200,000 1-Jul-14 30-Jun-15 6,200,000525 48510112 MARKET ORIENTED INFRASTRUCTURES PROJECT Service 51,074,021 1-Jul-14 30-Jun-15 51,074,021
48550101 WATER AND SANITATION INFRASTRUCTURES PROJECT Service 27,166,405 1-Jul-14 30-Jun-15 27,166,40548570101 ROADS INFRASTRUCTURES PROJECT Service 33,543,345 1-Jul-14 30-Jun-15 33,543,34548570102 ROADS MAINTANANCE PROJECT Service 12,000,000 1-Jul-14 30-Jun-15 12,000,000NETHERLAND Service 317,833,560 317,833,560
526 48510112 MARKET ORIENTED INFRASTRUCTURES PROJECT Service 38,000,000 1-Jul-14 30-Jun-15 38,000,00048570101 ROADS INFRASTRUCTURES PROJECT Service 57,833,560 1-Jul-14 30-Jun-15 57,833,56048570102 ROADS MAINTANANCE PROJECT Service 222,000,000 1-Jul-14 30-Jun-15 222,000,0004900 GISAGARA DISTRICT 2,943,919,202 2,943,919,20202 EARMARKED TRANSFERS (DISTRICTS) 2,068,492,179 2,068,492,179ENERGY, WATER AND SANITATION AUTHORITY (EWSA) 24,600,000 24,600,000
527 49540202 IMPROVE BIOMASS USE EFFICIENCY Service 24,600,000 1-Jul-14 30-Jun-15 24,600,000RWANDA 2,043,892,179 2,043,892,179
528 49450123 ADMINISTRATIVE INFRASTRUCTURES PROJECT Service 82,581,000 1-Jul-14 30-Jun-15 82,581,000529 49460118 DISTRICT CAPACITIES SUPPORT PROJECT Service 88,522,371 1-Jul-14 30-Jun-15 88,522,371530 49460123 ICT DEVELOPMENT PROJECT Service 7,024,609 1-Jul-14 30-Jun-15 7,024,609531 49470213 EDUCATION INFRASTRUCTURES PROJECT Service 165,736,900 1-Jul-14 30-Jun-15 165,736,900532 49490202 SOCIAL PROTECTION PROJECT Service 240,216,020 1-Jul-14 30-Jun-15 240,216,020533 49490209 1. SOCIAL PROTECTION PROVISION AND COORDINATION PROJECT: Service 41,373,039 1-Jul-14 30-Jun-15 41,373,039534 49500301 NATIONAL EMPLOYEMENT PROGRAM (NEP) PROJECT Service 12,737,065 1-Jul-14 30-Jun-15 12,737,065535 49500305 SPORT & CULTURE DEVELOPMENT PROJECT Service 355,492,062 1-Jul-14 30-Jun-15 355,492,062536 49510111 MARKET ORIENTED INFRASTRUCTURES PROJECT Service 356,190,394 1-Jul-14 30-Jun-15 356,190,394537 49520104 AGRICULTURAL PRODUCTION SYSTEMS DEVELOPMENT PROJECT Service 165,831,184 1-Jul-14 30-Jun-15 165,831,184538 49520203 LIVESTOCK DEVELOPMENT PROJECT Service 47,443,653 1-Jul-14 30-Jun-15 47,443,653539 49530106 NATURAL RESOURCES SUSTAINABLE MANAGEMENT PROJECT Service 43,709,804 1-Jul-14 30-Jun-15 43,709,804540 49540103 ENERGY DEVELOPMENT AND ELECTRICITY PROVISION PROJECT Service 12,500,000 1-Jul-14 30-Jun-15 12,500,000541 49560211 URBAN AND RURAL SETTLEMENT PROJECT Service 40,031,999 1-Jul-14 30-Jun-15 40,031,999542 49570103 ROADS INFRASTRUCTURES PROJECT Service 384,502,079 1-Jul-14 30-Jun-15 384,502,079
08 EXTERNAL GRANTS 875,427,023 875,427,023DFID 437,620,139 437,620,13949490202 SOCIAL PROTECTION PROJECT Service 437,620,139 1-Jul-14 30-Jun-15 437,620,139KFW Service 133,985,715 133,985,71549500305 SPORT & CULTURE DEVELOPMENT PROJECT Service 42,041,996 1-Jul-14 30-Jun-15 42,041,996
543 49550104 WATER AND SANITATION INFRASTRUCTURES PROJECT Service 91,943,719 1-Jul-14 30-Jun-15 91,943,719NETHERLAND 303,821,169 303,821,169
544 49510111 MARKET ORIENTED INFRASTRUCTURES PROJECT Service 22,570,680 1-Jul-14 30-Jun-15 22,570,68049540103 ENERGY DEVELOPMENT AND ELECTRICITY PROVISION PROJECT Service 216,071,740 1-Jul-14 30-Jun-15 216,071,740
54549540104 4. ENERGY AND ELECTRICITY PROVISION AND MANAGEMENT PROJECT: Service
22,570,680 1-Jul-14 30-Jun-15 22,570,680
49550104 WATER AND SANITATION INFRASTRUCTURES PROJECT Service 42,608,069 1-Jul-14 30-Jun-15 42,608,0695000 MUHANGA DISTRICT 3,680,499,699 3,680,499,69902 EARMARKED TRANSFERS (DISTRICTS) 2,821,260,760 2,821,260,760ENERGY, WATER AND SANITATION AUTHORITY (EWSA) 20,700,000 20,700,000
546 50540202 IMPROVE BIOMASS USE EFFICIENCY Service 20,700,000 1-Jul-14 30-Jun-15 20,700,000RWANDA Service 2,800,560,760 2,800,560,760
547 50450115 ADMINISTRATIVE INFRASTRUCTURES PROJECT Service 262,553,971 1-Jul-14 30-Jun-15 262,553,971548 50460115 DISTRICT CAPACITIES SUPPORT PROJECT Service 136,070,553 1-Jul-14 30-Jun-15 136,070,553549 50470207 EDUCATION INFRASTRUCTURES PROJECT Service 119,987,000 1-Jul-14 30-Jun-15 119,987,000550 50490209 SOCIAL PROTECTION PROJECT Service 230,762,368 1-Jul-14 30-Jun-15 230,762,368
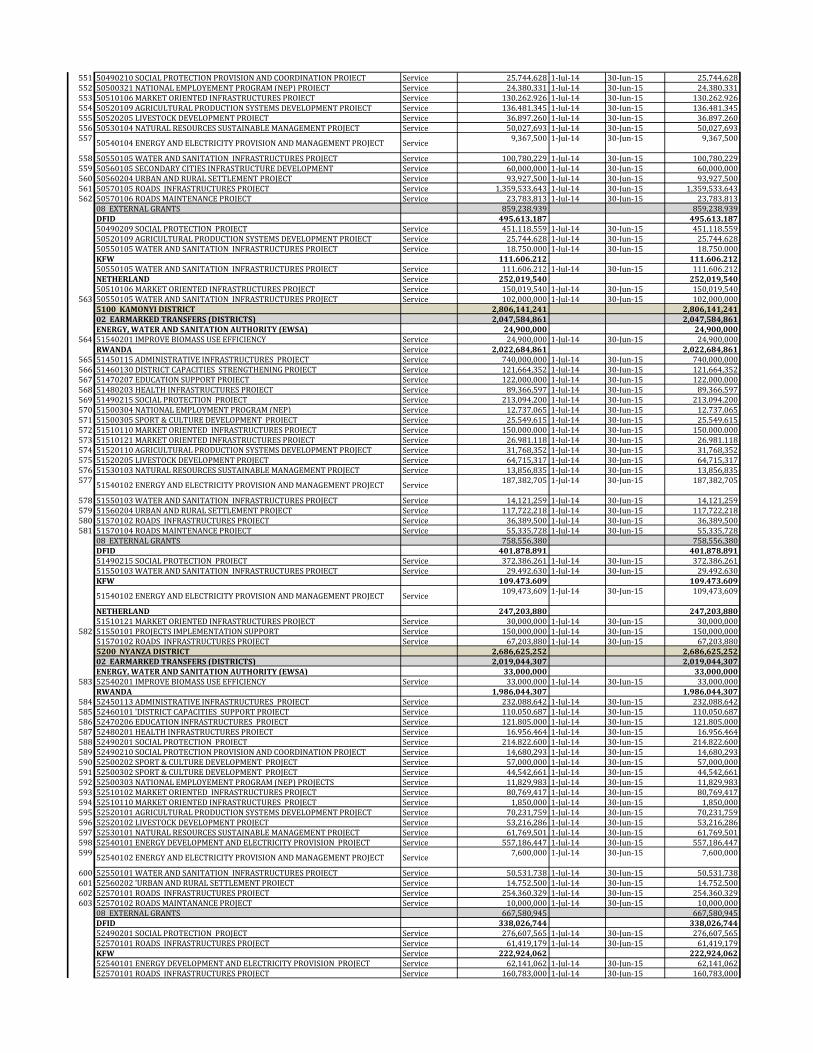
551 50490210 SOCIAL PROTECTION PROVISION AND COORDINATION PROJECT Service 25,744,628 1-Jul-14 30-Jun-15 25,744,628552 50500321 NATIONAL EMPLOYEMENT PROGRAM (NEP) PROJECT Service 24,380,331 1-Jul-14 30-Jun-15 24,380,331553 50510106 MARKET ORIENTED INFRASTRUCTURES PROJECT Service 130,262,926 1-Jul-14 30-Jun-15 130,262,926554 50520109 AGRICULTURAL PRODUCTION SYSTEMS DEVELOPMENT PROJECT Service 136,481,345 1-Jul-14 30-Jun-15 136,481,345555 50520205 LIVESTOCK DEVELOPMENT PROJECT Service 36,897,260 1-Jul-14 30-Jun-15 36,897,260556 50530104 NATURAL RESOURCES SUSTAINABLE MANAGEMENT PROJECT Service 50,027,693 1-Jul-14 30-Jun-15 50,027,693557
50540104 ENERGY AND ELECTRICITY PROVISION AND MANAGEMENT PROJECT Service9,367,500 1-Jul-14 30-Jun-15 9,367,500
558 50550105 WATER AND SANITATION INFRASTRUCTURES PROJECT Service 100,780,229 1-Jul-14 30-Jun-15 100,780,229559 50560105 SECONDARY CITIES INFRASTRUCTURE DEVELOPMENT Service 60,000,000 1-Jul-14 30-Jun-15 60,000,000560 50560204 URBAN AND RURAL SETTLEMENT PROJECT Service 93,927,500 1-Jul-14 30-Jun-15 93,927,500561 50570105 ROADS INFRASTRUCTURES PROJECT Service 1,359,533,643 1-Jul-14 30-Jun-15 1,359,533,643562 50570106 ROADS MAINTENANCE PROJECT Service 23,783,813 1-Jul-14 30-Jun-15 23,783,813
08 EXTERNAL GRANTS 859,238,939 859,238,939DFID 495,613,187 495,613,18750490209 SOCIAL PROTECTION PROJECT Service 451,118,559 1-Jul-14 30-Jun-15 451,118,55950520109 AGRICULTURAL PRODUCTION SYSTEMS DEVELOPMENT PROJECT Service 25,744,628 1-Jul-14 30-Jun-15 25,744,62850550105 WATER AND SANITATION INFRASTRUCTURES PROJECT Service 18,750,000 1-Jul-14 30-Jun-15 18,750,000KFW 111,606,212 111,606,21250550105 WATER AND SANITATION INFRASTRUCTURES PROJECT Service 111,606,212 1-Jul-14 30-Jun-15 111,606,212NETHERLAND Service 252,019,540 252,019,54050510106 MARKET ORIENTED INFRASTRUCTURES PROJECT Service 150,019,540 1-Jul-14 30-Jun-15 150,019,540
563 50550105 WATER AND SANITATION INFRASTRUCTURES PROJECT Service 102,000,000 1-Jul-14 30-Jun-15 102,000,0005100 KAMONYI DISTRICT 2,806,141,241 2,806,141,24102 EARMARKED TRANSFERS (DISTRICTS) 2,047,584,861 2,047,584,861ENERGY, WATER AND SANITATION AUTHORITY (EWSA) 24,900,000 24,900,000
564 51540201 IMPROVE BIOMASS USE EFFICIENCY Service 24,900,000 1-Jul-14 30-Jun-15 24,900,000RWANDA Service 2,022,684,861 2,022,684,861
565 51450115 ADMINISTRATIVE INFRASTRUCTURES PROJECT Service 740,000,000 1-Jul-14 30-Jun-15 740,000,000566 51460130 DISTRICT CAPACITIES STRENGTHENING PROJECT Service 121,664,352 1-Jul-14 30-Jun-15 121,664,352567 51470207 EDUCATION SUPPORT PROJECT Service 122,000,000 1-Jul-14 30-Jun-15 122,000,000568 51480203 HEALTH INFRASTRUCTURES PROJECT Service 89,366,597 1-Jul-14 30-Jun-15 89,366,597569 51490215 SOCIAL PROTECTION PROJECT Service 213,094,200 1-Jul-14 30-Jun-15 213,094,200570 51500304 NATIONAL EMPLOYMENT PROGRAM (NEP) Service 12,737,065 1-Jul-14 30-Jun-15 12,737,065571 51500305 SPORT & CULTURE DEVELOPMENT PROJECT Service 25,549,615 1-Jul-14 30-Jun-15 25,549,615572 51510110 MARKET ORIENTED INFRASTRUCTURES PROJECT Service 150,000,000 1-Jul-14 30-Jun-15 150,000,000573 51510121 MARKET ORIENTED INFRASTRUCTURES PROJECT Service 26,981,118 1-Jul-14 30-Jun-15 26,981,118574 51520110 AGRICULTURAL PRODUCTION SYSTEMS DEVELOPMENT PROJECT Service 31,768,352 1-Jul-14 30-Jun-15 31,768,352575 51520205 LIVESTOCK DEVELOPMENT PROJECT Service 64,715,317 1-Jul-14 30-Jun-15 64,715,317576 51530103 NATURAL RESOURCES SUSTAINABLE MANAGEMENT PROJECT Service 13,856,835 1-Jul-14 30-Jun-15 13,856,835577
51540102 ENERGY AND ELECTRICITY PROVISION AND MANAGEMENT PROJECT Service187,382,705 1-Jul-14 30-Jun-15 187,382,705
578 51550103 WATER AND SANITATION INFRASTRUCTURES PROJECT Service 14,121,259 1-Jul-14 30-Jun-15 14,121,259579 51560204 URBAN AND RURAL SETTLEMENT PROJECT Service 117,722,218 1-Jul-14 30-Jun-15 117,722,218580 51570102 ROADS INFRASTRUCTURES PROJECT Service 36,389,500 1-Jul-14 30-Jun-15 36,389,500581 51570104 ROADS MAINTENANCE PROJECT Service 55,335,728 1-Jul-14 30-Jun-15 55,335,728
08 EXTERNAL GRANTS 758,556,380 758,556,380DFID 401,878,891 401,878,89151490215 SOCIAL PROTECTION PROJECT Service 372,386,261 1-Jul-14 30-Jun-15 372,386,26151550103 WATER AND SANITATION INFRASTRUCTURES PROJECT Service 29,492,630 1-Jul-14 30-Jun-15 29,492,630KFW 109,473,609 109,473,609
51540102 ENERGY AND ELECTRICITY PROVISION AND MANAGEMENT PROJECT Service109,473,609 1-Jul-14 30-Jun-15 109,473,609
NETHERLAND 247,203,880 247,203,88051510121 MARKET ORIENTED INFRASTRUCTURES PROJECT Service 30,000,000 1-Jul-14 30-Jun-15 30,000,000
582 51550101 PROJECTS IMPLEMENTATION SUPPORT Service 150,000,000 1-Jul-14 30-Jun-15 150,000,00051570102 ROADS INFRASTRUCTURES PROJECT Service 67,203,880 1-Jul-14 30-Jun-15 67,203,8805200 NYANZA DISTRICT 2,686,625,252 2,686,625,25202 EARMARKED TRANSFERS (DISTRICTS) 2,019,044,307 2,019,044,307ENERGY, WATER AND SANITATION AUTHORITY (EWSA) 33,000,000 33,000,000
583 52540201 IMPROVE BIOMASS USE EFFICIENCY Service 33,000,000 1-Jul-14 30-Jun-15 33,000,000RWANDA 1,986,044,307 1,986,044,307
584 52450113 ADMINISTRATIVE INFRASTRUCTURES PROJECT Service 232,088,642 1-Jul-14 30-Jun-15 232,088,642585 52460101 'DISTRICT CAPACITIES SUPPORT PROJECT Service 110,050,687 1-Jul-14 30-Jun-15 110,050,687586 52470206 EDUCATION INFRASTRUCTURES PROJECT Service 121,805,000 1-Jul-14 30-Jun-15 121,805,000587 52480201 HEALTH INFRASTRUCTURES PROJECT Service 16,956,464 1-Jul-14 30-Jun-15 16,956,464588 52490201 SOCIAL PROTECTION PROJECT Service 214,822,600 1-Jul-14 30-Jun-15 214,822,600589 52490210 SOCIAL PROTECTION PROVISION AND COORDINATION PROJECT Service 14,680,293 1-Jul-14 30-Jun-15 14,680,293590 52500202 SPORT & CULTURE DEVELOPMENT PROJECT Service 57,000,000 1-Jul-14 30-Jun-15 57,000,000591 52500302 SPORT & CULTURE DEVELOPMENT PROJECT Service 44,542,661 1-Jul-14 30-Jun-15 44,542,661592 52500303 NATIONAL EMPLOYEMENT PROGRAM (NEP) PROJECTS Service 11,829,983 1-Jul-14 30-Jun-15 11,829,983593 52510102 MARKET ORIENTED INFRASTRUCTURES PROJECT Service 80,769,417 1-Jul-14 30-Jun-15 80,769,417594 52510110 MARKET ORIENTED INFRASTRUCTURES PROJECT Service 1,850,000 1-Jul-14 30-Jun-15 1,850,000595 52520101 AGRICULTURAL PRODUCTION SYSTEMS DEVELOPMENT PROJECT Service 70,231,759 1-Jul-14 30-Jun-15 70,231,759596 52520102 LIVESTOCK DEVELOPMENT PROJECT Service 53,216,286 1-Jul-14 30-Jun-15 53,216,286597 52530101 NATURAL RESOURCES SUSTAINABLE MANAGEMENT PROJECT Service 61,769,501 1-Jul-14 30-Jun-15 61,769,501598 52540101 ENERGY DEVELOPMENT AND ELECTRICITY PROVISION PROJECT Service 557,186,447 1-Jul-14 30-Jun-15 557,186,447599
52540102 ENERGY AND ELECTRICITY PROVISION AND MANAGEMENT PROJECT Service7,600,000 1-Jul-14 30-Jun-15 7,600,000
600 52550101 WATER AND SANITATION INFRASTRUCTURES PROJECT Service 50,531,738 1-Jul-14 30-Jun-15 50,531,738601 52560202 'URBAN AND RURAL SETTLEMENT PROJECT Service 14,752,500 1-Jul-14 30-Jun-15 14,752,500602 52570101 ROADS INFRASTRUCTURES PROJECT Service 254,360,329 1-Jul-14 30-Jun-15 254,360,329603 52570102 ROADS MAINTANANCE PROJECT Service 10,000,000 1-Jul-14 30-Jun-15 10,000,000
08 EXTERNAL GRANTS 667,580,945 667,580,945DFID 338,026,744 338,026,74452490201 SOCIAL PROTECTION PROJECT Service 276,607,565 1-Jul-14 30-Jun-15 276,607,56552570101 ROADS INFRASTRUCTURES PROJECT Service 61,419,179 1-Jul-14 30-Jun-15 61,419,179KFW Service 222,924,062 222,924,06252540101 ENERGY DEVELOPMENT AND ELECTRICITY PROVISION PROJECT Service 62,141,062 1-Jul-14 30-Jun-15 62,141,06252570101 ROADS INFRASTRUCTURES PROJECT Service 160,783,000 1-Jul-14 30-Jun-15 160,783,000

NETHERLAND Service 106,630,139 106,630,13952570101 ROADS INFRASTRUCTURES PROJECT Service 106,630,139 1-Jul-14 30-Jun-15 106,630,1395300 NYARUGURU DISTRICT 3,969,890,484 3,969,890,48402 EARMARKED TRANSFERS (DISTRICTS) 3,049,219,993 3,049,219,993ENERGY, WATER AND SANITATION AUTHORITY (EWSA) 32,700,000 32,700,000
604 53540201 IMPROVE BIOMASS USE EFFICIENCY Service 32,700,000 1-Jul-14 30-Jun-15 32,700,000NYARUGURU Service 25,052,198 25,052,198
605 53490201 SOCIAL PROTECTION PROVISION AND COORDINATION PROJECT Service 25,052,198 1-Jul-14 30-Jun-15 25,052,198RWANDA Service 2,991,467,795 2,991,467,795
606 53450116 ADMINISTRATIVE INFRASTRUCTURES PROJECT Service 53,441,830 1-Jul-14 30-Jun-15 53,441,830607 53460115 DISTRICT CAPACITIES SUPPORT PROJECT Service 109,062,986 1-Jul-14 30-Jun-15 109,062,986608 53470207 EDUCATION INFRASTRUCTURES PROJECT Service 271,839,484 1-Jul-14 30-Jun-15 271,839,484609 53470302 CONSTRUCTION OF KIBEHO TVET RETAINING WALL Service 44,908,170 1-Jul-14 30-Jun-15 44,908,170610 53480206 HEALTH INFRASTRUCTURES PROJECT Service 86,052,412 1-Jul-14 30-Jun-15 86,052,412611 53490204 SOCIAL PROTECTION PROJECT Service 322,136,997 1-Jul-14 30-Jun-15 322,136,997612 53500304 SPORT & CULTURE DEVELOPMENT PROJECT Service 59,010,000 1-Jul-14 30-Jun-15 59,010,000613 53500305 NATIONAL EMPLOYEMENT PROGRAM (NEP) PROJECT Service 12,736,770 1-Jul-14 30-Jun-15 12,736,770614 53510107 MARKET ORIENTED INFRASTRUCTURES PROJECT Service 37,732,275 1-Jul-14 30-Jun-15 37,732,275615 53510109 MARKET ORIENTED INFRASTRUCTURES PROJECT Service 674,934,588 1-Jul-14 30-Jun-15 674,934,588616 53520102 AGRICULTURAL PRODUCTION SYSTEMS DEVELOPMENT PROJECT Service 205,723,303 1-Jul-14 30-Jun-15 205,723,303617 53520201 LIVESTOCK DEVELOPMENT PROJECT Service 62,970,415 1-Jul-14 30-Jun-15 62,970,415618 53530102 NATURAL RESOURCES SUSTAINABLE MANAGEMENT PROJECT Service 74,984,228 1-Jul-14 30-Jun-15 74,984,228619 53540104 ENERGY DEVELOPMENT AND ELECTRICITY PROVISION PROJECT Service 291,413,856 1-Jul-14 30-Jun-15 291,413,856620 53550103 WATER AND SANITATION INFRASTRUCTURES PROJECT Service 224,264,214 1-Jul-14 30-Jun-15 224,264,214621 53560202 URBAN AND RURAL SETTLEMENT PROJECT Service 159,759,196 1-Jul-14 30-Jun-15 159,759,196622 53570105 ROADS INFRASTRUCTURES PROJECT Service 29,505,000 1-Jul-14 30-Jun-15 29,505,000623 53570106 ROADS MAINTENANCE PROJECT Service 270,992,071 1-Jul-14 30-Jun-15 270,992,071
08 EXTERNAL GRANTS 920,670,491 920,670,491DFID Service 524,619,513 524,619,51353490204 SOCIAL PROTECTION PROJECT Service 499,567,315 1-Jul-14 30-Jun-15 499,567,31553520102 AGRICULTURAL PRODUCTION SYSTEMS DEVELOPMENT PROJECT Service 25,052,198 1-Jul-14 30-Jun-15 25,052,198KFW Service 121,558,358 121,558,35853510109 MARKET ORIENTED INFRASTRUCTURES PROJECT Service 121,558,358 1-Jul-14 30-Jun-15 121,558,358NETHERLAND Service 274,492,620 274,492,62053510109 MARKET ORIENTED INFRASTRUCTURES PROJECT Service 274,492,620 1-Jul-14 30-Jun-15 274,492,6205400 RUSIZI DISTRICT 3,847,235,099 3,847,235,09902 EARMARKED TRANSFERS (DISTRICTS) 2,856,217,431 2,856,217,431RWANDA Service 305,908,580 305,908,580
624 54510103 MARKET ORIENTED INFRASTRUCTURES PROJECT Service 305,908,580 1-Jul-14 30-Jun-15 305,908,580ENERGY, WATER AND SANITATION AUTHORITY (EWSA) 7,200,000 7,200,000
625 54540202 IMPROVE BIOMASS USE EFFICIENCY Service 7,200,000 1-Jul-14 30-Jun-15 7,200,000RWANDA 17,015,766 17,015,766
626 54520301 PROJECTS IMPLEMENTATION SUPPORT Service 17,015,766 1-Jul-14 30-Jun-15 17,015,766RWANDA 2,526,093,085 2,526,093,085
627 54450121 ADMINISTRATIVE INFRASTRUCTURES PROJECT Service 28,500,000 1-Jul-14 30-Jun-15 28,500,000628 54460108 ICT DEVELOPMENT PROJECT Service 11,529,750 1-Jul-14 30-Jun-15 11,529,750629 54460130 DISTRICT CAPACITIES SUPPORT PROJECT Service 103,763,727 1-Jul-14 30-Jun-15 103,763,727630 54470210 EDUCATION INFRASTRUCTURES PROJECT Service 195,200,000 1-Jul-14 30-Jun-15 195,200,000631 54490202 SOCIAL PROTECTION PROJECT Service 282,639,070 1-Jul-14 30-Jun-15 282,639,070632 54490227 SOCIAL PROTECTION PROVISION AND COORDINATION PROJECT Service 49,509,210 1-Jul-14 30-Jun-15 49,509,210633 54500301 NATIONAL EMPLOYEMENT PROGRAM (NEP) PROJECTS Service 16,950,752 1-Jul-14 30-Jun-15 16,950,752634 54510103 MARKET ORIENTED INFRASTRUCTURES PROJECT Service 16,935,549 1-Jul-14 30-Jun-15 16,935,549635 54520101 AGRICULTURAL PRODUCTION SYSTEMS DEVELOPMENT PROJECT Service 114,749,950 1-Jul-14 30-Jun-15 114,749,950636 54520202 LIVESTOCK DEVELOPMENT PROJECT Service 67,993,410 1-Jul-14 30-Jun-15 67,993,410637 54530103 NATURAL RESOURCES SUSTAINABLE MANAGEMENT PROJECT Service 56,943,937 1-Jul-14 30-Jun-15 56,943,937638 54540103 ENERGY DEVELOPMENT AND ELECTRICITY PROVISION PROJECT Service 476,921,114 1-Jul-14 30-Jun-15 476,921,114639 54550105 WATER AND SANITATION INFRASTRUCTURES PROJECT Service 461,677,939 1-Jul-14 30-Jun-15 461,677,939640 54560154 SECONDARY CITIES INFRASTRUCTURE DEVELOPMENT Service 65,952,265 1-Jul-14 30-Jun-15 65,952,265641 54560204 URBAN AND RURAL SETTLEMENT PROJECT Service 53,665,126 1-Jul-14 30-Jun-15 53,665,126642 54570102 ROADS INFRASTRUCTURES PROJECT Service 484,031,130 1-Jul-14 30-Jun-15 484,031,130643 54570105 ROADS MAINTANANCE PROJECT Service 39,130,156 1-Jul-14 30-Jun-15 39,130,156
08 EXTERNAL GRANTS 991,017,668 991,017,668DFID 552,064,500 552,064,50054490202 SOCIAL PROTECTION PROJECT Service 502,555,290 1-Jul-14 30-Jun-15 502,555,29054570102 ROADS INFRASTRUCTURES PROJECT Service 49,509,210 1-Jul-14 30-Jun-15 49,509,210KFW Service 124,330,048 124,330,048
644 54480206 HEALTH INFRASTRUCTURES PROJECT Service 47,700,000 1-Jul-14 30-Jun-15 47,700,00054570102 ROADS INFRASTRUCTURES PROJECT Service 76,630,048 1-Jul-14 30-Jun-15 76,630,048NETHERLAND Service 314,623,120 314,623,12054570102 ROADS INFRASTRUCTURES PROJECT Service 314,623,120 1-Jul-14 30-Jun-15 314,623,1205500 NYABIHU DISTRICT 2,346,753,935 2,346,753,93502 EARMARKED TRANSFERS (DISTRICTS) 1,651,849,246 1,651,849,246ENERGY, WATER AND SANITATION AUTHORITY (EWSA) 19,200,000 19,200,000
645 55540201 IMPROVE BIOMASS USE EFFICIENCY Service 19,200,000 1-Jul-14 30-Jun-15 19,200,000RWANDA 1,632,649,246 1,632,649,246
646 55460116 DISTRICT CAPACITIES SUPPORT PROJECT Service 89,297,342 1-Jul-14 30-Jun-15 89,297,342647 55470208 'EDUCATION INFRASTRUCTURES PROJECT Service 155,082,717 1-Jul-14 30-Jun-15 155,082,717648 55480203 HEALTH INFRASTRUCTURES PROJECT Service 64,541,719 1-Jul-14 30-Jun-15 64,541,719649 55490205 SOCIAL PROTECTION PROJECT Service 136,862,009 1-Jul-14 30-Jun-15 136,862,009650 55490228 SOCIAL PROTECTION PROVISION AND COORDINATION PROJECT Service 22,226,765 1-Jul-14 30-Jun-15 22,226,765651 55500302 NATIONAL EMPLOYEMENT PROGRAM (NEP) PROJECTS Service 15,610,357 1-Jul-14 30-Jun-15 15,610,357652 55510121 MARKET ORIENTED INFRASTRUCTURES PROJECT Service 540,750,920 1-Jul-14 30-Jun-15 540,750,920653 55520103 'AGRICULTURAL PRODUCTION SYSTEMS DEVELOPMENT PROJECT Service 60,000,000 1-Jul-14 30-Jun-15 60,000,000654 55520106 AGRICULTURAL PRODUCTION SYSTEMS DEVELOPMENT AND
INTENSIFICATION PROJECTService
61,322,991 1-Jul-14 30-Jun-15 61,322,991
655 55520201 'LIVESTOCK DEVELOPMENT PROJECT Service 88,034,490 1-Jul-14 30-Jun-15 88,034,490656 55530103 NATURAL RESOURCES SUSTAINABLE MANAGEMENT PROJECT Service 80,219,964 1-Jul-14 30-Jun-15 80,219,964657 55530401 RIVES, MARASHLANDS AND LAKE SHORES PROTECTED Service 40,408,620 1-Jul-14 30-Jun-15 40,408,620658
55540104 ENERGY AND ELECTRICITY PROVISION AND MANAGEMENT PROJECT Service6,000,000 1-Jul-14 30-Jun-15 6,000,000

659 55550107 WATER AND SANITATION INFRASTRUCTURES PROJECT Service 15,000,000 1-Jul-14 30-Jun-15 15,000,000660 55560104 IMPLEMETATION OF URBAN MASTER PLAN (EXPROPRIATION OF
MUKAMIRA TOWN)Service
66,878,000 1-Jul-14 30-Jun-15 66,878,000
661 55570102 ROADS INFRASTRUCTURES PROJECT Service 190,413,352 1-Jul-14 30-Jun-15 190,413,35208 EXTERNAL GRANTS 694,904,689 694,904,689DFID Service 694,904,689 694,904,68955490205 SOCIAL PROTECTION PROJECT Service 316,000,435 1-Jul-14 30-Jun-15 316,000,43555570102 ROADS INFRASTRUCTURES PROJECT Service 378,904,254 1-Jul-14 30-Jun-15 378,904,2545600 RUBAVU DISTRICT 3,906,088,594 3,906,088,59402 EARMARKED TRANSFERS (DISTRICTS) 3,213,676,286 3,213,676,286ENERGY, WATER AND SANITATION AUTHORITY (EWSA) Service 11,700,000 11,700,000
662 56540202 IMPROVE BIOMASS USE EFFICIENCY Service 11,700,000 1-Jul-14 30-Jun-15 11,700,000RWANDA Service 3,201,976,286 3,201,976,286
663 56450115 ADMINISTRATIVE INFRASTRUCTURES PROJECT Service 147,525,000 1-Jul-14 30-Jun-15 147,525,000664 56460112 DISTRICT CAPACITIES SUPPORT PROJECT Service 140,783,739 1-Jul-14 30-Jun-15 140,783,739665 56460113 ICT DEVELOPMENT PROJECT Service 244,420 1-Jul-14 30-Jun-15 244,420666 56470208 EDUCATION INFRASTRUCTURES PROJECT Service 119,987,000 1-Jul-14 30-Jun-15 119,987,000667 56490207 SOCIAL PROTECTION PROJECT Service 249,654,908 1-Jul-14 30-Jun-15 249,654,908668 56500304 'SPORT & CULTURE DEVELOPMENT PROJECT Service 201,617,500 1-Jul-14 30-Jun-15 201,617,500669 56500305 NATIONAL EMPLOYEMENT PROGRAM (NEP) PROJECTS Service 4,316,917 1-Jul-14 30-Jun-15 4,316,917670 56510108 MARKET ORIENTED INFRASTRUCTURES PROJECT Service 120,414,974 1-Jul-14 30-Jun-15 120,414,974671 56510109 NATIONAL EMPLOYEMENT PROGRAM (NEP) PROJECTS Service 114,000,092 1-Jul-14 30-Jun-15 114,000,092672 56510110 MARKET ORIENTED INFRASTRUCTURES PROJECT: Service 300,000,000 1-Jul-14 30-Jun-15 300,000,000673 56520103 'AGRICULTURAL PRODUCTION SYSTEMS DEVELOPMENT PROJECT Service 159,304,215 1-Jul-14 30-Jun-15 159,304,215674 56520205 LIVESTOCK DEVELOPMENT PROJECT Service 76,925,720 1-Jul-14 30-Jun-15 76,925,720675 56530103 NATURAL RESOURCES SUSTAINABLE MANAGEMENT PROJECT Service 3,024,000 1-Jul-14 30-Jun-15 3,024,000676 56530104 NATURAL RESOURCES SUSTAINABLE MANAGEMENT PROJECT Service 91,304,039 1-Jul-14 30-Jun-15 91,304,039677 56540103 'ENERGY DEVELOPMENT AND ELECTRICITY PROVISION PROJECT Service 295,050,000 1-Jul-14 30-Jun-15 295,050,000678 56560107 URBAN AND RURAL SETTLEMENT PROJECT Service 120,000,000 1-Jul-14 30-Jun-15 120,000,000679 56570105 ROADS INFRASTRUCTURES PROJECT Service 852,230,586 1-Jul-14 30-Jun-15 852,230,586680 56570106 ROADS MAINTENANCE PROJECT Service 205,593,176 1-Jul-14 30-Jun-15 205,593,176
08 EXTERNAL GRANTS 692,412,308 692,412,308DFID 333,418,732 333,418,73256490207 SOCIAL PROTECTION PROJECT Service 301,081,990 1-Jul-14 30-Jun-15 301,081,99056570105 ROADS INFRASTRUCTURES PROJECT Service 32,336,742 1-Jul-14 30-Jun-15 32,336,742KFW 110,184,476 110,184,47656480204 HEALTH INFRASTRUCTURES PROJECT Service 90,896,931 1-Jul-14 30-Jun-15 90,896,93156570105 ROADS INFRASTRUCTURES PROJECT Service 19,287,545 1-Jul-14 30-Jun-15 19,287,545NETHERLAND 248,809,100 248,809,10056510108 MARKET ORIENTED INFRASTRUCTURES PROJECT Service 151,874,046 1-Jul-14 30-Jun-15 151,874,04656570105 ROADS INFRASTRUCTURES PROJECT Service 96,935,054 1-Jul-14 30-Jun-15 96,935,0545700 KARONGI DISTRICT 3,173,012,985 3,173,012,98502 EARMARKED TRANSFERS (DISTRICTS) 2,342,057,812 2,342,057,812ENERGY, WATER AND SANITATION AUTHORITY (EWSA) 19,200,000 19,200,000
681 57540201 IMPROVE BIOMASS USE EFFICIENCY Service 19,200,000 1-Jul-14 30-Jun-15 19,200,000RWANDA 2,322,857,812 2,322,857,812
682 57450119 ADMINISTRATIVE INFRASTRUCTURES PROJECT Service 11,207,027 1-Jul-14 30-Jun-15 11,207,027683 57460108 DISTRICT CAPACITIES SUPPORT PROJECT Service 166,855,461 1-Jul-14 30-Jun-15 166,855,461684 57460109 ICT DEVELOPMENT PROJECT Service 9,718,072 1-Jul-14 30-Jun-15 9,718,072685 57470207 EDUCATION INFRASTRUCTURES PROJECT Service 138,365,484 1-Jul-14 30-Jun-15 138,365,484686 57480202 HEALTH INFRASTRUCTURES PROJECT Service 80,433,015 1-Jul-14 30-Jun-15 80,433,015687 57490203 SOCIAL PROTECTION PROVISION AND COORDINATION PROJECT Service 40,405,804 1-Jul-14 30-Jun-15 40,405,804688 57490207 SOCIAL PROTECTION PROJECT Service 339,043,216 1-Jul-14 30-Jun-15 339,043,216689 57500302 NATIONAL EMPLOYEMENT PROGRAM (NEP) PROJECTS Service 12,950,752 1-Jul-14 30-Jun-15 12,950,752690 57500303 SPORT & CULTURE DEVELOPMENT PROJECT Service 86,610,598 1-Jul-14 30-Jun-15 86,610,598691 57510101 MARKET ORIENTED INFRASTRUCTURES PROJECT Service 480,153,132 1-Jul-14 30-Jun-15 480,153,132692 57520104 AGRICULTURAL PRODUCTION SYSTEMS DEVELOPMENT PROJECT Service 189,999,285 1-Jul-14 30-Jun-15 189,999,285693 57520202 LIVESTOCK DEVELOPMENT PROJECT Service 190,354,434 1-Jul-14 30-Jun-15 190,354,434694 57530102 NATURAL RESOURCES SUSTAINABLE MANAGEMENT PROJECT Service 55,655,391 1-Jul-14 30-Jun-15 55,655,391695 57540102 ENERGY DEVELOPMENT AND ELECTRICITY PROVISION PROJECT Service 94,884,857 1-Jul-14 30-Jun-15 94,884,857696 57550101 WATER AND SANITATION INFRASTRUCTURES PROJECT Service 228,884,189 1-Jul-14 30-Jun-15 228,884,189697 57560202 'URBAN AND RURAL SETTLEMENT PROJECT Service 137,598,682 1-Jul-14 30-Jun-15 137,598,682698 57570103 ROADS INFRASTRUCTURES PROJECT Service 59,738,413 1-Jul-14 30-Jun-15 59,738,413
08 EXTERNAL GRANTS 830,955,173 830,955,173DFID 459,097,385 459,097,38557490207 SOCIAL PROTECTION PROJECT Service 418,691,581 1-Jul-14 30-Jun-15 418,691,58157520104 AGRICULTURAL PRODUCTION SYSTEMS DEVELOPMENT PROJECT Service 40,405,804 1-Jul-14 30-Jun-15 40,405,804KFW 126,534,432 126,534,43257510101 MARKET ORIENTED INFRASTRUCTURES PROJECT Service 126,534,432 1-Jul-14 30-Jun-15 126,534,432NETHERLAND 245,323,356 245,323,35657510101 MARKET ORIENTED INFRASTRUCTURES PROJECT Service 53,729,160 1-Jul-14 30-Jun-15 53,729,16057540102 ENERGY DEVELOPMENT AND ELECTRICITY PROVISION PROJECT Service 191,594,196 1-Jul-14 30-Jun-15 191,594,1965800 NGORORERO DISTRICT 4,518,268,268 4,518,268,26802 EARMARKED TRANSFERS (DISTRICTS) 3,817,869,810 3,817,869,810ENERGY, WATER AND SANITATION AUTHORITY (EWSA) 19,200,000 19,200,000
699 58540201 IMPROVE BIOMASS USE EFFICIENCY Service 19,200,000 1-Jul-14 30-Jun-15 19,200,000RWANDA 3,798,669,810 3,798,669,810
700 58450118 ADMINISTRATIVE INFRASTRUCTURES PROJECT Service 56,627,824 1-Jul-14 30-Jun-15 56,627,824701 58460110 'DISTRICT CAPACITIES SUPPORT PROJECT Service 237,636,974 1-Jul-14 30-Jun-15 237,636,974702 58460111 ICT DEVELOPMENT PROJECT Service 51,830,450 1-Jul-14 30-Jun-15 51,830,450703 58470207 'EDUCATION INFRASTRUCTURES PROJECT Service 143,984,400 1-Jul-14 30-Jun-15 143,984,400704 58480205 HEALTH INFRASTRUCTURES PROJECT Service 224,030,000 1-Jul-14 30-Jun-15 224,030,000705 58490204 SOCIAL PROTECTION PROJECT Service 224,492,959 1-Jul-14 30-Jun-15 224,492,959706 58490227 SOCIAL PROTECTION PROVISION AND COORDINATION PROJECT Service 27,923,240 1-Jul-14 30-Jun-15 27,923,240707 58500304 NATIONAL EMPLOYEMENT PROGRAM (NEP) PROJECTS Service 15,102,669 1-Jul-14 30-Jun-15 15,102,669708 58500305 'SPORT & CULTURE DEVELOPMENT PROJECT Service 198,127,050 1-Jul-14 30-Jun-15 198,127,050709 58510104 MARKET ORIENTED INFRASTRUCTURES PROJECT Service 408,312,864 1-Jul-14 30-Jun-15 408,312,864710 58520102 AGRICULTURAL PRODUCTION SYSTEMS DEVELOPMENT PROJECT Service 68,479,402 1-Jul-14 30-Jun-15 68,479,402711 58520203 LIVESTOCK DEVELOPMENT PROJECT Service 76,956,968 1-Jul-14 30-Jun-15 76,956,968712 58530103 NATURAL RESOURCES SUSTAINABLE MANAGEMENT PROJECT Service 60,745,887 1-Jul-14 30-Jun-15 60,745,887

713 58540102 'ENERGY DEVELOPMENT AND ELECTRICITY PROVISION PROJECT Service 165,426,969 1-Jul-14 30-Jun-15 165,426,969714 58550101 WATER AND SANITATION INFRASTRUCTURES PROJECT Service 169,146,348 1-Jul-14 30-Jun-15 169,146,348715 58560204 URBAN AND RURAL SETTLEMENT PROJECT Service 179,041,969 1-Jul-14 30-Jun-15 179,041,969716 58570104 ROADS MAINTENANCE PROJECT Service 98,439,361 1-Jul-14 30-Jun-15 98,439,361717 58570106 'ROADS INFRASTRUCTURES PROJECT Service 1,392,364,476 1-Jul-14 30-Jun-15 1,392,364,476
08 EXTERNAL GRANTS 700,398,458 700,398,458DFID 327,508,355 327,508,35558490204 SOCIAL PROTECTION PROJECT Service 299,585,115 1-Jul-14 30-Jun-15 299,585,11558520102 AGRICULTURAL PRODUCTION SYSTEMS DEVELOPMENT PROJECT Service 27,923,240 1-Jul-14 30-Jun-15 27,923,240KFW Service 114,449,683 114,449,68358550101 WATER AND SANITATION INFRASTRUCTURES PROJECT Service 114,449,683 1-Jul-14 30-Jun-15 114,449,683NETHERLAND Service 258,440,420 258,440,42058510104 MARKET ORIENTED INFRASTRUCTURES PROJECT Service 258,440,420 1-Jul-14 30-Jun-15 258,440,4205900 NYAMASHEKE DISTRICT 3,357,140,488 3,357,140,48802 EARMARKED TRANSFERS (DISTRICTS) 2,890,059,465 2,890,059,465RWANDA 546,548,553 546,548,553
718 59510102 MARKET ORIENTED INFRASTRUCTURES PROJECT Service 300,000,000 1-Jul-14 30-Jun-15 300,000,000719 59540103 'ENERGY DEVELOPMENT AND ELECTRICITY PROVISION PROJECT Service 127,381,146 1-Jul-14 30-Jun-15 127,381,146720 59550102 WATER AND SANITATION INFRASTRUCTURES PROJECT Service 33,000,000 1-Jul-14 30-Jun-15 33,000,000721 59570104 ROADS MAINTENANCE PROJECT Service 86,167,407 1-Jul-14 30-Jun-15 86,167,407
ENERGY, WATER AND SANITATION AUTHORITY (EWSA) 10,800,000 10,800,000722 59540201 IMPROVE BIOMASS USE EFFICIENCY Service 10,800,000 1-Jul-14 30-Jun-15 10,800,000
RWANDA 2,332,710,912 2,332,710,912723 59450119 ADMINISTRATIVE INFRASTRUCTURES PROJECT Service 455,050,000 1-Jul-14 30-Jun-15 455,050,000724 59460108 'DISTRICT CAPACITIES SUPPORT PROJECT Service 85,279,067 1-Jul-14 30-Jun-15 85,279,067725 59460109 ICT DEVELOPMENT PROJECT Service 85,467,660 1-Jul-14 30-Jun-15 85,467,660726 59470210 EDUCATION SUPPORT PROJECT Service 28,000,000 1-Jul-14 30-Jun-15 28,000,000727 59470211 EDUCATION INFRASTRUCTURES PROJECT Service 181,532,790 1-Jul-14 30-Jun-15 181,532,790728 59490205 SOCIAL PROTECTION PROJECT Service 684,402,407 1-Jul-14 30-Jun-15 684,402,407729 59490220 SOCIAL PROTECTION PROVISION AND COORDINATION PROJECT Service 28,791,677 1-Jul-14 30-Jun-15 28,791,677730 59500302 'SPORT & CULTURE DEVELOPMENT PROJECT Service 67,474,130 1-Jul-14 30-Jun-15 67,474,130731 59510102 MARKET ORIENTED INFRASTRUCTURES PROJECT Service 65,771,660 1-Jul-14 30-Jun-15 65,771,660732 59510103 NATIONAL EMPLOYEMENT PROGRAM (NEP) PROJECTS Service 11,827,659 1-Jul-14 30-Jun-15 11,827,659733 59520102 'AGRICULTURAL PRODUCTION SYSTEMS DEVELOPMENT PROJECT Service 271,666,022 1-Jul-14 30-Jun-15 271,666,022734 59520201 LIVESTOCK DEVELOPMENT PROJECT Service 84,896,953 1-Jul-14 30-Jun-15 84,896,953735 59530106 NATURAL RESOURCES SUSTAINABLE MANAGEMENT PROJECT Service 62,531,141 1-Jul-14 30-Jun-15 62,531,141736 59540103 'ENERGY DEVELOPMENT AND ELECTRICITY PROVISION PROJECT Service 45,223,944 1-Jul-14 30-Jun-15 45,223,944737 59550102 WATER AND SANITATION INFRASTRUCTURES PROJECT Service 88,389,384 1-Jul-14 30-Jun-15 88,389,384738 59560202 URBAN AND RURAL SETTLEMENT PROJECT Service 58,712,218 1-Jul-14 30-Jun-15 58,712,218739 59570104 ROADS MAINTENANCE PROJECT Service 27,694,200 1-Jul-14 30-Jun-15 27,694,200
08 EXTERNAL GRANTS 467,081,023 467,081,023DFID 39,603,444 39,603,44459490205 SOCIAL PROTECTION PROJECT Service 10,811,767 1-Jul-14 30-Jun-15 10,811,76759570104 ROADS MAINTENANCE PROJECT Service 28,791,677 1-Jul-14 30-Jun-15 28,791,677KFW 111,249,239 111,249,23959540103 'ENERGY DEVELOPMENT AND ELECTRICITY PROVISION PROJECT Service 111,249,239 1-Jul-14 30-Jun-15 111,249,239NETHERLAND 316,228,340 316,228,34059510102 MARKET ORIENTED INFRASTRUCTURES PROJECT Service 48,228,340 1-Jul-14 30-Jun-15 48,228,34059540103 'ENERGY DEVELOPMENT AND ELECTRICITY PROVISION PROJECT Service 268,000,000 1-Jul-14 30-Jun-15 268,000,0006000 RUTSIRO DISTRICT 3,239,989,147 3,239,989,14702 EARMARKED TRANSFERS (DISTRICTS) 2,466,391,858 2,466,391,858ENERGY, WATER AND SANITATION AUTHORITY (EWSA) 18,000,000 18,000,000
740 60540260 IMPROVE BIOMASS USE EFFICIENCY Service 18,000,000 1-Jul-14 30-Jun-15 18,000,000RWANDA 2,448,391,858 2,448,391,858
741 60460111 DISTRICT CAPACITIES STRENGTHENING PROJECT Service 203,420,443 1-Jul-14 30-Jun-15 203,420,443742 60460113 'ICT DEVELOPMENT PROJECT Service 32,000,000 1-Jul-14 30-Jun-15 32,000,000743 60470209 EDUCATION INFRASTRUCTURES PROJECT Service 208,798,670 1-Jul-14 30-Jun-15 208,798,670744 60480206 HEALTH INFRASTRUCTURES PROJECT Service 60,000,000 1-Jul-14 30-Jun-15 60,000,000745 60490201 SOCIAL PROTECTION PROVISION AND COORDINATION PROJECT: Service 24,683,972 1-Jul-14 30-Jun-15 24,683,972746 60490204 SOCIAL PROTECTION PROJECT Service 211,197,299 1-Jul-14 30-Jun-15 211,197,299747 60500303 NATIONAL EMPLOYEMENT PROGRAM (NEP) PROJECTS Service 7,253,429 1-Jul-14 30-Jun-15 7,253,429748 60510103 MARKET ORIENTED INFRASTRUCTURES PROJECT Service 340,344,513 1-Jul-14 30-Jun-15 340,344,513749 60510110 MARKET ORIENTED INFRASTRUCTURES PROJECT Service 300,000,000 1-Jul-14 30-Jun-15 300,000,000750 60520104 'AGRICULTURAL PRODUCTION SYSTEMS DEVELOPMENT PROJECT Service 143,849,633 1-Jul-14 30-Jun-15 143,849,633751 60520203 'LIVESTOCK DEVELOPMENT PROJECT Service 89,510,002 1-Jul-14 30-Jun-15 89,510,002752 60530104 'NATURAL RESOURCES SUSTAINABLE MANAGEMENT PROJECT Service 93,602,319 1-Jul-14 30-Jun-15 93,602,319753 60540102 ENERGY DEVELOPMENT AND ELECTRICITY PROVISION PROJECT Service 5,000,000 1-Jul-14 30-Jun-15 5,000,000754 60550101 WATER AND SANITATION INFRASTRUCTURES PROJECT Service 399,560,819 1-Jul-14 30-Jun-15 399,560,819755 60560203 URBAN AND RURAL SETTLEMENT PROJECT Service 120,829,437 1-Jul-14 30-Jun-15 120,829,437756 60560204 URBAN AND RURAL SETTLEMENT PROJECT Service 148,341,322 1-Jul-14 30-Jun-15 148,341,322757 60570103 'ROADS INFRASTRUCTURES PROJECT Service 60,000,000 1-Jul-14 30-Jun-15 60,000,000
08 EXTERNAL GRANTS 773,597,289 773,597,289DFID 349,753,260 349,753,26060490204 SOCIAL PROTECTION PROJECT Service 325,069,288 1-Jul-14 30-Jun-15 325,069,28860520104 'AGRICULTURAL PRODUCTION SYSTEMS DEVELOPMENT PROJECT Service 24,683,972 1-Jul-14 30-Jun-15 24,683,972KFW Service 130,088,769 130,088,76960550101 WATER AND SANITATION INFRASTRUCTURES PROJECT Service 14,528,200 1-Jul-14 30-Jun-15 14,528,20060560204 URBAN AND RURAL SETTLEMENT PROJECT Service 115,560,569 1-Jul-14 30-Jun-15 115,560,569NETHERLAND Service 293,755,260 293,755,26060510103 MARKET ORIENTED INFRASTRUCTURES PROJECT Service 71,705,487 1-Jul-14 30-Jun-15 71,705,48760520104 'AGRICULTURAL PRODUCTION SYSTEMS DEVELOPMENT PROJECT Service 44,280,445 1-Jul-14 30-Jun-15 44,280,44560550101 WATER AND SANITATION INFRASTRUCTURES PROJECT Service 127,769,328 1-Jul-14 30-Jun-15 127,769,32860560204 URBAN AND RURAL SETTLEMENT PROJECT Service 50,000,000 1-Jul-14 30-Jun-15 50,000,0006100 BURERA DISTRICT 2,946,647,101 2,946,647,10102 EARMARKED TRANSFERS (DISTRICTS) 2,115,350,690 2,115,350,690ENERGY, WATER AND SANITATION AUTHORITY (EWSA) 9,600,000 9,600,000
758 61540201 IMPROVE BIOMASS USE EFFICIENCY Service 9,600,000 1-Jul-14 30-Jun-15 9,600,000RWANDA 2,105,750,690 2,105,750,690
759 61460113 DISTRICT CAPACITIES SUPPORT PROJECT Service 95,068,576 1-Jul-14 30-Jun-15 95,068,576760 61470209 EDUCATION INFRASTRUCTURES PROJECT Service 337,391,573 1-Jul-14 30-Jun-15 337,391,573

761 61480204 HEALTH INFRASTRUCTURES PROJECT Service 316,334,092 1-Jul-14 30-Jun-15 316,334,092762 61490206 SOCIAL PROTECTION PROJECT Service 269,728,125 1-Jul-14 30-Jun-15 269,728,125763 61490209 SOCIAL PROTECTION PROVISION AND COORDINATION PROJECT Service 47,807,277 1-Jul-14 30-Jun-15 47,807,277764 61500301 NATIONAL EMPLOYEMENT PROGRAM (NEP) PROJECTS Service 12,737,065 1-Jul-14 30-Jun-15 12,737,065765 61510105 NATIONAL EMPLOYEMENT PROGRAM (NEP) PROJECTS Service 3,887,548 1-Jul-14 30-Jun-15 3,887,548766 61510106 MARKET ORIENTED INFRASTRUCTURES PROJECT Service 148,247,808 1-Jul-14 30-Jun-15 148,247,808767 61520103 AGRICULTURAL PRODUCTION SYSTEMS DEVELOPMENT PROJECT Service 225,770,360 1-Jul-14 30-Jun-15 225,770,360768 61520104 'LIVESTOCK DEVELOPMENT PROJECT Service 89,411,421 1-Jul-14 30-Jun-15 89,411,421769 61530101 NATURAL RESOURCES SUSTAINABLE MANAGEMENT PROJECT Service 52,430,079 1-Jul-14 30-Jun-15 52,430,079770 61550101 WATER AND SANITATION INFRASTRUCTURE PROJECT Service 162,771,890 1-Jul-14 30-Jun-15 162,771,890771 61560203 URBAN AND RURAL SETTLEMENT PROJECT Service 134,385,340 1-Jul-14 30-Jun-15 134,385,340772 61570109 ROADS INFRASTRUCTURES PROJECT Service 209,779,536 1-Jul-14 30-Jun-15 209,779,536
08 EXTERNAL GRANTS 831,296,411 831,296,411DFID 402,820,206 402,820,20661490206 SOCIAL PROTECTION PROJECT Service 355,012,929 1-Jul-14 30-Jun-15 355,012,92961570109 ROADS INFRASTRUCTURES PROJECT Service 47,807,277 1-Jul-14 30-Jun-15 47,807,277KFW Service 131,510,505 131,510,505
773 61540101 'ENERGY DEVELOPMENT AND ELECTRICITY PROVISION PROJECT Service 131,510,505 1-Jul-14 30-Jun-15 131,510,505NETHERLAND 296,965,700 296,965,70061550101 WATER AND SANITATION INFRASTRUCTURE PROJECT Service 296,965,700 1-Jul-14 30-Jun-15 296,965,7006200 GICUMBI DISTRICT 3,478,324,633 3,478,324,63302 EARMARKED TRANSFERS (DISTRICTS) 2,639,338,249 2,639,338,249RWANDA 63,393,772 63,393,772
774 62510106 MARKET ORIENTED INFRASTRUCTURES PROJECT: Service 11,355,640 1-Jul-14 30-Jun-15 11,355,640775 62560106 URBAN AND RURAL PROJECTS MANAGEMENT Service 52,038,132 1-Jul-14 30-Jun-15 52,038,132
ENERGY, WATER AND SANITATION AUTHORITY (EWSA) 34,200,000 34,200,000776 62540262 IMPROVE BIOMASS USE EFFICIENCY Service 34,200,000 1-Jul-14 30-Jun-15 34,200,000
RWANDA 15,791,958 15,791,958777 62530104 NATURAL RESOURCES SUSTAINABLE MANAGEMENT PROJECT Service 15,791,958 1-Jul-14 30-Jun-15 15,791,958
RWANDA 2,525,952,519 2,525,952,519778 62460136 DISTRICT CAPACITIES SUPPORT PROJECT Service 189,123,319 1-Jul-14 30-Jun-15 189,123,319779 62460137 ICT DEVELOPMENT PROJECT Service 16,500,000 1-Jul-14 30-Jun-15 16,500,000780 62470210 EDUCATION INFRASTRUCTURES PROJECT Service 195,200,000 1-Jul-14 30-Jun-15 195,200,000781 62480222 HEALTH INFRASTRUCTURES PROJECT Service 508,727,861 1-Jul-14 30-Jun-15 508,727,861782 62490210 SOCIAL PROTECTION PROVISION AND COORDINATION PROJECT Service 44,147,569 1-Jul-14 30-Jun-15 44,147,569783 62490229 SOCIAL PROTECTION PROJECT Service 275,703,283 1-Jul-14 30-Jun-15 275,703,283784 62500305 NATIONAL EMPLOYEMENT PROGRAM (NEP) PROJECT Service 8,294,262 1-Jul-14 30-Jun-15 8,294,262785 62510106 MARKET ORIENTED INFRASTRUCTURES PROJECT: Service 211,632,372 1-Jul-14 30-Jun-15 211,632,372786 62520102 AGRICULTURAL PRODUCTION SYSTEMS DEVELOPMENT PROJECT Service 398,844,378 1-Jul-14 30-Jun-15 398,844,378787 62520202 LIVESTOCK DEVELOPMENT PROJECT Service 69,607,444 1-Jul-14 30-Jun-15 69,607,444788 62530104 NATURAL RESOURCES SUSTAINABLE MANAGEMENT PROJECT Service 57,175,803 1-Jul-14 30-Jun-15 57,175,803789 62550105 WATER AND SANITATION INFRASTRUCTURES PROJECT Service 386,724,603 1-Jul-14 30-Jun-15 386,724,603790 62570103 ROADS INFRASTRUCTURES PROJECT Service 35,000,000 1-Jul-14 30-Jun-15 35,000,000791 62570109 ROADS INFRASTRUCTURE MANAGEMENT PROJECT Service 12,000,000 1-Jul-14 30-Jun-15 12,000,000792 62570111 ROADS MAINTENANCE PROJECT Service 117,271,625 1-Jul-14 30-Jun-15 117,271,625
08 EXTERNAL GRANTS 838,986,384 838,986,384DFID 364,188,428 364,188,42862490229 SOCIAL PROTECTION PROJECT Service 320,040,859 1-Jul-14 30-Jun-15 320,040,859
800 62520102 AGRICULTURAL PRODUCTION SYSTEMS DEVELOPMENT PROJECT Service 44,147,569 1-Jul-14 30-Jun-15 44,147,569KFW 145,727,857 145,727,85762510106 MARKET ORIENTED INFRASTRUCTURES PROJECT: Service 145,727,857 1-Jul-14 30-Jun-15 145,727,857NETHERLAND 329,070,099 329,070,099
801 62540106 ENERGY DEVELOPMENT AND ELECTRICITY PROVISION PROJECT Service 300,000,000 1-Jul-14 30-Jun-15 300,000,00062570111 ROADS MAINTENANCE PROJECT Service 29,070,099 1-Jul-14 30-Jun-15 29,070,0996300 MUSANZE DISTRICT 2,490,887,382 2,490,887,38202 EARMARKED TRANSFERS (DISTRICTS) 1,705,976,304 1,705,976,304ENERGY, WATER AND SANITATION AUTHORITY (EWSA) 16,500,000 16,500,000
802 63540201 IMPROVE BIOMASS USE EFFICIENCY Service 16,500,000 1-Jul-14 30-Jun-15 16,500,000RWANDA 1,689,476,304 1,689,476,304
803 63460111 DISTRICT CAPACITIES SUPPORT PROJECT Service 129,488,873 1-Jul-14 30-Jun-15 129,488,873804 63470214 EDUCATION INFRASTRUCTURES PROJECT Service 156,769,900 1-Jul-14 30-Jun-15 156,769,900805 63480207 HEALTH INFRASTRUCTURES PROJECT Service 34,862,126 1-Jul-14 30-Jun-15 34,862,126806 63490210 SOCIAL PROTECTION PROJECT Service 129,439,551 1-Jul-14 30-Jun-15 129,439,551807 63490227 SOCIAL PROTECTION PROVISION AND COORDINATION PROJECT Service 30,310,767 1-Jul-14 30-Jun-15 30,310,767808 63500302 NATIONAL EMPLOYEMENT PROGRAM (NEP) PROJECTS Service 12,737,065 1-Jul-14 30-Jun-15 12,737,065809 63510106 MARKET ORIENTED INFRASTRUCTURES PROJECT Service 59,133,861 1-Jul-14 30-Jun-15 59,133,861810 63520102 AGRICULTURAL PRODUCTION SYSTEMS DEVELOPMENT PROJECT Service 13,783,146 1-Jul-14 30-Jun-15 13,783,146811 63520208 LIVESTOCK DEVELOPMENT PROJECT Service 60,078,000 1-Jul-14 30-Jun-15 60,078,000812 63530102 'NATURAL RESOURCES SUSTAINABLE MANAGEMENT PROJECT Service 164,561,897 1-Jul-14 30-Jun-15 164,561,897813 63540103 ENERGY DEVELOPMENT AND ELECTRICITY PROVISION PROJECT Service 208,502,000 1-Jul-14 30-Jun-15 208,502,000814 63550109 WATER AND SANITATION INFRASTRUCTURES PROJECT Service 19,411,057 1-Jul-14 30-Jun-15 19,411,057815 63560202 URBAN AND RURAL SETTLEMENT PROJECT Service 45,000,000 1-Jul-14 30-Jun-15 45,000,000816 63560203 URBAN AND RURAL SETTLEMENT PROJECT Service 88,217,218 1-Jul-14 30-Jun-15 88,217,218817 63570103 ROADS INFRASTRUCTURES PROJECT Service 537,180,843 1-Jul-14 30-Jun-15 537,180,843
08 EXTERNAL GRANTS 784,911,078 784,911,078DFID 407,590,429 407,590,42963490210 SOCIAL PROTECTION PROJECT Service 377,279,662 1-Jul-14 30-Jun-15 377,279,66263520102 AGRICULTURAL PRODUCTION SYSTEMS DEVELOPMENT PROJECT Service 30,310,767 1-Jul-14 30-Jun-15 30,310,767KFW 125,112,697 125,112,69763570103 ROADS INFRASTRUCTURES PROJECT Service 125,112,697 1-Jul-14 30-Jun-15 125,112,697NETHERLAND Service 252,207,952 252,207,95263540103 ENERGY DEVELOPMENT AND ELECTRICITY PROVISION PROJECT Service 50,000,000 1-Jul-14 30-Jun-15 50,000,00063570103 ROADS INFRASTRUCTURES PROJECT Service 202,207,952 1-Jul-14 30-Jun-15 202,207,9526400 RULINDO DISTRICT 3,776,580,306 3,776,580,30602 EARMARKED TRANSFERS (DISTRICTS) 2,850,681,422 2,850,681,422ENERGY, WATER AND SANITATION AUTHORITY (EWSA) 21,600,000 21,600,000
818 64540201 IMPROVE BIOMASS USE EFFICIENCY Service 21,600,000 1-Jul-14 30-Jun-15 21,600,000RWANDA Service 2,829,081,422 2,829,081,422
819 64460112 'DISTRICT CAPACITIES SUPPORT PROJECT Service 144,558,542 1-Jul-14 30-Jun-15 144,558,542820 64470213 EDUCATION INFRASTRUCTURES PROJECT Service 294,769,286 1-Jul-14 30-Jun-15 294,769,286

821 64490201 SOCIAL PROTECTION PROJECT Service 202,431,240 1-Jul-14 30-Jun-15 202,431,240822 64490204 SOCIAL PROTECTION PROVISION AND COORDINATION PROJECT: Service 51,445,914 1-Jul-14 30-Jun-15 51,445,914823 64500303 SPORT & CULTURE DEVELOPMENT PROJECT Service 415,831,515 1-Jul-14 30-Jun-15 415,831,515824 64500304 NATIONAL EMPLOYEMENT PROGRAM (NEP) PROJECTS Service 6,020,750 1-Jul-14 30-Jun-15 6,020,750825 64510101 MARKET ORIENTED INFRASTRUCTURES PROJECT Service 110,411,596 1-Jul-14 30-Jun-15 110,411,596826 64520202 'LIVESTOCK DEVELOPMENT PROJECT Service 89,073,561 1-Jul-14 30-Jun-15 89,073,561827 64530103 'NATURAL RESOURCES SUSTAINABLE MANAGEMENT PROJECT Service 48,824,053 1-Jul-14 30-Jun-15 48,824,053828 64550103 WATER AND SANITATION INFRASTRUCTURES PROJECT Service 136,332,859 1-Jul-14 30-Jun-15 136,332,859829 64560204 'URBAN AND RURAL SETTLEMENT PROJECT Service 408,626,494 1-Jul-14 30-Jun-15 408,626,494830 64570101 ROADS INFRASTRUCTURES PROJECT Service 920,755,612 1-Jul-14 30-Jun-15 920,755,612
08 EXTERNAL GRANTS 925,898,884 925,898,884DFID Service 583,239,086 583,239,08664490201 SOCIAL PROTECTION PROJECT Service 531,793,172 1-Jul-14 30-Jun-15 531,793,17264510101 MARKET ORIENTED INFRASTRUCTURES PROJECT Service 51,445,914 1-Jul-14 30-Jun-15 51,445,914KFW 105,087,238 105,087,23864550103 WATER AND SANITATION INFRASTRUCTURES PROJECT Service 105,087,238 1-Jul-14 30-Jun-15 105,087,238NETHERLAND 184,184,884 184,184,884
831 64540102 ENERGY DEVELOPMENT AND ELECTRICITY PROVISION PROJECT Service 175,797,022 1-Jul-14 30-Jun-15 175,797,02264550103 WATER AND SANITATION INFRASTRUCTURES PROJECT Service 8,387,862 1-Jul-14 30-Jun-15 8,387,862UNITED STATES AGENCY FOR INTERNATIONAL DEVELOPMENT - USAID 53,387,676 53,387,676
832 64520103 'AGRICULTURAL PRODUCTION SYSTEMS DEVELOPMENT PROJECT Service 53,387,676 1-Jul-14 30-Jun-15 53,387,6766500 GAKENKE DISTRICT 3,225,278,132 3,225,278,13202 EARMARKED TRANSFERS (DISTRICTS) 2,334,628,197 2,334,628,197ENERGY, WATER AND SANITATION AUTHORITY (EWSA) 49,800,000 49,800,000
833 65540202 IMPROVE BIOMASS USE EFFICIENCY Service 49,800,000 1-Jul-14 30-Jun-15 49,800,000RWANDA 2,284,828,197 2,284,828,197
834 65450121 ADMINISTRATIVE INFRASTRUCTURES PROJECT Service 71,600,000 1-Jul-14 30-Jun-15 71,600,000835 65460106 DISTRICT CAPACITIES SUPPORT PROJECT Service 80,703,087 1-Jul-14 30-Jun-15 80,703,087836 65470207 EDUCATION INFRASTRUCTURES PROJECT Service 299,665,262 1-Jul-14 30-Jun-15 299,665,262837 65470357 ELECTRIFICATION AND PROTECTION OF NEMBA YOUTH TRAINING
CENTERService
34,422,500 1-Jul-14 30-Jun-15 34,422,500
838 65480202 HEALTH FACILITIES PROVISION AND MANAGEMENT PROJECT Service 151,234,447 1-Jul-14 30-Jun-15 151,234,447839 65490201 SOCIAL PROTECTION PROVISION AND COORDINATION PROJECT Service 44,251,973 1-Jul-14 30-Jun-15 44,251,973840 65490204 SOCIAL PROTECTION PROJECT Service 766,810,987 1-Jul-14 30-Jun-15 766,810,987841 65500303 NATIONAL EMPLOYEMENT PROGRAM (NEP) PROJECT Service 12,737,065 1-Jul-14 30-Jun-15 12,737,065842 65520103 AGRICULTURAL PRODUCTION SYSTEMS DEVELOPMENT AND
INTENSIFICATION PROJECTService
139,973,504 1-Jul-14 30-Jun-15 139,973,504
843 65520204 LIVESTOCK DEVELOPMENT PROJECT Service 85,078,897 1-Jul-14 30-Jun-15 85,078,897844 65530103 NATURAL RESOURCES SUSTAINABLE MANAGEMENT PROJECT Service 52,556,839 1-Jul-14 30-Jun-15 52,556,839845 65540102 ENERGY DEVELOPMENT AND ELECTRICITY PROVISION PROJECT Service 119,293,679 1-Jul-14 30-Jun-15 119,293,679846 65550101 WATER AND SANITATION INFRASTRUCTURES PROJECT Service 121,378,777 1-Jul-14 30-Jun-15 121,378,777847 65560202 URBAN AND RURAL SETTLEMENT PROJECT Service 64,006,000 1-Jul-14 30-Jun-15 64,006,000848 65570104 ROADS INFRASTRUCTURES PROJECT Service 241,115,180 1-Jul-14 30-Jun-15 241,115,180
08 EXTERNAL GRANTS 890,649,935 890,649,935DFID 455,225,467 455,225,46765490204 SOCIAL PROTECTION PROJECT Service 455,225,467 1-Jul-14 30-Jun-15 455,225,467KFW Service 133,643,108 133,643,10865550101 WATER AND SANITATION INFRASTRUCTURES PROJECT Service 133,643,108 1-Jul-14 30-Jun-15 133,643,108NETHERLAND Service 301,781,360 301,781,360
849 65510104 MARKET ORIENTED RURAL INFRASTRUCTURE PROJECT Service 301,781,360 1-Jul-14 30-Jun-15 301,781,3606600 RUHANGO DISTRICT 2,811,262,063 2,811,262,06302 EARMARKED TRANSFERS (DISTRICTS) 2,146,922,319 2,146,922,319RWANDA 236,000,000 236,000,000
850 66470206 EDUCATION SUPPORT PROJECT Service 36,000,000 1-Jul-14 30-Jun-15 36,000,000851 66540104 'ENERGY DEVELOPMENT AND ELECTRICITY PROVISION PROJECT Service 200,000,000 1-Jul-14 30-Jun-15 200,000,000
ENERGY, WATER AND SANITATION AUTHORITY (EWSA) 21,600,000 21,600,000852 66540201 IMPROVE BIOMASS USE EFFICIENCY Service 21,600,000 1-Jul-14 30-Jun-15 21,600,000
MINEDUC 85,826,087 85,826,087853 66470206 EDUCATION SUPPORT PROJECT Service 85,826,087 1-Jul-14 30-Jun-15 85,826,087
RWANDA ENVIRONMENT MANAGEMENT AUTHORITY 89,836,237 89,836,237854 66570105 ROADS INFRASTRUCTURES PROJECT Service 89,836,237 1-Jul-14 30-Jun-15 89,836,237
RWANDA 1,713,659,995 1,713,659,995855 66450113 ADMINISTRATIVE INFRASTRUCTURES PROJECT Service 321,641,198 1-Jul-14 30-Jun-15 321,641,198856 66460117 DISTRICT CAPACITIES SUPPORT PROJECT Service 86,179,281 1-Jul-14 30-Jun-15 86,179,281857 66460118 ICT DEVELOPMENT PROJECT Service 19,916,756 1-Jul-14 30-Jun-15 19,916,756858 66480202 HEALTH INFRASTRUCTURES PROJECT Service 34,259,615 1-Jul-14 30-Jun-15 34,259,615859 66490205 SOCIAL PROTECTION PROJECT Service 363,556,803 1-Jul-14 30-Jun-15 363,556,803860 66500305 SPORT & CULTURE DEVELOPMENT PROJECT Service 43,653,755 1-Jul-14 30-Jun-15 43,653,755861 66500321 NATIONAL EMPLOYEMENT PROGRAM (NEP) PROJECTS Service 11,624,613 1-Jul-14 30-Jun-15 11,624,613862 66510106 MARKET ORIENTED INFRASTRUCTURES PROJECT Service 180,289,198 1-Jul-14 30-Jun-15 180,289,198863 66520103 AGRICULTURAL PRODUCTION SYSTEMS DEVELOPMENT PROJECT Service 207,505,685 1-Jul-14 30-Jun-15 207,505,685864 66520203 LIVESTOCK DEVELOPMENT PROJECT Service 52,584,206 1-Jul-14 30-Jun-15 52,584,206865 66530105 'NATURAL RESOURCES SUSTAINABLE MANAGEMENT PROJECT Service 21,000,000 1-Jul-14 30-Jun-15 21,000,000866 66540104 'ENERGY DEVELOPMENT AND ELECTRICITY PROVISION PROJECT Service 97,915,003 1-Jul-14 30-Jun-15 97,915,003867 66550101 WATER AND SANITATION INFRASTRUCTURES PROJECT Service 85,000,000 1-Jul-14 30-Jun-15 85,000,000868 66560203 URBAN AND RURAL SETTLEMENT PROJECT Service 62,000,000 1-Jul-14 30-Jun-15 62,000,000869 66570105 ROADS INFRASTRUCTURES PROJECT Service 126,533,882 1-Jul-14 30-Jun-15 126,533,882
08 EXTERNAL GRANTS 664,339,744 664,339,744DFID 329,558,780 329,558,78066490205 SOCIAL PROTECTION PROJECT Service 302,944,891 1-Jul-14 30-Jun-15 302,944,89166570105 ROADS INFRASTRUCTURES PROJECT Service 26,613,889 1-Jul-14 30-Jun-15 26,613,889KFW 105,208,404 105,208,40466530105 'NATURAL RESOURCES SUSTAINABLE MANAGEMENT PROJECT Service 101,100,826 1-Jul-14 30-Jun-15 101,100,82666570105 ROADS INFRASTRUCTURES PROJECT Service 4,107,578 1-Jul-14 30-Jun-15 4,107,578NETHERLAND 229,572,560 229,572,56066510106 MARKET ORIENTED INFRASTRUCTURES PROJECT Service 12,000,000 1-Jul-14 30-Jun-15 12,000,00066570105 ROADS INFRASTRUCTURES PROJECT Service 217,572,560 1-Jul-14 30-Jun-15 217,572,5606700 NYARUGENGE DISTRICT 1,284,131,599 1,284,131,59902 EARMARKED TRANSFERS (DISTRICTS) 1,067,408,200 1,067,408,200RWANDA 175,087,987 175,087,987

870 67470212 EDUCATION INFRASTRUCTURES PROJECT Service 36,000,000 1-Jul-14 30-Jun-15 36,000,000871 67480209 HEALTH INFRASTRUCTURES PROJECT Service 10,000,000 1-Jul-14 30-Jun-15 10,000,000872 67510107 NATIONAL EMPLOYEMENT PROGRAM (NEP) PROJECTS Service 23,049,248 1-Jul-14 30-Jun-15 23,049,248873 67520208 LIVESTOCK DEVELOPMENT PROJECT Service 4,386,620 1-Jul-14 30-Jun-15 4,386,620874 67530104 NATURAL RESOURCES SUSTAINABLE MANAGEMENT PROJECT Service 5,810,256 1-Jul-14 30-Jun-15 5,810,256875 67550104 WATER AND SANITATION INFRASTRUCTURES PROJECT Service 95,841,863 1-Jul-14 30-Jun-15 95,841,863
RWANDA 892,320,213 892,320,213876 67460156 DISTRICT CAPACITIES SUPPORT PROJECT Service 75,096,304 1-Jul-14 30-Jun-15 75,096,304877 67470212 EDUCATION INFRASTRUCTURES PROJECT Service 239,422,382 1-Jul-14 30-Jun-15 239,422,382878 67490220 SOCIAL PROTECTION PROVISION AND COORDINATION PROJECT: Service 44,622,758 1-Jul-14 30-Jun-15 44,622,758879 67490227 SOCIAL PROTECTION PROJECT Service 113,061,615 1-Jul-14 30-Jun-15 113,061,615880 67500310 SPORT & CULTURE DEVELOPMENT PROJECT Service 12,950,752 1-Jul-14 30-Jun-15 12,950,752881 67520101 AGRICULTURAL PRODUCTION SYSTEMS DEVELOPMENT PROJECT Service 59,368,986 1-Jul-14 30-Jun-15 59,368,986882 67520208 LIVESTOCK DEVELOPMENT PROJECT Service 40,375,747 1-Jul-14 30-Jun-15 40,375,747883 67530104 NATURAL RESOURCES SUSTAINABLE MANAGEMENT PROJECT Service 36,352,524 1-Jul-14 30-Jun-15 36,352,524884 67570145 ROADS INFRASTRUCTURES PROJECT Service 252,222,677 1-Jul-14 30-Jun-15 252,222,677885 67570146 ROADS MAINTANANCE PROJECT Service 18,846,468 1-Jul-14 30-Jun-15 18,846,468
08 EXTERNAL GRANTS 216,723,399 216,723,399DFID Service 154,019,533 154,019,53367490227 SOCIAL PROTECTION PROJECT Service 74,256,700 1-Jul-14 30-Jun-15 74,256,70067550104 WATER AND SANITATION INFRASTRUCTURES PROJECT Service 12,960,462 1-Jul-14 30-Jun-15 12,960,46267570145 ROADS INFRASTRUCTURES PROJECT Service 66,802,371 1-Jul-14 30-Jun-15 66,802,371KFW 53,037,154 53,037,15467570145 ROADS INFRASTRUCTURES PROJECT Service 53,037,154 1-Jul-14 30-Jun-15 53,037,154NETHERLAND 9,666,712 9,666,71267550104 WATER AND SANITATION INFRASTRUCTURES PROJECT Service 9,666,712 1-Jul-14 30-Jun-15 9,666,7126800 KICUKIRO DISTRICT 1,427,869,066 1,427,869,06602 EARMARKED TRANSFERS (DISTRICTS) 1,101,054,772 1,101,054,772RWANDA 1,054,415,673 1,054,415,673
886 68460120 DISTRICT CAPACITIES SUPPORT PROJECT Service 78,801,354 1-Jul-14 30-Jun-15 78,801,354887 68470221 EDUCATION INFRASTRUCTURES PROJECT Service 119,987,000 1-Jul-14 30-Jun-15 119,987,000888 68490212 SOCIAL PROTECTION PROJECT Service 151,150,380 1-Jul-14 30-Jun-15 151,150,380889 68500307 NATIONAL EMPLOYEMENT PROGRAM (NEP) PROJECT Service 10,428,145 1-Jul-14 30-Jun-15 10,428,145890 68520104 AGRICULTURAL PRODUCTION SYSTEMS DEVELOPMENT PROJECT Service 60,825,704 1-Jul-14 30-Jun-15 60,825,704891 68520207 LIVESTOCK DEVELOPMENT PROJECT Service 28,486,177 1-Jul-14 30-Jun-15 28,486,177892 68530103 NATURAL RESOURCES SUSTAINABLE MANAGEMENT PROJECT Service 37,435,757 1-Jul-14 30-Jun-15 37,435,757893 68560202 URBAN AND RURAL SETTLEMENT PROJECT Service 73,819,472 1-Jul-14 30-Jun-15 73,819,472894 68570105 ROADS INFRASTRUCTURES PROJECT Service 433,481,684 1-Jul-14 30-Jun-15 433,481,684895 68570106 ROADS MAINTENANCE PROJECT Service 60,000,000 1-Jul-14 30-Jun-15 60,000,000
ENERGY, WATER AND SANITATION AUTHORITY (EWSA) 10,500,000 10,500,000896 68540204 IMPROVE BIOMASS USE EFFICIENCY Service 10,500,000 1-Jul-14 30-Jun-15 10,500,000
RWANDA 36,139,099 36,139,099897 68490227 SOCIAL PROTECTION PROVISION AND COORDINATION PROJECT Service 30,256,132 1-Jul-14 30-Jun-15 30,256,132898 68500307 NATIONAL EMPLOYEMENT PROGRAM (NEP) PROJECT Service 5,882,967 1-Jul-14 30-Jun-15 5,882,967
08 EXTERNAL GRANTS 326,814,294 326,814,294DFID 149,996,032 149,996,03268490212 SOCIAL PROTECTION PROJECT Service 119,739,900 1-Jul-14 30-Jun-15 119,739,90068570105 ROADS INFRASTRUCTURES PROJECT Service 30,256,132 1-Jul-14 30-Jun-15 30,256,132GERMANY 51,893,334 51,893,334
899 68570101 ROADS INFRASTRUCTURE MANAGEMENT PROJECT Service 51,893,334 1-Jul-14 30-Jun-15 51,893,334NETHERLAND Service 124,924,928 124,924,92868570101 ROADS INFRASTRUCTURE MANAGEMENT PROJECT Service 86,924,928 1-Jul-14 30-Jun-15 86,924,92868570106 ROADS MAINTENANCE PROJECT Service 38,000,000 1-Jul-14 30-Jun-15 38,000,0006900 GASABO DISTRICT 2,058,576,536 2,058,576,53602 EARMARKED TRANSFERS (DISTRICTS) 1,510,769,364 1,510,769,364RWANDA 54,606,079 54,606,079
900 69570111 ROADS INFRASTRUCTURES PROJECT Service 54,606,079 1-Jul-14 30-Jun-15 54,606,079ENERGY, WATER AND SANITATION AUTHORITY (EWSA) 22,800,000 22,800,000
901 69540201 IMPROVE BIOMASS USE EFFICIENCY Service 22,800,000 1-Jul-14 30-Jun-15 22,800,000RWANDA 1,433,363,285 1,433,363,285
902 69450103 ADMINISTRATIVE INFRASTRUCTURES PROJECT Service 122,897,123 1-Jul-14 30-Jun-15 122,897,123903 69460131 DISTRICT CAPACITIES SUPPORT PROJECT Service 145,402,971 1-Jul-14 30-Jun-15 145,402,971904 69470212 EDUCATION INFRASTRUCTURES PROJECT Service 186,400,000 1-Jul-14 30-Jun-15 186,400,000905 69480204 HEALTH INFRASTRUCTURES PROJECT Service 81,000,000 1-Jul-14 30-Jun-15 81,000,000906 69490227 SOCIAL PROTECTION PROVISION AND COORDINATION PROJECT Service 29,689,300 1-Jul-14 30-Jun-15 29,689,300907 69490228 SOCIAL PROTECTION PROJECT Service 139,957,597 1-Jul-14 30-Jun-15 139,957,597908 69500305 NATIONAL EMPLOYEMENT PROGRAM (NEP) PROJECTS Service 24,987,065 1-Jul-14 30-Jun-15 24,987,065909 69510108 MARKET ORIENTED INFRASTRUCTURES PROJECT Service 40,000,000 1-Jul-14 30-Jun-15 40,000,000910 69520104 AGRICULTURAL PRODUCTION SYSTEMS DEVELOPMENT AND
INTENSIFICATION PROJECTService
33,052,056 1-Jul-14 30-Jun-15 33,052,056
911 69520206 LIVESTOCK DEVELOPMENT PROJECT Service 57,202,351 1-Jul-14 30-Jun-15 57,202,351912 69530105 NATURAL RESOURCES SUSTAINABLE MANAGEMENT PROJECT Service 42,715,007 1-Jul-14 30-Jun-15 42,715,007913 69540104 ENERGY DEVELOPMENT AND ELECTRICITY PROVISION PROJECT Service 245,684,686 1-Jul-14 30-Jun-15 245,684,686914 69550104 WATER AND SANITATION INFRASTRUCTURES PROJECT Service 117,064,429 1-Jul-14 30-Jun-15 117,064,429915 69570111 ROADS INFRASTRUCTURES PROJECT Service 167,310,700 1-Jul-14 30-Jun-15 167,310,700
08 EXTERNAL GRANTS 547,807,172 547,807,172DFID 182,697,200 182,697,20069490228 SOCIAL PROTECTION PROJECT Service 153,007,900 1-Jul-14 30-Jun-15 153,007,90069570111 ROADS INFRASTRUCTURES PROJECT Service 29,689,300 1-Jul-14 30-Jun-15 29,689,300KFW 130,747,853 130,747,853
91669540103 ENERGY AND ELECTRICITY PROVISION AND MANAGEMENT PROJECT Service
26,961,184 1-Jul-14 30-Jun-15 26,961,184
69550104 WATER AND SANITATION INFRASTRUCTURES PROJECT Service 103,786,669 1-Jul-14 30-Jun-15 103,786,669NETHERLAND 234,362,119 234,362,11969510108 MARKET ORIENTED INFRASTRUCTURES PROJECT Service 86,862,119 1-Jul-14 30-Jun-15 86,862,11969570111 ROADS INFRASTRUCTURES PROJECT Service 147,500,000 1-Jul-14 30-Jun-15 147,500,0007000 KIGALI CITY 2,555,016,048 2,555,016,04802 EARMARKED TRANSFERS (DISTRICTS) 2,159,820,130 2,159,820,130RWANDA 2,159,820,130 2,159,820,130
917 70370142 ROADS INFRASTRUCTURES PROJECT Service 2,001,132,377 1-Jul-14 30-Jun-15 2,001,132,377

918 70370143 WATER AND SANITATION INFRASTRUCTURES PROJECT Service 158,687,753 1-Jul-14 30-Jun-15 158,687,75308 EXTERNAL GRANTS 395,195,918 395,195,918KFW 121,295,918 121,295,91870370142 ROADS INFRASTRUCTURES PROJECT Service 121,295,918 1-Jul-14 30-Jun-15 121,295,918NETHERLAND Service 273,900,000 273,900,00070370142 ROADS INFRASTRUCTURES PROJECT Service 273,900,000 1-Jul-14 30-Jun-15 273,900,000DEVELOPMENT BANK OF RWANDA (BRD)SPECIAL PROJECTS & INFRASTRUCTURETOTAL NUMBER OF PROJECTS 244 FOR THE YEAR 2015 Service 60,581,407,916 60,581,407,916
HOUSING TOTAL NUMBER OF PROJECTS 173 FOR THE YEAR 2015 Service 8,564,953,663 8,564,953,663
EDUCATIONTOTAL NUMBER OF PROJECTS 38 FOR THE YEAR 2015 Service 14,863,949,032 14,863,949,032
1711 GRAND TOTAL POPULATION OF PROJECTS IN ALL SECTORS OF ECONOMIC ANALYSIS