cb flood risk assessment using gis
TRANSCRIPT
8/3/2019 CB Flood Risk Assessment Using GIS
http://slidepdf.com/reader/full/cb-flood-risk-assessment-using-gis 1/21
29
Community-Based Flood Risk Assessment Using GIS for the
Town of San Sebastián, Guatemala
G. Peters GuarínC.J. van Westen
L. Montoya
Abstract
The municipality of San Sebastián, considered one of the most prone to natural hazards in
Guatemala, was selected as one of the pilot areas of the UNESCO program on “Capacity Build-
ing for Natural Disaster Reduction”. The town is located within the Samalá basin, near the
active channel of the river, which is heavily affected by lahars related to the active Santiaguito-
Santa María volcanic complex. The town is threatened both by lahars as well as by flooding. As
is often the case in towns such as San Sebastián, very little data (e.g., cadastral, topographical,hydrological and meteorological) was available to perform a flood risk assessment based on
traditional hydrological modeling.
To perform a basic flood risk assessment, an alternative method for producing several sets
of data was implemented by combining aerial photo interpretation, the use of data question-
naires in a community-based field data collection campaign, and subsequent analysis using
Geographical Information Systems (GIS). A cadastral base map with an attribute database was
generated as key inputs for flood hazard and vulnerability assessment. Information collected by
means of a small-scale survey on a home-by-home basis, in cooperation with a local NGO, was
used to reconstruct the last flood that affected the town during Hurricane Mitch in 1998.
Based on this historic flood scenario vulnerability curves relating water height and speed
with expected level of damage were constructed for three of the main elements at risk within the
urban area: buildings, building contents, and road network. Vulnerability maps were generated
using GIS and combined with cost information to derive estimated losses.The resulting cadastral database containing physical and social information at the parcel
level as well as detailed information on flood hazard, vulnerability and expected losses, can be
used by municipal authorities as a valuable tool in municipal planning, including a wider range
of applications in addition to risk management.
Key words: flood hazard, risk assessment, risk, community-based methods, GIS
Resumen
El municipio de San Sebastián es considerado uno de los más susceptibles a amenazas naturales
en Guatemala. Por esta razón fue seleccionado como una de las áreas piloto del programa“Fortalecimiento de Capacidades Locales para la Reducción de Desastres Naturales” de la
UNESCO. Este municipio se localiza dentro de la cuenca del Río Samalá, cuyo cauce activo
esta siendo constantemente afectado por lahares provenientes del complejo volcánico activo
Santiaguito-Santa Maria. Para la cabecera municipal y pequeñas villas localizadas en sus márgenes
29
Address correspondence to G. Peters Guar í n, International Institute for Geo-information Science and
Earth Observation (ITC), P.O. Box 6, 7500 AA, Enschede, The Netherlands, Email:
[email protected]; [email protected]; [email protected]
edit_hsd_journal.pmd 12/21/2004, 10:24 AM29
8/3/2019 CB Flood Risk Assessment Using GIS
http://slidepdf.com/reader/full/cb-flood-risk-assessment-using-gis 2/21
30
esta conjugación de factores constituye una amenaza, tanto por la ocurrencia de lahares como
por inundaciones.
Por lo general, no sólo en Guatemala sino en muchas regiones de países en desarrollo, las
municipalidades pequeñas como San Sebastián no poseen las bases catastrales y topográficas ni
la información y los registros hidrológicos y meteorológicos requeridos para llevar a cabo un
análisis de riesgo por inundaciones; basado en modelación hidrológica tradicional.Se implementó un método alternativo para producir una serie de datos que permitiera llevar
a cabo un análisis básico de riesgo por inundaciones, combinando la interpretación de fotografías
aéreas, el diligenciamiento de cuestionarios en una campaña de recolección de datos con soporte
comunitario y finalmente su análisis usando Sistemas de Información Geográficos (SIG). Un
mapa catastral y una base de datos y atributos fueron generados como elementos claves para
evaluar la amenaza y vulnerabilidad a inundaciones. La información recolectada por medio de
una encuesta a pequeña escala, casa por casa en cooperación con una ONG local, fue usada para
reconstruir la última inundación que afectó la cabecera urbana de San Sebastián durante el
Huracán Mitch en 1998.
Tomando como base este escenario histórico se construyeron curvas de vulnerabilidad, que
relacionaran la altura y velocidad del agua con el nivel de daño esperado, para tres elementos en
riesgo, considerados vitales dentro de un área urbana: construcciones, contenido de las mismas
y red vial. Se generaron igualmente mapas de vulnerabilidad mediante análisis en SIG, los cuales
fueron combinados con información de costos para derivar finalmente información de daños
esperados.
Se espera que tanto la base catastral, la cual contiene datos físicos y sociales al nivel de
parcela; como la información de amenazas, vulnerabilidad y daño esperado se constituyan en
elementos valiosos para las autoridades municipales; y que dicha información sea integrada
tanto a los planes de gestión del riesgo, como a otro amplio rango de aplicaciones que incluyan
los planes de ordenamiento y desarrollo municipal.
Palabras Claves: Amenaza por inundación, análisis de vulnerabilidad, riesgo, métodos
comunitarios participativos, SIG
Introduction
Floods are one of the most common disaster phenomena, causing considerable personal injury
and property damage. Problems related to flooding and vulnerability of the population have
greatly increased in recent decades due to several factors including changes in land-use in the
hinterlands, urbanization of flood-prone sites, squatter settlements and sub-standard construc-
tions, and increased household density (Munich Re., 2002; Pelling, 2003).
In light of the limited financial resources of developing countries, the cost-benefit implica-
tions of disaster reduction alternatives must be carefully assessed. The expected damage (or
risk assessment) provides one of the necessary inputs in cost-benefit analyses. Defined as the
expected losses (e.g., casualties, injuries, property damage, and disruption of economic activi-
ties) due to hazardous events in a given area during a specific reference period, risk can be
estimated as the product of hazard, vulnerability and cost of the elements at risk (UNDRO,
1991).
Traditional methods for flood risk assessment are based on hydrological and hydraulic
modeling software packages. These models are useful in depicting the spatial and temporal
distribution of floods. However, few are well integrated within spatial modeling environments
(i.e., GIS) and few are capable of non-expert implementation (Al-Sabhan et al., 2003). In addi-
tion to the specific data requirements (quality and quantity), these types of models demand
edit_hsd_journal.pmd 12/21/2004, 10:24 AM30
8/3/2019 CB Flood Risk Assessment Using GIS
http://slidepdf.com/reader/full/cb-flood-risk-assessment-using-gis 3/21
31
considerable expertise in hydrological data evaluation, model application and the efficient man-
agement of large spatial and temporal datasets (FEMA, 2003).
Remote or rural areas in developing countries usually lack most of the technical data re-
quired to carry out such studies. Furthermore, local authorities often lack the required staff with
expertise to use the specialized techniques and models. Additionally, small budgets for invest-
ment restrict the acquisition of basic datasets through consulting companies. To bridge thisinformation gap, alternative methodologies and data sources should be used, such as those used
in community-based approaches which offer the possibility to compile, organize and recon-
struct the collective memory of the inhabitants from a flood-affected region. Examples of vul-
nerability and risk assessment studies using community-based approaches can be found in IFRC
(2002) and Coburn, Spence and Pomonis (1994). The use of GIS tools in such studies has been
demonstrated by AGSO (2001) and FEMA (2003).
One of the objectives of this study was to provide an alternative method for a basic flood
risk assessment in data-poor environments by combining aerial photo interpretation, data ques-
tionnaires in a community-based field data collection campaign, and its subsequent processing
and analysis using Geographical Information Systems (GIS). Datasets produced by these means
and managed under GIS could be used by local authorities to carry out many of the municipal
planning activities related to risk management. Moreover, these data could be used for other
administrative and decision-making purposes. In fact, data collection for risk mitigation does
not usually rate high on the priority lists of local authorities as there are a range of other prob-
lems which are perceived as more pressing. For example, the implementation or updating of
basic cadastral systems is important for local authorities seeking to increase municipal revenues
through better tax collection (van Westen et al., 2002).
Within the framework of the UNESCO program on “Capacity Building for Natural Disas-
ter Reduction” (UNESCO-CBNDR), a Regional Action Program for Central America was initi-
ated which focused on training and the development of case studies in most Central American
countries. One of these case studies was conducted in the town of San Sebastián, Guatemala,
located in an area exposed to a range of natural hazards. Over the last 50 years, the town has
been affected several times by floods from some of the tributaries of the Samalá River. The most
recent event occurred in October 1998 and was caused by extreme precipitation related to Hur-
ricane Mitch. The 1998 flood scenario was reconstructed through interviews with local people.The data were then used to conduct a vulnerability assessment and a loss estimate calculation.
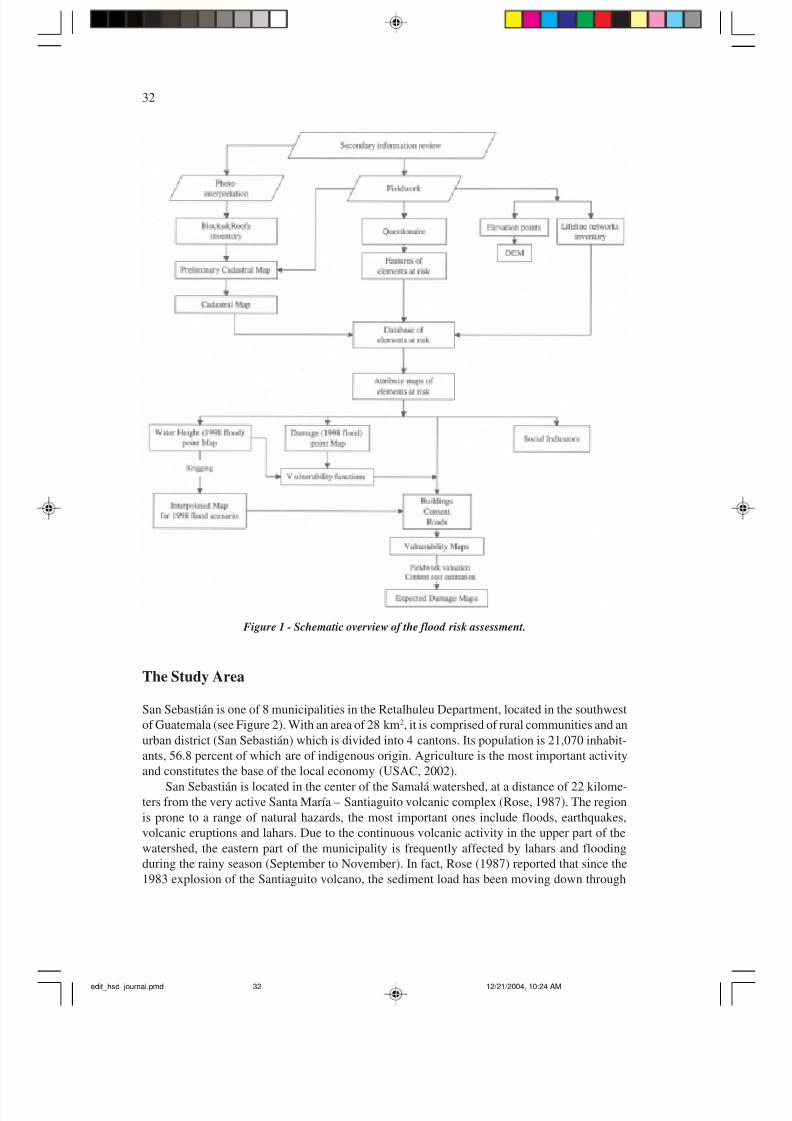
An overview of the methodology used is presented in Figure 1.
edit_hsd_journal.pmd 12/21/2004, 10:24 AM31
8/3/2019 CB Flood Risk Assessment Using GIS
http://slidepdf.com/reader/full/cb-flood-risk-assessment-using-gis 4/21
32
Figure 1 - Schematic overview of the flood risk assessment.
The Study Area
San Sebastián is one of 8 municipalities in the Retalhuleu Department, located in the southwest
of Guatemala (see Figure 2). With an area of 28 km2, it is comprised of rural communities and an
urban district (San Sebastián) which is divided into 4 cantons. Its population is 21,070 inhabit-
ants, 56.8 percent of which are of indigenous origin. Agriculture is the most important activity
and constitutes the base of the local economy (USAC, 2002).
San Sebastián is located in the center of the Samalá watershed, at a distance of 22 kilome-ters from the very active Santa María – Santiaguito volcanic complex (Rose, 1987). The region
is prone to a range of natural hazards, the most important ones include floods, earthquakes,
volcanic eruptions and lahars. Due to the continuous volcanic activity in the upper part of the
watershed, the eastern part of the municipality is frequently affected by lahars and flooding
during the rainy season (September to November). In fact, Rose (1987) reported that since the
1983 explosion of the Santiaguito volcano, the sediment load has been moving down through
edit_hsd_journal.pmd 12/21/2004, 10:24 AM32
8/3/2019 CB Flood Risk Assessment Using GIS
http://slidepdf.com/reader/full/cb-flood-risk-assessment-using-gis 5/21
33
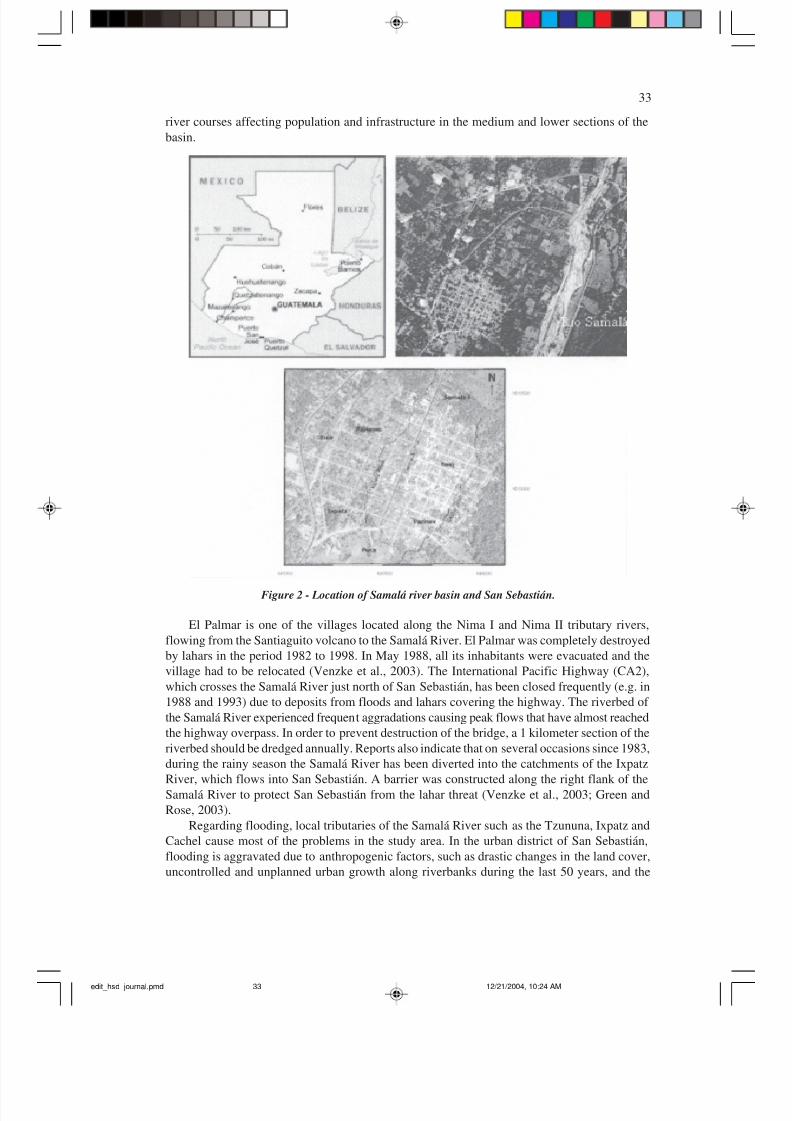
river courses affecting population and infrastructure in the medium and lower sections of the
basin.
Figure 2 - Location of Samalá river basin and San Sebastián.
El Palmar is one of the villages located along the Nima I and Nima II tributary rivers,
flowing from the Santiaguito volcano to the Samalá River. El Palmar was completely destroyed
by lahars in the period 1982 to 1998. In May 1988, all its inhabitants were evacuated and the
village had to be relocated (Venzke et al., 2003). The International Pacific Highway (CA2),
which crosses the Samalá River just north of San Sebastián, has been closed frequently (e.g. in
1988 and 1993) due to deposits from floods and lahars covering the highway. The riverbed of
the Samalá River experienced frequent aggradations causing peak flows that have almost reached
the highway overpass. In order to prevent destruction of the bridge, a 1 kilometer section of the
riverbed should be dredged annually. Reports also indicate that on several occasions since 1983,
during the rainy season the Samalá River has been diverted into the catchments of the Ixpatz
River, which flows into San Sebastián. A barrier was constructed along the right flank of theSamalá River to protect San Sebastián from the lahar threat (Venzke et al., 2003; Green and
Rose, 2003).
Regarding flooding, local tributaries of the Samalá River such as the Tzununa, Ixpatz and
Cachel cause most of the problems in the study area. In the urban district of San Sebastián,
flooding is aggravated due to anthropogenic factors, such as drastic changes in the land cover,
uncontrolled and unplanned urban growth along riverbanks during the last 50 years, and the
edit_hsd_journal.pmd 12/21/2004, 10:24 AM33
8/3/2019 CB Flood Risk Assessment Using GIS
http://slidepdf.com/reader/full/cb-flood-risk-assessment-using-gis 6/21
34
dumping of garbage in the streams. The last flood event took place at the end of the rainy season
in 1998 coinciding with Hurricane Mitch’s landfall in Central America.
Rainfall from Hurricane Mitch was exceptional because it was geographically widespread,
prolonged over a period of about two weeks, moderate to heavy in intensity, and occurred at the
end of the rainy season when the ground already had a high moisture content. The area received
between 200 and 600 mm of rain over a 13-day period between October 25th and November6th. Meteorological stations, which are distantly and sparsely distributed across Guatemala,
provided a general picture of the precipitation associated with Hurricane Mitch throughout the
country, which ranged from 182 mm to 1,069 mm (USGS, 2002). In the Samalá River basin,
torrential rains caused floods three times during the last weeks of October in 1998, although no
lahars were reported. In the vicinity of San Sebastián, the near to flat watersheds of the minor
tributaries of the Samalá River caused the excess drainage to flow from one basin to another,
during major rainstorms (October 27, 1998). Such was the case of the Tzununa River that runs
west of San Sebastián, which overflowed north of the urban area at the bridge on the road to
Buena Vista Farm. From this point and for more than two kilometers down, the road acted as a
channel for the water, which was finally transferred to the upper part of the Ixpatz basin. The
Ixpatz River also overflowed just before reaching the urban district of San Sebastián, spreading
throughout the street network. Once there, the distribution of flood and damage was determined
by local topography, configuration of the streets and building blocks (particularly passages or
empty spaces between constructions), and presence of bottlenecks created along streams due to
encroachment of buildings in the streams. In other words, building features played an important
role in the behavior of the floodwater. This is an important point as it highlights the need to
obtain building footprint information (opposed to only parcel information) to accurately model
the distribution of the water during a flood event.
Data Collection
This survey started by collecting three sets of aerial photographs from San Sebastián (years
1964, 1991 and 2000). These images were ortho-rectified using GPS data and a 1:50,000 scale
topographic map. The orthophoto from 2000 was used as the basis for mapping cadastral unitsand elements at risk. The remaining two sets were used to evaluate the growth pattern for the
urban district over the last four decades.
Multi-temporal analysis of the aerial photographs and other data (USAC, 2002) revealed
that the rate of population growth is low (3 %), and that the urban area did not grow extensively
in size over that period. Instead, growth took place in the form of densification within the urban
area, as it is common practice for people to sub-divide their land among their children. Accord-
ingly, the number of plots inside one building block increases while the average plot size de-
creases. The analysis also revealed that growth in the urban area occurred along the floodplain.
The densification process has also affected watercourses, which are often directly bordered by
houses and confined to very narrow channels. Other factors contributing to increased suscepti-
bility to flooding include the poor state of the sewage system, the absence of a public solid waste
collection system (both have led to waste disposal in the streets and local streams), and changes
in land use since impermeable surfaces hamper infiltration and speed up run-off.
The orthophoto from 2000 was used to generate a cadastral base map containing informa-
tion on individual plots and buildings, with attached attribute information related to ownership,
building features and land use. Preliminary delineation of building blocks (or ‘manzanas’) and
roof inventory was made by means of detailed digital image interpretation and ‘on-screen’ digi-
tizing. Plot boundaries were later checked during fieldwork and significant discrepancies were
identified mainly in areas near the main square. Most were due to the complex densification
edit_hsd_journal.pmd 12/21/2004, 10:24 AM34
8/3/2019 CB Flood Risk Assessment Using GIS
http://slidepdf.com/reader/full/cb-flood-risk-assessment-using-gis 7/21
35
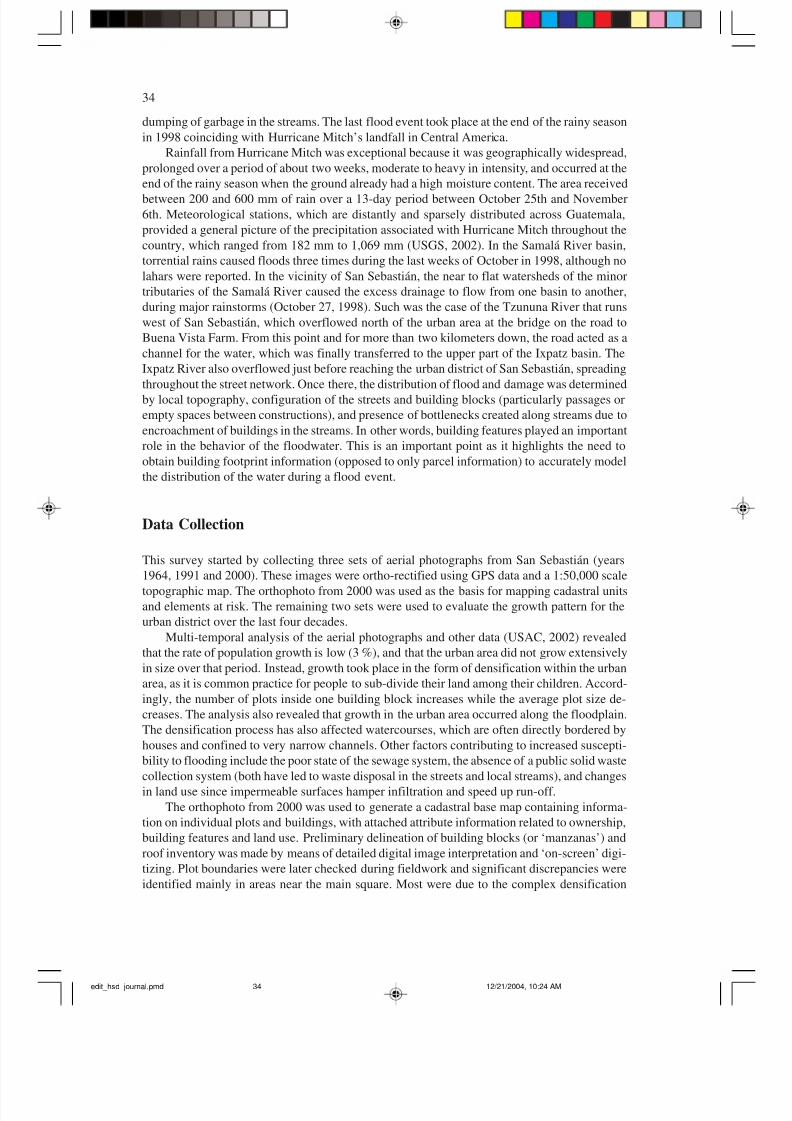
pattern that significantly increases the number of individual dwellings inside a building plot.
For example, a single roof may cover more than one home or a given plot may have more than
one type of roof (see Figure 3). The preliminary interpretation map was then verified and ad-
justed during inspection transects along the streets and inside the blocks.
Figure 3 - Comparison of digitized plots before (preliminary roof inventory - left) and after
field inspection (right), for a section of San Sebastián.
Attribute information for cadastral plots was collected through extensive fieldwork. In this
stage, a community-based tool (small-scale survey) was used to capture data in the urban area.
This ‘census’ was carried out in October 2002 with the aid of the “FEMID” group (Fortalecimiento
de Estructuras Locales en Mitigación de Riesgos), a local NGO working on an early warning
system for hazards (mostly lahars) in San Sebastián (FEMID, 2000). The survey was carried out
on a house-by-house basis by three groups of 2 interviewers, of which at least one was of local
origin. The survey included a technical description of the building and an interview with the
inhabitants. Whereas the technical description of the building was made for all cadastral plots,
interviews were only conducted at locations affected by flooding. Information about three main
topics: characteristics of the building and its contents, socio-economic aspects and information
on the magnitude and damage of historic flood events was obtained through a questionnaire
adapted from the National Commission for Disaster Reduction (CONRED).
The collection of reliable information about flood events that occurred before the 1998
Mitch flood proved to be a difficult task. Difficulties such as the resident’s age (e.g. too young
to remember the past events), recent settling down and lone dwellings reduced the survey’s
effectiveness. Nevertheless, several inhabitants confirmed that similar events had taken place
on at least two occasions over the last 50 years: one during the 1950’s and one at the beginning
of the 1970’s. Most of the inhabitants were able to indicate the flood height and describe dam-
ages caused by the inundation related to Hurricane Mitch in 1998. In several cases, especially
for buildings that had not been repaired or repainted, it was possible to measure floodwater
marks and use them for corroboration purposes later on.
Most of the survey was performed using traditional paper questionnaires. One of the teamsimplemented a mobile GIS consisting of a palmtop computer with a GIS including a database.
This tool-set was used for visualizing the orthophoto image, digitizing cadastral units and enter-
ing the attribute data. The information stored in the database for elements at risk was linked to
the cadastral base map by means of geographic attributes in the GIS. An overview of some of
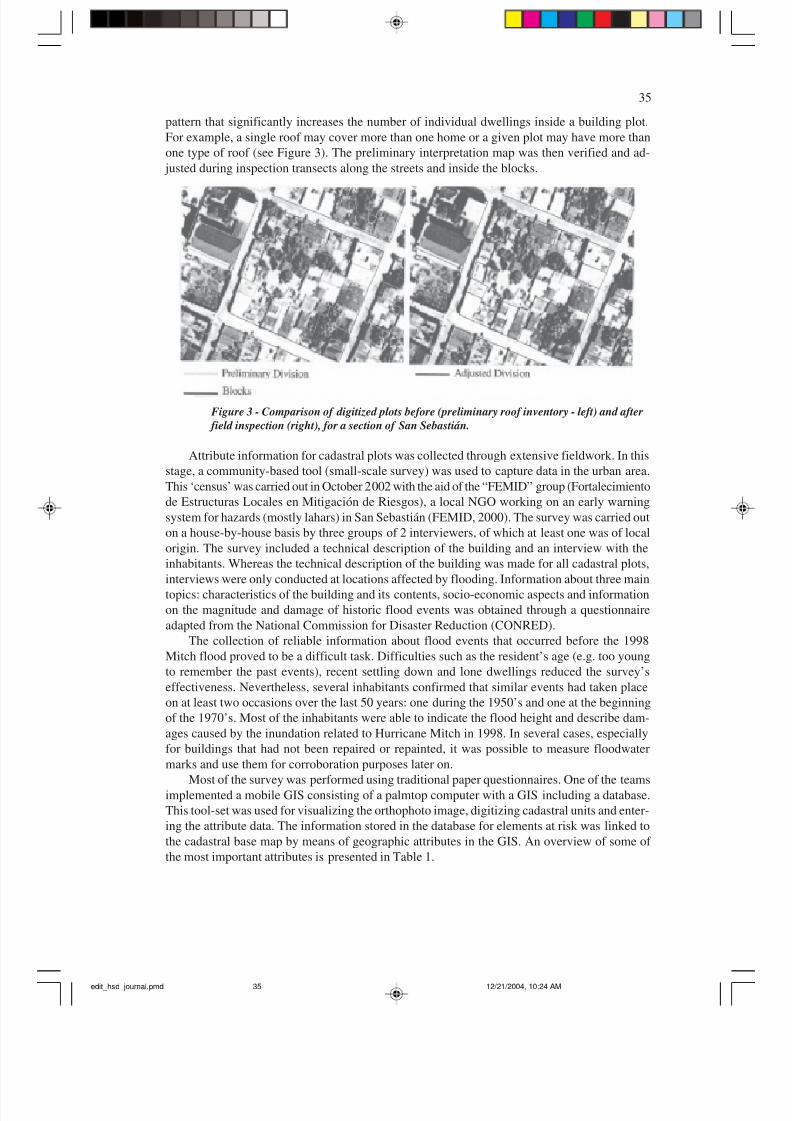
the most important attributes is presented in Table 1.
edit_hsd_journal.pmd 12/21/2004, 10:24 AM35
8/3/2019 CB Flood Risk Assessment Using GIS
http://slidepdf.com/reader/full/cb-flood-risk-assessment-using-gis 8/21
36
Table 1 - Description of some of the most significant attributes identified as risk elements
during the field survey.
Flood Scenario Mapping
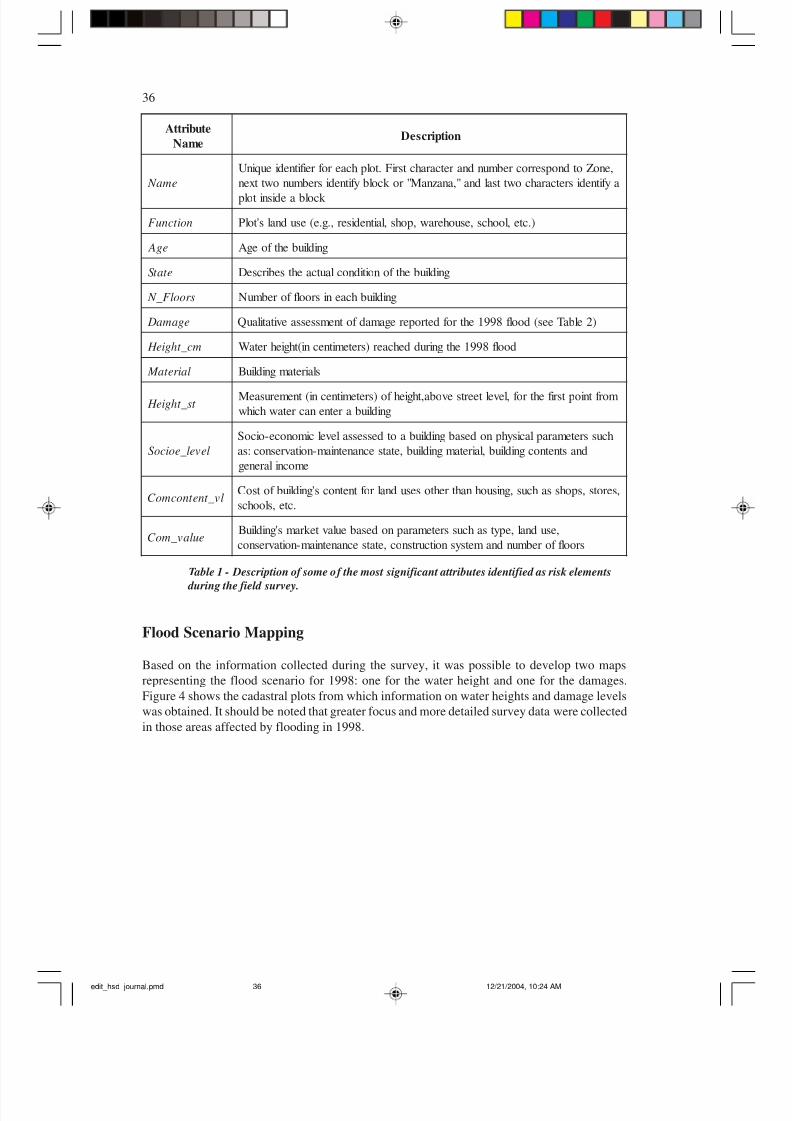
Based on the information collected during the survey, it was possible to develop two maps
representing the flood scenario for 1998: one for the water height and one for the damages.
Figure 4 shows the cadastral plots from which information on water heights and damage levels
was obtained. It should be noted that greater focus and more detailed survey data were collected
in those areas affected by flooding in 1998.
etubirttA
emaNnoitpircseD
ema N
,enoZotdnopserrocrebmundnaretcarahctsriF.tolphcaerof reif itnedieuqinU
ayf itnedisretcarahcowttsaldna",anaznaM"rok colbyf itnedisrebmunowttxen
k colbaedisnitolp
noit cnuF ).cte,loohcs,esuoheraw,pohs,laitnediser,.g.e(esudnals'tolP
eg A gnidliubehtf oegA
et at S gnidliubehtf onoitidnoclautcaehtsebircseD
sr oolF _ N gnidliubhcaenisroolf f orebmuN
egama D )2elbaTees(doolf 8991ehtrof detroperegamadf otnemssessaevitatilauQ
mc_t hgie H doolf 8991ehtgniruddehcaer)sretemitnecni(thgiehretaW
lair et a M slairetamgnidliuB
t s_t hgie H morf tnioptsrif ehtrof ,levelteertsevoba,thgiehf o)sretemitnecni(tnemerusaeM
gnidliubaretnenacretawhcihw
level_eoicoS
hcussretemaraplacisyhpnodesabgnidliubaotdessessalevelcimonoce-oicoS
dnastnetnocgnidliub,lairetamgnidliub,etatsecnanetniam-noitavresnoc:sa
emocnilareneg
lv_t net nocmoC ,serots,spohssahcus,gnisuohnahtrehtosesudnalrof tnetnocs'gnidliubf otsoC
.cte,sloohcs
eulav_moC ,esudnal,epytsahcussretemarapnodesabeulavtek rams'gnidliuB
sroolf f orebmundnametsysnoitcurtsnoc,etatsecnanetniam-noitavresnoc
edit_hsd_journal.pmd 12/21/2004, 10:24 AM36
8/3/2019 CB Flood Risk Assessment Using GIS
http://slidepdf.com/reader/full/cb-flood-risk-assessment-using-gis 9/21
37
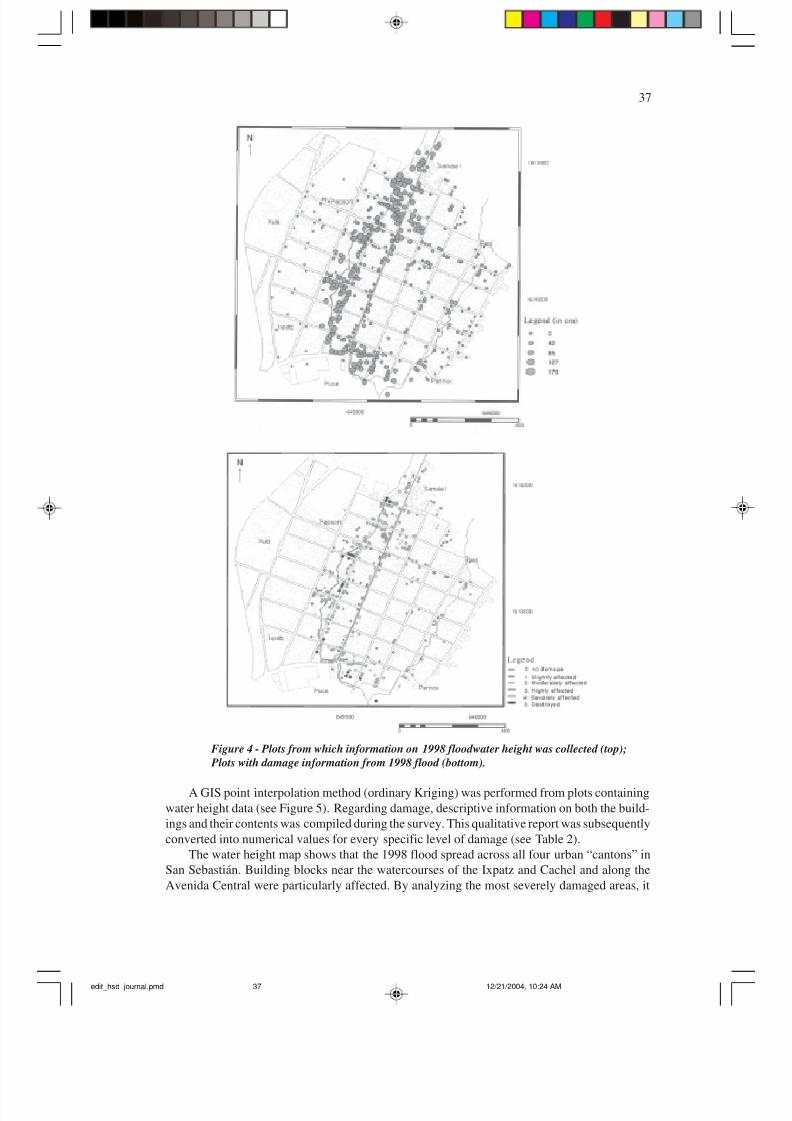
Figure 4 - Plots from which information on 1998 floodwater height was collected (top);
Plots with damage information from 1998 flood (bottom).
A GIS point interpolation method (ordinary Kriging) was performed from plots containing
water height data (see Figure 5). Regarding damage, descriptive information on both the build-
ings and their contents was compiled during the survey. This qualitative report was subsequently
converted into numerical values for every specific level of damage (see Table 2).
The water height map shows that the 1998 flood spread across all four urban “cantons” in
San Sebastián. Building blocks near the watercourses of the Ixpatz and Cachel and along the
Avenida Central were particularly affected. By analyzing the most severely damaged areas, it
edit_hsd_journal.pmd 12/21/2004, 10:24 AM37
8/3/2019 CB Flood Risk Assessment Using GIS
http://slidepdf.com/reader/full/cb-flood-risk-assessment-using-gis 10/21
38
was noticed that the water height reached 130 centimeters at some point during the flood (points
1 and 2 in Figure 5). In those zones, 6 houses were destroyed, 3 were severely damaged and 16
were highly damaged (see Table 2). Moreover, the water removed most of the bricks covering
the streets, which people later used to rebuild their houses or piled them up as temporary flood
protection. Severe damage was also caused to roads connecting San Sebastián with the National
Pacific Highway. At some points the asphalt surface was completely removed. Flood heightsalso exceeded 1 meter in four spots identified as bottlenecks along the Ixpatz River (points 3 to
6 in Figure 5). In most cases, bridges built above the street level behaved as source points for
overflowing at higher velocities resulting in 9 houses destroyed, 14 severely damaged and 48
highly damaged.
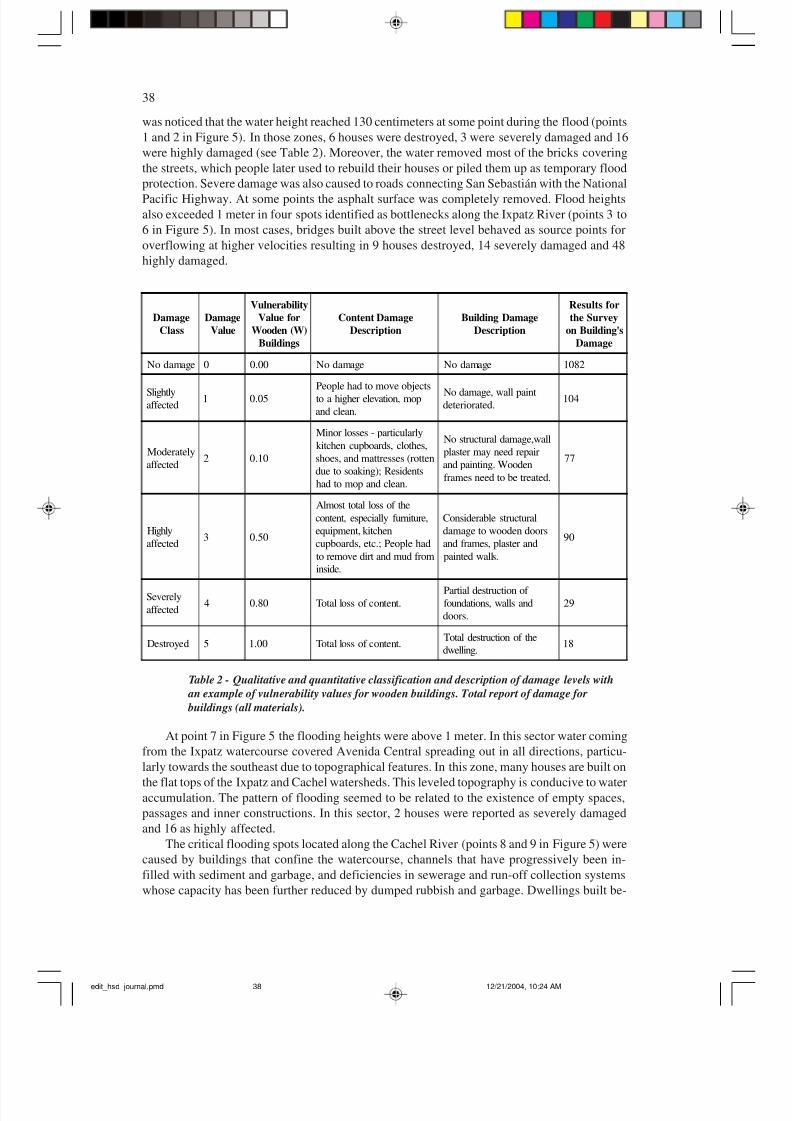
Table 2 - Qualitative and quantitative classification and description of damage levels with
an example of vulnerability values for wooden buildings. Total report of damage for
buildings (all materials).
At point 7 in Figure 5 the flooding heights were above 1 meter. In this sector water coming
from the Ixpatz watercourse covered Avenida Central spreading out in all directions, particu-
larly towards the southeast due to topographical features. In this zone, many houses are built on
the flat tops of the Ixpatz and Cachel watersheds. This leveled topography is conducive to wateraccumulation. The pattern of flooding seemed to be related to the existence of empty spaces,
passages and inner constructions. In this sector, 2 houses were reported as severely damaged
and 16 as highly affected.
The critical flooding spots located along the Cachel River (points 8 and 9 in Figure 5) were
caused by buildings that confine the watercourse, channels that have progressively been in-
filled with sediment and garbage, and deficiencies in sewerage and run-off collection systems
whose capacity has been further reduced by dumped rubbish and garbage. Dwellings built be-
Damage
Class
Damage
Value
Vulnerability
Value for
Wooden (W)
Buildings
Content Damage
Description
Building Damage
Description
Results for
the Survey
on Building's
Damage
No damage 0 0.00 No damage No damage 1082
Slightlyaffected
1 0.05
People had to move objects
to a higher elevation, mop
and clean.
No damage, wall paintdeteriorated.
104
Moderately
affected2 0.10
Minor losses - particularly
kitchen cupboards, clothes,
shoes, and mattresses (rotten
due to soaking); Residents
had to mop and clean.
No structural damage,wall
plaster may need repair
and painting. Wooden
frames need to be treated.
77
Highly
affected3 0.50
Almost total loss of the
content, especially furniture,
equipment, kitchen
cupboards, etc.; People had
to remove dirt and mud from
inside.
Considerable structural
damage to wooden doors
and frames, plaster and
painted walls.
90
Severely
affected4 0.80 Total loss of content.
Partial destruction of foundations, walls and
doors.
29
Destroyed 5 1.00 Total loss of content.Total destruction of the
dwelling.18
edit_hsd_journal.pmd 12/21/2004, 10:24 AM38
8/3/2019 CB Flood Risk Assessment Using GIS
http://slidepdf.com/reader/full/cb-flood-risk-assessment-using-gis 11/21
39
low the street level have a higher vulnerability, as small floods can also take place during normal
rainy seasons. Flooding for building blocks in the central part of the town ranged from 0 to 100
cm, with levels decreasing further away from streams. In this area, the damage that occurred
was mainly to building contents. Blocks located towards the eastern and western borders of the
urban district were not affected, as they are situated in a relatively higher terrain.
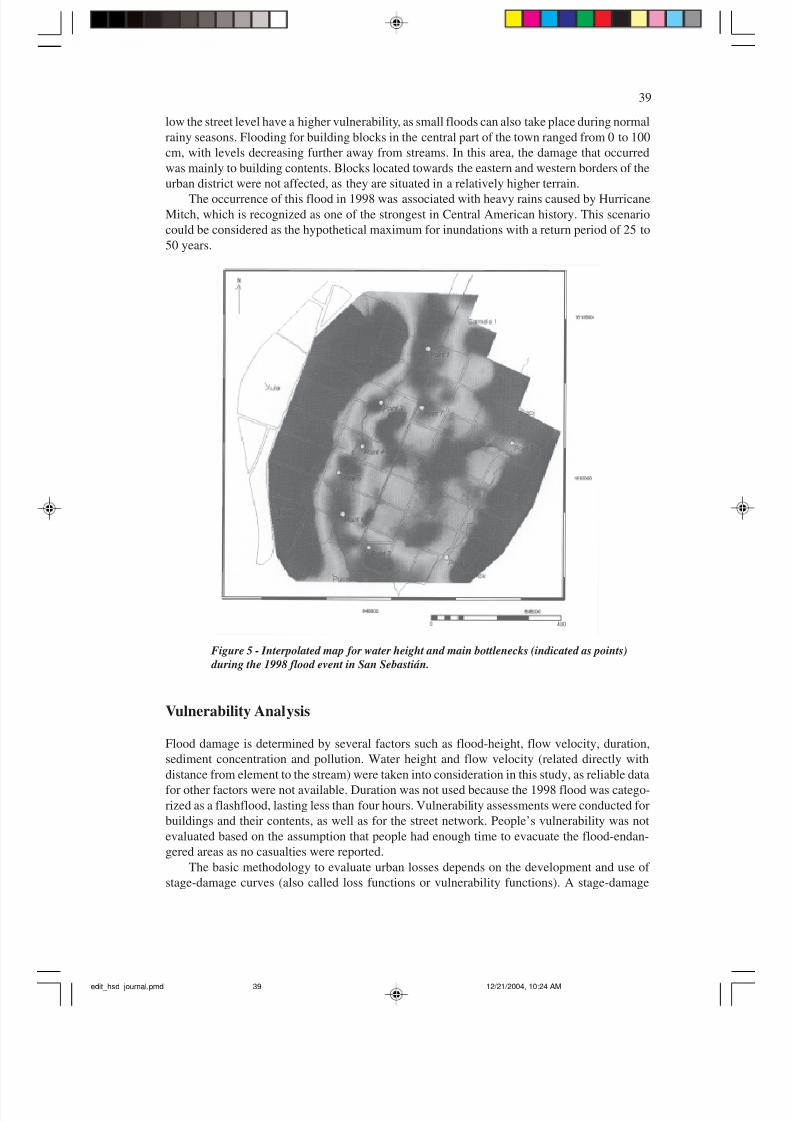
The occurrence of this flood in 1998 was associated with heavy rains caused by HurricaneMitch, which is recognized as one of the strongest in Central American history. This scenario
could be considered as the hypothetical maximum for inundations with a return period of 25 to
50 years.
Figure 5 - Interpolated map for water height and main bottlenecks (indicated as points)
during the 1998 flood event in San Sebastián.
Vulnerability Analysis
Flood damage is determined by several factors such as flood-height, flow velocity, duration,
sediment concentration and pollution. Water height and flow velocity (related directly with
distance from element to the stream) were taken into consideration in this study, as reliable data
for other factors were not available. Duration was not used because the 1998 flood was catego-
rized as a flashflood, lasting less than four hours. Vulnerability assessments were conducted for
buildings and their contents, as well as for the street network. People’s vulnerability was not
evaluated based on the assumption that people had enough time to evacuate the flood-endan-
gered areas as no casualties were reported.
The basic methodology to evaluate urban losses depends on the development and use of
stage-damage curves (also called loss functions or vulnerability functions). A stage-damage
edit_hsd_journal.pmd 12/21/2004, 10:24 AM39
8/3/2019 CB Flood Risk Assessment Using GIS
http://slidepdf.com/reader/full/cb-flood-risk-assessment-using-gis 12/21
40
curve is normally related to a specific class of building or crop and establishes the relationship
between flood damage and depth of flooding (or stage) (Smith, 1994). The damage function
estimates the damage as a value between 0 (no damage) to 1 (total destruction). The method
developed in this research uses a combination of the “Existing databases” and the “Valuation
Survey” approach (Penning-Rowsell and Chatterton, 1977). Estimations relied on databases
created for elements at risk within the urban area of San Sebastián and information about dam-age related to the 1998 flood. Several stage-damage functions specific for the area were devel-
oped and applied by means of GIS in order to replicate actual conditions of elements at risk.
Building Vulnerability
To determine the vulnerability to flooding for buildings, three factors were taken into account:
• Height of water column affecting each single plot. In this step, for each plot the height
above the street (measured during fieldwork) was subtracted from the floodwater’s
height, resulting in the precise amount of water inundating a given building. Due to
heavy rains (typical of tropical weather) many of the buildings in San Sebastián areprotected from frequent small floods by elevated thresholds in front of the doors.
• Position of plots in relation to streams. A distance map for the watercourses (Ixpatz,
Cachel and Avenida Central) was calculated in GIS. The average distance for each
cadastral plot was introduced in the database.
• Material. In this case, for houses reported as destroyed the material existing before the
flood was surveyed and used in the analysis.
Three building construction types were identified as prevailing in San Sebastián:
• Reinforced concrete and masonry (BC): consisting of concrete columns reinforced
with steel bars and in-fill walls made of clay bricks, all covered with plaster.
• Wood (W): frame made out of wooden poles with walls built out of overlapping hori
zontal boards, without foundations.• Mixture of concrete blocks and wood (CW): includes a small wall, often less than 70
cm high, built out of bricks, stones or concrete blocks and topped by overlapping
wooden boards.
A comparative analysis of these construction systems determined that wood and mixed
concrete-wood performed relatively similarly during flooding. However, the latter type (CW)
could have sustained considerably less damage with water levels lower than the base wall.
Significantly, only buildings of these two types were destroyed in 1998. Some reinforced con-
crete and masonry buildings (BC) were damaged but none were fully destroyed.
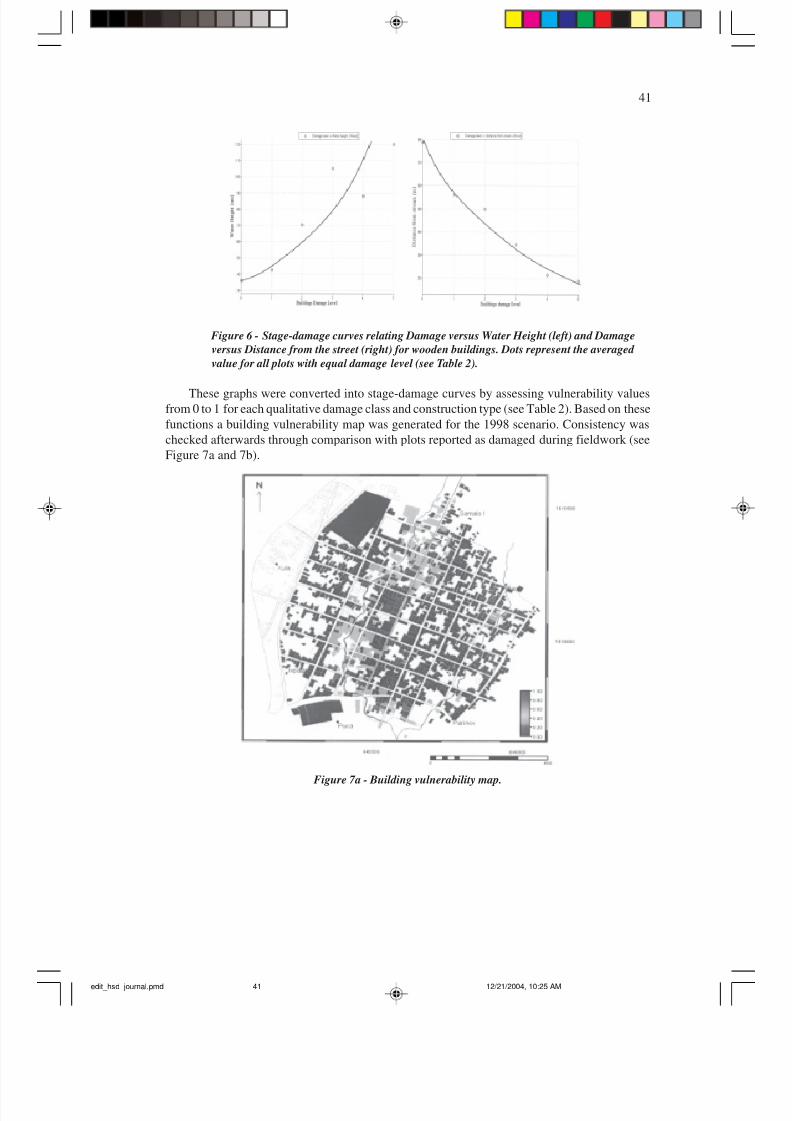
In order to establish relationships between damage and floodwater height, two graphs were
plotted for each construction type: damage level (assessed from the building damage report)
against averaged flood, and damage level against distance from the streams (see Figure 6).
edit_hsd_journal.pmd 12/21/2004, 10:24 AM40
8/3/2019 CB Flood Risk Assessment Using GIS
http://slidepdf.com/reader/full/cb-flood-risk-assessment-using-gis 13/21
41
Figure 6 - Stage-damage curves relating Damage versus Water Height (left) and Damage
versus Distance from the street (right) for wooden buildings. Dots represent the averaged
value for all plots with equal damage level (see Table 2).
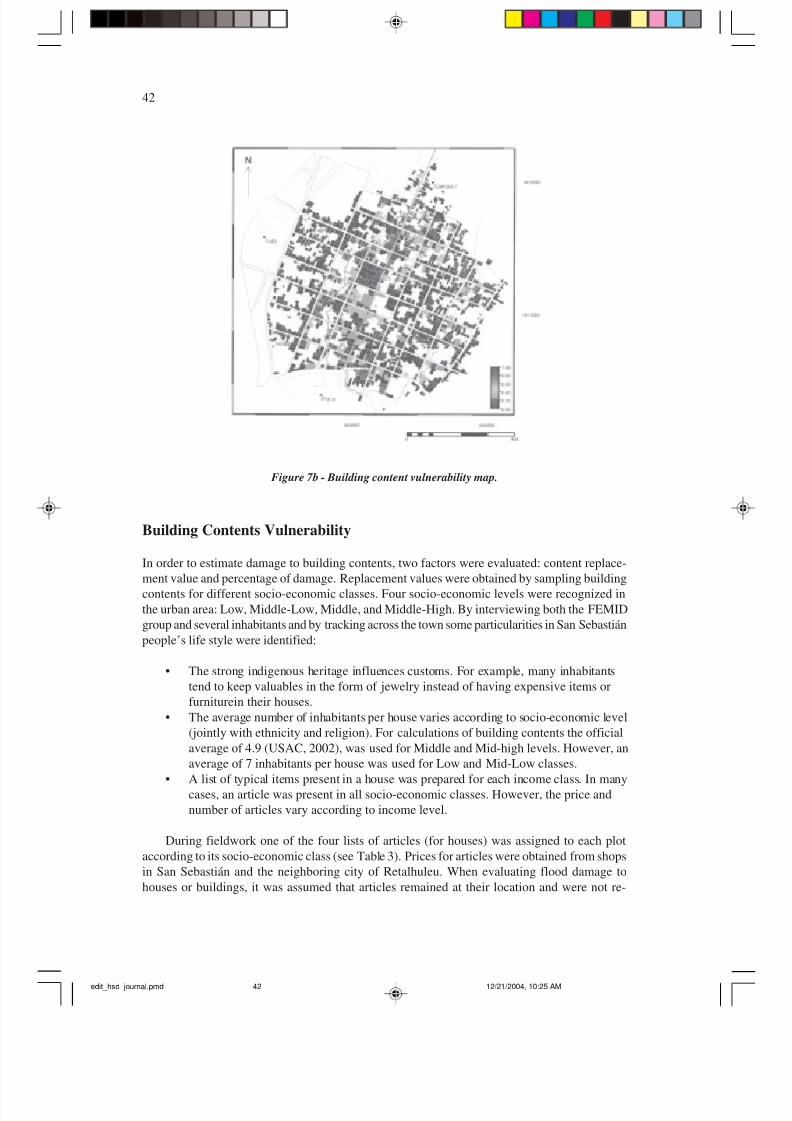
These graphs were converted into stage-damage curves by assessing vulnerability valuesfrom 0 to 1 for each qualitative damage class and construction type (see Table 2). Based on these
functions a building vulnerability map was generated for the 1998 scenario. Consistency was
checked afterwards through comparison with plots reported as damaged during fieldwork (see
Figure 7a and 7b).
Figure 7a - Building vulnerability map.
edit_hsd_journal.pmd 12/21/2004, 10:25 AM41
8/3/2019 CB Flood Risk Assessment Using GIS
http://slidepdf.com/reader/full/cb-flood-risk-assessment-using-gis 14/21
42
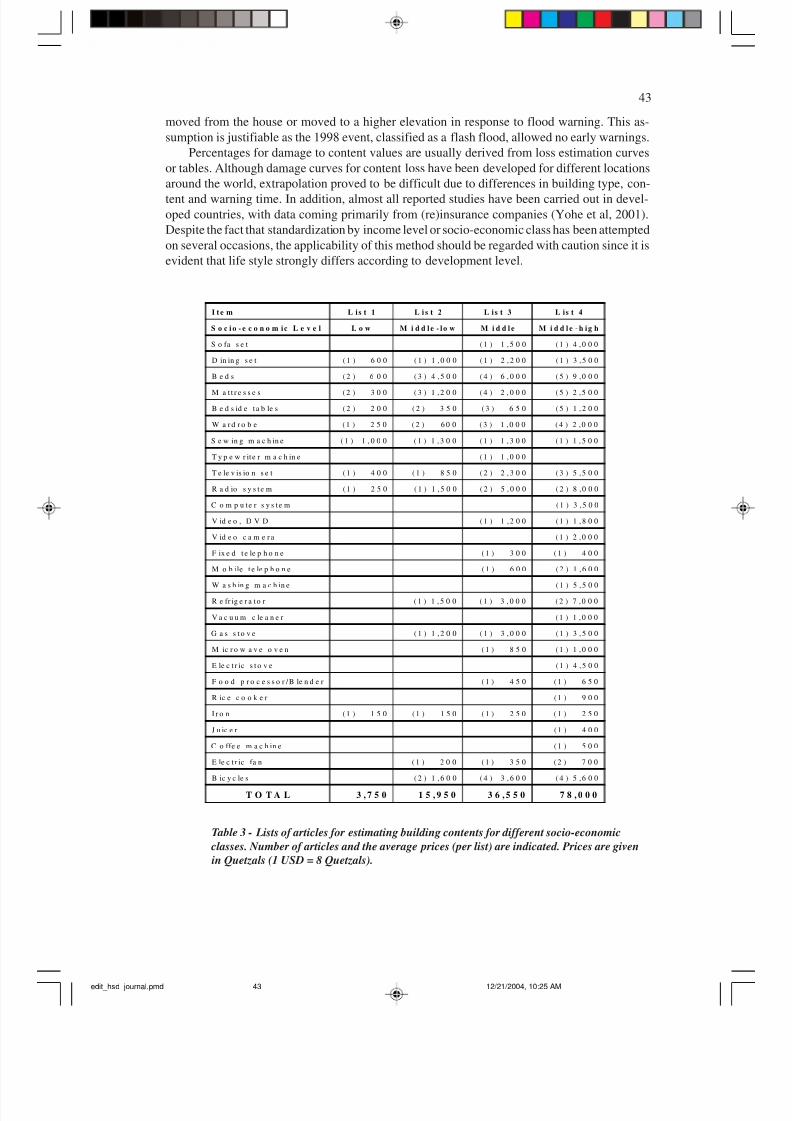
Figure 7b - Building content vulnerability map.
Building Contents Vulnerability
In order to estimate damage to building contents, two factors were evaluated: content replace-
ment value and percentage of damage. Replacement values were obtained by sampling building
contents for different socio-economic classes. Four socio-economic levels were recognized in
the urban area: Low, Middle-Low, Middle, and Middle-High. By interviewing both the FEMID
group and several inhabitants and by tracking across the town some particularities in San Sebastián
people’s life style were identified:
• The strong indigenous heritage influences customs. For example, many inhabitants
tend to keep valuables in the form of jewelry instead of having expensive items or
furniturein their houses.
• The average number of inhabitants per house varies according to socio-economic level
(jointly with ethnicity and religion). For calculations of building contents the official
average of 4.9 (USAC, 2002), was used for Middle and Mid-high levels. However, an
average of 7 inhabitants per house was used for Low and Mid-Low classes.
• A list of typical items present in a house was prepared for each income class. In manycases, an article was present in all socio-economic classes. However, the price and
number of articles vary according to income level.
During fieldwork one of the four lists of articles (for houses) was assigned to each plot
according to its socio-economic class (see Table 3). Prices for articles were obtained from shops
in San Sebastián and the neighboring city of Retalhuleu. When evaluating flood damage to
houses or buildings, it was assumed that articles remained at their location and were not re-
edit_hsd_journal.pmd 12/21/2004, 10:25 AM42
8/3/2019 CB Flood Risk Assessment Using GIS
http://slidepdf.com/reader/full/cb-flood-risk-assessment-using-gis 15/21
43
moved from the house or moved to a higher elevation in response to flood warning. This as-
sumption is justifiable as the 1998 event, classified as a flash flood, allowed no early warnings.
Percentages for damage to content values are usually derived from loss estimation curves
or tables. Although damage curves for content loss have been developed for different locations
around the world, extrapolation proved to be difficult due to differences in building type, con-
tent and warning time. In addition, almost all reported studies have been carried out in devel-oped countries, with data coming primarily from (re)insurance companies (Yohe et al, 2001).
Despite the fact that standardization by income level or socio-economic class has been attempted
on several occasions, the applicability of this method should be regarded with caution since it is
evident that life style strongly differs according to development level.
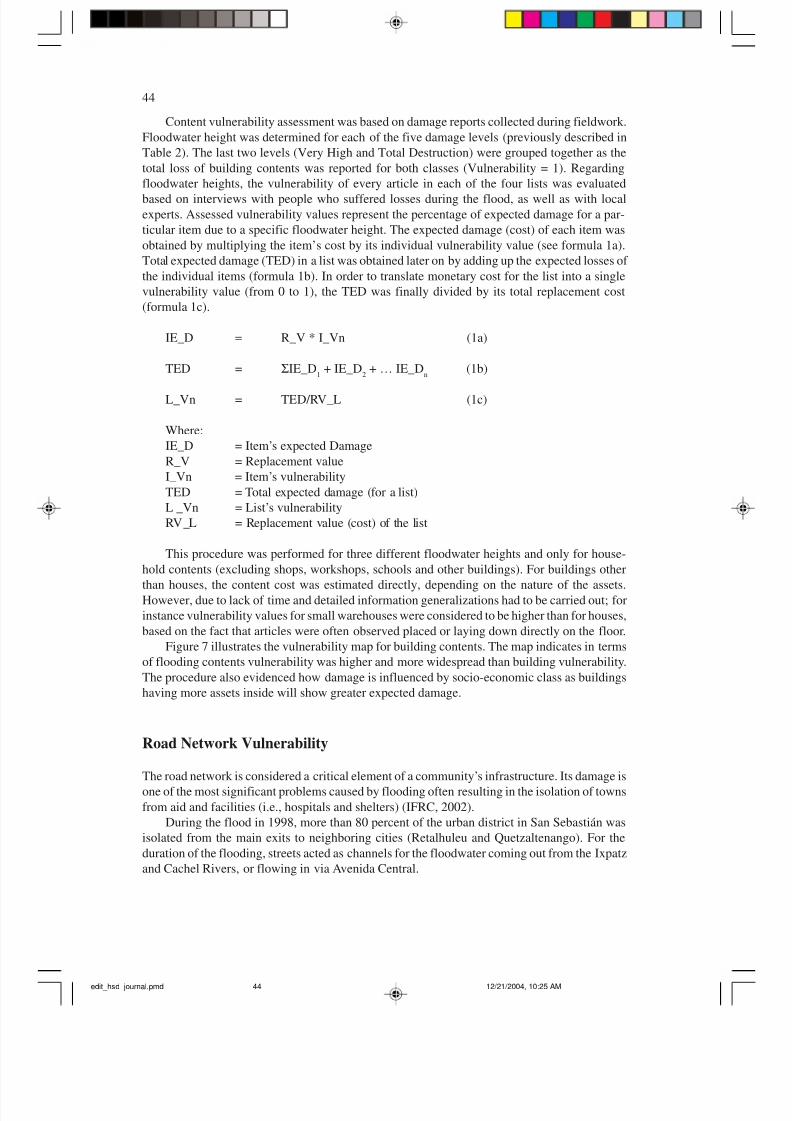
Table 3 - Lists of articles for estimating building contents for different socio-economic
classes. Number of articles and the average prices (per list) are indicated. Prices are given
in Quetzals (1 USD = 8 Quetzals).
I t e m L is t 1 L i s t 2 L is t 3 L is t 4
S o c i o - e c o n o m ic L e v e l L o w M i d d l e - lo w M i d d l e M i d d l e - h ig h
S o fa s e t ( 1 ) 1 , 5 0 0 ( 1 ) 4 , 0 0 0
D in in g s e t ( 1 ) 6 0 0 ( 1 ) 1 , 0 0 0 ( 1 ) 2 , 2 0 0 ( 1 ) 3 , 5 0 0
B e d s ( 2 ) 6 0 0 ( 3 ) 4 , 5 0 0 ( 4 ) 6 , 0 0 0 ( 5 ) 9 ,0 0 0
M a t t r e s s e s ( 2 ) 3 0 0 ( 3 ) 1 , 2 0 0 ( 4 ) 2 , 0 0 0 ( 5 ) 2 ,5 0 0
B e d s id e ta b le s ( 2 ) 2 0 0 ( 2 ) 3 5 0 ( 3 ) 6 5 0 ( 5 ) 1 , 2 0 0
W a r d r o b e ( 1 ) 2 5 0 ( 2 ) 6 0 0 ( 3 ) 1 , 0 0 0 ( 4 ) 2 ,0 0 0
S e w in g m a c h in e ( 1 ) 1 , 0 0 0 ( 1 ) 1 , 3 0 0 ( 1 ) 1 , 3 0 0 ( 1 ) 1 , 5 0 0
T y p e w r ite r m a c h in e ( 1 ) 1 , 0 0 0
T e le v is io n s e t ( 1 ) 4 0 0 ( 1 ) 8 5 0 ( 2 ) 2 , 3 0 0 ( 3 ) 5 ,5 0 0
R a d io s y s t e m ( 1 ) 2 5 0 ( 1 ) 1 , 5 0 0 ( 2 ) 5 , 0 0 0 ( 2 ) 8 ,0 0 0
C o m p u te r s y s te m ( 1 ) 3 , 5 0 0
V id e o , D V D ( 1 ) 1 , 2 0 0 ( 1 ) 1 , 8 0 0
V id e o c a m e r a ( 1 ) 2 , 0 0 0
F ix e d t e le p h o n e ( 1 ) 3 0 0 ( 1 ) 4 0 0
M o b ile t e le p h o n e ( 1 ) 6 0 0 ( 2 ) 1 , 6 0 0
W a s h in g m a c h in e ( 1 ) 5 , 5 0 0
R e fr ig e r a to r ( 1 ) 1 , 5 0 0 ( 1 ) 3 , 0 0 0 ( 2 ) 7 ,0 0 0
V a c u u m c le a n e r ( 1 ) 1 , 0 0 0
G a s s t o v e ( 1 ) 1 , 2 0 0 ( 1 ) 3 , 0 0 0 ( 1 ) 3 , 5 0 0
M ic r o w a v e o v e n ( 1 ) 8 5 0 ( 1 ) 1 , 0 0 0
E le c t r ic s t o v e ( 1 ) 4 , 5 0 0
F o o d p r o c e s s o r /B le n d e r ( 1 ) 4 5 0 ( 1 ) 6 5 0
R ic e c o o k e r ( 1 ) 9 0 0
I r o n ( 1 ) 1 5 0 ( 1 ) 1 5 0 ( 1 ) 2 5 0 ( 1 ) 2 5 0
J u ic e r ( 1 ) 4 0 0
C o ffe e m a c h in e ( 1 ) 5 0 0
E le c t r ic fa n ( 1 ) 2 0 0 ( 1 ) 3 5 0 ( 2 ) 7 0 0
B ic y c le s ( 2 ) 1 , 6 0 0 ( 4 ) 3 , 6 0 0 ( 4 ) 5 ,6 0 0
T O T A L 3 , 7 5 0 1 5 , 9 5 0 3 6 , 5 5 0 7 8 , 0 0 0
edit_hsd_journal.pmd 12/21/2004, 10:25 AM43
8/3/2019 CB Flood Risk Assessment Using GIS
http://slidepdf.com/reader/full/cb-flood-risk-assessment-using-gis 16/21
44
Content vulnerability assessment was based on damage reports collected during fieldwork.
Floodwater height was determined for each of the five damage levels (previously described in
Table 2). The last two levels (Very High and Total Destruction) were grouped together as the
total loss of building contents was reported for both classes (Vulnerability = 1). Regarding
floodwater heights, the vulnerability of every article in each of the four lists was evaluated
based on interviews with people who suffered losses during the flood, as well as with localexperts. Assessed vulnerability values represent the percentage of expected damage for a par-
ticular item due to a specific floodwater height. The expected damage (cost) of each item was
obtained by multiplying the item’s cost by its individual vulnerability value (see formula 1a).
Total expected damage (TED) in a list was obtained later on by adding up the expected losses of
the individual items (formula 1b). In order to translate monetary cost for the list into a single
vulnerability value (from 0 to 1), the TED was finally divided by its total replacement cost
(formula 1c).
IE_D = R_V * I_Vn (1a)
TED = ΣIE_D1
+ IE_D2
+ … IE_Dn
(1b)
L_Vn = TED/RV_L (1c)
Where:
IE_D = Item’s expected Damage
R_V = Replacement value
I_Vn = Item’s vulnerability
TED = Total expected damage (for a list)
L _Vn = List’s vulnerability
RV_L = Replacement value (cost) of the list
This procedure was performed for three different floodwater heights and only for house-
hold contents (excluding shops, workshops, schools and other buildings). For buildings other
than houses, the content cost was estimated directly, depending on the nature of the assets.However, due to lack of time and detailed information generalizations had to be carried out; for
instance vulnerability values for small warehouses were considered to be higher than for houses,
based on the fact that articles were often observed placed or laying down directly on the floor.
Figure 7 illustrates the vulnerability map for building contents. The map indicates in terms
of flooding contents vulnerability was higher and more widespread than building vulnerability.
The procedure also evidenced how damage is influenced by socio-economic class as buildings
having more assets inside will show greater expected damage.
Road Network Vulnerability
The road network is considered a critical element of a community’s infrastructure. Its damage is
one of the most significant problems caused by flooding often resulting in the isolation of towns
from aid and facilities (i.e., hospitals and shelters) (IFRC, 2002).
During the flood in 1998, more than 80 percent of the urban district in San Sebastián was
isolated from the main exits to neighboring cities (Retalhuleu and Quetzaltenango). For the
duration of the flooding, streets acted as channels for the floodwater coming out from the Ixpatz
and Cachel Rivers, or flowing in via Avenida Central.
edit_hsd_journal.pmd 12/21/2004, 10:25 AM44
8/3/2019 CB Flood Risk Assessment Using GIS
http://slidepdf.com/reader/full/cb-flood-risk-assessment-using-gis 17/21
45
Damage to the road or street network basically depends on the material and quality of the
road surface in relation to the height and velocity of the floodwater. In order to evaluate the
vulnerability of the urban area’s road networks, four main types of surface material were differ-
entiated:
• Asphalt (AS): Main roads and highway.• Concrete (C): Avenida Central and recently paved streets.
• Concrete bricks (CB): Secondary streets. This seemed to be the most common mate-
rial.
• Earth (E): Rural or recently delineated streets.
For the assessment of vulnerability, values for road loss functions were not used because
data on this topic was not found in the literature. Instead, the analysis relied directly on informa-
tion collected from interviews and observations during fieldwork. For instance, given that the
asphalted connections from San Sebastián to the CA2 Highway were destroyed by the flood, a
vulnerability value of 1 was given to the minimum floodwater height reported for this road (60
cm). For asphalt roads, rainwater run-off heights from 15 to 20 cm were considered normal
during the rainy season; therefore, these surfaces are able to deal with these flood heights with-
out experiencing damage. Twenty (20) cm was assigned as the threshold for undergoing damage
(vulnerability = 0) accordingly. Vulnerability values for other road materials were determined in
the same way.
Risk Estimation
Since the flood scenario for 1998 lacked a well-defined return period, it was not possible to
estimate the total flood risk in terms of probability of occurrence. Instead, calculations for ex-
pected losses to buildings, building contents and roads due to a similar flooding event (similar to
that in 1998) were performed.
A database including information related to the commercial value of the plots and a link to
the lists of contents for the buildings was constructed during fieldwork, based on the input of
local FEMID group members. Building features such as type, land use, state of conservation-
maintenance, age, construction system, size and number of floors were taken into consideration
for this valuation. For the valuation of the lists for building contents, refer to Table 2. For the
roads valuation, a list of prices per square meter for each material type was obtained from local
experts in Guatemala.
The next step following the determination and valuation of the elements at risk was to
generate the Expected Damage map using GIS tools. The steps included:
• For buildings: building vulnerability (see Figure 7) was multiplied by the market value
of each parcel;
• For contents: building contents vulnerability (see Figure 7) was multiplied by an
attribute map displaying the building contents’ costs. This map was obtained byclassifying all houses according to socio-economic class. Non-residential buildings
were classified according to land use type. This map was later reclassified by linking
the costs of the list according to the socio-economic class. In mixed-use cases (e.g.,
housing and commercial), the values of both lists, residential and non-residential, were
combined;
• For roads: area covered by each type of surface was multiplied by its respective price
per square meter, and then multiplied by the flood vulnerability value.
edit_hsd_journal.pmd 12/21/2004, 10:25 AM45

8/3/2019 CB Flood Risk Assessment Using GIS
http://slidepdf.com/reader/full/cb-flood-risk-assessment-using-gis 18/21
46
Finally, a total loss value was calculated by adding up the damage for buildings and their
contents and displaying the expected losses for roads in the areas surrounding the plots (see
Figure 8).
Figure 8 - Map of Total Expected Damage for elements at risk (combined building and
content loss). Prices are given in Quetzals (1 USD = approx. 8 Quetzals at the time of this
research - October 2002).
Discussion and Conclusions
The generation of flood risk maps in areas with very limited data is filled with a considerable
number of restrictions and distinct disadvantages. Ideally, one would use hydrological model-
ing to estimate peak discharges for different return periods. This would be complemented by
hydraulic modeling using profile information to estimate the associated flood heights and flow
velocities. In the absence of detailed rainfall, discharge and altitude information, the use of these
models is too uncertain, especially if flooding takes places in an urban area, and is caused byseveral small rivers, as was the case in San Sebastián.
To overcome flood-related data scarcity in this study case, researchers decided to combine
several methods for data acquisition such as photo- interpretation, digitizing in GIS, and collec-
tion of historic flood information through an extensive field campaign consisting of interviews
with the aid of local experts. This last activity turned out to be relatively successful in San
edit_hsd_journal.pmd 12/21/2004, 10:25 AM46
8/3/2019 CB Flood Risk Assessment Using GIS
http://slidepdf.com/reader/full/cb-flood-risk-assessment-using-gis 19/21
47
Sebastián, where a local emergency committee group (FEMID) had been established earlier
with the aid of the national Committee for Disaster Reduction (CONRED).
Reliable data on maximum flood heights and flood damage was collected for a large num-
ber of points within the urban area. However, it was not viable to collect data for several flood
events, due to limitations on the collective memory of the community. It was only possible to
collect information on the last major event that took place (i.e. hurricane Mitch in 1998). Al-though some inhabitants also indicated that similar flood events had occurred during the 1950’s
and the 1970’s, it was not possible to obtain sufficiently reliable information in order to recon-
struct those flood events. In general, one can conclude that the use of this method is more
reliable if carried out relatively soon after a major event has happened. This is a serious limita-
tion to the application of the method for disaster prevention in areas with infrequent high mag-
nitude events.
In this study, a method was used to overcome data scarcity by attempting to reconstruct a
past event based on community knowledge. However, for those environments in which data is
available to conduct hydrological modeling, both methods can be implemented together. The
scenario depicted through reconstruction is a useful complement since is based on facts, and
constitutes a valuable means for calibrating and verifying the results of modeling.
Another aspect to consider when applying this method is that collection of data on maxi-
mum flood heights and flood damage is more reliable if it is gathered through interviews with
people that were directly affected. Nevertheless, measures were taken during data collection to
corroborate the information given by affected inhabitants with that given by neighbors and with
remaining flood marks, in order to avoid exaggeration in values for flood heights and damage.
Stage-damage curves according to the local conditions were also developed using the informa-
tion collected through interviews. The curves obtained show the same trend as those found in
literature.
Data collection on past flood events was combined with the data collected on elements at
risk. The participation of the local FEMID group also proved crucial for gathering information
on buildings and its contents. This approach highlighted the importance of understanding the
local context as it was found that, apart from the socio-economical level, factors like ethnicity
and cultural background strongly influence the life style, and therefore the building contents.
In this study, information on social vulnerability was also collected, including aspects suchas ethnicity, religious background, gender, age distribution, as well as people’s capacity and
ways of coping with flood events (e.g., having a small farm in the countryside, existence of
family or other relations on which they could rely in case of evacuation, and attitudes towards
disasters which was often religiously determined).
The results of the data collection campaign were linked to a database that can also be used
for cadastral purposes. In many small urban areas in developing countries, municipal authorities
still lack a basic system for cadastral mapping. Using a basic GIS, disaster prevention informa-
tion can be combined with cadastral information to allow municipal authorities to increase tax
collection, thereby reinforcing the justification for investment in the spatial database. Thus, this
type of multi-functional spatial database can be used, not only for establishing the cost-benefit
implications of possible risk reduction measures, but also for a number of other municipal spa-
tial planning activities in the field of waste disposal, health, education, etc. Therefore, the method
presented can potentially be used as a multipurpose tool enabling municipal authorities to col-lect relevant information at a low cost that can be applied to make effective management deci-
sions.
edit_hsd_journal.pmd 12/21/2004, 10:25 AM47
8/3/2019 CB Flood Risk Assessment Using GIS
http://slidepdf.com/reader/full/cb-flood-risk-assessment-using-gis 20/21
48
Acknowledgements
The authors would like to thank Estuardo Lira and Manolo Barillas of the USGS office in
Guatemala for their support in obtaining the basic data. We thank Arc. Eugenia García of
CONRED (Comisión Nacional para la Reducción de Desastres) for her assistance during the
data collection campaign, as well as Irna, Claudia, Doña Pilar, Johanna and Don Julio of the
FEMID project (Fortalecimiento de Estructuras Locales en Mitigación de Riesgos) in San
Sebastián.
This research was carried out as part of a research project of the International Institute for
Geo-Information Sciences and Earth Observation (ITC), entitled “Strengthening Local Authori-
ties in Risk Management”. We also would like to thank UNESCO for its support within the
UNESCO-CBNDR project.
References
AGSO, 2001. Natural hazards and risk they pose to South East Queensland. Geoscience Austra-
lia in conjunction with the Bureau of Meteorology. (http://www.agso.gov.au/urban/
factsheets/risk_modelling.jsp).
Al-Sabhan, W., M. Mulligan, and G.A. Blackburn, 2003. "A Real-time Hydrological Model for
Flood Prediction Using GIS and the WWW." Computers, Environment and Urban Sys-
tems 27:9-32.
Coburn, A.W., Spence R.J.S. and Pomonis, A. (1994). Vulnerability and risk assessment. United
Nations Development Programme. Disaster Management Training Programme. 69 p.
(http://www.undmtp.org/modules_e.htm).
FEMA, 2003. Flood Hazard Mapping. Online tutorials. (http://www.fema.gov/fhm/
ot_main.shtm).
FEMID, 2000. Proyecto para el fortalecimiento de estructuras en la mitigación de desastres.
(http://disaster-info.net/cepredenac/femid/web/paginas/femid.html).
Green, B.D., and Rose, W.I., 2003. Volcanic Risk Map for Santa María, Guatemala.(http://www.geo.mtu.edu/volcanoes/santamaria/volcrisk/).
IFRC, 2002. Toolbox for Vulnerability and Capacity Assessment Disaster Preparedness. Interna-
tional Federation of Red Cross and Red Crescent Societies. Geneva, Switzerland. (http:/
/www.ifrc.org/what/disasters/dp/planning/vca/guidelines.asp).
Munich Reinsurance, 2002. Topics: Annual review: Natural catastrophes 2002. Munich
Reinsurance. 52 p. (http://www.munichre.com).
Pelling, M. 2003.The Vulnerability of Cities. Natural Disasters and Social Resilience. Earthscan
Publications Ltd. London, UK. p. 184.
Penning-Rowsell, E. & Chatterton, J., 1977. The Benefits of Flood Alleviation: A Manual of
assessment techniques. England: Saxon House.
Rose, W.I., 1987. Volcanic Activity at Santiaguito Volcano, 1976-1984: Geological Society of
America Special Paper 2121, p. 17-27.
Smith, D. I., 1994. Flood Damage Estimation - A review of urban stage-damage curves and lossfunctions. Water SA, 20(3), 231–238.
UNDRO, 1991. Mitigating Natural Disasters: Phenomena, Effects and Options. United Nations
Disaster Relief Coordinator, United Nations: New York. 164 pp.
USAC, 2002. Diagnostico participativo año 2002. Municipalidad de la Villa de San Sebastián
Retalhuleu August 2002. Universidad San Carlos. Centro Universitario de Oriente
División de Ciencias Económicas.
USGS, 2002. United States Geological Survey. Landslides triggered by Hurricane Mitch in
edit_hsd_journal.pmd 12/21/2004, 10:25 AM48

8/3/2019 CB Flood Risk Assessment Using GIS
http://slidepdf.com/reader/full/cb-flood-risk-assessment-using-gis 21/21
49
Guatemala. Inventory and Discussion. Open-File Report 01-443. USGS Hurricane Mitch
Relief Program. (http://mitchnts1.cr.usgs.gov/response.html).
Venzke, E., Wunderman R.W., McClelland, L., Simkin, T., Luhr, J.F., Siebert, L., and Mayberry,
G. (eds.), 2003. Global volcanism, 1968 to the Present. Smithsonian Institution, Global
Volcanism Program Digital Information Series, GVP-4 (http://www.volcano.si.edu/gvp/
reports/).Westen, van C.J., Montoya, L., L. Boerboom and Badilla Coto, E., 2002. Multi-hazard risk
assessment using GIS in urban areas. A case study for the city of Turrialba, Costa Rica
In: Proceedings Regional Workshop on Best Practices in Disaster Mitigation: Lessons
Learned from the Asian Urban Disaster Mitigation Program and other initiatives. Asian
Disaster Preparedness Center, 24 – 26 September, 2002, Bali, Indonesia. pp 120-136.
Yohe, G., Tol, R. Sj. & Thompson, D., 2001. Indicators for social and economic coping capacity
– moving toward a working definition of adaptive capacity. Department of Economics,
Wesleyan University, Middletown.