c.b. worth - "money in motion"
TRANSCRIPT

7/28/2019 C.B. Worth - "Money in Motion"
http://slidepdf.com/reader/full/cb-worth-money-in-motion 1/24
Oppenheimer Asset Management Inc. 200 Park Avenue New York, NY 10166 Tel: 800-221-5588 Fax: 212-667-4959
“MONEY IN MOTION” TECHNICAL ANALYSIS & RESEARCH A division of Oppenheimer Asset Management Inc.
Carter Braxton Worth
Chief Market Technician
(212) 667-4324
June 24, 2013
C.B. Worth – “Money In Motion”
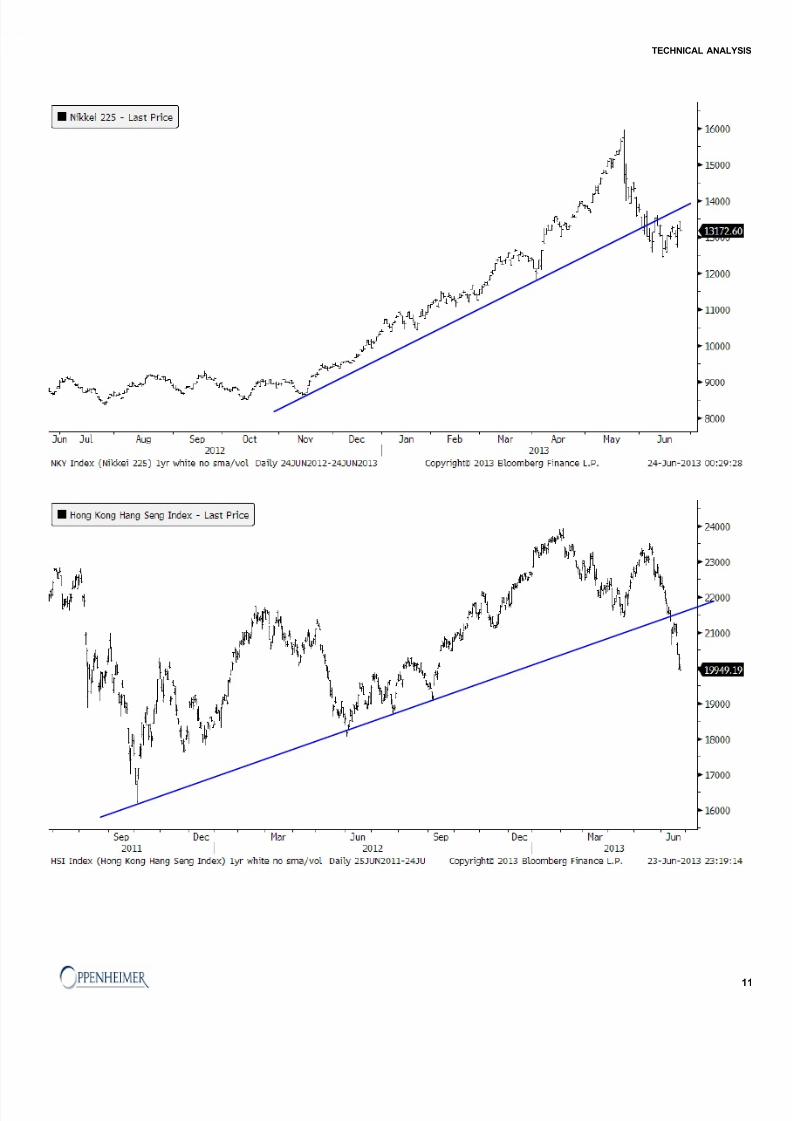
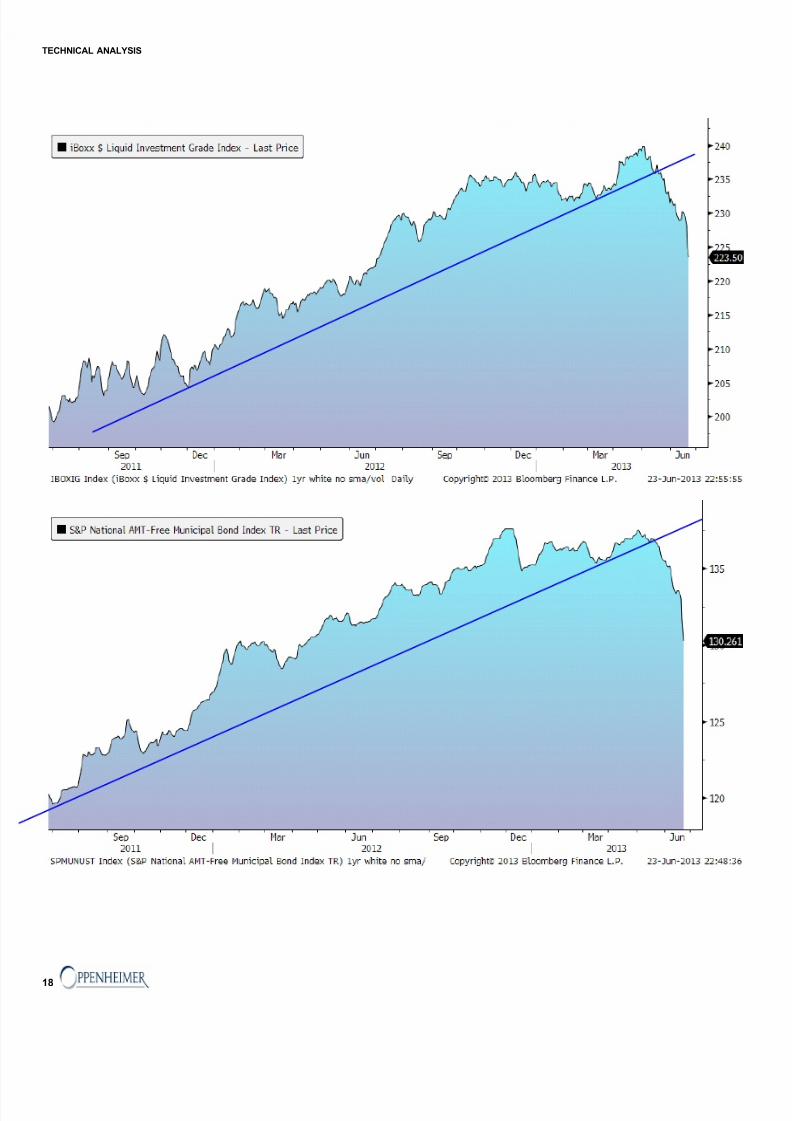
We have no new thoughts.
Sell.
The charts on the pages that follow speak for themselves.
Of course, we believe the charts have been speaking for themselves for quite some time—as all will know.Our position is clear.
At some point there is no point … in saying anything more.
To that end, last week, we wrote nothing.Literally.
There was no "Mon ey in Motion" (first time in years).
Today's piece, again by saying nothing, speaks for itself, speaks for its author.

7/28/2019 C.B. Worth - "Money in Motion"
http://slidepdf.com/reader/full/cb-worth-money-in-motion 2/24
2
TECHNICAL ANALYSIS

7/28/2019 C.B. Worth - "Money in Motion"
http://slidepdf.com/reader/full/cb-worth-money-in-motion 3/24
3
TECHNICAL ANALYSIS

7/28/2019 C.B. Worth - "Money in Motion"
http://slidepdf.com/reader/full/cb-worth-money-in-motion 4/24
4
TECHNICAL ANALYSIS

7/28/2019 C.B. Worth - "Money in Motion"
http://slidepdf.com/reader/full/cb-worth-money-in-motion 5/24

7/28/2019 C.B. Worth - "Money in Motion"
http://slidepdf.com/reader/full/cb-worth-money-in-motion 6/24
6
TECHNICAL ANALYSIS

7/28/2019 C.B. Worth - "Money in Motion"
http://slidepdf.com/reader/full/cb-worth-money-in-motion 7/24
7
Lumber
Brent Crude Oil
TECHNICAL ANALYSIS

7/28/2019 C.B. Worth - "Money in Motion"
http://slidepdf.com/reader/full/cb-worth-money-in-motion 8/24
8
TECHNICAL ANALYSIS

7/28/2019 C.B. Worth - "Money in Motion"
http://slidepdf.com/reader/full/cb-worth-money-in-motion 9/24
9
TECHNICAL ANALYSIS

7/28/2019 C.B. Worth - "Money in Motion"
http://slidepdf.com/reader/full/cb-worth-money-in-motion 10/24
10
TECHNICAL ANALYSIS
7/28/2019 C.B. Worth - "Money in Motion"
http://slidepdf.com/reader/full/cb-worth-money-in-motion 11/24
11
TECHNICAL ANALYSIS

7/28/2019 C.B. Worth - "Money in Motion"
http://slidepdf.com/reader/full/cb-worth-money-in-motion 12/24

7/28/2019 C.B. Worth - "Money in Motion"
http://slidepdf.com/reader/full/cb-worth-money-in-motion 13/24
13
TECHNICAL ANALYSIS

7/28/2019 C.B. Worth - "Money in Motion"
http://slidepdf.com/reader/full/cb-worth-money-in-motion 14/24
14
TECHNICAL ANALYSIS

7/28/2019 C.B. Worth - "Money in Motion"
http://slidepdf.com/reader/full/cb-worth-money-in-motion 15/24
15
TECHNICAL ANALYSIS

7/28/2019 C.B. Worth - "Money in Motion"
http://slidepdf.com/reader/full/cb-worth-money-in-motion 16/24
16
TECHNICAL ANALYSIS

7/28/2019 C.B. Worth - "Money in Motion"
http://slidepdf.com/reader/full/cb-worth-money-in-motion 17/24
17
TECHNICAL ANALYSIS
7/28/2019 C.B. Worth - "Money in Motion"
http://slidepdf.com/reader/full/cb-worth-money-in-motion 18/24
18
TECHNICAL ANALYSIS

7/28/2019 C.B. Worth - "Money in Motion"
http://slidepdf.com/reader/full/cb-worth-money-in-motion 19/24
19
TECHNICAL ANALYSIS

7/28/2019 C.B. Worth - "Money in Motion"
http://slidepdf.com/reader/full/cb-worth-money-in-motion 20/24
20
Trade well,
-Carter
TECHNICAL ANALYSIS
7/28/2019 C.B. Worth - "Money in Motion"
http://slidepdf.com/reader/full/cb-worth-money-in-motion 21/24
21
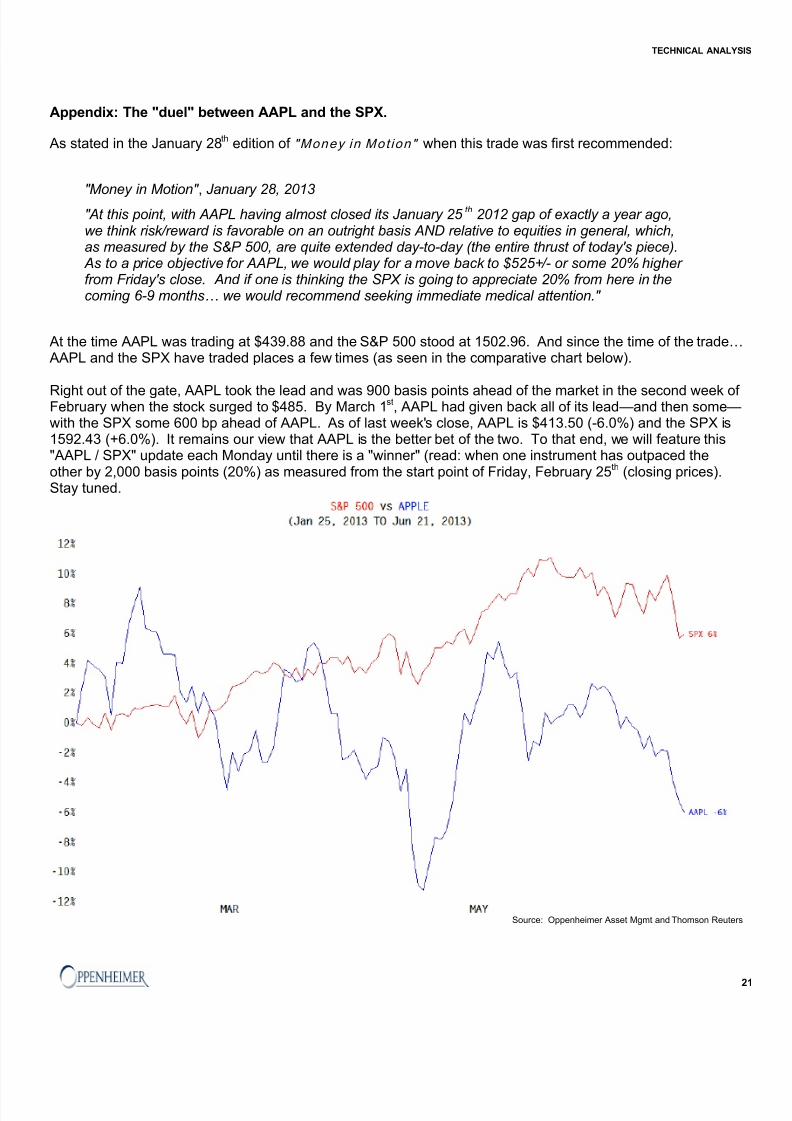
Appendix: The "duel" between AAPL and the SPX.
As stated in the January 28th edition of "Money in Mot ion" when this trade was first recommended:
"Money in Motion" , January 28, 2013 "At this point, with AAPL having almost closed its January 25 th 2012 gap of exactly a year ago,we think risk/reward is favorable on an outright basis AND relative to equities in general, which,as measured by the S&P 500, are quite extended day-to-day (the entire thrust of today's piece).
As to a price objective for AAPL, we would play for a move back to $525+/- or some 20% higher from Friday's close. And if one is thinking the SPX is going to appreciate 20% from here in thecoming 6-9 months… we would recommend seeking immediate medical attention."
At the time AAPL was trading at $439.88 and the S&P 500 stood at 1502.96. And since the time of the trade… AAPL and the SPX have traded places a few times (as seen in the comparative chart below).
Right out of the gate, AAPL took the lead and was 900 basis points ahead of the market in the second week of February when the stock surged to $485. By March 1st, AAPL had given back all of its lead—and then some—with the SPX some 600 bp ahead of AAPL. As of last week's close, AAPL is $413.50 (-6.0%) and the SPX is1592.43 (+6.0%). It remains our view that AAPL is the better bet of the two. To that end, we will feature this"AAPL / SPX" update each Monday until there is a "winner" (read: when one instrument has outpaced theother by 2,000 basis points (20%) as measured from the start point of Friday, February 25th (closing prices).Stay tuned.
Source: Oppenheimer Asset Mgmt and Thomson Reuters
TECHNICAL ANALYSIS

7/28/2019 C.B. Worth - "Money in Motion"
http://slidepdf.com/reader/full/cb-worth-money-in-motion 22/24
22
Important Disclosure Footnotes for Companies Mentioned in this Report that Are Covered by
Oppenheimer & Co. Inc:
Stock Prices as of June 24, 2013
Apple Inc. (AAPL - NASDAQ, $413.50, OUTPERFORM)
TECHNICAL ANALYSIS

7/28/2019 C.B. Worth - "Money in Motion"
http://slidepdf.com/reader/full/cb-worth-money-in-motion 23/24
7/28/2019 C.B. Worth - "Money in Motion"
http://slidepdf.com/reader/full/cb-worth-money-in-motion 24/24
independent judgment of the merits and risks of investments. The analyst writing the report is not a person or company with
actual, implied or apparent authority to act on behalf of any issuer mentioned in the report. Before making an investment
decision with respect to any security recommended in this report, the recipient should consider whether such recommendation
is appropriate given the recipient's particular investment needs, objectives and financial circumstances. We recommend that
investors independently evaluate particular investments and strategies, and encourage investors to seek the advice of a
financial advisor. Oppenheimer Asset Management Inc. will not treat non-client recipients as its clients solely by virtue of their
receiving this report. Past performance is not a guarantee of future results, and no representation or warranty, express or implied, is made regarding future performance of any security mentioned in this report. The price of the securities mentioned
in this report and the income they produce may fluctuate and/or be adversely affected by exchange rates, and investors may
realize losses on investments in such securities, including the loss of investment principal. Oppenheimer Asset Management
Inc. accepts no liability for any loss arising from the use of information contained in this report. All information, opinions and
statistical data contained in this report were obtained or derived from public sources believed to be reliable, but Oppenheimer
Asset Management Inc. does not represent that any such information, opinion or statistical data is accurate or complete (with
the exception of information contained in the Important Disclosures section of this report provided by Oppenheimer Asset
Management Inc. or individual research analysts), and they should not be relied upon as such. All estimates, opinions and
recommendations expressed herein constitute judgments as of the date of this report and are subject to change without
notice. Nothing in this report constitutes legal, accounting or tax advice. Since the levels and bases of taxation can change,
any reference in this report to the impact of taxation should not be construed as offering tax advice on the tax consequences
of investments. As with any investment having potential tax implications, clients should consult with their own independent tax
adviser. This report may provide addresses of, or contain hyperlinks to, Internet web sites. Oppenheimer Asset Management
Inc. has not reviewed the linked Internet web site of any third party and takes no responsibility for the contents thereof.
Each such address or hyperlink is provided solely for the recipient's convenience and information, and the content of linked
third party web sites is not in any way incorporated into this document. Recipients who choose to access such third-party
web sites or follow such hyperlinks do so at their own risk. The S&P 500 Index is an unmanaged value-weighted index of
500 common stocks that is generally considered representative of the U.S. stock market. The S&P 500 index figures do
not reflect any fees, expenses or taxes. This research is distributed in the UK and elsewhere throughout Europe, as third
party research by Oppenheimer Europe Ltd, which is authorized and regulated by the Financial Conduct Authority (FCA).
This research is for information purposes only and is not to be construed as a solicitation or an offer to purchase or sell
investments or related financial instruments. This research is for distribution only to persons who are eligible counterparties
or professional clients and is exempt from the general restrictions in section 21 of the Financial Services and Markets Act2000 on the communication of invitations or inducements to engage in investment activity on the grounds that it is being
distributed in the UK only to persons of a kind described in Article 19(5) (Investment Professionals) and 49(2) High Net Worth
companies, unincorporated associations etc) of the Financial Services and Markets Act 2000 (Financial Promotion) Order
2005 (as amended). It is not intended to be distributed or passed on, directly or indirectly, to any other class of persons. In
particular, this material is not for distribution to, and should not be relied upon by, retail clients, as defined under the rules
of the FCA. Neither the FCA’s protection rules nor compensation scheme may be applied. This report or any portion hereof
may not be reprinted, sold, or redistributed without the written consent of Oppenheimer Asset Management Inc. Copyright
© Oppenheimer Asset Management Inc. 2013.
This report or any portion hereof may not be reprinted, sold, or redistributed without the written consent of Oppenheimer & Co. Inc. Copyright
© Oppenheimer & Co. Inc. 2013.
TECHNICAL ANALYSIS