cbo's analysis of health care spending and policy proposals
TRANSCRIPT
Congressional Budget Office
CBO’s Analysis of Health Care Spending and Policy Proposals
Presentation for staff of the U.S. Department of Commerce
September 21, 2016
Philip Ellis Deputy Assistant Director Health, Retirement, and Long-Term Analysis Division
1 CO N G R ES S I ON AL B U D G E T O F F I C E
CBO’s General Approach to Policy Analysis
2 CO N G R ES S I ON AL B U D G E T O F F I C E
CBO was created by the Congressional Budget and Impoundment Control Act of 1974. The agency started operating in February 1975.
CBO has about 230 full-time staff, more than three-fourths of whom hold advanced degrees in economics, public policy, or related fields.
3 CO N G R ES S I ON AL B U D G E T O F F I C E
CBO provides objective, nonpartisan information to the Congress.
The agency makes baseline projections of federal spending, revenues, and deficits under current law.
4 CO N G R ES S I ON AL B U D G E T O F F I C E
CBO produces estimates of the effects of changes in federal policies, including: • legislation being developed by
Congressional committees; and • conceptual proposals being discussed in
the Congress or elsewhere.
CBO makes no recommendations.
5 CO N G R ES S I ON AL B U D G E T O F F I C E
CBO’s estimates focus on the next 10 years but sometimes look out 20 years or more.
The estimates are meant to reflect the middle of the distribution of possible outcomes, and they incorporate behavioral responses to the extent feasible.
6 CO N G R ES S I ON AL B U D G E T O F F I C E
CBO’s estimates use whatever evidence can be brought to bear, given available resources and time.
The estimates can change in response to new analysis by CBO and others, and the agency provides explanations of the analysis to the extent feasible.
7 CO N G R ES S I ON AL B U D G E T O F F I C E
CBO’s Analysis of Federal Spending on Health Care

8 CO N G R ES S I ON AL B U D G E T O F F I C E
National Spending for Health Care, 2014
9 CO N G R ES S I ON AL B U D G E T O F F I C E
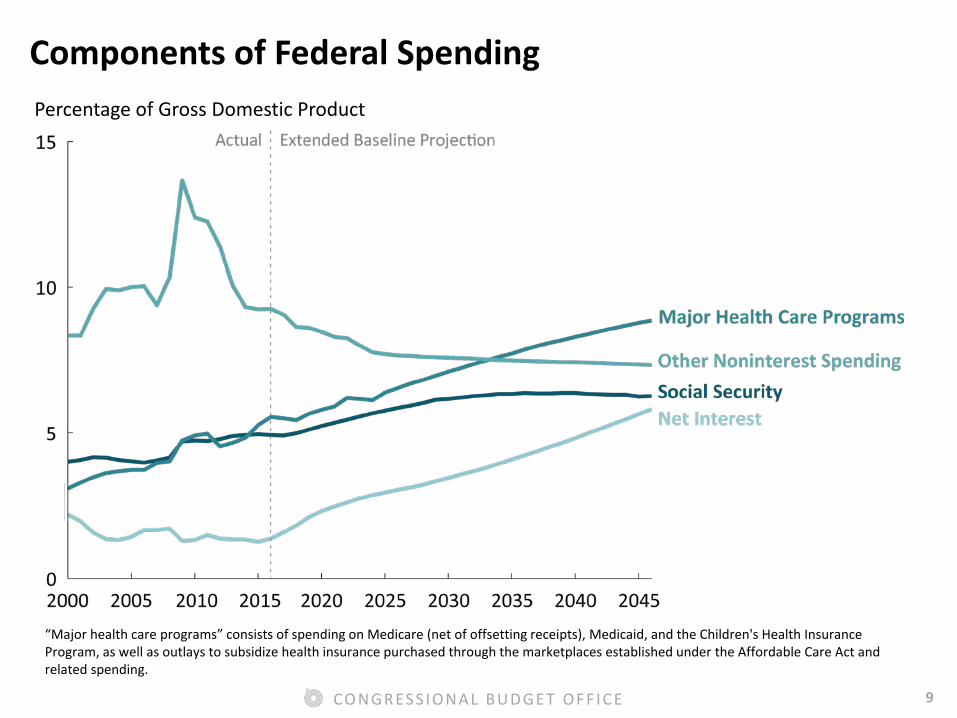
Components of Federal Spending Percentage of Gross Domestic Product
“Major health care programs” consists of spending on Medicare (net of offsetting receipts), Medicaid, and the Children's Health Insurance Program, as well as outlays to subsidize health insurance purchased through the marketplaces established under the Affordable Care Act and related spending.
10 CO N G R ES S I ON AL B U D G E T O F F I C E
CBO expects that, between 2016 and 2046, gross federal spending on major health care programs as a share of GDP will increase by 4 percentage points, from 6.1 percent to 10.1 percent.
11 CO N G R ES S I ON AL B U D G E T O F F I C E
1.8 percentage points come from population aging, mostly because aging makes more people eligible for Medicare and increases costs per enrollee.
2.2 percentage points come from excess cost growth, meaning that spending per beneficiary, adjusted for demographic changes, will grow more quickly than potential GDP per capita.
12 CO N G R ES S I ON AL B U D G E T O F F I C E
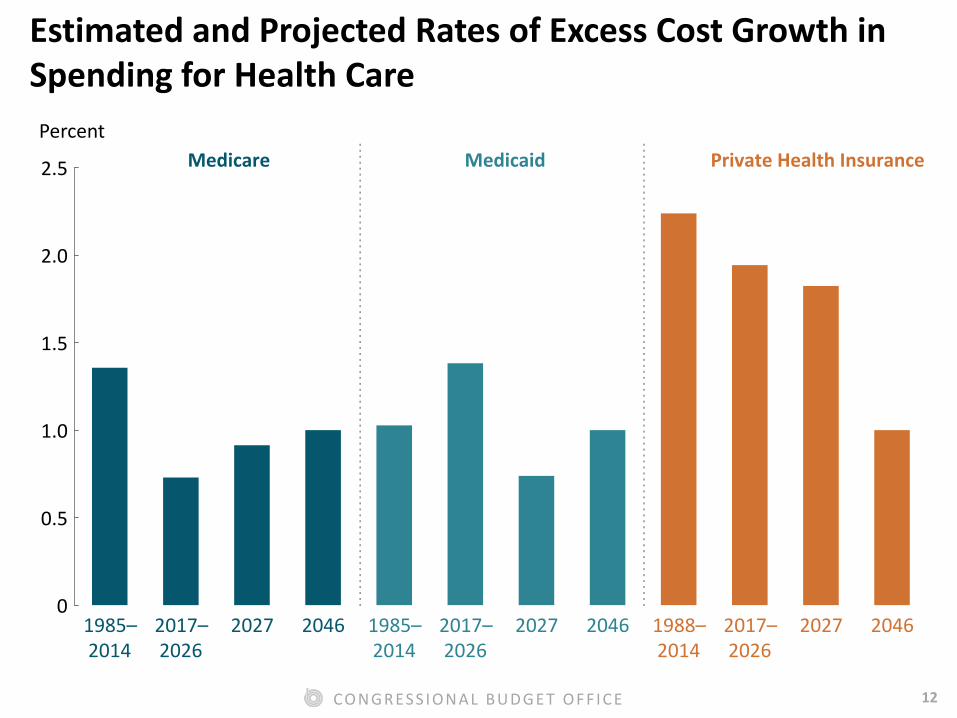
Estimated and Projected Rates of Excess Cost Growth in Spending for Health Care Percent
1985–2014
2017–2026
2027 2046 1985–2014
2017–2026
2027 2046 1988–2014
2017–2026
2027 20460
0.5
1.0
1.5
2.0
2.5 Medicare Medicaid Private Health Insurance
13 CO N G R ES S I ON AL B U D G E T O F F I C E
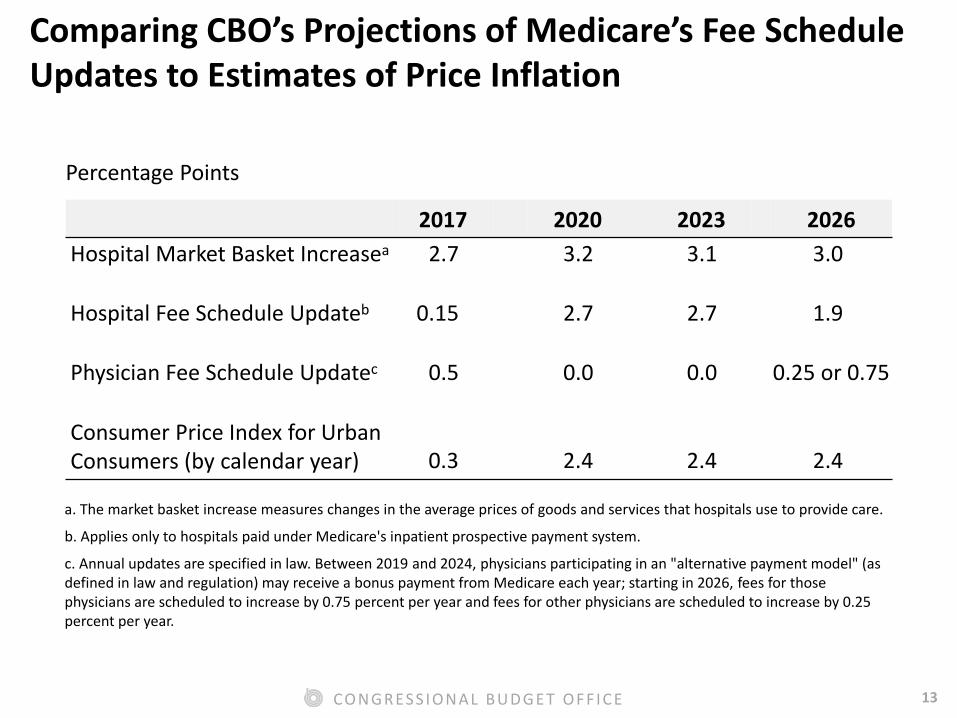
Comparing CBO’s Projections of Medicare’s Fee Schedule Updates to Estimates of Price Inflation
2017 2020 2023 2026 Hospital Market Basket Increasea 2.7 3.2 3.1 3.0
Hospital Fee Schedule Updateb 0.15 2.7 2.7 1.9
Physician Fee Schedule Updatec 0.5 0.0 0.0 0.25 or 0.75
Consumer Price Index for Urban Consumers (by calendar year) 0.3 2.4 2.4 2.4
Percentage Points
a. The market basket increase measures changes in the average prices of goods and services that hospitals use to provide care.
b. Applies only to hospitals paid under Medicare's inpatient prospective payment system.
c. Annual updates are specified in law. Between 2019 and 2024, physicians participating in an "alternative payment model" (as defined in law and regulation) may receive a bonus payment from Medicare each year; starting in 2026, fees for those physicians are scheduled to increase by 0.75 percent per year and fees for other physicians are scheduled to increase by 0.25 percent per year.
14 CO N G R ES S I ON AL B U D G E T O F F I C E
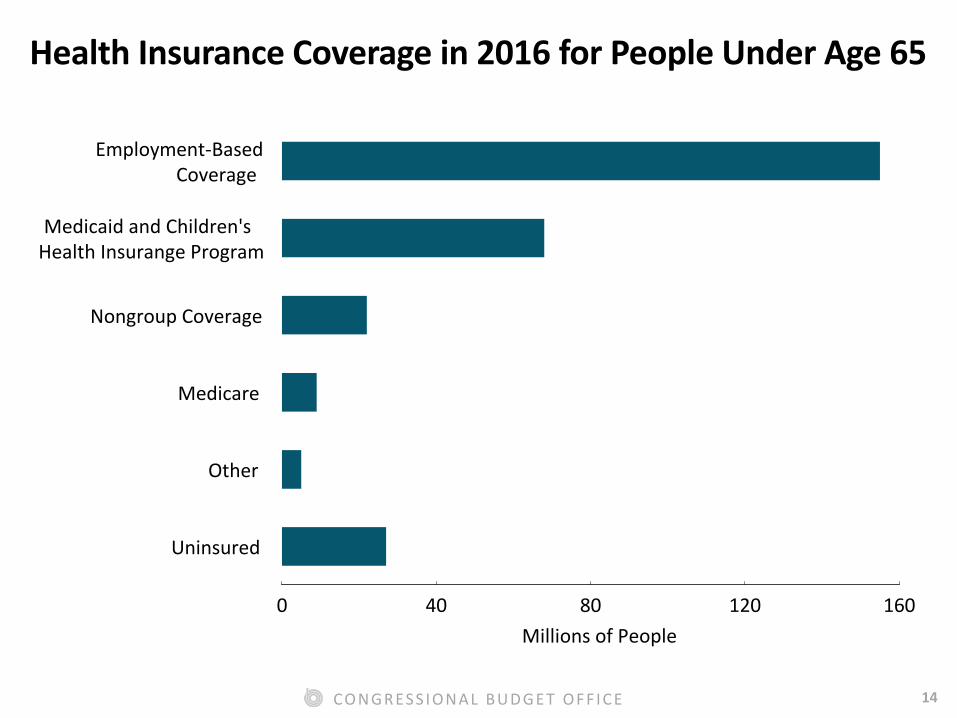
Health Insurance Coverage in 2016 for People Under Age 65
Uninsured
Other
Medicare
Nongroup Coverage
Medicaid and Children'sHealth Insurange Program
Employment-BasedCoverage
0 40 80 120 160Millions of People
15 CO N G R ES S I ON AL B U D G E T O F F I C E
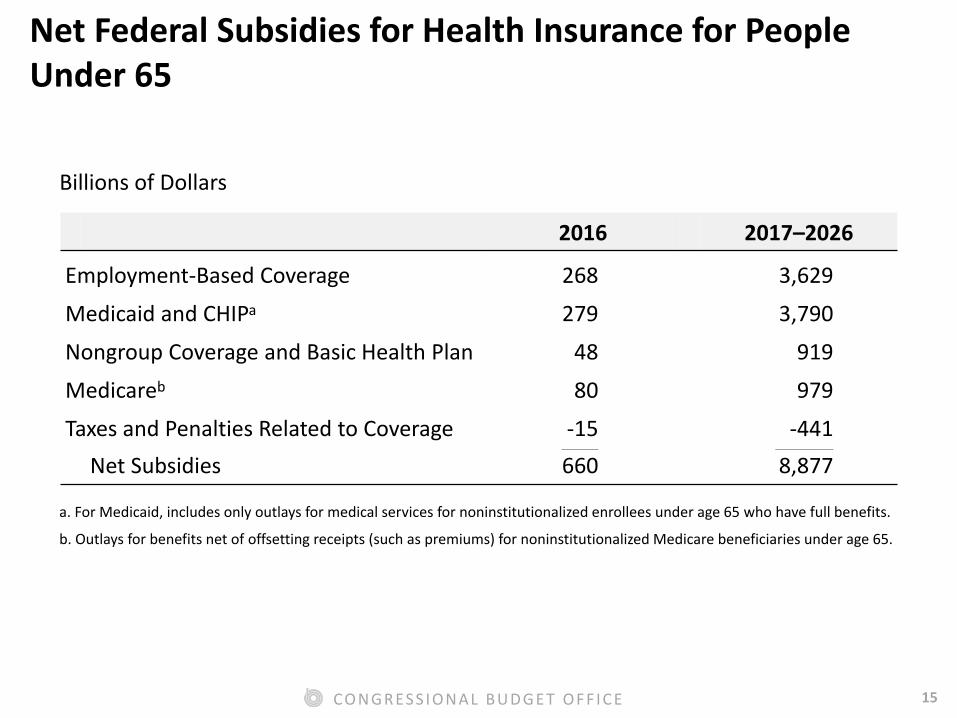
Net Federal Subsidies for Health Insurance for People Under 65
Billions of Dollars
2016 2017–2026
Employment-Based Coverage 268 3,629
Medicaid and CHIPa 279 3,790
Nongroup Coverage and Basic Health Plan 48 919
Medicareb 80 979
Taxes and Penalties Related to Coverage -15 -441 ______________ ______________________
Net Subsidies 660 8,877
a. For Medicaid, includes only outlays for medical services for noninstitutionalized enrollees under age 65 who have full benefits.
b. Outlays for benefits net of offsetting receipts (such as premiums) for noninstitutionalized Medicare beneficiaries under age 65.
16 CO N G R ES S I ON AL B U D G E T O F F I C E
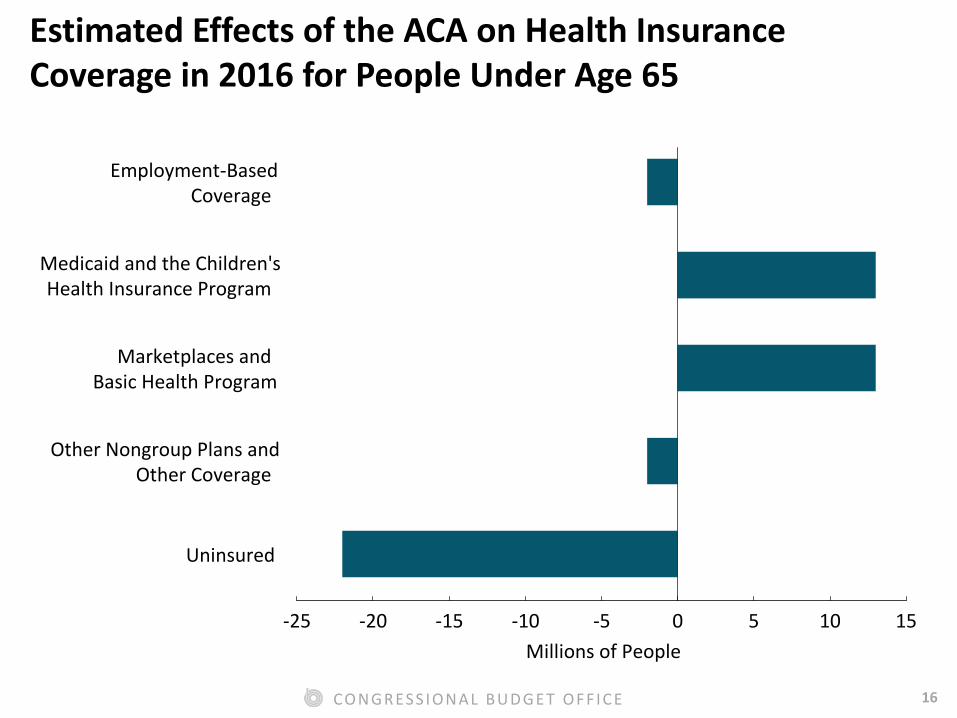
Estimated Effects of the ACA on Health Insurance Coverage in 2016 for People Under Age 65
Uninsured
Other Nongroup Plans andOther Coverage
Marketplaces andBasic Health Program
Medicaid and the Children'sHealth Insurance Program
Employment-BasedCoverage
-25 -20 -15 -10 -5 0 5 10 15Millions of People
17 CO N G R ES S I ON AL B U D G E T O F F I C E
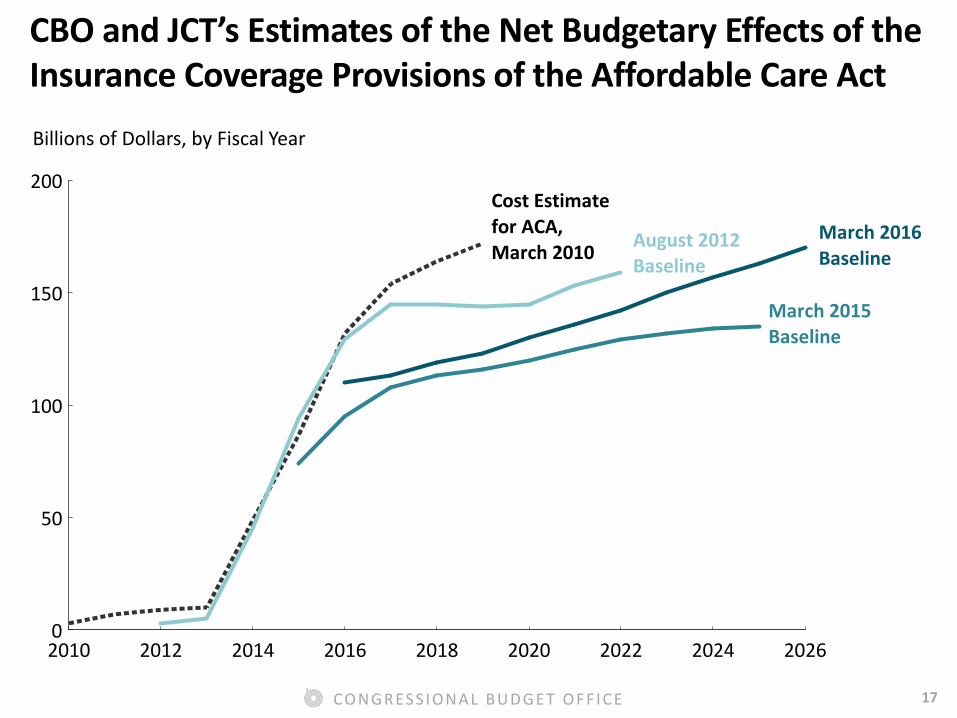
CBO and JCT’s Estimates of the Net Budgetary Effects of the Insurance Coverage Provisions of the Affordable Care Act
2010 2012 2014 2016 2018 2020 2022 2024 20260
50
100
150
200Cost Estimatefor ACA,March 2010 August 2012
Baseline
March 2015Baseline
March 2016Baseline
Billions of Dollars, by Fiscal Year
18 CO N G R ES S I ON AL B U D G E T O F F I C E
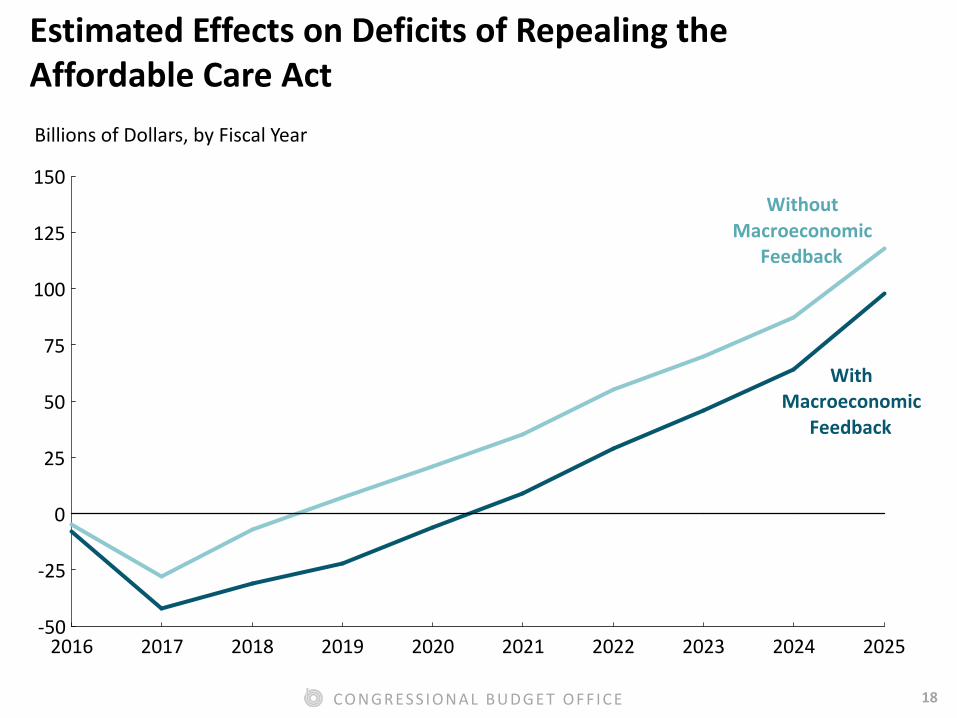
Estimated Effects on Deficits of Repealing the Affordable Care Act
2016 2017 2018 2019 2020 2021 2022 2023 2024 2025-50
-25
0
25
50
75
100
125
150Without
MacroeconomicFeedback
WithMacroeconomic
Feedback
Billions of Dollars, by Fiscal Year
19 CO N G R ES S I ON AL B U D G E T O F F I C E
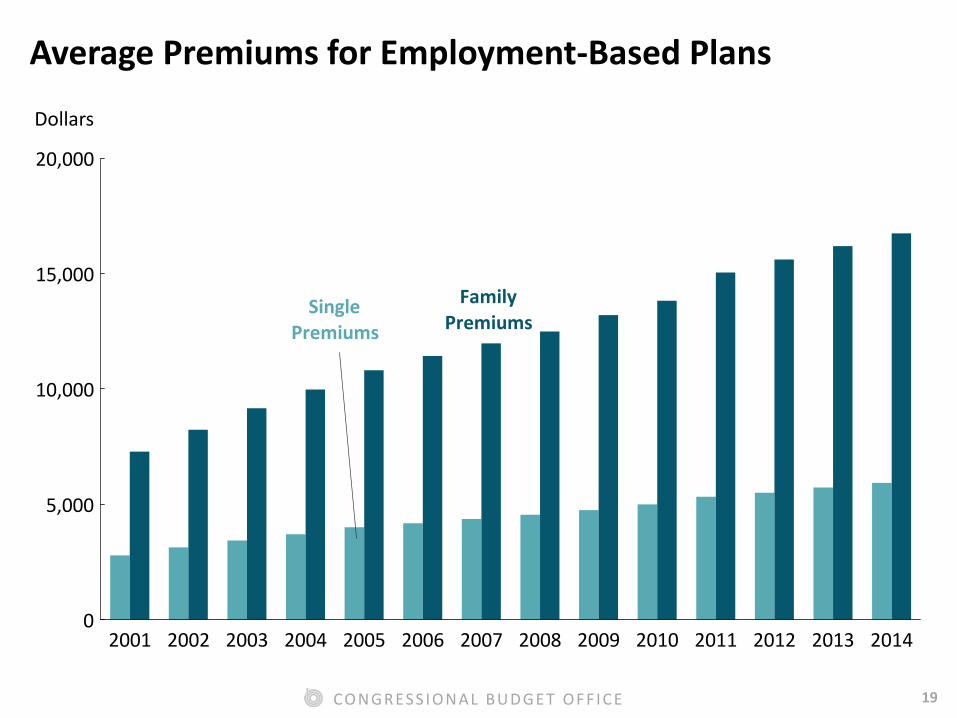
Average Premiums for Employment-Based Plans
Dollars
2001 2002 2003 2004 2005 2006 2007 2008 2009 2010 2011 2012 2013 20140
5,000
10,000
15,000
20,000
FamilyPremiums
SinglePremiums
20 CO N G R ES S I ON AL B U D G E T O F F I C E
Examples of Policy Proposals and Approaches that CBO Has
Analyzed Recently
21 CO N G R ES S I ON AL B U D G E T O F F I C E
CBO has analyzed a broad range of possible approaches designed to reduce spending, including: • Reducing federal subsides
• Paying Medicare providers in different ways
• Making broader structural changes in Medicare or Medicaid
• Improving the health of the population
22 CO N G R ES S I ON AL B U D G E T O F F I C E
Cutting federal subsidies for health insurance would help the budget but would leave affected people to bear higher costs.
23 CO N G R ES S I ON AL B U D G E T O F F I C E
Federal policies could: • Narrow eligibility for ACA subsidies or
repeal them
• Reduce the ACA subsidy per enrollee
• Reduce the tax subsidy for employment-based health insurance
• Raise the eligibility age for Medicare
• Increase premiums for Medicare
• Increase Medicare’s cost-sharing requirements
24 CO N G R ES S I ON AL B U D G E T O F F I C E
Paying Medicare providers in different ways could help the budget but would have a range of effects on providers and beneficiaries.
25 CO N G R ES S I ON AL B U D G E T O F F I C E
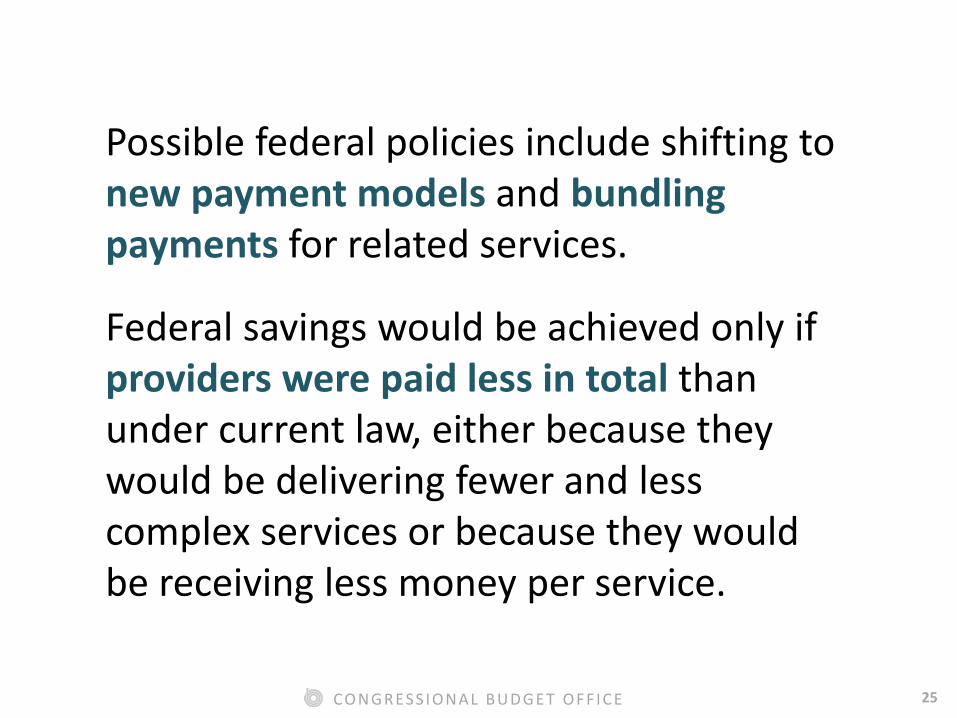
Possible federal policies include shifting to new payment models and bundling payments for related services.
Federal savings would be achieved only if providers were paid less in total than under current law, either because they would be delivering fewer and less complex services or because they would be receiving less money per service.
26 CO N G R ES S I ON AL B U D G E T O F F I C E
Making larger structural changes to federal health care programs could help the budget but would have a range of effects on providers and beneficiaries.
27 CO N G R ES S I ON AL B U D G E T O F F I C E
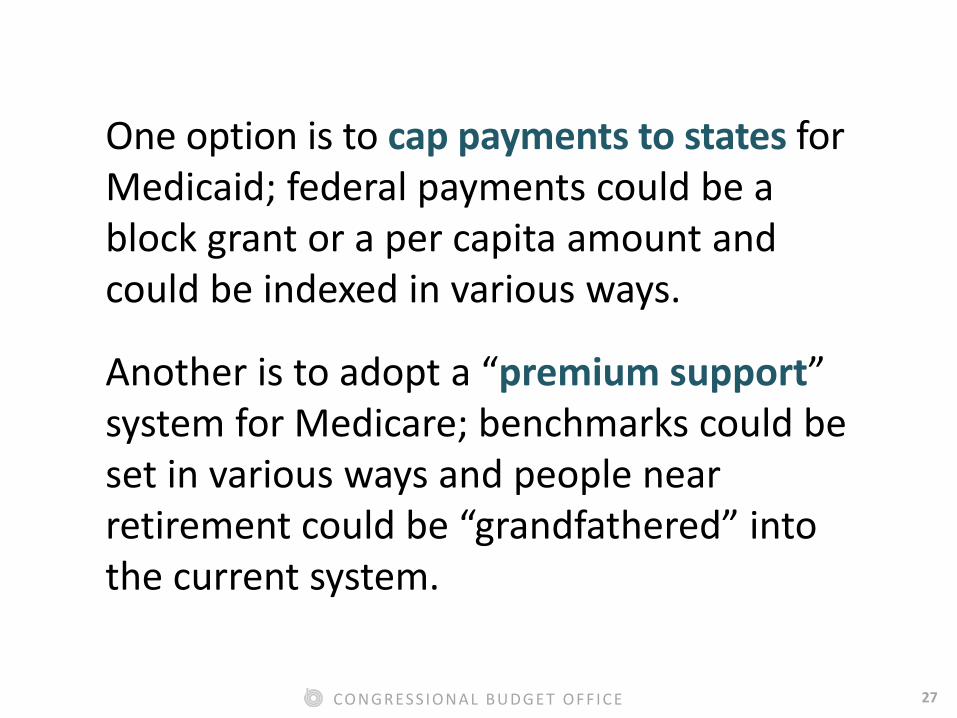
One option is to cap payments to states for Medicaid; federal payments could be a block grant or a per capita amount and could be indexed in various ways.
Another is to adopt a “premium support” system for Medicare; benchmarks could be set in various ways and people near retirement could be “grandfathered” into the current system.
28 CO N G R ES S I ON AL B U D G E T O F F I C E
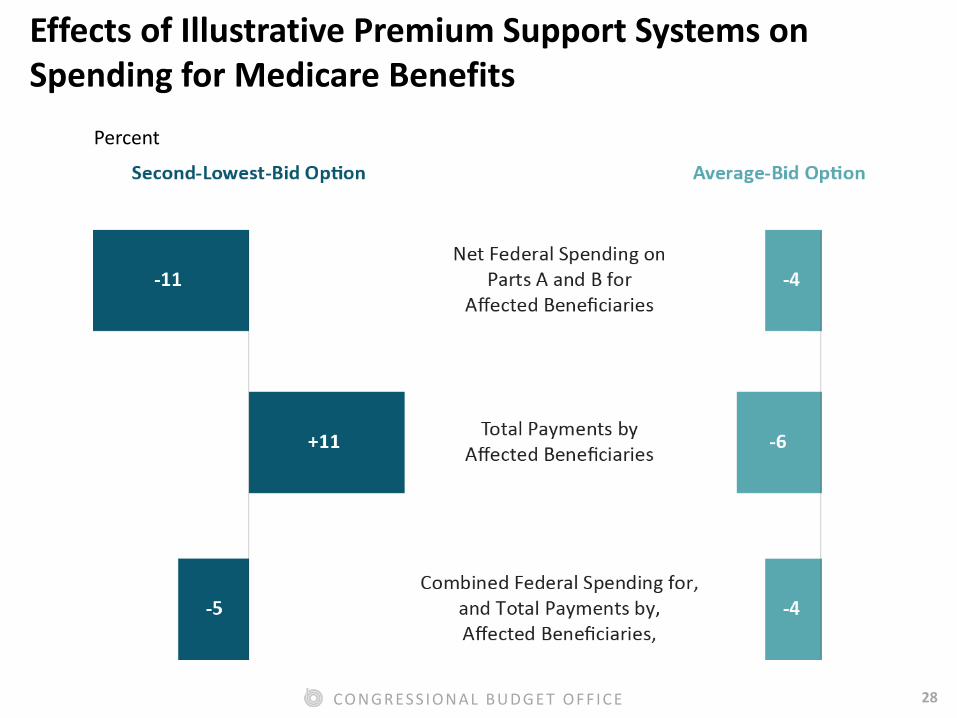
Effects of Illustrative Premium Support Systems on Spending for Medicare Benefits
Percent
29 CO N G R ES S I ON AL B U D G E T O F F I C E
Policy initiatives that improved health would help people but might or might not produce savings for the federal budget.
30 CO N G R ES S I ON AL B U D G E T O F F I C E
There are many steps between a policy initiative aimed at improving health and its budgetary effects.
31 CO N G R ES S I ON AL B U D G E T O F F I C E
In general, the policy would need to change people’s behavior, which could be difficult.
Changes in behavior would then need to improve people’s health, which could take some time.
Improvements in health would then need to reduce health care costs, which could also take some time.
32 CO N G R ES S I ON AL B U D G E T O F F I C E
The budgetary effects of policy initiatives depend on a combination of factors: • Any reduction in annual health care costs
per person
• Any increase in tax revenues from better health and increases in federal spending from people living longer
• Any budgetary cost or savings of the policy itself
33 CO N G R ES S I ON AL B U D G E T O F F I C E
Conclusion
34 CO N G R ES S I ON AL B U D G E T O F F I C E
Federal lawmakers often strive for policies that both reduce the growth of federal health care spending and improve the effectiveness of the national health care system.
35 CO N G R ES S I ON AL B U D G E T O F F I C E
Designing federal policies to achieve both of those goals is challenging. Most policies have significant disadvantages as well as advantages.
How health insurers, health care providers, and individuals would respond to most policies is uncertain.