cbre research · 2012-q2 2014), when it was the only tech-thirty office market other than detroit...
TRANSCRIPT

CBRE Research
Measuring Tech Industry Impact on Office Markets in North America

2015 TECH-THIRTY | CBRE Research2

HOW WELL IS THE TECH INDUSTRY PERFORMING?The high-tech software/services industry created 730,000 new jobs at a growth rate of 34% since 2009—one-fifth of all new office-using jobs. The sector was also the leading driver of U.S. office market demand, account-ing for 20% of major leasing activity in 2015.
WHAT IS THE TOP-RANKED TECH-THIRTY CITY? San Francisco topped the Tech-Thirty office markets list for four straight years; its high-tech job base (43%) and office rents (31%) grew at the fastest rate over the past two years. Phoenix shared the top high-tech job growth rate of 43% with San Francisco, but created 4,300 fewer new jobs.
WHERE TO FIND HIGH-TECH INDUSTRY MOMENTUM MARKETS? Twenty-four markets exceeded the U.S. high-tech software/services job growth rate of 5.7% between 2012 and 2014, with Austin (33%), Silicon Valley (27%) and Nashville (23%) joining San Francisco and Phoenix to round out the top five.
WHICH CITIES LEAD THE TECH-THIRTY OFFICE MARKETS? Sixteen markets posted double-digit rent growth over the past two years, led by San Francisco (31%), Silicon Valley (28%), Raleigh-Durham (23%), San Francisco Peninsula (21%) and Vancouver (18%).
WHERE ARE THE RENT PREMIUMS/DISCOUNTS? The strong performance of high-tech submarkets led to substantial rent premiums over the entire Tech-Thirty office market—the aggregate premium was 11%. Within markets, premiums were as high as 87% in East Cambridge, 85% in Santa Monica and 73% in Mountain View. Discounts were also available in a number of emerging tech submarkets, including Reston/Herndon (-23%), St. Louis CBD (-17%) and Northeast Charlotte (-12%).
WHERE TO INVEST? From an investor’s perspective, Austin, Salt Lake City, Phoenix and Portland offer further growth potential. These markets are also attractive to occupiers, although Raleigh-Durham, Dallas/Ft. Worth, Charlotte and Nashville offer the best combination of low office rents and a growing high-tech labor pool.
HOW LONG WILL THE INDUSTRY STAY STRONG? The high-tech industry is directly supported by consumer demand and a growing number of high-tech integrated businesses, which should keep the industry strong in the years ahead and provide further support for office markets in the Tech-Thirty. Commercial real estate investors must be mindful and have realistic expectations about this historically volatile industry underpinning the health of many Tech-Thirty office markets.
3 © 2015, CBRE, Inc.

Growth in the high-tech software/services industry is significantly outpacing broader job and office-using employment growth, fueling robust demand for office space in primary tech markets and submarkets. With the addition of more than 730,000 jobs, the U.S. software/services employment sector grew by more than one-third between 2009 and May 2015. By comparison, total employment and office-using employment excluding high-tech each increased by less than 11% over the same period. In 2015, the software/services component added 48,000 jobs through May, compared with the addition of 46,000 during the same period in 2014. At this pace, this year should match or surpass 2014’s 150,000 new jobs, the highest annual total for the current expansion period.
Compared with other creative industries, expansion in high-tech software/services dwarfs growth in other sectors (Figure 1). Between 2009 and May 2015, the media-entertainment sector recorded the second-fastest rate of job creation (14.8%), behind the high-tech software/services sector’s growth rate of 34.4%. Employment levels in most of the other major creative
industries have just recently reached their respective 2007 peaks.
Rapid job creation continues to make the high-tech industry the strongest driver of office space demand. High-tech transactions took the largest share of major leasing activity in 2014, 19%—up from 14% in 2013. Its share was 20% through Q2 2015, again exceeding all other industries. In many leading tech markets, the sector is even more dominant: in Silicon Valley, Austin, San Francisco and Seattle, high-tech companies accounted for 88%, 63%, 62% and 60% of major leasing activity through Q2 2015, respectively. With high-tech tenants representing more than 16% of major office requirements to be fulfilled in 54 markets tracked by CBRE Research, this sector is projected to remain the strongest source of demand for office space through 2015.
2015 TECH-THIRTY | CBRE Research4

Source: U.S. Bureau of Labor Statistics and CBRE Research, July 2015.
80
85
90
95
100
105
110
115
120
125
130
135
140
145
2007 2008 2009 2010 2011 2012 2013 2014 2015
High-Tech Software/Services
Biotech
U.S. Total Non-Farm
Media-Entertainment
Office Jobs (excl. high-tech)
Design Services
High-Tech Manufacturers
Telecom
FIGURE 1
U.S. JOB GROWTH FOR HIGH-TECH AND CREATIVE INDUSTRIESIndex Value > 100 indicates job growth above 2007 peak
5 © 2015, CBRE, Inc.

Within the Tech-Thirty, comprised of leading technology markets in the U.S. and Canada, high-tech software/services job creation overwhelmingly outperformed the national average (Figure 2). Among these markets, 24 exceeded the 5.7% U.S. software/services job growth rate between 2012 and 2014. San Francisco and Phoenix were the top growth markets—each registered a 42.7% rate of new job creation. Comparing the current period (2012-2014) with the prior period (2011-2013), we found 11 markets posted faster growth, including Silicon Valley, Pittsburgh and Minneapolis. Of the 19 markets with slower growth during these comparison periods, job creation was still strong. Among these were San Francisco, Austin, Nashville, New York, Indianapolis and the San Francisco Peninsula—all of which experienced software/services sector growth of 15% or higher between 2012 and 2014. Only Washington, D.C. lost software/services jobs over the past two years, due to federal government cutbacks’ lingering impact on the local economy.
Silicon Valley led software/services job creation in absolute terms—followed by Seattle, San Francisco, New York and Chicago. These job gains indicate the appeal to tech companies of established, higher-cost tech markets such as San Francisco and Silicon Valley, as well as the rapid expansion of Sunbelt markets—like Phoenix, Austin and Nashville—that offer a skilled labor pool and lower operating costs.
The impact of high-tech job creation on office market rent growth was apparent, with 16 of the Tech-Thirty posting rent growth of 10% or more between Q2 2013 and Q2 2015. The San Francisco Bay Area was once again among the top markets for rent growth, reflecting the region’s strong job creation and low vacancy rates. San Francisco, Silicon Valley and the San Francisco Peninsula were also among the top six most concentrated markets in terms of new high-tech jobs as a share of new office jobs, indicating the importance of the high-tech industry as an economic and office-market driver over the past few years. Raleigh-Durham, a low-cost market with a large, skilled workforce, posted the third-fastest rent growth—a major turnaround from its prior period performance (Q2 2012-Q2 2014), when it was the only Tech-Thirty office market other than Detroit to see rents decline.
Office rents within the Tech-Thirty increased in all but two of the primary tech submarkets between Q2 2013 and Q2 2015. Several of the most expensive submarkets posted the strongest rent growth (Figure 3.2), illustrating stiff competition among tenants to locate in highly desirable areas such as Mountain View, SOMA, East Cambridge, Redwood City and Santa Monica. Most of the top submarkets for net absorption during this period were in the Sunbelt and West—among them Mountain View, Southvalley, the Nashville CBD, Northeast Charlotte, Sorrento Mesa and the North Loop (Figure 3.4).
2015 TECH-THIRTY | CBRE Research6

FIGURE 2
HIGH-TECH SOFTWARE/SERVICES JOB AND OFFICE RENT GROWTH, PAST TWO YEARS
High-Tech Software/Services Job GrowthRanked by growth rate, 2012 to 2014
Office Market Rent GrowthRanked by growth rate, Q2 2013 to Q2 2015
Source: U.S. Bureau of Labor Statistics, Statistics Canada and CBRE Research, July 2015.
RANK MARKET
CURRENT PERIOD
Q2 ‘13-Q2 ‘15
PRIOR PERIOD
Q2’12-Q2’14
1 San Francisco 30.7% 34.6%
2 Silicon Valley 28.1% 21.4%
3 Raleigh-Durham 23.4% -0.9%
4 San Francisco Peninsula 21.0% 19.3%
5 Vancouver 18.4% 14.3%
6 Orange County 16.1% 5.2%
7 Boston 14.4% 11.2%
8 New York 14.1% 17.5%
9 Dallas/Ft. Worth 13.4% 12.0%
10 San Diego 12.7% 8.6%
11 Pittsburgh 12.4% 1.8%
12 Denver 11.8% 12.7%
13 Austin 11.4% 12.2%
14 Minneapolis 10.9% 7.2%
15 Greater Los Angeles 10.9% 9.5%
16 Portland 10.7% 6.1%
17 Seattle 9.4% 8.0%
18 Nashville 8.9% 8.5%
19 Salt Lake City 8.8% 4.1%
20 Phoenix 8.3% 3.7%
21 Charlotte 8.0% 4.3%
22 Chicago 6.2% 3.5%
23 Atlanta 6.1% 3.3%
24 Toronto 5.0% 0.5%
25 Indianapolis 4.0% 0.6%
26 Washington, D.C. 3.4% 3.6%
27 St. Louis 3.1% 1.4%
28 Philadelphia 3.0% 2.2%
29 Detroit 2.9% -0.7%
30 Baltimore 1.0% 3.7%
GROWTH RATEGROWTH RATE
RANK MARKET
CURRENT PERIOD
2012-2014
PRIOR PERIOD
2011-2013
NEW JOBS
2012-2014
AS % NEW OFFICE JOBS 2012-2014
1 San Francisco 42.7% 50.9% 16,976 55.1%
2 Phoenix 42.7% 18.6% 12,662 31.3%
3 Austin 33.0% 33.7% 9,313 34.4%
4 Silicon Valley 27.0% 20.0% 25,448 68.4%
5 Nashville 22.7% 29.6% 2,117 10.4%
6 New York 22.6% 22.7% 15,865 30.9%
7 Seattle 18.3% 17.0% 18,841 88.1%
8 Indianapolis 18.0% 20.7% 3,047 10.4%
9 Charlotte 17.3% 13.4% 2,864 13.6%
10 Salt Lake City 16.2% 15.6% 5,567 22.6%
11 Portland 16.1% 12.3% 3,404 16.7%
12 San Francisco Pen. 15.0% 30.2% 5,070 42.8%
13 Chicago 14.9% 19.3% 10,192 26.4%
14 Raleigh-Durham 14.2% 16.8% 3,853 26.1%
15 Pittsburgh 14.1% 2.2% 1,734 232.1%
16 Orange County 12.9% 9.7% 3,448 15.2%
17 Dallas/Ft. Worth 10.7% 16.4% 8,193 14.3%
18 Minneapolis 10.7% 4.5% 4,444 24.0%
19 Denver 10.7% 13.3% 5,603 20.0%
20 Boston 8.5% 15.8% 7,755 36.1%
21 St. Louis 8.5% 24.6% 1,657 16.6%
22 Atlanta 7.8% 10.5% 4,872 3.8%
23 San Diego 7.6% 4.1% 1,980 19.6%
24 Los Angeles 6.7% 11.9% 3,779 11.4%
25 Toronto 5.3% 4.2% 4,900 8.0%
26 Baltimore 4.3% 10.0% 1,283 10.4%
27 Detroit 3.5% 7.7% 1,240 6.8%
28 Philadelphia 2.5% 3.9% 907 14.6%
29 Vancouver 2.4% 18.7% 800 5.8%
30 Washington, D.C. -2.2% 0.8% -3,142 76.3%
NEW HIGH-TECH JOBS
7 © 2015, CBRE, Inc.

FIGURE 3
OFFICE MARKET PERFORMANCE FACTORS, TWO-YEAR GROWTH TREND
FIGURE 3:1
RENT GROWTH OVERALL MARKETQ2 2013 TO Q2 2015
FIGURE 3:2
RENT GROWTH TOP TECH SUBMARKETQ2 2013 TO Q2 2015
Source: CBRE Research, Q2 2015. Source: CBRE Research, Q2 2015.
-10% 0% 10% 20% 30% 40%
Baltimore (BALT) Detroit (DET)
Philadelphia (PHL) St. Louis (STL)
Washington, D.C. (DC) Indianapolis (IND)
Toronto (TORO) Atlanta (ATL)
Chicago (CHI) Charlotte (CLT) Phoenix (PHX)
Salt Lake City (SLC) Nashville (NASH)
Seattle (SEA) Portland (POR)
Greater Los Angeles (LA) Minneapolis (MIN)
Austin (AUS) Denver (DEN)
Pittsburgh (PIT) San Diego (SD)
Dallas/Ft. Worth (DFW) New York (NY) Boston (BOS)
Orange County (OC) Vancouver (VAN)
San Fran Peninsula (SFP) Raleigh-Durham (R-D)
Silicon Valley (SV) San Francisco (SF)
-10% 0% 10% 20% 30% 40%
Reston/Herndon (DC)
BWI (BALT) CBD (STL) CBD (IND)
River North (CHI) Northeast (CLT)
RTP/I-40 Corridor (R-D) North Fulton (ATL) Southvalley (SLC)
Far North Dallas (DFW) Yaletown & Gastown (VAN)
Tempe (PHX) Midtown South (NY)
Oakland (PIT) Toronto Downtown West (TORO)
Sorrento Mesa (SD) CBD (POR)
Ann Arbor (DET) Santa Monica (LA) North Loop (MIN)
University City (PHL) South Orange County (OC)
CBD (NASH) SOMA (SF)
Redwood City (SFP) East Cambridge (BOS)
Lake Union (SEA) Mountain View (SV)
Northwest (AUS)
Northwest (DEN)
2015 TECH-THIRTY | CBRE Research8

FIGURE 3:2
RENT GROWTH TOP TECH SUBMARKETQ2 2013 TO Q2 2015
FIGURE 3:4
NET ABSORPTION GROWTH TOP TECH SUBMARKET Q3 2013 TO Q2 2015 (% OF TOTAL BUILDING STOCK)
FIGURE 3:3
NET ABSORPTION GROWTH OVERALL MARKET Q3 2013 TO Q2 2015 (% OF TOTAL BUILDING STOCK)
Source: CBRE Research, Q2 2015. Source: CBRE Research, Q2 2015.Source: CBRE Research, Q2 2015.
-1% 1% 3% 5% 7% 9 % 11% 13%
Washington, D.C. (DC) Toronto (TORO)
Baltimore (BALT) Chicago (CHI)
Vancouver (VAN) St. Louis (STL) New York (NY)
Pittsburgh (PIT) Minneapolis (MIN)
San Fran Peninsula (SFP) Denver (DEN) Boston (BOS)
San Diego (SD) Greater Los Angeles (LA)
Indianapolis (IND) Philadelphia (PHL)
Portland (POR) Atlanta (ATL)
Dallas/Ft. Worth (DFW) Orange County (OC)
Detroit (DET) Salt Lake City (SLC) San Francisco (SF) Nashville (NASH)
Seattle (SEA) Charlotte (CLT) Phoenix (PHO)
Raleigh-Durham (R-D) Austin (AUS)
Silicon Valley (SV)
-5% 0 % 5% 10% 15% 20% 25% 30%
Sorrento Mesa (SD) Santa Monica (LA)
Toronto Downtown West (TORO) Yaletown & Gastown (VAN)
River North (CHI) CBD (IND)
Reston/Herndon (DC) CBD (POR)
Oakland (PIT) CBD (STL)
Midtown South (NY) Redwood City (SFP)
BWI (BALT) CBD (NASH)
North Fulton (ASU) South Orange County (OC)
SOMA (SF) Tempe (AZ)
East Cambridge (BOS) Northeast (CLT)
Northwest (AUS) Ann Arbor (DET)
Far North Dallas (DFW) RTP/I-40 Corridor (R-D)
North Loop (MIN) Southvalley (SLC)
University City (PIT) Lake Union (SEA)
Mountain View (SV)
Northwest (DEN)
9 © 2015, CBRE, Inc.

The Tech-Thirty Strength Diagram illustrates the strength of each market’s high-tech software/services job creation rate and office market performance between Q2 2013 and Q2 2015 (Figure 4). The diagram shows that above-average high-tech software/services job growth generally coincided with above-average office market performance. Silicon Valley led in both respects, followed by the San Francisco Peninsula and San Francisco, both of which boast strong job creation and office market fundamentals.
Several lower-cost Sunbelt and Western markets that benefit from Bay Area tenant spillover—including Austin, Salt Lake City, Phoenix and Portland—appear in the Growth Leaders quadrant as well. Sunbelt and Western markets are also well-represented in the Emerging Market quadrant; San Diego, Orange County, Charlotte, Nashville and Dallas-Ft. Worth are counted here, with markedly improved office market conditions observed in many of these metro areas over the past few years.
Source: CBRE Research,Q2 2015, U.S. Bureau of Labor Statistics, Statistics Canada, July 2015. Tech-Thirty Strength Diagram measures the relative strength of the Tech-Thirty office markets on a scale of 0 to 100. High-tech software/services job strength includes high-tech software/services job growth over the past two years and their current concentration within office-using job categories. Office market strength includes rent and net absorption growth over the past two years. The quadrant lines represent the 30-market aggregate average for each strength measure.
FIGURE 4
TECH-THIRTY STRENGTH DIAGRAM
0
10
20
30
40
50
60
70
80
90
100
Overa
ll Mark
et Str
ength
0
High-Tech Software/Services Strength
10 20 30 40 50 60 70 80 90 100
Charlotte
St. Louis
Toronto
Vancouver
Detroit Minneapolis
Phoenix
Silicon Valley
EMERGING GROWTH LEADERS
HIGH-POTENTIALLAGGING
San Francisco
Austin
Seattle
Boston Salt Lake City
Denver
Raleigh-Durham
Portland Orange County
San Diego Atlanta
Los Angeles
Pittsburgh
Manhattan
Baltimore Chicago
Philadelphia
Nashville
Indianapolis
Washington, D.C.
Dallas/Ft.Worth
San Francisco Peninsula
2015 TECH-THIRTY | CBRE Research10

FIGURE 5
TECH-THIRTY OFFICE MARKET CYCLE
VancouverWashington, D.C.
BaltimoreSt. Louis
Tech-Thirty Aggregate
Tech-Thirty MarketIndianapolis
PittsburghDetroit
AustinBostonChicagoSeattle
San FranciscoToronto
ManhattanSan Francisco PeninsulaSilicon Valley
AtlantaLos Angeles
Orange CountyPhiladelphia
PhoenixNashville
DenverPortland
Raleigh-DurhamSalt Lake City
Dallas/Ft. WorthMinneapolis
Charlotte
San Diego
2009
2010 2011
2012
2014
2013
2015
In aggregate, the Tech-Thirty moved forward in the office market cycle over the past 12 months and were firmly in the expansion phase in Q2 2015 (Figure 5). By market, positioning did vary significantly. In the U.S., San Francisco was once again furthest along in the cycle, followed by San Francisco Peninsula, Silicon Valley and New York. Portland made the greatest jump from last year, moving from the late stabilization phase to the mid-expansion phase, as it benefited from an active start-up community and from Bay Area tech companies expanding into the region. The two Canadian Tech-Thirty office
markets are at opposite ends of the spectrum; Toronto is in the maturation stage and Vancouver is in the earlier, stabilization phase. Meanwhile, Washington, D.C. and Baltimore continued to lag most other office markets due to federal government and contractor cutbacks and recent years’ high levels of new supply; both markets moved forward in the cycle, however, over the past 12 months.
Vacancy increasing, rents declining, and excess new
supply additions.
Vacancy increasing or decreasing slowly, rents still declining or stable, and limited
or no new supply additions.
Vacancy declining, rents rising at faster pace, and new supply additions
underway or on the horizon.
Vacancy stable with moderate increase/decrease, rents increasing at a slower pace,
and increased new supply additions.
Source: CBRE Research, Q2 2015.
Contraction Stabilization Expansion Maturation
11 © 2015, CBRE, Inc.

Many leading tech submarkets are outperforming the broader office markets in which they are located. Analyzing data from the top tech submarket in each Tech-Thirty office market, we find that tenants are willing to pay a premium to be in the areas that top tech talent prefer. Many of these submarkets also have supply constraints that contribute to low vacancy rates. In Q2 2015, nine of the top tech submarkets had vacancy rates below 5%; none of the broader Tech-Thirty office markets had vacancy rates below this threshold. Vacancy rates were lowest in Mountain View (1.4%), Oakland in Pittsburgh (2.8%), Gas and Yaletown (3.4%), Ann Arbor (4.1%) and East Cambridge (4.1%). Another commonality connecting many of the tightest office submarkets is their proximity to top-tier educational institutions, which foster research and innovation and provide a pool of well-educated workers to local tech companies.
As the high-tech industry expands during the current cycle, the rent premium paid for office space by tenants in the premier tech submarkets widened (Figure 6). Between 2010 and 2011, the average aggregate asking rent in these top submarkets was less than the corresponding rent in the Tech-Thirty office markets as a whole. The leading submarkets’ aggregate rent only surpassed the overall
Tech-Thirty rent in Q1 2012, and the gap has generally increased since then. Indeed, the Q2 2015 premium of 11.1% was the highest of the current cycle, with premier submarket rents higher than their respective overall market rents in 22 of the Tech-Thirty. Rent premiums were significantly higher in several of the strongest tech submarkets, notably East Cambridge (87%), Santa Monica (85%) and Mountain View (73%). On average, vacancy rates in these three submarkets were 660 basis points (bps) lower than their respective market-wide vacancy rates; the same figure for the Tech-Thirty was 280 bps. In several emerging tech submarkets, rent discounts are available; these include Reston/Herndon (-23%), St. Louis CBD (-17%) and Northeast Charlotte (-12%). With rental rates less than the average market rate and a rising pool of talent, these submarkets are poised to attract further tech tenants. Furthermore, with the exception of the Reston/Herndon submarket of Washington, D.C., these submarkets are recording positive—and in some cases strong—rent growth, indicating improving fundamentals and room for growth.
12 2015 TECH-THIRTY | CBRE Research

FIGURE 6
TECH-THIRTY MARKETS AND SUBMARKETS AGGREGATEANNUAL AVERAGE ASKING RENT
Source: CBRE Research, Q2 2015.
$27
$29
$31
$33
$35
$37
$39
Q1 2010
Q2 2010
Q3 2010
Q4 2010
Q1 2011
Q2 2011
Q3 2011
Q4 2011
Q1 2012
Q2 2012
Q3 2012
Q4 2012
Q1 2013
Q2 2013
Q3 2013
Q4 2013
Q1 2014
Q2 2014
Q3 2014
Q4 2014
Q1 2015
Q2 2015
Overall Tech-Thirty Markets Tech-Thirty SubmarketsPSF / Annual
10%
11%
13 © 2015, CBRE, Inc.

14
Technological advancement is increasingly integral to business productivity, and has bolstered the current U.S. economic expansion. Strong business and consumer demand for technology services and tech innovation is expected to support continued hiring among high-tech firms. The Index of Consumer Technology Expectations (Figure 7), which measures anticipated spending on technology, remains on an upward trend—illustrating the avid consumer demand for new and innovative technology. Sustained consumption is a boon to high-tech companies and the office market clusters in which they locate. This trend should further bolster office-using employment among the Tech-Thirty.
Overall, national indicators show economic fundamentals to remain strong, and our outlook calls for continued growth over the next two years. The rapid high-tech industry expansion of the past five years has increased concern over growth sustainability—especially given the tech talent labor shortage—and how high-tech companies will endure business cycle changes. When the next downturn occurs, markets with large technology clusters could experience disproportionately negative effects.
Venture capital (VC) investment, particularly in the software and media/entertainment sectors, remains the
driving force behind the expanding high-tech industry and its impact on Tech-Thirty office markets. The annual level of VC funding in these two sectors nearly doubled from 2013 to 2014, according to data from Thompson Reuters for the PricewaterhouseCoopers/National Venture Capital Association’s MoneyTree Report. Their share of total VC funding also has increased significantly, from less than 40% throughout the dot-com era to more than 50% in 2014 and Q1 2015. A continued high level of VC funding will be critical to sustaining employment and office market growth in tech-driven markets. The trend in San Francisco office asking rents illustrates this, having tracked closely with overall VC funding levels over the past 20 years (Figure 8).
Another of the current cycle’s significant differences from 1999-2000 is the large number of tech companies that remain private rather than filing IPOs. Although the profitability of newly public technology companies has eroded significantly in recent years, according to Jay Ritter—a University of Florida professor who analyzes IPOs—the number of technology IPOs has been a fraction of those at the dot-com era’s peak, when the IPO was the primary exit strategy of many technology firms. The shift toward companies remaining private for longer is evident in the surge in late-stage VC funding in software and
2015 TECH-THIRTY | CBRE Research

FIGURE 7
U.S. INDEX OF CONSUMER TECHNOLOGY EXPECTATIONS(FOR SPENDING)
FIGURE 8
U.S. VENTURE CAPITAL FUNDING FOR SOFTWARE & MEDIA/ENTERTAINMENT SECTOR VS. SAN FRANCISCO OFFICE AVERAGE ASKING RENT
Source: Consumer Electronics Association, July 2015.
Source: PwC MoneyTree and CBRE Research, July 2015.
$10
$20
$30
$40
$50
$60
$70
$0
$5
$10
$15
$20
$25
$30
$35
$40
1995 1996 1997 1998 1999 2000 2001 2002 2003 2004 2005 2006 2007 2008 2009 2010 2011 2012 2013 2014
Billions PSF Annual
Seed Stage (L)
Early Stage (L)
Expansion Stage (L)
Late Stage (L)
San Francisco Annual Avg. Rent (R)
65
70
75
80
85
90
95
100
2007 2008 2009 2010 2011 2012 2013 2014 2015
15 © 2015, CBRE, Inc.

media/entertainment companies, which is now nearly equivalent to dot-com era levels (Figure 9). More than 1,500 late-stage VC tech deals occurred over the past five years, versus 1,100 recorded between 1997 and 2001, although a portion of the more recent count involves some companies raising multiple late-stage rounds of capital funding. The rapidly growing number of “unicorns”—a term intended to reflect the rarity of private companies with valuations of more than $1 billion—has generated fears of overexuberance among investors, particularly given private companies’ lower transparency in comparison to public firms. According to venture capital database CB Insights, there are now 118 unicorn companies, collectively valued at nearly half a trillion dollars; the value increase in the first half of 2015 alone was by 47%. For comparison, in 2009 there were just four unicorns with a combined valuation of $13 billion.
There is a strong link between high-tech funding, high-tech employment and office market growth (Figures 8 and 9). A robust correlation between late-stage VC funding and high-tech hiring has important implications for the office market. Large late-stage funding deals allow companies to scale operations quickly, and expand their employment base. This drives large office expansions and leasing transactions. Investors’ willingness to fund technology companies at rising valuations will be critical for continued growth in high-tech hiring and office space demand in primary tech markets.
Public market indices such as the Shiller S&P 500 Cyclically Adjusted PE (CAPE) ratio also reflect rising valuations (Figure 10). Though the CAPE ratio is a measurement of the broader equity market—rather than just the technology sector—it is an important metric for gauging the overall health of the economy and the financing environment; historically, an above-average ratio has preceded the most significant financial market corrections. The current CAPE ratio exceeds the long-term average; however, it is roughly half of the dot-com peak level and remains below the level corresponding to the 2007 financial market crisis. Also, the CAPE ratio for the technology sector is on par with the ratio for the overall S&P 500, indicating that P/E ratios for large public tech companies are not excessive relative to the broader S&P 500. Strong earnings by many major tech companies continue to hold down P/E ratios within the sector—even amid voracious investor demand.
Supported by consumer demand and the growing number of high-tech integrated businesses, fundamentals remain strong for continued improvement in the high-tech industry. Accordingly, office markets in the Tech-Thirty should expand further in the near term. Being mindful about realistic growth expectations, valuations and viable exit strategies will protect commercial real estate investors from some potential losses that were unforeseen during the last tech boom.
2015 TECH-THIRTY | CBRE Research16

FIGURE 9
U.S. LATE STAGE VENTURE CAPITAL FUNDING FOR SOFTWARE & MEDIA/ENTERTAINMENT SECTOR VS. U.S. HIGH-TECH SOFTWARE/SERVICES JOB GROWTH
FIGURE 10
SHILLER S&P 500 CYCLICALLY ADJUSTED PE RATIO(CAPE RATIO)
Late Stage Venture Capital Funding (L) High-Tech Software/Services Job Growth (R)Billions
Source: PwC MoneyTree, U.S. Bureau of Labor Statistics and CBRE Research, July 2015.
Source: Shiller PE Ratio, July 2015.
Black Tuesday 1929 P/E 33
Black Monday 1987
P/E 18
Dot-com Bubble 2000
P/E 44
Financial Crisis 2007 P/E 28 June, 2015
P/E 26
0
5
10
15
20
25
30
35
40
45
50
1881
18
84
1887
18
90
1893
18
96
1899
19
02
1905
19
08
1911
19
14
1917
19
20
1923
19
26
1929
19
32
1935
19
38
1941
19
44
1947
19
50
1953
19
56
1959
19
62
1965
19
68
1971
19
74
1977
19
80
1983
19
86
1989
19
92
1995
19
98
2001
20
04
2007
20
10
2013
-12%
-10%
-8%
-6%
-4%
-2%
0%
2%
4%
6%
8%
10%
$0
$1
$2
$3
$4
$5
$6
$7
1996 1997 1998 1999 2000 2001 2002 2003 2004 2005 2006 2007 2008 2009 2010 2011 2012 2013 2014
17 © 2015, CBRE, Inc.

Appendix: Tech-Thirty Employment CategoriesData sources used in this report include industry employment data from the U.S. Bureau of Labor Statistics, Statistics Canada, the PriceWaterhouseCoopers/National Venture Capital Association Moneytree Report, the Shiller S&P 500 Cyclically Adjusted PE Ratio (CAPE Ratio), Consumer Electronics Association, and CBRE Research.
18 2015 TECH-THIRTY | CBRE Research18

Bio-Tech includes scientific research and development services, medical equipment and supplies, pharmaceuticals and medicines, and medical and diagnostic laboratories.
Design Services includes architectural and engineering services, and specialized design services.
High-Tech Manufacturing includes computer and electronic products, electrical equipment, and other electrical equipment and components.
High-Tech Services includes computer systems design and related services, software publishers, data processing, hosting and related services, electronic shopping and electronic auctions, and Internet publishing and broadcasting and web search portals.
Media-Entertainment includes motion picture and video production, and advertising and related services.
Office-Using Jobs includes professional and business services, financial activities, and information.
Telecom includes telecommunications.
19 © 2015, CBRE, Inc.

• Nine leases of 100,000 sq. ft. or more were signed through June 2015, six by high-tech tenants. Overall, the high-tech industry accounts for 56% of completed office leases and 54% of the 5.0 million sq. ft. in active space requirements.
• Tech-heavy submarkets are commanding average asking rents that are at least as high as the CBD rents in their respective markets; in Mission Bay/China Basin, they have reached $80 per sq. ft.
• New developments are largely pre-leased, with notable deals including Uber in Mission Bay and Stripe in South of Market.
OFFICE MARKET STATS, Q2 2015
Average Asking RentFS/YR
$67.99
Vacancy Rate 5.7%
New SupplyUnder Construction
4.5 MSF
Top Tech SubmarketRents/Vacancy
SOMA$68.27 / 4.7%
HIGH-TECH INDUSTRY STATS, 2014
EmploymentHigh-Tech Software/Services
56,743
Employment Clustering % of Office-Using Jobs
23.2%
Educational AttainmentResidents w/ BA or higher
53.6%
Labor Cost (MSA)Software Engineer
$118,652 Source: CBRE Research, Q2 2015 and U.S. Bureau of Labor Statistics, July 2015.
605040302010
0
220200180160140120100
SIGNIFICANT OFFICE LEASE DEALS, 2015
Stripe 510 Townsend St. 300,000 SF Uber 555 Market St. 200,000 SFFitbit 199 Fremont St. 163,600 SFSource: CBRE Research, Q2 2015.
High-Tech Software/Service Jobs (L) Office-Using Jobs (R) (Excluding High-Tech)
2001 2002 2003 2004 2005 2006 2007 2008 2009 2010 2011 2012 2013 2014
HOT TOPICS
QUICK STATS
HIGH-TECH SOFTWARE/SERVICES VS. OFFICE-USING JOBS (THOUSANDS)
Source: CBRE Research, Q2 2015. Net absorption growth as a % of market’s inventory
Washington, D.C. (DC) Toronto (TORO)
Baltimore (BALT) Chicago (CHI)
Vancouver (VAN) St. Louis (STL) New York (NY)
Pittsburgh (PIT) Minneapolis (MIN)
San Fran Peninsula (SFP) Denver (DEN) Boston (BOS)
San Diego (SD) Greater Los Angeles (LA)
Indianapolis (IND) Philadelphia (PHL)
Portland (POR) Atlanta (ATL)
Dallas/Ft. Worth (DFW) Orange County (OC)
Detroit (DET) Salt Lake City (SLC) San Francisco (SF) Nashville (NASH)
Seattle (SEA) Charlotte (CLT) Phoenix (PHO)
Raleigh-Durham (R-D) Austin (AUS)
Silicon Valley (SV)
NET ABSORPTION GROWTHOVERALL MARKET, PAST TWO YEARS (Q3 2013 - Q2 2015)
Source: CBRE Research, Q2 2015.-10% 0% 10% 20% 30% 40%
Reston/Herndon (DC) NorthWest (DEN)
BWI (BALT) CBD (STL) CBD (IND)
River North (CHI) Northeast (CLT)
RTP/I-40 Corridor (R-D) North Fulton (ATL) Southvalley (SLC)
Far North Dallas (DFW) Yaletown & Gastown (VAN)
Tempe (PHX) Midtown South (NY)
Oakland (PIT) Toronto Downtown West (TORO)
Sorrento Mesa (SD) CBD (POR)
Ann Arbor (DET) Santa Monica (LA) North Loop (MIN)
University City (PHL) South Orange County (OC)
CBD (NASH) SOMA (SF)
Redwood City (SFP) East Cambridge (BOS)
Lake Union (SEA) Mountain View (SV)
NorthWest (AUS)
RENT GROWTHTOP TECH SUBMARKET, PAST TWO YEARS (Q2 2013 TO Q2 2015)
HIGH-TECH SOFTWARE/SERVICES JOB AND OFFICE RENT GROWTH
High-Tech Job Growth Office Market Rent Growth
Rank MarketCurrent Period
2012-2014Prior Period
2011-2013Current Period
Q2‘13-Q2‘15Prior Period
Q2‘12-Q2‘141 San Francisco (SF) 42.7% 50.9% 30.7% 34.6% 2 Phoenix (PHX) 42.7% 18.6% 8.3% 3.7%3 Austin (AUS) 33.0% 33.7% 11.4% 12.2%4 Silicon Valley (SV) 27.0% 20.0% 28.1% 21.4%5 Nashville (NASH) 22.7% 29.6% 8.9% 8.5%6 New York (NY) 22.6% 22.7% 14.1% 17.5%7 Seattle (SEA) 18.3% 17.0% 9.4% 8.0%8 Indianapolis (IND) 18.0% 20.7% 10.9% 9.5%9 Charlotte (CLT) 17.3% 13.4% 8.0% 4.3%
10 Salt Lake City (SLC) 16.2% 15.6% 8.8% 4.1%11 Portland (POR) 16.1% 12.3% 10.7% 6.1%12 San Francisco Pen. (SFP) 15.0% 30.2% 21.0% 19.3%13 Chicago (CHI) 14.9% 19.3% 6.2% 3.5%14 Raleigh-Durham (R-D) 14.2% 16.8% 23.4% -0.9%15 Pittsburgh (PIT) 14.1% 2.2% 12.4% 1.8%16 Orange County (OC) 12.9% 9.7% 16.1% 5.2%17 Dallas/Ft. Worth (DFW) 10.7% 16.4% 13.4% 12.0%18 Minneapolis (MIN) 10.7% 4.5% 10.9% 7.2%19 Denver (DEN) 10.7% 13.3% 11.8% 12.7%20 Boston (BOS) 8.5% 15.8% 14.4% 11.2%21 St. Louis (STL) 8.5% 24.6% 3.1% 1.4%22 Atlanta (ATL) 7.8% 10.5% 6.1% 3.3%23 San Diego (SD) 7.6% 4.1% 12.7% 8.6%24 Los Angeles (LA) 6.7% 11.9% 4.0% 0.6%25 Toronto (TORO) 5.3% 4.2% 5.0% 0.5%26 Baltimore (BAL) 4.3% 10.0% 1.0% 3.7%27 Detroit (DET) 3.5% 7.7% 2.9% -0.7%28 Philadelphia (PHL) 2.5% 3.9% 3.0% 2.2%29 Vancouver (VAN) 2.4% 18.7% 18.4% 14.3%30 Washington, D.C. (DC) -2.2% 0.8% 3.4% 3.6%
Sources: U.S. Bureau of Labor Statistics and Statistics Canada, July 2015 and CBRE Research, Q2 2015.Ranked by high-tech job growth rate.
San Francisco
2015 TECH-THIRTY | CBRE Research20

• Tech occupiers’ demand for the best amenities in premier locations has caused rental rates in South Scottsdale and Tempe to rise by 20% to 25% over the past 12 months.
• The competitive hiring environment is causing some non-tech users to consider taking space in urban areas with better amenities, in order to better attract millennial workers.
• In South Scottsdale and Tempe, the lack of available space in blocks of 25,000 sq. ft. or more in buildings proximate to walkable amenities has developers jockeying to initiate new projects to chase this demand.
Sources: U.S. Bureau of Labor Statistics and Statistics Canada, July 2015 and CBRE Research, Q2 2015.Ranked by high-tech job growth rate.
OFFICE MARKET STATS, Q2 2015
Average Asking RentFS/YR
$22.06
Vacancy Rate 20.1%
New SupplyUnder Construction
3.6 MSF
Top Tech SubmarketRents/Vacancy
Tempe$22.08 / 11.0%
TECH INDUSTRY STATS, 2014
EmploymentHigh-Tech Software/Services
42,304
Employment Clustering % of Office-Using Jobs
8.6%
Educational AttainmentResidents w/ BA or higher
29.2%
Labor Cost (MSA)Software Engineer
$92,500
SIGNIFICANT OFFICE LEASE DEALS, 2015
Zenefits 40 E. Rio Salado Pkwy. 135,700 SF Infusionsoft 1450 S. Spectrum Blvd. 100,600 SFAmkor Technology 2045 E. Innovation Cir. 96,000 SFSource: CBRE Research, Q2 2015.
Source: CBRE Research, Q2 2015 and U.S. Bureau of Labor Statistics, July 2015.
4540353025201510
530480430380330280
High-Tech Software/Service Jobs (L) Office-Using Jobs (R) (Excluding High-Tech)
2001 2002 2003 2004 2005 2006 2007 2008 2009 2010 2011 2012 2013 2014
HIGH-TECH SOFTWARE/SERVICES VS. OFFICE-USING JOBS (THOUSANDS)
Source: CBRE Research, Q2 2015. Net absorption growth as a % of market’s inventory
Washington, D.C. (DC)
Toronto (TORO) Baltimore (BALT)
Chicago (CHI) Vancouver (VAN)
St. Louis (STL) New York (NY)
Pittsburgh (PIT) Minneapolis (MIN)
San Fran Peninsula (SFP) Denver (DEN) Boston (BOS)
San Diego (SD) Greater Los Angeles (LA)
Indianapolis (IND) Philadelphia (PHL)
Portland (POR) Atlanta (ATL)
Dallas/Ft. Worth (DFW) Orange County (OC)
Detroit (DET) Salt Lake City (SLC) San Francisco (SF) Nashville (NASH)
Seattle (SEA) Charlotte (CLT) Phoenix (PHO)
Raleigh-Durham (R-D) Austin (AUS)
Silicon Valley (SV)
NET ABSORPTION GROWTHOVERALL MARKET, PAST TWO YEARS (Q3 2013 - Q2 2015)
Source: CBRE Research, Q2 2015.-10% 0% 10% 20% 30% 40%
Reston/Herndon (DC) NorthWest (DEN)
BWI (BALT) CBD (STL) CBD (IND)
River North (CHI) Northeast (CLT)
RTP/I-40 Corridor (R-D) North Fulton (ATL) Southvalley (SLC)
Far North Dallas (DFW) Yaletown & Gastown (VAN)
Tempe (PHX) Midtown South (NY)
Oakland (PIT) Toronto Downtown West (TORO)
Sorrento Mesa (SD) CBD (POR)
Ann Arbor (DET) Santa Monica (LA) North Loop (MIN)
University City (PHL) South Orange County (OC)
CBD (NASH) SOMA (SF)
Redwood City (SFP) East Cambridge (BOS)
Lake Union (SEA) Mountain View (SV)
RENT GROWTHTOP TECH SUBMARKET, PAST TWO YEARS (Q2 2013 TO Q2 2015)
NorthWest (AUS)
HOT TOPICS
QUICK STATS
HIGH-TECH SOFTWARE/SERVICES JOB AND OFFICE RENT GROWTH
High-Tech Job Growth Office Market Rent Growth
Rank MarketCurrent Period
2012-2014Prior Period
2011-2013Current Period
Q2‘13-Q2‘15Prior Period
Q2‘12-Q2‘141 San Francisco (SF) 42.7% 50.9% 30.7% 34.6% 2 Phoenix (PHX) 42.7% 18.6% 8.3% 3.7%3 Austin (AUS) 33.0% 33.7% 11.4% 12.2%4 Silicon Valley (SV) 27.0% 20.0% 28.1% 21.4%5 Nashville (NASH) 22.7% 29.6% 8.9% 8.5%6 New York (NY) 22.6% 22.7% 14.1% 17.5%7 Seattle (SEA) 18.3% 17.0% 9.4% 8.0%8 Indianapolis (IND) 18.0% 20.7% 10.9% 9.5%9 Charlotte (CLT) 17.3% 13.4% 8.0% 4.3%
10 Salt Lake City (SLC) 16.2% 15.6% 8.8% 4.1%11 Portland (POR) 16.1% 12.3% 10.7% 6.1%12 San Francisco Pen. (SFP) 15.0% 30.2% 21.0% 19.3%13 Chicago (CHI) 14.9% 19.3% 6.2% 3.5%14 Raleigh-Durham (R-D) 14.2% 16.8% 23.4% -0.9%15 Pittsburgh (PIT) 14.1% 2.2% 12.4% 1.8%16 Orange County (OC) 12.9% 9.7% 16.1% 5.2%17 Dallas/Ft. Worth (DFW) 10.7% 16.4% 13.4% 12.0%18 Minneapolis (MIN) 10.7% 4.5% 10.9% 7.2%19 Denver (DEN) 10.7% 13.3% 11.8% 12.7%20 Boston (BOS) 8.5% 15.8% 14.4% 11.2%21 St. Louis (STL) 8.5% 24.6% 3.1% 1.4%22 Atlanta (ATL) 7.8% 10.5% 6.1% 3.3%23 San Diego (SD) 7.6% 4.1% 12.7% 8.6%24 Los Angeles (LA) 6.7% 11.9% 4.0% 0.6%25 Toronto (TORO) 5.3% 4.2% 5.0% 0.5%26 Baltimore (BAL) 4.3% 10.0% 1.0% 3.7%27 Detroit (DET) 3.5% 7.7% 2.9% -0.7%28 Philadelphia (PHL) 2.5% 3.9% 3.0% 2.2%29 Vancouver (VAN) 2.4% 18.7% 18.4% 14.3%30 Washington, D.C. (DC) -2.2% 0.8% 3.4% 3.6%
Phoenix
21 © 2015, CBRE, Inc.

• One of Austin’s premier high-tech companies expanded again in Q1 2015, signing a 207,000 sq. ft. lease in Austin’s CBD.
• Austin’s high-tech occupiers long tended to cluster in the suburban markets of the Northwest, near Dell and IBM, but that changed when a major internet-based company first came to the CBD in 2008.
• More than 100 high-tech companies are now located in the Austin CBD, where developers have responded to the tight market. The CBD now has the metro’s highest concentration of office space under construction, with nearly 670,000 sq. ft. underway.
Sources: U.S. Bureau of Labor Statistics and Statistics Canada, July 2015 and CBRE Research, Q2 2015.Ranked by high-tech job growth rate.
OFFICE MARKET STATS, Q2 2015
Average Asking RentFS/YR
$31.33
Vacancy Rate 11.9%
New SupplyUnder Construction
2.2 MSF
Top Tech SubmarketRents/Vacancy
Northwest$30.59 / 10.3%
HIGH-TECH INDUSTRY STATS, 2014
EmploymentHigh-Tech Software/Services
37,541
Employment Clustering % of Office-Using Jobs
16.8%
Educational AttainmentResidents w/ BA or higher
43.0%
Labor Cost (MSA)Software Engineer
$96,559
SIGNIFICANT OFFICE LEASE DEALS, 2015
Confidential 320 Capital of Texas Hwy. 217,500 SF Confidential 500 W. 2nd St. 207,000 SFIndeed 6500 N. Capital of Texas Hwy. 172,500 SFSource: CBRE Research, Q2 2015.
Source: CBRE Research, Q2 2015 and U.S. Bureau of Labor Statistics, July 2015.
403530252015
200190180170160150140130120110100
High-Tech Software/Service Jobs (L) Office-Using Jobs (R) (Excluding High-Tech)
2001 2002 2003 2004 2005 2006 2007 2008 2009 2010 2011 2012 2013 2014
HIGH-TECH SOFTWARE/SERVICES VS. OFFICE-USING JOBS (THOUSANDS)
Source: CBRE Research, Q2 2015. Net absorption growth as a % of market’s inventory
Washington, D.C. (DC)
Toronto (TORO) Baltimore (BALT)
Chicago (CHI) Vancouver (VAN)
St. Louis (STL) New York (NY)
Pittsburgh (PIT) Minneapolis (MIN)
San Fran Peninsula (SFP) Denver (DEN) Boston (BOS)
San Diego (SD) Greater Los Angeles (LA)
Indianapolis (IND) Philadelphia (PHL)
Portland (POR) Atlanta (ATL)
Dallas/Ft. Worth (DFW) Orange County (OC)
Detroit (DET) Salt Lake City (SLC) San Francisco (SF) Nashville (NASH)
Seattle (SEA) Charlotte (CLT) Phoenix (PHO)
Raleigh-Durham (R-D) Austin (AUS)
Silicon Valley (SV)
NET ABSORPTION GROWTHOVERALL MARKET, PAST TWO YEARS (Q3 2013 - Q2 2015)
Source: CBRE Research, Q2 2015.-10% 0% 10% 20% 30% 40%
Reston/Herndon (DC)
BWI (BALT) CBD (STL) CBD (IND)
River North (CHI) Northeast (CLT)
RTP/I-40 Corridor (R-D) North Fulton (ATL) Southvalley (SLC)
Far North Dallas (DFW) Yaletown & Gastown (VAN)
Tempe (PHX) Midtown South (NY)
Oakland (PIT) Toronto Downtown West (TORO)
Sorrento Mesa (SD) CBD (POR)
Ann Arbor (DET) Santa Monica (LA) North Loop (MIN)
University City (PHL) South Orange County (OC)
CBD (NASH) SOMA (SF)
Redwood City (SFP) East Cambridge (BOS)
Lake Union (SEA) Mountain View (SV)
RENT GROWTHTOP TECH SUBMARKET, PAST TWO YEARS (Q2 2013 TO Q2 2015)
NorthWest (AUS)
HOT TOPICS
QUICK STATS
HIGH-TECH SOFTWARE/SERVICES JOB AND OFFICE RENT GROWTH
High-Tech Job Growth Office Market Rent Growth
Rank MarketCurrent Period
2012-2014Prior Period
2011-2013Current Period
Q2‘13-Q2‘15Prior Period
Q2‘12-Q2‘141 San Francisco (SF) 42.7% 50.9% 30.7% 34.6% 2 Phoenix (PHX) 42.7% 18.6% 8.3% 3.7%3 Austin (AUS) 33.0% 33.7% 11.4% 12.2%4 Silicon Valley (SV) 27.0% 20.0% 28.1% 21.4%5 Nashville (NASH) 22.7% 29.6% 8.9% 8.5%6 New York (NY) 22.6% 22.7% 14.1% 17.5%7 Seattle (SEA) 18.3% 17.0% 9.4% 8.0%8 Indianapolis (IND) 18.0% 20.7% 10.9% 9.5%9 Charlotte (CLT) 17.3% 13.4% 8.0% 4.3%
10 Salt Lake City (SLC) 16.2% 15.6% 8.8% 4.1%11 Portland (POR) 16.1% 12.3% 10.7% 6.1%12 San Francisco Pen. (SFP) 15.0% 30.2% 21.0% 19.3%13 Chicago (CHI) 14.9% 19.3% 6.2% 3.5%14 Raleigh-Durham (R-D) 14.2% 16.8% 23.4% -0.9%15 Pittsburgh (PIT) 14.1% 2.2% 12.4% 1.8%16 Orange County (OC) 12.9% 9.7% 16.1% 5.2%17 Dallas/Ft. Worth (DFW) 10.7% 16.4% 13.4% 12.0%18 Minneapolis (MIN) 10.7% 4.5% 10.9% 7.2%19 Denver (DEN) 10.7% 13.3% 11.8% 12.7%20 Boston (BOS) 8.5% 15.8% 14.4% 11.2%21 St. Louis (STL) 8.5% 24.6% 3.1% 1.4%22 Atlanta (ATL) 7.8% 10.5% 6.1% 3.3%23 San Diego (SD) 7.6% 4.1% 12.7% 8.6%24 Los Angeles (LA) 6.7% 11.9% 4.0% 0.6%25 Toronto (TORO) 5.3% 4.2% 5.0% 0.5%26 Baltimore (BAL) 4.3% 10.0% 1.0% 3.7%27 Detroit (DET) 3.5% 7.7% 2.9% -0.7%28 Philadelphia (PHL) 2.5% 3.9% 3.0% 2.2%29 Vancouver (VAN) 2.4% 18.7% 18.4% 14.3%30 Washington, D.C. (DC) -2.2% 0.8% 3.4% 3.6%
Austin
Northwest (DEN)
2015 TECH-THIRTY | CBRE Research22

• Since the beginning of 2014, 4.6 million sq. ft. in new development projects has been pre-leased, 99.5% by tech companies.
• Severe space constraints have caused many tech companies to expand southward into areas like Santa Clara and North San Jose.
• These areas offer large blocks of new construction, as well as rents that are much lower than those in Palo Alto, Mountain View and San Francisco.
Sources: U.S. Bureau of Labor Statistics and Statistics Canada, July 2015 and CBRE Research, Q2 2015.Ranked by high-tech job growth rate.
OFFICE MARKET STATS, Q2 2015
Average Asking RentFS/YR
$49.20
Vacancy Rate 7.2%
New SupplyUnder Construction
8.7 MSF
Top Tech SubmarketRents/Vacancy
Mountain View$85.14 / 1.4%
TECH INDUSTRY STATS, 2014
EmploymentHigh-Tech Software/Services
119,722
Employment Clustering % of Office-Using Jobs
39.9%
Educational AttainmentResidents w/ BA or higher
47.1%
Labor Cost (MSA)Software Engineer
$140,614
SIGNIFICANT OFFICE LEASE DEALS, 2015
Palo Alto Networks 3325 Scott Blvd. 722,000 SF LinkedIn 391 San Antonio Rd. 456,600 SFConfidential 505 Mathilda Ave. 424,000 SFSource: CBRE Research, Q2 2015.
Source: CBRE Research, Q2 2015 and U.S. Bureau of Labor Statistics, July 2015.
130120110100
9080706050
210200190180170160150140130120
High-Tech Software/Service Jobs (L) Office-Using Jobs (R) (Excluding High-Tech)
2001 2002 2003 2004 2005 2006 2007 2008 2009 2010 2011 2012 2013 2014
HIGH-TECH SOFTWARE/SERVICES VS. OFFICE-USING JOBS (THOUSANDS)
Source: CBRE Research, Q2 2015. Net absorption growth as a % of market’s inventory
Washington, D.C. (DC)
Toronto (TORO) Baltimore (BALT)
Chicago (CHI) Vancouver (VAN)
St. Louis (STL) New York (NY)
Pittsburgh (PIT) Minneapolis (MIN)
San Fran Peninsula (SFP) Denver (DEN) Boston (BOS)
San Diego (SD) Greater Los Angeles (LA)
Indianapolis (IND) Philadelphia (PHL)
Portland (POR) Atlanta (ATL)
Dallas/Ft. Worth (DFW) Orange County (OC)
Detroit (DET) Salt Lake City (SLC) San Francisco (SF) Nashville (NASH)
Seattle (SEA) Charlotte (CLT) Phoenix (PHO)
Raleigh-Durham (R-D) Austin (AUS)
Silicon Valley (SV)
NET ABSORPTION GROWTHOVERALL MARKET, PAST TWO YEARS (Q3 2013 - Q2 2015)
Source: CBRE Research, Q2 2015.-10% 0% 10% 20% 30% 40%
Reston/Herndon (DC) NorthWest (DEN)
BWI (BALT) CBD (STL) CBD (IND)
River North (CHI) Northeast (CLT)
RTP/I-40 Corridor (R-D) North Fulton (ATL) Southvalley (SLC)
Far North Dallas (DFW) Yaletown & Gastown (VAN)
Tempe (PHX) Midtown South (NY)
Oakland (PIT) Toronto Downtown West (TORO)
Sorrento Mesa (SD) CBD (POR)
Ann Arbor (DET) Santa Monica (LA) North Loop (MIN)
University City (PHL) South Orange County (OC)
CBD (NASH) SOMA (SF)
Redwood City (SFP) East Cambridge (BOS)
Lake Union (SEA) Mountain View (SV)
RENT GROWTHTOP TECH SUBMARKET, PAST TWO YEARS (Q2 2013 TO Q2 2015)
NorthWest (AUS)
HOT TOPICS
QUICK STATS
HIGH-TECH SOFTWARE/SERVICES JOB AND OFFICE RENT GROWTH
High-Tech Job Growth Office Market Rent Growth
Rank MarketCurrent Period
2012-2014Prior Period
2011-2013Current Period
Q2‘13-Q2‘15Prior Period
Q2‘12-Q2‘141 San Francisco (SF) 42.7% 50.9% 30.7% 34.6% 2 Phoenix (PHX) 42.7% 18.6% 8.3% 3.7%3 Austin (AUS) 33.0% 33.7% 11.4% 12.2%4 Silicon Valley (SV) 27.0% 20.0% 28.1% 21.4%5 Nashville (NASH) 22.7% 29.6% 8.9% 8.5%6 New York (NY) 22.6% 22.7% 14.1% 17.5%7 Seattle (SEA) 18.3% 17.0% 9.4% 8.0%8 Indianapolis (IND) 18.0% 20.7% 10.9% 9.5%9 Charlotte (CLT) 17.3% 13.4% 8.0% 4.3%
10 Salt Lake City (SLC) 16.2% 15.6% 8.8% 4.1%11 Portland (POR) 16.1% 12.3% 10.7% 6.1%12 San Francisco Pen. (SFP) 15.0% 30.2% 21.0% 19.3%13 Chicago (CHI) 14.9% 19.3% 6.2% 3.5%14 Raleigh-Durham (R-D) 14.2% 16.8% 23.4% -0.9%15 Pittsburgh (PIT) 14.1% 2.2% 12.4% 1.8%16 Orange County (OC) 12.9% 9.7% 16.1% 5.2%17 Dallas/Ft. Worth (DFW) 10.7% 16.4% 13.4% 12.0%18 Minneapolis (MIN) 10.7% 4.5% 10.9% 7.2%19 Denver (DEN) 10.7% 13.3% 11.8% 12.7%20 Boston (BOS) 8.5% 15.8% 14.4% 11.2%21 St. Louis (STL) 8.5% 24.6% 3.1% 1.4%22 Atlanta (ATL) 7.8% 10.5% 6.1% 3.3%23 San Diego (SD) 7.6% 4.1% 12.7% 8.6%24 Los Angeles (LA) 6.7% 11.9% 4.0% 0.6%25 Toronto (TORO) 5.3% 4.2% 5.0% 0.5%26 Baltimore (BAL) 4.3% 10.0% 1.0% 3.7%27 Detroit (DET) 3.5% 7.7% 2.9% -0.7%28 Philadelphia (PHL) 2.5% 3.9% 3.0% 2.2%29 Vancouver (VAN) 2.4% 18.7% 18.4% 14.3%30 Washington, D.C. (DC) -2.2% 0.8% 3.4% 3.6%
Silicon Valley
23 © 2015, CBRE, Inc.

• Although Nashville’s tech industry is small, it is growing quickly and claims the largest percentage of projected IT growth in Tennessee.
• Venture capital funding in Nashville has increased consistently over the past three years, reaching $153 million in 2014, according to the PWC MoneyTree Report. This funding growth will fuel tech industry expansion and office space demand.
• Super fast internet is coming to Nashville; the city is one of just eight major metros with the service already online or underway. Its presence should foster innovation and attract additional tech companies.
Sources: U.S. Bureau of Labor Statistics and Statistics Canada, July 2015 and CBRE Research, Q2 2015.Ranked by high-tech job growth rate.
OFFICE MARKET STATS, Q2 2015
Average Asking RentFS/YR
$20.46
Vacancy Rate 8.3%
New SupplyUnder Construction
1.7 MSF
Top Tech SubmarketRents/Vacancy
CBD$23.17 / 14.1%
HIGH-TECH INDUSTRY STATS, 2014
EmploymentHigh-Tech Software/Services
11,427
Employment Clustering % of Office-Using Jobs
7.1%
Educational AttainmentResidents w/ BA or higher
38.9%
Labor Cost (MSA)Software Engineer
$84,247
SIGNIFICANT OFFICE LEASE DEALS, 2015
ForceX 2200 Charlotte Ave. 36,000 SF Uniguest 2926 Kraft Dr. 33,000 SFUber 209 7th Ave. N 4,000 SFSource: CBRE Research, Q2 2015.
Source: CBRE Research, Q2 2015 and U.S. Bureau of Labor Statistics, July 2015.
121110
987654
160150140
10120110100
9080
High-Tech Software/Service Jobs (L) Office-Using Jobs (R) (Excluding High-Tech)
2001 2002 2003 2004 2005 2006 2007 2008 2009 2010 2011 2012 2013 2014
HIGH-TECH SOFTWARE/SERVICES VS. OFFICE-USING JOBS (THOUSANDS)
Source: CBRE Research, Q2 2015.-10% 0% 10% 20% 30% 40%
Reston/Herndon (DC) NorthWest (DEN)
BWI (BALT) CBD (STL) CBD (IND)
River North (CHI) Northeast (CLT)
RTP/I-40 Corridor (R-D) North Fulton (ATL) Southvalley (SLC)
Far North Dallas (DFW) Yaletown & Gastown (VAN)
Tempe (PHX) Midtown South (NY)
Oakland (PIT) Toronto Downtown West (TORO)
Sorrento Mesa (SD) CBD (POR)
Ann Arbor (DET) Santa Monica (LA) North Loop (MIN)
University City (PHL) South Orange County (OC)
CBD (NASH) SOMA (SF)
Redwood City (SFP) East Cambridge (BOS)
Lake Union (SEA) Mountain View (SV)
RENT GROWTHTOP TECH SUBMARKET, PAST TWO YEARS (Q2 2013 TO Q2 2015)
NorthWest (AUS)
HOT TOPICS
QUICK STATS
Source: CBRE Research, Q2 2015. Net absorption growth as a % of market’s inventory
Washington, D.C. (DC) Toronto (TORO)
Baltimore (BALT) Chicago (CHI)
Vancouver (VAN) St. Louis (STL) New York (NY)
Pittsburgh (PIT) Minneapolis (MIN)
San Fran Peninsula (SFP) Denver (DEN) Boston (BOS)
San Diego (SD) Greater Los Angeles (LA)
Indianapolis (IND) Philadelphia (PHL)
Portland (POR) Atlanta (ATL)
Dallas/Ft. Worth (DFW) Orange County (OC)
Detroit (DET) Salt Lake City (SLC) San Francisco (SF) Nashville (NASH)
Seattle (SEA) Charlotte (CLT) Phoenix (PHO)
Raleigh-Durham (R-D) Austin (AUS)
Silicon Valley (SV)
NET ABSORPTION GROWTHOVERALL MARKET, PAST TWO YEARS (Q3 2013 - Q2 2015)
HIGH-TECH SOFTWARE/SERVICES JOB AND OFFICE RENT GROWTH
High-Tech Job Growth Office Market Rent Growth
Rank MarketCurrent Period
2012-2014Prior Period
2011-2013Current Period
Q2‘13-Q2‘15Prior Period
Q2‘12-Q2‘141 San Francisco (SF) 42.7% 50.9% 30.7% 34.6% 2 Phoenix (PHX) 42.7% 18.6% 8.3% 3.7%3 Austin (AUS) 33.0% 33.7% 11.4% 12.2%4 Silicon Valley (SV) 27.0% 20.0% 28.1% 21.4%5 Nashville (NASH) 22.7% 29.6% 8.9% 8.5%6 New York (NY) 22.6% 22.7% 14.1% 17.5%7 Seattle (SEA) 18.3% 17.0% 9.4% 8.0%8 Indianapolis (IND) 18.0% 20.7% 10.9% 9.5%9 Charlotte (CLT) 17.3% 13.4% 8.0% 4.3%
10 Salt Lake City (SLC) 16.2% 15.6% 8.8% 4.1%11 Portland (POR) 16.1% 12.3% 10.7% 6.1%12 San Francisco Pen. (SFP) 15.0% 30.2% 21.0% 19.3%13 Chicago (CHI) 14.9% 19.3% 6.2% 3.5%14 Raleigh-Durham (R-D) 14.2% 16.8% 23.4% -0.9%15 Pittsburgh (PIT) 14.1% 2.2% 12.4% 1.8%16 Orange County (OC) 12.9% 9.7% 16.1% 5.2%17 Dallas/Ft. Worth (DFW) 10.7% 16.4% 13.4% 12.0%18 Minneapolis (MIN) 10.7% 4.5% 10.9% 7.2%19 Denver (DEN) 10.7% 13.3% 11.8% 12.7%20 Boston (BOS) 8.5% 15.8% 14.4% 11.2%21 St. Louis (STL) 8.5% 24.6% 3.1% 1.4%22 Atlanta (ATL) 7.8% 10.5% 6.1% 3.3%23 San Diego (SD) 7.6% 4.1% 12.7% 8.6%24 Los Angeles (LA) 6.7% 11.9% 4.0% 0.6%25 Toronto (TORO) 5.3% 4.2% 5.0% 0.5%26 Baltimore (BAL) 4.3% 10.0% 1.0% 3.7%27 Detroit (DET) 3.5% 7.7% 2.9% -0.7%28 Philadelphia (PHL) 2.5% 3.9% 3.0% 2.2%29 Vancouver (VAN) 2.4% 18.7% 18.4% 14.3%30 Washington, D.C. (DC) -2.2% 0.8% 3.4% 3.6%
Nashville
2015 TECH-THIRTY | CBRE Research24

• High-tech leasing activity remains the driving force of office occupancy in Midtown South Manhattan; through June 2015, 1.2 million sq. ft. of space was leased by tech companies. Fifty-four percent was in Midtown South.
• With available space limited, tech companies are being pushed into other submarkets; in Midtown South, space larger than 10,000 sq. ft. will not be available for another three years.
• Rental rates in this top tech submarket continue to reach all-time highs – tech tenants’ average base rent is more than $70 per sq. ft.
Sources: U.S. Bureau of Labor Statistics and Statistics Canada, July 2015 and CBRE Research, Q2 2015.Ranked by high-tech job growth rate.
OFFICE MARKET STATS, Q2 2015
Average Asking RentFS/YR
$69.71
Vacancy Rate 7.1%
New SupplyUnder Construction
9.3 MSF
Top Tech SubmarketRents/Vacancy
Midtown South$70.09 / 5.0%
TECH INDUSTRY STATS, 2014
EmploymentHigh-Tech Software/Services
86,012
Employment Clustering % of Office-Using Jobs
8.3%
Educational AttainmentResidents w/ BA or higher
60.4%
Labor Cost (MSA)Software Engineer
$111,682
SIGNIFICANT OFFICE LEASE DEALS, 2015
PayPal 95 Morton St. 95,100 SF PlaceIQ, Inc. 5 Bryant Park 45,300 SFSoundCloud 50 W 23rd St. 43,100 SFSource: CBRE Research, Q2 2015.
Source: CBRE Research, Q2 2015 and U.S. Bureau of Labor Statistics, July 2015.
90807060504030
1000950900850800750
High-Tech Software/Service Jobs (L) Office-Using Jobs (R) (Excluding High-Tech)
2001 2002 2003 2004 2005 2006 2007 2008 2009 2010 2011 2012 2013 2014
HIGH-TECH SOFTWARE/SERVICES VS. OFFICE-USING JOBS (THOUSANDS)
Source: CBRE Research, Q2 2015. Net absorption growth as a % of market’s inventory
Washington, D.C. (DC)
Toronto (TORO) Baltimore (BALT)
Chicago (CHI) Vancouver (VAN)
St. Louis (STL) New York (NY)
Pittsburgh (PIT) Minneapolis (MIN)
San Fran Peninsula (SFP) Denver (DEN) Boston (BOS)
San Diego (SD) Greater Los Angeles (LA)
Indianapolis (IND) Philadelphia (PHL)
Portland (POR) Atlanta (ATL)
Dallas/Ft. Worth (DFW) Orange County (OC)
Detroit (DET) Salt Lake City (SLC) San Francisco (SF) Nashville (NASH)
Seattle (SEA) Charlotte (CLT) Phoenix (PHO)
Raleigh-Durham (R-D) Austin (AUS)
Silicon Valley (SV)
NET ABSORPTION GROWTHOVERALL MARKET, PAST TWO YEARS (Q3 2013 - Q2 2015)
Source: CBRE Research, Q2 2015.-10% 0% 10% 20% 30% 40%
Reston/Herndon (DC) NorthWest (DEN)
BWI (BALT) CBD (STL) CBD (IND)
River North (CHI) Northeast (CLT)
RTP/I-40 Corridor (R-D) North Fulton (ATL) Southvalley (SLC)
Far North Dallas (DFW) Yaletown & Gastown (VAN)
Tempe (PHX) Midtown South (NY)
Oakland (PIT) Toronto Downtown West (TORO)
Sorrento Mesa (SD) CBD (POR)
Ann Arbor (DET) Santa Monica (LA) North Loop (MIN)
University City (PHL) South Orange County (OC)
CBD (NASH) SOMA (SF)
Redwood City (SFP) East Cambridge (BOS)
Lake Union (SEA) Mountain View (SV)
RENT GROWTHTOP TECH SUBMARKET, PAST TWO YEARS (Q2 2013 TO Q2 2015)
NorthWest (AUS)
HOT TOPICS
QUICK STATS
HIGH-TECH SOFTWARE/SERVICES JOB AND OFFICE RENT GROWTH
High-Tech Job Growth Office Market Rent Growth
Rank MarketCurrent Period
2012-2014Prior Period
2011-2013Current Period
Q2‘13-Q2‘15Prior Period
Q2‘12-Q2‘141 San Francisco (SF) 42.7% 50.9% 30.7% 34.6% 2 Phoenix (PHX) 42.7% 18.6% 8.3% 3.7%3 Austin (AUS) 33.0% 33.7% 11.4% 12.2%4 Silicon Valley (SV) 27.0% 20.0% 28.1% 21.4%5 Nashville (NASH) 22.7% 29.6% 8.9% 8.5%6 New York (NY) 22.6% 22.7% 14.1% 17.5%7 Seattle (SEA) 18.3% 17.0% 9.4% 8.0%8 Indianapolis (IND) 18.0% 20.7% 10.9% 9.5%9 Charlotte (CLT) 17.3% 13.4% 8.0% 4.3%
10 Salt Lake City (SLC) 16.2% 15.6% 8.8% 4.1%11 Portland (POR) 16.1% 12.3% 10.7% 6.1%12 San Francisco Pen. (SFP) 15.0% 30.2% 21.0% 19.3%13 Chicago (CHI) 14.9% 19.3% 6.2% 3.5%14 Raleigh-Durham (R-D) 14.2% 16.8% 23.4% -0.9%15 Pittsburgh (PIT) 14.1% 2.2% 12.4% 1.8%16 Orange County (OC) 12.9% 9.7% 16.1% 5.2%17 Dallas/Ft. Worth (DFW) 10.7% 16.4% 13.4% 12.0%18 Minneapolis (MIN) 10.7% 4.5% 10.9% 7.2%19 Denver (DEN) 10.7% 13.3% 11.8% 12.7%20 Boston (BOS) 8.5% 15.8% 14.4% 11.2%21 St. Louis (STL) 8.5% 24.6% 3.1% 1.4%22 Atlanta (ATL) 7.8% 10.5% 6.1% 3.3%23 San Diego (SD) 7.6% 4.1% 12.7% 8.6%24 Los Angeles (LA) 6.7% 11.9% 4.0% 0.6%25 Toronto (TORO) 5.3% 4.2% 5.0% 0.5%26 Baltimore (BAL) 4.3% 10.0% 1.0% 3.7%27 Detroit (DET) 3.5% 7.7% 2.9% -0.7%28 Philadelphia (PHL) 2.5% 3.9% 3.0% 2.2%29 Vancouver (VAN) 2.4% 18.7% 18.4% 14.3%30 Washington, D.C. (DC) -2.2% 0.8% 3.4% 3.6%
New York
25 © 2015, CBRE, Inc.

• The past 12 months have seen more than 3.0 million sq. ft. of new leasing activity by tech tenants, accounting for 41% of the total square footage leased.
• Competition for tech talent is a central theme in occupiers’ workplace strategies.
• The University of Washington and Tsinghua University have partnered to create the Global Innovation Exchange (GIX), an institute with the goal of educating the next generation of innovators. GIX is finalizing a lease to initially occupy 100,000 sq. ft. at the Spring District.
Sources: U.S. Bureau of Labor Statistics and Statistics Canada, July 2015 and CBRE Research, Q2 2015.Ranked by high-tech job growth rate.
OFFICE MARKET STATS, Q2 2015
Average Asking RentFS/YR
$32.39
Vacancy Rate 12.8%
New SupplyUnder Construction
6.5 MSF
Top Tech SubmarketRents/Vacancy
Lake Union$42.02 / 10.6%
HIGH-TECH INDUSTRY STATS, 2014
EmploymentHigh-Tech Software/Services
121,672
Employment Clustering % of Office-Using Jobs
34.2%
Educational AttainmentResidents w/ BA or higher
45.9%
Labor Cost (MSA)Software Engineer
$117,192
SIGNIFICANT OFFICE LEASE DEALS, 2015
Confidential 307 Fairview Ave. N 800,000 SF Expedia 1201 Amgen Ct. W 550,000 SFFacebook 1101 Dexter Ave. N 274,000 SFSource: CBRE Research, Q2 2015.
Source: CBRE Research, Q2 2015 and U.S. Bureau of Labor Statistics, July 2015.
130120110100
9080706050
270260250240230220210200
High-Tech Software/Service Jobs (L) Office-Using Jobs (R) (Excluding High-Tech)
2001 2002 2003 2004 2005 2006 2007 2008 2009 2010 2011 2012 2013 2014
HIGH-TECH SOFTWARE/SERVICES VS. OFFICE-USING JOBS (THOUSANDS)
Source: CBRE Research, Q2 2015. Net absorption growth as a % of market’s inventory
Washington, D.C. (DC)
Toronto (TORO) Baltimore (BALT)
Chicago (CHI) Vancouver (VAN)
St. Louis (STL) New York (NY)
Pittsburgh (PIT) Minneapolis (MIN)
San Fran Peninsula (SFP) Denver (DEN) Boston (BOS)
San Diego (SD) Greater Los Angeles (LA)
Indianapolis (IND) Philadelphia (PHL)
Portland (POR) Atlanta (ATL)
Dallas/Ft. Worth (DFW) Orange County (OC)
Detroit (DET) Salt Lake City (SLC) San Francisco (SF) Nashville (NASH)
Seattle (SEA) Charlotte (CLT) Phoenix (PHO)
Raleigh-Durham (R-D) Austin (AUS)
Silicon Valley (SV)
NET ABSORPTION GROWTHOVERALL MARKET, PAST TWO YEARS (Q3 2013 - Q2 2015)
Source: CBRE Research, Q2 2015.-10% 0% 10% 20% 30% 40%
Reston/Herndon (DC) NorthWest (DEN)
BWI (BALT) CBD (STL) CBD (IND)
River North (CHI) Northeast (CLT)
RTP/I-40 Corridor (R-D) North Fulton (ATL) Southvalley (SLC)
Far North Dallas (DFW) Yaletown & Gastown (VAN)
Tempe (PHX) Midtown South (NY)
Oakland (PIT) Toronto Downtown West (TORO)
Sorrento Mesa (SD) CBD (POR)
Ann Arbor (DET) Santa Monica (LA) North Loop (MIN)
University City (PHL) South Orange County (OC)
CBD (NASH) SOMA (SF)
Redwood City (SFP) East Cambridge (BOS)
Lake Union (SEA) Mountain View (SV)
RENT GROWTHTOP TECH SUBMARKET, PAST TWO YEARS (Q2 2013 TO Q2 2015)
NorthWest (AUS)
HOT TOPICS
QUICK STATS
HIGH-TECH SOFTWARE/SERVICES JOB AND OFFICE RENT GROWTH
High-Tech Job Growth Office Market Rent Growth
Rank MarketCurrent Period
2012-2014Prior Period
2011-2013Current Period
Q2‘13-Q2‘15Prior Period
Q2‘12-Q2‘141 San Francisco (SF) 42.7% 50.9% 30.7% 34.6% 2 Phoenix (PHX) 42.7% 18.6% 8.3% 3.7%3 Austin (AUS) 33.0% 33.7% 11.4% 12.2%4 Silicon Valley (SV) 27.0% 20.0% 28.1% 21.4%5 Nashville (NASH) 22.7% 29.6% 8.9% 8.5%6 New York (NY) 22.6% 22.7% 14.1% 17.5%7 Seattle (SEA) 18.3% 17.0% 9.4% 8.0%8 Indianapolis (IND) 18.0% 20.7% 10.9% 9.5%9 Charlotte (CLT) 17.3% 13.4% 8.0% 4.3%
10 Salt Lake City (SLC) 16.2% 15.6% 8.8% 4.1%11 Portland (POR) 16.1% 12.3% 10.7% 6.1%12 San Francisco Pen. (SFP) 15.0% 30.2% 21.0% 19.3%13 Chicago (CHI) 14.9% 19.3% 6.2% 3.5%14 Raleigh-Durham (R-D) 14.2% 16.8% 23.4% -0.9%15 Pittsburgh (PIT) 14.1% 2.2% 12.4% 1.8%16 Orange County (OC) 12.9% 9.7% 16.1% 5.2%17 Dallas/Ft. Worth (DFW) 10.7% 16.4% 13.4% 12.0%18 Minneapolis (MIN) 10.7% 4.5% 10.9% 7.2%19 Denver (DEN) 10.7% 13.3% 11.8% 12.7%20 Boston (BOS) 8.5% 15.8% 14.4% 11.2%21 St. Louis (STL) 8.5% 24.6% 3.1% 1.4%22 Atlanta (ATL) 7.8% 10.5% 6.1% 3.3%23 San Diego (SD) 7.6% 4.1% 12.7% 8.6%24 Los Angeles (LA) 6.7% 11.9% 4.0% 0.6%25 Toronto (TORO) 5.3% 4.2% 5.0% 0.5%26 Baltimore (BAL) 4.3% 10.0% 1.0% 3.7%27 Detroit (DET) 3.5% 7.7% 2.9% -0.7%28 Philadelphia (PHL) 2.5% 3.9% 3.0% 2.2%29 Vancouver (VAN) 2.4% 18.7% 18.4% 14.3%30 Washington, D.C. (DC) -2.2% 0.8% 3.4% 3.6%
Seattle
2015 TECH-THIRTY | CBRE Research26
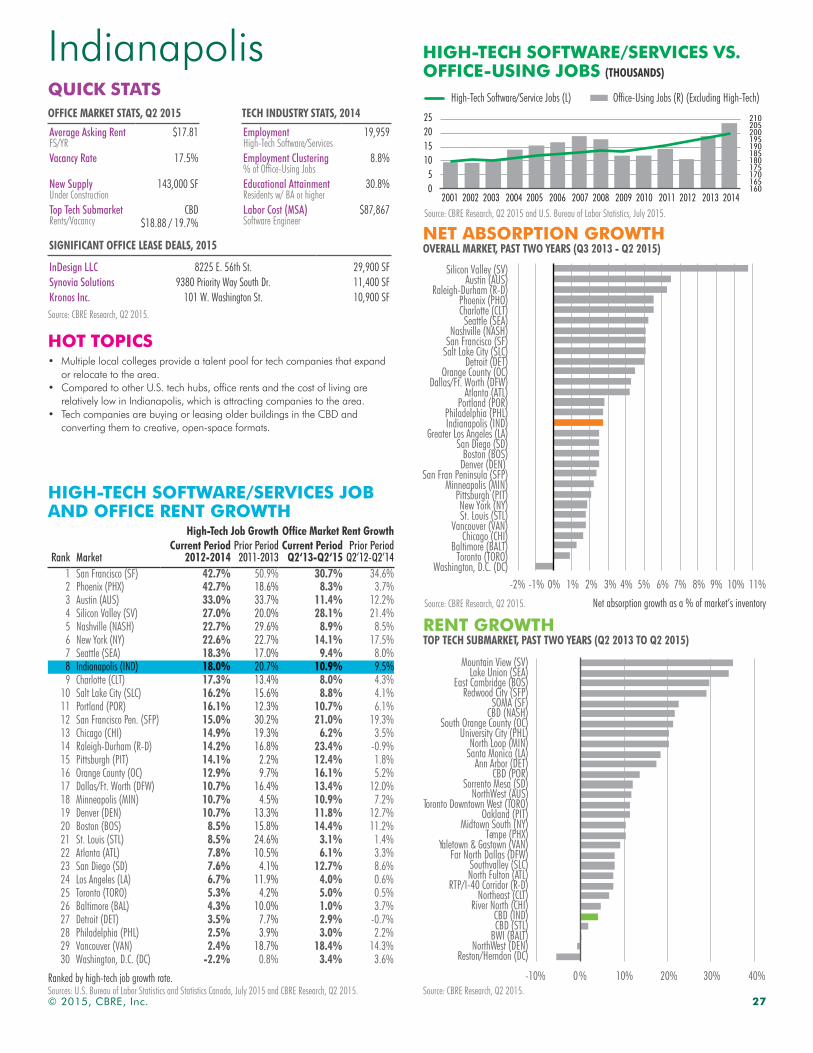
• Multiple local colleges provide a talent pool for tech companies that expand or relocate to the area.
• Compared to other U.S. tech hubs, office rents and the cost of living are relatively low in Indianapolis, which is attracting companies to the area.
• Tech companies are buying or leasing older buildings in the CBD and converting them to creative, open-space formats.
Sources: U.S. Bureau of Labor Statistics and Statistics Canada, July 2015 and CBRE Research, Q2 2015.Ranked by high-tech job growth rate.
OFFICE MARKET STATS, Q2 2015
Average Asking RentFS/YR
$17.81
Vacancy Rate 17.5%
New SupplyUnder Construction
143,000 SF
Top Tech SubmarketRents/Vacancy
CBD$18.88 / 19.7%
TECH INDUSTRY STATS, 2014
EmploymentHigh-Tech Software/Services
19,959
Employment Clustering % of Office-Using Jobs
8.8%
Educational AttainmentResidents w/ BA or higher
30.8%
Labor Cost (MSA)Software Engineer
$87,867
SIGNIFICANT OFFICE LEASE DEALS, 2015
InDesign LLC 8225 E. 56th St. 29,900 SF Synovia Solutions 9380 Priority Way South Dr. 11,400 SFKronos Inc. 101 W. Washington St. 10,900 SFSource: CBRE Research, Q2 2015.
Source: CBRE Research, Q2 2015 and U.S. Bureau of Labor Statistics, July 2015.
25201510
50
210205200195190185180175170165160
High-Tech Software/Service Jobs (L) Office-Using Jobs (R) (Excluding High-Tech)
2001 2002 2003 2004 2005 2006 2007 2008 2009 2010 2011 2012 2013 2014
HIGH-TECH SOFTWARE/SERVICES VS. OFFICE-USING JOBS (THOUSANDS)
Source: CBRE Research, Q2 2015. Net absorption growth as a % of market’s inventory
Washington, D.C. (DC) Toronto (TORO)
Baltimore (BALT) Chicago (CHI)
Vancouver (VAN) St. Louis (STL) New York (NY)
Pittsburgh (PIT) Minneapolis (MIN)
San Fran Peninsula (SFP) Denver (DEN) Boston (BOS)
San Diego (SD) Greater Los Angeles (LA)
Indianapolis (IND) Philadelphia (PHL)
Portland (POR) Atlanta (ATL)
Dallas/Ft. Worth (DFW) Orange County (OC)
Detroit (DET) Salt Lake City (SLC) San Francisco (SF) Nashville (NASH)
Seattle (SEA) Charlotte (CLT) Phoenix (PHO)
Raleigh-Durham (R-D) Austin (AUS)
Silicon Valley (SV)
NET ABSORPTION GROWTHOVERALL MARKET, PAST TWO YEARS (Q3 2013 - Q2 2015)
Source: CBRE Research, Q2 2015.-10% 0% 10% 20% 30% 40%
Reston/Herndon (DC) NorthWest (DEN)
BWI (BALT) CBD (STL) CBD (IND)
River North (CHI) Northeast (CLT)
RTP/I-40 Corridor (R-D) North Fulton (ATL) Southvalley (SLC)
Far North Dallas (DFW) Yaletown & Gastown (VAN)
Tempe (PHX) Midtown South (NY)
Oakland (PIT) Toronto Downtown West (TORO)
Sorrento Mesa (SD) CBD (POR)
Ann Arbor (DET) Santa Monica (LA) North Loop (MIN)
University City (PHL) South Orange County (OC)
CBD (NASH) SOMA (SF)
Redwood City (SFP) East Cambridge (BOS)
Lake Union (SEA) Mountain View (SV)
RENT GROWTHTOP TECH SUBMARKET, PAST TWO YEARS (Q2 2013 TO Q2 2015)
NorthWest (AUS)
HOT TOPICS
QUICK STATS
HIGH-TECH SOFTWARE/SERVICES JOB AND OFFICE RENT GROWTH
High-Tech Job Growth Office Market Rent Growth
Rank MarketCurrent Period
2012-2014Prior Period
2011-2013Current Period
Q2‘13-Q2‘15Prior Period
Q2‘12-Q2‘141 San Francisco (SF) 42.7% 50.9% 30.7% 34.6% 2 Phoenix (PHX) 42.7% 18.6% 8.3% 3.7%3 Austin (AUS) 33.0% 33.7% 11.4% 12.2%4 Silicon Valley (SV) 27.0% 20.0% 28.1% 21.4%5 Nashville (NASH) 22.7% 29.6% 8.9% 8.5%6 New York (NY) 22.6% 22.7% 14.1% 17.5%7 Seattle (SEA) 18.3% 17.0% 9.4% 8.0%8 Indianapolis (IND) 18.0% 20.7% 10.9% 9.5%9 Charlotte (CLT) 17.3% 13.4% 8.0% 4.3%
10 Salt Lake City (SLC) 16.2% 15.6% 8.8% 4.1%11 Portland (POR) 16.1% 12.3% 10.7% 6.1%12 San Francisco Pen. (SFP) 15.0% 30.2% 21.0% 19.3%13 Chicago (CHI) 14.9% 19.3% 6.2% 3.5%14 Raleigh-Durham (R-D) 14.2% 16.8% 23.4% -0.9%15 Pittsburgh (PIT) 14.1% 2.2% 12.4% 1.8%16 Orange County (OC) 12.9% 9.7% 16.1% 5.2%17 Dallas/Ft. Worth (DFW) 10.7% 16.4% 13.4% 12.0%18 Minneapolis (MIN) 10.7% 4.5% 10.9% 7.2%19 Denver (DEN) 10.7% 13.3% 11.8% 12.7%20 Boston (BOS) 8.5% 15.8% 14.4% 11.2%21 St. Louis (STL) 8.5% 24.6% 3.1% 1.4%22 Atlanta (ATL) 7.8% 10.5% 6.1% 3.3%23 San Diego (SD) 7.6% 4.1% 12.7% 8.6%24 Los Angeles (LA) 6.7% 11.9% 4.0% 0.6%25 Toronto (TORO) 5.3% 4.2% 5.0% 0.5%26 Baltimore (BAL) 4.3% 10.0% 1.0% 3.7%27 Detroit (DET) 3.5% 7.7% 2.9% -0.7%28 Philadelphia (PHL) 2.5% 3.9% 3.0% 2.2%29 Vancouver (VAN) 2.4% 18.7% 18.4% 14.3%30 Washington, D.C. (DC) -2.2% 0.8% 3.4% 3.6%
Indianapolis
27 © 2015, CBRE, Inc.

• Tech companies have increased their interest in Charlotte; from startups to large corporate users, firms are actively searching for available space.
• Charlotte’s young, diverse workforce—supplied by several highly respected and high-profile area colleges and universities—is one of the reasons tech firms are attracted to the area.
• Tech incubators have emerged—particularly in the CBD—to foster tech startups and create an environment for companies to succeed and grow.
• Charlotte being a super fast internet market, we expect expansion from high-tech companies there.
Sources: U.S. Bureau of Labor Statistics and Statistics Canada, July 2015 and CBRE Research, Q2 2015.Ranked by high-tech job growth rate.
OFFICE MARKET STATS, Q2 2015
Average Asking RentFS/YR
$21.73
Vacancy Rate 9.8%
New SupplyUnder Construction
343,000 SF
Top Tech SubmarketRents/Vacancy
Northeast$19.07 / 9.7%
HIGH-TECH INDUSTRY STATS, 2014
EmploymentHigh-Tech Software/Services
19,389
Employment Clustering % of Office-Using Jobs
6.9%
Educational AttainmentResidents w/ BA or higher
41.9%
Labor Cost (MSA)Software Engineer
$97,402
SIGNIFICANT OFFICE LEASE DEALS, 2015
Thinkgate LLC 201 S Tryon St. 21,200 SF Kinetic Concepts, Inc. 10101 Claude Freeman Dr. 18,300 SFNorComp 3810 Shutterfly Rd. 16,000 SFSource: CBRE Research, Q2 2015.
Source: CBRE Research, Q2 2015 and U.S. Bureau of Labor Statistics, July 2015.
211917151311
975
270250230210190170150
High-Tech Software/Service Jobs (L) Office-Using Jobs (R) (Excluding High-Tech)
2001 2002 2003 2004 2005 2006 2007 2008 2009 2010 2011 2012 2013 2014
HIGH-TECH SOFTWARE/SERVICES VS. OFFICE-USING JOBS (THOUSANDS)
Source: CBRE Research, Q2 2015.-10% 0% 10% 20% 30% 40%
Reston/Herndon (DC) NorthWest (DEN)
BWI (BALT) CBD (STL) CBD (IND)
River North (CHI) Northeast (CLT)
RTP/I-40 Corridor (R-D) North Fulton (ATL) Southvalley (SLC)
Far North Dallas (DFW) Yaletown & Gastown (VAN)
Tempe (PHX) Midtown South (NY)
Oakland (PIT) Toronto Downtown West (TORO)
Sorrento Mesa (SD) CBD (POR)
Ann Arbor (DET) Santa Monica (LA) North Loop (MIN)
University City (PHL) South Orange County (OC)
CBD (NASH) SOMA (SF)
Redwood City (SFP) East Cambridge (BOS)
Lake Union (SEA) Mountain View (SV)
RENT GROWTHTOP TECH SUBMARKET, PAST TWO YEARS (Q2 2013 TO Q2 2015)
NorthWest (AUS)
HOT TOPICS
QUICK STATS
Source: CBRE Research, Q2 2015. Net absorption growth as a % of market’s inventory
Washington, D.C. (DC) Toronto (TORO)
Baltimore (BALT) Chicago (CHI)
Vancouver (VAN) St. Louis (STL) New York (NY)
Pittsburgh (PIT) Minneapolis (MIN)
San Fran Peninsula (SFP) Denver (DEN) Boston (BOS)
San Diego (SD) Greater Los Angeles (LA)
Indianapolis (IND) Philadelphia (PHL)
Portland (POR) Atlanta (ATL)
Dallas/Ft. Worth (DFW) Orange County (OC)
Detroit (DET) Salt Lake City (SLC) San Francisco (SF) Nashville (NASH)
Seattle (SEA) Charlotte (CLT) Phoenix (PHO)
Raleigh-Durham (R-D) Austin (AUS)
Silicon Valley (SV)
NET ABSORPTION GROWTHOVERALL MARKET, PAST TWO YEARS (Q3 2013 - Q2 2015)
HIGH-TECH SOFTWARE/SERVICES JOB AND OFFICE RENT GROWTH
High-Tech Job Growth Office Market Rent Growth
Rank MarketCurrent Period
2012-2014Prior Period
2011-2013Current Period
Q2‘13-Q2‘15Prior Period
Q2‘12-Q2‘141 San Francisco (SF) 42.7% 50.9% 30.7% 34.6% 2 Phoenix (PHX) 42.7% 18.6% 8.3% 3.7%3 Austin (AUS) 33.0% 33.7% 11.4% 12.2%4 Silicon Valley (SV) 27.0% 20.0% 28.1% 21.4%5 Nashville (NASH) 22.7% 29.6% 8.9% 8.5%6 New York (NY) 22.6% 22.7% 14.1% 17.5%7 Seattle (SEA) 18.3% 17.0% 9.4% 8.0%8 Indianapolis (IND) 18.0% 20.7% 10.9% 9.5%9 Charlotte (CLT) 17.3% 13.4% 8.0% 4.3%
10 Salt Lake City (SLC) 16.2% 15.6% 8.8% 4.1%11 Portland (POR) 16.1% 12.3% 10.7% 6.1%12 San Francisco Pen. (SFP) 15.0% 30.2% 21.0% 19.3%13 Chicago (CHI) 14.9% 19.3% 6.2% 3.5%14 Raleigh-Durham (R-D) 14.2% 16.8% 23.4% -0.9%15 Pittsburgh (PIT) 14.1% 2.2% 12.4% 1.8%16 Orange County (OC) 12.9% 9.7% 16.1% 5.2%17 Dallas/Ft. Worth (DFW) 10.7% 16.4% 13.4% 12.0%18 Minneapolis (MIN) 10.7% 4.5% 10.9% 7.2%19 Denver (DEN) 10.7% 13.3% 11.8% 12.7%20 Boston (BOS) 8.5% 15.8% 14.4% 11.2%21 St. Louis (STL) 8.5% 24.6% 3.1% 1.4%22 Atlanta (ATL) 7.8% 10.5% 6.1% 3.3%23 San Diego (SD) 7.6% 4.1% 12.7% 8.6%24 Los Angeles (LA) 6.7% 11.9% 4.0% 0.6%25 Toronto (TORO) 5.3% 4.2% 5.0% 0.5%26 Baltimore (BAL) 4.3% 10.0% 1.0% 3.7%27 Detroit (DET) 3.5% 7.7% 2.9% -0.7%28 Philadelphia (PHL) 2.5% 3.9% 3.0% 2.2%29 Vancouver (VAN) 2.4% 18.7% 18.4% 14.3%30 Washington, D.C. (DC) -2.2% 0.8% 3.4% 3.6%
Charlotte
2015 TECH-THIRTY | CBRE Research28

• Tech broadened its footprint in Salt Lake City during the past year, but remained concentrated in the Southvalley submarket.
• More than 50% of the 1.3 million sq. ft. of office space currently under construction is in the tech-driven Southvalley.
• A high level of venture capital funding in the area indicates a healthy high-tech sector that is primed for continued growth.
Sources: U.S. Bureau of Labor Statistics and Statistics Canada, July 2015 and CBRE Research, Q2 2015.Ranked by high-tech job growth rate.
OFFICE MARKET STATS, Q2 2015
Average Asking RentFS/YR
$21.59
Vacancy Rate 10.8%
New SupplyUnder Construction
1.3 MSF
Top Tech SubmarketRents/Vacancy
Southvalley$22.28 / 5.9%
TECH INDUSTRY STATS, 2014
EmploymentHigh-Tech Software/Services
39,968
Employment Clustering % of Office-Using Jobs
15.2%
Educational AttainmentResidents w/ BA or higher
32.4%
Labor Cost (MSA)Software Engineer
$93,409
SIGNIFICANT OFFICE LEASE DEALS, 2015
Ancestry.com 3900 N Traverse Mountain Blvd. 200,000 SF Thumbtack 12992 S Frontrunner Blvd. 50,000 SFMaritz CX 3451 N Triumph Blvs. 48,000 SFSource: CBRE Research, Q2 2015.
Source: CBRE Research, Q2 2015 and U.S. Bureau of Labor Statistics, July 2015.
45403530252015
240220200180160140120100
High-Tech Software/Service Jobs (L) Office-Using Jobs (R) (Excluding High-Tech)
2001 2002 2003 2004 2005 2006 2007 2008 2009 2010 2011 2012 2013 2014
HIGH-TECH SOFTWARE/SERVICES VS. OFFICE-USING JOBS (THOUSANDS)
Source: CBRE Research, Q2 2015. Net absorption growth as a % of market’s inventory
Washington, D.C. (DC) Toronto (TORO)
Baltimore (BALT) Chicago (CHI)
Vancouver (VAN) St. Louis (STL) New York (NY)
Pittsburgh (PIT) Minneapolis (MIN)
San Fran Peninsula (SFP) Denver (DEN) Boston (BOS)
San Diego (SD) Greater Los Angeles (LA)
Indianapolis (IND) Philadelphia (PHL)
Portland (POR) Atlanta (ATL)
Dallas/Ft. Worth (DFW) Orange County (OC)
Detroit (DET) Salt Lake City (SLC) San Francisco (SF) Nashville (NASH)
Seattle (SEA) Charlotte (CLT) Phoenix (PHO)
Raleigh-Durham (R-D) Austin (AUS)
Silicon Valley (SV)
NET ABSORPTION GROWTHOVERALL MARKET, PAST TWO YEARS (Q3 2013 - Q2 2015)
Source: CBRE Research, Q2 2015.-10% 0% 10% 20% 30% 40%
Reston/Herndon (DC) NorthWest (DEN)
BWI (BALT) CBD (STL) CBD (IND)
River North (CHI) Northeast (CLT)
RTP/I-40 Corridor (R-D) North Fulton (ATL) Southvalley (SLC)
Far North Dallas (DFW) Yaletown & Gastown (VAN)
Tempe (PHX) Midtown South (NY)
Oakland (PIT) Toronto Downtown West (TORO)
Sorrento Mesa (SD) CBD (POR)
Ann Arbor (DET) Santa Monica (LA) North Loop (MIN)
University City (PHL) South Orange County (OC)
CBD (NASH) SOMA (SF)
Redwood City (SFP) East Cambridge (BOS)
Lake Union (SEA) Mountain View (SV)
RENT GROWTHTOP TECH SUBMARKET, PAST TWO YEARS (Q2 2013 TO Q2 2015)
NorthWest (AUS)
HOT TOPICS
QUICK STATS
HIGH-TECH SOFTWARE/SERVICES JOB AND OFFICE RENT GROWTH
High-Tech Job Growth Office Market Rent Growth
Rank MarketCurrent Period
2012-2014Prior Period
2011-2013Current Period
Q2‘13-Q2‘15Prior Period
Q2‘12-Q2‘141 San Francisco (SF) 42.7% 50.9% 30.7% 34.6% 2 Phoenix (PHX) 42.7% 18.6% 8.3% 3.7%3 Austin (AUS) 33.0% 33.7% 11.4% 12.2%4 Silicon Valley (SV) 27.0% 20.0% 28.1% 21.4%5 Nashville (NASH) 22.7% 29.6% 8.9% 8.5%6 New York (NY) 22.6% 22.7% 14.1% 17.5%7 Seattle (SEA) 18.3% 17.0% 9.4% 8.0%8 Indianapolis (IND) 18.0% 20.7% 10.9% 9.5%9 Charlotte (CLT) 17.3% 13.4% 8.0% 4.3%
10 Salt Lake City (SLC) 16.2% 15.6% 8.8% 4.1%11 Portland (POR) 16.1% 12.3% 10.7% 6.1%12 San Francisco Pen. (SFP) 15.0% 30.2% 21.0% 19.3%13 Chicago (CHI) 14.9% 19.3% 6.2% 3.5%14 Raleigh-Durham (R-D) 14.2% 16.8% 23.4% -0.9%15 Pittsburgh (PIT) 14.1% 2.2% 12.4% 1.8%16 Orange County (OC) 12.9% 9.7% 16.1% 5.2%17 Dallas/Ft. Worth (DFW) 10.7% 16.4% 13.4% 12.0%18 Minneapolis (MIN) 10.7% 4.5% 10.9% 7.2%19 Denver (DEN) 10.7% 13.3% 11.8% 12.7%20 Boston (BOS) 8.5% 15.8% 14.4% 11.2%21 St. Louis (STL) 8.5% 24.6% 3.1% 1.4%22 Atlanta (ATL) 7.8% 10.5% 6.1% 3.3%23 San Diego (SD) 7.6% 4.1% 12.7% 8.6%24 Los Angeles (LA) 6.7% 11.9% 4.0% 0.6%25 Toronto (TORO) 5.3% 4.2% 5.0% 0.5%26 Baltimore (BAL) 4.3% 10.0% 1.0% 3.7%27 Detroit (DET) 3.5% 7.7% 2.9% -0.7%28 Philadelphia (PHL) 2.5% 3.9% 3.0% 2.2%29 Vancouver (VAN) 2.4% 18.7% 18.4% 14.3%30 Washington, D.C. (DC) -2.2% 0.8% 3.4% 3.6%
Salt Lake City
29 © 2015, CBRE, Inc.

• The ever-increasing costs of housing and salaries in tech hubs like San Francisco and Silicon Valley make Portland an appealing alternative for employers to recruit talent.
• Tech companies are a significant source of office space demand in Portland; in 2014, they accounted for more than one-third of the top leasing transactions.
• Demand for space is so strong that speculative construction is on the rise for the first time since the Great Recession.
Sources: U.S. Bureau of Labor Statistics and Statistics Canada, July 2015 and CBRE Research, Q2 2015.Ranked by high-tech job growth rate.
OFFICE MARKET STATS, Q2 2015
Average Asking RentFS/YR
$23.36
Vacancy Rate 11.4%
New SupplyUnder Construction
787,000 SF
Top Tech SubmarketRents/Vacancy
CBD$26.88 / 9.9%
HIGH-TECH INDUSTRY STATS, 2014
EmploymentHigh-Tech Software/Services
24,497
Employment Clustering % of Office-Using Jobs
10.5%
Educational AttainmentResidents w/ BA or higher
38.4%
Labor Cost (MSA)Software Engineer
$95,616
SIGNIFICANT OFFICE LEASE DEALS, 2015
Wacom Technology Corp. 1455 NW Irving St. 65,400 SF CollegeNET 805 SW Broadway St. 44,700 SFDiscoverOrg 805 Broadway St. 27,000 SFSource: CBRE Research, Q2 2015.
Source: CBRE Research, Q2 2015 and U.S. Bureau of Labor Statistics, July 2015.
262422201816141210
220210200190180170160150
High-Tech Software/Service Jobs (L) Office-Using Jobs (R) (Excluding High-Tech)
2001 2002 2003 2004 2005 2006 2007 2008 2009 2010 2011 2012 2013 2014
HIGH-TECH SOFTWARE/SERVICES VS. OFFICE-USING JOBS (THOUSANDS)
Source: CBRE Research, Q2 2015. Net absorption growth as a % of market’s inventory
Washington, D.C. (DC)
Toronto (TORO) Baltimore (BALT)
Chicago (CHI) Vancouver (VAN)
St. Louis (STL) New York (NY)
Pittsburgh (PIT) Minneapolis (MIN)
San Fran Peninsula (SFP) Denver (DEN) Boston (BOS)
San Diego (SD) Greater Los Angeles (LA)
Indianapolis (IND) Philadelphia (PHL)
Portland (POR) Atlanta (ATL)
Dallas/Ft. Worth (DFW) Orange County (OC)
Detroit (DET) Salt Lake City (SLC) San Francisco (SF) Nashville (NASH)
Seattle (SEA) Charlotte (CLT) Phoenix (PHO)
Raleigh-Durham (R-D) Austin (AUS)
Silicon Valley (SV)
NET ABSORPTION GROWTHOVERALL MARKET, PAST TWO YEARS (Q3 2013 - Q2 2015)
Source: CBRE Research, Q2 2015.-10% 0% 10% 20% 30% 40%
Reston/Herndon (DC) NorthWest (DEN)
BWI (BALT) CBD (STL) CBD (IND)
River North (CHI) Northeast (CLT)
RTP/I-40 Corridor (R-D) North Fulton (ATL) Southvalley (SLC)
Far North Dallas (DFW) Yaletown & Gastown (VAN)
Tempe (PHX) Midtown South (NY)
Oakland (PIT) Toronto Downtown West (TORO)
Sorrento Mesa (SD) CBD (POR)
Ann Arbor (DET) Santa Monica (LA) North Loop (MIN)
University City (PHL) South Orange County (OC)
CBD (NASH) SOMA (SF)
Redwood City (SFP) East Cambridge (BOS)
Lake Union (SEA) Mountain View (SV)
RENT GROWTHTOP TECH SUBMARKET, PAST TWO YEARS (Q2 2013 TO Q2 2015)
NorthWest (AUS)
HOT TOPICS
QUICK STATS
HIGH-TECH SOFTWARE/SERVICES JOB AND OFFICE RENT GROWTH
High-Tech Job Growth Office Market Rent Growth
Rank MarketCurrent Period
2012-2014Prior Period
2011-2013Current Period
Q2‘13-Q2‘15Prior Period
Q2‘12-Q2‘141 San Francisco (SF) 42.7% 50.9% 30.7% 34.6% 2 Phoenix (PHX) 42.7% 18.6% 8.3% 3.7%3 Austin (AUS) 33.0% 33.7% 11.4% 12.2%4 Silicon Valley (SV) 27.0% 20.0% 28.1% 21.4%5 Nashville (NASH) 22.7% 29.6% 8.9% 8.5%6 New York (NY) 22.6% 22.7% 14.1% 17.5%7 Seattle (SEA) 18.3% 17.0% 9.4% 8.0%8 Indianapolis (IND) 18.0% 20.7% 10.9% 9.5%9 Charlotte (CLT) 17.3% 13.4% 8.0% 4.3%
10 Salt Lake City (SLC) 16.2% 15.6% 8.8% 4.1%11 Portland (POR) 16.1% 12.3% 10.7% 6.1%12 San Francisco Pen. (SFP) 15.0% 30.2% 21.0% 19.3%13 Chicago (CHI) 14.9% 19.3% 6.2% 3.5%14 Raleigh-Durham (R-D) 14.2% 16.8% 23.4% -0.9%15 Pittsburgh (PIT) 14.1% 2.2% 12.4% 1.8%16 Orange County (OC) 12.9% 9.7% 16.1% 5.2%17 Dallas/Ft. Worth (DFW) 10.7% 16.4% 13.4% 12.0%18 Minneapolis (MIN) 10.7% 4.5% 10.9% 7.2%19 Denver (DEN) 10.7% 13.3% 11.8% 12.7%20 Boston (BOS) 8.5% 15.8% 14.4% 11.2%21 St. Louis (STL) 8.5% 24.6% 3.1% 1.4%22 Atlanta (ATL) 7.8% 10.5% 6.1% 3.3%23 San Diego (SD) 7.6% 4.1% 12.7% 8.6%24 Los Angeles (LA) 6.7% 11.9% 4.0% 0.6%25 Toronto (TORO) 5.3% 4.2% 5.0% 0.5%26 Baltimore (BAL) 4.3% 10.0% 1.0% 3.7%27 Detroit (DET) 3.5% 7.7% 2.9% -0.7%28 Philadelphia (PHL) 2.5% 3.9% 3.0% 2.2%29 Vancouver (VAN) 2.4% 18.7% 18.4% 14.3%30 Washington, D.C. (DC) -2.2% 0.8% 3.4% 3.6%
Portland
2015 TECH-THIRTY | CBRE Research30

• In order to be closer to venture capital funding on Sand Hill Road, technology companies located in Menlo Park and Palo Alto are willing to pay top rental rates in the Bay Area.
• Facebook continues to expand its footprint and has development plans for a third campus at the old TE Connectivity site.
• Limited available space has spurred development in downtown Redwood City; at the same time, some tech companies are moving to North County in search of lower rental rates.
Sources: U.S. Bureau of Labor Statistics and Statistics Canada, July 2015 and CBRE Research, Q2 2015.Ranked by high-tech job growth rate.
OFFICE MARKET STATS, Q2 2015
Average Asking RentFS/YR
$60.84
Vacancy Rate 8.0%
New SupplyUnder Construction
1.5 MSF
Top Tech SubmarketRents/Vacancy
Redwood City$61.68 / 8.3%
TECH INDUSTRY STATS, 2014
EmploymentHigh-Tech Software/Services
38,968
Employment Clustering % of Office-Using Jobs
31.9%
Educational AttainmentResidents w/ BA or higher
43.8%
Labor Cost (MSA)Software Engineer
$118,652
SIGNIFICANT OFFICE LEASE DEALS, 2015
Tibco Software 3301 Hillview Ave. 292,000 SF NetSuite 2955 Campus Dr. 128,500 SFEMC 151 Commonwealth Dr. 118,000 SFSource: CBRE Research, Q2 2015.
Source: CBRE Research, Q2 2015 and U.S. Bureau of Labor Statistics, July 2015.
45403530252015
90858075706560
High-Tech Software/Service Jobs (L) Office-Using Jobs (R) (Excluding High-Tech)
2001 2002 2003 2004 2005 2006 2007 2008 2009 2010 2011 2012 2013 2014
HIGH-TECH SOFTWARE/SERVICES VS. OFFICE-USING JOBS (THOUSANDS)
Source: CBRE Research, Q2 2015. Net absorption growth as a % of market’s inventory
Washington, D.C. (DC) Toronto (TORO)
Baltimore (BALT) Chicago (CHI)
Vancouver (VAN) St. Louis (STL) New York (NY)
Pittsburgh (PIT) Minneapolis (MIN)
San Fran Peninsula (SFP) Denver (DEN) Boston (BOS)
San Diego (SD) Greater Los Angeles (LA)
Indianapolis (IND) Philadelphia (PHL)
Portland (POR) Atlanta (ATL)
Dallas/Ft. Worth (DFW) Orange County (OC)
Detroit (DET) Salt Lake City (SLC) San Francisco (SF) Nashville (NASH)
Seattle (SEA) Charlotte (CLT) Phoenix (PHO)
Raleigh-Durham (R-D) Austin (AUS)
Silicon Valley (SV)
NET ABSORPTION GROWTHOVERALL MARKET, PAST TWO YEARS (Q3 2013 - Q2 2015)
Source: CBRE Research, Q2 2015.-10% 0% 10% 20% 30% 40%
Reston/Herndon (DC) NorthWest (DEN)
BWI (BALT) CBD (STL) CBD (IND)
River North (CHI) Northeast (CLT)
RTP/I-40 Corridor (R-D) North Fulton (ATL) Southvalley (SLC)
Far North Dallas (DFW) Yaletown & Gastown (VAN)
Tempe (PHX) Midtown South (NY)
Oakland (PIT) Toronto Downtown West (TORO)
Sorrento Mesa (SD) CBD (POR)
Ann Arbor (DET) Santa Monica (LA) North Loop (MIN)
University City (PHL) South Orange County (OC)
CBD (NASH) SOMA (SF)
Redwood City (SFP) East Cambridge (BOS)
Lake Union (SEA) Mountain View (SV)
RENT GROWTHTOP TECH SUBMARKET, PAST TWO YEARS (Q2 2013 TO Q2 2015)
NorthWest (AUS)
HOT TOPICS
QUICK STATS
HIGH-TECH SOFTWARE/SERVICES JOB AND OFFICE RENT GROWTH
High-Tech Job Growth Office Market Rent Growth
Rank MarketCurrent Period
2012-2014Prior Period
2011-2013Current Period
Q2‘13-Q2‘15Prior Period
Q2‘12-Q2‘141 San Francisco (SF) 42.7% 50.9% 30.7% 34.6% 2 Phoenix (PHX) 42.7% 18.6% 8.3% 3.7%3 Austin (AUS) 33.0% 33.7% 11.4% 12.2%4 Silicon Valley (SV) 27.0% 20.0% 28.1% 21.4%5 Nashville (NASH) 22.7% 29.6% 8.9% 8.5%6 New York (NY) 22.6% 22.7% 14.1% 17.5%7 Seattle (SEA) 18.3% 17.0% 9.4% 8.0%8 Indianapolis (IND) 18.0% 20.7% 10.9% 9.5%9 Charlotte (CLT) 17.3% 13.4% 8.0% 4.3%
10 Salt Lake City (SLC) 16.2% 15.6% 8.8% 4.1%11 Portland (POR) 16.1% 12.3% 10.7% 6.1%12 San Francisco Pen. (SFP) 15.0% 30.2% 21.0% 19.3%13 Chicago (CHI) 14.9% 19.3% 6.2% 3.5%14 Raleigh-Durham (R-D) 14.2% 16.8% 23.4% -0.9%15 Pittsburgh (PIT) 14.1% 2.2% 12.4% 1.8%16 Orange County (OC) 12.9% 9.7% 16.1% 5.2%17 Dallas/Ft. Worth (DFW) 10.7% 16.4% 13.4% 12.0%18 Minneapolis (MIN) 10.7% 4.5% 10.9% 7.2%19 Denver (DEN) 10.7% 13.3% 11.8% 12.7%20 Boston (BOS) 8.5% 15.8% 14.4% 11.2%21 St. Louis (STL) 8.5% 24.6% 3.1% 1.4%22 Atlanta (ATL) 7.8% 10.5% 6.1% 3.3%23 San Diego (SD) 7.6% 4.1% 12.7% 8.6%24 Los Angeles (LA) 6.7% 11.9% 4.0% 0.6%25 Toronto (TORO) 5.3% 4.2% 5.0% 0.5%26 Baltimore (BAL) 4.3% 10.0% 1.0% 3.7%27 Detroit (DET) 3.5% 7.7% 2.9% -0.7%28 Philadelphia (PHL) 2.5% 3.9% 3.0% 2.2%29 Vancouver (VAN) 2.4% 18.7% 18.4% 14.3%30 Washington, D.C. (DC) -2.2% 0.8% 3.4% 3.6%
San Francisco Peninsula
31 © 2015, CBRE, Inc.

• In the CBD, high-tech has been among the top three industries for leasing activity since 2012, along with financial and legal services.
• The space needs of Chicago high-tech companies are growing because of rapid hiring in the past two years.
• In Q2 2012, tech-related firms represented 6% of all tenants in the CBD, they now account for 8% of the market. Rising from 4.4 to 6.7 million sq. ft., this represents a 54% increase in tech-occupied space,
Sources: U.S. Bureau of Labor Statistics and Statistics Canada, July 2015 and CBRE Research, Q2 2015.Ranked by high-tech job growth rate.
OFFICE MARKET STATS, Q2 2015
Average Asking RentFS/YR
$28.40
Vacancy Rate 16.1%
New SupplyUnder Construction
2.6 MSF
Top Tech SubmarketRents/Vacancy
River North$35.21 / 9.3%
HIGH-TECH INDUSTRY STATS, 2014
EmploymentHigh-Tech Software/Services
78,579
Employment Clustering % of Office-Using Jobs
9.2%
Educational AttainmentResidents w/ BA or higher
35.5%
Labor Cost (MSA)Software Engineer
$90,393
SIGNIFICANT OFFICE LEASE DEALS, 2015
Yelp 222 Merchandise Mart Plz. 132,000 SF Avant, Inc 222 N LaSalle St. 78,900 SFSAC Wireless 540 W Madison St. 41,900 SFSource: CBRE Research, Q2 2015.
Source: CBRE Research, Q2 2015 and U.S. Bureau of Labor Statistics, July 2015.
858075706560555045
830810790770750730710690670650
High-Tech Software/Service Jobs (L) Office-Using Jobs (R) (Excluding High-Tech)
2001 2002 2003 2004 2005 2006 2007 2008 2009 2010 2011 2012 2013 2014
HIGH-TECH SOFTWARE/SERVICES VS. OFFICE-USING JOBS (THOUSANDS)
Source: CBRE Research, Q2 2015. Net absorption growth as a % of market’s inventory
Washington, D.C. (DC) Toronto (TORO)
Baltimore (BALT) Chicago (CHI)
Vancouver (VAN) St. Louis (STL) New York (NY)
Pittsburgh (PIT) Minneapolis (MIN)
San Fran Peninsula (SFP) Denver (DEN) Boston (BOS)
San Diego (SD) Greater Los Angeles (LA)
Indianapolis (IND) Philadelphia (PHL)
Portland (POR) Atlanta (ATL)
Dallas/Ft. Worth (DFW) Orange County (OC)
Detroit (DET) Salt Lake City (SLC) San Francisco (SF) Nashville (NASH)
Seattle (SEA) Charlotte (CLT) Phoenix (PHO)
Raleigh-Durham (R-D) Austin (AUS)
Silicon Valley (SV)
NET ABSORPTION GROWTHOVERALL MARKET, PAST TWO YEARS (Q3 2013 - Q2 2015)
Source: CBRE Research, Q2 2015.-10% 0% 10% 20% 30% 40%
Reston/Herndon (DC) NorthWest (DEN)
BWI (BALT) CBD (STL) CBD (IND)
River North (CHI) Northeast (CLT)
RTP/I-40 Corridor (R-D) North Fulton (ATL) Southvalley (SLC)
Far North Dallas (DFW) Yaletown & Gastown (VAN)
Tempe (PHX) Midtown South (NY)
Oakland (PIT) Toronto Downtown West (TORO)
Sorrento Mesa (SD) CBD (POR)
Ann Arbor (DET) Santa Monica (LA) North Loop (MIN)
University City (PHL) South Orange County (OC)
CBD (NASH) SOMA (SF)
Redwood City (SFP) East Cambridge (BOS)
Lake Union (SEA) Mountain View (SV)
RENT GROWTHTOP TECH SUBMARKET, PAST TWO YEARS (Q2 2013 TO Q2 2015)
NorthWest (AUS)
HOT TOPICS
QUICK STATS
HIGH-TECH SOFTWARE/SERVICES JOB AND OFFICE RENT GROWTH
High-Tech Job Growth Office Market Rent Growth
Rank MarketCurrent Period
2012-2014Prior Period
2011-2013Current Period
Q2‘13-Q2‘15Prior Period
Q2‘12-Q2‘141 San Francisco (SF) 42.7% 50.9% 30.7% 34.6% 2 Phoenix (PHX) 42.7% 18.6% 8.3% 3.7%3 Austin (AUS) 33.0% 33.7% 11.4% 12.2%4 Silicon Valley (SV) 27.0% 20.0% 28.1% 21.4%5 Nashville (NASH) 22.7% 29.6% 8.9% 8.5%6 New York (NY) 22.6% 22.7% 14.1% 17.5%7 Seattle (SEA) 18.3% 17.0% 9.4% 8.0%8 Indianapolis (IND) 18.0% 20.7% 10.9% 9.5%9 Charlotte (CLT) 17.3% 13.4% 8.0% 4.3%
10 Salt Lake City (SLC) 16.2% 15.6% 8.8% 4.1%11 Portland (POR) 16.1% 12.3% 10.7% 6.1%12 San Francisco Pen. (SFP) 15.0% 30.2% 21.0% 19.3%13 Chicago (CHI) 14.9% 19.3% 6.2% 3.5%14 Raleigh-Durham (R-D) 14.2% 16.8% 23.4% -0.9%15 Pittsburgh (PIT) 14.1% 2.2% 12.4% 1.8%16 Orange County (OC) 12.9% 9.7% 16.1% 5.2%17 Dallas/Ft. Worth (DFW) 10.7% 16.4% 13.4% 12.0%18 Minneapolis (MIN) 10.7% 4.5% 10.9% 7.2%19 Denver (DEN) 10.7% 13.3% 11.8% 12.7%20 Boston (BOS) 8.5% 15.8% 14.4% 11.2%21 St. Louis (STL) 8.5% 24.6% 3.1% 1.4%22 Atlanta (ATL) 7.8% 10.5% 6.1% 3.3%23 San Diego (SD) 7.6% 4.1% 12.7% 8.6%24 Los Angeles (LA) 6.7% 11.9% 4.0% 0.6%25 Toronto (TORO) 5.3% 4.2% 5.0% 0.5%26 Baltimore (BAL) 4.3% 10.0% 1.0% 3.7%27 Detroit (DET) 3.5% 7.7% 2.9% -0.7%28 Philadelphia (PHL) 2.5% 3.9% 3.0% 2.2%29 Vancouver (VAN) 2.4% 18.7% 18.4% 14.3%30 Washington, D.C. (DC) -2.2% 0.8% 3.4% 3.6%
Chicago
2015 TECH-THIRTY | CBRE Research32

• Leasing activity remains concentrated in the suburban office market, but tech tenants are focusing their attention on urban areas with a live/work/play environment.
• The amenities available in Downtown Raleigh, Downtown Durham, North Hills and other mixed-use urban areas attract millennials – and both established tech companies and start-ups are following them.
• Raleigh-Durham is a super fast internet market and should foster continued high-tech innovation.
Sources: U.S. Bureau of Labor Statistics and Statistics Canada, July 2015 and CBRE Research, Q2 2015.Ranked by high-tech job growth rate.
OFFICE MARKET STATS, Q2 2015
Average Asking RentFS/YR
$23.31
Vacancy Rate 14.2%
New SupplyUnder Construction
1.7 MSF
Top Tech SubmarketRents/Vacancy
RTP/I-40 Corridor$20.03 / 19.2%
TECH INDUSTRY STATS, 2014
EmploymentHigh-Tech Software/Services
30,892
Employment Clustering % of Office-Using Jobs
15.6%
Educational AttainmentResidents w/ BA or higher
49.5%
Labor Cost (MSA)Software Engineer
$100,850
SIGNIFICANT OFFICE LEASE DEALS, 2015
Allscrips Midtown Plz. 245,000 SF Genbrand 5297 S Miami Blvd. 71,000 SFSynopsis 1101 Slater Rd. 26,000 SFSource: CBRE Research, Q2 2015.
Source: CBRE Research, Q2 2015 and U.S. Bureau of Labor Statistics, July 2015.
333129272523211917
180170160150140130120110100
High-Tech Software/Service Jobs (L) Office-Using Jobs (R) (Excluding High-Tech)
2001 2002 2003 2004 2005 2006 2007 2008 2009 2010 2011 2012 2013 2014
HIGH-TECH SOFTWARE/SERVICES VS. OFFICE-USING JOBS (THOUSANDS)
Source: CBRE Research, Q2 2015. Net absorption growth as a % of market’s inventory
Washington, D.C. (DC) Toronto (TORO)
Baltimore (BALT) Chicago (CHI)
Vancouver (VAN) St. Louis (STL) New York (NY)
Pittsburgh (PIT) Minneapolis (MIN)
San Fran Peninsula (SFP) Denver (DEN) Boston (BOS)
San Diego (SD) Greater Los Angeles (LA)
Indianapolis (IND) Philadelphia (PHL)
Portland (POR) Atlanta (ATL)
Dallas/Ft. Worth (DFW) Orange County (OC)
Detroit (DET) Salt Lake City (SLC) San Francisco (SF) Nashville (NASH)
Seattle (SEA) Charlotte (CLT) Phoenix (PHO)
Raleigh-Durham (R-D) Austin (AUS)
Silicon Valley (SV)
NET ABSORPTION GROWTHOVERALL MARKET, PAST TWO YEARS (Q3 2013 - Q2 2015)
Source: CBRE Research, Q2 2015.-10% 0% 10% 20% 30% 40%
Reston/Herndon (DC) NorthWest (DEN)
BWI (BALT) CBD (STL) CBD (IND)
River North (CHI) Northeast (CLT)
RTP/I-40 Corridor (R-D) North Fulton (ATL) Southvalley (SLC)
Far North Dallas (DFW) Yaletown & Gastown (VAN)
Tempe (PHX) Midtown South (NY)
Oakland (PIT) Toronto Downtown West (TORO)
Sorrento Mesa (SD) CBD (POR)
Ann Arbor (DET) Santa Monica (LA) North Loop (MIN)
University City (PHL) South Orange County (OC)
CBD (NASH) SOMA (SF)
Redwood City (SFP) East Cambridge (BOS)
Lake Union (SEA) Mountain View (SV)
RENT GROWTHTOP TECH SUBMARKET, PAST TWO YEARS (Q2 2013 TO Q2 2015)
NorthWest (AUS)
HOT TOPICS
QUICK STATS
HIGH-TECH SOFTWARE/SERVICES JOB AND OFFICE RENT GROWTH
High-Tech Job Growth Office Market Rent Growth
Rank MarketCurrent Period
2012-2014Prior Period
2011-2013Current Period
Q2‘13-Q2‘15Prior Period
Q2‘12-Q2‘141 San Francisco (SF) 42.7% 50.9% 30.7% 34.6% 2 Phoenix (PHX) 42.7% 18.6% 8.3% 3.7%3 Austin (AUS) 33.0% 33.7% 11.4% 12.2%4 Silicon Valley (SV) 27.0% 20.0% 28.1% 21.4%5 Nashville (NASH) 22.7% 29.6% 8.9% 8.5%6 New York (NY) 22.6% 22.7% 14.1% 17.5%7 Seattle (SEA) 18.3% 17.0% 9.4% 8.0%8 Indianapolis (IND) 18.0% 20.7% 10.9% 9.5%9 Charlotte (CLT) 17.3% 13.4% 8.0% 4.3%
10 Salt Lake City (SLC) 16.2% 15.6% 8.8% 4.1%11 Portland (POR) 16.1% 12.3% 10.7% 6.1%12 San Francisco Pen. (SFP) 15.0% 30.2% 21.0% 19.3%13 Chicago (CHI) 14.9% 19.3% 6.2% 3.5%14 Raleigh-Durham (R-D) 14.2% 16.8% 23.4% -0.9%15 Pittsburgh (PIT) 14.1% 2.2% 12.4% 1.8%16 Orange County (OC) 12.9% 9.7% 16.1% 5.2%17 Dallas/Ft. Worth (DFW) 10.7% 16.4% 13.4% 12.0%18 Minneapolis (MIN) 10.7% 4.5% 10.9% 7.2%19 Denver (DEN) 10.7% 13.3% 11.8% 12.7%20 Boston (BOS) 8.5% 15.8% 14.4% 11.2%21 St. Louis (STL) 8.5% 24.6% 3.1% 1.4%22 Atlanta (ATL) 7.8% 10.5% 6.1% 3.3%23 San Diego (SD) 7.6% 4.1% 12.7% 8.6%24 Los Angeles (LA) 6.7% 11.9% 4.0% 0.6%25 Toronto (TORO) 5.3% 4.2% 5.0% 0.5%26 Baltimore (BAL) 4.3% 10.0% 1.0% 3.7%27 Detroit (DET) 3.5% 7.7% 2.9% -0.7%28 Philadelphia (PHL) 2.5% 3.9% 3.0% 2.2%29 Vancouver (VAN) 2.4% 18.7% 18.4% 14.3%30 Washington, D.C. (DC) -2.2% 0.8% 3.4% 3.6%
Raleigh-Durham
33 © 2015, CBRE, Inc.

• Uber and Carnegie Mellon University partnered to create the Uber Advanced Technologies Center in Pittsburgh to develop software for mapping, driving safety and autonomous vehicles.
• The center of the Pittsburgh tech market keeps expanding beyond Oakland, with neighborhoods like the East End, Lawrenceville, the Strip District, the CBD, the North Side and the South Side all seeing increased concentrations of tech users.
• Several urban redevelopment projects have successfully secured tech companies as early tenants, accelerating the interest in mixed-use environments.
Sources: U.S. Bureau of Labor Statistics and Statistics Canada, July 2015 and CBRE Research, Q2 2015.Ranked by high-tech job growth rate.
OFFICE MARKET STATS, Q2 2015
Average Asking RentFS/YR
$21.13
Vacancy Rate 10.5%
New SupplyUnder Construction
1.8 MSF
Top Tech SubmarketRents/Vacancy
Oakland$20.37 / 2.8%
HIGH-TECH INDUSTRY STATS, 2014
EmploymentHigh-Tech Software/Services
14,028
Employment Clustering % of Office-Using Jobs
5.7%
Educational AttainmentResidents w/ BA or higher
32.3%
Labor Cost (MSA)Software Engineer
$84,640
SIGNIFICANT OFFICE LEASE DEALS, 2015
NetApp 800 Cranberry Woods 85,500 SF Uber Technologies Restaurant Depot 52,800 SFM*Modal Services Murray Ave. 34,000 SFSource: CBRE Research, Q2 2015.
Source: CBRE Research, Q2 2015 and U.S. Bureau of Labor Statistics, July 2015.
16151413121110
240230220210200190180
High-Tech Software/Service Jobs (L) Office-Using Jobs (R) (Excluding High-Tech)
2001 2002 2003 2004 2005 2006 2007 2008 2009 2010 2011 2012 2013 2014
HIGH-TECH SOFTWARE/SERVICES VS. OFFICE-USING JOBS (THOUSANDS)
Source: CBRE Research, Q2 2015. Net absorption growth as a % of market’s inventory
Washington, D.C. (DC)
Toronto (TORO) Baltimore (BALT)
Chicago (CHI) Vancouver (VAN)
St. Louis (STL) New York (NY)
Pittsburgh (PIT) Minneapolis (MIN)
San Fran Peninsula (SFP) Denver (DEN) Boston (BOS)
San Diego (SD) Greater Los Angeles (LA)
Indianapolis (IND) Philadelphia (PHL)
Portland (POR) Atlanta (ATL)
Dallas/Ft. Worth (DFW) Orange County (OC)
Detroit (DET) Salt Lake City (SLC) San Francisco (SF) Nashville (NASH)
Seattle (SEA) Charlotte (CLT) Phoenix (PHO)
Raleigh-Durham (R-D) Austin (AUS)
Silicon Valley (SV)
NET ABSORPTION GROWTHOVERALL MARKET, PAST TWO YEARS (Q3 2013 - Q2 2015)
Source: CBRE Research, Q2 2015.-10% 0% 10% 20% 30% 40%
Reston/Herndon (DC) NorthWest (DEN)
BWI (BALT) CBD (STL) CBD (IND)
River North (CHI) Northeast (CLT)
RTP/I-40 Corridor (R-D) North Fulton (ATL) Southvalley (SLC)
Far North Dallas (DFW) Yaletown & Gastown (VAN)
Tempe (PHX) Midtown South (NY)
Oakland (PIT) Toronto Downtown West (TORO)
Sorrento Mesa (SD) CBD (POR)
Ann Arbor (DET) Santa Monica (LA) North Loop (MIN)
University City (PHL) South Orange County (OC)
CBD (NASH) SOMA (SF)
Redwood City (SFP) East Cambridge (BOS)
Lake Union (SEA) Mountain View (SV)
RENT GROWTHTOP TECH SUBMARKET, PAST TWO YEARS (Q2 2013 TO Q2 2015)
NorthWest (AUS)
HOT TOPICS
QUICK STATS
HIGH-TECH SOFTWARE/SERVICES JOB AND OFFICE RENT GROWTH
High-Tech Job Growth Office Market Rent Growth
Rank MarketCurrent Period
2012-2014Prior Period
2011-2013Current Period
Q2‘13-Q2‘15Prior Period
Q2‘12-Q2‘141 San Francisco (SF) 42.7% 50.9% 30.7% 34.6% 2 Phoenix (PHX) 42.7% 18.6% 8.3% 3.7%3 Austin (AUS) 33.0% 33.7% 11.4% 12.2%4 Silicon Valley (SV) 27.0% 20.0% 28.1% 21.4%5 Nashville (NASH) 22.7% 29.6% 8.9% 8.5%6 New York (NY) 22.6% 22.7% 14.1% 17.5%7 Seattle (SEA) 18.3% 17.0% 9.4% 8.0%8 Indianapolis (IND) 18.0% 20.7% 10.9% 9.5%9 Charlotte (CLT) 17.3% 13.4% 8.0% 4.3%
10 Salt Lake City (SLC) 16.2% 15.6% 8.8% 4.1%11 Portland (POR) 16.1% 12.3% 10.7% 6.1%12 San Francisco Pen. (SFP) 15.0% 30.2% 21.0% 19.3%13 Chicago (CHI) 14.9% 19.3% 6.2% 3.5%14 Raleigh-Durham (R-D) 14.2% 16.8% 23.4% -0.9%15 Pittsburgh (PIT) 14.1% 2.2% 12.4% 1.8%16 Orange County (OC) 12.9% 9.7% 16.1% 5.2%17 Dallas/Ft. Worth (DFW) 10.7% 16.4% 13.4% 12.0%18 Minneapolis (MIN) 10.7% 4.5% 10.9% 7.2%19 Denver (DEN) 10.7% 13.3% 11.8% 12.7%20 Boston (BOS) 8.5% 15.8% 14.4% 11.2%21 St. Louis (STL) 8.5% 24.6% 3.1% 1.4%22 Atlanta (ATL) 7.8% 10.5% 6.1% 3.3%23 San Diego (SD) 7.6% 4.1% 12.7% 8.6%24 Los Angeles (LA) 6.7% 11.9% 4.0% 0.6%25 Toronto (TORO) 5.3% 4.2% 5.0% 0.5%26 Baltimore (BAL) 4.3% 10.0% 1.0% 3.7%27 Detroit (DET) 3.5% 7.7% 2.9% -0.7%28 Philadelphia (PHL) 2.5% 3.9% 3.0% 2.2%29 Vancouver (VAN) 2.4% 18.7% 18.4% 14.3%30 Washington, D.C. (DC) -2.2% 0.8% 3.4% 3.6%
Pittsburgh
2015 TECH-THIRTY | CBRE Research34

• The number of new development projects delivering creative space that tech tenants prefer has increased in recent quarters as supply in the market has tightened.
• Much of the new space will be offered at a premium compared to available space in existing buildings.
• Tech medical device companies are expanding; by attracting tech talent to the region, they are playing an important role in the development of the OC tech market.
Sources: U.S. Bureau of Labor Statistics and Statistics Canada, July 2015 and CBRE Research, Q2 2015.Ranked by high-tech job growth rate.
OFFICE MARKET STATS, Q2 2015
Average Asking RentFS/YR
$26.76
Vacancy Rate 9.2%
New SupplyUnder Construction
682,000 SF
Top Tech SubmarketRents/Vacancy
South Orange County$28.68 / 6.1%
TECH INDUSTRY STATS, 2014
EmploymentHigh-Tech Software/Services
30,134
Employment Clustering % of Office-Using Jobs
7.3%
Educational AttainmentResidents w/ BA or higher
37.3%
Labor Cost (MSA)Software Engineer
$109,816
SIGNIFICANT OFFICE LEASE DEALS, 2015
Skywork Solutions Inc. 5211 California Ave. 126,900 SF Kofax LTD. 15201 Laguna Canyon Rd. 91,200 SFEllipse Technologies 101 Enterprise 54,000 SFSource: CBRE Research, Q2 2015.
Source: CBRE Research, Q2 2015 and U.S. Bureau of Labor Statistics, July 2015.
32302826242220
430410390370350330310290270250
High-Tech Software/Service Jobs (L) Office-Using Jobs (R) (Excluding High-Tech)
2001 2002 2003 2004 2005 2006 2007 2008 2009 2010 2011 2012 2013 2014
HIGH-TECH SOFTWARE/SERVICES VS. OFFICE-USING JOBS (THOUSANDS)
Source: CBRE Research, Q2 2015.-10% 0% 10% 20% 30% 40%
Reston/Herndon (DC) NorthWest (DEN)
BWI (BALT) CBD (STL) CBD (IND)
River North (CHI) Northeast (CLT)
RTP/I-40 Corridor (R-D) North Fulton (ATL) Southvalley (SLC)
Far North Dallas (DFW) Yaletown & Gastown (VAN)
Tempe (PHX) Midtown South (NY)
Oakland (PIT) Toronto Downtown West (TORO)
Sorrento Mesa (SD) CBD (POR)
Ann Arbor (DET) Santa Monica (LA) North Loop (MIN)
University City (PHL) South Orange County (OC)
CBD (NASH) SOMA (SF)
Redwood City (SFP) East Cambridge (BOS)
Lake Union (SEA) Mountain View (SV)
RENT GROWTHTOP TECH SUBMARKET, PAST TWO YEARS (Q2 2013 TO Q2 2015)
NorthWest (AUS)
HOT TOPICS
QUICK STATS
Source: CBRE Research, Q2 2015. Net absorption growth as a % of market’s inventory
Washington, D.C. (DC) Toronto (TORO)
Baltimore (BALT) Chicago (CHI)
Vancouver (VAN) St. Louis (STL) New York (NY)
Pittsburgh (PIT) Minneapolis (MIN)
San Fran Peninsula (SFP) Denver (DEN) Boston (BOS)
San Diego (SD) Greater Los Angeles (LA)
Indianapolis (IND) Philadelphia (PHL)
Portland (POR) Atlanta (ATL)
Dallas/Ft. Worth (DFW) Orange County (OC)
Detroit (DET) Salt Lake City (SLC) San Francisco (SF) Nashville (NASH)
Seattle (SEA) Charlotte (CLT) Phoenix (PHO)
Raleigh-Durham (R-D) Austin (AUS)
Silicon Valley (SV)
NET ABSORPTION GROWTHOVERALL MARKET, PAST TWO YEARS (Q3 2013 - Q2 2015)
HIGH-TECH SOFTWARE/SERVICES JOB AND OFFICE RENT GROWTH
High-Tech Job Growth Office Market Rent Growth
Rank MarketCurrent Period
2012-2014Prior Period
2011-2013Current Period
Q2‘13-Q2‘15Prior Period
Q2‘12-Q2‘141 San Francisco (SF) 42.7% 50.9% 30.7% 34.6% 2 Phoenix (PHX) 42.7% 18.6% 8.3% 3.7%3 Austin (AUS) 33.0% 33.7% 11.4% 12.2%4 Silicon Valley (SV) 27.0% 20.0% 28.1% 21.4%5 Nashville (NASH) 22.7% 29.6% 8.9% 8.5%6 New York (NY) 22.6% 22.7% 14.1% 17.5%7 Seattle (SEA) 18.3% 17.0% 9.4% 8.0%8 Indianapolis (IND) 18.0% 20.7% 10.9% 9.5%9 Charlotte (CLT) 17.3% 13.4% 8.0% 4.3%
10 Salt Lake City (SLC) 16.2% 15.6% 8.8% 4.1%11 Portland (POR) 16.1% 12.3% 10.7% 6.1%12 San Francisco Pen. (SFP) 15.0% 30.2% 21.0% 19.3%13 Chicago (CHI) 14.9% 19.3% 6.2% 3.5%14 Raleigh-Durham (R-D) 14.2% 16.8% 23.4% -0.9%15 Pittsburgh (PIT) 14.1% 2.2% 12.4% 1.8%16 Orange County (OC) 12.9% 9.7% 16.1% 5.2%17 Dallas/Ft. Worth (DFW) 10.7% 16.4% 13.4% 12.0%18 Minneapolis (MIN) 10.7% 4.5% 10.9% 7.2%19 Denver (DEN) 10.7% 13.3% 11.8% 12.7%20 Boston (BOS) 8.5% 15.8% 14.4% 11.2%21 St. Louis (STL) 8.5% 24.6% 3.1% 1.4%22 Atlanta (ATL) 7.8% 10.5% 6.1% 3.3%23 San Diego (SD) 7.6% 4.1% 12.7% 8.6%24 Los Angeles (LA) 6.7% 11.9% 4.0% 0.6%25 Toronto (TORO) 5.3% 4.2% 5.0% 0.5%26 Baltimore (BAL) 4.3% 10.0% 1.0% 3.7%27 Detroit (DET) 3.5% 7.7% 2.9% -0.7%28 Philadelphia (PHL) 2.5% 3.9% 3.0% 2.2%29 Vancouver (VAN) 2.4% 18.7% 18.4% 14.3%30 Washington, D.C. (DC) -2.2% 0.8% 3.4% 3.6%
Orange County
35 © 2015, CBRE, Inc.

• Consolidations and expansions are causing high-tech occupiers in Dallas/Ft. Worth to require more office space, mainly in North Dallas.
• CoreLogic is combining its area offices into one 327,183 sq. ft. campus in the Cypress Waters development, with the relocation taking place in 2017.
• The software developer RealPage plans to add 500 jobs over the next year, outgrowing its current location and consolidating its 1,400 employees into one Richardson-based campus.
Sources: U.S. Bureau of Labor Statistics and Statistics Canada, July 2015 and CBRE Research, Q2 2015.Ranked by high-tech job growth rate.
OFFICE MARKET STATS, Q2 2015
Average Asking RentFS/YR
$20.75
Vacancy Rate 17.9%
New SupplyUnder Construction
7.2 MSF
Top Tech SubmarketRents/Vacancy
Far North Dallas$22.46 / 14.2%
HIGH-TECH INDUSTRY STATS, 2014
EmploymentHigh-Tech Software/Services
84,507
Employment Clustering % of Office-Using Jobs
9.9%
Educational AttainmentResidents w/ BA or higher
34.1%
Labor Cost (MSA)Software Engineer
$100,033
SIGNIFICANT OFFICE LEASE DEALS, 2015
RealPage 2201 Lakeside Blv. 400,000 SF CoreLogic Hackberry Rd. and Ranch Trl. 327,200 SFSamsung 400 Dividend Dr. 156,000 SFSource: CBRE Research, Q2 2015.
Source: CBRE Research, Q2 2015 and U.S. Bureau of Labor Statistics, July 2015.
95857565554535
800750700650600550500
High-Tech Software/Service Jobs (L) Office-Using Jobs (R) (Excluding High-Tech)
2001 2002 2003 2004 2005 2006 2007 2008 2009 2010 2011 2012 2013 2014
HIGH-TECH SOFTWARE/SERVICES VS. OFFICE-USING JOBS (THOUSANDS)
Source: CBRE Research, Q2 2015. Net absorption growth as a % of market’s inventory
Washington, D.C. (DC) Toronto (TORO)
Baltimore (BALT) Chicago (CHI)
Vancouver (VAN) St. Louis (STL) New York (NY)
Pittsburgh (PIT) Minneapolis (MIN)
San Fran Peninsula (SFP) Denver (DEN) Boston (BOS)
San Diego (SD) Greater Los Angeles (LA)
Indianapolis (IND) Philadelphia (PHL)
Portland (POR) Atlanta (ATL)
Dallas/Ft. Worth (DFW) Orange County (OC)
Detroit (DET) Salt Lake City (SLC) San Francisco (SF) Nashville (NASH)
Seattle (SEA) Charlotte (CLT) Phoenix (PHO)
Raleigh-Durham (R-D) Austin (AUS)
Silicon Valley (SV)
NET ABSORPTION GROWTHOVERALL MARKET, PAST TWO YEARS (Q3 2013 - Q2 2015)
Source: CBRE Research, Q2 2015.-10% 0% 10% 20% 30% 40%
Reston/Herndon (DC) NorthWest (DEN)
BWI (BALT) CBD (STL) CBD (IND)
River North (CHI) Northeast (CLT)
RTP/I-40 Corridor (R-D) North Fulton (ATL) Southvalley (SLC)
Far North Dallas (DFW) Yaletown & Gastown (VAN)
Tempe (PHX) Midtown South (NY)
Oakland (PIT) Toronto Downtown West (TORO)
Sorrento Mesa (SD) CBD (POR)
Ann Arbor (DET) Santa Monica (LA) North Loop (MIN)
University City (PHL) South Orange County (OC)
CBD (NASH) SOMA (SF)
Redwood City (SFP) East Cambridge (BOS)
Lake Union (SEA) Mountain View (SV)
RENT GROWTHTOP TECH SUBMARKET, PAST TWO YEARS (Q2 2013 TO Q2 2015)
NorthWest (AUS)
HOT TOPICS
QUICK STATS
HIGH-TECH SOFTWARE/SERVICES JOB AND OFFICE RENT GROWTH
High-Tech Job Growth Office Market Rent Growth
Rank MarketCurrent Period
2012-2014Prior Period
2011-2013Current Period
Q2‘13-Q2‘15Prior Period
Q2‘12-Q2‘141 San Francisco (SF) 42.7% 50.9% 30.7% 34.6% 2 Phoenix (PHX) 42.7% 18.6% 8.3% 3.7%3 Austin (AUS) 33.0% 33.7% 11.4% 12.2%4 Silicon Valley (SV) 27.0% 20.0% 28.1% 21.4%5 Nashville (NASH) 22.7% 29.6% 8.9% 8.5%6 New York (NY) 22.6% 22.7% 14.1% 17.5%7 Seattle (SEA) 18.3% 17.0% 9.4% 8.0%8 Indianapolis (IND) 18.0% 20.7% 10.9% 9.5%9 Charlotte (CLT) 17.3% 13.4% 8.0% 4.3%
10 Salt Lake City (SLC) 16.2% 15.6% 8.8% 4.1%11 Portland (POR) 16.1% 12.3% 10.7% 6.1%12 San Francisco Pen. (SFP) 15.0% 30.2% 21.0% 19.3%13 Chicago (CHI) 14.9% 19.3% 6.2% 3.5%14 Raleigh-Durham (R-D) 14.2% 16.8% 23.4% -0.9%15 Pittsburgh (PIT) 14.1% 2.2% 12.4% 1.8%16 Orange County (OC) 12.9% 9.7% 16.1% 5.2%17 Dallas/Ft. Worth (DFW) 10.7% 16.4% 13.4% 12.0%18 Minneapolis (MIN) 10.7% 4.5% 10.9% 7.2%19 Denver (DEN) 10.7% 13.3% 11.8% 12.7%20 Boston (BOS) 8.5% 15.8% 14.4% 11.2%21 St. Louis (STL) 8.5% 24.6% 3.1% 1.4%22 Atlanta (ATL) 7.8% 10.5% 6.1% 3.3%23 San Diego (SD) 7.6% 4.1% 12.7% 8.6%24 Los Angeles (LA) 6.7% 11.9% 4.0% 0.6%25 Toronto (TORO) 5.3% 4.2% 5.0% 0.5%26 Baltimore (BAL) 4.3% 10.0% 1.0% 3.7%27 Detroit (DET) 3.5% 7.7% 2.9% -0.7%28 Philadelphia (PHL) 2.5% 3.9% 3.0% 2.2%29 Vancouver (VAN) 2.4% 18.7% 18.4% 14.3%30 Washington, D.C. (DC) -2.2% 0.8% 3.4% 3.6%
Dallas/Ft. Worth
2015 TECH-THIRTY | CBRE Research36

• A highly educated workforce and burgeoning tech startup community have led to a growing number of tech companies being located in the Twin Cities.
• Tech companies continue to gravitate to non-traditional office space just outside the downtown core, in the North Loop and Northeast submarkets.
• A dearth of large contiguous blocks of space has spurred developers to buy old warehouse buildings, refurbishing them into non-traditional office space.
• The downtown core also benefits from tech company expansion, offering amenities such as fitness centers and access to the light rail.
Sources: U.S. Bureau of Labor Statistics and Statistics Canada, July 2015 and CBRE Research, Q2 2015.Ranked by high-tech job growth rate.
OFFICE MARKET STATS, Q2 2015
Average Asking RentFS/YR
$24.86
Vacancy Rate 15.4%
New SupplyUnder Construction
180,000 SF
Top Tech SubmarketRents/Vacancy
North Loop$24.03 / 8.1%
TECH INDUSTRY STATS, 2014
EmploymentHigh-Tech Software/Services
45,997
Employment Clustering % of Office-Using Jobs
8.5%
Educational AttainmentResidents w/ BA or higher
39.3%
Labor Cost (MSA)Software Engineer
$94,869
SIGNIFICANT OFFICE LEASE DEALS, 2015
JAMF Software 100 Washington Ave. S 52,100 SF McKesson Technologies 2700 Snelling Ave. 25,500 SFMednet 110 Cheshire Ln. 20,000 SFSource: CBRE Research, Q2 2015.
Source: CBRE Research, Q2 2015 and U.S. Bureau of Labor Statistics, July 2015.
48464442403836343230
520500480460440420400
High-Tech Software/Service Jobs (L) Office-Using Jobs (R) (Excluding High-Tech)
2001 2002 2003 2004 2005 2006 2007 2008 2009 2010 2011 2012 2013 2014
HIGH-TECH SOFTWARE/SERVICES VS. OFFICE-USING JOBS (THOUSANDS)
Source: CBRE Research, Q2 2015. Net absorption growth as a % of market’s inventory
Washington, D.C. (DC) Toronto (TORO)
Baltimore (BALT) Chicago (CHI)
Vancouver (VAN) St. Louis (STL) New York (NY)
Pittsburgh (PIT) Minneapolis (MIN)
San Fran Peninsula (SFP) Denver (DEN) Boston (BOS)
San Diego (SD) Greater Los Angeles (LA)
Indianapolis (IND) Philadelphia (PHL)
Portland (POR) Atlanta (ATL)
Dallas/Ft. Worth (DFW) Orange County (OC)
Detroit (DET) Salt Lake City (SLC) San Francisco (SF) Nashville (NASH)
Seattle (SEA) Charlotte (CLT) Phoenix (PHO)
Raleigh-Durham (R-D) Austin (AUS)
Silicon Valley (SV)
NET ABSORPTION GROWTHOVERALL MARKET, PAST TWO YEARS (Q3 2013 - Q2 2015)
Source: CBRE Research, Q2 2015.-10% 0% 10% 20% 30% 40%
Reston/Herndon (DC) NorthWest (DEN)
BWI (BALT) CBD (STL) CBD (IND)
River North (CHI) Northeast (CLT)
RTP/I-40 Corridor (R-D) North Fulton (ATL) Southvalley (SLC)
Far North Dallas (DFW) Yaletown & Gastown (VAN)
Tempe (PHX) Midtown South (NY)
Oakland (PIT) Toronto Downtown West (TORO)
Sorrento Mesa (SD) CBD (POR)
Ann Arbor (DET) Santa Monica (LA) North Loop (MIN)
University City (PHL) South Orange County (OC)
CBD (NASH) SOMA (SF)
Redwood City (SFP) East Cambridge (BOS)
Lake Union (SEA) Mountain View (SV)
RENT GROWTHTOP TECH SUBMARKET, PAST TWO YEARS (Q2 2013 TO Q2 2015)
NorthWest (AUS)
HOT TOPICS
QUICK STATS
HIGH-TECH SOFTWARE/SERVICES JOB AND OFFICE RENT GROWTH
High-Tech Job Growth Office Market Rent Growth
Rank MarketCurrent Period
2012-2014Prior Period
2011-2013Current Period
Q2‘13-Q2‘15Prior Period
Q2‘12-Q2‘141 San Francisco (SF) 42.7% 50.9% 30.7% 34.6% 2 Phoenix (PHX) 42.7% 18.6% 8.3% 3.7%3 Austin (AUS) 33.0% 33.7% 11.4% 12.2%4 Silicon Valley (SV) 27.0% 20.0% 28.1% 21.4%5 Nashville (NASH) 22.7% 29.6% 8.9% 8.5%6 New York (NY) 22.6% 22.7% 14.1% 17.5%7 Seattle (SEA) 18.3% 17.0% 9.4% 8.0%8 Indianapolis (IND) 18.0% 20.7% 10.9% 9.5%9 Charlotte (CLT) 17.3% 13.4% 8.0% 4.3%
10 Salt Lake City (SLC) 16.2% 15.6% 8.8% 4.1%11 Portland (POR) 16.1% 12.3% 10.7% 6.1%12 San Francisco Pen. (SFP) 15.0% 30.2% 21.0% 19.3%13 Chicago (CHI) 14.9% 19.3% 6.2% 3.5%14 Raleigh-Durham (R-D) 14.2% 16.8% 23.4% -0.9%15 Pittsburgh (PIT) 14.1% 2.2% 12.4% 1.8%16 Orange County (OC) 12.9% 9.7% 16.1% 5.2%17 Dallas/Ft. Worth (DFW) 10.7% 16.4% 13.4% 12.0%18 Minneapolis (MIN) 10.7% 4.5% 10.9% 7.2%19 Denver (DEN) 10.7% 13.3% 11.8% 12.7%20 Boston (BOS) 8.5% 15.8% 14.4% 11.2%21 St. Louis (STL) 8.5% 24.6% 3.1% 1.4%22 Atlanta (ATL) 7.8% 10.5% 6.1% 3.3%23 San Diego (SD) 7.6% 4.1% 12.7% 8.6%24 Los Angeles (LA) 6.7% 11.9% 4.0% 0.6%25 Toronto (TORO) 5.3% 4.2% 5.0% 0.5%26 Baltimore (BAL) 4.3% 10.0% 1.0% 3.7%27 Detroit (DET) 3.5% 7.7% 2.9% -0.7%28 Philadelphia (PHL) 2.5% 3.9% 3.0% 2.2%29 Vancouver (VAN) 2.4% 18.7% 18.4% 14.3%30 Washington, D.C. (DC) -2.2% 0.8% 3.4% 3.6%
Minneapolis
37 © 2015, CBRE, Inc.

• High-tech tenants accounted for more than 8.0% of the active tenants in the CBD in Q2 2015, compared to just over 4.0% a year earlier.
• Over the past 18 months, high-tech was the third largest demand driver for deals larger than 10,000 sq. ft., accounting for 11.8% of total activity.
• The bulk of high-tech-occupied space remains in the Northwest and Boulder submarkets.
• Startups and smaller tech companies prefer the Downtown Boulder and Downtown Denver submarkets, where creative space is readily available and companies have access to a talented labor pool.
Sources: U.S. Bureau of Labor Statistics and Statistics Canada, July 2015 and CBRE Research, Q2 2015.Ranked by high-tech job growth rate.
OFFICE MARKET STATS, Q2 2015
Average Asking RentFS/YR
$24.15
Vacancy Rate 13.2%
New SupplyUnder Construction
3.1 MSF
Top Tech SubmarketRents/Vacancy
NorthWest$24.54 / 15.3%
HIGH-TECH INDUSTRY STATS, 2014
EmploymentHigh-Tech Software/Services
58,014
Employment Clustering % of Office-Using Jobs
13.5%
Educational AttainmentResidents w/ BA or higher
42.2%
Labor Cost (MSA)Software Engineer
$102,245
SIGNIFICANT OFFICE LEASE DEALS, 2015
Confidential 2930 Pearl St. 200,000 SF Four Winds Interactive 1221 Broadway St. 53,000 SFTravelport 9200 E Panorama Cir. 35,000 SFSource: CBRE Research, Q2 2015.
Source: CBRE Research, Q2 2015 and U.S. Bureau of Labor Statistics, July 2015.
605550454035
380370360350340330320310300
High-Tech Software/Service Jobs (L) Office-Using Jobs (R) (Excluding High-Tech)
2001 2002 2003 2004 2005 2006 2007 2008 2009 2010 2011 2012 2013 2014
HIGH-TECH SOFTWARE/SERVICES VS. OFFICE-USING JOBS (THOUSANDS)
Source: CBRE Research, Q2 2015. Net absorption growth as a % of market’s inventory
Washington, D.C. (DC)
Toronto (TORO) Baltimore (BALT)
Chicago (CHI) Vancouver (VAN)
St. Louis (STL) New York (NY)
Pittsburgh (PIT) Minneapolis (MIN)
San Fran Peninsula (SFP) Denver (DEN) Boston (BOS)
San Diego (SD) Greater Los Angeles (LA)
Indianapolis (IND) Philadelphia (PHL)
Portland (POR) Atlanta (ATL)
Dallas/Ft. Worth (DFW) Orange County (OC)
Detroit (DET) Salt Lake City (SLC) San Francisco (SF) Nashville (NASH)
Seattle (SEA) Charlotte (CLT) Phoenix (PHO)
Raleigh-Durham (R-D) Austin (AUS)
Silicon Valley (SV)
NET ABSORPTION GROWTHOVERALL MARKET, PAST TWO YEARS (Q3 2013 - Q2 2015)
Source: CBRE Research, Q2 2015.-10% 0% 10% 20% 30% 40%
Reston/Herndon (DC)
BWI (BALT) CBD (STL) CBD (IND)
River North (CHI) Northeast (CLT)
RTP/I-40 Corridor (R-D) North Fulton (ATL) Southvalley (SLC)
Far North Dallas (DFW) Yaletown & Gastown (VAN)
Tempe (PHX) Midtown South (NY)
Oakland (PIT) Toronto Downtown West (TORO)
Sorrento Mesa (SD) CBD (POR)
Ann Arbor (DET) Santa Monica (LA) North Loop (MIN)
University City (PHL) South Orange County (OC)
CBD (NASH) SOMA (SF)
Redwood City (SFP) East Cambridge (BOS)
Lake Union (SEA) Mountain View (SV)
RENT GROWTHTOP TECH SUBMARKET, PAST TWO YEARS (Q2 2013 TO Q2 2015)
NorthWest (AUS)
HOT TOPICS
QUICK STATS
HIGH-TECH SOFTWARE/SERVICES JOB AND OFFICE RENT GROWTH
High-Tech Job Growth Office Market Rent Growth
Rank MarketCurrent Period
2012-2014Prior Period
2011-2013Current Period
Q2‘13-Q2‘15Prior Period
Q2‘12-Q2‘141 San Francisco (SF) 42.7% 50.9% 30.7% 34.6% 2 Phoenix (PHX) 42.7% 18.6% 8.3% 3.7%3 Austin (AUS) 33.0% 33.7% 11.4% 12.2%4 Silicon Valley (SV) 27.0% 20.0% 28.1% 21.4%5 Nashville (NASH) 22.7% 29.6% 8.9% 8.5%6 New York (NY) 22.6% 22.7% 14.1% 17.5%7 Seattle (SEA) 18.3% 17.0% 9.4% 8.0%8 Indianapolis (IND) 18.0% 20.7% 10.9% 9.5%9 Charlotte (CLT) 17.3% 13.4% 8.0% 4.3%
10 Salt Lake City (SLC) 16.2% 15.6% 8.8% 4.1%11 Portland (POR) 16.1% 12.3% 10.7% 6.1%12 San Francisco Pen. (SFP) 15.0% 30.2% 21.0% 19.3%13 Chicago (CHI) 14.9% 19.3% 6.2% 3.5%14 Raleigh-Durham (R-D) 14.2% 16.8% 23.4% -0.9%15 Pittsburgh (PIT) 14.1% 2.2% 12.4% 1.8%16 Orange County (OC) 12.9% 9.7% 16.1% 5.2%17 Dallas/Ft. Worth (DFW) 10.7% 16.4% 13.4% 12.0%18 Minneapolis (MIN) 10.7% 4.5% 10.9% 7.2%19 Denver (DEN) 10.7% 13.3% 11.8% 12.7%20 Boston (BOS) 8.5% 15.8% 14.4% 11.2%21 St. Louis (STL) 8.5% 24.6% 3.1% 1.4%22 Atlanta (ATL) 7.8% 10.5% 6.1% 3.3%23 San Diego (SD) 7.6% 4.1% 12.7% 8.6%24 Los Angeles (LA) 6.7% 11.9% 4.0% 0.6%25 Toronto (TORO) 5.3% 4.2% 5.0% 0.5%26 Baltimore (BAL) 4.3% 10.0% 1.0% 3.7%27 Detroit (DET) 3.5% 7.7% 2.9% -0.7%28 Philadelphia (PHL) 2.5% 3.9% 3.0% 2.2%29 Vancouver (VAN) 2.4% 18.7% 18.4% 14.3%30 Washington, D.C. (DC) -2.2% 0.8% 3.4% 3.6%
Denver
Northwest (DEN)
2015 TECH-THIRTY | CBRE Research38

• Generating a constant stream of highly qualified tech workers, Harvard and MIT make East Cambridge one of the hottest tech markets in the country.
• Boston and Cambridge have a number of co-working spaces, the vast majority of which are geared specifically toward the small technology tenant.
• Proximity to some of the world’s most prestigious healthcare organizations supports growth in the digital health sector, and increases demand for a large pool of talent.
Sources: U.S. Bureau of Labor Statistics and Statistics Canada, July 2015 and CBRE Research, Q2 2015.Ranked by high-tech job growth rate.
OFFICE MARKET STATS, Q2 2015
Average Asking RentFS/YR
$33.77
Vacancy Rate 12.4%
New SupplyUnder Construction
5.1 MSF
Top Tech SubmarketRents/Vacancy
East Cambridge$63.37 / 4.1%
TECH INDUSTRY STATS, 2014
EmploymentHigh-Tech Software/Services
99,284
Employment Clustering % of Office-Using Jobs
16.1%
Educational AttainmentResidents w/ BA or higher
46.9%
Labor Cost (MSA)Software Engineer
$114,353
SIGNIFICANT OFFICE LEASE DEALS, 2015
Autodesk 21-25 Drydock Ave. 72,000 SF Akamai 50 Hampshire St. 65,824 SFBroadcom 200 Brickstone Sq. 61,000 SFSource: CBRE Research, Q2 2015.
Source: CBRE Research, Q2 2015 and U.S. Bureau of Labor Statistics, July 2015.
110100
9080706050
550540530520510500490480470460450
High-Tech Software/Service Jobs (L) Office-Using Jobs (R) (Excluding High-Tech)
2001 2002 2003 2004 2005 2006 2007 2008 2009 2010 2011 2012 2013 2014
HIGH-TECH SOFTWARE/SERVICES VS. OFFICE-USING JOBS (THOUSANDS)
Source: CBRE Research, Q2 2015. Net absorption growth as a % of market’s inventory
Washington, D.C. (DC)
Toronto (TORO) Baltimore (BALT)
Chicago (CHI) Vancouver (VAN)
St. Louis (STL) New York (NY)
Pittsburgh (PIT) Minneapolis (MIN)
San Fran Peninsula (SFP) Denver (DEN) Boston (BOS)
San Diego (SD) Greater Los Angeles (LA)
Indianapolis (IND) Philadelphia (PHL)
Portland (POR) Atlanta (ATL)
Dallas/Ft. Worth (DFW) Orange County (OC)
Detroit (DET) Salt Lake City (SLC) San Francisco (SF) Nashville (NASH)
Seattle (SEA) Charlotte (CLT) Phoenix (PHO)
Raleigh-Durham (R-D) Austin (AUS)
Silicon Valley (SV)
NET ABSORPTION GROWTHOVERALL MARKET, PAST TWO YEARS (Q3 2013 - Q2 2015)
Source: CBRE Research, Q2 2015.-10% 0% 10% 20% 30% 40%
Reston/Herndon (DC) NorthWest (DEN)
BWI (BALT) CBD (STL) CBD (IND)
River North (CHI) Northeast (CLT)
RTP/I-40 Corridor (R-D) North Fulton (ATL) Southvalley (SLC)
Far North Dallas (DFW) Yaletown & Gastown (VAN)
Tempe (PHX) Midtown South (NY)
Oakland (PIT) Toronto Downtown West (TORO)
Sorrento Mesa (SD) CBD (POR)
Ann Arbor (DET) Santa Monica (LA) North Loop (MIN)
University City (PHL) South Orange County (OC)
CBD (NASH) SOMA (SF)
Redwood City (SFP) East Cambridge (BOS)
Lake Union (SEA) Mountain View (SV)
RENT GROWTHTOP TECH SUBMARKET, PAST TWO YEARS (Q2 2013 TO Q2 2015)
NorthWest (AUS)
HOT TOPICS
QUICK STATS
HIGH-TECH SOFTWARE/SERVICES JOB AND OFFICE RENT GROWTH
High-Tech Job Growth Office Market Rent Growth
Rank MarketCurrent Period
2012-2014Prior Period
2011-2013Current Period
Q2‘13-Q2‘15Prior Period
Q2‘12-Q2‘141 San Francisco (SF) 42.7% 50.9% 30.7% 34.6% 2 Phoenix (PHX) 42.7% 18.6% 8.3% 3.7%3 Austin (AUS) 33.0% 33.7% 11.4% 12.2%4 Silicon Valley (SV) 27.0% 20.0% 28.1% 21.4%5 Nashville (NASH) 22.7% 29.6% 8.9% 8.5%6 New York (NY) 22.6% 22.7% 14.1% 17.5%7 Seattle (SEA) 18.3% 17.0% 9.4% 8.0%8 Indianapolis (IND) 18.0% 20.7% 10.9% 9.5%9 Charlotte (CLT) 17.3% 13.4% 8.0% 4.3%
10 Salt Lake City (SLC) 16.2% 15.6% 8.8% 4.1%11 Portland (POR) 16.1% 12.3% 10.7% 6.1%12 San Francisco Pen. (SFP) 15.0% 30.2% 21.0% 19.3%13 Chicago (CHI) 14.9% 19.3% 6.2% 3.5%14 Raleigh-Durham (R-D) 14.2% 16.8% 23.4% -0.9%15 Pittsburgh (PIT) 14.1% 2.2% 12.4% 1.8%16 Orange County (OC) 12.9% 9.7% 16.1% 5.2%17 Dallas/Ft. Worth (DFW) 10.7% 16.4% 13.4% 12.0%18 Minneapolis (MIN) 10.7% 4.5% 10.9% 7.2%19 Denver (DEN) 10.7% 13.3% 11.8% 12.7%20 Boston (BOS) 8.5% 15.8% 14.4% 11.2%21 St. Louis (STL) 8.5% 24.6% 3.1% 1.4%22 Atlanta (ATL) 7.8% 10.5% 6.1% 3.3%23 San Diego (SD) 7.6% 4.1% 12.7% 8.6%24 Los Angeles (LA) 6.7% 11.9% 4.0% 0.6%25 Toronto (TORO) 5.3% 4.2% 5.0% 0.5%26 Baltimore (BAL) 4.3% 10.0% 1.0% 3.7%27 Detroit (DET) 3.5% 7.7% 2.9% -0.7%28 Philadelphia (PHL) 2.5% 3.9% 3.0% 2.2%29 Vancouver (VAN) 2.4% 18.7% 18.4% 14.3%30 Washington, D.C. (DC) -2.2% 0.8% 3.4% 3.6%
Boston
39 © 2015, CBRE, Inc.

• Tech companies are a source of high-wage job creation and support for new construction and the conversion of historical buildings.
• St. Louis is a lower-cost market, and high-tech companies are attracted to the area through Arch grants and state incentives.
• World Wide Technology is planning to build a new seven-story, 225,000-sq.-ft., owner-occupied headquarters in Westport Plaza.
• Incubator/shared workspace facilities have grown significantly, with the addition of four large spaces in the last few years.
Sources: U.S. Bureau of Labor Statistics and Statistics Canada, July 2015 and CBRE Research, Q2 2015.Ranked by high-tech job growth rate.
OFFICE MARKET STATS, Q2 2015
Average Asking RentFS/YR
$18.58
Vacancy Rate 16.3%
New SupplyUnder Construction
0 SF
Top Tech SubmarketRents/Vacancy
CBD$15.42 / 28%
HIGH-TECH INDUSTRY STATS, 2014
EmploymentHigh-Tech Software/Services
21,230
Employment Clustering % of Office-Using Jobs
7.3%
Educational AttainmentResidents w/ BA or higher
36.7%
Labor Cost (MSA)Software Engineer
$95,755
SIGNIFICANT OFFICE LEASE DEALS, 2015
Ricoh 1400 S. Hwy Dr. 17,300 SF World Wide Technology 111 Westport Plz 12,900 SFIndustrious 555 Washington Ave. 11,000 SFSource: CBRE Research, Q2 2015.
Source: CBRE Research, Q2 2015 and U.S. Bureau of Labor Statistics, July 2015.
222120191817161514
285280275270265260255250245
High-Tech Software/Service Jobs (L) Office-Using Jobs (R) (Excluding High-Tech)
2001 2002 2003 2004 2005 2006 2007 2008 2009 2010 2011 2012 2013 2014
HIGH-TECH SOFTWARE/SERVICES VS. OFFICE-USING JOBS (THOUSANDS)
Source: CBRE Research, Q2 2015. Net absorption growth as a % of market’s inventory
Washington, D.C. (DC)
Toronto (TORO) Baltimore (BALT)
Chicago (CHI) Vancouver (VAN)
St. Louis (STL) New York (NY)
Pittsburgh (PIT) Minneapolis (MIN)
San Fran Peninsula (SFP) Denver (DEN) Boston (BOS)
San Diego (SD) Greater Los Angeles (LA)
Indianapolis (IND) Philadelphia (PHL)
Portland (POR) Atlanta (ATL)
Dallas/Ft. Worth (DFW) Orange County (OC)
Detroit (DET) Salt Lake City (SLC) San Francisco (SF) Nashville (NASH)
Seattle (SEA) Charlotte (CLT) Phoenix (PHO)
Raleigh-Durham (R-D) Austin (AUS)
Silicon Valley (SV)
NET ABSORPTION GROWTHOVERALL MARKET, PAST TWO YEARS (Q3 2013 - Q2 2015)
Source: CBRE Research, Q2 2015.-10% 0% 10% 20% 30% 40%
Reston/Herndon (DC) NorthWest (DEN)
BWI (BALT) CBD (STL) CBD (IND)
River North (CHI) Northeast (CLT)
RTP/I-40 Corridor (R-D) North Fulton (ATL) Southvalley (SLC)
Far North Dallas (DFW) Yaletown & Gastown (VAN)
Tempe (PHX) Midtown South (NY)
Oakland (PIT) Toronto Downtown West (TORO)
Sorrento Mesa (SD) CBD (POR)
Ann Arbor (DET) Santa Monica (LA) North Loop (MIN)
University City (PHL) South Orange County (OC)
CBD (NASH) SOMA (SF)
Redwood City (SFP) East Cambridge (BOS)
Lake Union (SEA) Mountain View (SV)
RENT GROWTHTOP TECH SUBMARKET, PAST TWO YEARS (Q2 2013 TO Q2 2015)
NorthWest (AUS)
HOT TOPICS
QUICK STATS
HIGH-TECH SOFTWARE/SERVICES JOB AND OFFICE RENT GROWTH
High-Tech Job Growth Office Market Rent Growth
Rank MarketCurrent Period
2012-2014Prior Period
2011-2013Current Period
Q2‘13-Q2‘15Prior Period
Q2‘12-Q2‘141 San Francisco (SF) 42.7% 50.9% 30.7% 34.6% 2 Phoenix (PHX) 42.7% 18.6% 8.3% 3.7%3 Austin (AUS) 33.0% 33.7% 11.4% 12.2%4 Silicon Valley (SV) 27.0% 20.0% 28.1% 21.4%5 Nashville (NASH) 22.7% 29.6% 8.9% 8.5%6 New York (NY) 22.6% 22.7% 14.1% 17.5%7 Seattle (SEA) 18.3% 17.0% 9.4% 8.0%8 Indianapolis (IND) 18.0% 20.7% 10.9% 9.5%9 Charlotte (CLT) 17.3% 13.4% 8.0% 4.3%
10 Salt Lake City (SLC) 16.2% 15.6% 8.8% 4.1%11 Portland (POR) 16.1% 12.3% 10.7% 6.1%12 San Francisco Pen. (SFP) 15.0% 30.2% 21.0% 19.3%13 Chicago (CHI) 14.9% 19.3% 6.2% 3.5%14 Raleigh-Durham (R-D) 14.2% 16.8% 23.4% -0.9%15 Pittsburgh (PIT) 14.1% 2.2% 12.4% 1.8%16 Orange County (OC) 12.9% 9.7% 16.1% 5.2%17 Dallas/Ft. Worth (DFW) 10.7% 16.4% 13.4% 12.0%18 Minneapolis (MIN) 10.7% 4.5% 10.9% 7.2%19 Denver (DEN) 10.7% 13.3% 11.8% 12.7%20 Boston (BOS) 8.5% 15.8% 14.4% 11.2%21 St. Louis (STL) 8.5% 24.6% 3.1% 1.4%22 Atlanta (ATL) 7.8% 10.5% 6.1% 3.3%23 San Diego (SD) 7.6% 4.1% 12.7% 8.6%24 Los Angeles (LA) 6.7% 11.9% 4.0% 0.6%25 Toronto (TORO) 5.3% 4.2% 5.0% 0.5%26 Baltimore (BAL) 4.3% 10.0% 1.0% 3.7%27 Detroit (DET) 3.5% 7.7% 2.9% -0.7%28 Philadelphia (PHL) 2.5% 3.9% 3.0% 2.2%29 Vancouver (VAN) 2.4% 18.7% 18.4% 14.3%30 Washington, D.C. (DC) -2.2% 0.8% 3.4% 3.6%
St. Louis
2015 TECH-THIRTY | CBRE Research40

• Georgia Tech is cultivating a startup culture to feed into the area’s growing high-tech industry.
• High-paying jobs associated with tech companies and Atlanta’s low cost of living are attracting millennials from universities across the south to the Midtown and West Midtown submarkets.
• Preferring mass transit and other urban amenities, millennials are moving towards the CBD in growing numbers—and tech companies are following. Midtown is starting to attract a larger tech presence, over the more traditional North Fulton submarket.
Sources: U.S. Bureau of Labor Statistics and Statistics Canada, July 2015 and CBRE Research, Q2 2015.Ranked by high-tech job growth rate.
OFFICE MARKET STATS, Q2 2015
Average Asking RentFS/YR
$21.28
Vacancy Rate 18.1%
New SupplyUnder Construction
500,000 SF
Top Tech SubmarketRents/Vacancy
North Fulton$20.25 / 15.4%
TECH INDUSTRY STATS, 2014
EmploymentHigh-Tech Software/Services
67,024
Employment Clustering % of Office-Using Jobs
10.4%
Educational AttainmentResidents w/ BA or higher
35.2%
Labor Cost (MSA)Software Engineer
$94,448
SIGNIFICANT OFFICE LEASE DEALS, 2015
Fiserv 2900 and 2950 Westside Pkwy. 376,000 SF Manhattan Associates, Inc. 2300 Windy Ridge Pkwy. 191,000 SFSITA 3100 Cumberland Blvd. 156,200 SFSource: CBRE Research, Q2 2015.
Source: CBRE Research, Q2 2015 and U.S. Bureau of Labor Statistics, July 2015.
706560555045
0
600550500450400350300
High-Tech Software/Service Jobs (L) Office-Using Jobs (R) (Excluding High-Tech)
2001 2002 2003 2004 2005 2006 2007 2008 2009 2010 2011 2012 2013 2014
HIGH-TECH SOFTWARE/SERVICES VS. OFFICE-USING JOBS (THOUSANDS)
Source: CBRE Research, Q2 2015. Net absorption growth as a % of market’s inventory
Washington, D.C. (DC) Toronto (TORO)
Baltimore (BALT) Chicago (CHI)
Vancouver (VAN) St. Louis (STL) New York (NY)
Pittsburgh (PIT) Minneapolis (MIN)
San Fran Peninsula (SFP) Denver (DEN) Boston (BOS)
San Diego (SD) Greater Los Angeles (LA)
Indianapolis (IND) Philadelphia (PHL)
Portland (POR) Atlanta (ATL)
Dallas/Ft. Worth (DFW) Orange County (OC)
Detroit (DET) Salt Lake City (SLC) San Francisco (SF) Nashville (NASH)
Seattle (SEA) Charlotte (CLT) Phoenix (PHO)
Raleigh-Durham (R-D) Austin (AUS)
Silicon Valley (SV)
NET ABSORPTION GROWTHOVERALL MARKET, PAST TWO YEARS (Q3 2013 - Q2 2015)
Source: CBRE Research, Q2 2015.-10% 0% 10% 20% 30% 40%
Reston/Herndon (DC) NorthWest (DEN)
BWI (BALT) CBD (STL) CBD (IND)
River North (CHI) Northeast (CLT)
RTP/I-40 Corridor (R-D) North Fulton (ATL) Southvalley (SLC)
Far North Dallas (DFW) Yaletown & Gastown (VAN)
Tempe (PHX) Midtown South (NY)
Oakland (PIT) Toronto Downtown West (TORO)
Sorrento Mesa (SD) CBD (POR)
Ann Arbor (DET) Santa Monica (LA) North Loop (MIN)
University City (PHL) South Orange County (OC)
CBD (NASH) SOMA (SF)
Redwood City (SFP) East Cambridge (BOS)
Lake Union (SEA) Mountain View (SV)
RENT GROWTHTOP TECH SUBMARKET, PAST TWO YEARS (Q2 2013 TO Q2 2015)
NorthWest (AUS)
HOT TOPICS
QUICK STATS
HIGH-TECH SOFTWARE/SERVICES JOB AND OFFICE RENT GROWTH
High-Tech Job Growth Office Market Rent Growth
Rank MarketCurrent Period
2012-2014Prior Period
2011-2013Current Period
Q2‘13-Q2‘15Prior Period
Q2‘12-Q2‘141 San Francisco (SF) 42.7% 50.9% 30.7% 34.6% 2 Phoenix (PHX) 42.7% 18.6% 8.3% 3.7%3 Austin (AUS) 33.0% 33.7% 11.4% 12.2%4 Silicon Valley (SV) 27.0% 20.0% 28.1% 21.4%5 Nashville (NASH) 22.7% 29.6% 8.9% 8.5%6 New York (NY) 22.6% 22.7% 14.1% 17.5%7 Seattle (SEA) 18.3% 17.0% 9.4% 8.0%8 Indianapolis (IND) 18.0% 20.7% 10.9% 9.5%9 Charlotte (CLT) 17.3% 13.4% 8.0% 4.3%
10 Salt Lake City (SLC) 16.2% 15.6% 8.8% 4.1%11 Portland (POR) 16.1% 12.3% 10.7% 6.1%12 San Francisco Pen. (SFP) 15.0% 30.2% 21.0% 19.3%13 Chicago (CHI) 14.9% 19.3% 6.2% 3.5%14 Raleigh-Durham (R-D) 14.2% 16.8% 23.4% -0.9%15 Pittsburgh (PIT) 14.1% 2.2% 12.4% 1.8%16 Orange County (OC) 12.9% 9.7% 16.1% 5.2%17 Dallas/Ft. Worth (DFW) 10.7% 16.4% 13.4% 12.0%18 Minneapolis (MIN) 10.7% 4.5% 10.9% 7.2%19 Denver (DEN) 10.7% 13.3% 11.8% 12.7%20 Boston (BOS) 8.5% 15.8% 14.4% 11.2%21 St. Louis (STL) 8.5% 24.6% 3.1% 1.4%22 Atlanta (ATL) 7.8% 10.5% 6.1% 3.3%23 San Diego (SD) 7.6% 4.1% 12.7% 8.6%24 Los Angeles (LA) 6.7% 11.9% 4.0% 0.6%25 Toronto (TORO) 5.3% 4.2% 5.0% 0.5%26 Baltimore (BAL) 4.3% 10.0% 1.0% 3.7%27 Detroit (DET) 3.5% 7.7% 2.9% -0.7%28 Philadelphia (PHL) 2.5% 3.9% 3.0% 2.2%29 Vancouver (VAN) 2.4% 18.7% 18.4% 14.3%30 Washington, D.C. (DC) -2.2% 0.8% 3.4% 3.6%
Atlanta
41 © 2015, CBRE, Inc.

• Despite out-migration of some mature tech companies, many employees have remained in San Diego, fueling rapid growth at younger innovative tech companies, primarily in Sorrento Mesa.
• Technology-based genomics projects by life science companies are increasing significantly, further expanding the region’s need for and pool of tech talent.
• The local concentration of military operations supports a thriving defense industry and has established San Diego as a center for cyber-security excellence, with major local universities launching cyber security programs to fuel the growing demand for such skills.
Sources: U.S. Bureau of Labor Statistics and Statistics Canada, July 2015 and CBRE Research, Q2 2015.Ranked by high-tech job growth rate.
OFFICE MARKET STATS, Q2 2015
Average Asking RentFS/YR
$29.88
Vacancy Rate 12.6%
New SupplyUnder Construction
885,000 SF
Top Tech SubmarketRents/Vacancy
Sorrento Mesa$32.76 / 14.5%
HIGH-TECH INDUSTRY STATS, 2014
EmploymentHigh-Tech Software/Services
27,871
Employment Clustering % of Office-Using Jobs
8.7%
Educational AttainmentResidents w/ BA or higher
34.8%
Labor Cost (MSA)Software Engineer
$95,755
SIGNIFICANT OFFICE LEASE DEALS, 2015
Illumina 5200 Illumina Way 296,000 SF Bose 8863 Siempra Viva Rd. 112,000 SFMaxLinear 5966 La Place Ct. 68,600 SFSource: CBRE Research, Q2 2015.
Source: CBRE Research, Q2 2015 and U.S. Bureau of Labor Statistics, July 2015.
2927252321191715
320310300290280270260250240230220
High-Tech Software/Service Jobs (L) Office-Using Jobs (R) (Excluding High-Tech)
2001 2002 2003 2004 2005 2006 2007 2008 2009 2010 2011 2012 2013 2014
HIGH-TECH SOFTWARE/SERVICES VS. OFFICE-USING JOBS (THOUSANDS)
Source: CBRE Research, Q2 2015. Net absorption growth as a % of market’s inventory
Washington, D.C. (DC) Toronto (TORO)
Baltimore (BALT) Chicago (CHI)
Vancouver (VAN) St. Louis (STL) New York (NY)
Pittsburgh (PIT) Minneapolis (MIN)
San Fran Peninsula (SFP) Denver (DEN) Boston (BOS)
San Diego (SD) Greater Los Angeles (LA)
Indianapolis (IND) Philadelphia (PHL)
Portland (POR) Atlanta (ATL)
Dallas/Ft. Worth (DFW) Orange County (OC)
Detroit (DET) Salt Lake City (SLC) San Francisco (SF) Nashville (NASH)
Seattle (SEA) Charlotte (CLT) Phoenix (PHO)
Raleigh-Durham (R-D) Austin (AUS)
Silicon Valley (SV)
NET ABSORPTION GROWTHOVERALL MARKET, PAST TWO YEARS (Q3 2013 - Q2 2015)
Source: CBRE Research, Q2 2015.-10% 0% 10% 20% 30% 40%
Reston/Herndon (DC) NorthWest (DEN)
BWI (BALT) CBD (STL) CBD (IND)
River North (CHI) Northeast (CLT)
RTP/I-40 Corridor (R-D) North Fulton (ATL) Southvalley (SLC)
Far North Dallas (DFW) Yaletown & Gastown (VAN)
Tempe (PHX) Midtown South (NY)
Oakland (PIT) Toronto Downtown West (TORO)
Sorrento Mesa (SD) CBD (POR)
Ann Arbor (DET) Santa Monica (LA) North Loop (MIN)
University City (PHL) South Orange County (OC)
CBD (NASH) SOMA (SF)
Redwood City (SFP) East Cambridge (BOS)
Lake Union (SEA) Mountain View (SV)
RENT GROWTHTOP TECH SUBMARKET, PAST TWO YEARS (Q2 2013 TO Q2 2015)
NorthWest (AUS)
HOT TOPICS
QUICK STATS
High-Tech Job Growth Office Market Rent Growth
Rank MarketCurrent Period
2012-2014Prior Period
2011-2013Current Period
Q2‘13-Q2‘15Prior Period
Q2‘12-Q2‘141 San Francisco (SF) 42.7% 50.9% 30.7% 34.6% 2 Phoenix (PHX) 42.7% 18.6% 8.3% 3.7%3 Austin (AUS) 33.0% 33.7% 11.4% 12.2%4 Silicon Valley (SV) 27.0% 20.0% 28.1% 21.4%5 Nashville (NASH) 22.7% 29.6% 8.9% 8.5%6 New York (NY) 22.6% 22.7% 14.1% 17.5%7 Seattle (SEA) 18.3% 17.0% 9.4% 8.0%8 Indianapolis (IND) 18.0% 20.7% 10.9% 9.5%9 Charlotte (CLT) 17.3% 13.4% 8.0% 4.3%
10 Salt Lake City (SLC) 16.2% 15.6% 8.8% 4.1%11 Portland (POR) 16.1% 12.3% 10.7% 6.1%12 San Francisco Pen. (SFP) 15.0% 30.2% 21.0% 19.3%13 Chicago (CHI) 14.9% 19.3% 6.2% 3.5%14 Raleigh-Durham (R-D) 14.2% 16.8% 23.4% -0.9%15 Pittsburgh (PIT) 14.1% 2.2% 12.4% 1.8%16 Orange County (OC) 12.9% 9.7% 16.1% 5.2%17 Dallas/Ft. Worth (DFW) 10.7% 16.4% 13.4% 12.0%18 Minneapolis (MIN) 10.7% 4.5% 10.9% 7.2%19 Denver (DEN) 10.7% 13.3% 11.8% 12.7%20 Boston (BOS) 8.5% 15.8% 14.4% 11.2%21 St. Louis (STL) 8.5% 24.6% 3.1% 1.4%22 Atlanta (ATL) 7.8% 10.5% 6.1% 3.3%23 San Diego (SD) 7.6% 4.1% 12.7% 8.6%24 Los Angeles (LA) 6.7% 11.9% 4.0% 0.6%25 Toronto (TORO) 5.3% 4.2% 5.0% 0.5%26 Baltimore (BAL) 4.3% 10.0% 1.0% 3.7%27 Detroit (DET) 3.5% 7.7% 2.9% -0.7%28 Philadelphia (PHL) 2.5% 3.9% 3.0% 2.2%29 Vancouver (VAN) 2.4% 18.7% 18.4% 14.3%30 Washington, D.C. (DC) -2.2% 0.8% 3.4% 3.6%
HIGH-TECH SOFTWARE/SERVICES JOB AND OFFICE RENT GROWTH
San Diego
2015 TECH-THIRTY | CBRE Research42

• High-tech leasing activity took up 1.4 million sq. ft. in 2014; it was tech companies’ most active year yet in greater Los Angeles.
• In Santa Monica, 2.31 million sq. ft. of office space is occupied by 158 high-tech tenants, making it the largest L.A. submarket for tech firms.
• High-tech companies are beginning to cluster in Playa Vista; a large private investment there could make it the metro’s top tech submarket.
• Snapchat expanded its footprint in Silicon Beach by leasing 77,995 sq. ft. of office space, accounting for 43% of positive net absorption in the Venice/Marina Del Rey submarket.
Sources: U.S. Bureau of Labor Statistics and Statistics Canada, July 2015 and CBRE Research, Q2 2015.Ranked by high-tech job growth rate.
OFFICE MARKET STATS, Q2 2015
Average Asking RentFS/YR
$33.36
Vacancy Rate 15.6%
New SupplyUnder Construction
2.2 MSF
Top Tech SubmarketRents/Vacancy
Santa Monica$61.68 / 9.3%
TECH INDUSTRY STATS, 2014
EmploymentHigh-Tech Software/Services
60,183
Employment Clustering % of Office-Using Jobs
5.7%
Educational AttainmentResidents w/ BA or higher
30.2%
Labor Cost (MSA)Software Engineer
$110,949
SIGNIFICANT OFFICE LEASE DEALS, 2015
Hulu 2450 Broadway 61,700 SF SnapChat 606-634 Venice Blvd. 44,200 SFTrueCar 120 N Broadway 38,000 SFSource: CBRE Research, Q2 2015.
Source: CBRE Research, Q2 2015 and U.S. Bureau of Labor Statistics, July 2015.
615957555351494745
110010501000
950900850800
High-Tech Software/Service Jobs (L) Office-Using Jobs (R) (Excluding High-Tech)
2001 2002 2003 2004 2005 2006 2007 2008 2009 2010 2011 2012 2013 2014
HIGH-TECH SOFTWARE/SERVICES VS. OFFICE-USING JOBS (THOUSANDS)
Source: CBRE Research, Q2 2015.-10% 0% 10% 20% 30% 40%
Reston/Herndon (DC) NorthWest (DEN)
BWI (BALT) CBD (STL) CBD (IND)
River North (CHI) Northeast (CLT)
RTP/I-40 Corridor (R-D) North Fulton (ATL) Southvalley (SLC)
Far North Dallas (DFW) Yaletown & Gastown (VAN)
Tempe (PHX) Midtown South (NY)
Oakland (PIT) Toronto Downtown West (TORO)
Sorrento Mesa (SD) CBD (POR)
Ann Arbor (DET) Santa Monica (LA) North Loop (MIN)
University City (PHL) South Orange County (OC)
CBD (NASH) SOMA (SF)
Redwood City (SFP) East Cambridge (BOS)
Lake Union (SEA) Mountain View (SV)
RENT GROWTHTOP TECH SUBMARKET, PAST TWO YEARS (Q2 2013 TO Q2 2015)
NorthWest (AUS)
HOT TOPICS
QUICK STATS
Source: CBRE Research, Q2 2015. Net absorption growth as a % of market’s inventory
Washington, D.C. (DC) Toronto (TORO)
Baltimore (BALT) Chicago (CHI)
Vancouver (VAN) St. Louis (STL) New York (NY)
Pittsburgh (PIT) Minneapolis (MIN)
San Fran Peninsula (SFP) Denver (DEN) Boston (BOS)
San Diego (SD) Greater Los Angeles (LA)
Indianapolis (IND) Philadelphia (PHL)
Portland (POR) Atlanta (ATL)
Dallas/Ft. Worth (DFW) Orange County (OC)
Detroit (DET) Salt Lake City (SLC) San Francisco (SF) Nashville (NASH)
Seattle (SEA) Charlotte (CLT) Phoenix (PHO)
Raleigh-Durham (R-D) Austin (AUS)
Silicon Valley (SV)
NET ABSORPTION GROWTHOVERALL MARKET, PAST TWO YEARS (Q3 2013 - Q2 2015)
High-Tech Job Growth Office Market Rent Growth
Rank MarketCurrent Period
2012-2014Prior Period
2011-2013Current Period
Q2‘13-Q2‘15Prior Period
Q2‘12-Q2‘141 San Francisco (SF) 42.7% 50.9% 30.7% 34.6% 2 Phoenix (PHX) 42.7% 18.6% 8.3% 3.7%3 Austin (AUS) 33.0% 33.7% 11.4% 12.2%4 Silicon Valley (SV) 27.0% 20.0% 28.1% 21.4%5 Nashville (NASH) 22.7% 29.6% 8.9% 8.5%6 New York (NY) 22.6% 22.7% 14.1% 17.5%7 Seattle (SEA) 18.3% 17.0% 9.4% 8.0%8 Indianapolis (IND) 18.0% 20.7% 10.9% 9.5%9 Charlotte (CLT) 17.3% 13.4% 8.0% 4.3%
10 Salt Lake City (SLC) 16.2% 15.6% 8.8% 4.1%11 Portland (POR) 16.1% 12.3% 10.7% 6.1%12 San Francisco Pen. (SFP) 15.0% 30.2% 21.0% 19.3%13 Chicago (CHI) 14.9% 19.3% 6.2% 3.5%14 Raleigh-Durham (R-D) 14.2% 16.8% 23.4% -0.9%15 Pittsburgh (PIT) 14.1% 2.2% 12.4% 1.8%16 Orange County (OC) 12.9% 9.7% 16.1% 5.2%17 Dallas/Ft. Worth (DFW) 10.7% 16.4% 13.4% 12.0%18 Minneapolis (MIN) 10.7% 4.5% 10.9% 7.2%19 Denver (DEN) 10.7% 13.3% 11.8% 12.7%20 Boston (BOS) 8.5% 15.8% 14.4% 11.2%21 St. Louis (STL) 8.5% 24.6% 3.1% 1.4%22 Atlanta (ATL) 7.8% 10.5% 6.1% 3.3%23 San Diego (SD) 7.6% 4.1% 12.7% 8.6%24 Los Angeles (LA) 6.7% 11.9% 4.0% 0.6%25 Toronto (TORO) 5.3% 4.2% 5.0% 0.5%26 Baltimore (BAL) 4.3% 10.0% 1.0% 3.7%27 Detroit (DET) 3.5% 7.7% 2.9% -0.7%28 Philadelphia (PHL) 2.5% 3.9% 3.0% 2.2%29 Vancouver (VAN) 2.4% 18.7% 18.4% 14.3%30 Washington, D.C. (DC) -2.2% 0.8% 3.4% 3.6%
HIGH-TECH SOFTWARE/SERVICES JOB AND OFFICE RENT GROWTH
Los Angeles
43 © 2015, CBRE, Inc.

• Downtown West and Liberty Village are popular submarkets for high-tech companies, due to a high concentration of “brick-and-beam” space.
• New top-tier buildings in Downtown South, including RBC WaterPark Place and Bremner Tower, have attracted major tech tenants, including Cisco and SoftCom.
• Tech incubation facilities—such as MaRS and the proposed Waterfront Innovation Centre—are increasing in prevalence.
Sources: U.S. Bureau of Labor Statistics and Statistics Canada, July 2015 and CBRE Research, Q2 2015.Ranked by high-tech job growth rate.
OFFICE MARKET STATS, Q2 2015
Average Asking RentFS/YR
$35.48
Vacancy Rate 9.7%
New SupplyUnder Construction
5.2 MSF
Top Tech SubmarketRents/Vacancy
Toronto Downtown West$37.74 / 4.7%
HIGH-TECH INDUSTRY STATS, 2014
EmploymentHigh-Tech Software/Services
96,800
Employment Clustering % of Office-Using Jobs
11.7%
Educational AttainmentResidents w/ BA or higher
41.9%
Labor Cost (MSA)Software Engineer
$66,585
SIGNIFICANT OFFICE LEASE DEALS, 2015
Confidential 120 Bremner Blvd. 126,000 SF Salesforce.com 10 Bay St. 79,500 SFOracle Canada 277 Front St. W 56,100 SFSource: CBRE Research, Q2 2015.
Source: CBRE Research, Q2 2015 and Statistics Canada, July 2015.
1009590858075706560
750700650600550500
High-Tech Software/Service Jobs (L) Office-Using Jobs (R) (Excluding High-Tech)
2001 2002 2003 2004 2005 2006 2007 2008 2009 2010 2011 2012 2013 2014
HIGH-TECH SOFTWARE/SERVICES VS. OFFICE-USING JOBS (THOUSANDS)
Source: CBRE Research, Q2 2015. Net absorption growth as a % of market’s inventory
Washington, D.C. (DC)
Toronto (TORO) Baltimore (BALT)
Chicago (CHI) Vancouver (VAN)
St. Louis (STL) New York (NY)
Pittsburgh (PIT) Minneapolis (MIN)
San Fran Peninsula (SFP) Denver (DEN) Boston (BOS)
San Diego (SD) Greater Los Angeles (LA)
Indianapolis (IND) Philadelphia (PHL)
Portland (POR) Atlanta (ATL)
Dallas/Ft. Worth (DFW) Orange County (OC)
Detroit (DET) Salt Lake City (SLC) San Francisco (SF) Nashville (NASH)
Seattle (SEA) Charlotte (CLT) Phoenix (PHO)
Raleigh-Durham (R-D) Austin (AUS)
Silicon Valley (SV)
NET ABSORPTION GROWTHOVERALL MARKET, PAST TWO YEARS (Q3 2013 - Q2 2015)
Source: CBRE Research, Q2 2015.-10% 0% 10% 20% 30% 40%
Reston/Herndon (DC) NorthWest (DEN)
BWI (BALT) CBD (STL) CBD (IND)
River North (CHI) Northeast (CLT)
RTP/I-40 Corridor (R-D) North Fulton (ATL) Southvalley (SLC)
Far North Dallas (DFW) Yaletown & Gastown (VAN)
Tempe (PHX) Midtown South (NY)
Oakland (PIT) Toronto Downtown West (TORO)
Sorrento Mesa (SD) CBD (POR)
Ann Arbor (DET) Santa Monica (LA) North Loop (MIN)
University City (PHL) South Orange County (OC)
CBD (NASH) SOMA (SF)
Redwood City (SFP) East Cambridge (BOS)
Lake Union (SEA) Mountain View (SV)
RENT GROWTHTOP TECH SUBMARKET, PAST TWO YEARS (Q2 2013 TO Q2 2015)
NorthWest (AUS)
High-Tech Job Growth Office Market Rent Growth
Rank MarketCurrent Period
2012-2014Prior Period
2011-2013Current Period
Q2‘13-Q2‘15Prior Period
Q2‘12-Q2‘141 San Francisco (SF) 42.7% 50.9% 30.7% 34.6% 2 Phoenix (PHX) 42.7% 18.6% 8.3% 3.7%3 Austin (AUS) 33.0% 33.7% 11.4% 12.2%4 Silicon Valley (SV) 27.0% 20.0% 28.1% 21.4%5 Nashville (NASH) 22.7% 29.6% 8.9% 8.5%6 New York (NY) 22.6% 22.7% 14.1% 17.5%7 Seattle (SEA) 18.3% 17.0% 9.4% 8.0%8 Indianapolis (IND) 18.0% 20.7% 10.9% 9.5%9 Charlotte (CLT) 17.3% 13.4% 8.0% 4.3%
10 Salt Lake City (SLC) 16.2% 15.6% 8.8% 4.1%11 Portland (POR) 16.1% 12.3% 10.7% 6.1%12 San Francisco Pen. (SFP) 15.0% 30.2% 21.0% 19.3%13 Chicago (CHI) 14.9% 19.3% 6.2% 3.5%14 Raleigh-Durham (R-D) 14.2% 16.8% 23.4% -0.9%15 Pittsburgh (PIT) 14.1% 2.2% 12.4% 1.8%16 Orange County (OC) 12.9% 9.7% 16.1% 5.2%17 Dallas/Ft. Worth (DFW) 10.7% 16.4% 13.4% 12.0%18 Minneapolis (MIN) 10.7% 4.5% 10.9% 7.2%19 Denver (DEN) 10.7% 13.3% 11.8% 12.7%20 Boston (BOS) 8.5% 15.8% 14.4% 11.2%21 St. Louis (STL) 8.5% 24.6% 3.1% 1.4%22 Atlanta (ATL) 7.8% 10.5% 6.1% 3.3%23 San Diego (SD) 7.6% 4.1% 12.7% 8.6%24 Los Angeles (LA) 6.7% 11.9% 4.0% 0.6%25 Toronto (TORO) 5.3% 4.2% 5.0% 0.5%26 Baltimore (BAL) 4.3% 10.0% 1.0% 3.7%27 Detroit (DET) 3.5% 7.7% 2.9% -0.7%28 Philadelphia (PHL) 2.5% 3.9% 3.0% 2.2%29 Vancouver (VAN) 2.4% 18.7% 18.4% 14.3%30 Washington, D.C. (DC) -2.2% 0.8% 3.4% 3.6%
HIGH-TECH SOFTWARE/SERVICES JOB AND OFFICE RENT GROWTH
HOT TOPICS
QUICK STATS
Toronto
2015 TECH-THIRTY | CBRE Research44

• With tech talent showing a preference toward living in Baltimore City, small to mid-sized technology companies are slowly migrating to the city as well.
• Leasing activity has been robust among government contactor groups which have migrated to be near U.S. Cyber Command at Fort Meade.
• Cyber security firms seeking shorter term leases to be coterminous with length of customer contracts.
Sources: U.S. Bureau of Labor Statistics and Statistics Canada, July 2015 and CBRE Research, Q2 2015.Ranked by high-tech job growth rate.
OFFICE MARKET STATS, Q2 2015
Average Asking RentFS/YR
$22.72
Vacancy Rate 14.4%
New SupplyUnder Construction
680,000 SF
Top Tech SubmarketRents/Vacancy
BWI$24.73 / 13.3%
TECH INDUSTRY STATS, 2014
EmploymentHigh-Tech Software/Services
31,127
Employment Clustering % of Office-Using Jobs
11.2%
Educational AttainmentResidents w/ BA or higher
37.2%
Labor Cost (MSA)Software Engineer
$119,237
SIGNIFICANT OFFICE LEASE DEALS, 2015
FEI Systems 9755 Patuxent Woods Dr. 48,800 SF SafeNet Assured Technologies LLC 3465 Box Hill Corporate Center Dr. 13,700 SFIP Keys Technologies, LLC 420 National Business Park 7,400 SFSource: CBRE Research, Q2 2015.
Source: CBRE Research, Q2 2015 and U.S. Bureau of Labor Statistics, July 2015.
312927252321191715
250245240235230225220215210205
High-Tech Software/Service Jobs (L) Office-Using Jobs (R) (Excluding High-Tech)
2001 2002 2003 2004 2005 2006 2007 2008 2009 2010 2011 2012 2013 2014
HIGH-TECH SOFTWARE/SERVICES VS. OFFICE-USING JOBS (THOUSANDS)
Source: CBRE Research, Q2 2015.-10% 0% 10% 20% 30% 40%
Reston/Herndon (DC) NorthWest (DEN)
BWI (BALT) CBD (STL) CBD (IND)
River North (CHI) Northeast (CLT)
RTP/I-40 Corridor (R-D) North Fulton (ATL) Southvalley (SLC)
Far North Dallas (DFW) Yaletown & Gastown (VAN)
Tempe (PHX) Midtown South (NY)
Oakland (PIT) Toronto Downtown West (TORO)
Sorrento Mesa (SD) CBD (POR)
Ann Arbor (DET) Santa Monica (LA) North Loop (MIN)
University City (PHL) South Orange County (OC)
CBD (NASH) SOMA (SF)
Redwood City (SFP) East Cambridge (BOS)
Lake Union (SEA) Mountain View (SV)
RENT GROWTHTOP TECH SUBMARKET, PAST TWO YEARS (Q2 2013 TO Q2 2015)
NorthWest (AUS)
HOT TOPICS
QUICK STATS
Source: CBRE Research, Q2 2015. Net absorption growth as a % of market’s inventory
Washington, D.C. (DC) Toronto (TORO)
Baltimore (BALT) Chicago (CHI)
Vancouver (VAN) St. Louis (STL) New York (NY)
Pittsburgh (PIT) Minneapolis (MIN)
San Fran Peninsula (SFP) Denver (DEN) Boston (BOS)
San Diego (SD) Greater Los Angeles (LA)
Indianapolis (IND) Philadelphia (PHL)
Portland (POR) Atlanta (ATL)
Dallas/Ft. Worth (DFW) Orange County (OC)
Detroit (DET) Salt Lake City (SLC) San Francisco (SF) Nashville (NASH)
Seattle (SEA) Charlotte (CLT) Phoenix (PHO)
Raleigh-Durham (R-D) Austin (AUS)
Silicon Valley (SV)
NET ABSORPTION GROWTHOVERALL MARKET, PAST TWO YEARS (Q3 2013 - Q2 2015)
High-Tech Job Growth Office Market Rent Growth
Rank MarketCurrent Period
2012-2014Prior Period
2011-2013Current Period
Q2‘13-Q2‘15Prior Period
Q2‘12-Q2‘141 San Francisco (SF) 42.7% 50.9% 30.7% 34.6% 2 Phoenix (PHX) 42.7% 18.6% 8.3% 3.7%3 Austin (AUS) 33.0% 33.7% 11.4% 12.2%4 Silicon Valley (SV) 27.0% 20.0% 28.1% 21.4%5 Nashville (NASH) 22.7% 29.6% 8.9% 8.5%6 New York (NY) 22.6% 22.7% 14.1% 17.5%7 Seattle (SEA) 18.3% 17.0% 9.4% 8.0%8 Indianapolis (IND) 18.0% 20.7% 10.9% 9.5%9 Charlotte (CLT) 17.3% 13.4% 8.0% 4.3%
10 Salt Lake City (SLC) 16.2% 15.6% 8.8% 4.1%11 Portland (POR) 16.1% 12.3% 10.7% 6.1%12 San Francisco Pen. (SFP) 15.0% 30.2% 21.0% 19.3%13 Chicago (CHI) 14.9% 19.3% 6.2% 3.5%14 Raleigh-Durham (R-D) 14.2% 16.8% 23.4% -0.9%15 Pittsburgh (PIT) 14.1% 2.2% 12.4% 1.8%16 Orange County (OC) 12.9% 9.7% 16.1% 5.2%17 Dallas/Ft. Worth (DFW) 10.7% 16.4% 13.4% 12.0%18 Minneapolis (MIN) 10.7% 4.5% 10.9% 7.2%19 Denver (DEN) 10.7% 13.3% 11.8% 12.7%20 Boston (BOS) 8.5% 15.8% 14.4% 11.2%21 St. Louis (STL) 8.5% 24.6% 3.1% 1.4%22 Atlanta (ATL) 7.8% 10.5% 6.1% 3.3%23 San Diego (SD) 7.6% 4.1% 12.7% 8.6%24 Los Angeles (LA) 6.7% 11.9% 4.0% 0.6%25 Toronto (TORO) 5.3% 4.2% 5.0% 0.5%26 Baltimore (BAL) 4.3% 10.0% 1.0% 3.7%27 Detroit (DET) 3.5% 7.7% 2.9% -0.7%28 Philadelphia (PHL) 2.5% 3.9% 3.0% 2.2%29 Vancouver (VAN) 2.4% 18.7% 18.4% 14.3%30 Washington, D.C. (DC) -2.2% 0.8% 3.4% 3.6%
HIGH-TECH SOFTWARE/SERVICES JOB AND OFFICE RENT GROWTH
Baltimore
45 © 2015, CBRE, Inc.

• Technology firms expanding to Detroit are increasing local demand for creative office space and improving the metro’s office market fundamentals.
• Incubator and startup initiatives such as the Madison Block and TechTown are supporting the growing startup activity in Downtown Detroit.
• Automotive manufacturers and suppliers are in a mini renaissance, demanding a more technologically savvy workforce as a result of the growing use of and demand for high-tech cars.
• The University of Michigan and its strong pool of talent contribute to the growth of high-tech companies in Ann Arbor.
Sources: U.S. Bureau of Labor Statistics and Statistics Canada, July 2015 and CBRE Research, Q2 2015.Ranked by high-tech job growth rate.
OFFICE MARKET STATS, Q2 2015
Average Asking RentFS/YR
$17.32
Vacancy Rate 19.7%
New SupplyUnder Construction
85,000 SF
Top Tech SubmarketRents/Vacancy
Ann Arbor$23.19 / 4.1%
HIGH-TECH INDUSTRY STATS, 2014
EmploymentHigh-Tech Software/Services
36,424
Employment Clustering % of Office-Using Jobs
7.8%
Educational AttainmentResidents w/ BA or higher
30.8%
Labor Cost (MSA)Software Engineer
$92,085
SIGNIFICANT OFFICE LEASE DEALS, 2015
Hello World 3000 Town Center 43,000 SF Logicalis 2600 S Telegraph Rd. 40,500 SFSiemens 400 Morgan Rd. 25,200 SFSource: CBRE Research, Q2 2015.
Source: CBRE Research, Q2 2015 and U.S. Bureau of Labor Statistics, July 2015.
454035302520
480460440420400380360340
High-Tech Software/Service Jobs (L) Office-Using Jobs (R) (Excluding High-Tech)
2001 2002 2003 2004 2005 2006 2007 2008 2009 2010 2011 2012 2013 2014
HIGH-TECH SOFTWARE/SERVICES VS. OFFICE-USING JOBS (THOUSANDS)
Source: CBRE Research, Q2 2015. Net absorption growth as a % of market’s inventory
Washington, D.C. (DC)
Toronto (TORO) Baltimore (BALT)
Chicago (CHI) Vancouver (VAN)
St. Louis (STL) New York (NY)
Pittsburgh (PIT) Minneapolis (MIN)
San Fran Peninsula (SFP) Denver (DEN) Boston (BOS)
San Diego (SD) Greater Los Angeles (LA)
Indianapolis (IND) Philadelphia (PHL)
Portland (POR) Atlanta (ATL)
Dallas/Ft. Worth (DFW) Orange County (OC)
Detroit (DET) Salt Lake City (SLC) San Francisco (SF) Nashville (NASH)
Seattle (SEA) Charlotte (CLT) Phoenix (PHO)
Raleigh-Durham (R-D) Austin (AUS)
Silicon Valley (SV)
NET ABSORPTION GROWTHOVERALL MARKET, PAST TWO YEARS (Q3 2013 - Q2 2015)
Source: CBRE Research, Q2 2015.-10% 0% 10% 20% 30% 40%
Reston/Herndon (DC) NorthWest (DEN)
BWI (BALT) CBD (STL) CBD (IND)
River North (CHI) Northeast (CLT)
RTP/I-40 Corridor (R-D) North Fulton (ATL) Southvalley (SLC)
Far North Dallas (DFW) Yaletown & Gastown (VAN)
Tempe (PHX) Midtown South (NY)
Oakland (PIT) Toronto Downtown West (TORO)
Sorrento Mesa (SD) CBD (POR)
Ann Arbor (DET) Santa Monica (LA) North Loop (MIN)
University City (PHL) South Orange County (OC)
CBD (NASH) SOMA (SF)
Redwood City (SFP) East Cambridge (BOS)
Lake Union (SEA) Mountain View (SV)
RENT GROWTHTOP TECH SUBMARKET, PAST TWO YEARS (Q2 2013 TO Q2 2015)
NorthWest (AUS)
HOT TOPICS
High-Tech Job Growth Office Market Rent Growth
Rank MarketCurrent Period
2012-2014Prior Period
2011-2013Current Period
Q2‘13-Q2‘15Prior Period
Q2‘12-Q2‘141 San Francisco (SF) 42.7% 50.9% 30.7% 34.6% 2 Phoenix (PHX) 42.7% 18.6% 8.3% 3.7%3 Austin (AUS) 33.0% 33.7% 11.4% 12.2%4 Silicon Valley (SV) 27.0% 20.0% 28.1% 21.4%5 Nashville (NASH) 22.7% 29.6% 8.9% 8.5%6 New York (NY) 22.6% 22.7% 14.1% 17.5%7 Seattle (SEA) 18.3% 17.0% 9.4% 8.0%8 Indianapolis (IND) 18.0% 20.7% 10.9% 9.5%9 Charlotte (CLT) 17.3% 13.4% 8.0% 4.3%
10 Salt Lake City (SLC) 16.2% 15.6% 8.8% 4.1%11 Portland (POR) 16.1% 12.3% 10.7% 6.1%12 San Francisco Pen. (SFP) 15.0% 30.2% 21.0% 19.3%13 Chicago (CHI) 14.9% 19.3% 6.2% 3.5%14 Raleigh-Durham (R-D) 14.2% 16.8% 23.4% -0.9%15 Pittsburgh (PIT) 14.1% 2.2% 12.4% 1.8%16 Orange County (OC) 12.9% 9.7% 16.1% 5.2%17 Dallas/Ft. Worth (DFW) 10.7% 16.4% 13.4% 12.0%18 Minneapolis (MIN) 10.7% 4.5% 10.9% 7.2%19 Denver (DEN) 10.7% 13.3% 11.8% 12.7%20 Boston (BOS) 8.5% 15.8% 14.4% 11.2%21 St. Louis (STL) 8.5% 24.6% 3.1% 1.4%22 Atlanta (ATL) 7.8% 10.5% 6.1% 3.3%23 San Diego (SD) 7.6% 4.1% 12.7% 8.6%24 Los Angeles (LA) 6.7% 11.9% 4.0% 0.6%25 Toronto (TORO) 5.3% 4.2% 5.0% 0.5%26 Baltimore (BAL) 4.3% 10.0% 1.0% 3.7%27 Detroit (DET) 3.5% 7.7% 2.9% -0.7%28 Philadelphia (PHL) 2.5% 3.9% 3.0% 2.2%29 Vancouver (VAN) 2.4% 18.7% 18.4% 14.3%30 Washington, D.C. (DC) -2.2% 0.8% 3.4% 3.6%
HIGH-TECH SOFTWARE/SERVICES JOB AND OFFICE RENT GROWTH
QUICK STATS
Detroit
2015 TECH-THIRTY | CBRE Research46

• Vast differences in asking rates are emerging, both downtown and in the suburbs, as tech tenant preferences and clustering drive demand in a few select submarkets, including the CBD and University City.
• With only 13 blocks of contiguous Class A space of 100,000 sq. ft. or more available, new development is becoming more active.
• The Comcast Innovation and Technology Center and the expanding University City Science Center will add nearly 2.8 million sq. ft. of office and lab space, furthering the tech presence in Philadelphia.
Sources: U.S. Bureau of Labor Statistics and Statistics Canada, July 2015 and CBRE Research, Q2 2015.Ranked by high-tech job growth rate.
OFFICE MARKET STATS, Q2 2015
Average Asking RentFS/YR
$25.76
Vacancy Rate 16.4%
New SupplyUnder Construction
1.9 MSF
Top Tech SubmarketRents/Vacancy
University City$37.43 / 4.5%
TECH INDUSTRY STATS, 2014
EmploymentHigh-Tech Software/Services
37,574
Employment Clustering % of Office-Using Jobs
8.4%
Educational AttainmentResidents w/ BA or higher
36.0%
Labor Cost (MSA)Software Engineer
$95,294
SIGNIFICANT OFFICE LEASE DEALS, 2015
C&D Technologies 1400 Union Meeting Rd. 126,800 SF ABB Process Automation 101 East County Line Rd. 115,000 SFAnalytical Graphics 224 Valley Creek Corporate Center 90,200 SFSource: CBRE Research, Q2 2015.
Source: CBRE Research, Q2 2015 and U.S. Bureau of Labor Statistics, July 2015.
3937353331292725
450430410390370350
High-Tech Software/Service Jobs (L) Office-Using Jobs (R) (Excluding High-Tech)
2001 2002 2003 2004 2005 2006 2007 2008 2009 2010 2011 2012 2013 2014
HIGH-TECH SOFTWARE/SERVICES VS. OFFICE-USING JOBS (THOUSANDS)
Source: CBRE Research, Q2 2015.-10% 0% 10% 20% 30% 40%
Reston/Herndon (DC) NorthWest (DEN)
BWI (BALT) CBD (STL) CBD (IND)
River North (CHI) Northeast (CLT)
RTP/I-40 Corridor (R-D) North Fulton (ATL) Southvalley (SLC)
Far North Dallas (DFW) Yaletown & Gastown (VAN)
Tempe (PHX) Midtown South (NY)
Oakland (PIT) Toronto Downtown West (TORO)
Sorrento Mesa (SD) CBD (POR)
Ann Arbor (DET) Santa Monica (LA) North Loop (MIN)
University City (PHL) South Orange County (OC)
CBD (NASH) SOMA (SF)
Redwood City (SFP) East Cambridge (BOS)
Lake Union (SEA) Mountain View (SV)
RENT GROWTHTOP TECH SUBMARKET, PAST TWO YEARS (Q2 2013 TO Q2 2015)
NorthWest (AUS)
HOT TOPICS
QUICK STATS
Source: CBRE Research, Q2 2015. Net absorption growth as a % of market’s inventory
Washington, D.C. (DC) Toronto (TORO)
Baltimore (BALT) Chicago (CHI)
Vancouver (VAN) St. Louis (STL) New York (NY)
Pittsburgh (PIT) Minneapolis (MIN)
San Fran Peninsula (SFP) Denver (DEN) Boston (BOS)
San Diego (SD) Greater Los Angeles (LA)
Indianapolis (IND) Philadelphia (PHL)
Portland (POR) Atlanta (ATL)
Dallas/Ft. Worth (DFW) Orange County (OC)
Detroit (DET) Salt Lake City (SLC) San Francisco (SF) Nashville (NASH)
Seattle (SEA) Charlotte (CLT) Phoenix (PHO)
Raleigh-Durham (R-D) Austin (AUS)
Silicon Valley (SV)
NET ABSORPTION GROWTHOVERALL MARKET, PAST TWO YEARS (Q3 2013 - Q2 2015)
High-Tech Job Growth Office Market Rent Growth
Rank MarketCurrent Period
2012-2014Prior Period
2011-2013Current Period
Q2‘13-Q2‘15Prior Period
Q2‘12-Q2‘141 San Francisco (SF) 42.7% 50.9% 30.7% 34.6% 2 Phoenix (PHX) 42.7% 18.6% 8.3% 3.7%3 Austin (AUS) 33.0% 33.7% 11.4% 12.2%4 Silicon Valley (SV) 27.0% 20.0% 28.1% 21.4%5 Nashville (NASH) 22.7% 29.6% 8.9% 8.5%6 New York (NY) 22.6% 22.7% 14.1% 17.5%7 Seattle (SEA) 18.3% 17.0% 9.4% 8.0%8 Indianapolis (IND) 18.0% 20.7% 10.9% 9.5%9 Charlotte (CLT) 17.3% 13.4% 8.0% 4.3%
10 Salt Lake City (SLC) 16.2% 15.6% 8.8% 4.1%11 Portland (POR) 16.1% 12.3% 10.7% 6.1%12 San Francisco Pen. (SFP) 15.0% 30.2% 21.0% 19.3%13 Chicago (CHI) 14.9% 19.3% 6.2% 3.5%14 Raleigh-Durham (R-D) 14.2% 16.8% 23.4% -0.9%15 Pittsburgh (PIT) 14.1% 2.2% 12.4% 1.8%16 Orange County (OC) 12.9% 9.7% 16.1% 5.2%17 Dallas/Ft. Worth (DFW) 10.7% 16.4% 13.4% 12.0%18 Minneapolis (MIN) 10.7% 4.5% 10.9% 7.2%19 Denver (DEN) 10.7% 13.3% 11.8% 12.7%20 Boston (BOS) 8.5% 15.8% 14.4% 11.2%21 St. Louis (STL) 8.5% 24.6% 3.1% 1.4%22 Atlanta (ATL) 7.8% 10.5% 6.1% 3.3%23 San Diego (SD) 7.6% 4.1% 12.7% 8.6%24 Los Angeles (LA) 6.7% 11.9% 4.0% 0.6%25 Toronto (TORO) 5.3% 4.2% 5.0% 0.5%26 Baltimore (BAL) 4.3% 10.0% 1.0% 3.7%27 Detroit (DET) 3.5% 7.7% 2.9% -0.7%28 Philadelphia (PHL) 2.5% 3.9% 3.0% 2.2%29 Vancouver (VAN) 2.4% 18.7% 18.4% 14.3%30 Washington, D.C. (DC) -2.2% 0.8% 3.4% 3.6%
HIGH-TECH SOFTWARE/SERVICES JOB AND OFFICE RENT GROWTH
Philadelphia
47 © 2015, CBRE, Inc.

• As of mid-year, high-tech tenants represented 44% of current downtown office space requirements.
• The Yaletown and Gastown submarkets remain highly attractive to tech tenants looking for “stick and brick” style premises.
• Low vacancy and rising rental rates in Yaletown and Gastown, however, are pushing tech tenants into neighboring industrial areas, namely Mount Pleasant and Railtown.
• High-tech employment has increased by a very robust 19.7% since 2011, 12 times the rate of total employment.
Sources: U.S. Bureau of Labor Statistics and Statistics Canada, July 2015 and CBRE Research, Q2 2015.Ranked by high-tech job growth rate.
OFFICE MARKET STATS, Q2 2015
Average Asking RentFS/YR
$40.06
Vacancy Rate 10.9%
New SupplyUnder Construction
2.0 MSF
Top Tech SubmarketRents/Vacancy
Yaletown & Gastown$41.78 / 3.4%
HIGH-TECH INDUSTRY STATS, 2014
EmploymentHigh-Tech Software/Services
34,000
Employment Clustering % of Office-Using Jobs
12.0%
Educational AttainmentResidents w/ BA or higher
45.2%
Labor Cost (MSA)Software Engineer
$65,619
SIGNIFICANT OFFICE LEASE DEALS, 2015
Avigilon 555 Robson St. 135,000 SF Sony Pictures Imageworks 725 Granville St. 75,000 SFAnimal Logic (Warner Brothers) 840 Cambie St. 47,000 SFSource: CBRE Research, Q2 2015.
Source: CBRE Research, Q2 2015 and Statistics Canada, July 2015.
3533312927252321191715
260250240230220210
0
High-Tech Software/Service Jobs (L) Office-Using Jobs (R) (Excluding High-Tech)
2001 2002 2003 2004 2005 2006 2007 2008 2009 2010 2011 2012 2013 2014
HIGH-TECH SOFTWARE/SERVICES VS. OFFICE-USING JOBS (THOUSANDS)
Source: CBRE Research, Q2 2015.-10% 0% 10% 20% 30% 40%
Reston/Herndon (DC) NorthWest (DEN)
BWI (BALT) CBD (STL) CBD (IND)
River North (CHI) Northeast (CLT)
RTP/I-40 Corridor (R-D) North Fulton (ATL) Southvalley (SLC)
Far North Dallas (DFW) Yaletown & Gastown (VAN)
Tempe (PHX) Midtown South (NY)
Oakland (PIT) Toronto Downtown West (TORO)
Sorrento Mesa (SD) CBD (POR)
Ann Arbor (DET) Santa Monica (LA) North Loop (MIN)
University City (PHL) South Orange County (OC)
CBD (NASH) SOMA (SF)
Redwood City (SFP) East Cambridge (BOS)
Lake Union (SEA) Mountain View (SV)
RENT GROWTHTOP TECH SUBMARKET, PAST TWO YEARS (Q2 2013 TO Q2 2015)
NorthWest (AUS)
High-Tech Job Growth Office Market Rent Growth
Rank MarketCurrent Period
2012-2014Prior Period
2011-2013Current Period
Q2‘13-Q2‘15Prior Period
Q2‘12-Q2‘141 San Francisco (SF) 42.7% 50.9% 30.7% 34.6% 2 Phoenix (PHX) 42.7% 18.6% 8.3% 3.7%3 Austin (AUS) 33.0% 33.7% 11.4% 12.2%4 Silicon Valley (SV) 27.0% 20.0% 28.1% 21.4%5 Nashville (NASH) 22.7% 29.6% 8.9% 8.5%6 New York (NY) 22.6% 22.7% 14.1% 17.5%7 Seattle (SEA) 18.3% 17.0% 9.4% 8.0%8 Indianapolis (IND) 18.0% 20.7% 10.9% 9.5%9 Charlotte (CLT) 17.3% 13.4% 8.0% 4.3%
10 Salt Lake City (SLC) 16.2% 15.6% 8.8% 4.1%11 Portland (POR) 16.1% 12.3% 10.7% 6.1%12 San Francisco Pen. (SFP) 15.0% 30.2% 21.0% 19.3%13 Chicago (CHI) 14.9% 19.3% 6.2% 3.5%14 Raleigh-Durham (R-D) 14.2% 16.8% 23.4% -0.9%15 Pittsburgh (PIT) 14.1% 2.2% 12.4% 1.8%16 Orange County (OC) 12.9% 9.7% 16.1% 5.2%17 Dallas/Ft. Worth (DFW) 10.7% 16.4% 13.4% 12.0%18 Minneapolis (MIN) 10.7% 4.5% 10.9% 7.2%19 Denver (DEN) 10.7% 13.3% 11.8% 12.7%20 Boston (BOS) 8.5% 15.8% 14.4% 11.2%21 St. Louis (STL) 8.5% 24.6% 3.1% 1.4%22 Atlanta (ATL) 7.8% 10.5% 6.1% 3.3%23 San Diego (SD) 7.6% 4.1% 12.7% 8.6%24 Los Angeles (LA) 6.7% 11.9% 4.0% 0.6%25 Toronto (TORO) 5.3% 4.2% 5.0% 0.5%26 Baltimore (BAL) 4.3% 10.0% 1.0% 3.7%27 Detroit (DET) 3.5% 7.7% 2.9% -0.7%28 Philadelphia (PHL) 2.5% 3.9% 3.0% 2.2%29 Vancouver (VAN) 2.4% 18.7% 18.4% 14.3%30 Washington, D.C. (DC) -2.2% 0.8% 3.4% 3.6%
HIGH-TECH SOFTWARE/SERVICES JOB AND OFFICE RENT GROWTH
HOT TOPICS
QUICK STATS
Source: CBRE Research, Q2 2015. Net absorption growth as a % of market’s inventory
Washington, D.C. (DC) Toronto (TORO)
Baltimore (BALT) Chicago (CHI)
Vancouver (VAN) St. Louis (STL) New York (NY)
Pittsburgh (PIT) Minneapolis (MIN)
San Fran Peninsula (SFP) Denver (DEN) Boston (BOS)
San Diego (SD) Greater Los Angeles (LA)
Indianapolis (IND) Philadelphia (PHL)
Portland (POR) Atlanta (ATL)
Dallas/Ft. Worth (DFW) Orange County (OC)
Detroit (DET) Salt Lake City (SLC) San Francisco (SF) Nashville (NASH)
Seattle (SEA) Charlotte (CLT) Phoenix (PHO)
Raleigh-Durham (R-D) Austin (AUS)
Silicon Valley (SV)
NET ABSORPTION GROWTHOVERALL MARKET, PAST TWO YEARS (Q3 2013 - Q2 2015)
Vancouver
2015 TECH-THIRTY | CBRE Research48

• Proximity to the federal government, an educated workforce and rapid growth in venture capital investment support the area’s expanding tech community.
• Net new demand in the tech sector has helped offset the negative market effects of the federal government.
• D.C. has the second highest concentration of WeWork offices in the country. In Q2 2015, Uber leased 82,000 sq. ft. worth of co-working space in northern Virginia.
• Since 2009, D.C. has seen the highest rate of millennial population growth. The increasingly young population will support the D.C.’s tech talent labor pool.
Sources: U.S. Bureau of Labor Statistics and Statistics Canada, July 2015 and CBRE Research, Q2 2015.Ranked by high-tech job growth rate.
OFFICE MARKET STATS, Q2 2015
Average Asking RentFS/YR
$36.68
Vacancy Rate 15.5%
New SupplyUnder Construction
4.4 MSF
Top Tech SubmarketRents/Vacancy
Reston/Herndon$28.31 / 15.0%
TECH INDUSTRY STATS, 2014
EmploymentHigh-Tech Software/Services
138,175
Employment Clustering % of Office-Using Jobs
21.2%
Educational AttainmentResidents w/ BA or higher
51.5%
Labor Cost (MSA)Software Engineer
$109,317
SIGNIFICANT OFFICE LEASE DEALS, 2015
Confidential 5404 Wisconsin Ave. 133,700 SF Uber Technologies 1717 Rhode Island Ave. NW 73,800 SFPalantir Technologies 1025 Thomas Jefferson St. NW 61,000 SFSource: CBRE Research, Q2 2015.
High-Tech Job Growth Office Market Rent Growth
Rank MarketCurrent Period
2012-2014Prior Period
2011-2013Current Period
Q2‘13-Q2‘15Prior Period
Q2‘12-Q2‘141 San Francisco (SF) 42.7% 50.9% 30.7% 34.6% 2 Phoenix (PHX) 42.7% 18.6% 8.3% 3.7%3 Austin (AUS) 33.0% 33.7% 11.4% 12.2%4 Silicon Valley (SV) 27.0% 20.0% 28.1% 21.4%5 Nashville (NASH) 22.7% 29.6% 8.9% 8.5%6 New York (NY) 22.6% 22.7% 14.1% 17.5%7 Seattle (SEA) 18.3% 17.0% 9.4% 8.0%8 Indianapolis (IND) 18.0% 20.7% 10.9% 9.5%9 Charlotte (CLT) 17.3% 13.4% 8.0% 4.3%
10 Salt Lake City (SLC) 16.2% 15.6% 8.8% 4.1%11 Portland (POR) 16.1% 12.3% 10.7% 6.1%12 San Francisco Pen. (SFP) 15.0% 30.2% 21.0% 19.3%13 Chicago (CHI) 14.9% 19.3% 6.2% 3.5%14 Raleigh-Durham (R-D) 14.2% 16.8% 23.4% -0.9%15 Pittsburgh (PIT) 14.1% 2.2% 12.4% 1.8%16 Orange County (OC) 12.9% 9.7% 16.1% 5.2%17 Dallas/Ft. Worth (DFW) 10.7% 16.4% 13.4% 12.0%18 Minneapolis (MIN) 10.7% 4.5% 10.9% 7.2%19 Denver (DEN) 10.7% 13.3% 11.8% 12.7%20 Boston (BOS) 8.5% 15.8% 14.4% 11.2%21 St. Louis (STL) 8.5% 24.6% 3.1% 1.4%22 Atlanta (ATL) 7.8% 10.5% 6.1% 3.3%23 San Diego (SD) 7.6% 4.1% 12.7% 8.6%24 Los Angeles (LA) 6.7% 11.9% 4.0% 0.6%25 Toronto (TORO) 5.3% 4.2% 5.0% 0.5%26 Baltimore (BAL) 4.3% 10.0% 1.0% 3.7%27 Detroit (DET) 3.5% 7.7% 2.9% -0.7%28 Philadelphia (PHL) 2.5% 3.9% 3.0% 2.2%29 Vancouver (VAN) 2.4% 18.7% 18.4% 14.3%30 Washington, D.C. (DC) -2.2% 0.8% 3.4% 3.6%
Source: CBRE Research, Q2 2015 and U.S. Bureau of Labor Statistics, July 2015.
145140135130125120115110105100
540520500480460440420
High-Tech Software/Service Jobs (L) Office-Using Jobs (R) (Excluding High-Tech)
2001 2002 2003 2004 2005 2006 2007 2008 2009 2010 2011 2012 2013 2014
HIGH-TECH SOFTWARE/SERVICES VS. OFFICE-USING JOBS (THOUSANDS)
Source: CBRE Research, Q2 2015. Net absorption growth as a % of market’s inventory
Washington, D.C. (DC)
Toronto (TORO) Baltimore (BALT)
Chicago (CHI) Vancouver (VAN)
St. Louis (STL) New York (NY)
Pittsburgh (PIT) Minneapolis (MIN)
San Fran Peninsula (SFP) Denver (DEN) Boston (BOS)
San Diego (SD) Greater Los Angeles (LA)
Indianapolis (IND) Philadelphia (PHL)
Portland (POR) Atlanta (ATL)
Dallas/Ft. Worth (DFW) Orange County (OC)
Detroit (DET) Salt Lake City (SLC) San Francisco (SF) Nashville (NASH)
Seattle (SEA) Charlotte (CLT) Phoenix (PHO)
Raleigh-Durham (R-D) Austin (AUS)
Silicon Valley (SV)
NET ABSORPTION GROWTHOVERALL MARKET, PAST TWO YEARS (Q3 2013 - Q2 2015)
Source: CBRE Research, Q2 2015.-10% 0% 10% 20% 30% 40%
Reston/Herndon (DC) NorthWest (DEN)
BWI (BALT) CBD (STL) CBD (IND)
River North (CHI) Northeast (CLT)
RTP/I-40 Corridor (R-D) North Fulton (ATL) Southvalley (SLC)
Far North Dallas (DFW) Yaletown & Gastown (VAN)
Tempe (PHX) Midtown South (NY)
Oakland (PIT) Toronto Downtown West (TORO)
Sorrento Mesa (SD) CBD (POR)
Ann Arbor (DET) Santa Monica (LA) North Loop (MIN)
University City (PHL) South Orange County (OC)
CBD (NASH) SOMA (SF)
Redwood City (SFP) East Cambridge (BOS)
Lake Union (SEA) Mountain View (SV)
RENT GROWTHTOP TECH SUBMARKET, PAST TWO YEARS (Q2 2013 TO Q2 2015)
NorthWest (AUS)
HOT TOPICS
QUICK STATS
HIGH-TECH SOFTWARE/SERVICES JOB AND OFFICE RENT GROWTH
Washington, D.C.
49 © 2015, CBRE, Inc.

Disclaimer: Information contained herein, including projections, has been obtained from sources believed to be reliable. While we do not doubt its accuracy, we have not verified it and make no guarantee, warranty or representation about it. It is your responsibility to confirm independently its accuracy and completeness. This information is presented exclusively for use by CBRE clients and professionals and all rights to the material are reserved and cannot be reproduced without prior written permission of CBRE.
Edward J. SchreyerPresident Agency and Asset Services, Americas +1 214 863 [email protected]
Whitley CollinsPresidentOccupier Advisory and Transaction Services, Americas+1 310 363 [email protected]
John FragerExecutive Managing DirectorTechnology and Media Practice+1 858 546 [email protected]
Colin YasukochiDirector, Research and Analysis+1 415 772 [email protected]
Lexi RussellSenior Research Analyst+1 415 772 [email protected]
FOR MORE INFORMATION ABOUT INVESTOR SERVICES, PLEASE CONTACT:
FOR MORE INFORMATION ABOUT OCCUPIER SERVICES, PLEASE CONTACT:
FOR MORE INFORMATION REGARDING CBRE RESEARCH, PLEASE CONTACT:
FOR MORE INFORMATION REGARDINGTECH-THIRTY 2015, PLEASE CONTACT:
To learn more about CBRE Research, or to access additional research reports, please visit the Global Research Gateway at www.cbre.com/researchgateway. Additional U.S. publications produced by CBRE Research can be found at www.cbre.us/research.
WANT TO KNOW MORE ABOUT SCORING TECH TALENT?
CBRE Research recently released a comprehensive report on scoring tech talent across the U.S. The report, “Influencing Innovation, Economic and Real Estate Growth in 50 U.S. Markets”, identifies the top markets for tech talent using a proprietary scoring system, explains what tech talent markets look like, and identifies the top tech talent momentum and innovation markets and corresponding operating costs. Download the Scoring Tech Talent: Influencing Innovation, Economic and Real Estate Growth in 50 U.S. Markets.
Spencer G. LevyAmericas Head of Research+1 410 951 [email protected] Follow Spencer on Twitter: @SpencerGLevy
Andrea CrossAmericas Head of Office Research+1 415 772 [email protected] Andrea on Twitter: @AndreaBCross
2015 TECH-THIRTY | CBRE Research50