cc111 lec#6 : flow charts 1 flow charts reference :understanding computers chapter 13
TRANSCRIPT

CC111 Lec#6 : Flow Charts 1
Flow Charts
Reference :Understanding ComputersChapter 13
CC111 Lec#6 : Flow Charts 2
DefinitionsDefinitionsDefinitionsDefinitions
FlowchartFlowchart:: is a diagrammatic representation that
illustrates the sequence of operations to be performed
to get the solution of a problem.

CC111 Lec#6 : Flow Charts 3
Standard Symbols UsedStandard Symbols UsedStandard Symbols UsedStandard Symbols Used
A1
Off-page Connector
?Yes
No
Condition
CalculateVariables
Process Rectangle
A
On-Page Connector
PrintPrintResultsResults
Input/OutputStart Or Stop Process
Start

CC111 Lec#6 : Flow Charts 4
How to Write a Program?How to Write a Program?How to Write a Program?How to Write a Program?
1.Start
2.Define Problem to Solve
3.Think of an Algorithm
4.Think of a Technique for the Solution
5.Write Solution on a Piece of Paper
6.If not Finished Repeat Steps 4 and 5
7.Write Code and Program
8.Debug and Test
9.If not Finished Repeat Steps 7 and 8
10.Stop
CC111 Lec#6 : Flow Charts 5
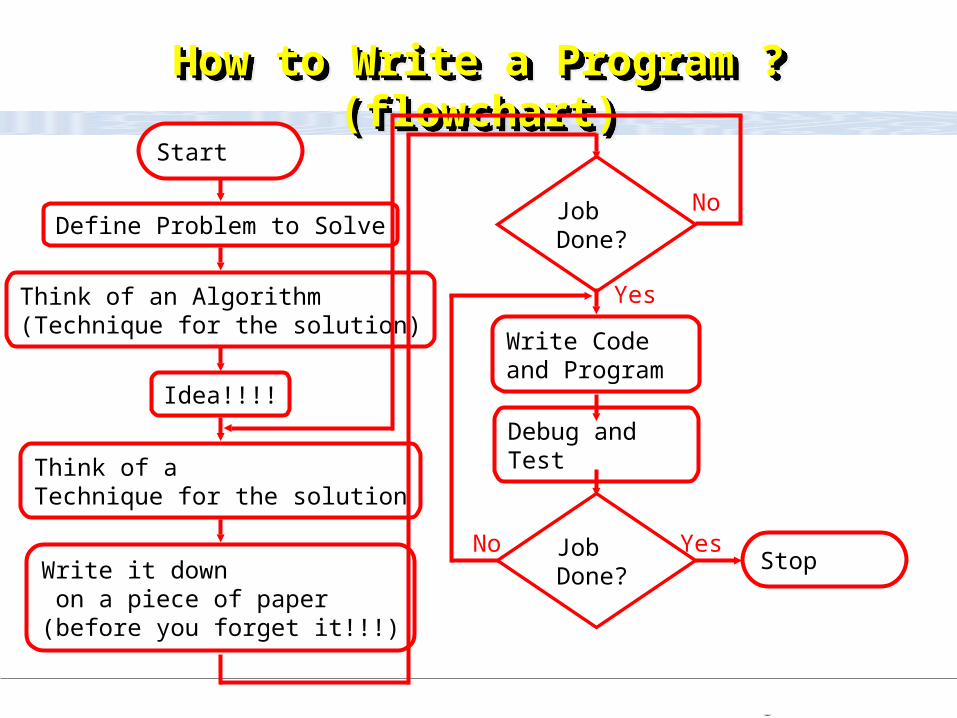
How to Write a Program ?(flowchart)How to Write a Program ?(flowchart)How to Write a Program ?(flowchart)How to Write a Program ?(flowchart)
Define Problem to Solve
Stop
Think of an Algorithm (Technique for the solution)
Idea!!!!
Write it down on a piece of paper(before you forget it!!!)
Write Code and Program
Job Done?
Debug and Test
Job Done?
Start
Think of a Technique for the solution
No
Yes
YesNo

CC111 Lec#6 : Flow Charts 6
DefinitionsDefinitions
An Algorithm
Is a complete step-by-step procedure for solving a
problem or accomplishing a task.
( Where the algorithm is represented by drawing “Flowcharts” )
A computer program makes use of algorithms. A computer program makes use of algorithms.

CC111 Lec#6 : Flow Charts 7
Basic Flow Chart Operations
1.1. Simple SequenceSimple Sequence2.2. Selection PatternSelection Pattern3.3. Loop PatternLoop Pattern
All computer instructions are based on four basic processing patterns:
CC111 Lec#6 : Flow Charts 8
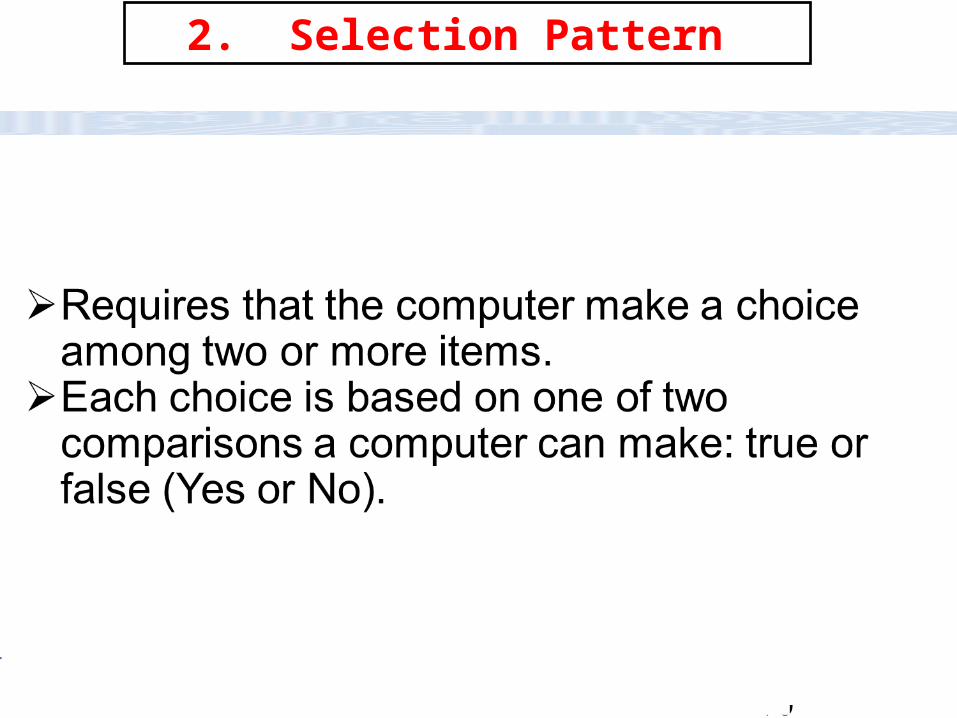
1.Simple Sequence
Logic involves executing instructions one statement after another, in the order presented by the program.
This is the simplest and most-used pattern. The computer assumes that all instructions are to be
executed in this order unless the program presents other instructions.
CC111 Lec#6 : Flow Charts 9
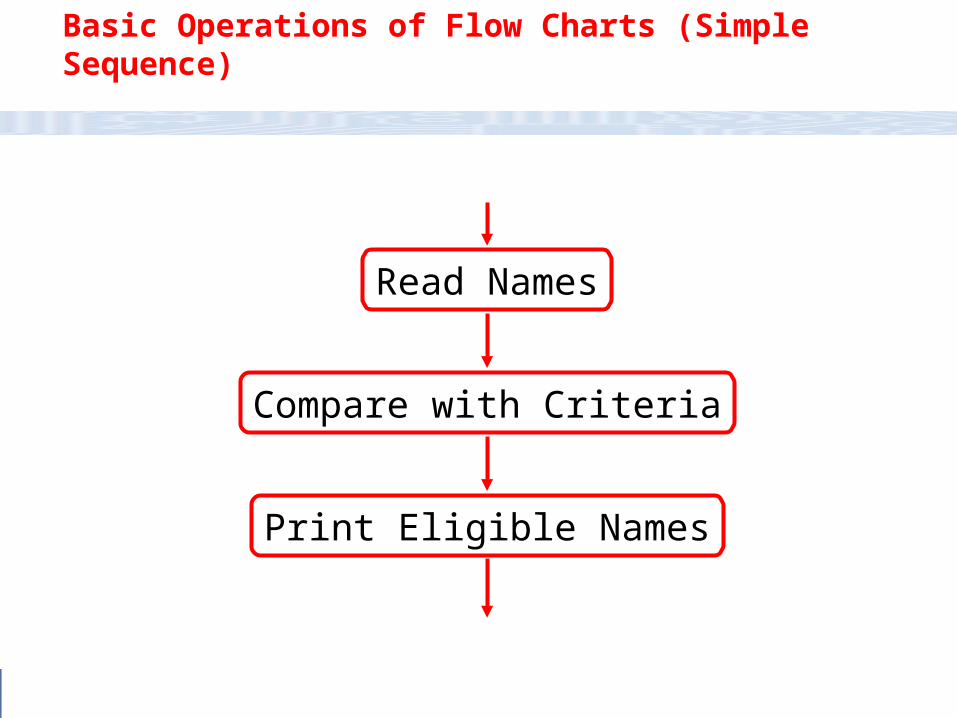
Read Names
Compare with Criteria
Print Eligible Names
Basic Operations of Flow Charts (Simple Sequence)
CC111 Lec#6 : Flow Charts 10
2. Selection Pattern
CC111 Lec#6 : Flow Charts 11
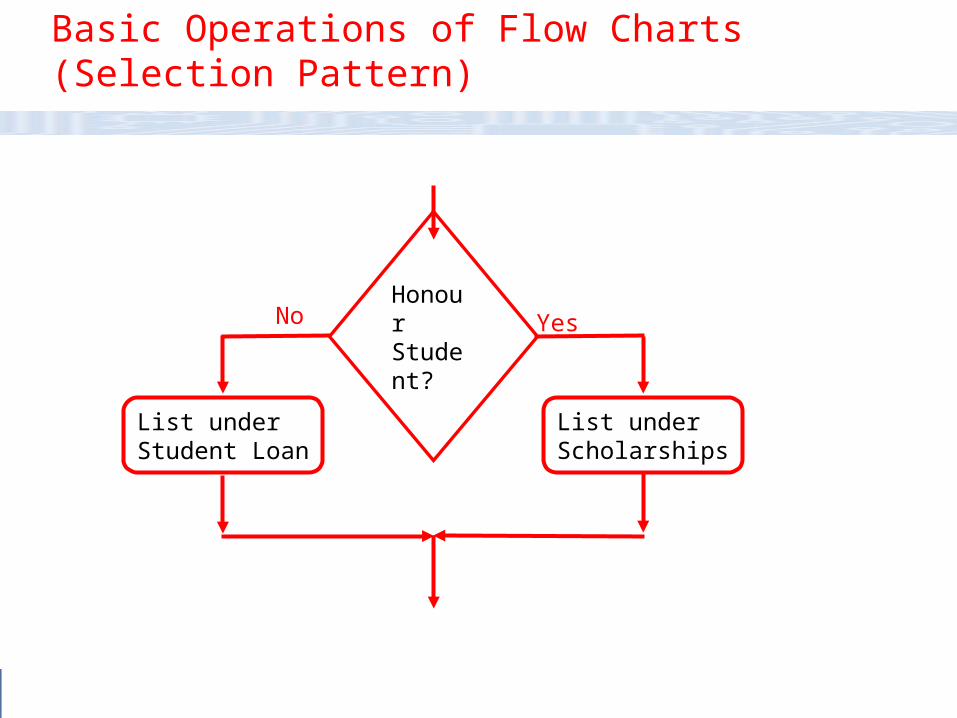
Honour Student?
List underStudent Loan
Yes
List underScholarships
No
Basic Operations of Flow Charts (Selection Pattern)

CC111 Lec#6 : Flow Charts 12
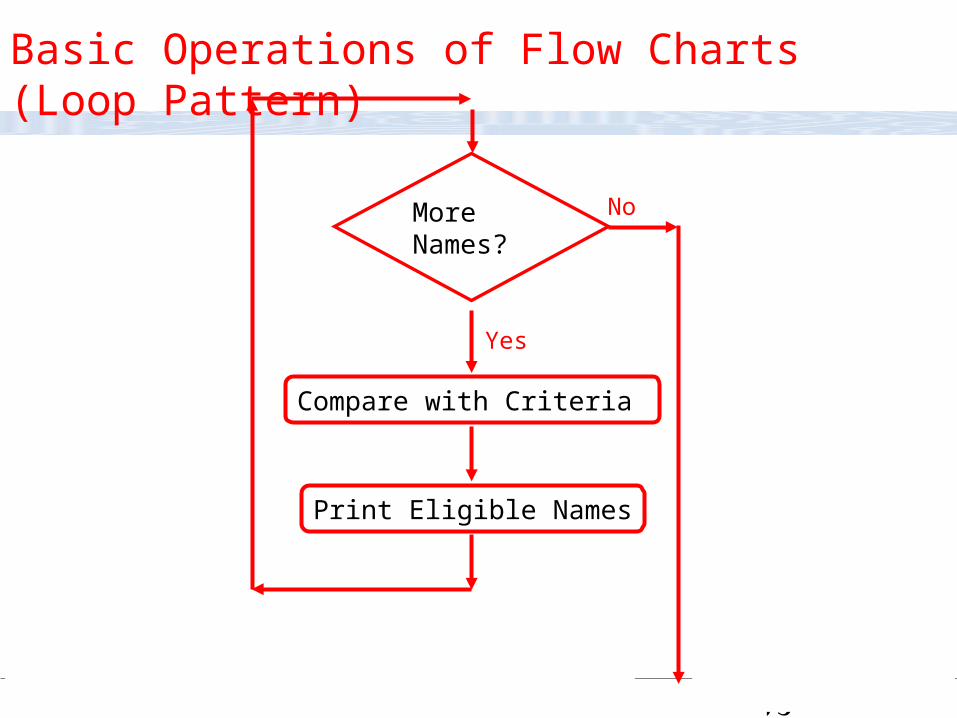
3. Loop Pattern
Directs the computer to loop back to a previous statement in the program, repeating the same sequence over again, usually with new data.
By looping, the programmer avoids having to repeat the same set of instructions over and over
CC111 Lec#6 : Flow Charts 13
More Names?
No
Yes
Compare with Criteria
Print Eligible Names
Basic Operations of Flow Charts (Loop Pattern)

CC111 Lec#6 : Flow Charts 14
Flowcharts play a vital role in the programming of a problem and are quite helpful in understanding the logic of complicated and lengthy problems.
Once the flowchart is drawn, it becomes easy to write the program in any high level language.
Often we see how flowcharts are helpful in explaining the program to others.
Hence, it is correct to say that a flowchart is a must for the better documentation of a complex program.
Uses of Flow Charts
CC111 Lec#6 : Flow Charts 15
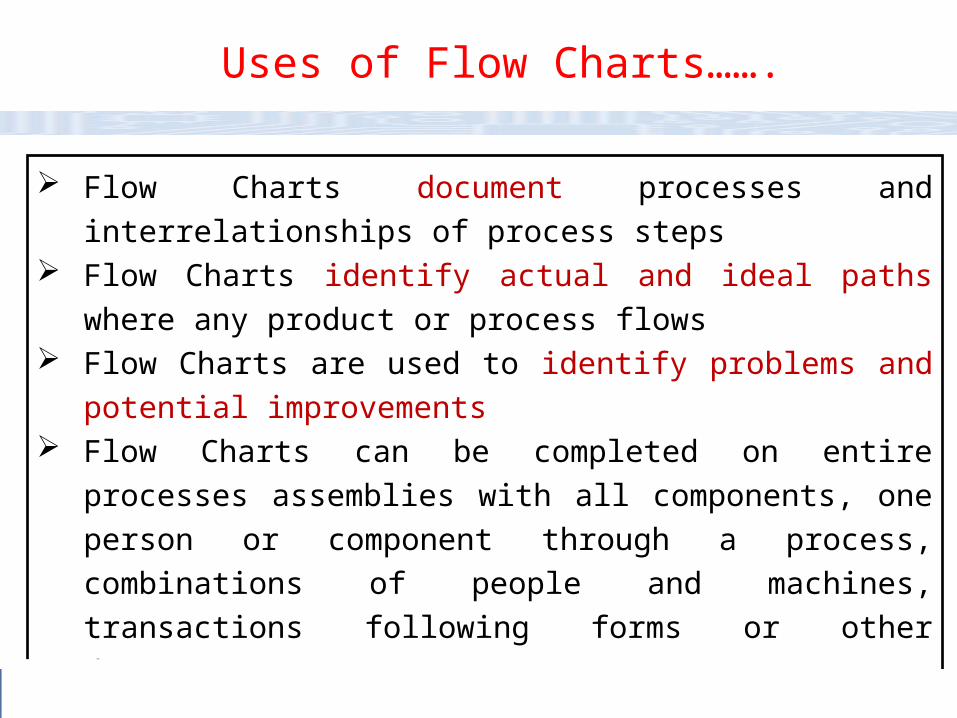
Flow Charts document processes and interrelationships of
process steps Flow Charts identify actual and ideal paths where any product
or process flows Flow Charts are used to identify problems and potential
improvements Flow Charts can be completed on entire processes
assemblies with all components, one person or component
through a process, combinations of people and machines,
transactions following forms or other documents, etc.
Uses of Flow Charts…….

CC111 Lec#6 : Flow Charts 16
Communication: Flowcharts are better way of communicating the logic of a system to all concerned.
Effective Analysis: With the help of flowchart, problem can be analysed in more effective way.
Proper Documentation: Program flowcharts serve as a good program documentation, which is needed for various purposes.
Advantages of Flow Charts
CC111 Lec#6 : Flow Charts 17
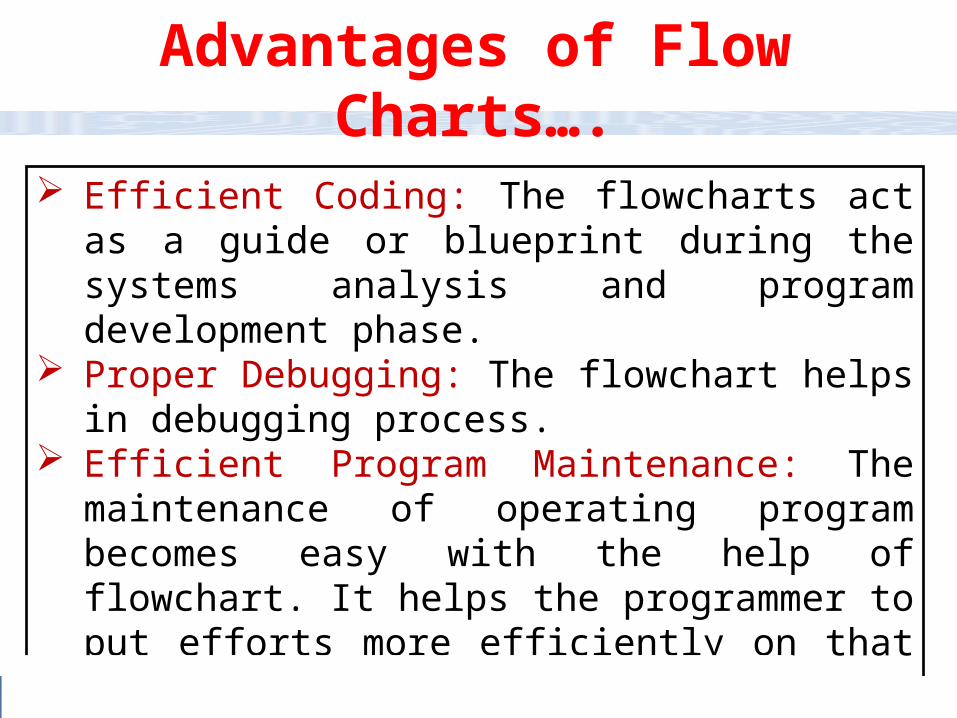
Efficient Coding: The flowcharts act as a guide or blueprint during the systems analysis and program development phase.
Proper Debugging: The flowchart helps in debugging process.
Efficient Program Maintenance: The maintenance of operating program becomes easy with the help of flowchart. It helps the programmer to put efforts more efficiently on that part.
Advantages of Flow Charts….
CC111 Lec#6 : Flow Charts 18
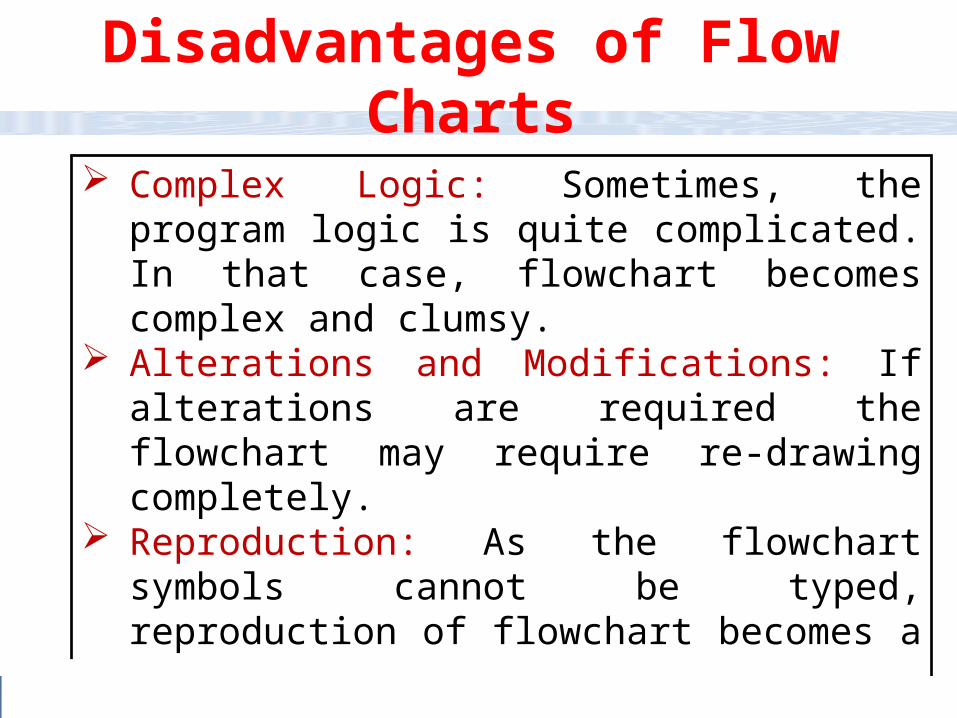
Complex Logic: Sometimes, the program logic is quite complicated. In that case, flowchart becomes complex and clumsy.
Alterations and Modifications: If alterations are required the flowchart may require re-drawing completely.
Reproduction: As the flowchart symbols cannot be typed, reproduction of flowchart becomes a problem.
The Essentials of what Is Done can easily be lost in the technical details of how it is done.
Disadvantages of Flow Charts
CC111 Lec#6 : Flow Charts 19
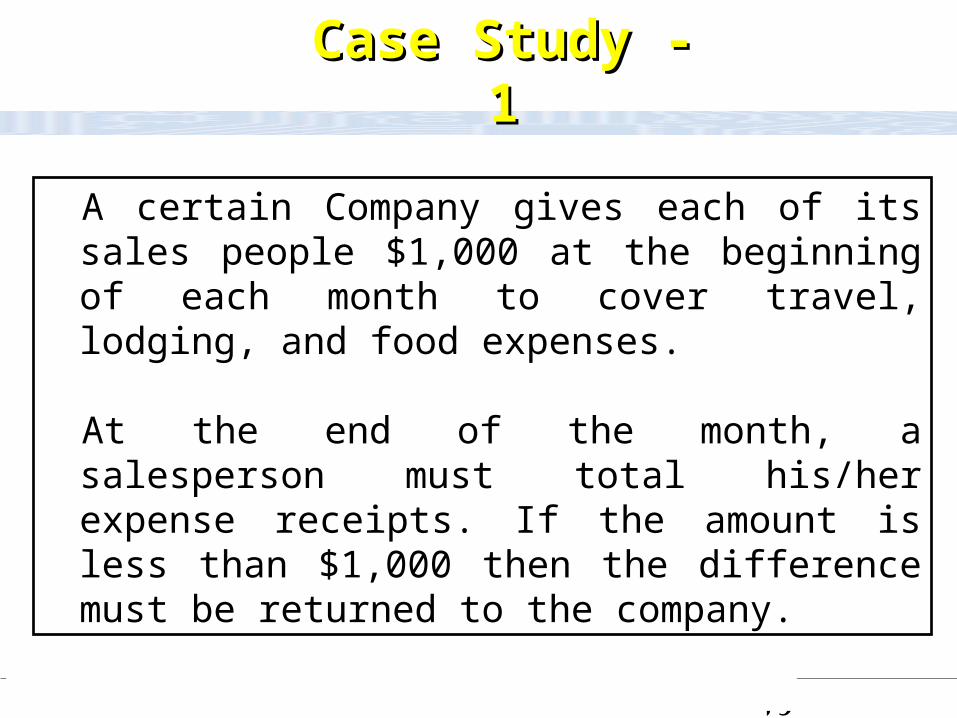
A certain Company gives each of its sales people $1,000 at the beginning of each month to cover travel, lodging, and food expenses.
At the end of the month, a salesperson must total his/her expense receipts. If the amount is less than $1,000 then the difference must be returned to the company.
Case Study - 1Case Study - 1

CC111 Lec#6 : Flow Charts 20
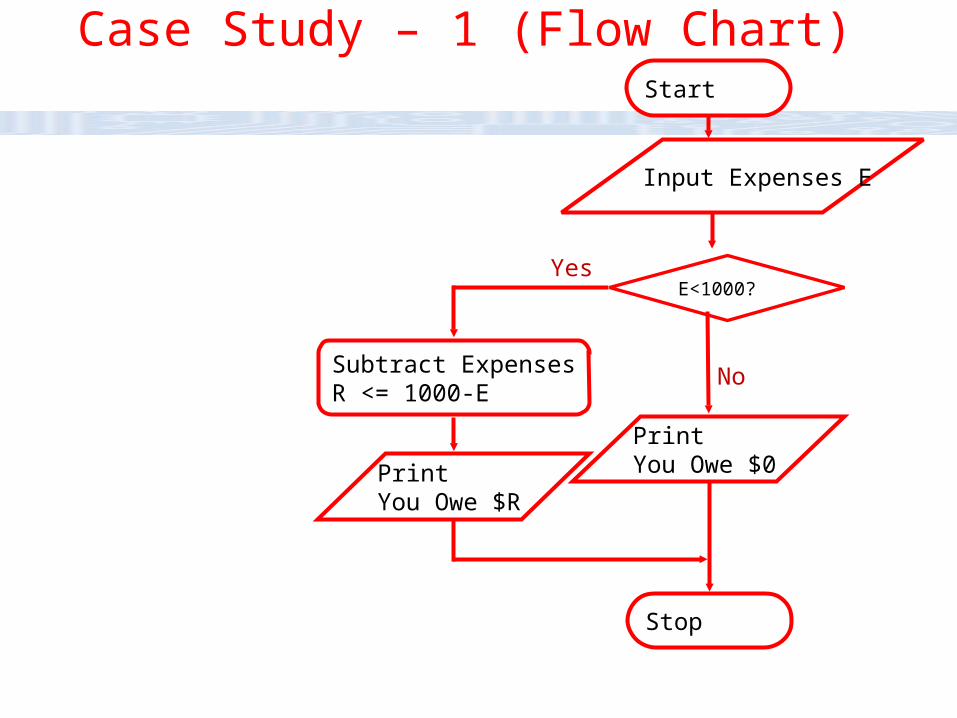
Here is an algorithm for figuring how much Here is an algorithm for figuring how much money, if any, must be returned:money, if any, must be returned:
1-Total the expense receipts for the month.1-Total the expense receipts for the month.2. Subtract the amount of the expense receipts from 2. Subtract the amount of the expense receipts from 1,000.1,000.3. 3. If the remainder is more than 0, return that amount the remainder is more than 0, return that amount to the company.to the company.
Case Study – 1 (Solution)Case Study – 1 (Solution)
CC111 Lec#6 : Flow Charts 21
Stop
Subtract ExpensesR <= 1000-E
E<1000?
Start
No
Yes
Input Expenses E
Print You Owe $0Print
You Owe $R
Case Study – 1 (Flow Chart)

CC111 Lec#6 : Flow Charts 22
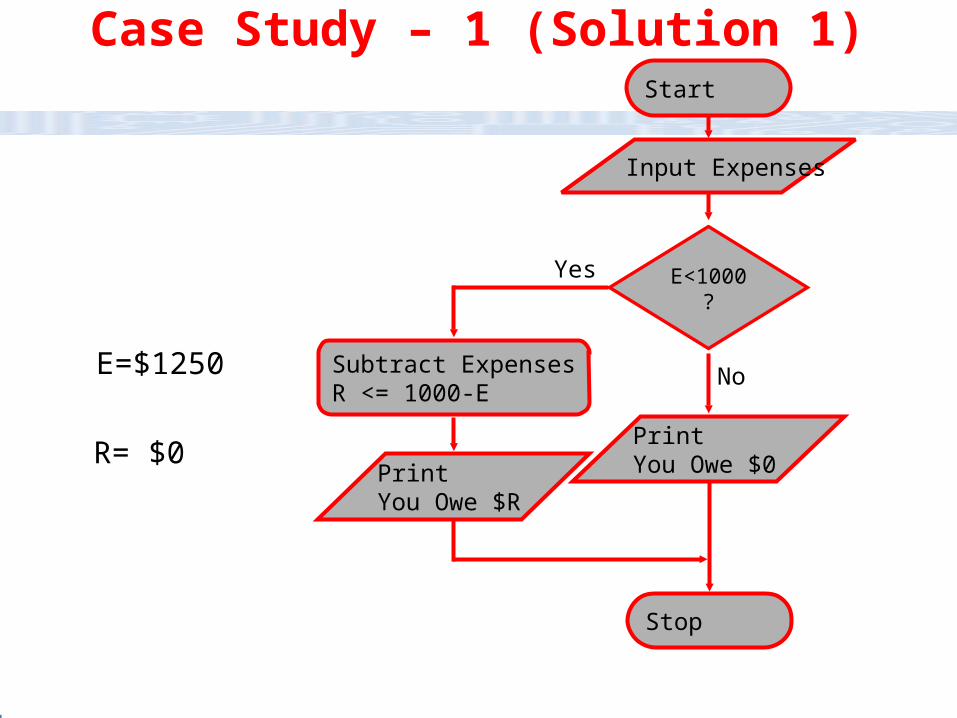
What would be the amount to return to the company in this case?
Assume the Employee has Spent$1250
Case Study – 1 (Solution 1)
CC111 Lec#6 : Flow Charts 23
Stop
Subtract ExpensesR <= 1000-E
E<1000?
Start
No
Yes
Input Expenses
Print You Owe $0Print
You Owe $R
E=$1250
Case Study – 1 (Solution 1)
R= $0
CC111 Lec#6 : Flow Charts 24
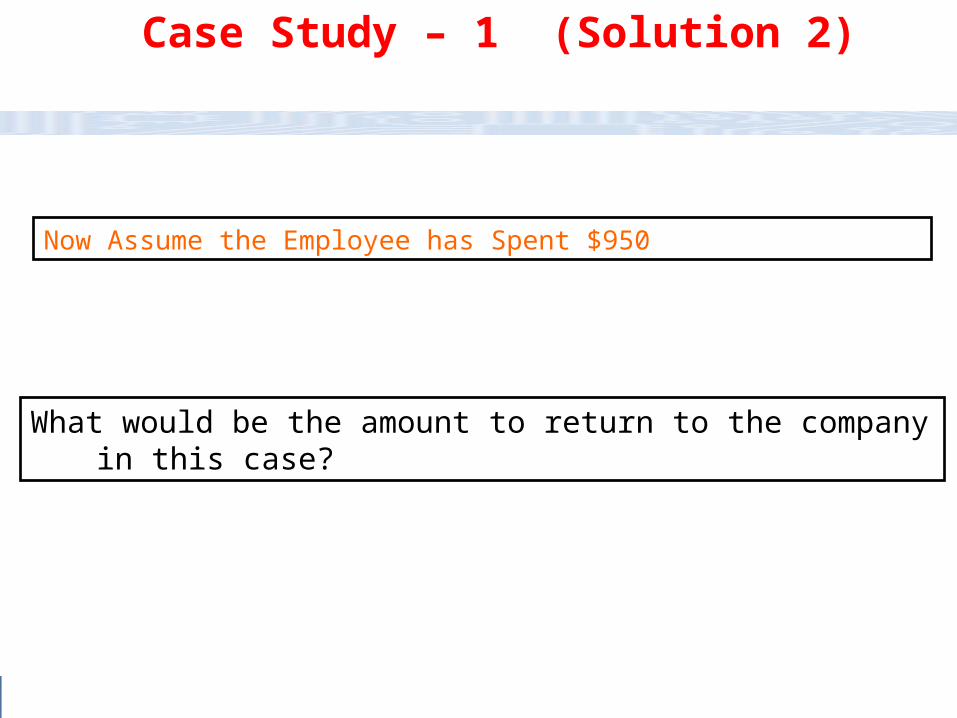
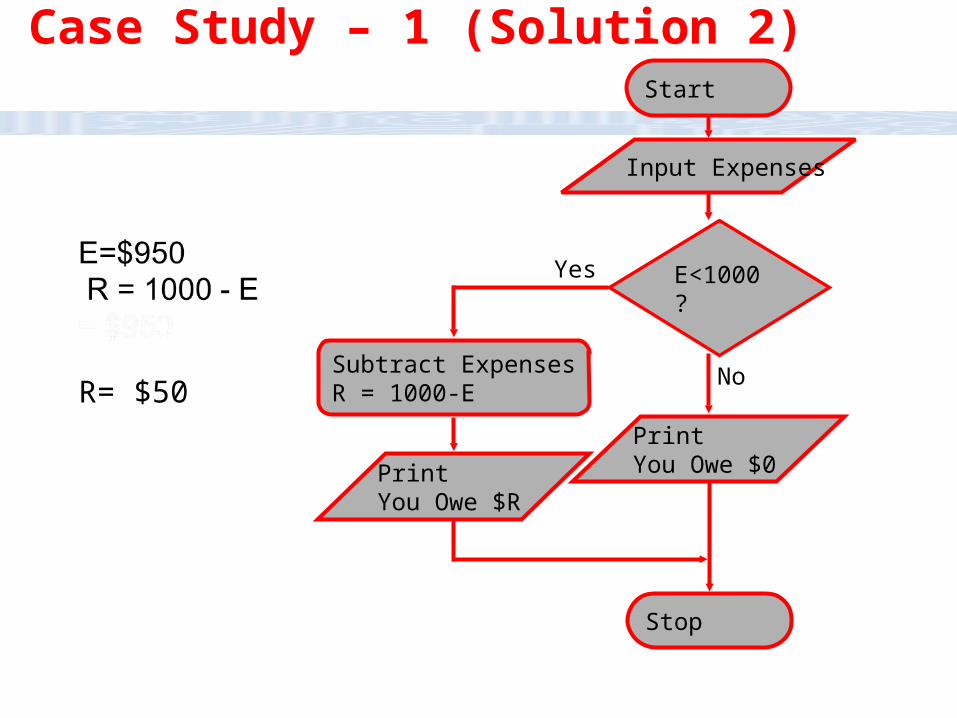
What would be the amount to return to the company in this case?
Now Assume the Employee has Spent $950
Case Study – 1 (Solution 2)
CC111 Lec#6 : Flow Charts 25
Stop
Subtract ExpensesR = 1000-E
E<1000?
Start
No
Yes
Input Expenses
Print You Owe $0Print
You Owe $R
Case Study – 1 (Solution 2)
R= $50

CC111 Lec#6 : Flow Charts 26
Basic Guidelines for Flow Charting
In drawing a proper flowchart, all necessary requirements should be listed out in logical order.
The flowchart should be clear, neat and easy to follow. There should not be any room for ambiguity in understanding the flowchart.
The usual direction of the flow of a procedure or system is from left to right or top to bottom

CC111 Lec#6 : Flow Charts 27
• Only one flow line should come out from a process symbol.
Basic Guidelines for Flow Charting(Cont.)

CC111 Lec#6 : Flow Charts 28
YY
NN
??<<
==
??>>
Basic Guidelines for Flow Charting (Cont.)
Only one flow line should enter a decision symbol, but two or three flow lines, one for each possible answer, should leave the decision symbol.

CC111 Lec#6 : Flow Charts 29
StopStopStartStart
Basic Guidelines for Flow Charting (Cont.)
Only one flow line is used in conjunction with terminal symbol.

CC111 Lec#6 : Flow Charts 30
Write within standard symbols briefly. As necessary, you can use the annotation symbol to describe data or computational steps more clearly.
If the flowchart becomes complex, it is better to use connector symbols to reduce the number of flow lines.
Avoid the intersection of flow lines if you want to make it more effective and better way of communication.
Basic Guidelines for Flow Charting (Cont.)
CC111 Lec#6 : Flow Charts 31
Basic Guidelines for Flow Charting (Cont.)
• Ensure that the flowchart has a logical start and finish.
• It is useful to test the validity of the flowchart by passing through it with a simple test data

CC111 Lec#6 : Flow Charts 32
Draw a flowchart to find the sum of first 5 natural
numbers..
Case Study - 2

CC111 Lec#6 : Flow Charts 33
1010
NN SumSum
00 00
11 11
22 33
33 66
44
55 1515
Sum = 0
Stop
N = 0
N = N + 1
?N = 5
Start
Sum = Sum + N
No
Yes
Print Sum
CC111 Lec#6 : Flow Charts 34
Draw a flowchart to find the largest of three numbers A,B, and C.
Case Study - 3

CC111 Lec#6 : Flow Charts 35
Stop
?A > B
Start
No
Read A, B, C
?B > C
No
?A > C
No
Print B Print C Print APrint C
Yes Yes Yes
Case Study - 3

CC111 Lec#6 : Flow Charts 36
Consider four input cases:Consider four input cases:
4. A = 5 ; B = 3 ; C = 3 4. A = 5 ; B = 3 ; C = 3
1. A = 5 ; B = 7 ; C = 3
2. A = 5 ; B = 6 ; C = 7
3. A = 5 ; B = 3 ; C = 7
Case Study – 3 - (Solutions)Case Study – 3 - (Solutions)
CC111 Lec#6 : Flow Charts 37
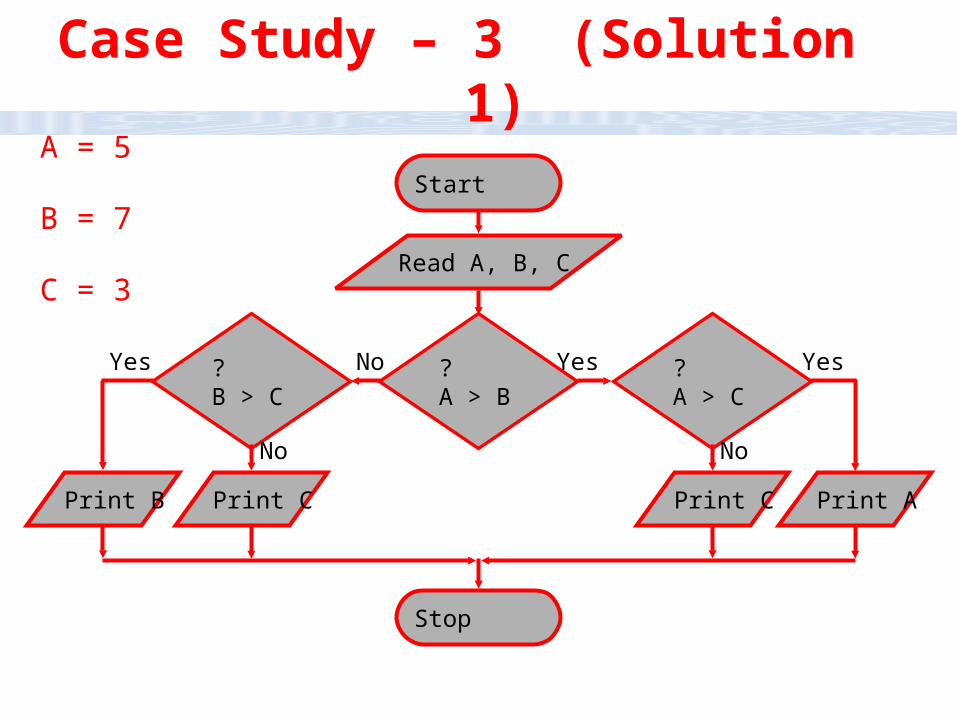
Stop
?A > B
Start
No
Read A, B, C
?B > C
No
?A > C
No
Print B Print C Print APrint C
Yes Yes Yes
B = 7B = 7
C = 3C = 3
A = 5A = 5
Case Study – 3 (Solution 1)

CC111 Lec#6 : Flow Charts 38
Stop
?A > B
Start
No
Read A, B, C
?B > C
No
?A > C
No
Print B Print C Print APrint C
Yes Yes Yes
B = 6B = 6B = 6B = 6
C = 7C = 7C = 7C = 7
A = 5A = 5A = 5A = 5
Case Study – 3 (Solution 2)
CC111 Lec#6 : Flow Charts 39
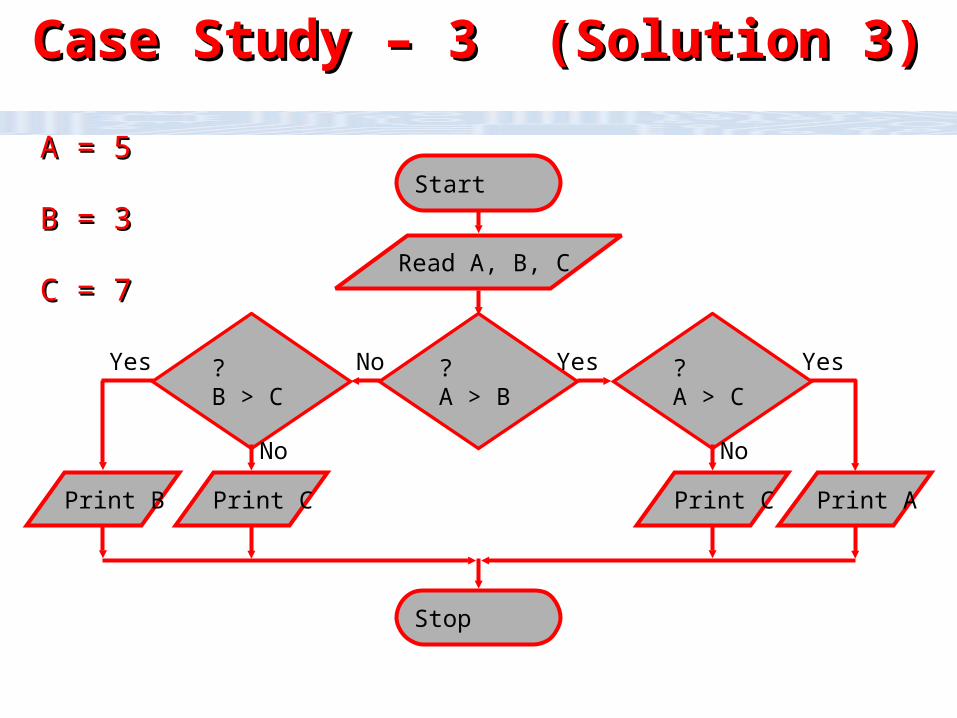
Stop
?A > B
Start
No
Read A, B, C
?B > C
No
?A > C
No
Print B Print C Print APrint C
Yes Yes Yes
B = 3B = 3B = 3B = 3
C = 7C = 7C = 7C = 7
A = 5A = 5A = 5A = 5
Case Study – 3 (Solution 3)Case Study – 3 (Solution 3)
CC111 Lec#6 : Flow Charts 40
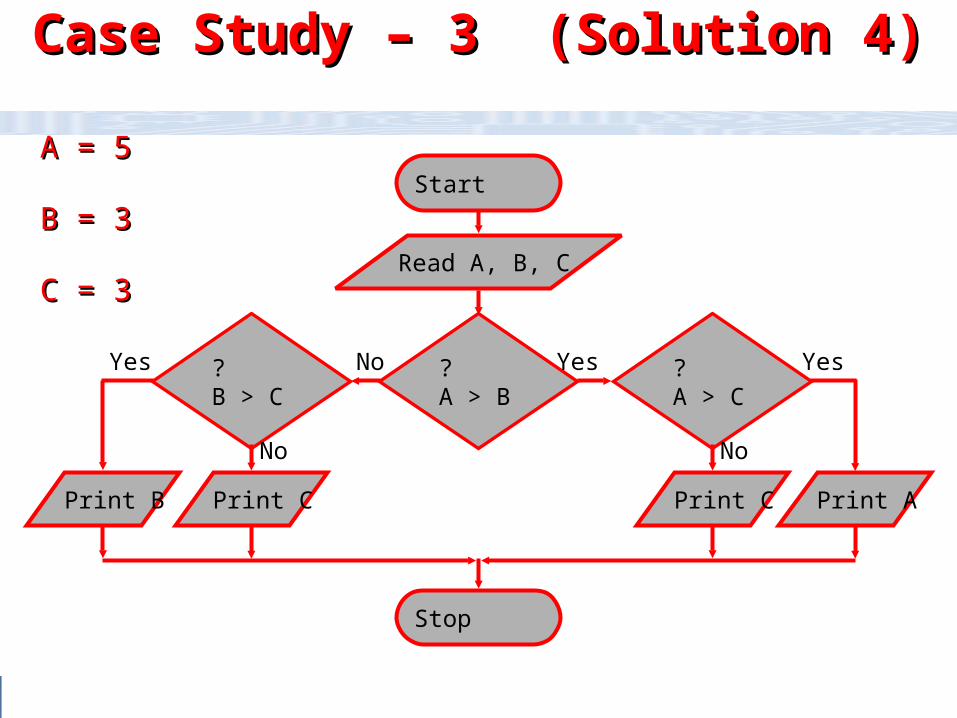
Stop
?A > B
Start
No
Read A, B, C
?B > C
No
?A > C
No
Print B Print C Print APrint C
Yes Yes Yes
B = 3B = 3B = 3B = 3
C = 3C = 3C = 3C = 3
A = 5A = 5A = 5A = 5
Case Study – 3 (Solution 4)Case Study – 3 (Solution 4)

CC111 Lec#6 : Flow Charts 41
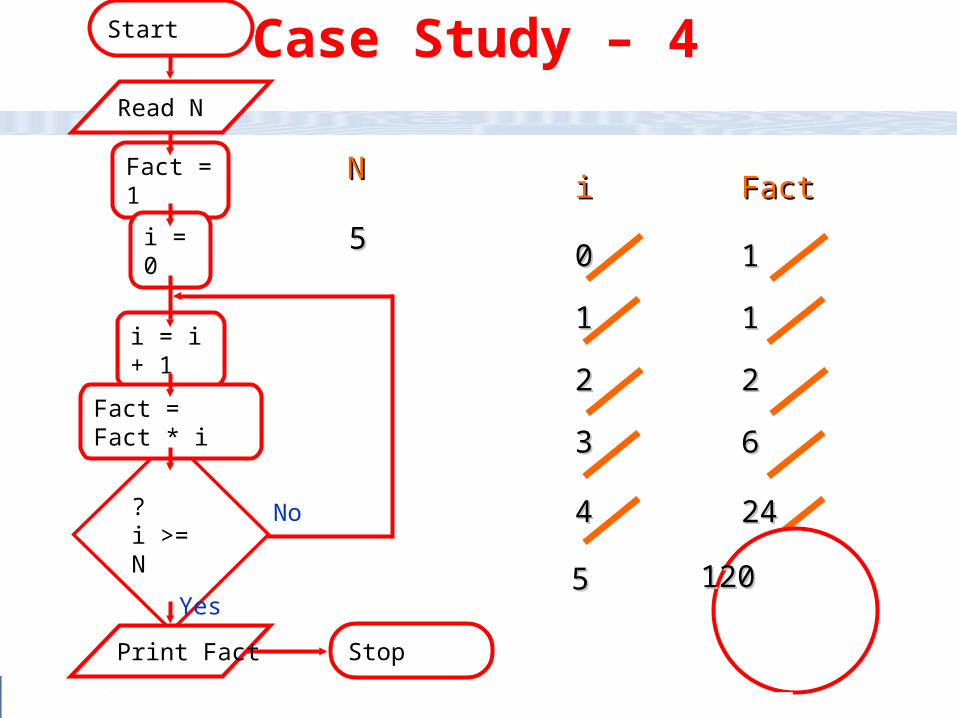
Draw a flowchart for computing factorial N (N!). Where N! = 1 ´ 2 ´ 3 ´ …… N .
Test the program for N = 5
Case Study - 4
CC111 Lec#6 : Flow Charts 42
2424
ii FactFact
00 11
11 11
22 22
33 66
44
55 120120
Fact = 1
Stop
i = 0
i = i + 1
?i >= N
Start
Fact = Fact * i
No
Yes
Print Fact
Read N
NN
55
Case Study – 4