cca rit team first experiment summary
TRANSCRIPT

1
CCA RIT Team first experiment summary
ElenaFedorovskaya,BobChung,DonHutcheson,DavidHunter,PierreUrbainDon'shastyupdate,November13,2018

2
Introduction
• RITresearchpromptedbythesevendatasetsinISO/PAS15339-2.TheseCRPCsexhibitconsistentcolorappearancebutthestatementlacksscientificverification.

3
CRPC1~CRPC7 CMYK(Pictorial,ISO12642-2)
CRPC1 CRPC2 CRPC3 CRPC4 CRPC5 CRPC6 CRPC7
• DifferentsubstratesandC*• SameCMYRGBhueangles• Sametonereproduction• Samegraybalance• Colordifferencesbetweenadjacent
printingconditionsareunequal.• CCAwasmentioned,butnot
verified.
!5#
!4#
!3#
!2#
!1#
0#
1#
2#
3#
4#
5#
0# 10# 20# 30# 40# 50# 60# 70# 80# 90# 100#
a*/b*%
%TV%
RPC1_a# RPC1_b# RPC3_a# RPC3_b#
RPC5_a# RPC5_b# RPC7_a# RPC7_b#
!5#
!4#
!3#
!2#
!1#
0#
1#
2#
3#
4#
5#
0# 10# 20# 30# 40# 50# 60# 70# 80# 90# 100#
a*/b*%
%TV%
RPC2_a# RPC2_b# RPC4_a#
RPC4_b# RPC6_a# RPC6_b#
CRPC1,3,5,and7 CRPC2,4,and6
0
0.1
0.2
0.3
0.4
0.5
0.6
0.7
0.8
0.9
1
0.0 1.0 2.0 3.0 4.0 5.0 6.0 7.0 8.0 9.0 10.0 11.0 12.0 13.0 14.0
∆E00
CRF(CRPC1-CRPC2)
(CRPC2-CRPC3)
(CRPC3-CRPC4)
(CRPC4-CRPC5)
(CRPC5-CRPC6)
(CRPC6-CRPC7)
95th percentile ∆E 00
(CRPC1-CRPC2) 7.24(CRPC2-CRPC3) 6.56(CRPC3-CRPC4) 9.86(CRPC4-CRPC5) 4.18(CRPC5-CRPC6) 3.26(CRPC6-CRPC7) 4.03
0"
10"
20"
30"
40"
50"
60"
70"
80"
90"
100"
0" 10" 20" 30" 40" 50" 60" 70" 80" 90" 100"
Dk#
%TV#
RPC1_Dk"
RPC3_Dk"
RPC5_Dk"
RPC7_Dk"
0.0"
10.0"
20.0"
30.0"
40.0"
50.0"
60.0"
70.0"
80.0"
0" 10" 20" 30" 40" 50" 60" 70" 80" 90" 100"
Dk#
%TV#
RPC2_Dk"
RPC4_Dk"
RPC6_Dk"
CRPC 1, 3, 5, and 7! CRPC 2, 4, and 6!

4
Objectives
• TestthehypothesisthatCCAdependsonmultipledatasetswithvaryinggamutvolumes,whilehavingconsistenttonality,graybalanceandhuesrelativetosubstrate.• Examinethesuitabilityofthe95thpercentile∆E00asaCCAmetric• 3∆E00(95thpercentile∆E00)colordifferencebetweenadjacentdatasetsintheControlandtheExperimentalgroups.

5
Experimental — Sample Preparation • UseCRPC5asastartingpointtocreate7datasetsdifferinginchromaandgamutvolumeby3∆E00at95%pctl.(Controlgroup).
• Createsystematicallydistorteddatasetsintermsof• graybalance• tonereproduction• chroma(gamut)
• Differences3∆E00at95%pctl.(Experimentalgroup).
TR-1TR-2TR-3 TR+1 TR+2 TR+3
RefCRPC
Ch+1
Ch+2
Ch+3
Ch-1
Ch-2
Ch-3
GB+1
GB+2
GB+3
GB-1
GB-2
GB-3

6
Control Group
CMYK(Pictorial,ISO12642-2)
Ch-3 Ch-2 Ch-1 CRPC4 Ch+1 Ch+2 Ch+3
• DifferentC*andgamut• SameCMYRGBhueangles• Sametonereproduction• Samegraybalance• Colordifferencesbetweenadjacent
printingconditionsareequal.
• ReplaceCRPC1~CRPC7inpsychometrictesting
95th ∆E00 -3d_G7 -2d_G7 -1d_G7 0d_G7 +1d_G7 +2d_G7 +3d_G7
-3d_G7 -----
-2d_G7 3.1 -----
-1d_G7 6.2 3.1 -----
0d_G7 9.2 6.2 3.1 -----
+1d_G7 12.3 9.3 6.2 3.1 -----
+2d_G7 15.2 12.2 9.2 6.2 3.1 -----
+3d_G7 16.8 13.8 10.8 7.9 5.5 3.0 -----

7
Experimental Groups CMYK(Pictorial,ISO12642-2)
TR-3 TR-2 TR-1 CH+2 TR+1 TR+2 TR+3
• SameC*andgamut• SameCMYRGBhueangles• Differenttonereproduction• Samegraybalance• Colordifferencesbetweenadjacentprinting
conditionsareequal.
CMYK(Pictorial,ISO12642-2)
GB-3 GB-2 GB-1 CH+2 GB+1 GB+2 GB+3
• SameC*andgamut• SameCMYRGBhueangles• Sametonereproduction• Differentgraybalance• Colordifferencesbetweenadjacentprinting
conditionsareequal.
95th ∆E00 3Y 2Y 1Y 0 1B 2B 3B
3Y -----
2Y 3.0 -----
1Y 6.1 3.0 -----
0 9.1 6.1 3.0 -----
1B 12.2 9.1 6.1 3.0 -----
2B 15.2 12.1 9.1 6.1 3.0 -----
3B 18.1 15.1 12.1 9.1 6.0 3.0 -----
95th ∆E00 -3TVI -2TVI -1TVI 0 +1TVI +2TVI +3TVI
-3TVI -----
-2TVI 3.0 -----
-1TVI 6.1 3.0 -----
0 9.0 5.9 3.0 -----
+1TVI 12.0 8.9 6.0 3.0 -----
+2TVI 14.9 11.9 8.9 6.0 3.0 -----
+3TVI 17.7 14.9 11.9 9.0 6.0 3.0 -----

8
Experimental — Sample Verification
• Verifyalldatasetandprofiles(AnnexC)• Applyprofilestotestimagesandoutputhardcopy,perflowchart.
• MeasurehardcopiesoftheIdealliance12647-7digitalcontrolstrip(84patches)andcalculatethe95thpercentile∆E00betweenadjacentdatasets.

9
Experimental — Psychometric Testing 1
• Thereisa‘hole’intheControlgroup.Rankthecandidateimagesthatexhibit(fromthemosttotheleast)consistentcolorappearanceinrelationtotheControlgroup.
Controlgroup
CandidateImages(randomized)

10
Visual Variation Between Datasets
• Thenextfiveslidesvisualizethesevenbasicdatasets,andthedistorteddatasets(TVI,Contrast,Graybalance,Chroma)• Eachdatasetineachgroupdiffersfromit'sneighbourby3∆E0095thpctl.• Theleftimageisanominalreference

11
7 datasets
12
TVI

13
S-curve
14
Graybal

15
Chroma

16
Experimental — Psychometric Testing 2
or
or
Whichsetinpairhashigherconsistencyofcolorappearance?Providerating1-excellent,2-good,3–fair,4–poor,5-unacceptable

17
Results — Sample Verification
• Visualsimulationmeetsexpectations.
• Theaverage95thpercentilecolordifferencebetweenadjacentdatasetsintheControlgroupis3.1∆E00.
• Theaverage95thpercentilecolordifferencebetweenadjacentdatasetsintheExperimentalgroupis3.0∆E00.
• Theaverage95thpercentile∆E00betweentheControldataset(2d_G7)andgraybalancedistortedgroupis3∆E00,6∆E00,or9∆E00.

18
Results — Visual Simulation • Controlgroupvs.CRPC1~CRPC7
7newdatasetsfromCRPC5byscalingwhitepoint,blackpointandchromawithconstantprimaryhueangles,G7tonalityandgraybalance,withthe95thpercentile∆E00betweenanytwoadjacentdatasets=3
VisualsimulationoftheControlgroup(-3d~3d)
VisualsimulationoftheCRPCs(CRPC1~CRPC7)

19
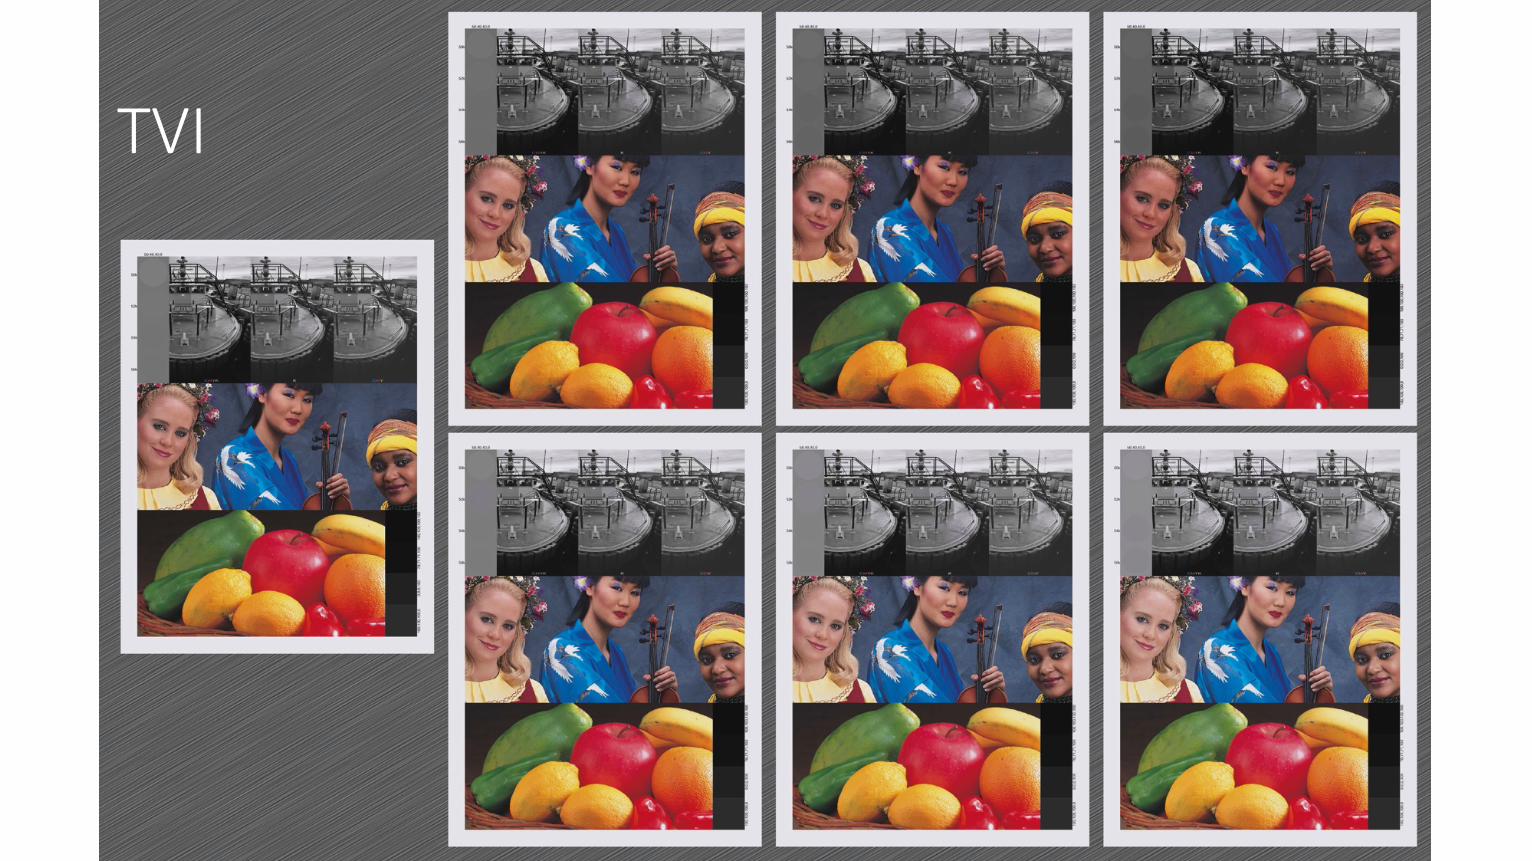
Results — Visual Simulation • Experimentalgroup(tonalcurveshapevs.TVI)
12datasetsvaryingintonality(3lighter,3darker,3lowercontrast,3highercontrast)and18datasetswithgraybalance(3each+CMYRGB)variationsfromonereferencecontroldataset,with395thpercentile∆E00betweenanytwoadjacentdatasets.
• VisualsimulationoftheExperimentalgroup(S-3toS+3)
• VisualsimulationoftheExperimentalgroup(TVI-3toTVI+3)

20
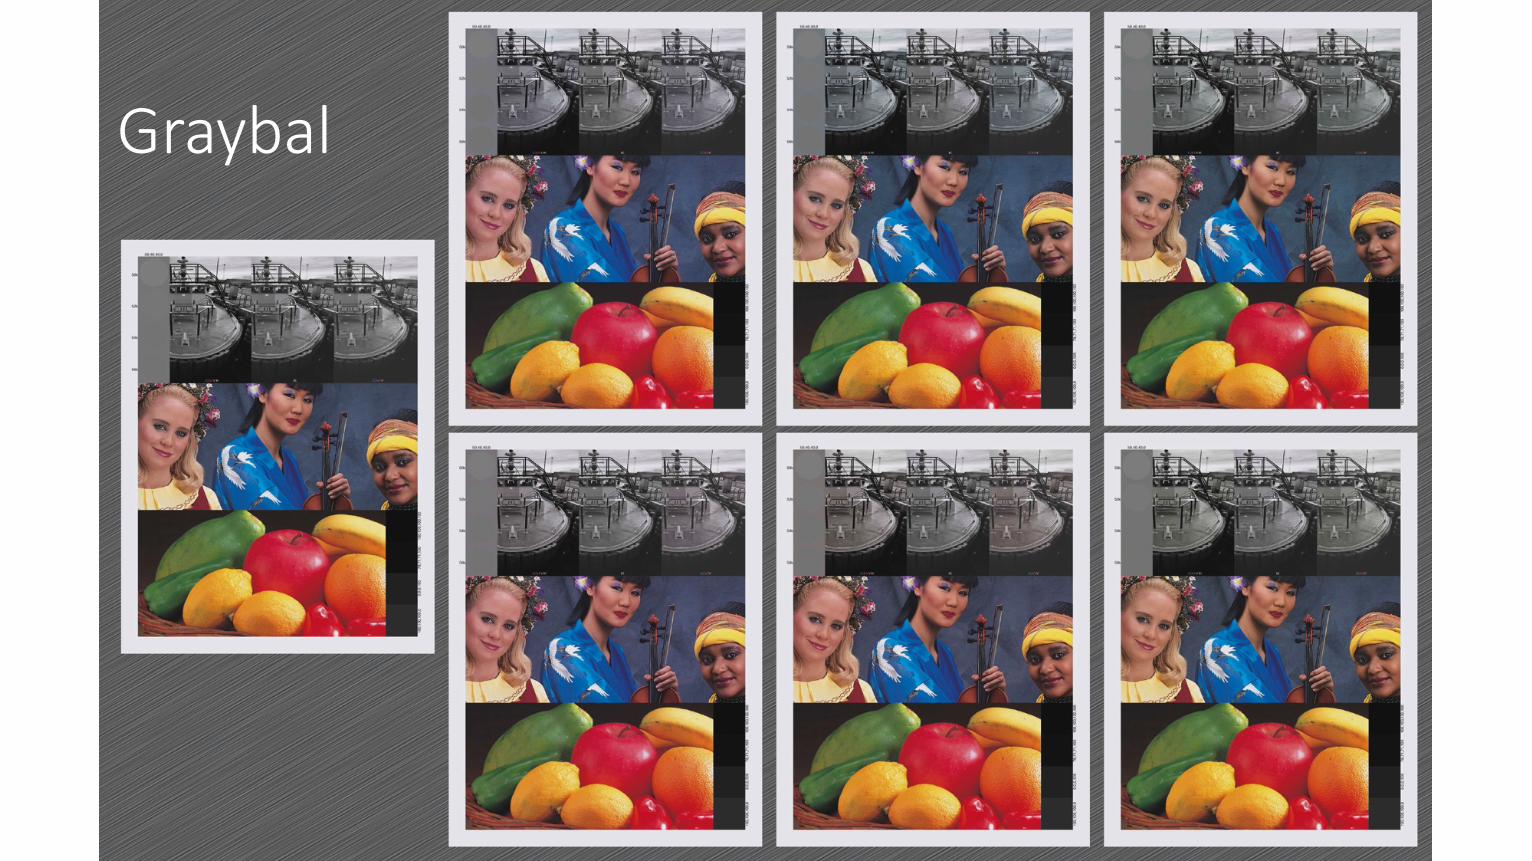
• VisualsimulationoftheExperimentalgroup(GB_C-R)
• VisualsimulationoftheExperimentalgroup(GB_M-G)
• VisualsimulationoftheExperimentalgroup(GB_Y-B)
• Experimentalgroup(graybalanceincomplementaryhueangles)
Results — Visual Simulation

21
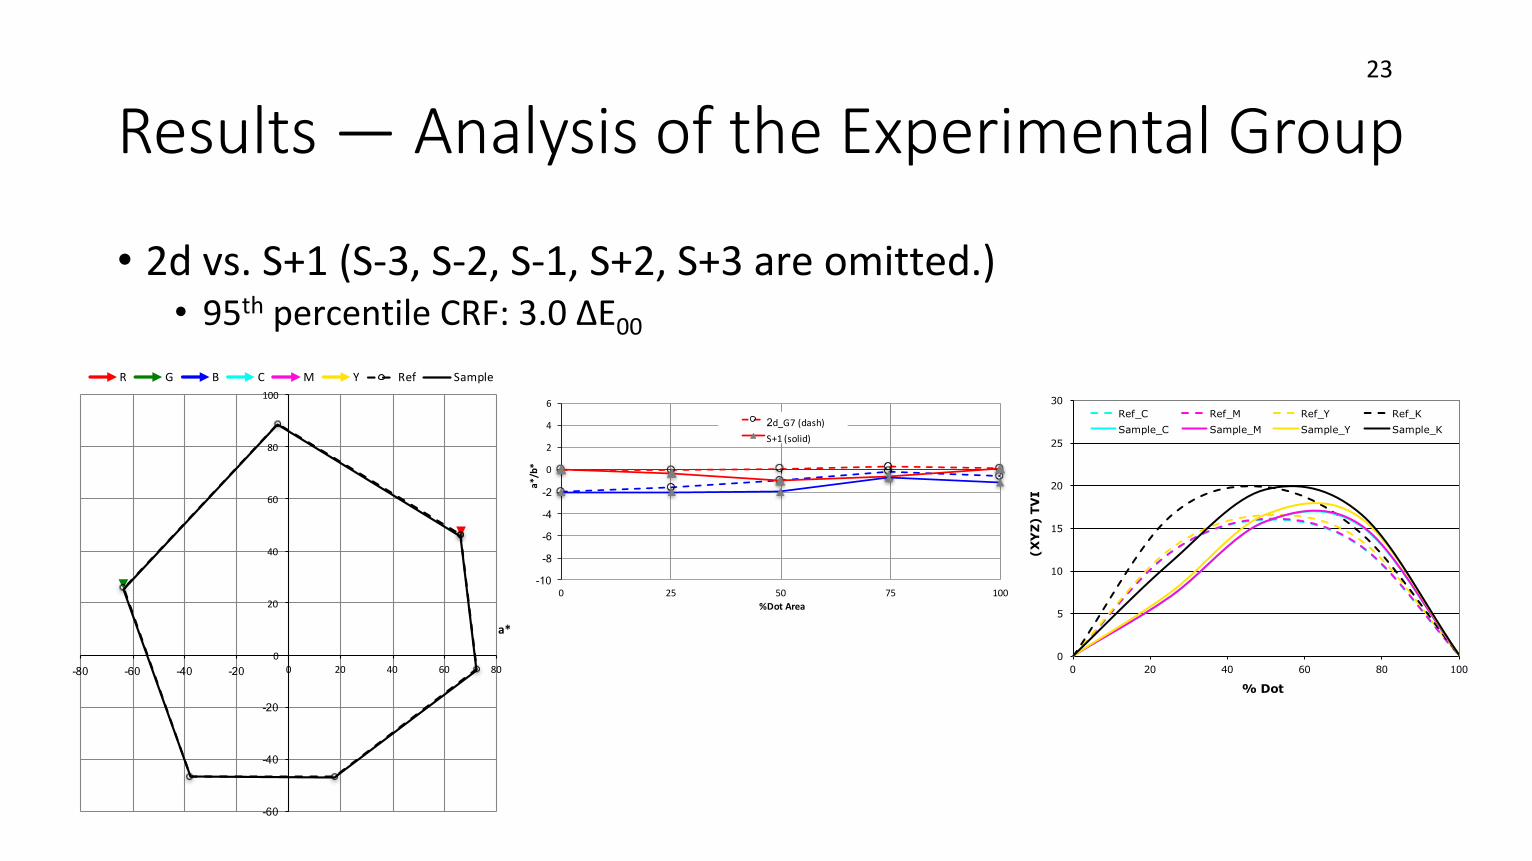
Results — Analysis of the Experimental Group
• 2dvs.GB_C1(B1,G1,M1,R1,Y1areomitted.)• 95thpercentileCRF:3.1∆E00
-60
-40
-20
0
20
40
60
80
100
-80 -60 -40 -20 0 20 40 60 80
b*
a*
R G B C M Y Ref Sample
-10 -8 -6 -4 -2 0
2
4
6
0 25 50 75 100
a*/b*
%DotArea
2d_G7(dash) GB_C+1(solid)
0
5
10
15
20
25
30
0 20 40 60 80 100
(XY
Z) T
VI
% Dot
Ref_C Ref_M Ref_Y Ref_KSample_C Sample_M Sample_Y Sample_K

22
Results — Analysis of the Experimental Group
• 2dvs.GB_C2(B2,G2,M2,R2,Y2areomitted.)• 95thpercentileCRF:6.1∆E00
-60
-40
-20
0
20
40
60
80
100
-80 -60 -40 -20 0 20 40 60 80
b*
a*
R G B C M Y Ref Sample
-10 -8 -6 -4 -2 0
2
4
6
0 25 50 75 100
a*/b*
%DotArea
2d_G7(dash) GB_C+2(solid)
0
5
10
15
20
25
30
0 20 40 60 80 100
(XY
Z) T
VI
% Dot
Ref_C Ref_M Ref_Y Ref_KSample_C Sample_M Sample_Y Sample_K
23
Results — Analysis of the Experimental Group
• 2dvs.S+1(S-3,S-2,S-1,S+2,S+3areomitted.)• 95thpercentileCRF:3.0∆E00
-60
-40
-20
0
20
40
60
80
100
-80 -60 -40 -20 0 20 40 60 80
b*
a*
R G B C M Y Ref Sample
-10 -8 -6 -4 -2 0
2
4
6
0 25 50 75 100
a*/b*
%DotArea
2d_G7(dash) S+1(solid)
0
5
10
15
20
25
30
0 20 40 60 80 100
(XY
Z) T
VI
% Dot
Ref_C Ref_M Ref_Y Ref_KSample_C Sample_M Sample_Y Sample_K

24
Results —95th ∆E00 of Adjacent Datasets
• Experimentaldatasets(GB_3Y~3B)
• ‘0’represents‘+2d_G7’
95th ∆E00 3Y 2Y 1Y 0 1B 2B 3B
3Y -----
2Y 3.0 -----
1Y 6.1 3.0 -----
0 9.1 6.1 3.0 -----
1B 12.2 9.1 6.1 3.0 -----
2B 15.2 12.1 9.1 6.1 3.0 -----
3B 18.1 15.1 12.1 9.1 6.0 3.0 -----
95th ∆E00 -3TVI -2TVI -1TVI 0 +1TVI +2TVI +3TVI
-3TVI -----
-2TVI 3.0 -----
-1TVI 6.1 3.0 -----
0 9.0 5.9 3.0 -----
+1TVI 12.0 8.9 6.0 3.0 -----
+2TVI 14.9 11.9 8.9 6.0 3.0 -----
+3TVI 17.7 14.9 11.9 9.0 6.0 3.0 -----
• Experimentaldatasets(-3TVI~+3TVI)
• ‘0’represents‘+2d_G7’

25
Results — Psychometric Testing
• Viewingbooth(gti;ISO3664-2009compliant)• 6Samplesets• 2sessions• 12participants• 6experts• 6novices
Controlset

26
Results — Psychometric Testing
1) RanksamplesthatfitintheimagesetforbestCCA
2) CompareandratesamplesetsfordemonstratingCCA.

27
Results: CCA from ranking images for the best corrected
-3.00 -2.50 -2.00 -1.50 -1.00 -0.50 0.00 0.50 1.00
CCAbasedonrankingcandidateimages
G7+2d
R+1
Y+1
G+1
TVI-1
TVI+1C+1
S-1S+1B+1
TVI-2S-2G+2 S-3
TVI-3M+2S+2
B+2
R+2TVI+2
M+1C+2
ColorConsistencyscalebasedonThurstone’sLawofComparativeJudgement,CaseV(Thurstone,1927)

28
Results: CCA vs measured adjacent 95% delta E00

29
Results: Measured 95% delta E00 vs relative CCA

30Results: Consistency of Color Appearance from Ratings of Sets of Images
LSMeans Differences Tukey HSDα= 0.050 Q= 2.8654
LevelGB Y-BGB M-GGB C-RSTVIControl
AAA
BBB
CC
LeastSq Mean
3.623.403.133.032.422.32
Levels not connected by same letter are significantly different.
11.5
22.5
33.5
44.5
5
Sco
re L
S M
eans
Con
trol
GB
C-R
GB
M-G
GB
Y-B S
TVI
Set
Source
Nparm DF
Sum of Squares F Ratio Prob > F
Set 5 5 81.914 15.301 <.0001*
All12participants

31
LSMeans Differences Tukey HSDα= 0.050 Q= 2.88174
LevelGB Y-BGB M-GGB C-RSTVIControl
AA
BB
CC
D
E
LeastSq Mean
4.134.073.433.232.531.70
Levels not connected by same letter are significantly different.
Results: Comparison of Consistency of Color Appearance Ratings for Sets of Images
Source
Nparm DF
Sum of Squares F Ratio Prob > F
Set 5 5 131.117 31.723 <.0001*
EXPERTSONLY(6participants)
11.5
22.5
33.5
44.5
5
Sco
re L
S M
eans
Con
trol
GB
C-R
GB
M-G
GB
Y-B S
TVI
Set

32
LSMeans Differences Tukey HSDα= 0.050 Q= 2.88174
LevelGB Y-BControlGB C-RSGB M-GTVI
AAAAA
BBBBB
LeastSq Mean
3.102.932.832.832.732.30
Levels not connected by same letter are significantly different.
Results: Comparison of Consistency of Color Appearance Ratings for Sets of Images
Source
Nparm DF
Sum of Squares F Ratio Prob > F
Set 5 5 10.911 2.358 .0423
NOVICESONLY(6participants)
11.5
22.5
33.5
44.5
5
Sco
re L
S M
eans
Con
trol
GB
C-R
GB
M-G
GB
Y-B S
TVI
Set

33
Conclusions • AmethodologyforstudyingConsistentColorAppearanceforasetofprintedimageswasdeveloped.
• PsychometrictestsshowedthatCCAofimagesetwithchromachangesappeartobemoreconsistentthanduetootherattribute(+/-TR,+/-GB)change.
• ThereisadiscrepancybetweenexpertsandnoviceswhenjudgingCCAwhichmaybeattributedtotheCCAversusimagequalityperceptions.
• LargerangeofimagevariationswithinasetcanbeproblematicforjudgingCCA.• Device-based95thpercentile∆E00isshowntobeagoodpredictorforConsistentColorAppearanceinthepresentexperiment.The95thpercentile∆E00~3wereperceptibleintermsofCCAevaluations.
• AdditionalexperimentsareneededtoevaluatetheeffectsofpictorialsceneonCCA.