ccm key comparison ccm.d-k4 hydrometer · ccm.d-k4 “hydrometers” page 2 of 45 ccm.d-k4...
TRANSCRIPT
CCM.D-K4 “Hydrometers” Page 1 of 45
Final report
CCM Key Comparison CCM.D-K4
“Hydrometer”
S. Lorefice1, L. O. Becerra
2, E. Lenard
3, Y. J Lee
4, W.G. Lee
4, T. Madec
5, P. A. Meury
5, J. Cáceres
6,
C. Santos6, C. Vámossy
7, J. Man
8, K. Fen
8, K. Toda
9, J. Wright
10, H. Bettin
11, H. Toth
11
1
Istituto Nazionale di Ricerca Metrologica (INRiM) Strada delle Cacce, 91; 10135 Torino, ITALY
2 Centro Nacional de Metrologia (CENAM) Km 4.5 Carretera a los Cués, Mpio El Marqués, Querétaro – MEXICO
3 Główny Urząd Miar (GUM) ul. Elektoralna 2; 00-950 Warszawa – POLAND
4 Korea Research Institute of Standards and Science (KRISS) 267 Gajeong-Ro Yuseong-Gu, Daejeon 305-340 – REPUBLIC of KOREA
5 Laboratoire National de Métrologie et d’Essais (LNE) 1, rue Gaston Boissier ; 75724 Paris Cedex 15, FRANCE
6 Laboratorio Tecnológico del Uruguay (LATU) Av. Italia 6201, Montevideo - URUGUAY
7 Magyar Kereskedelmi Engedélyezési Hivatal (MKEH)., Németvölgyi út 37-39; 1124 Budapest - HUNGARY
8 National Measurement Institute (NMIA) Bradfield Rd, Lindfield, NSW 2070 - AUSTRALIA
9 National Metrology Institute of Japan (NMIJ) 1-8-31, Midirigaoka, Ikeda, Osaka, 563-8577 - JAPAN
10 National Institute of Standards and Technology (NIST) 100 Bureau Dr., Mail Stop 8361, Gaithersburg, MD 20899 – USA
11 Physikalisch-Technische Bundesanstalt (PTB) Bundesallee 100; 38116 Braunschweig – GERMANY
INRiM, Italy
January 2016
CCM.D-K4 “Hydrometers” Page 2 of 45
CCM.D-K4 “Hydrometer”
Abstract
This report presents the comparison philosophy, methodology, analysis and the results of the designed
CCM.D-K4 key comparison that covered the calibration of high resolution hydrometers for liquid and
alcoholometers in the density range 600 kg/m3 to 2000 kg/m
3 at the temperature of 20 °C. The main
purpose of this comparison was not only to evaluate the degree of equivalence in the calibration of high
accuracy hydrometers between NMI participants, but also to link, were it is possible, the results of
previous Comparisons to Key Comparison Reference Values (KCRVs) of CCM.D-K4. Eleven NMI
laboratories took part in the CCM.D-K4 divided in two groups (petals).
With the CCM.D-K4 purpose, two similar sets consisting of three hydrometers for liquid density
determinations and an alcoholometer were circulated to the NMI participants as a travelling standard in
the time interval from January 2011 to April 2012.
Twelve Key Comparison Reference Values (KCRVs) for each petal have been obtained at the density
values related to the tested density marks of the transfer standards by the results of participants. The
KCRVs and corresponding uncertainties were calculated by the weighted mean in the case of consistent
results, otherwise the median was used.
The degree of equivalence (DoE) with respect to the corresponding KCRV was determined for each
participant and, in this particular comparison, the Weighted Least Squares (WLS) method was used to
link the individual DoE of each participant by a continuous function.
Significant drift of the transfer standards was not detected.
This report also gives instructions on calculating pair-wise degrees of equivalence, with the addition of
any information on correlations that may be necessary to estimate more accurately as well as the
procedure for linking international comparisons to the CCM.D-K4. Finally an example of linkage to the
CCM.D-K4 is given by dealing with the results of the bilateral comparison between INRiM and NMIA,
which was added to this comparison so that all participants were engaged after the breakage of the
9340171 artefact.
A particularly good agreement was found among the results provided by most of the participants, even
if some systematic differences and either underestimated or overestimated uncertainties of the submitted
results can be identified with respect to the KCRVs. In general the deviations of the laboratory results to
the KCRVs are within of 1/3rd to 1/4th of a scale division and the uncertainty at 95 % is usually within
half a division. During the analysis of the submitted results, a systematic difference between the first
and last immersed mark was also noted, possibly due to a temperature gradient along the stem and/or
wetting of the stem around the tested mark, and therefore a corrected claimed uncertainty from each
laboratory is expected. However this comparison may help the laboratories to solve some residual or
marginal problems as well as to better understand the uncertainty components.
The comparison fully supports the calibration measurement capabilities table in the BIPM key
comparison database (KCDB). The results can be used to link regional comparisons to this CCM key
comparison
CCM.D-K4 “Hydrometers” Page 3 of 45
Table of contents
Abstract 2
1. PREFACE 4
2. ORGANIZATION 6
2.1 Participants and schedule 6
2.2 Transfer standards (hydrometer samples) 6
2.3 Conditions selected 7
2.4 Procedure and method of measurement 10
2.4.1 Uncertainty claims of NMIs 12
3. RESULTS 12
3.1 Data received from participants 12
3.2 Communication from the participating laboratories 13
3.3 Interpretation of the comparison: the degree of equivalence DoE 14
3.4 Key Comparison Reference Values (KCRV) and degrees of equivalence 15
3.5 Continuous functions of DoEs 18
3.6 Degree of equivalence between pairs of NMIs 19
3.7 Linkage of international comparisons to the CCM.D-K4 20
3.8 The bilateral comparison INRiM – NMIA and its linkage to CCM.D-K4 21
4. DISCUSSION and CONCLUSION 23
References 25
Acknowledgements 25
Appendix A1 26
Hydrometer S/N 9342351 27
Hydrometer S/N 9340172 29
Hydrometer S/N 9343460 31
Hydrometer S/N 9346684 33
Hydrometer S/N 9342348 35
Hydrometer S/N 9340171 37
Hydrometer S/N 9343462 39
Hydrometer S/N 9346688 41
Appendix A2 43
CCM.D-K4 “Hydrometers” Page 4 of 45
1. PREFACE
A CIPM key comparison concerning the calibration of high resolution hydrometers for liquid
density determinations in the range 600 kg/m3 to 2000 kg/m
3 at the temperature of 20 °C was
proposed during the meeting of the Working Group on Density (WG-Density) of the
Consultative Committee for Mass and Related Quantities (CCM) held on April 22nd
, 2008 at
the BIPM with the purpose to:
Recognize and compare the different experimental setups and calibration methods applied
by the participants;
Compare the participants’ methods for the uncertainty evaluation and ascertain the
consistency of their calibration results;
Allow linkage of the regional comparisons previously performed under the auspices of the
Regional Metrology Organizations APMP, EURAMET and SIM.
This CIPM key comparison program, designated as CCM.D-K4 “Hydrometer”, was
coordinated by the Istitituto Nazionale di Ricerca Metrologica (INRiM, Italy). The
Physikalisch-Technische Bundesanstalt (PTB, Germany) and the Centro Nacional de
Metrologia (CENAM, Mexico) supported the pilot to determine the technical protocol for this
key comparison. A total of 11 National Metrology Institutes, divided into two groups took part
in this comparison.
The Key comparison CCM.D-K4 “Hydrometer”, which covered the density range 600 kg/m3 to
2000 kg/m3 at 20 °C, comes after various comparisons in “Hydrometry” performed everywhere
since the 90s. For the purpose of this project two similar sets consisting of three high-accuracy
hydrometers for liquid density determinations and an alcoholometer (alcohol hydrometer) cl.1
were arranged and each set of them was circulated to each of the two groups as travelling
standards in the time interval from January 2011 to April 2012.
The corrections to be applied to the stated scale readings at 20 °C is often the parameter
compared in inter-comparisons. Each laboratory, belonging to an individual petal, determined
the corrections to be applied to three stated scale readings at 20 °C of different hydrometers in
accordance with the technical protocol and the report form received in advance [1].
The present report, which is based on the uniform treatment of the results of the participants,
describes the organization of the actual project, the method for analysis of the calibration data
and the comparison results.
The results also allowed determination of the degrees of equivalence of each participating NMI
with the Key Comparison Reference Values (KCRV) of the CCM.D-K4.
The Final report is intended to be a publication for the CIPM Key Comparison Data Base.
CCM.D-K4 “Hydrometers” Page 5 of 45
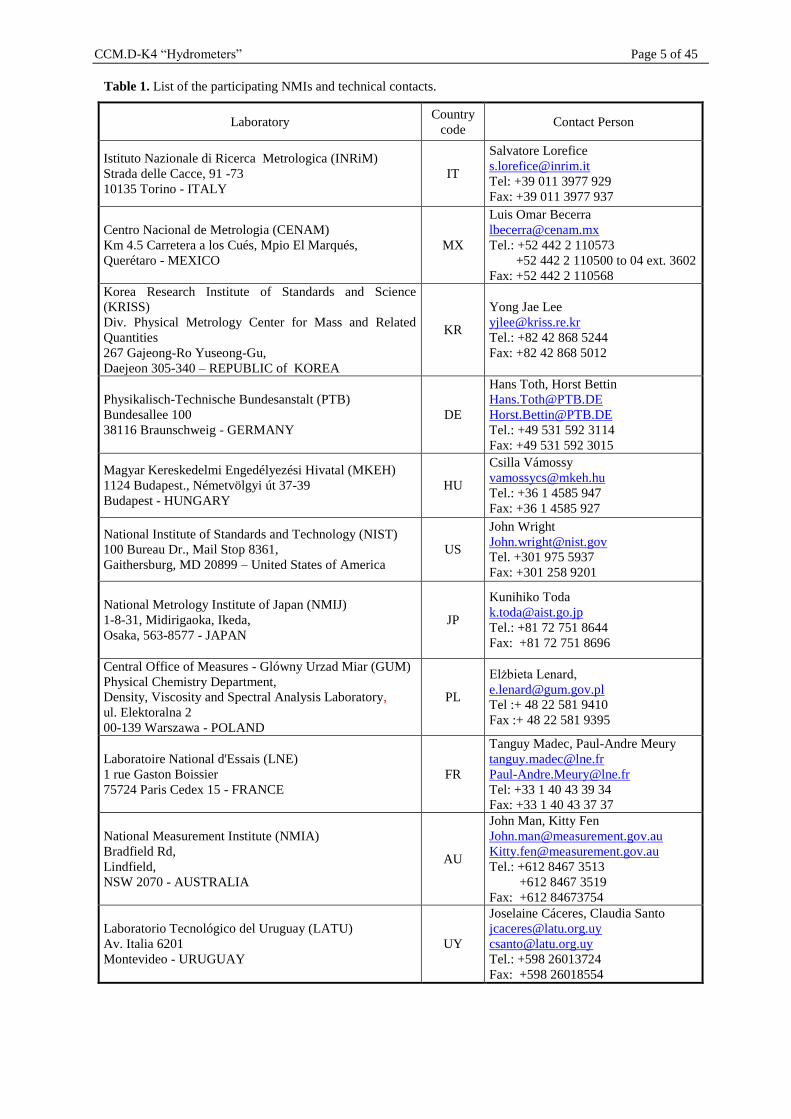
Table 1. List of the participating NMIs and technical contacts.
Laboratory Country
code Contact Person
Istituto Nazionale di Ricerca Metrologica (INRiM)
Strada delle Cacce, 91 -73
10135 Torino - ITALY
IT
Salvatore Lorefice
Tel: +39 011 3977 929
Fax: +39 011 3977 937
Centro Nacional de Metrologia (CENAM)
Km 4.5 Carretera a los Cués, Mpio El Marqués,
Querétaro - MEXICO
MX
Luis Omar Becerra
Tel.: +52 442 2 110573
+52 442 2 110500 to 04 ext. 3602
Fax: +52 442 2 110568
Korea Research Institute of Standards and Science
(KRISS)
Div. Physical Metrology Center for Mass and Related
Quantities
267 Gajeong-Ro Yuseong-Gu,
Daejeon 305-340 – REPUBLIC of KOREA
KR
Yong Jae Lee
Tel.: +82 42 868 5244
Fax: +82 42 868 5012
Physikalisch-Technische Bundesanstalt (PTB)
Bundesallee 100
38116 Braunschweig - GERMANY
DE
Hans Toth, Horst Bettin
Tel.: +49 531 592 3114
Fax: +49 531 592 3015
Magyar Kereskedelmi Engedélyezési Hivatal (MKEH)
1124 Budapest., Németvölgyi út 37-39
Budapest - HUNGARY
HU
Csilla Vámossy
Tel.: +36 1 4585 947
Fax: +36 1 4585 927
National Institute of Standards and Technology (NIST)
100 Bureau Dr., Mail Stop 8361,
Gaithersburg, MD 20899 – United States of America
US
John Wright
Tel. +301 975 5937
Fax: +301 258 9201
National Metrology Institute of Japan (NMIJ)
1-8-31, Midirigaoka, Ikeda,
Osaka, 563-8577 - JAPAN
JP
Kunihiko Toda
Tel.: +81 72 751 8644
Fax: +81 72 751 8696
Central Office of Measures - Glówny Urzad Miar (GUM)
Physical Chemistry Department,
Density, Viscosity and Spectral Analysis Laboratory,
ul. Elektoralna 2
00-139 Warszawa - POLAND
PL
Elżbieta Lenard,
Tel :+ 48 22 581 9410
Fax :+ 48 22 581 9395
Laboratoire National d'Essais (LNE)
1 rue Gaston Boissier
75724 Paris Cedex 15 - FRANCE
FR
Tanguy Madec, Paul-Andre Meury
Tel: +33 1 40 43 39 34
Fax: +33 1 40 43 37 37
National Measurement Institute (NMIA)
Bradfield Rd,
Lindfield,
NSW 2070 - AUSTRALIA
AU
John Man, Kitty Fen
Tel.: +612 8467 3513
+612 8467 3519
Fax: +612 84673754
Laboratorio Tecnológico del Uruguay (LATU)
Av. Italia 6201
Montevideo - URUGUAY
UY
Joselaine Cáceres, Claudia Santo
Tel.: +598 26013724
Fax: +598 26018554
CCM.D-K4 “Hydrometers” Page 6 of 45
2. ORGANIZATION
2.1 Participants and schedule
Ten NMIs, plus the pilot institute, agreed to participate in the comparison ab-initio.
Table 1 comprises the participating NMIs and the technical contacts.
For the purpose of this project, the participating laboratories were divided into two groups
(petal A and petal B) the three laboratories INRiM, CENAM and PTB performed
measurements in both loops. The organization of the comparison was changed in the density
range of 1 000 kg/m3
due to the breakage of one alcoholometer, a bilateral comparison between
INRiM and NMIA was added to the two scheduled petals so that all participants were engaged.
In addition to the unforeseen difficulty relating to the artefact breakage, transportation, customs
and administrative constraints forced changes in the original schedule of the comparison.
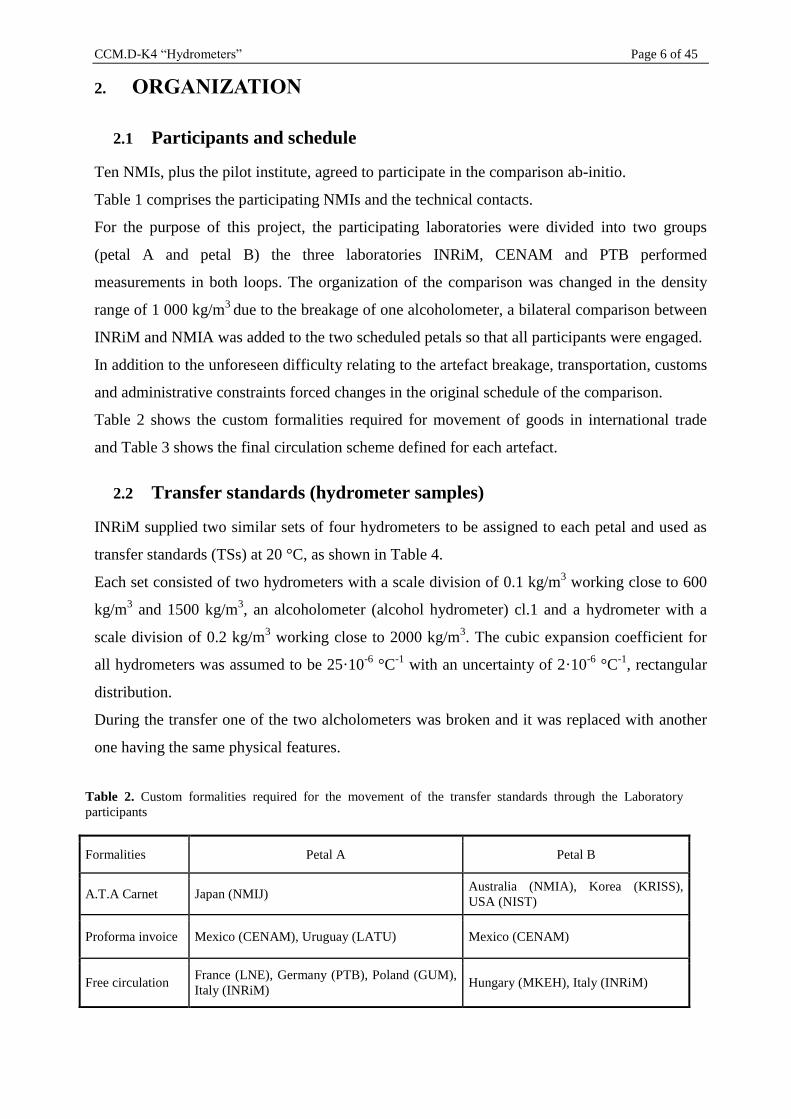
Table 2 shows the custom formalities required for movement of goods in international trade
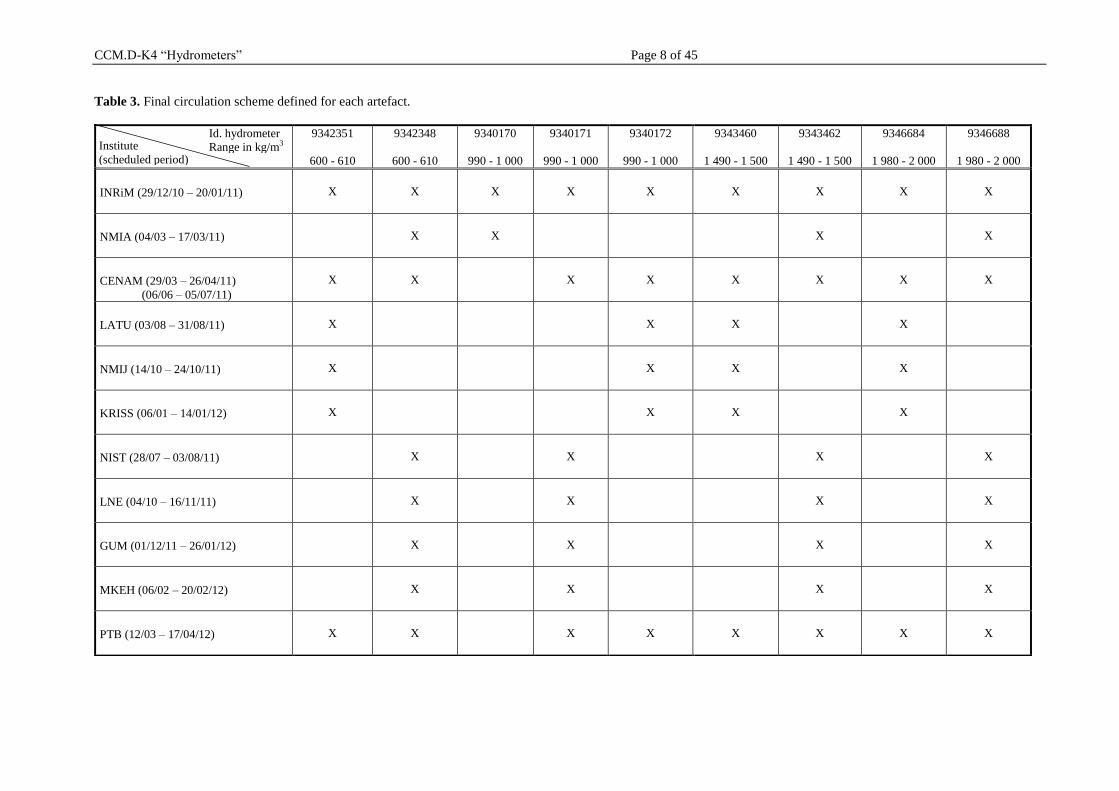
and Table 3 shows the final circulation scheme defined for each artefact.
2.2 Transfer standards (hydrometer samples)
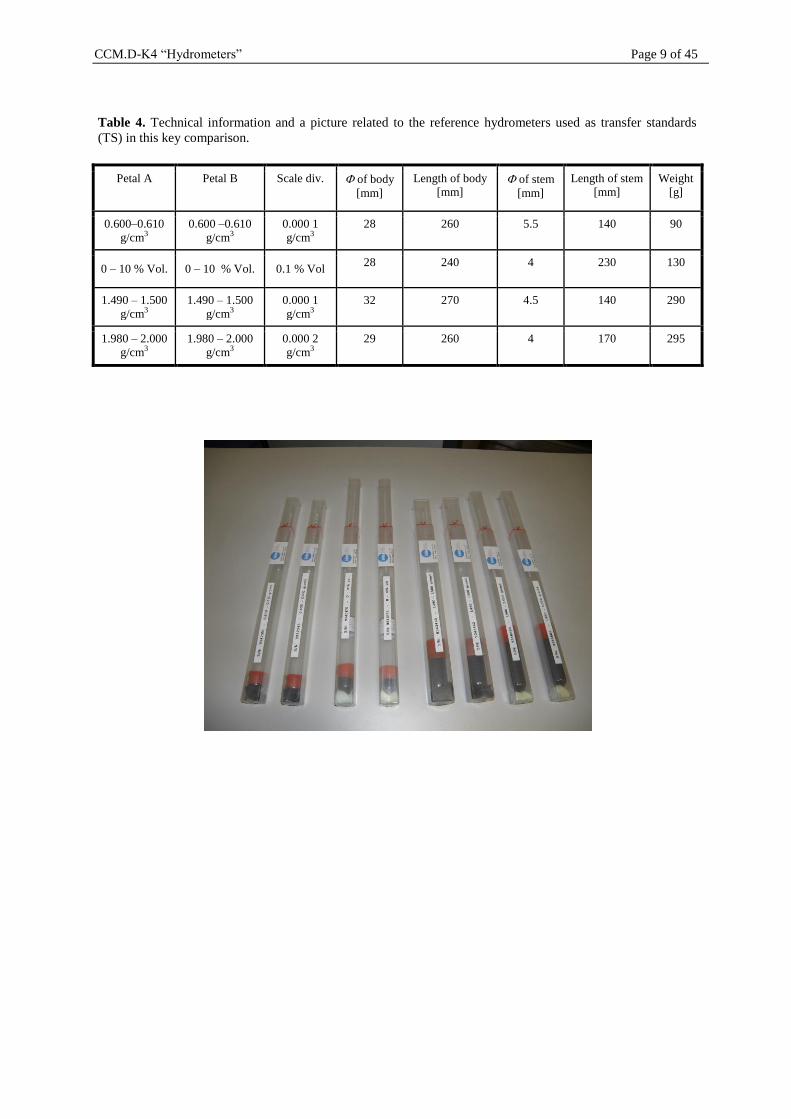
INRiM supplied two similar sets of four hydrometers to be assigned to each petal and used as
transfer standards (TSs) at 20 °C, as shown in Table 4.
Each set consisted of two hydrometers with a scale division of 0.1 kg/m3 working close to 600
kg/m3 and 1500 kg/m
3, an alcoholometer (alcohol hydrometer) cl.1 and a hydrometer with a
scale division of 0.2 kg/m3 working close to 2000 kg/m
3. The cubic expansion coefficient for
all hydrometers was assumed to be 25·10-6
°C-1
with an uncertainty of 2·10-6
°C-1
, rectangular
distribution.
During the transfer one of the two alcholometers was broken and it was replaced with another
one having the same physical features.
Table 2. Custom formalities required for the movement of the transfer standards through the Laboratory
participants
Formalities Petal A Petal B
A.T.A Carnet Japan (NMIJ) Australia (NMIA), Korea (KRISS),
USA (NIST)
Proforma invoice Mexico (CENAM), Uruguay (LATU) Mexico (CENAM)
Free circulation France (LNE), Germany (PTB), Poland (GUM),
Italy (INRiM) Hungary (MKEH), Italy (INRiM)
CCM.D-K4 “Hydrometers” Page 7 of 45
The pilot laboratory did not detect any significant change in calibration on any of the artefacts
after returning from circulation. Although at present these conditions did not allow to determine
the stability of each artifact for a long time, they confirm the stability of the transfer standards
during the comparison.
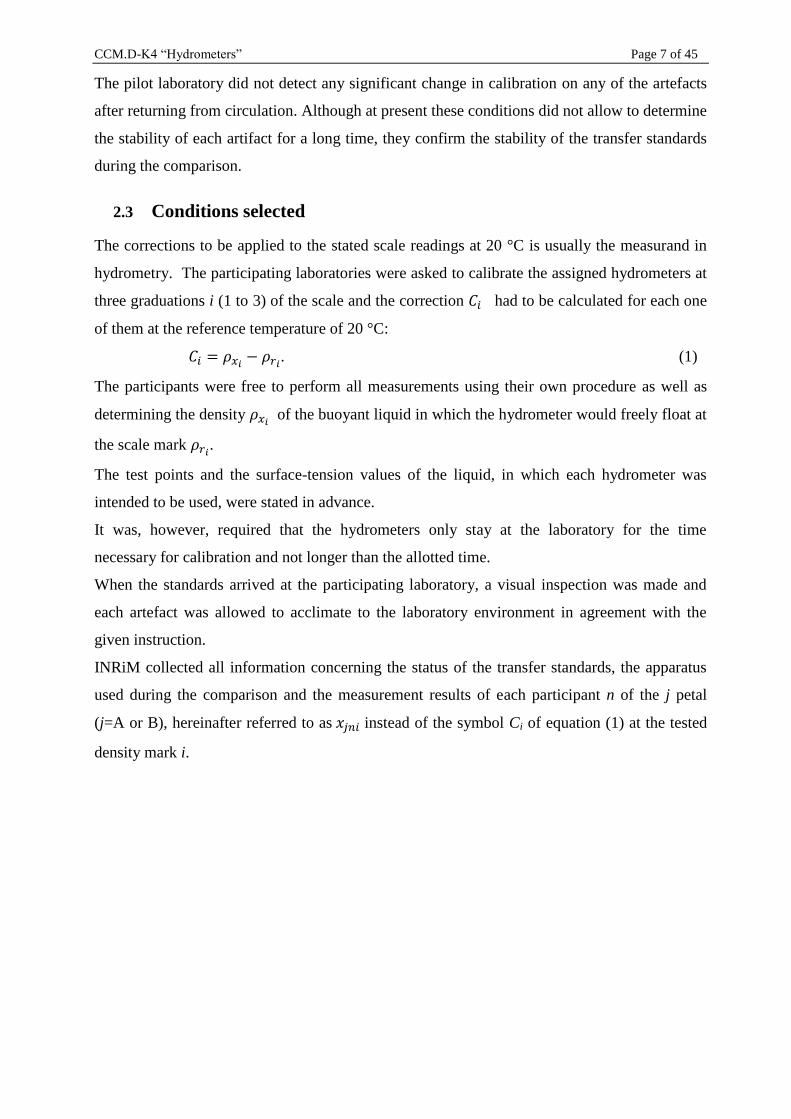
2.3 Conditions selected
The corrections to be applied to the stated scale readings at 20 °C is usually the measurand in
hydrometry. The participating laboratories were asked to calibrate the assigned hydrometers at
three graduations i (1 to 3) of the scale and the correction 𝐶𝑖 had to be calculated for each one
of them at the reference temperature of 20 °C:
𝐶𝑖 = 𝜌𝑥𝑖− 𝜌𝑟𝑖
. (1)
The participants were free to perform all measurements using their own procedure as well as
determining the density 𝜌𝑥𝑖 of the buoyant liquid in which the hydrometer would freely float at
the scale mark 𝜌𝑟𝑖.
The test points and the surface-tension values of the liquid, in which each hydrometer was
intended to be used, were stated in advance.
It was, however, required that the hydrometers only stay at the laboratory for the time
necessary for calibration and not longer than the allotted time.
When the standards arrived at the participating laboratory, a visual inspection was made and
each artefact was allowed to acclimate to the laboratory environment in agreement with the
given instruction.
INRiM collected all information concerning the status of the transfer standards, the apparatus
used during the comparison and the measurement results of each participant n of the j petal
(j=A or B), hereinafter referred to as 𝑥𝑗𝑛𝑖 instead of the symbol Ci of equation (1) at the tested
density mark i.
CCM.D-K4 “Hydrometers” Page 8 of 45
Table 3. Final circulation scheme defined for each artefact.
9342351
600 - 610
9342348
600 - 610
9340170
990 - 1 000
9340171
990 - 1 000
9340172
990 - 1 000
9343460
1 490 - 1 500
9343462
1 490 - 1 500
9346684
1 980 - 2 000
9346688
1 980 - 2 000
INRiM (29/12/10 – 20/01/11)
X X X X X X X X X
NMIA (04/03 – 17/03/11)
X X X X
CENAM (29/03 – 26/04/11)
(06/06 – 05/07/11)
X X X X X X X X
LATU (03/08 – 31/08/11)
X X X X
NMIJ (14/10 – 24/10/11)
X X X X
KRISS (06/01 – 14/01/12)
X X X X
NIST (28/07 – 03/08/11)
X X X X
LNE (04/10 – 16/11/11)
X X X X
GUM (01/12/11 – 26/01/12)
X X X X
MKEH (06/02 – 20/02/12)
X X X X
PTB (12/03 – 17/04/12)
X X X X X X X X
Id. hydrometer
Range in kg/m3 Institute
(scheduled period)
CCM.D-K4 “Hydrometers” Page 9 of 45
Table 4. Technical information and a picture related to the reference hydrometers used as transfer standards
(TS) in this key comparison.
Petal A Petal B Scale div. of body
[mm]
Length of body
[mm] of stem
[mm]
Length of stem
[mm]
Weight
[g]
0.600–0.610
g/cm3
0.600 –0.610
g/cm3
0.000 1
g/cm3
28 260 5.5 140 90
0 – 10 % Vol. 0 – 10 % Vol. 0.1 % Vol 28 240 4 230 130
1.490 – 1.500
g/cm3
1.490 – 1.500
g/cm3
0.000 1
g/cm3
32 270 4.5 140 290
1.980 – 2.000
g/cm3
1.980 – 2.000
g/cm3
0.000 2
g/cm3
29 260 4 170 295
CCM.D-K4 “Hydrometers” Page 10 of 45
2.4 Procedure and method of measurement
Table 5 summarizes the differences in the equipment used at each NMI and in their calibration
procedures.
All participants carried out their task by adopting the hydrostatic weighing in a single liquid,
the density of which was known for the test temperature (Cuckow’s method).
Four laboratories: KRISS, NMIJ, NMIA and LATU used two different balances for weighing
the tested hydrometer in air and immersed in the buoyant liquid, respectively. The weighing
method was the direct reading of the balance for INRiM, MKEH, NIST, NMIJ and LATU
while the laboratories CENAM, KRISS, PTB, GUM, LNE and NMIA used the balance as a
comparator and the substitution weighing by means of calibrated weights was performed to
achieve the balance readings within a narrow electronic range.
Straight chain alkanes such as n-Pentadecane, n-Nonane, n-Tridecane and n-Tetradecane were
used by the different laboratories as buoyant liquids. Each participant measured the density of
the used liquid by hydrostatic weighing, oscillating-type density meter, and sensitive standard
hydrometers. However each laboratory monitored the stability of the density of the buoyant
liquid at least before and after the hydrometer calibration by using the same instruments and
standards used to determine the density of the buoyant liquid.
The majority of participants measured the surface tension of the buoyant liquid by commercial
available tensiometers by applying different measuring methods, CENAM used the stem
measurement with the hydrostatic weighing and the MKEH knew the values of interest from
reference data.
The mean of the parameters contributing to the air-density calculation were recorded during
calibration, i. e. pressure, temperature, relative humidity (or dew point). With the exception of
KRISS, all laboratories assumed a constant value of 0.04% for the CO2 content. The mean of
the air-density values was calculated by the CIPM formula (CIPM2007) [2] and reported.
Accurate calipers or suitable instruments with a resolution between 0.01 and 0.1 mm were used
to measure the diameter of the stem of the hydrometer to be calibrated. PTB used an automatic
measuring device by means of which the separation between graduation mark and the stem
diameter throughout the whole scale of each hydrometer to be calibrated were measured.
In general, the alignment of the liquid horizontal plane with the selected scale-mark is
identified by CCD camera servo-assisted with a desktop computer or by monitor, a few
laboratories used a magnifier. The alignment principles by CCD camera were independently
based on [3, 4, 5] although technical modifications were made by the users.
CCM.D-K4 “Hydrometers” Page 11 of 45
Table 5. Summary of the experimental facilities operated at the different NMIs.
Institute
Balance
Max capacity [g]/readability [g] Buoyant
liquid
Thermostat type,
capacity
Thermometer for
liquid temperature Alignment
Surface tension
method Weighing in air
Hydrostatic
weighing
INRiM 505 / 0.000 01 n-Nonane Double-walled glass
vessel, 30 litre Pt100 Ohm, ASL F17
CCD camera
PC aided Plate
CENAM* 405 / 0.000 1 n-Pentadecane Tamson TV7000, 70 litre Pt100 Ohm, ASL F250 CCD camera
PC aided
Stem method,
hydrostatic weighing
KRISS* 405 / 0.000 1 230 / 0.000 01 n-Tridecane Lauda RP1840, 21 litre Pt100 Ohm, ASL F300 CCD camera
PC aided Ring
PTB* 1 109 / 0.000 01 n-Tridecane Tamson TVBX 70, 70 litre
SPRT 25 Ohm, PAAR
MKT25
CCD camera
PC aided Plate
MKEH 1 000 / 0.000 1 n-Nonane Tamson TMV70, 70 litre Pt100 Ohm, Hart Sci
Black Stack 1560
Magnifier
hand-operated Reference data
NIST 205 / 0.000 01 n-Tridecane Hart 7011, 20 litre YSI Thermistor,
Keithley 195A
laser sheet + laser power
meter
Du Noüy &
Wilhelmy ring
NMIJ 520 / 0.000 1 520 / 0.000 1 n-Tridecane Double-walled PVC and
aluminium vessel, 30 litre Pt100 Ohm, ASL F200
Magnifier
hand-operated Plate
GUM* 1 109 / 0.000 01 n-Nonane Tamson TV7000, 70 litre 25 Ohm PRT, ASL
F700B
Magnifier electronically
controlled support Ring
LNE* 405 / 0.000 1 n-Tetradecane Tamson TV7000, 70 litre Pt100 Ohm,
HP34420A
Magnifier
hand-operated
Du Noüy &
Wilhelmy ring
NMIA* 1 000 / 0.000 1
160 / 0.000 01 205 / 0.000 01 n-Nonane Colora NB33498, 25 litre
Pt100 Ohm,
Hewlett Packard
CCD camera
hand-operated Ring
LATU 1200 / 0.001 204 / 0.000 1 n-Tridecane Tamson TV7000, 70 litre Pt100 Ohm Magnifier
hand-operated Ring
* Weighing procedure: By substitution method
CCM.D-K4 “Hydrometers” Page 12 of 45
Mechanical devices were used for sinking the tested hydrometer or additionally, sinkers
adjustable in height were used in order that the liquid level corresponds to the scale mark
concerned.
2.4.1 Uncertainty claims of NMIs
In addition to the uncertainty contributions proposed in the worksheet by the coordinating
laboratories [1], several laboratories have included the contribution due to standard deviation of
the mean of corrections or reproducibility of measurements. Moreover PTB also took into
account the contribution due to the influence of the temperature distribution in the bath, NMIJ
the contributions due to the weighing value of suspension and the density of used weights and
NIST considered tridecane density changing, surface tension, and positioning the liquid surface
at the mark to be calibrated (contribution due to the contact angle of the buoyant liquid on the
hydrometer stem).
3. RESULTS
After the participating laboratory completed its own measurements, all information concerning
the calibration was submitted to the pilot laboratory using the sheets Report Form 1 and Report
Form 2 annexed to [1].
3.1 Data received from participants
The INRiM collected and analysed anything related to:
a) Details of the instrumentation used by each participant in the project, including the
origin of their traceability to the SI.
b) Details of the relevant information on the measurements and parameters used for the
comparison such as local gravity, mass measurements, density of working fluid and,
finally, the ambient conditions including data on air density, air temperature, air
pressure, humidity and CO2 content.
c) Calculated values of the three corrections for each transfer standard at the specified
reading marks and surface tension values.
d) Uncertainty budget of the twelve calculated corrections, which were estimated and
combined following GUM [6] under the responsibility of each participating institute.
Each laboratory also reported the uncertainty of all measured quantities as well as the
effective degrees of freedom eff of the combined standard uncertainty uc, the t-factor
CCM.D-K4 “Hydrometers” Page 13 of 45
t95(eff) taken from the t-distribution for a 95% confidence level and the expanded
uncertainty for the corrections as U95 = t95(eff) · uc .
e) Analysis of reported data, INRiM elaborated all laboratory data as soon as they were
available. Some participants were also invited to check for results that appeared to be
anomalous before the Draft A was sent to them in agreement with the
CIPM MRA-D-05, March 2014 [7].
3.2 Communication from the participating laboratories
The alcoholometer S/N 9340170 broke during the circulation and as a result, it was decided that
the calibration results obtained by NMIA and INRiM would be presented as a bilateral
comparison.
LATU detected some problems with their apparatus during the calibration of the three
hydrometers in the range from 1 000 kg/m3 to 2 000 kg/m
3; the expected results of the transfer
standards identified with the Serial Numbers 9340172, 9343460 and 9346684 were not
submitted.
After the first issue of the draft A circulated among the participants, the MKEH and the NIST
submitted new results.
Before the issue of the draft A the MKEH staff suspected that the building reconstruction in the
laboratory during the comparison measurements could have affected its results. The MKEH
was able to detect the possible cause after the conclusion of the draft. The influence of
temperature changing in the room during the immersion was the main problem. A density
correction because of the temperature influence has been made.
NIST made a mistake about the units used for the uncertainties, as reported in in the data report
(Form2). NIST thought the units were parts per million when they were actually g/cm3·10
-6. In
addition the laboratory suspected that density changes of the buoyant liquid over time due to
evaporation of less dense impurities affected the own measurements and gave communication
to pilot laboratory that:
“NIST results show differences between 39 x 10-6
g/cm3 and 77 x 10
-6 g/cm
3 from the KCRVs.
Note that the currently approved NIST CMC uncertainty is 100 ppm, but smaller, customized
uncertainty values were used for this KC. SIM.M.D-K4 2007 – 2008 covered density range
601 kg/m3 to 1 300 kg/m
3 and NIST’s degrees of equivalence with the reference values ranged
from -15 ppm to 30 ppm. Moreover, NIST suspects that density changes of their tridecane over
time due to evaporation of less dense impurities is the source of the larger degrees of
equivalence in this comparison.”
CCM.D-K4 “Hydrometers” Page 14 of 45
Therefore NIST wrote that ”NIST will:
employ a higher resolution check standard to better reveal changes in their Cuckow’s
apparatus. (Presently, a check standard is used before each batch of customer
calibrations and the results must agree with prior results within 100 parts in 106, the
NIST CMC uncertainty).
measure the properties of the tridecane more frequently to track changes due to
evaporation.
not seek a lower CMC than our current value of 100 ppm until future comparisons
support such reductions.”
3.3 Interpretation of the comparison: the degree of equivalence DoE
According to the CIPM MRA, the degree of equivalence (DoE) must be established for each
comparison, which can provide traceability for a calibration measurement capability announced
in the Key Comparison Data Base, KCDB, Appendix C, by the laboratory.
DoE must be calculated as the deviation of the value reported by the laboratory from the key
comparison reference value evaluated in the framework of an internationally accepted key
comparison.
Twelve Key Comparison Reference Values (i=1 to 12) have been obtained at the tested density
mark of the four transfer standards for each petal by the results of participants in the range
600 kg/m3 to 2000 kg/m
3. To quantify the discrepancies, tests of equivalence of the
measurements are based on a recommended method used for key comparisons [8].
The results from each of the n laboratories of the j petal (j=A or B) have then been
characterized in terms of a ‘degree of equivalence’ representing the deviation 𝐷𝑗𝑛𝑖 of its result
𝑥𝑗𝑛𝑖 from the estimated Key Comparison Reference Value (𝐾𝐶𝑅𝑉𝑗𝑖) at the tested density mark i
as
𝐷𝑗𝑛𝑖 = 𝑥𝑗𝑛𝑖 − 𝐾𝐶𝑅𝑉𝑗𝑖 (2)
with the associated uncertainty
𝑢(𝐷𝑗𝑛𝑖) = (𝑢2(𝑥𝑗𝑛𝑖) + 𝑢2(𝐾𝐶𝑅𝑉𝑗𝑖) − 2𝑢(𝑥𝑗𝑛𝑖 , 𝐾𝐶𝑅𝑉𝑗𝑖))
1
2. (3)
In equation (3), the 𝑢(𝐾𝐶𝑅𝑉𝑗𝑖) is interpreted as an estimate of the reference value uncertainty
made on the basis of the measurements provided by the participating institutes, and
𝑢(𝑥𝑗𝑛𝑖 , 𝐾𝐶𝑅𝑉𝑗𝑖) is the possible covariance term between the laboratory results and the
reference value.
CCM.D-K4 “Hydrometers” Page 15 of 45
The Reference value firstly was determined by weighted mean of the institutes’ measurements
(Procedure A), using the inverses of the squares of the associated standard uncertainties as the
weights:
1
22
1
n
jnin
jni
jni
jixuxu
xKCRV . (4)
The individual result xjni of each of the n laboratory results was considered consistent with the
“Reference value” at the 95 % of the level of significance if
|𝐷𝑗𝑛𝑖| ≤ 2𝑢(𝐷𝑗𝑛𝑖) . (5)
Such a reference value, however, is not applicable if some of the institutes’ measurements
appear to be anomalous or discrepant.
To identify the overall consistency of the claimed results, a chi-squared test was then applied
considering the consistency check as failing if
(6)
where Pr denotes “probability of”, 1 n is the number of degrees of freedom and
n
refnref
xu
xx
xu
xxobs 2
2
1
2
2
12
is the observed chi-squared value.
If the test was not satisfied, the 𝐾𝐶𝑅𝑉𝑗𝑖 is the median value amongst the submitted
measurement results (Procedure B).
By means of a Monte Carlo simulation, 100 000 random samples were generated, each made of
N values drawn from the distributions representing the results from each laboratory (N, here, is
the number of the laboratories of the relevant petal). In this way, 100 000 values for the median
of the drawn samples were obtained. The mean of such values was taken as the 𝐾𝐶𝑅𝑉𝑗𝑖 of the
single tested mark i. Also the corresponding simulated deviation terms of the degrees of
equivalence were obtained for each laboratory and used to determine a 95% coverage interval
for the laboratories’ deviations from the 𝐾𝐶𝑅𝑉𝑗𝑖.
3.4 Key Comparison Reference Values (KCRVs) and degrees of equivalence
The current results of the key comparison corresponding to the involved A and B “j” petals are
reported in the Appendix A1 relating to each tested hydrometer.
The measurement results with the corresponding uncertainties claimed by the participants are
listed in the odd table “A” or “B” which also provides the KCRVs with their own extended
uncertainty, the lower and upper limits of the coverage interval if procedure B was applied and
the 𝜒𝑜𝑏𝑠2 value at each tested mark. The even table “A” or “B” for the same artefact shows at
05.0Pr 22 obs
CCM.D-K4 “Hydrometers” Page 16 of 45
each tested mark of each “n” laboratory of the petal the degree of equivalence to the KCRV
with the coverage interval. Moreover the table reports the arithmetic mean of the three degree
of equivalence corresponding to the “k” tested hydrometer ∆𝑗𝑛𝑘=∑ 𝐷𝑗𝑛𝑖𝑖
3 with its estimated
standard uncertainty 𝑢∆𝑗𝑛𝑘= (𝑢𝐷𝑗𝑛𝑖
2 +(𝐷𝑗𝑛𝑖𝑚𝑎𝑥−𝐷𝑗𝑛𝑖𝑚𝑖𝑛)
2
12)
1
2
. Corresponding to the same tested
artefact, the figure also shows the degree of equivalence with respect to the KCRV of each
participant of the relevant petal related to each calibrated mark and their arithmetic mean with
their own expanded uncertainties.
The average of the three degrees of equivalence to the KCRVs, ∆𝑗𝑛𝑘 and the corresponding
estimated standard uncertainties are a good indicator of the ability of the laboratory n in the
calibration of hydrometers, because it shows the laboratory repeatability. The estimated
standard uncertainty 𝑢∆𝑗𝑛𝑘 takes into account the associated uncertainty of the individual
degree of equivalence 𝑢𝐷𝑗𝑛𝑖 calculated by (3), and the reproducibility in the calibration of the
laboratory by assuming a rectangular distribution from the dispersion of the individual degrees
of equivalence with respect to the three KCRVs for each transfer standard.
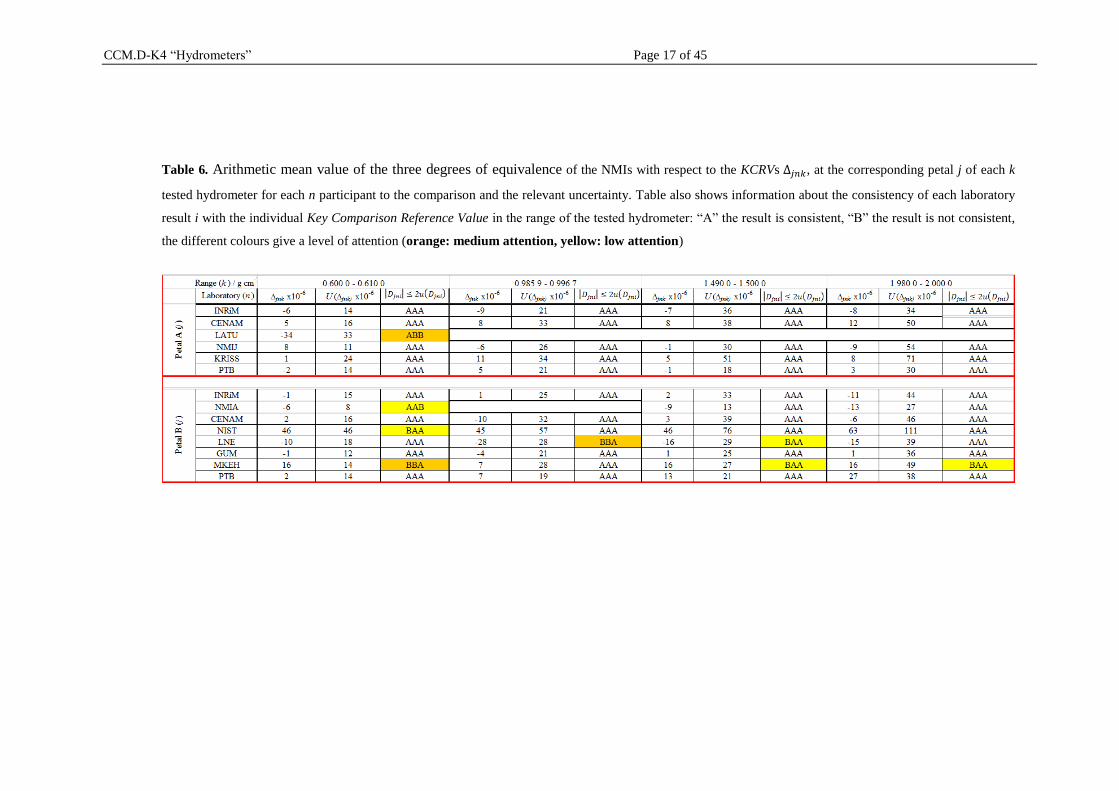
Table 6 shows the ∆𝑗𝑛𝑘 at the corresponding petal j of each k tested hydrometer for each n
participant to the comparison, its uncertainty, and finally information about the consistency of
each claimed result from the laboratory, according to equation (5): “A” the result is consistent,
“B” the result is not consistent.
In general it was observed that:
Petal A shows that all data are rather close to the weighted mean values. The
experimentally observed 2
obs values are always lower than 11.07 with 5 degrees of
freedom and 9.47 with 4 degrees of freedom. The LATU results were not considered in
the KCRV calculations with the exception in the range 0.600 g/cm3 and 0.610 g/cm
3.
Petal B shows that some laboratories exhibit a largest deviation related to the reference
values. In such inconsistent case, the mean of medians was taken as the 𝐾𝐶𝑅𝑉𝑗𝑖 . In
particular that was due to the results of NIST and MKEH at 0.601 g/cm3, LNE at
0.985 g/cm3 and 0.991 g/cm
3, and again MKEH at 1.981 g/cm
3. The NMIA results were
not considered in the reference value calculations in the range 0.985 g/cm3 and 0.998
g/cm3.
CCM.D-K4 “Hydrometers” Page 17 of 45
Table 6. Arithmetic mean value of the three degrees of equivalence of the NMIs with respect to the KCRVs ∆𝑗𝑛𝑘, at the corresponding petal j of each k
tested hydrometer for each n participant to the comparison and the relevant uncertainty. Table also shows information about the consistency of each laboratory
result i with the individual Key Comparison Reference Value in the range of the tested hydrometer: “A” the result is consistent, “B” the result is not consistent,
the different colours give a level of attention (orange: medium attention, yellow: low attention)
CCM.D-K4 “Hydrometers” Page 18 of 45
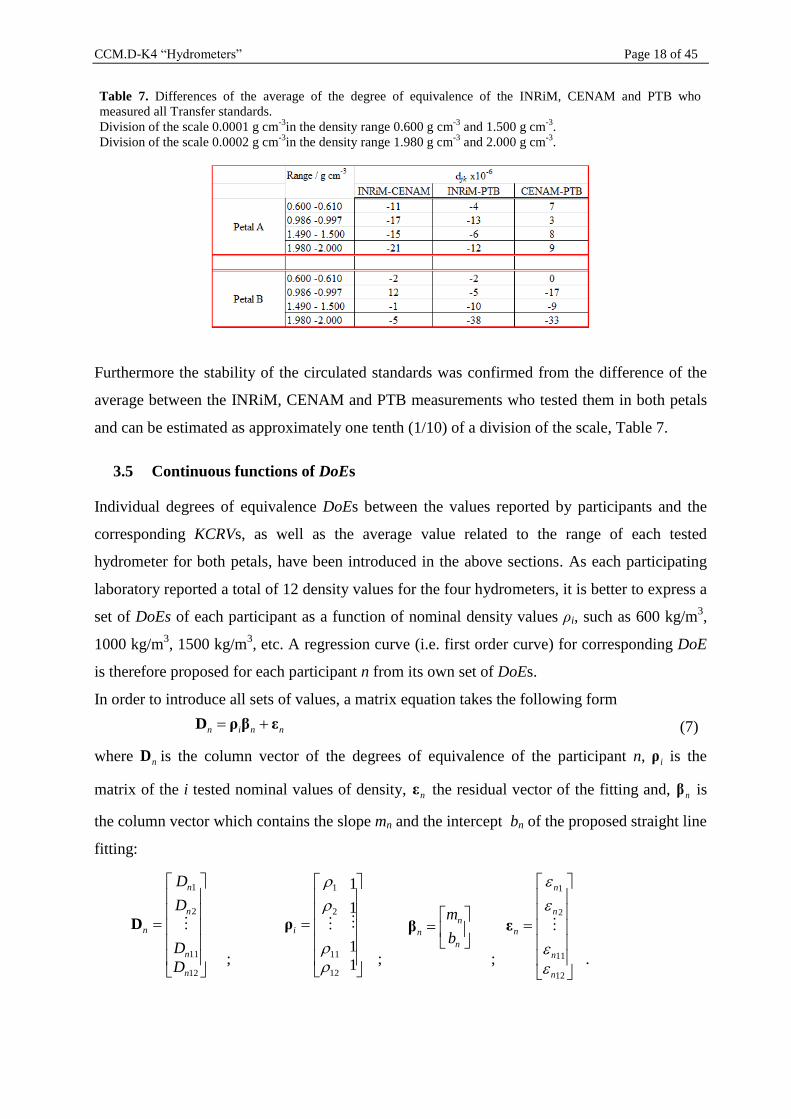
Furthermore the stability of the circulated standards was confirmed from the difference of the
average between the INRiM, CENAM and PTB measurements who tested them in both petals
and can be estimated as approximately one tenth (1/10) of a division of the scale, Table 7.
3.5 Continuous functions of DoEs
Individual degrees of equivalence DoEs between the values reported by participants and the
corresponding KCRVs, as well as the average value related to the range of each tested
hydrometer for both petals, have been introduced in the above sections. As each participating
laboratory reported a total of 12 density values for the four hydrometers, it is better to express a
set of DoEs of each participant as a function of nominal density values ρi, such as 600 kg/m3,
1000 kg/m3, 1500 kg/m
3, etc. A regression curve (i.e. first order curve) for corresponding DoE
is therefore proposed for each participant n from its own set of DoEs.
In order to introduce all sets of values, a matrix equation takes the following form
(7)
where nD is the column vector of the degrees of equivalence of the participant n, iρ is the
matrix of the i tested nominal values of density, nε the residual vector of the fitting and, nβ is
the column vector which contains the slope mn and the intercept bn of the proposed straight line
fitting:
; ; ; .
nnin εβρD
12
11
2
1
n
n
n
n
n
D
D
D
D
D
1
1
1
1
12
11
2
1
iρ
n
n
nb
mβ
12
11
2
1
n
n
n
n
n
ε
Table 7. Differences of the average of the degree of equivalence of the INRiM, CENAM and PTB who
measured all Transfer standards.
Division of the scale 0.0001 g cm-3
in the density range 0.600 g cm-3
and 1.500 g cm-3
.
Division of the scale 0.0002 g cm-3
in the density range 1.980 g cm-3
and 2.000 g cm-3
.
CCM.D-K4 “Hydrometers” Page 19 of 45
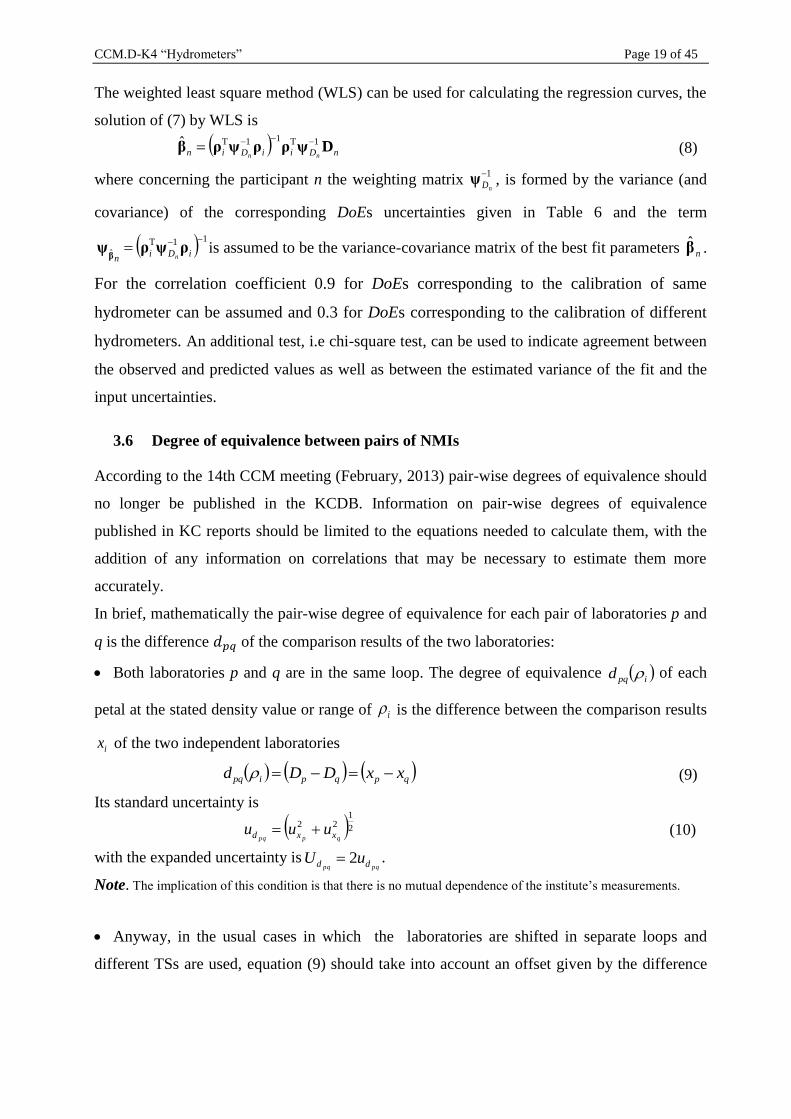
The weighted least square method (WLS) can be used for calculating the regression curves, the
solution of (7) by WLS is
(8)
where concerning the participant n the weighting matrix 1
nDψ , is formed by the variance (and
covariance) of the corresponding DoEs uncertainties given in Table 6 and the term
11Tˆ
iDin n
ρψρψβ
is assumed to be the variance-covariance matrix of the best fit parameters nβ̂ .
For the correlation coefficient 0.9 for DoEs corresponding to the calibration of same
hydrometer can be assumed and 0.3 for DoEs corresponding to the calibration of different
hydrometers. An additional test, i.e chi-square test, can be used to indicate agreement between
the observed and predicted values as well as between the estimated variance of the fit and the
input uncertainties.
3.6 Degree of equivalence between pairs of NMIs
According to the 14th CCM meeting (February, 2013) pair-wise degrees of equivalence should
no longer be published in the KCDB. Information on pair-wise degrees of equivalence
published in KC reports should be limited to the equations needed to calculate them, with the
addition of any information on correlations that may be necessary to estimate them more
accurately.
In brief, mathematically the pair-wise degree of equivalence for each pair of laboratories p and
q is the difference 𝑑𝑝𝑞 of the comparison results of the two laboratories:
Both laboratories p and q are in the same loop. The degree of equivalence ipqd of each
petal at the stated density value or range of i is the difference between the comparison results
ix of the two independent laboratories
(9)
Its standard uncertainty is
(10)
with the expanded uncertainty is .
Note. The implication of this condition is that there is no mutual dependence of the institute’s measurements.
Anyway, in the usual cases in which the laboratories are shifted in separate loops and
different TSs are used, equation (9) should take into account an offset given by the difference
nDiiDin nnDψρρψρβ
1T11Tˆ
qpqpipq xxDDd
21
22
qppq xxd uuu
pqpq dd uU 2
CCM.D-K4 “Hydrometers” Page 20 of 45
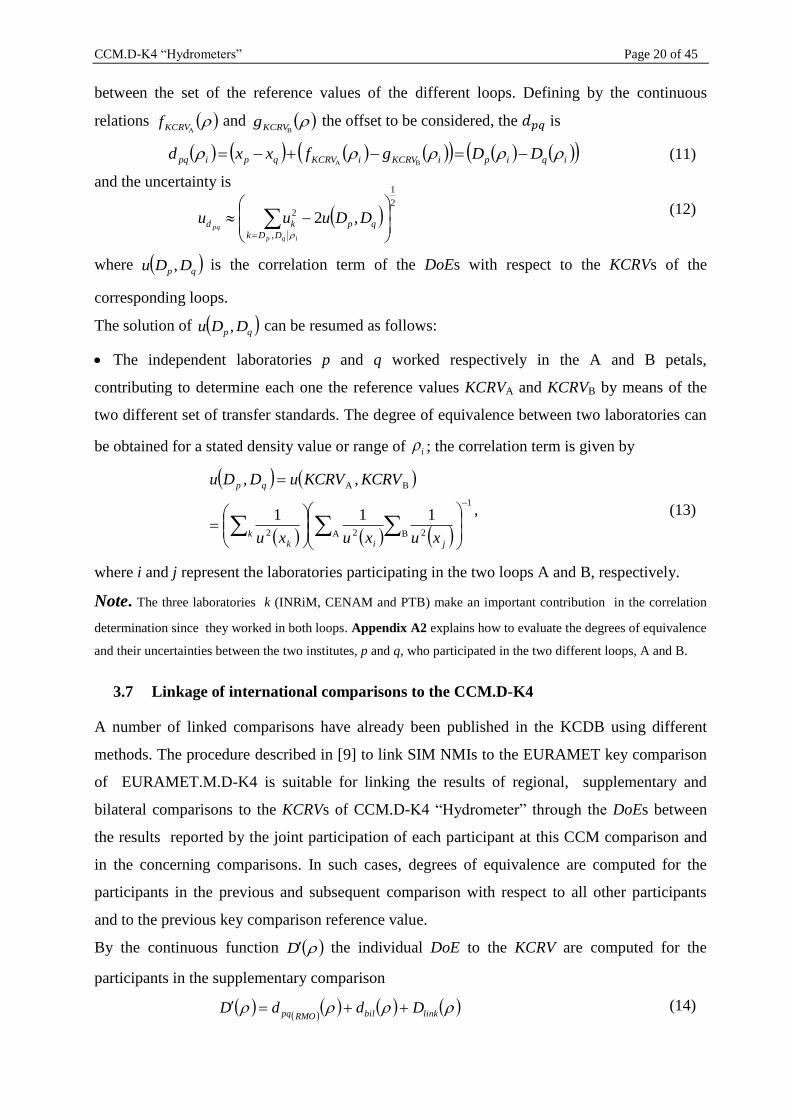
between the set of the reference values of the different loops. Defining by the continuous
relations AKCRVf and
BKCRVg the offset to be considered, the 𝑑𝑝𝑞 is
(11)
and the uncertainty is
(12)
where qp DDu , is the correlation term of the DoEs with respect to the KCRVs of the
corresponding loops.
The solution of qp DDu , can be resumed as follows:
The independent laboratories p and q worked respectively in the A and B petals,
contributing to determine each one the reference values KCRVA and KCRVB by means of the
two different set of transfer standards. The degree of equivalence between two laboratories can
be obtained for a stated density value or range of i ; the correlation term is given by
1
B 2A 22
BA
111
,,
ji
kk
qp
xuxuxu
KCRVKCRVuDDu
, (13)
where i and j represent the laboratories participating in the two loops A and B, respectively.
Note. The three laboratories k (INRiM, CENAM and PTB) make an important contribution in the correlation
determination since they worked in both loops. Appendix A2 explains how to evaluate the degrees of equivalence
and their uncertainties between the two institutes, p and q, who participated in the two different loops, A and B.
3.7 Linkage of international comparisons to the CCM.D-K4
A number of linked comparisons have already been published in the KCDB using different
methods. The procedure described in [9] to link SIM NMIs to the EURAMET key comparison
of EURAMET.M.D-K4 is suitable for linking the results of regional, supplementary and
bilateral comparisons to the KCRVs of CCM.D-K4 “Hydrometer” through the DoEs between
the results reported by the joint participation of each participant at this CCM comparison and
in the concerning comparisons. In such cases, degrees of equivalence are computed for the
participants in the previous and subsequent comparison with respect to all other participants
and to the previous key comparison reference value.
By the continuous function D the individual DoE to the KCRV are computed for the
participants in the supplementary comparison
(14)
iqipiKCRViKCRVqpipq DDgfxxd BA
2
1
,
2 ,2
qp
DDk
kd DDuuuiqp
pq
linkbilRMOpq DddD
CCM.D-K4 “Hydrometers” Page 21 of 45
where
linkD is the continuous function concerning the DoEs between results reported by the
linking laboratory (laboratories) with respect to the KCRVs in the CCM.D-K4;
RMOpqd is the continuous function concerning the degree of equivalence between
pairs of NMI laboratories, in the Regional comparison;
bild is the continuous function concerning the difference between the result
measurement of the two laboratories, the linking laboratory and the laboratory that took
part in the Regional and/or supplementary comparison.
In order to calculate the uncertainty of equation (14), numerical simulations by the Monte Carlo
method can be performed for each estimated value of D [10].
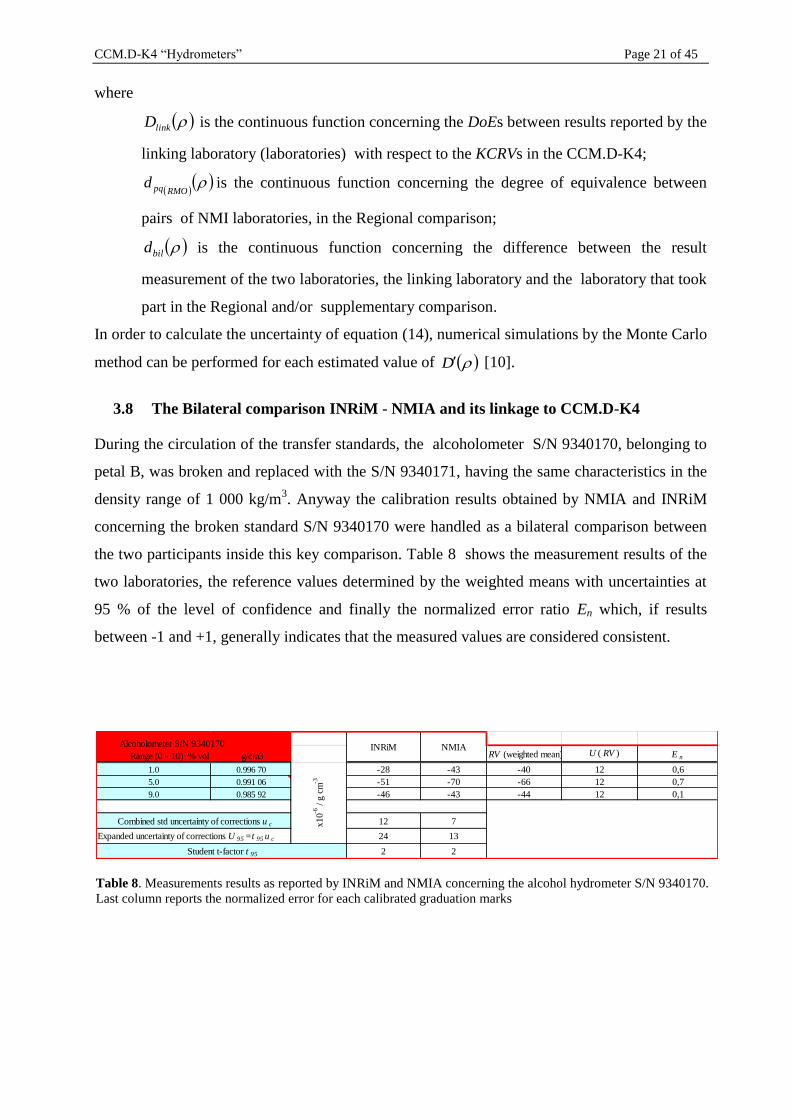
3.8 The Bilateral comparison INRiM - NMIA and its linkage to CCM.D-K4
During the circulation of the transfer standards, the alcoholometer S/N 9340170, belonging to
petal B, was broken and replaced with the S/N 9340171, having the same characteristics in the
density range of 1 000 kg/m3. Anyway the calibration results obtained by NMIA and INRiM
concerning the broken standard S/N 9340170 were handled as a bilateral comparison between
the two participants inside this key comparison. Table 8 shows the measurement results of the
two laboratories, the reference values determined by the weighted means with uncertainties at
95 % of the level of confidence and finally the normalized error ratio En which, if results
between -1 and +1, generally indicates that the measured values are considered consistent.
Table 8. Measurements results as reported by INRiM and NMIA concerning the alcohol hydrometer S/N 9340170.
Last column reports the normalized error for each calibrated graduation marks
RV (weighted mean) U ( RV ) E n
1.0 0.996 70 -28 -43 -40 12 0,6
5.0 0.991 06 -51 -70 -66 12 0,7
9.0 0.985 92 -46 -43 -44 12 0,1
12 7
24 13
2 2
INRiM Alcoholometer S/N 9340170
Range (0 - 10) % vol g/cm3
Combined std uncertainty of corrections u c
Expanded uncertainty of corrections U 95 =t 95 u c
Student t-factor t 95
NMIA
x10-6
/ g
cm
-3
CCM.D-K4 “Hydrometers” Page 22 of 45
In order to link the NMIA results to KCRV values of the CCM.D-K4 “Hydrometer” for each
result at the three tested marks in the range of 1 000 kg/m3, equation (14) is re-written as
(15)
where
INRiMNMIAbil xxd is the difference of the measurands as reported by
INRiM and NMIA at each tested mark in the bilateral comparison;
INRiMD is the individual DoE of INRiM with respect to the KCRV concerning the
CCM.D-K4 at the density related to tested mark.
The variance of each DoE of NMIA at the density related to the tested mark result
(16)
where the term of correlation is assumed to be
INRiMbilNMIA DdD
INRiMINRiMDd DxuuuuINRiMbilNMIAD
,2222
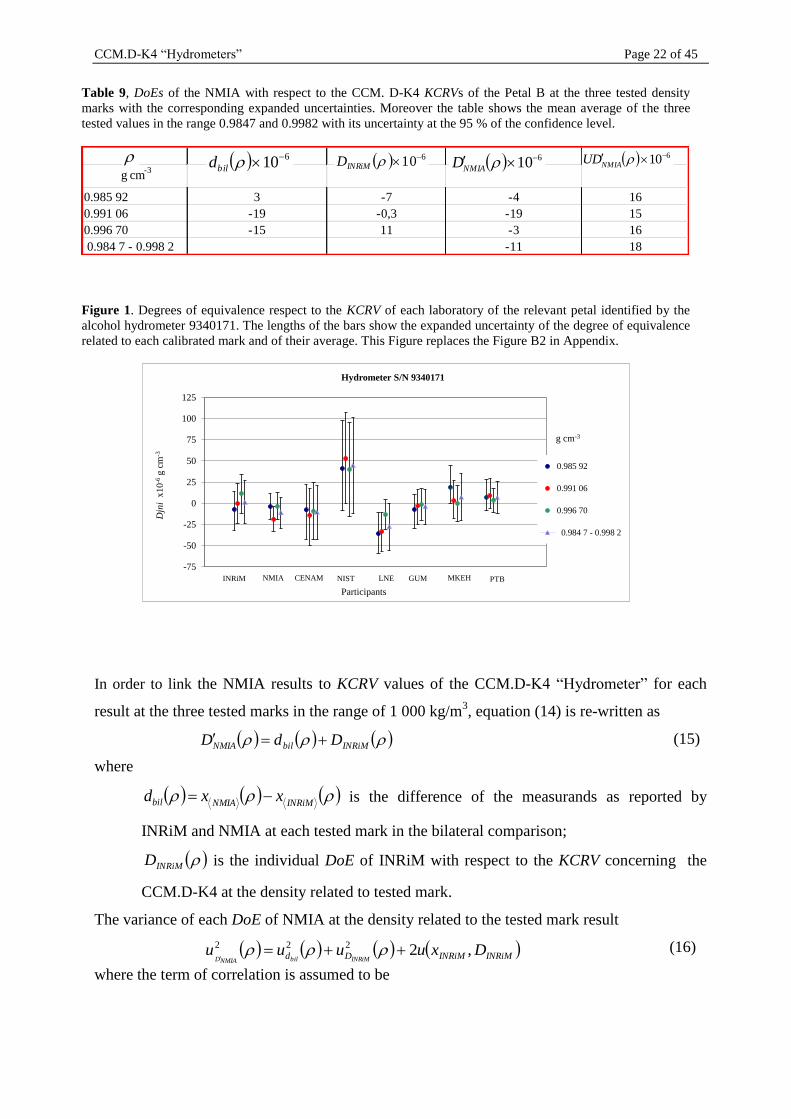
Table 9, DoEs of the NMIA with respect to the CCM. D-K4 KCRVs of the Petal B at the three tested density
marks with the corresponding expanded uncertainties. Moreover the table shows the mean average of the three
tested values in the range 0.9847 and 0.9982 with its uncertainty at the 95 % of the confidence level.
Figure 1. Degrees of equivalence respect to the KCRV of each laboratory of the relevant petal identified by the
alcohol hydrometer 9340171. The lengths of the bars show the expanded uncertainty of the degree of equivalence
related to each calibrated mark and of their average. This Figure replaces the Figure B2 in Appendix.
g cm-3
0.985 92 3 -7 -4 16
0.991 06 -19 -0,3 -19 15
0.996 70 -15 11 -3 16
0.984 7 - 0.998 2 -11 18
610 NMIAD 610INRiMD 610
bild 610
NMIADU
-75
-50
-25
0
25
50
75
100
125
0 2 4 6 8
Djn
ix
10
-6g c
m-3
Participants
Hydrometer S/N 9340171
0.985 92
0.991 06
0.996 70
0.984 7 - 0.998 2
g cm-3
INRiM NMIA CENAM NIST LNE GUM MKEH PTB
CCM.D-K4 “Hydrometers” Page 23 of 45
2
1
2
2 9.01
,,,
INRiM
INRiMINRiM
xjj
INRiM
BDDINRiMINRiMINRiM
uxu
xu
KCRVxuxxuDxu
(17)
where jxu is the uncertainty claimed by each participant belonging to petal B.
The linkage results concerning the NMIA with respect to the KCRV values of the CCM.D-K4
“Hydrometer” in the range 1 000 kg/m3, as they were calculated by equations (15) and (16) are
shown in Table 9. The Table also shows the average of the three NMIA DoE values and the
uncertainty at the 95 % level of significance, value which takes into account the repeatability of
the calibration results on the three tested marks.
Figure 1 replaces the Figure B2 in Appendix. It shows the degree of equivalence with respect to
the KCRVs of the concerned NMIs including the determined values of NMIA.
4. DISCUSSION and CONCLUSION
The Key comparison CCM.D-K4 “Hydrometer”, which covered the density range 600 kg/m3 to
2000 kg/m3 at 20 °C, comes after various comparisons in “Hydrometry” performed since the
90s by regional metrology organizations. So, the main purpose of it was not only to evaluate
the degree of equivalence between NMI participants in the calibration of hydrometers of high
accuracy, but also to establish a base to link, were it is possible, the results of previous
comparisons to the Key Comparison Reference Values (KCRVs) of CCM.D-K4.
In order to reach such objectives, two similar sets of three high-accuracy hydrometers for liquid
density determinations and an alcoholometer were circulated to the NMI participants as a
travelling standard in the time interval from January 2011 to April 2012.
The eleven participating NMIs were divided into two groups which to form two loops (petals).
The three density laboratories of INRiM, CENAM and PTB performed calibrations in both
petals. The calibration measurements of each hydrometer were carried out at three specified
division marks at atmospheric pressure. Each laboratory used their own hydrostatic weighing
system with their own respective standard liquid such as: n-pentadecane, n-nonane, n-tridecane
and n-tetradecane.
Two sets concerned twelve KRCVs, for each petal, have been obtained at the tested density
marks by the results of participants. The KRCVs and corresponding uncertainties were
calculated by the weighted mean in the case of consistent results, otherwise the median was
used.
CCM.D-K4 “Hydrometers” Page 24 of 45
The DoE with respect to the corresponding KCRV was determined for each participant and
also, in this particular comparison, the Weighted Least Squares (WLS) method to link the
individual DoE of each participant by a continuous function has been proposed. Furthermore,
information on pair-wise degrees of equivalence was provided: the equations needed to
calculate them, and any information on correlations that may be necessary to estimate them
more accurately. We also explained the procedure for linking international comparisons to the
CCM.D-K4. Finally an example of linkage to the CCM.D-K4 is given by dealing with the
results of the bilateral comparison between INRiM and NMIA, which was added to this
comparison so that all participants were engaged after the breakage of the 9340170 artefact.
The overall results have shown a very satisfying agreement among the results provided by most
of the participants. Technical improvements can be made in some laboratories and, in general,
on the uncertainty evaluation. With the exception of few cases, the deviations of the laboratory
results to the KCRVs are within of 1/3 to 1/4 of a division of scale and the uncertainty at 95% is
usually within half a division. Anyway some systematic differences and either underestimated
or overestimated uncertainties of the submitted results have been identified with respect to the
KCRVs which had the responsibility to fail the consistency test of the Reference value of this
comparison. During the analysis of the submitted results, a systematic difference between the
first and last immersed mark was also noted, possibly due to a temperature gradient along the
stem and/or wetting of the stem close to the tested mark [11]. A corrected claimed uncertainty
from each laboratory is expected according Table 6. However this comparison may help the
laboratories to solve some residual or marginal problems as well as to better understand the
uncertainty components.
The CCM.D-K4 “Hydrometer” key comparison fully supports the calibration measurement
capabilities table in the BIPM key comparison database (KCDB). The results can be used to
link regional comparisons to this CCM key comparison.
CCM.D-K4 “Hydrometers” Page 25 of 45
References
[1] Lorefice S., Becerra O. L., Toth H. 2010 Technical Protocol for CCM.D- K4 “Hydrometer”,
http://kcdb.bipm.org/appendixB/AppBResults/CCM.D-K4/CCM.D-K4_Technical_protocol.pdf
[2] Picard A., Davis R. S., Gläser M. and Fujii K.
2008 Revised formula for the density of moist air (CIPM-
2007), Metrologia, 45, 149–155.
[3] Lorefice S. and Malengo A. 2004 An image processing approach to calibration of hydrometers, Metrologia 41,
L7–L10
[4] Lee Y J, Chang K H, and Oh C Y 2004 Automatic Alignment Method for Calibration of Hydrometers,
Metrologia 41, S100-S104
[5] Aguilera, J., Wright, J., and Bean, V. 2008, Hydrometer Calibration by Hydrostatic Weighing with Automated
Liquid Surface Positioning, Meas. Sci. Technol. 19, 015104
[6] JCGM 100:2008 - Evaluation of measurement data — Guide to the expression of uncertainty in measurement
http://www.bipm.org/utils/common/documents/jcgm/JCGM_100_2008_E.pdf
[7] CIPM MRA-D-05, Measurement comparisons in the CIPM MRA, March 2014
[8] Cox M. G. 2002, The evaluation of key comparison data, Metrologia, 39, 589-595
[9] Becerra L.O., Lorefice S. and Pennecchi F. Hydrometer calibration: Linking SIM NMIs to the EURAMET
key comparison reference value of EURAMET.M.D-K4, Ingeniería 22 (2): 95-105, ISSN: 1409-2441; 2012.
[10] JCGM 101. (2008). Evaluation of measurement data. Supplement 1 to the Guide to the expression of
uncertainty in measurement. Propagation of distributions using a Monte Carlo method
http://www.bipm.org/utils/common/documents/jcgm/JCGM_101_2008_E.pdf
[11] Lorefice S. and Malengo A. 2006 Calibration of hydrometers, Meas. Sci. Technol., 17, 2560
Acknowledgements
The authors would like to acknowledge the kind assistance of all the colleagues in the participating laboratories for
helping this comparison to run so smoothly. A special thanks to A. Daued and L.M. Peña of CENAM and S.
Gerdesmann of PTB for their great competence to measure both sets of the travelling standards used in this key
comparison. Our thanks are also due to Dr Kenichi Fujii, chairman of the CCM WG on Density and Viscosity, for
all his efforts.
CCM.D-K4 “Hydrometers” Page 26 of 45
Appendix A1
This section deals with the measurement results and the standard uncertainties as reported by
the participants. For each artefact, the calculated CCM Key-Comparison Reference Value
(KCRV) at each calibrated mark concerning with each of the two petals, with the related
uncertainty or the lower (Ul) and upper (Ur) limits of the confidence interval if procedure B was
applied [8]. Moreover, for each petal and for each artefact the three degrees of equivalence to
the KCRVs and their average with the corresponding estimated standard uncertainties
concerning each of the NMIs are listed and shown.
CCM.D-K4 “Hydrometers” Page 27 of 45
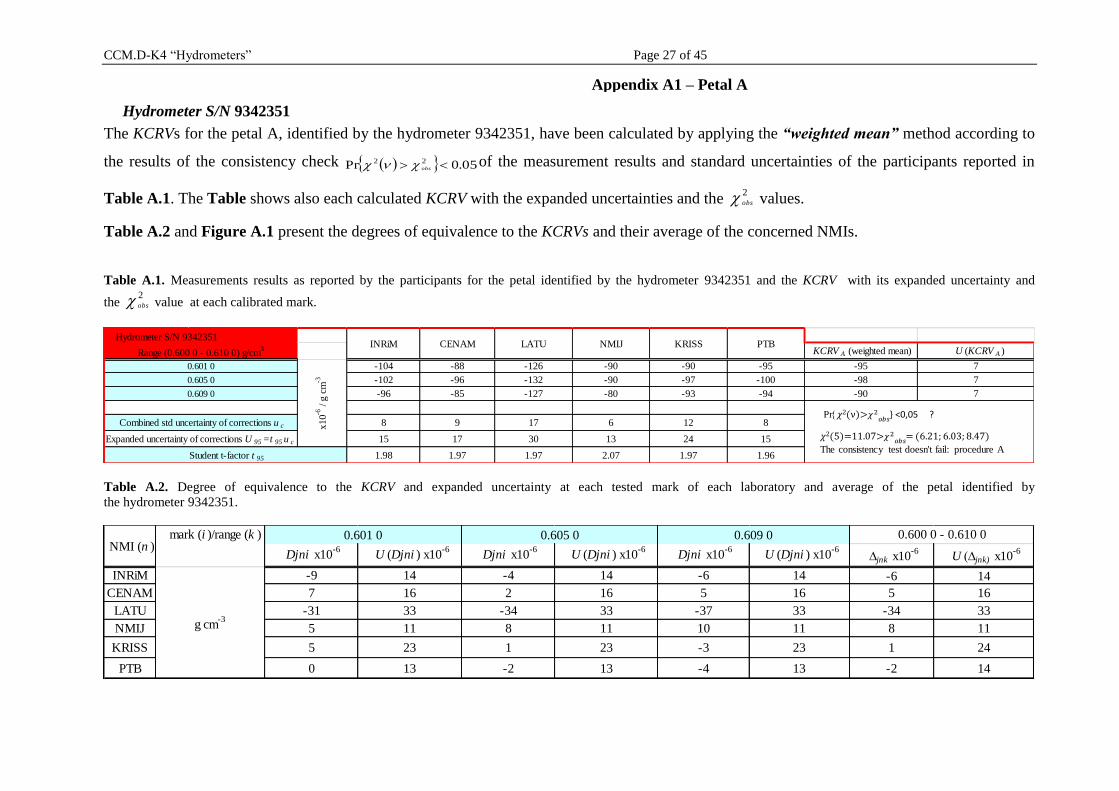
Hydrometer S/N 9342351
The KCRVs for the petal A, identified by the hydrometer 9342351, have been calculated by applying the “weighted mean” method according to
the results of the consistency check 05.0Pr 22 obs of the measurement results and standard uncertainties of the participants reported in
Table A.1. The Table shows also each calculated KCRV with the expanded uncertainties and the 2obs values.
Table A.2 and Figure A.1 present the degrees of equivalence to the KCRVs and their average of the concerned NMIs.
Table A.1. Measurements results as reported by the participants for the petal identified by the hydrometer 9342351 and the KCRV with its expanded uncertainty and
the 2obs value at each calibrated mark.
Table A.2. Degree of equivalence to the KCRV and expanded uncertainty at each tested mark of each laboratory and average of the petal identified by
the hydrometer 9342351.
KCRV A (weighted mean) U (KCRV A )
-104 -88 -126 -90 -90 -95 -95 7
-102 -96 -132 -90 -97 -100 -98 7
-96 -85 -127 -80 -93 -94 -90 7
8 9 17 6 12 8
15 17 30 13 24 15
1.98 1.97 1.97 2.07 1.97 1.96
PTBINRiM
Combined std uncertainty of corrections u c
x
10-6
/ g
cm
-3
Hydrometer S/N 9342351
Range (0.600 0 - 0.610 0) g/cm3
0.601 0
0.605 0
0.609 0
Student t-factor t 95
Expanded uncertainty of corrections U 95 =t 95 u c
LATU NMIJ KRISSCENAM
2(5)=11.07>𝜒2𝑜𝑏𝑠
= (6.21; 6.03; 8.47)
The consistency test doesn't fail: procedure A
Pr 2(ν)>𝜒2𝑜𝑏𝑠
} <0,05 ?
Djni x10-6
U (Djni ) x10-6
Djni x10-6
U (Djni ) x10-6
Djni x10-6
U (Djni ) x10-6
∆jnk x10-6
U (∆jnk) x10-6
INRiM -9 14 -4 14 -6 14 -6 14
CENAM 7 16 2 16 5 16 5 16
LATU -31 33 -34 33 -37 33 -34 33
NMIJ 5 11 8 11 10 11 8 11
KRISS 5 23 1 23 -3 23 1 24
PTB 0 13 -2 13 -4 13 -2 14
0.605 0 0.609 00.601 0NMI (n )
0.600 0 - 0.610 0 mark (i )/range (k )
g cm-3
Appendix A1 – Petal A
CCM.D-K4 “Hydrometers” Page 28 of 45
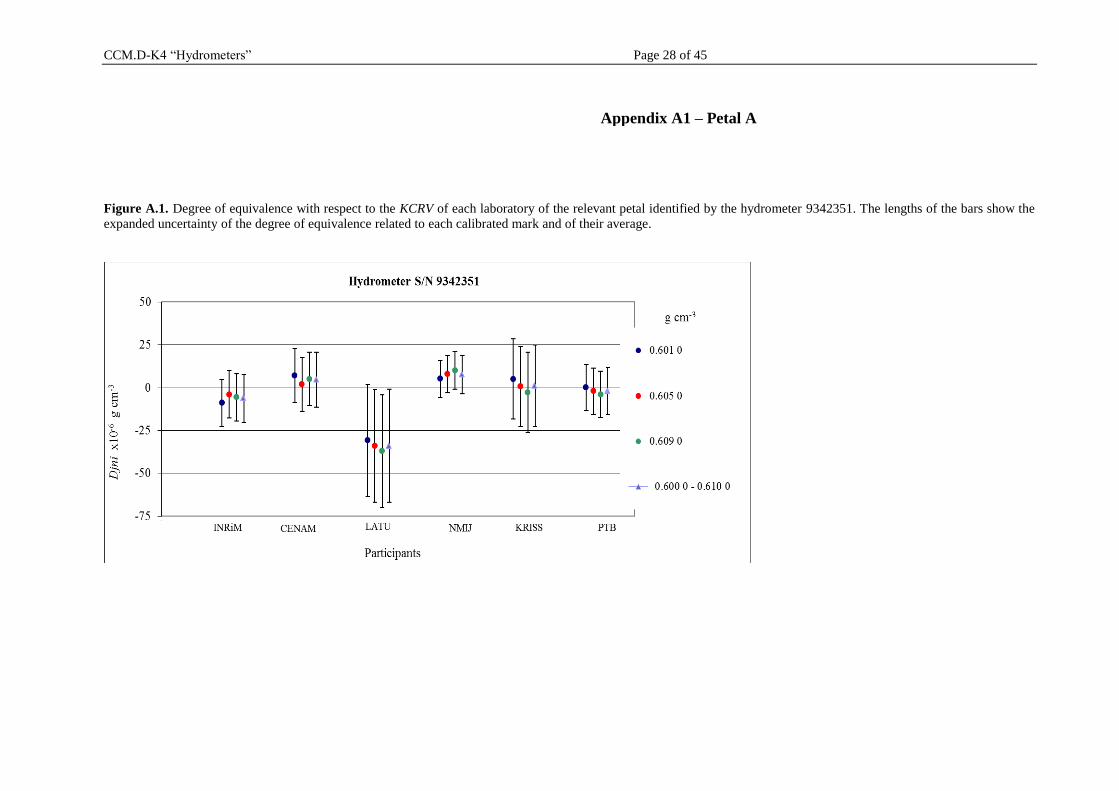
Figure A.1. Degree of equivalence with respect to the KCRV of each laboratory of the relevant petal identified by the hydrometer 9342351. The lengths of the bars show the
expanded uncertainty of the degree of equivalence related to each calibrated mark and of their average.
Appendix A1 – Petal A
CCM.D-K4 “Hydrometers” Page 29 of 45
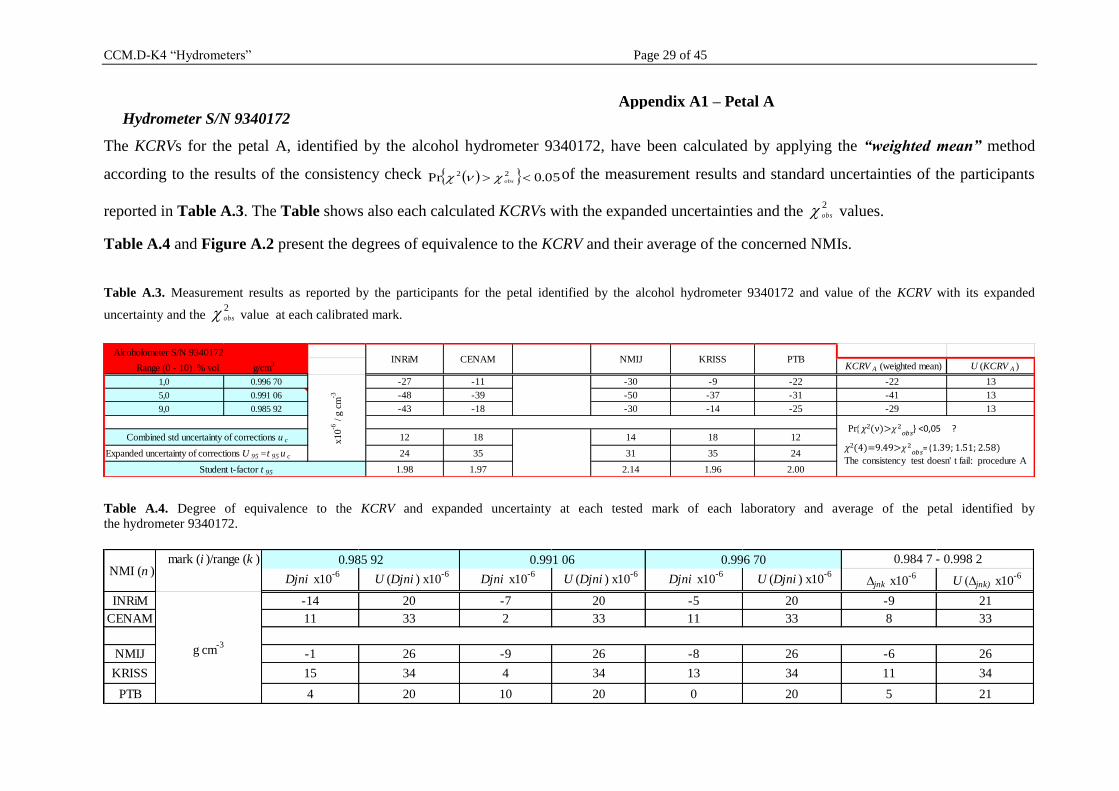
Hydrometer S/N 9340172
The KCRVs for the petal A, identified by the alcohol hydrometer 9340172, have been calculated by applying the “weighted mean” method
according to the results of the consistency check 05.0Pr 22 obs of the measurement results and standard uncertainties of the participants
reported in Table A.3. The Table shows also each calculated KCRVs with the expanded uncertainties and the 2obs values.
Table A.4 and Figure A.2 present the degrees of equivalence to the KCRV and their average of the concerned NMIs.
Table A.3. Measurement results as reported by the participants for the petal identified by the alcohol hydrometer 9340172 and value of the KCRV with its expanded
uncertainty and the 2obs value at each calibrated mark.
Table A.4. Degree of equivalence to the KCRV and expanded uncertainty at each tested mark of each laboratory and average of the petal identified by
the hydrometer 9340172.
KCRV A (weighted mean) U (KCRV A )
1,0 0.996 70 -27 -11 -30 -9 -22 -22 13
5,0 0.991 06 -48 -39 -50 -37 -31 -41 13
9,0 0.985 92 -43 -18 -30 -14 -25 -29 13
12 18 14 18 12
24 35 31 35 24
1.98 1.97 2.14 1.96 2.00
Combined std uncertainty of corrections u c
Expanded uncertainty of corrections U 95 =t 95 u c
CENAM
0
KRISS PTBINRiM NMIJ
Student t-factor t 95
Alcoholometer S/N 9340172
Range (0 - 10) % vol g/cm3
x
10-6
/ g
cm
-3
0
2(4)=9.49>𝜒2𝑜𝑏𝑠
= (1.39; 1.51; 2.58)
The consistency test doesn' t fail: procedure A
Pr 2(ν)>𝜒2𝑜𝑏𝑠
} <0,05 ?
Djni x10-6
U (Djni ) x10-6
Djni x10-6
U (Djni ) x10-6
Djni x10-6
U (Djni ) x10-6
∆jnk x10-6
U (∆jnk) x10-6
INRiM -14 20 -7 20 -5 20 -9 21
CENAM 11 33 2 33 11 33 8 33
NMIJ -1 26 -9 26 -8 26 -6 26
KRISS 15 34 4 34 13 34 11 34
PTB 4 20 10 20 0 20 5 21
0.991 06 0.996 70NMI (n )
mark (i )/range (k )
g cm-3
0.984 7 - 0.998 2 0.985 92
Appendix A1 – Petal A
CCM.D-K4 “Hydrometers” Page 30 of 45
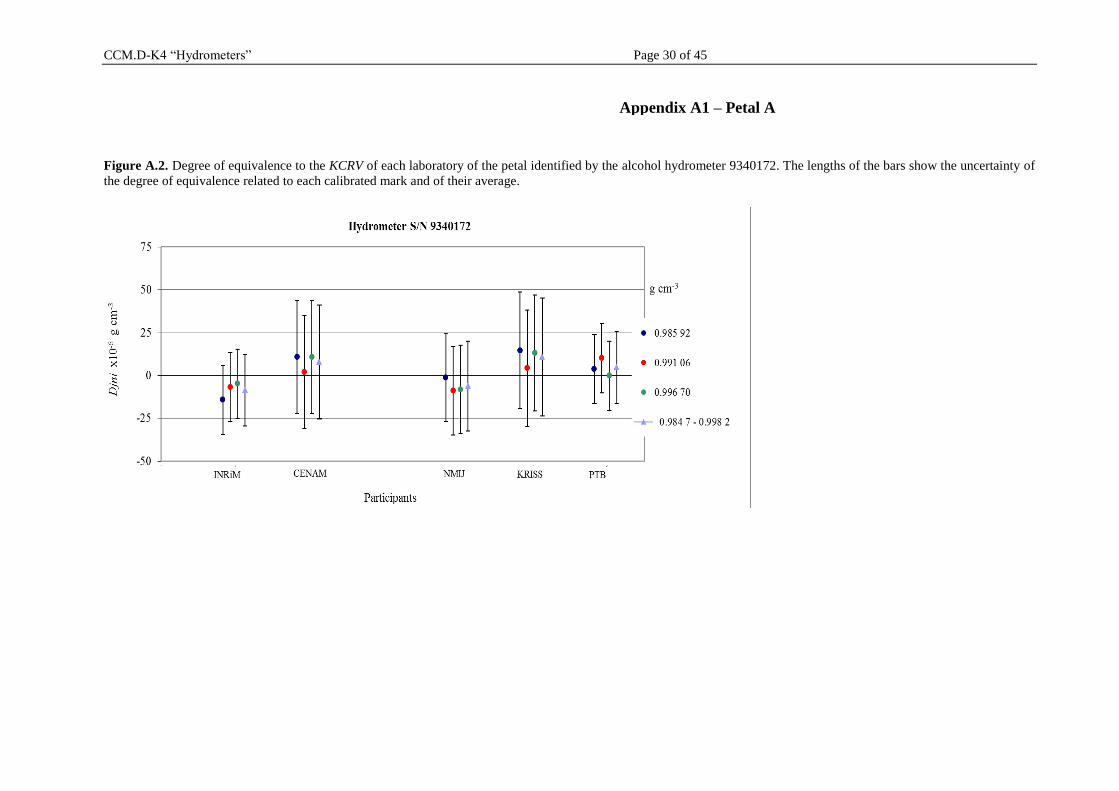
Figure A.2. Degree of equivalence to the KCRV of each laboratory of the petal identified by the alcohol hydrometer 9340172. The lengths of the bars show the uncertainty of
the degree of equivalence related to each calibrated mark and of their average.
Appendix A1 – Petal A
CCM.D-K4 “Hydrometers” Page 31 of 45
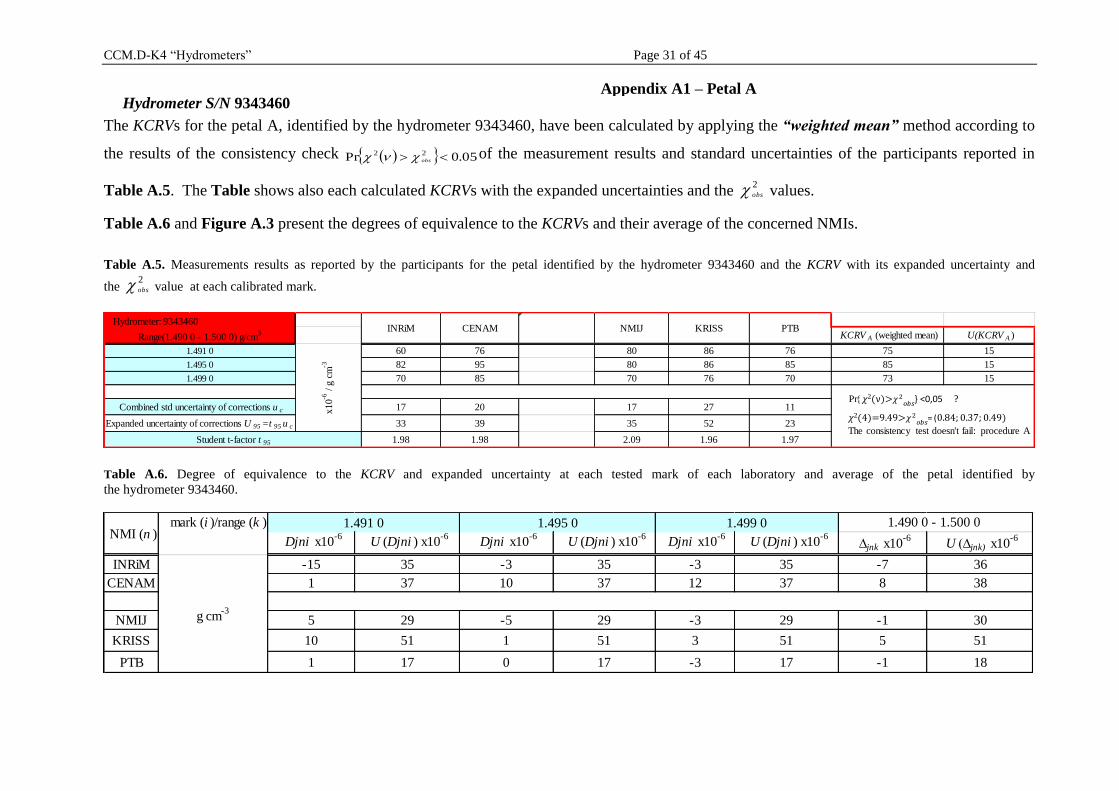
Hydrometer S/N 9343460
The KCRVs for the petal A, identified by the hydrometer 9343460, have been calculated by applying the “weighted mean” method according to
the results of the consistency check 05.0Pr 22 obs of the measurement results and standard uncertainties of the participants reported in
Table A.5. The Table shows also each calculated KCRVs with the expanded uncertainties and the 2obs values.
Table A.6 and Figure A.3 present the degrees of equivalence to the KCRVs and their average of the concerned NMIs.
Table A.5. Measurements results as reported by the participants for the petal identified by the hydrometer 9343460 and the KCRV with its expanded uncertainty and
the 2obs value at each calibrated mark.
Table A.6. Degree of equivalence to the KCRV and expanded uncertainty at each tested mark of each laboratory and average of the petal identified by
the hydrometer 9343460.
KCRV A (weighted mean) U(KCRV A )
60 76 0 80 86 76 75 15
82 95 0 80 86 85 85 15
70 85 0 70 76 70 73 15
17 20 0 17 27 11
33 39 0 35 52 23
1.98 1.98 2,01 2.09 1.96 1.97
3A
1.495 0
NMIJ PTBINRiMHydrometer: 9343460
Range(1.490 0 - 1.500 0) g/cm3
1.499 0
Student t-factor t 95
Combined std uncertainty of corrections u c
KRISS
Expanded uncertainty of corrections U 95 =t 95 u c x10-6
/ g
cm
-3
1.491 0
CENAM
2(4)=9.49>𝜒2𝑜𝑏𝑠
= (0.84; 0.37; 0.49)
The consistency test doesn't fail: procedure A
Pr 2(ν)>𝜒2𝑜𝑏𝑠
} <0,05 ?
Djni x10-6
U (Djni ) x10-6
Djni x10-6
U (Djni ) x10-6
Djni x10-6
U (Djni ) x10-6
∆jnk x10-6
U (∆jnk) x10-6
INRiM -15 35 -3 35 -3 35 -7 36
CENAM 1 37 10 37 12 37 8 38
NMIJ 5 29 -5 29 -3 29 -1 30
KRISS 10 51 1 51 3 51 5 51
PTB 1 17 0 17 -3 17 -1 18
NMI (n )1.491 0 1.490 0 - 1.500 0 1.499 01.495 0mark (i )/range (k )
g cm-3
Appendix A1 – Petal A
CCM.D-K4 “Hydrometers” Page 32 of 45
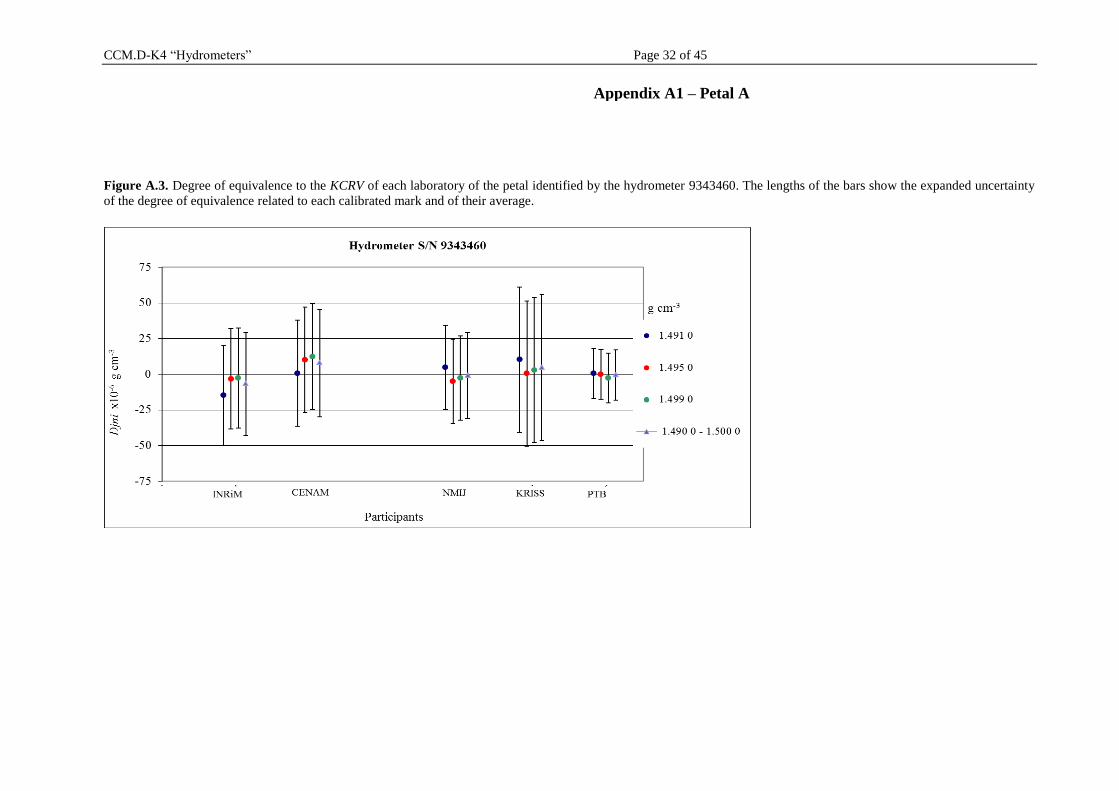
Figure A.3. Degree of equivalence to the KCRV of each laboratory of the petal identified by the hydrometer 9343460. The lengths of the bars show the expanded uncertainty
of the degree of equivalence related to each calibrated mark and of their average.
Appendix A1 – Petal A
CCM.D-K4 “Hydrometers” Page 33 of 45
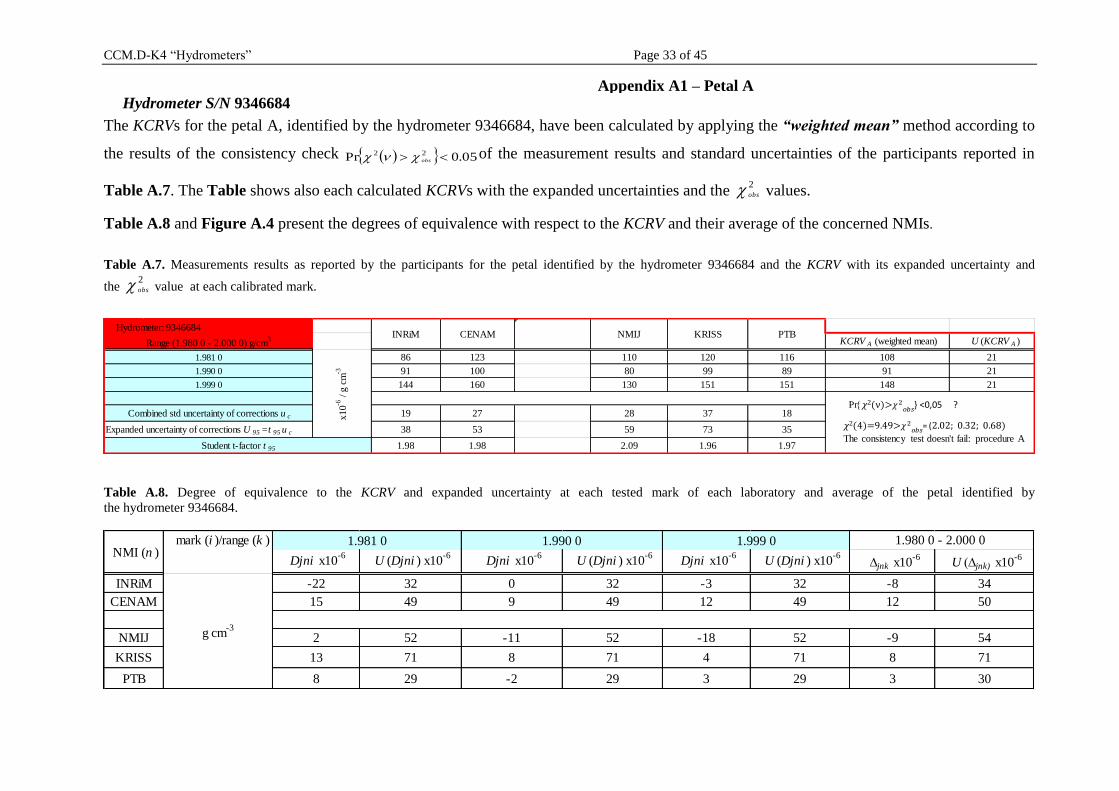
Hydrometer S/N 9346684
The KCRVs for the petal A, identified by the hydrometer 9346684, have been calculated by applying the “weighted mean” method according to
the results of the consistency check 05.0Pr 22 obs of the measurement results and standard uncertainties of the participants reported in
Table A.7. The Table shows also each calculated KCRVs with the expanded uncertainties and the 2obs values.
Table A.8 and Figure A.4 present the degrees of equivalence with respect to the KCRV and their average of the concerned NMIs.
Table A.7. Measurements results as reported by the participants for the petal identified by the hydrometer 9346684 and the KCRV with its expanded uncertainty and
the 2obs value at each calibrated mark.
Table A.8. Degree of equivalence to the KCRV and expanded uncertainty at each tested mark of each laboratory and average of the petal identified by
the hydrometer 9346684.
KCRV A (weighted mean) U (KCRV A )
86 123 0,000007 110 120 116 108 21
91 100 -0,000014 80 99 89 91 21
144 160 0,000019 130 151 151 148 21
19 27 0,000031 28 37 18
38 53 2,01 59 73 35
1.98 1.98 0,00006 2.09 1.96 1.97Student t-factor t 95
PTB
1.981 0
1.990 0
1.999 0
Combined std uncertainty of corrections u c
Expanded uncertainty of corrections U 95 =t 95 u c
Hydrometer: 9346684
Range (1.980 0 - 2.000 0) g/cm3
INRiM KRISS x10-6
/ g
cm
-3CENAM 3A NMIJ
2(4)=9.49>𝜒2𝑜𝑏𝑠
= (2.02; 0.32; 0.68)
The consistency test doesn't fail: procedure A
Pr 2(ν)>𝜒2𝑜𝑏𝑠
} <0,05 ?
Djni x10-6
U (Djni ) x10-6
Djni x10-6
U (Djni ) x10-6
Djni x10-6
U (Djni ) x10-6
∆jnk x10-6
U (∆jnk) x10-6
INRiM -22 32 0 32 -3 32 -8 34
CENAM 15 49 9 49 12 49 12 50
NMIJ 2 52 -11 52 -18 52 -9 54
KRISS 13 71 8 71 4 71 8 71
PTB 8 29 -2 29 3 29 3 30
1.981 0 1.990 0 1.999 0 1.980 0 - 2.000 0 NMI (n )
g cm-3
mark (i )/range (k )
Appendix A1 – Petal A
CCM.D-K4 “Hydrometers” Page 34 of 45
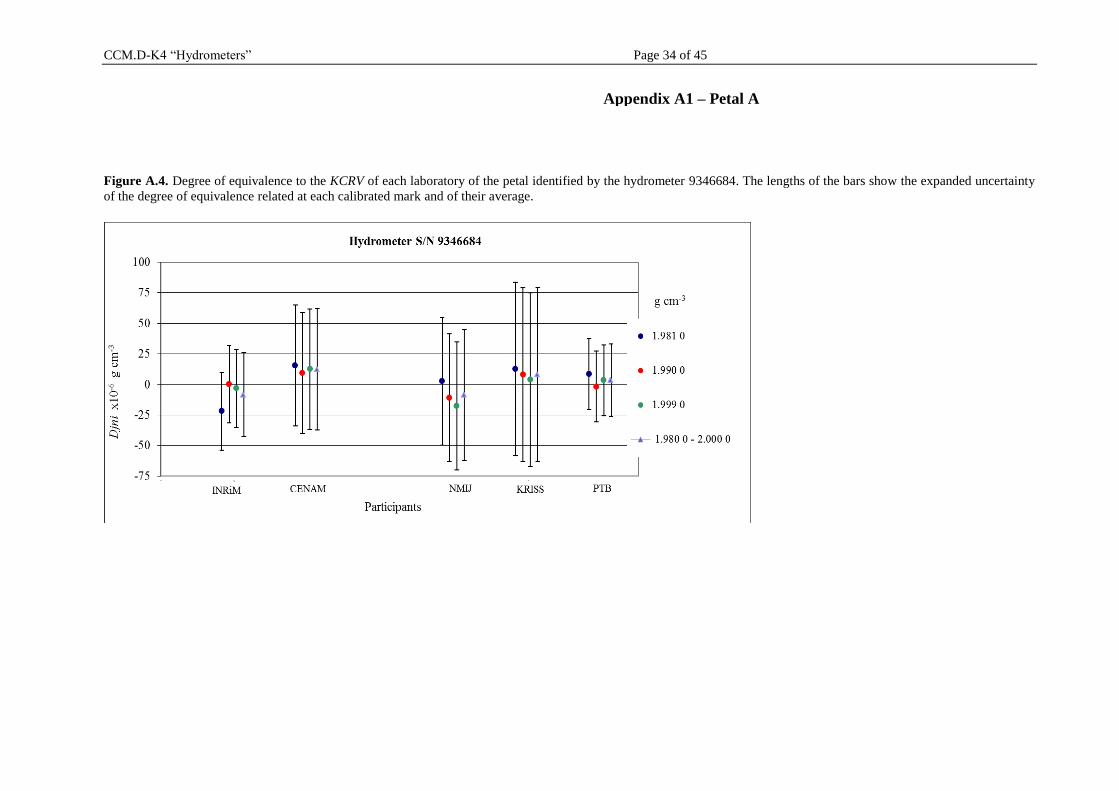
Figure A.4. Degree of equivalence to the KCRV of each laboratory of the petal identified by the hydrometer 9346684. The lengths of the bars show the expanded uncertainty
of the degree of equivalence related at each calibrated mark and of their average.
Appendix A1 – Petal A
CCM.D-K4 “Hydrometers” Page 35 of 45
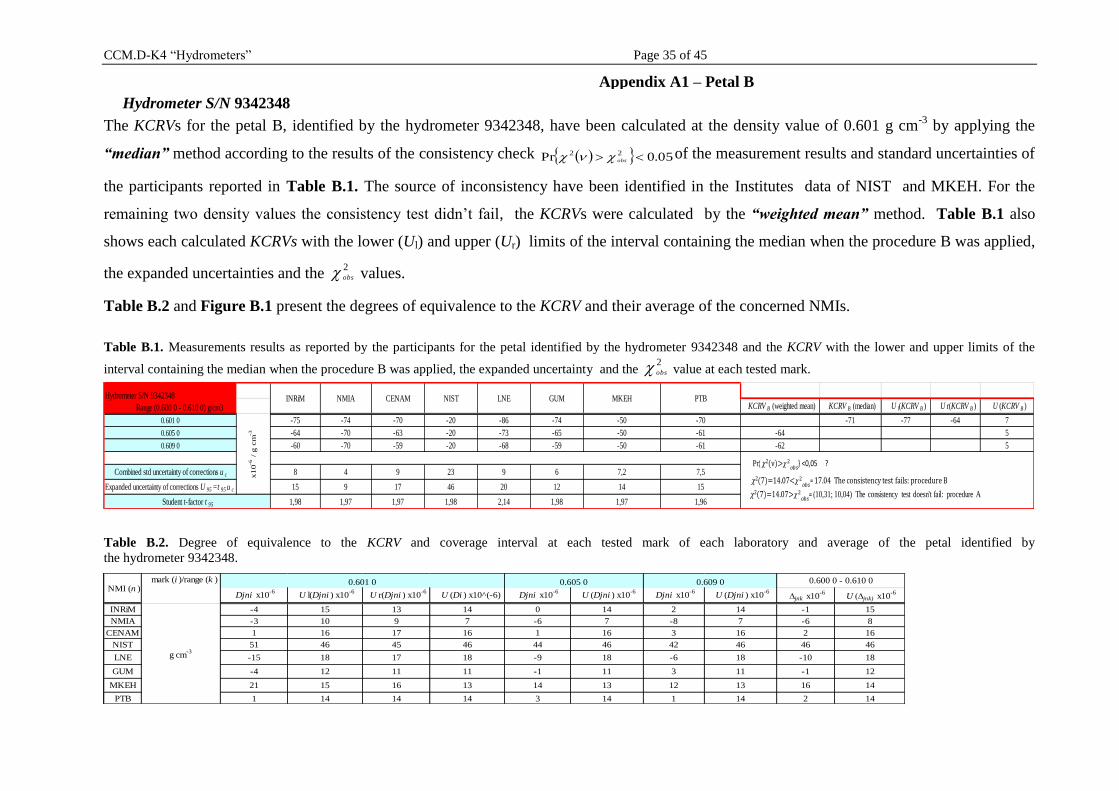
Hydrometer S/N 9342348
The KCRVs for the petal B, identified by the hydrometer 9342348, have been calculated at the density value of 0.601 g cm-3
by applying the
“median” method according to the results of the consistency check 05.0Pr 22 obs of the measurement results and standard uncertainties of
the participants reported in Table B.1. The source of inconsistency have been identified in the Institutes data of NIST and MKEH. For the
remaining two density values the consistency test didn’t fail, the KCRVs were calculated by the “weighted mean” method. Table B.1 also
shows each calculated KCRVs with the lower (Ul) and upper (Ur) limits of the interval containing the median when the procedure B was applied,
the expanded uncertainties and the 2obs values.
Table B.2 and Figure B.1 present the degrees of equivalence to the KCRV and their average of the concerned NMIs.
Table B.1. Measurements results as reported by the participants for the petal identified by the hydrometer 9342348 and the KCRV with the lower and upper limits of the
interval containing the median when the procedure B was applied, the expanded uncertainty and the 2obs value at each tested mark.
Table B.2. Degree of equivalence to the KCRV and coverage interval at each tested mark of each laboratory and average of the petal identified by
the hydrometer 9342348.
KCRV B (weighted mean) KCRV B (median) U l(KCRV B ) U r(KCRV B ) U (KCRV B )
-75 -74 -70 -20 -86 -74 -50 -70 -71 -77 -64 7
-64 -70 -63 -20 -73 -65 -50 -61 -64 5
-60 -70 -59 -20 -68 -59 -50 -61 -62 5
8 4 9 23 9 6 7,2 7,5
15 9 17 46 20 12 14 15
1,98 1,97 1,97 1,98 2,14 1,98 1,97 1,96
MKEH
x
10
-6 / g
cm
-3
Student t-factor t 95
Hydrometer S/N 9342348
Range (0.600 0 - 0.610 0) g/cm3NIST LNEINRiM
0.605 0
0.609 0
Expanded uncertainty of corrections U 95 =t 95 u c
0.601 0
CENAM GUM PTBNMIA
Combined std uncertainty of corrections u c
2(7)=14.07>𝜒2𝑜𝑏𝑠
= (10,31; 10,04) The consistency test doesn't fail: procedure A
2(7)=14.07<𝜒2𝑜𝑏𝑠
= 17.04 The consistency test fails: procedure B
Pr 2(ν)>𝜒2𝑜𝑏𝑠
} <0,05 ?
Djni x10-6
U l(Djni ) x10-6
U r(Djni ) x10-6
U (Di ) x10^(-6) Djni x10-6
U (Djni ) x10-6
Djni x10-6
U (Djni ) x10-6
∆jnk x10-6
U (∆jnk) x10-6
INRiM -4 15 13 14 0 14 2 14 -1 15
NMIA -3 10 9 7 -6 7 -8 7 -6 8
CENAM 1 16 17 16 1 16 3 16 2 16
NIST 51 46 45 46 44 46 42 46 46 46
LNE -15 18 17 18 -9 18 -6 18 -10 18
GUM -4 12 11 11 -1 11 3 11 -1 12
MKEH 21 15 16 13 14 13 12 13 16 14
PTB 1 14 14 14 3 14 1 14 2 14
0.605 0NMI (n )
0.600 0 - 0.610 0 0.601 0 0.609 0mark (i )/range (k )
g cm-3
Appendix A1 – Petal B
CCM.D-K4 “Hydrometers” Page 36 of 45
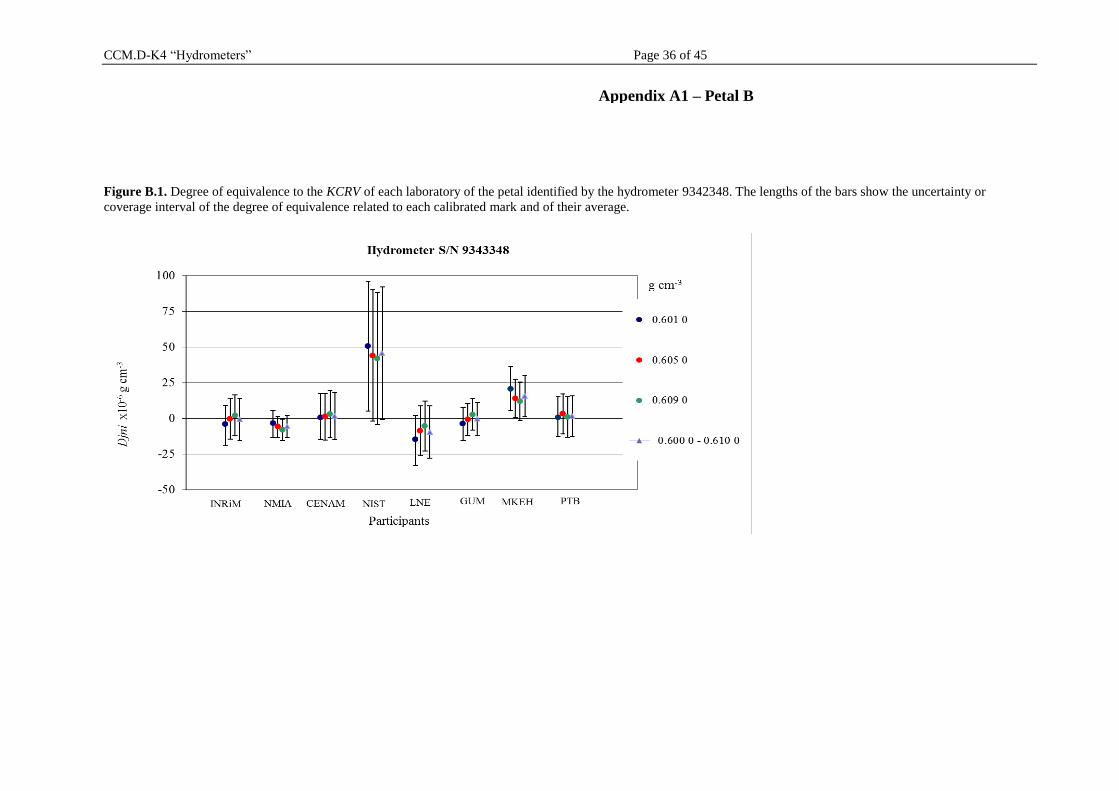
Figure B.1. Degree of equivalence to the KCRV of each laboratory of the petal identified by the hydrometer 9342348. The lengths of the bars show the uncertainty or
coverage interval of the degree of equivalence related to each calibrated mark and of their average.
Appendix A1 – Petal B
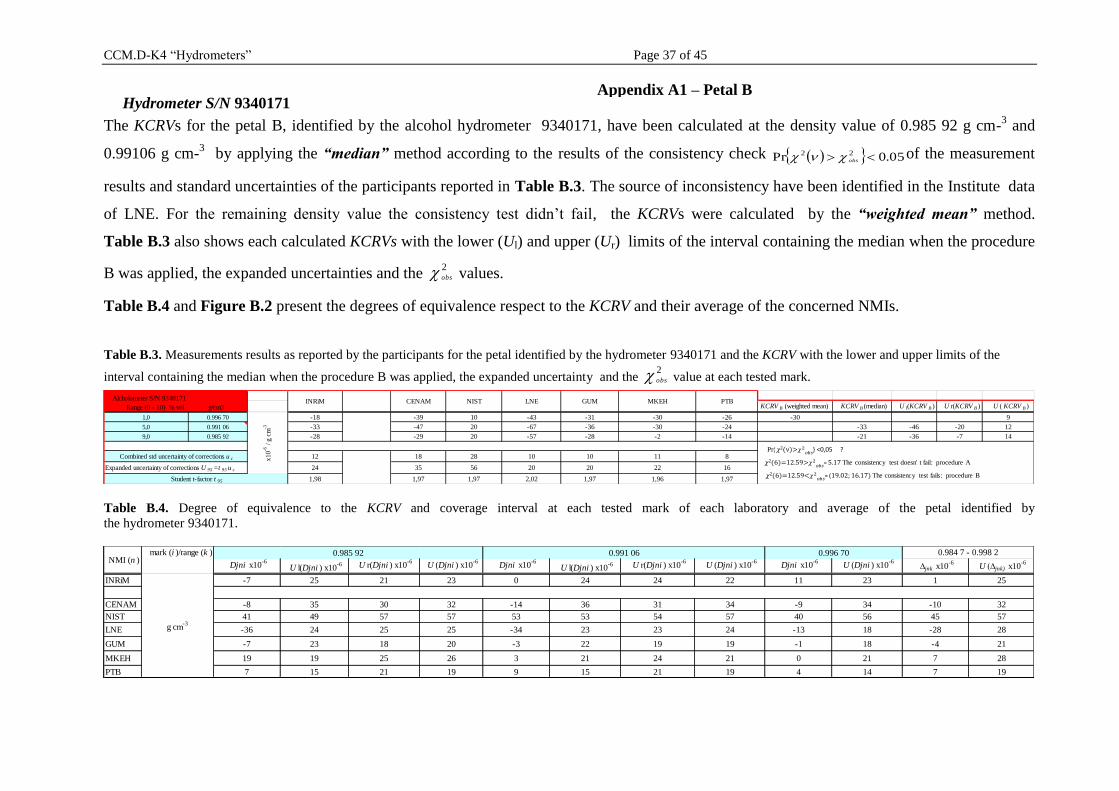
CCM.D-K4 “Hydrometers” Page 37 of 45
Hydrometer S/N 9340171
The KCRVs for the petal B, identified by the alcohol hydrometer 9340171, have been calculated at the density value of 0.985 92 g cm-3 and
0.99106 g cm-3 by applying the “median” method according to the results of the consistency check 05.0Pr 22 obs of the measurement
results and standard uncertainties of the participants reported in Table B.3. The source of inconsistency have been identified in the Institute data
of LNE. For the remaining density value the consistency test didn’t fail, the KCRVs were calculated by the “weighted mean” method.
Table B.3 also shows each calculated KCRVs with the lower (Ul) and upper (Ur) limits of the interval containing the median when the procedure
B was applied, the expanded uncertainties and the 2obs values.
Table B.4 and Figure B.2 present the degrees of equivalence respect to the KCRV and their average of the concerned NMIs.
Table B.3. Measurements results as reported by the participants for the petal identified by the hydrometer 9340171 and the KCRV with the lower and upper limits of the
interval containing the median when the procedure B was applied, the expanded uncertainty and the 2obs value at each tested mark.
Table B.4. Degree of equivalence to the KCRV and coverage interval at each tested mark of each laboratory and average of the petal identified by
the hydrometer 9340171.
KCRV B (weighted mean) KCRV B (median) U l(KCRV B ) U r(KCRV B ) U ( KCRV B )
1,0 0.996 70 -18 -39 10 -43 -31 -30 -26 -30 9
5,0 0.991 06 -33 -47 20 -67 -36 -30 -24 -33 -46 -20 12
9,0 0.985 92 -28 -29 20 -57 -28 -2 -14 -21 -36 -7 14
12 18 28 10 10 11 8
24 35 56 20 20 22 16
1,98 1,97 1,97 2,02 1,97 1,96 1,97
Alcholometer S/N 9340171
Range (0 - 10) % vol g/cm3 LNE GUMNIST MKEH PTBCENAM
Student t-factor t 95
x
10-6
/ g
cm
-3
Combined std uncertainty of corrections u c
Expanded uncertainty of corrections U 95 =t 95 u c
INRiM
2(6)=12.59<𝜒2𝑜𝑏𝑠
= (19.02; 16.17) The consistency test fails: procedure B
2(6)=12.59>𝜒2𝑜𝑏𝑠
= 5.17 The consistency test doesn' t fail: procedure A
Pr 2(ν)>𝜒2𝑜𝑏𝑠
} <0,05 ?
Djni x10-6
U l(Djni ) x10-6 U r(Djni ) x10
-6U (Djni ) x10
-6Djni x10
-6
U l(Djni ) x10-6 U r(Djni ) x10
-6U (Djni ) x10
-6Djni x10
-6U (Djni ) x10
-6∆jnk x10
-6U (∆jnk) x10
-6
INRiM -7 25 21 23 0 24 24 22 11 23 1 25
CENAM -8 35 30 32 -14 36 31 34 -9 34 -10 32
NIST 41 49 57 57 53 53 54 57 40 56 45 57
LNE -36 24 25 25 -34 23 23 24 -13 18 -28 28
GUM -7 23 18 20 -3 22 19 19 -1 18 -4 21
MKEH 19 19 25 26 3 21 24 21 0 21 7 28
PTB 7 15 21 19 9 15 21 19 4 14 7 19
g cm-3
mark (i )/range (k ) 0.991 06NMI (n )
0.985 92 0.984 7 - 0.998 2 0.996 70
Appendix A1 – Petal B
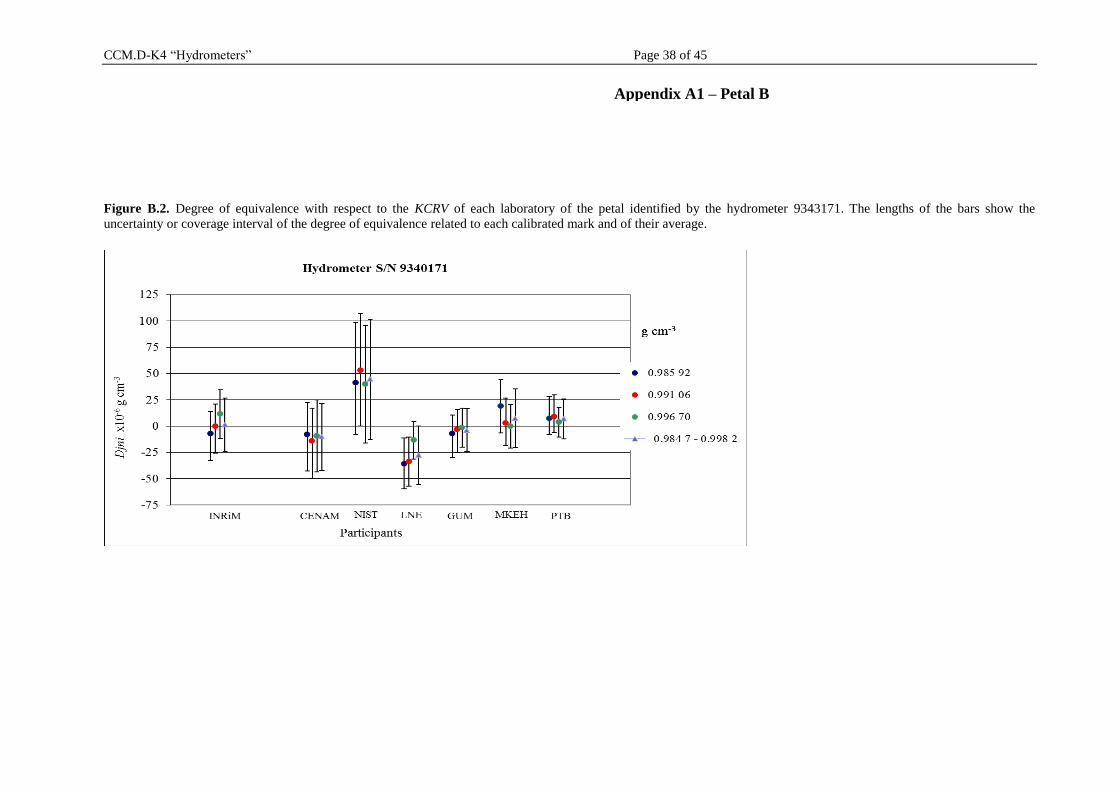
CCM.D-K4 “Hydrometers” Page 38 of 45
Figure B.2. Degree of equivalence with respect to the KCRV of each laboratory of the petal identified by the hydrometer 9343171. The lengths of the bars show the
uncertainty or coverage interval of the degree of equivalence related to each calibrated mark and of their average.
Appendix A1 – Petal B
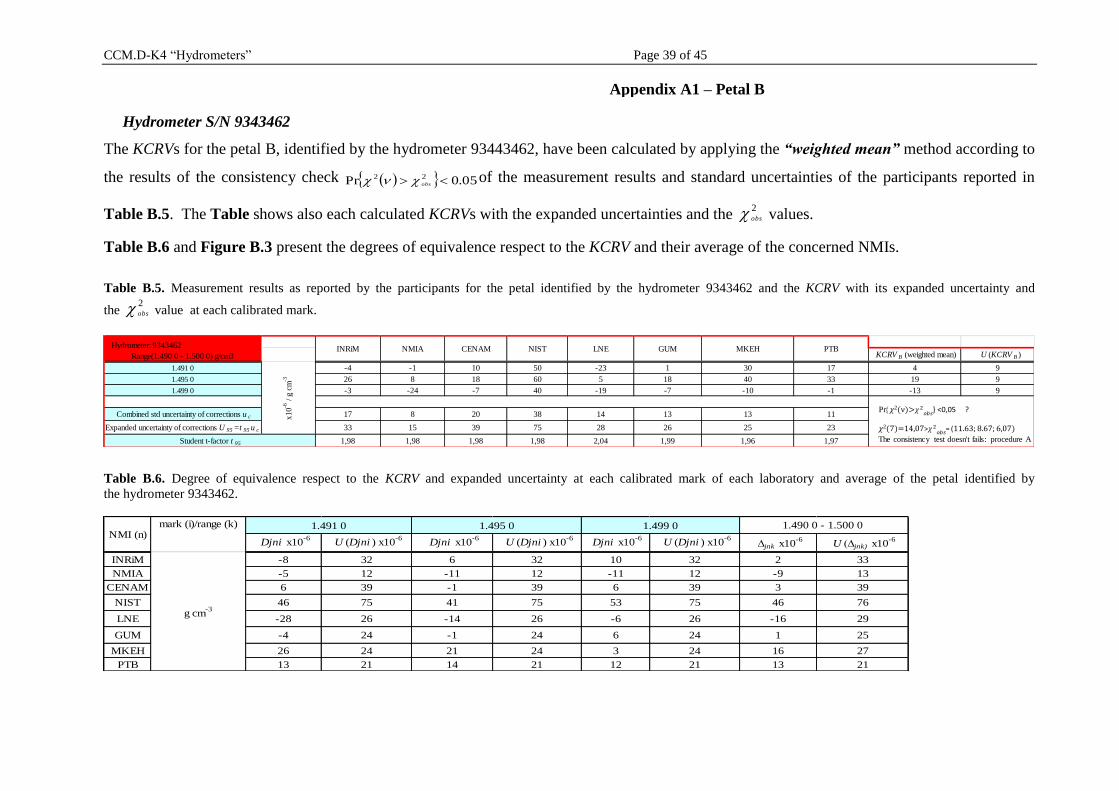
CCM.D-K4 “Hydrometers” Page 39 of 45
Hydrometer S/N 9343462
The KCRVs for the petal B, identified by the hydrometer 93443462, have been calculated by applying the “weighted mean” method according to
the results of the consistency check 05.0Pr 22 obs of the measurement results and standard uncertainties of the participants reported in
Table B.5. The Table shows also each calculated KCRVs with the expanded uncertainties and the 2obs values.
Table B.6 and Figure B.3 present the degrees of equivalence respect to the KCRV and their average of the concerned NMIs.
Table B.5. Measurement results as reported by the participants for the petal identified by the hydrometer 9343462 and the KCRV with its expanded uncertainty and
the 2obs value at each calibrated mark.
Table B.6. Degree of equivalence respect to the KCRV and expanded uncertainty at each calibrated mark of each laboratory and average of the petal identified by
the hydrometer 9343462.
KCRV B (weighted mean) U (KCRV B )
-4 -1 10 50 -23 1 30 17 4 9
26 8 18 60 5 18 40 33 19 9
-3 -24 -7 40 -19 -7 -10 -1 -13 9
17 8 20 38 14 13 13 11
33 15 39 75 28 26 25 23
1,98 1,98 1,98 1,98 2,04 1,99 1,96 1,97
MKEH PTB
Combined std uncertainty of corrections u c
x10-6
/ g
cm
-3
NIST LNE GUM
Expanded uncertainty of corrections U 95 =t 95 u c
1.491 0
CENAM
1.495 0
Student t-factor t 95
1.499 0
INRiM NMIAHydrometer: 9343462
Range(1.490 0 - 1.500 0) g/cm3
2(7)=14,07>𝜒2𝑜𝑏𝑠
= (11.63; 8.67; 6,07)
The consistency test doesn't fails: procedure A
Pr 2(ν)>𝜒2𝑜𝑏𝑠
} <0,05 ?
Djni x10-6
U (Djni ) x10-6
Djni x10-6
U (Djni ) x10-6
Djni x10-6
U (Djni ) x10-6
∆jnk x10-6
U (∆jnk) x10-6
INRiM -8 32 6 32 10 32 2 33
NMIA -5 12 -11 12 -11 12 -9 13
CENAM 6 39 -1 39 6 39 3 39
NIST 46 75 41 75 53 75 46 76
LNE -28 26 -14 26 -6 26 -16 29
GUM -4 24 -1 24 6 24 1 25
MKEH 26 24 21 24 3 24 16 27
PTB 13 21 14 21 12 21 13 21
1.495 0
g cm-3
1.490 0 - 1.500 0 NMI (n)
1.499 01.491 0mark (i)/range (k)
Appendix A1 – Petal B
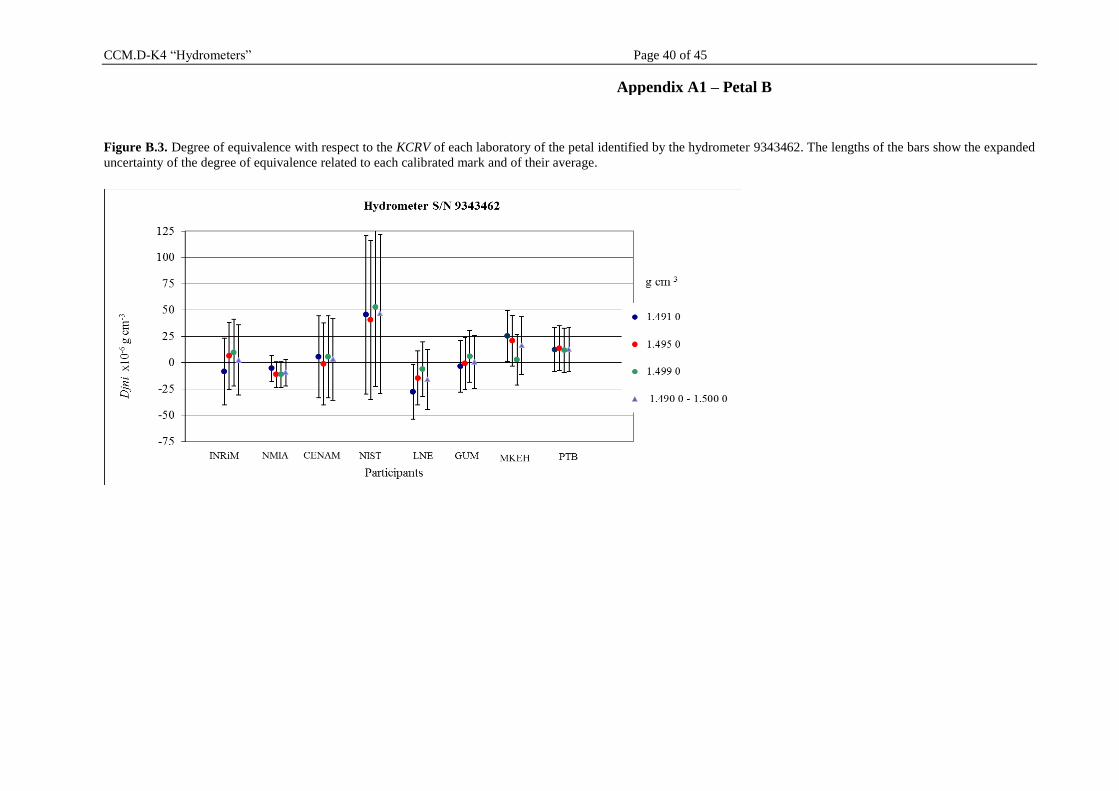
CCM.D-K4 “Hydrometers” Page 40 of 45
Figure B.3. Degree of equivalence with respect to the KCRV of each laboratory of the petal identified by the hydrometer 9343462. The lengths of the bars show the expanded
uncertainty of the degree of equivalence related to each calibrated mark and of their average.
Appendix A1 – Petal B
CCM.D-K4 “Hydrometers” Page 41 of 45
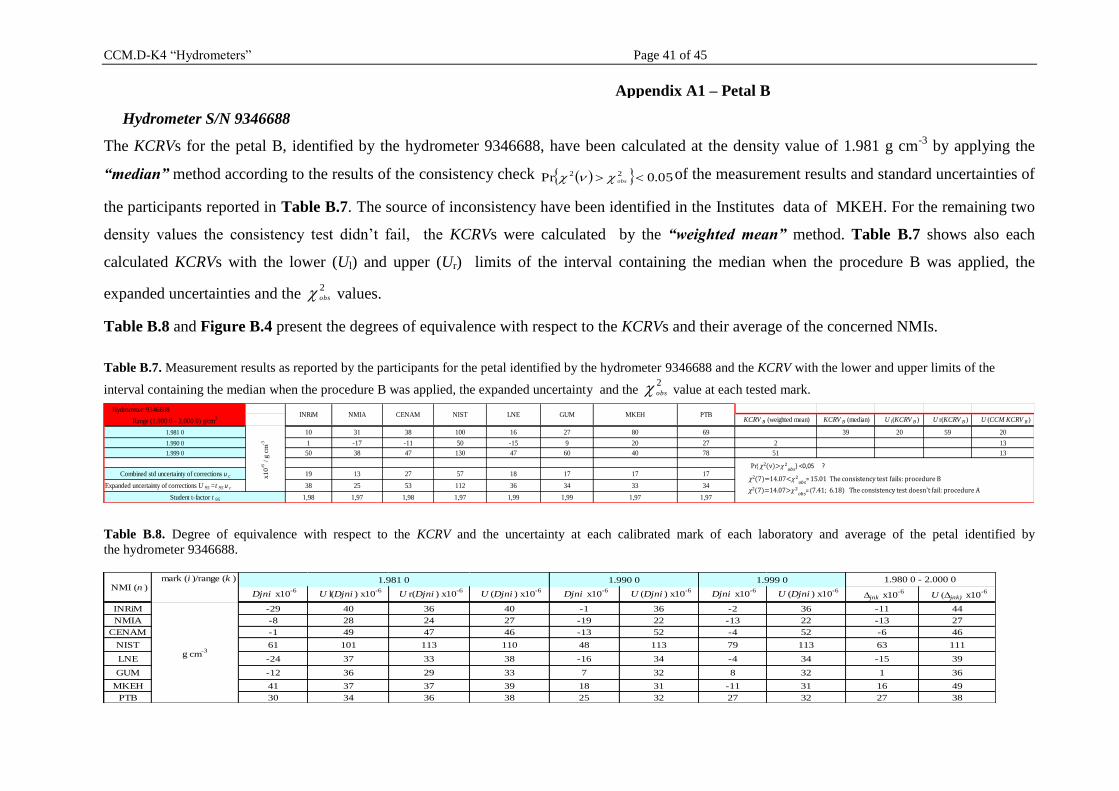
Hydrometer S/N 9346688
The KCRVs for the petal B, identified by the hydrometer 9346688, have been calculated at the density value of 1.981 g cm-3
by applying the
“median” method according to the results of the consistency check 05.0Pr 22 obs of the measurement results and standard uncertainties of
the participants reported in Table B.7. The source of inconsistency have been identified in the Institutes data of MKEH. For the remaining two
density values the consistency test didn’t fail, the KCRVs were calculated by the “weighted mean” method. Table B.7 shows also each
calculated KCRVs with the lower (Ul) and upper (Ur) limits of the interval containing the median when the procedure B was applied, the
expanded uncertainties and the 2obs values.
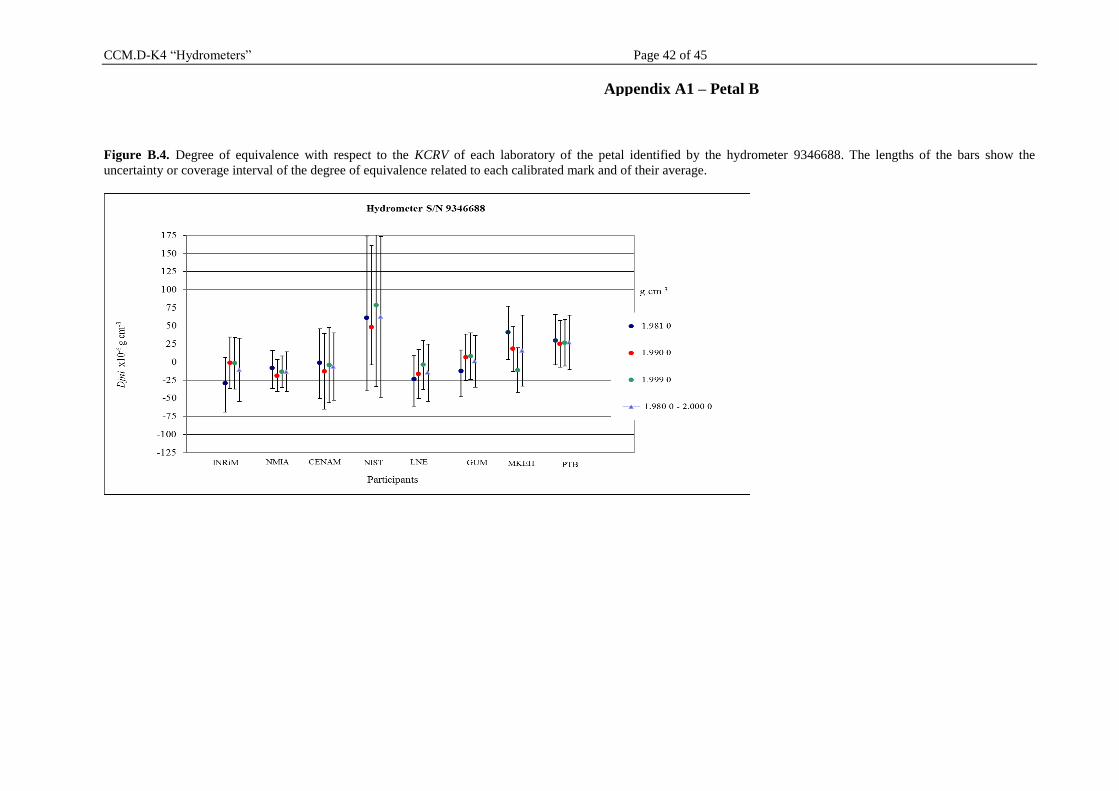
Table B.8 and Figure B.4 present the degrees of equivalence with respect to the KCRVs and their average of the concerned NMIs.
Table B.7. Measurement results as reported by the participants for the petal identified by the hydrometer 9346688 and the KCRV with the lower and upper limits of the
interval containing the median when the procedure B was applied, the expanded uncertainty and the 2obs value at each tested mark.
Table B.8. Degree of equivalence with respect to the KCRV and the uncertainty at each calibrated mark of each laboratory and average of the petal identified by
the hydrometer 9346688.
KCRV B (weighted mean) KCRV B (median) U l(KCRV B ) U r(KCRV B ) U (CCM KCRV B )
10 31 38 100 16 27 80 69 39 20 59 20
1 -17 -11 50 -15 9 20 27 2 13
50 38 47 130 47 60 40 78 51 13
19 13 27 57 18 17 17 17
38 25 53 112 36 34 33 34
1,98 1,97 1,98 1,97 1,99 1,99 1,97 1,97
MKEH PTB
1.981 0
1.990 0
x10
-6 / g
cm
-3
Student t-factor t 95
INRiM NMIA LNE GUMCENAM NIST
Combined std uncertainty of corrections u c
Expanded uncertainty of corrections U 95 =t 95 u c
Hydrometer: 9346688
Range (1.980 0 - 2.000 0) g/cm3
1.999 0
2(7)=14.07<𝜒2𝑜𝑏𝑠
= 15.01 The consistency test fails: procedure B
2(7)=14.07>𝜒2𝑜𝑏𝑠
= (7.41; 6.18) The consistency test doesn't fail: procedure A
Pr 2(ν)>𝜒2𝑜𝑏𝑠
} <0,05 ?
Djni x10-6
U l(Djni ) x10-6
U r(Djni ) x10-6
U (Djni ) x10-6
Djni x10-6
U (Djni ) x10-6
Djni x10-6
U (Djni ) x10-6
∆jnk x10-6
U (∆jnk) x10-6
INRiM -29 40 36 40 -1 36 -2 36 -11 44
NMIA -8 28 24 27 -19 22 -13 22 -13 27
CENAM -1 49 47 46 -13 52 -4 52 -6 46
NIST 61 101 113 110 48 113 79 113 63 111
LNE -24 37 33 38 -16 34 -4 34 -15 39
GUM -12 36 29 33 7 32 8 32 1 36
MKEH 41 37 37 39 18 31 -11 31 16 49
PTB 30 34 36 38 25 32 27 32 27 38
1.980 0 - 2.000 0 1.990 0 1.999 01.981 0NMI (n )
g cm-3
mark (i )/range (k )
Appendix A1 – Petal B
CCM.D-K4 “Hydrometers” Page 42 of 45
Figure B.4. Degree of equivalence with respect to the KCRV of each laboratory of the petal identified by the hydrometer 9346688. The lengths of the bars show the
uncertainty or coverage interval of the degree of equivalence related to each calibrated mark and of their average.
Appendix A1 – Petal B
CCM.D-K4 “Hydrometers” Page 43 of 45
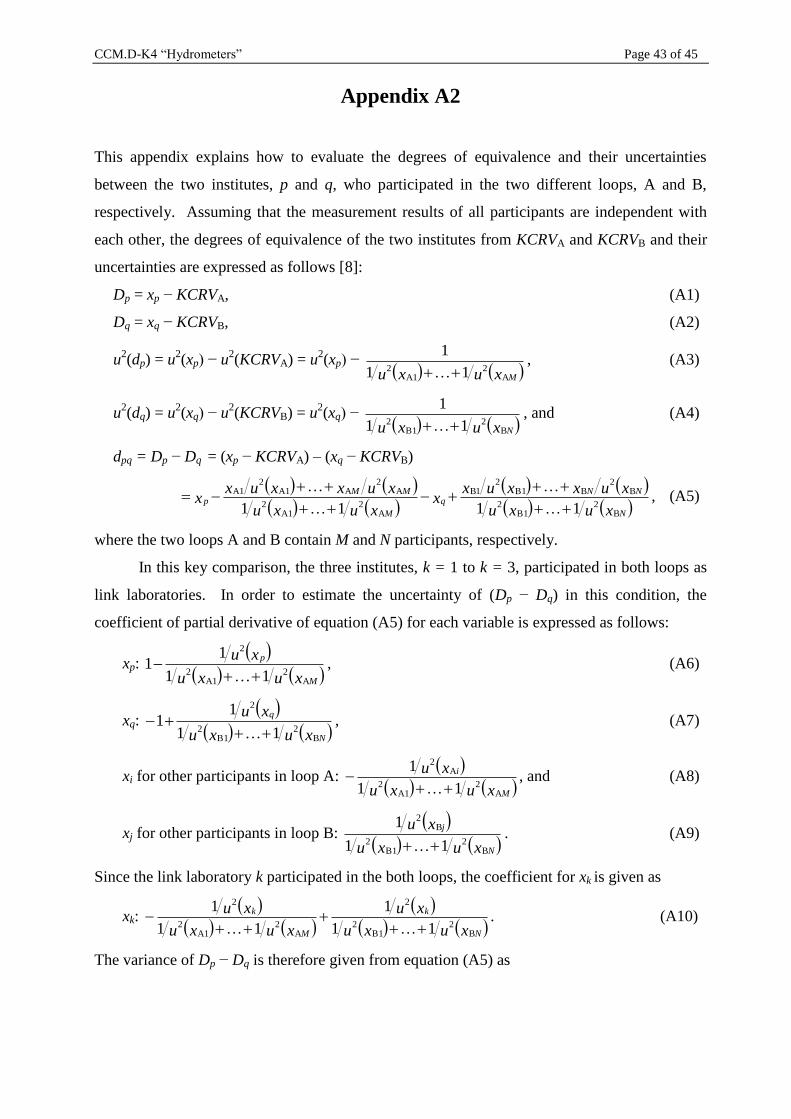
Appendix A2
This appendix explains how to evaluate the degrees of equivalence and their uncertainties
between the two institutes, p and q, who participated in the two different loops, A and B,
respectively. Assuming that the measurement results of all participants are independent with
each other, the degrees of equivalence of the two institutes from KCRVA and KCRVB and their
uncertainties are expressed as follows [8]:
Dp = xp − KCRVA, (A1)
Dq = xq − KCRVB, (A2)
u2(dp) = u
2(xp) − u
2(KCRVA) = u
2(xp) −
xuxu MA2
A12 11
1
, (A3)
u2(dq) = u
2(xq) − u
2(KCRVB) = u
2(xq) −
xuxu NB2
B12 11
1
, and (A4)
dpq = Dp − Dq = (xp − KCRVA) – (xq − KCRVB)
xuxu
xuxxuxx
xuxu
xuxxuxx
N
NNq
M
MMp
B2
B12
B2
BB12
1B
A2
A12
A2
AA12
1A
1111
, (A5)
where the two loops A and B contain M and N participants, respectively.
In this key comparison, the three institutes, k = 1 to k = 3, participated in both loops as
link laboratories. In order to estimate the uncertainty of (Dp − Dq) in this condition, the
coefficient of partial derivative of equation (A5) for each variable is expressed as follows:
xp:
xuxu
xu
M
p
A2
A12
2
11
11
, (A6)
xq:
xuxu
xu
N
q
B2
B12
2
11
11
, (A7)
xi for other participants in loop A:
xuxu
xu
M
i
A2
A12
A2
11
1
, and (A8)
xj for other participants in loop B:
xuxu
xu
N
j
B2
B12
B2
11
1
. (A9)
Since the link laboratory k participated in the both loops, the coefficient for xk is given as
xk:
xuxu
xu
xuxu
xu
N
k
M
k
B2
B12
2
A2
A12
2
11
1
11
1
. (A10)
The variance of Dp − Dq is therefore given from equation (A5) as
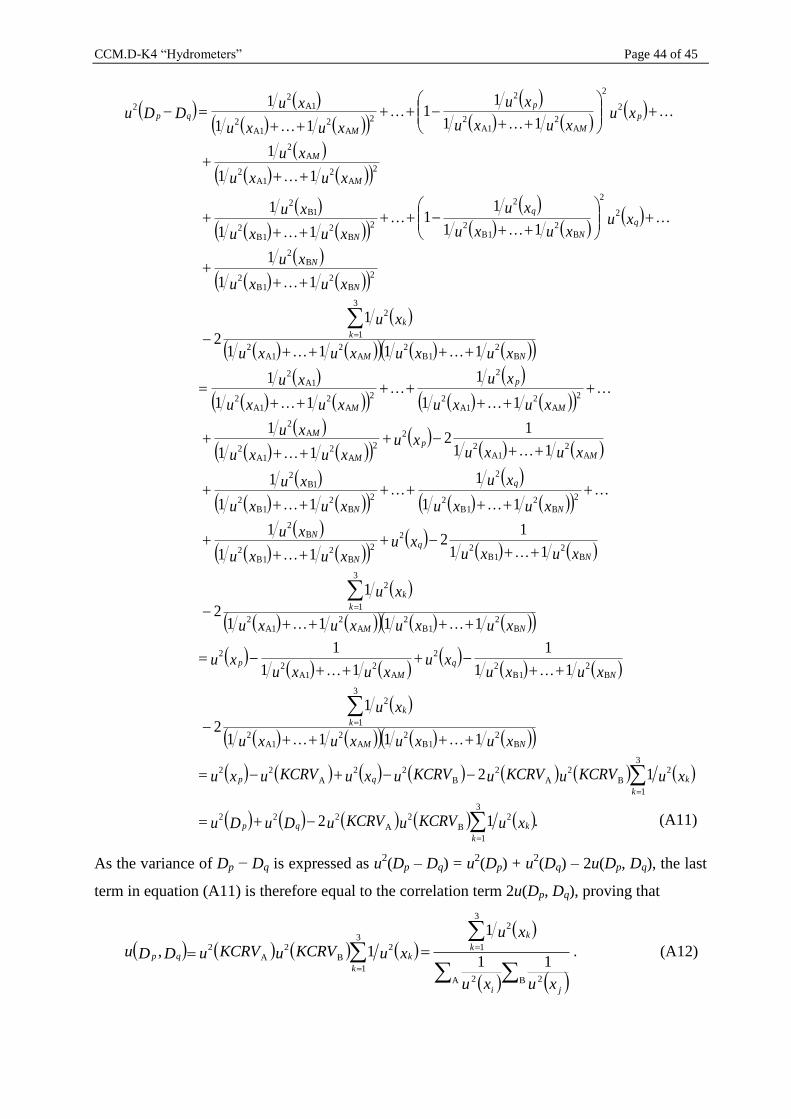
CCM.D-K4 “Hydrometers” Page 44 of 45
.12
12
1111
1
2
11
1
11
1
1111
1
2
11
12
11
1
11
1
11
1
11
12
11
1
11
1
11
1
1111
1
2
11
1
11
11
11
1
11
1
11
11
11
1
3
1
2B
2A
222
3
1
2B
2A
2B
22A
22
B2
B12
A2
A12
3
1
2
B2
B12
2
A2
A12
2
B2
B12
A2
A12
3
1
2
B2
B12
2
2
B2
B12
B2
2
B2
B12
2
2
B2
B12
1B2
A2
A12
2
2
A2
A12
A2
2
A2
A12
2
2
A2
A12
1A2
B2
B12
A2
A12
3
1
2
2
B2
B12
B2
2
2
B2
B12
2
2
B2
B12
1B2
2
A2
A12
A2
2
2
A2
A12
2
2
A2
A12
1A2
2
k
kqp
k
kqp
NM
k
k
N
q
M
p
NM
k
k
N
q
N
N
N
q
N
M
p
M
M
M
p
M
NM
k
k
N
N
q
N
q
N
M
M
p
M
p
M
qp
xuKCRVuKCRVuDuDu
xuKCRVuKCRVuKCRVuxuKCRVuxu
xuxuxuxu
xu
xuxuxu
xuxuxu
xuxuxuxu
xu
xuxuxu
xuxu
xu
xuxu
xu
xuxu
xu
xuxuxu
xuxu
xu
xuxu
xu
xuxu
xu
xuxuxuxu
xu
xuxu
xu
xuxuxu
xu
xuxu
xu
xuxu
xu
xuxuxu
xu
xuxu
xuDDu
As the variance of Dp − Dq is expressed as u2(Dp – Dq) = u
2(Dp) + u
2(Dq) – 2u(Dp, Dq), the last
term in equation (A11) is therefore equal to the correlation term 2u(Dp, Dq), proving that
B 2A 2
3
1
2
3
1
2B
2A
2
11
1
1,
ji
k
k
k
kqp
xuxu
xu
xuKCRVuKCRVuDDu . (A12)
(A11)