ccoouunnttyy ppaallmm bbeeaacchh
TRANSCRIPT

PALM BEACHPALM BEACHCOUNTYCOUNTY
Residential HousingResidential Housing
Market UpdateMarket Update
Year End 2020Year End 2020
Chris & Amy LosquadroQuantum Realty Advisors, Inc.
www.QuantumRealtyAdvisors.com
Brokerage ● Asset Management ● Advisory
Chris Losquadro, MBA, CPRES
Managing Director / Broker
4440 PGA Boulevard, Suite 308
Palm Beach Gardens, FL 33410
Direct: (561) 624-2680
Email: [email protected]
www.QuantumRealtyAdvisors.com
Dear valued clients, colleagues and friends:
As we close the book on 2020, many real estate industry observers will look back at the
housing market data and see the historic volatility that took place during the year. While a
number of major markets have not recovered to pre-pandemic levels, Palm Beach County is
experiencing housing activity at a level not seen in more than a decade.
Within this update you will find the year-end 2020 housing market information for Palm
Beach County. This includes detailed countywide and city level market statistics for sale
transactions of both single-family homes and condominium / townhouse properties.
The local market started out strong with the number of single-family sale transactions in
January 2020 up by more than 29%. When the market turned at the onset of the COVID
pandemic, April and May saw single-family sale transactions decline by more than 30% and
45% (year-over-year), respectively.
At the end of the third quarter, the market started to change in a meaningful way. Due to pent
up demand as well as in-migration from out-of-state buyers, the month of September marked a
substantial turnaround with monthly sale transactions increasing by more than 20% year-over-
year. That trend has continued throughout the entire fourth quarter as the number of housing
transactions across all types of homes have exceeded their 2019 results.
With the rollout of a COVID vaccine and the possibility of an improving economic
environment, it’s anticipated that these sales trends will continue during 2021. It should be
noted, however, that the current inventory level is extraordinarily low. While this can derail the
continued gain in the number of sales transactions, it will maintain the growth in home values
(barring any significant outlying events).
Thank you for allowing us to continue to service your real estate needs. If you have any
questions on the market data, Amy and I would be very happy to discuss.
Sincerely,
Chris Losquadro
Contents
• About Quantum
• Our Services
• Strategic Partners and Institutional Clients
• Featured Recent Transactions
• State of Florida - Monthly Market Detail for Single-Family
Homes (Year End 2020)
• State of Florida - Monthly Market Detail for Condominiums /
Townhomes (Year End 2020)
• Palm Beach County - Monthly Market Detail for Single-Family
Homes (Year End 2020)
• Palm Beach County - Monthly Market Detail for
Condominiums / Townhomes (Year End 2020)
• Boca Raton - Local Market Update (Year End 2020)
• Boynton Beach - Local Market Update (Year End 2020)
• Delray Beach - Local Market Update (Year End 2020)
• Jupiter - Local Market Update (Year End 2020)
• Lake Worth Beach - Local Market Update (Year End 2020)
• Palm Beach - Local Market Update (Year End 2020)
• Palm Beach Gardens - Local Market Update (Year End 2020)
• Wellington - Local Market Update (Year End 2020)
• West Palm Beach - Local Market Update (Year End 2020)

About Us
Quantum Realty Advisors, Inc. (Quantum) is a full service, family-owned real estate brokerage, asset
management and advisory firm. Since 1998 Quantum has been providing high quality real estate services to
our clients and strategic partners. We specialize in working with attorneys, accountants, asset management
institutions, investment firms and financial institutions in assisting with the real estate needs of their
organization or their clients.
The company was founded by Chris Losquadro who has been in the institutional real
estate industry for more than 25 years. Prior to founding Quantum Realty Advisors, Inc.,
Chris was the Director of Real Estate Asset Management for Capital Asset Research
Corporation, an affiliated company of MBIA, Inc. Before joining Capital Asset, Chris was
an REO Asset Manager for Ocwen Financial Corporation where he performed workouts
and REO disposition of the company's most troubled mortgages and real estate owned
properties.
He has performed real estate services for some of the world’s leading institutions including
John Hancock Real Estate, IBERIABANK, Boston Capital Corporation, PNC Real Estate, Lend Lease Real
Estate Investments, KeyBank and LNR Property Corporation.
Chris holds a Bachelor's of Business Administration (BBA) and a Master's of Business Administration
(MBA) from Florida Atlantic University in Boca Raton, Florida. He has been a licensed real estate broker in
the State of Florida since 1997 and holds the Certified Probate Real Estate Specialists (CPRES) & Certified
Distressed Property Expert (CDPE) designations. Chris is also a member of the state and national Realtor
associations, serves on the Board of Directors of the Palm Beach County Estate Planning Council and the East
Coast Estate Planning Council and is a member of the Palm Beach Tax Institute.
Amy Losquadro leads our team’s Residential & Luxury Home Division and is responsible
for the day-to-day marketing and management of all locally assigned residential and
conventional residential real estate listings. Amy has been in the real estate business since
the 1990's, and has personally completed more than $140,000,000 in transactions. She is
recognized as one of the top real estate agents in the northern Palm Beaches and is a 5-Star
rated agent on Zillow.com.
In addition to representing traditional buyers and sellers, Amy has sold hundreds of
properties for the Federal Home Loan Mortgage Corporation ("Freddie Mac"), JP Morgan
Chase, Sabadell United Bank/IBERIABANK, Bank of America, the Federal Deposit Insurance Corporation
and NationStar Mortgage Corporation.
Amy holds a Bachelor's of Science (BS) from Florida State University in Tallahassee, Florida and has
completed coursework for her Master's of Business Administration (MBA) from Florida Atlantic
University. She is a licensed real estate salesperson in the State of Florida and serves as the Vice-Chairperson
for the foundation of the Women’s Chamber of Commerce of Palm Beach County.

Our Services
Quantum Realty Advisors, Inc. (Quantum) is more than just a traditional real
estate company. Since 1998 our firm has been driven by long-term relationships
and we are proud to state that more than 90% of our business comes from repeat
clients or referrals from existing clients and strategic partners.
We are different from the traditional real estate brokerage company as Quantum
specializes in working with attorneys, accountants, asset management companies,
professional advisors, investment firms and financial institutions with the real
estate needs of their organization or their clients.
Inherited Property and Probate Real Estate
Residential & Luxury Home Sales
Corporate and Business Real Estate
Charitable Gifting of Real Estate
We are committed to changing your expectations of a real estate professional and
operate by one simple principle:
To do what’s right by our clients and strategic partners
With this principle in mind, we are creating a better client experience, providing
the kind of service you may have thought did not exist in the real estate industry.
Learn more about how we can assist you at: www.QuantumRealtyAdvisors.com.

Strategic Partners and Institutional Clients
Chris and Amy Losquadro of Quantum Realty Advisors, Inc. have received recent
property assignments, referrals or worked with clients of behalf of the following firms
and institutions:
• Boyes, Farina & Matwiczyk
• Barner and Barner
• Comiter, Singer, Baseman and Braun
• Downey and McElroy
• Sally Benson, P.A.
• Jones Foster
• KeyBank Private Bank
• Fields and Bachove
• Ceil Schneider Randell P.A.
• VirtualBank Senior Lending
• Haile, Shaw & Pfaffenberger
• IBERIABANK / First Horizon Bank
• Law Offices of Kyle Felty
• Millman Law Group
• Cutter, Chaves, Jospher, Rubin, Forman, Fleisher, Miller PA
• Cohen, Norris, Wolmer, Ray, Telepman & Cohen
• The Fuoco Group
• Hired Hearts
• Nationstar Mortgage Corporation
• The Law Office of Paul Krasker

Featured Recent Transactions
Produced by Florida Realtors® with data provided by Florida's multiple listing services. Statistics for each month compiled from MLS feeds on the 15th day of the following month.
Data released on Friday, January 22, 2021. Next data release is Friday, February 19, 2021.
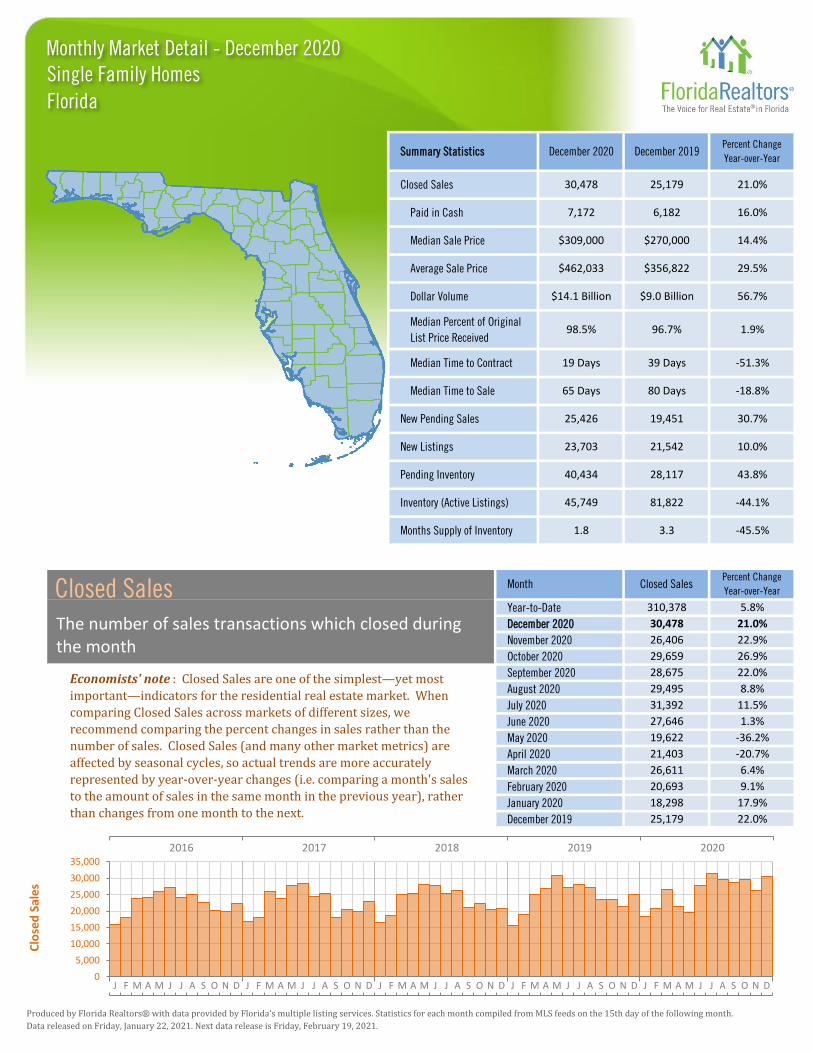
Year-to-Date 310,378 5.8%
21.0%
21,542 10.0%
Closed Sales
30,478
80 Days
28,117 43.8%
81,822 -44.1%
3.3 -45.5%
Summary Statistics
Closed Sales
Paid in Cash
98.5%
December 2020
$309,000Median Sale Price
Average Sale Price
Dollar Volume
Median Percent of Original
List Price Received
$270,000 14.4%
$14.1 Billion $9.0 Billion 56.7%
$462,033 $356,822 29.5%
December 2019Percent Change
Year-over-Year
7,172 6,182 16.0%
30,478 25,179 21.0%
96.7% 1.9%
19 Days 39 Days -51.3%
December 2020
Median Time to Contract
65 Days
25,426
Median Time to Sale
New Pending Sales
New Listings
Month
23,703
Pending Inventory 40,434
Inventory (Active Listings) 45,749
Months Supply of Inventory 1.8
-18.8%
19,451 30.7%
Percent Change
Year-over-Year
18,298
December 2019 25,179
May 2020 19,622
April 2020 21,403
August 2020 29,495
July 2020 31,392
June 2020 27,646
Economists' note : Closed Sales are one of the simplest—yet most
important—indicators for the residential real estate market. When
comparing Closed Sales across markets of different sizes, we
recommend comparing the percent changes in sales rather than the
number of sales. Closed Sales (and many other market metrics) are
affected by seasonal cycles, so actual trends are more accurately
represented by year-over-year changes (i.e. comparing a month's sales
to the amount of sales in the same month in the previous year), rather
than changes from one month to the next.
November 2020 26,406 22.9%
26.9%
22.0%
October 2020 29,659
September 2020 28,675
22.0%
March 2020 26,611
February 2020 20,693
6.4%
9.1%
17.9%
8.8%
11.5%
-36.2%
-20.7%
1.3%
January 2020
2016 2017 2018 2019 2020
J F M A M J J A S O N D J F M A M J J A S O N D J F M A M J J A S O N D J F M A M J J A S O N D J F M A M J J A S O N D
Monthly Market Detail - December 2020
Florida
Single Family Homes
Closed SalesThe number of sales transactions which closed duringthe month
0
5,000
10,000
15,000
20,000
25,000
30,000
35,000
Clo
sed
Sal
es

Produced by Florida Realtors® with data provided by Florida's multiple listing services. Statistics for each month compiled from MLS feeds on the 15th day of the following month.
Data released on Friday, January 22, 2021. Next data release is Friday, February 19, 2021.
September 2020
Month Cash SalesPercent Change
Year-over-Year
December 2020 7,172 16.0%
November 2020 6,038 14.8%
October 2020 6,584 13.6%
Year-to-Date 68,322 -4.3%
6,351 0.5%
6,175 12.7%
August 2020 6,084 -2.7%
May 2020 3,771 -47.1%
July 2020 6,161 -3.6%
June 2020 5,241 -14.4%
December 2020 23.5% -4.5%
November 2020 22.9% -6.5%
October 2020 22.2% -10.5%
September 2020 21.5% -7.7%
0.4%
August 2020 20.6% -10.8%
July 2020 19.6% -13.7%
June 2020 19.0% -15.2%
May 2020 19.2% -17.2%
April 2020 18.5% -25.7%
Economists' note : This statistic is simply another way of viewing
Cash Sales. The remaining percentages of Closed Sales (i.e. those not
paid fully in cash) each month involved some sort of financing, such as
mortgages, owner/seller financing, assumed loans, etc.
Economists' note : Cash Sales can be a useful indicator of the extent to
which investors are participating in the market. Why? Investors are
far more likely to have the funds to purchase a home available up front,
whereas the typical homebuyer requires a mortgage or some other
form of financing. There are, of course, many possible exceptions, so
this statistic should be interpreted with care.
Year-to-Date 22.0% -9.5%
MonthPercent of Closed
Sales Paid in Cash
Percent Change
Year-over-Year
January 2020 27.8% -5.1%
December 2019
December 2019 6,182 19.3%
February 2020
24.6% -2.0%
March 2020 23.9%
April 2020 3,955 -41.1%
March 2020
5,703 9.5%
January 2020 5,087 11.7%
-5.5%
February 2020 27.6%
J F M A M J J A S O N D J F M A M J J A S O N D J F M A M J J A S O N D J F M A M J J A S O N D J F M A M J J A S O N D
J F M A M J J A S O N D J F M A M J J A S O N D J F M A M J J A S O N D J F M A M J J A S O N D J F M A M J J A S O N D
0%
10%
20%
30%
40%
Pct
. of
Clo
sed
Sal
es
Pai
d in
Cas
h
0
2,000
4,000
6,000
8,000
Cas
h S
ale
s
Monthly Market Detail - December 2020
2016 2017 2018 2019 2020
Florida
Single Family Homes
Cash SalesThe number of Closed Sales during the month in whichbuyers exclusively paid in cash
2016 2017 2018 2019 2020
Cash Sales as a Percentage of Closed SalesThe percentage of Closed Sales during the monthwhich were Cash Sales

Produced by Florida Realtors® with data provided by Florida's multiple listing services. Statistics for each month compiled from MLS feeds on the 15th day of the following month.
Data released on Friday, January 22, 2021. Next data release is Friday, February 19, 2021.
Month Median Sale PricePercent Change
Year-over-Year
December 2020 $309,000 14.4%
Year-to-Date $290,000 9.6%
May 2020 $270,000 1.5%
November 2020 $305,000 14.1%
October 2020 $305,000 15.6%
July 2020 $295,000 10.1%
June 2020 $282,000 4.4%
September 2020 $300,000 13.2%
August 2020 $300,000 13.2%
April 2020 $275,000 6.0%
March 2020 $275,000 7.4%
February 2020 $270,000 8.0%
January 2020 $265,000 6.0%
December 2019 $270,000 5.9%
Month Average Sale PricePercent Change
Year-over-Year
December 2020 $462,033 29.5%
November 2020 $432,768 25.9%
October 2020 $428,597 27.2%
September 2020 $418,092 23.0%
7.9%
August 2020 $414,446 22.3%
July 2020 $409,257 14.9%
June 2020 $384,406 8.8%
May 2020 $353,819 -0.3%
April 2020 $362,734 3.0%
15.8%$401,478Year-to-Date
Economists' note : Median Sale Price is our preferred summary
statistic for price activity because, unlike Average Sale Price, Median
Sale Price is not sensitive to high sale prices for small numbers of
homes that may not be characteristic of the market area. Keep in mind
that median price trends over time are not always solely caused by
changes in the general value of local real estate. Median sale price only
reflects the values of the homes that sold each month, and the mix of
the types of homes that sell can change over time.
Economists' note : Usually, we prefer Median Sale Price over Average
Sale Price as a summary statistic for home prices. However, Average
Sale Price does have its uses—particularly when it is analyzed
alongside the Median Sale Price. For one, the relative difference
between the two statistics can provide some insight into the market for
higher-end homes in an area.January 2020 $361,821 6.3%
December 2019 $356,822 7.5%
March 2020 $371,531 8.9%
February 2020 $361,839
J F M A M J J A S O N D J F M A M J J A S O N D J F M A M J J A S O N D J F M A M J J A S O N D J F M A M J J A S O N D
J F M A M J J A S O N D J F M A M J J A S O N D J F M A M J J A S O N D J F M A M J J A S O N D J F M A M J J A S O N D
$0K
$100K
$200K
$300K
$400K
$500K
Ave
rage
Sal
e P
rice
$0K
$50K
$100K
$150K
$200K
$250K
$300K
$350K
Me
dia
n S
ale
Pri
ce
Monthly Market Detail - December 2020
2016 2017 2018 2019 2020
Florida
Single Family Homes
Median Sale PriceThe median sale price reported for the month (i.e. 50% of sales were above and 50% of sales were below)
2016 2017 2018 2019 2020
Average Sale PriceThe average sale price reported for the month (i.e. total sales in dollars divided by the number of sales)
Produced by Florida Realtors® with data provided by Florida's multiple listing services. Statistics for each month compiled from MLS feeds on the 15th day of the following month.
Data released on Friday, January 22, 2021. Next data release is Friday, February 19, 2021.
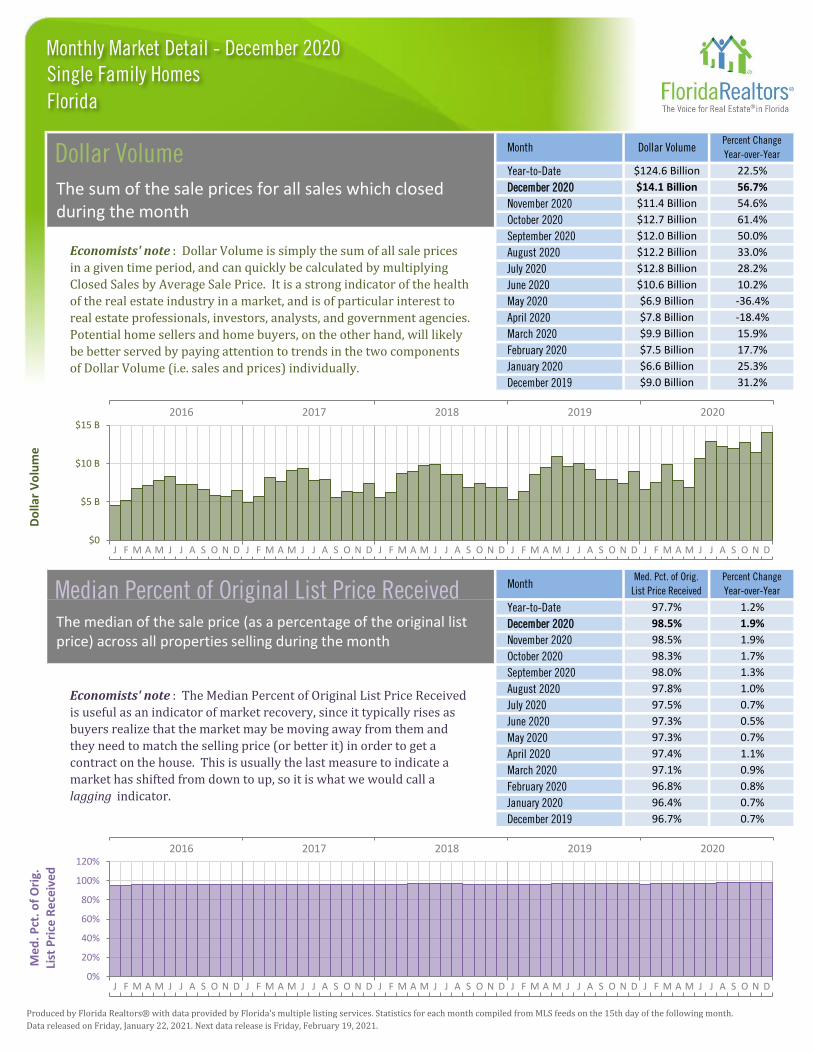
Month Dollar VolumePercent Change
Year-over-Year
December 2020 $14.1 Billion 56.7%
Year-to-Date $124.6 Billion 22.5%
-36.4%
November 2020 $11.4 Billion 54.6%
October 2020 $12.7 Billion 61.4%
$9.9 Billion 15.9%
September 2020 $12.0 Billion 50.0%
August 2020 $12.2 Billion 33.0%
July 2020 $12.8 Billion 28.2%
June 2020 $10.6 Billion 10.2%
May 2020 $6.9 Billion
December 2020 98.5% 1.9%
November 2020 98.5% 1.9%
October 2020 98.3% 1.7%
September 2020 98.0% 1.3%
0.8%
August 2020 97.8% 1.0%
July 2020 97.5% 0.7%
June 2020 97.3% 0.5%
May 2020 97.3% 0.7%
April 2020 97.4% 1.1%
Economists' note : The Median Percent of Original List Price Received
is useful as an indicator of market recovery, since it typically rises as
buyers realize that the market may be moving away from them and
they need to match the selling price (or better it) in order to get a
contract on the house. This is usually the last measure to indicate a
market has shifted from down to up, so it is what we would call a
lagging indicator.
Economists' note : Dollar Volume is simply the sum of all sale prices
in a given time period, and can quickly be calculated by multiplying
Closed Sales by Average Sale Price. It is a strong indicator of the health
of the real estate industry in a market, and is of particular interest to
real estate professionals, investors, analysts, and government agencies.
Potential home sellers and home buyers, on the other hand, will likely
be better served by paying attention to trends in the two components
of Dollar Volume (i.e. sales and prices) individually.
1.2%97.7%Year-to-Date
MonthMed. Pct. of Orig.
List Price Received
Percent Change
Year-over-Year
January 2020 96.4% 0.7%
December 2019
December 2019 $9.0 Billion 31.2%
February 2020
96.7% 0.7%
March 2020 97.1%
April 2020 $7.8 Billion -18.4%
March 2020
$7.5 Billion 17.7%
January 2020 $6.6 Billion 25.3%
0.9%
February 2020 96.8%
J F M A M J J A S O N D J F M A M J J A S O N D J F M A M J J A S O N D J F M A M J J A S O N D J F M A M J J A S O N D
J F M A M J J A S O N D J F M A M J J A S O N D J F M A M J J A S O N D J F M A M J J A S O N D J F M A M J J A S O N D
0%
20%
40%
60%
80%
100%
120%
Me
d. P
ct. o
f O
rig.
Li
st P
rice
Re
ceiv
ed
$0
$5 B
$10 B
$15 B
Do
llar
Vo
lum
e
Monthly Market Detail - December 2020
2016 2017 2018 2019 2020
Florida
Single Family Homes
Dollar VolumeThe sum of the sale prices for all sales which closed during the month
2016 2017 2018 2019 2020
Median Percent of Original List Price ReceivedThe median of the sale price (as a percentage of the original list price) across all properties selling during the month

Produced by Florida Realtors® with data provided by Florida's multiple listing services. Statistics for each month compiled from MLS feeds on the 15th day of the following month.
Data released on Friday, January 22, 2021. Next data release is Friday, February 19, 2021.
21 Days -47.5%
September 2020 23 Days -41.0%
April 2020 28 Days -34.9%
MonthMedian Time to
Contract
Percent Change
Year-over-Year
December 2020 19 Days -51.3%
31 Days -26.2%Year-to-Date
November 2020 19 Days -50.0%
October 2020
June 2020 43 Days 10.3%
May 2020 32 Days -22.0%
August 2020 29 Days -21.6%
July 2020 38 Days 0.0%
38 Days -22.4%
February 2020 49 Days -9.3%
March 2020
January 2020 44 Days -12.0%
December 2019 39 Days -9.3%
Month Median Time to SalePercent Change
Year-over-Year
December 2020 65 Days -18.8%
-10.7%75 DaysYear-to-Date
November 2020 64 Days -21.0%
October 2020 67 Days -18.3%
-11.0%
September 2020 68 Days -17.1%
August 2020 73 Days -6.4%
July 2020 82 Days 2.5%
June 2020 88 Days 7.3%
May 2020 76 Days -9.5%
December 2019 80 Days -4.8%
Economists' note : Time to Sale is a measure of the length of the home
selling process, calculated as the number of days between the initial
listing of a property and the closing of the sale. Median Time to Sale is
the amount of time the "middle" property selling this month was on
the market. That is, 50% of homes selling this month took less time to
sell, and 50% of homes took more time to sell. Median Time to Sale
gives a more accurate picture than Average Time to Sale, which can be
skewed upward by small numbers of properties taking an abnormally
long time to sell.
Economists' note : Like Time to Sale, Time to Contract is a measure of
the length of the home selling process calculated for sales which closed
during the month. The difference is that Time to Contract measures
the number of days between the initial listing of a property and the
signing of the contract which eventually led to the closing of the sale.
When the gap between Median Time to Contract and Median Time to
Sale grows, it is usually a sign of longer closing times and/or declining
numbers of cash sales.
February 2020 92 Days -5.2%
January 2020 88 Days -5.4%
April 2020 73 Days -13.1%
March 2020 81 Days
J F M A M J J A S O N D J F M A M J J A S O N D J F M A M J J A S O N D J F M A M J J A S O N D J F M A M J J A S O N D
J F M A M J J A S O N D J F M A M J J A S O N D J F M A M J J A S O N D J F M A M J J A S O N D J F M A M J J A S O N D0
20
40
60
80
100
120
Me
dia
n T
ime
to
Sa
le
0
10
20
30
40
50
60
Me
dia
n T
ime
to
C
on
trac
tMonthly Market Detail - December 2020
2016 2017 2018 2019 2020
Florida
Single Family Homes
Median Time to ContractThe median number of days between the listing date and contract date for all Closed Sales during the month
2016 2017 2018 2019 2020
Median Time to SaleThe median number of days between the listing date and closing date for all Closed Sales during the month
Produced by Florida Realtors® with data provided by Florida's multiple listing services. Statistics for each month compiled from MLS feeds on the 15th day of the following month.
Data released on Friday, January 22, 2021. Next data release is Friday, February 19, 2021.
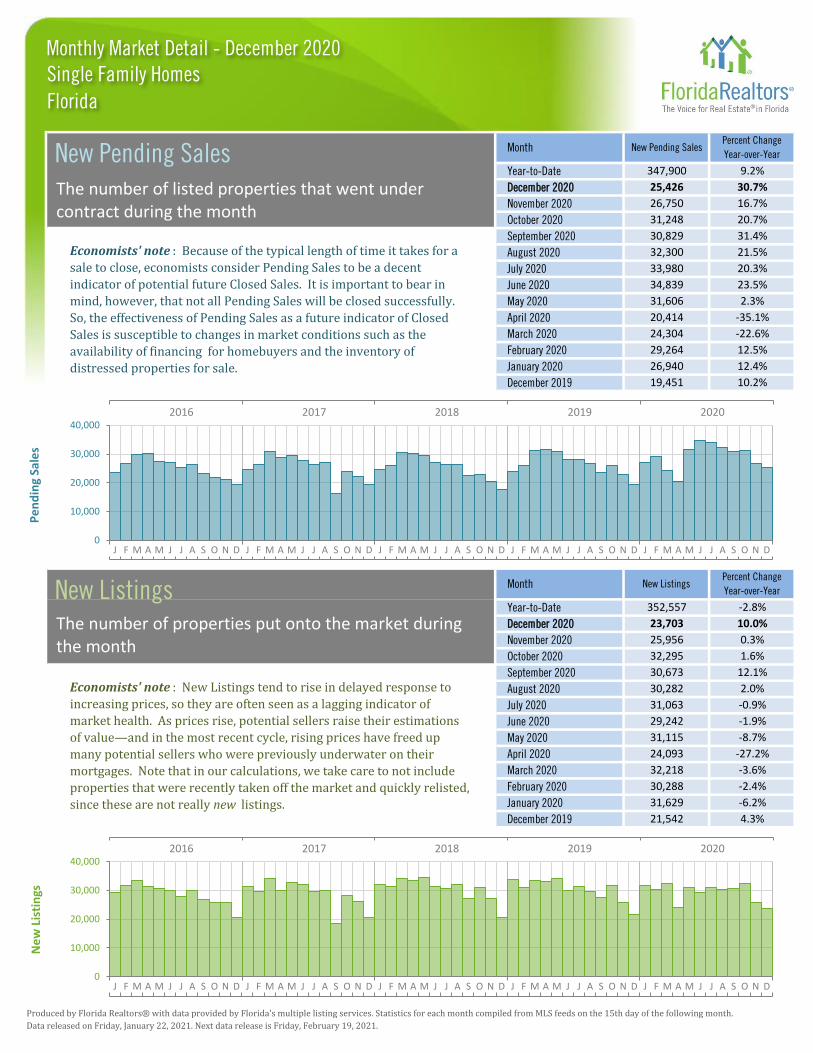
Economists' note : New Listings tend to rise in delayed response to
increasing prices, so they are often seen as a lagging indicator of
market health. As prices rise, potential sellers raise their estimations
of value—and in the most recent cycle, rising prices have freed up
many potential sellers who were previously underwater on their
mortgages. Note that in our calculations, we take care to not include
properties that were recently taken off the market and quickly relisted,
since these are not really new listings.
Economists' note : Because of the typical length of time it takes for a
sale to close, economists consider Pending Sales to be a decent
indicator of potential future Closed Sales. It is important to bear in
mind, however, that not all Pending Sales will be closed successfully.
So, the effectiveness of Pending Sales as a future indicator of Closed
Sales is susceptible to changes in market conditions such as the
availability of financing for homebuyers and the inventory of
distressed properties for sale.
Month New Pending SalesPercent Change
Year-over-Year
December 2020 25,426 30.7%
Year-to-Date 347,900 9.2%
May 2020 31,606 2.3%
November 2020 26,750 16.7%
October 2020 31,248 20.7%
July 2020 33,980 20.3%
June 2020 34,839 23.5%
September 2020 30,829 31.4%
August 2020 32,300 21.5%
April 2020 20,414 -35.1%
March 2020 24,304 -22.6%
February 2020 29,264 12.5%
January 2020 26,940 12.4%
December 2019 19,451 10.2%
Month New ListingsPercent Change
Year-over-Year
December 2020 23,703 10.0%
November 2020 25,956 0.3%
October 2020 32,295 1.6%
September 2020 30,673 12.1%
31,115 -8.7%
April 2020 24,093 -27.2%
December 2019 21,542 4.3%
March 2020 32,218 -3.6%
February 2020 30,288 -2.4%
Year-to-Date 352,557 -2.8%
January 2020 31,629 -6.2%
August 2020 30,282 2.0%
July 2020 31,063 -0.9%
June 2020 29,242 -1.9%
May 2020
J F M A M J J A S O N D J F M A M J J A S O N D J F M A M J J A S O N D J F M A M J J A S O N D J F M A M J J A S O N D
J F M A M J J A S O N D J F M A M J J A S O N D J F M A M J J A S O N D J F M A M J J A S O N D J F M A M J J A S O N D
0
10,000
20,000
30,000
40,000
Ne
w L
isti
ngs
0
10,000
20,000
30,000
40,000
Pe
nd
ing
Sale
s
Monthly Market Detail - December 2020
2016 2017 2018 2019 2020
Florida
Single Family Homes
New Pending SalesThe number of listed properties that went under contract during the month
2016 2017 2018 2019 2020
New ListingsThe number of properties put onto the market during the month
Produced by Florida Realtors® with data provided by Florida's multiple listing services. Statistics for each month compiled from MLS feeds on the 15th day of the following month.
Data released on Friday, January 22, 2021. Next data release is Friday, February 19, 2021.
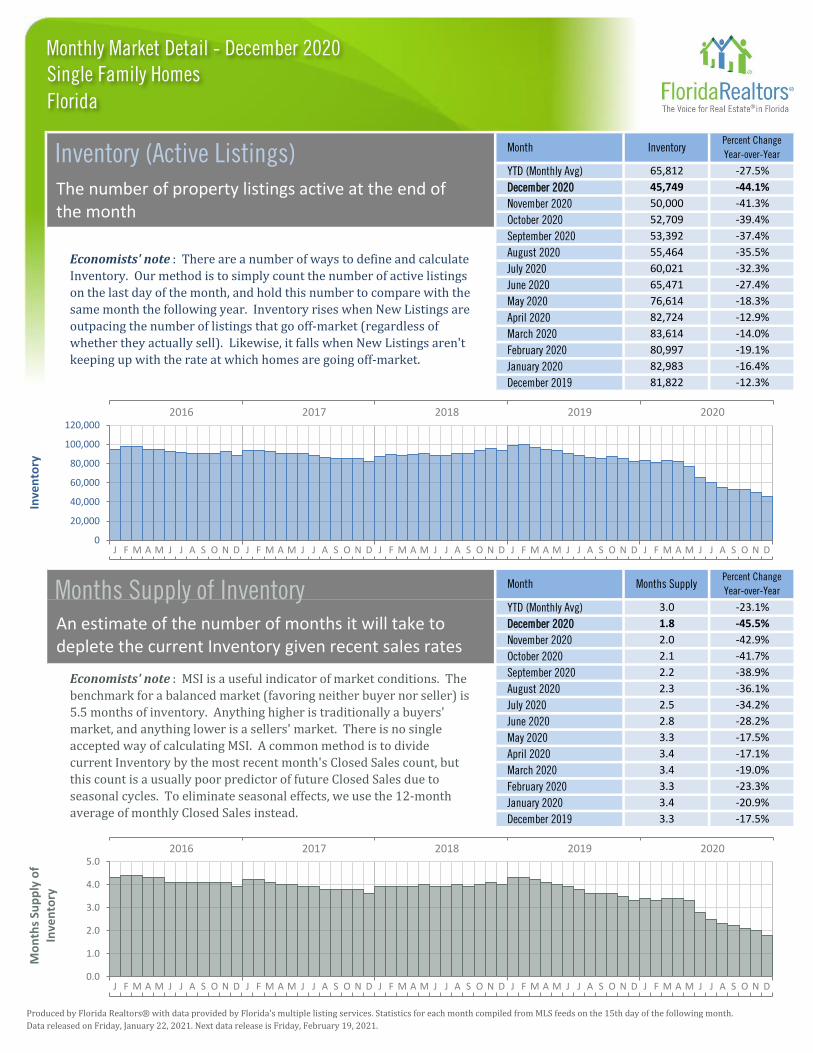
Economists' note : There are a number of ways to define and calculate
Inventory. Our method is to simply count the number of active listings
on the last day of the month, and hold this number to compare with the
same month the following year. Inventory rises when New Listings are
outpacing the number of listings that go off-market (regardless of
whether they actually sell). Likewise, it falls when New Listings aren't
keeping up with the rate at which homes are going off-market.
Economists' note : MSI is a useful indicator of market conditions. The
benchmark for a balanced market (favoring neither buyer nor seller) is
5.5 months of inventory. Anything higher is traditionally a buyers'
market, and anything lower is a sellers' market. There is no single
accepted way of calculating MSI. A common method is to divide
current Inventory by the most recent month's Closed Sales count, but
this count is a usually poor predictor of future Closed Sales due to
seasonal cycles. To eliminate seasonal effects, we use the 12-month
average of monthly Closed Sales instead.
YTD (Monthly Avg) 3.0 -23.1%
Month Months SupplyPercent Change
Year-over-Year
December 2019 3.3 -17.5%
February 2020 3.3 -23.3%
January 2020 3.4
December 2019 81,822 -12.3%
February 2020 80,997 -19.1%
January 2020 82,983 -16.4%
-20.9%
April 2020 3.4 -17.1%
March 2020 3.4 -19.0%
June 2020 2.8 -28.2%
May 2020 3.3 -17.5%
August 2020 2.3 -36.1%
July 2020 2.5 -34.2%
October 2020 2.1 -41.7%
September 2020 2.2 -38.9%
December 2020 1.8 -45.5%
November 2020 2.0 -42.9%
83,614 -14.0%
June 2020 65,471 -27.4%
May 2020 76,614 -18.3%
April 2020 82,724 -12.9%
March 2020
-37.4%
August 2020 55,464 -35.5%
July 2020 60,021 -32.3%
September 2020 53,392
Month InventoryPercent Change
Year-over-Year
December 2020 45,749 -44.1%
65,812 -27.5%YTD (Monthly Avg)
November 2020 50,000 -41.3%
October 2020 52,709 -39.4%
J F M A M J J A S O N D J F M A M J J A S O N D J F M A M J J A S O N D J F M A M J J A S O N D J F M A M J J A S O N D
J F M A M J J A S O N D J F M A M J J A S O N D J F M A M J J A S O N D J F M A M J J A S O N D J F M A M J J A S O N D
0.0
1.0
2.0
3.0
4.0
5.0
Mo
nth
s Su
pp
ly o
f In
ven
tory
0
20,000
40,000
60,000
80,000
100,000
120,000
Inve
nto
ry
Monthly Market Detail - December 2020
2016 2017 2018 2019 2020
Florida
Single Family Homes
Inventory (Active Listings)The number of property listings active at the end of the month
2016 2017 2018 2019 2020
Months Supply of InventoryAn estimate of the number of months it will take to deplete the current Inventory given recent sales rates
Produced by Florida Realtors® with data provided by Florida's multiple listing services. Statistics for each month compiled from MLS feeds on the 15th day of the following month.
Data released on Friday, January 22, 2021. Next data release is Friday, February 19, 2021.
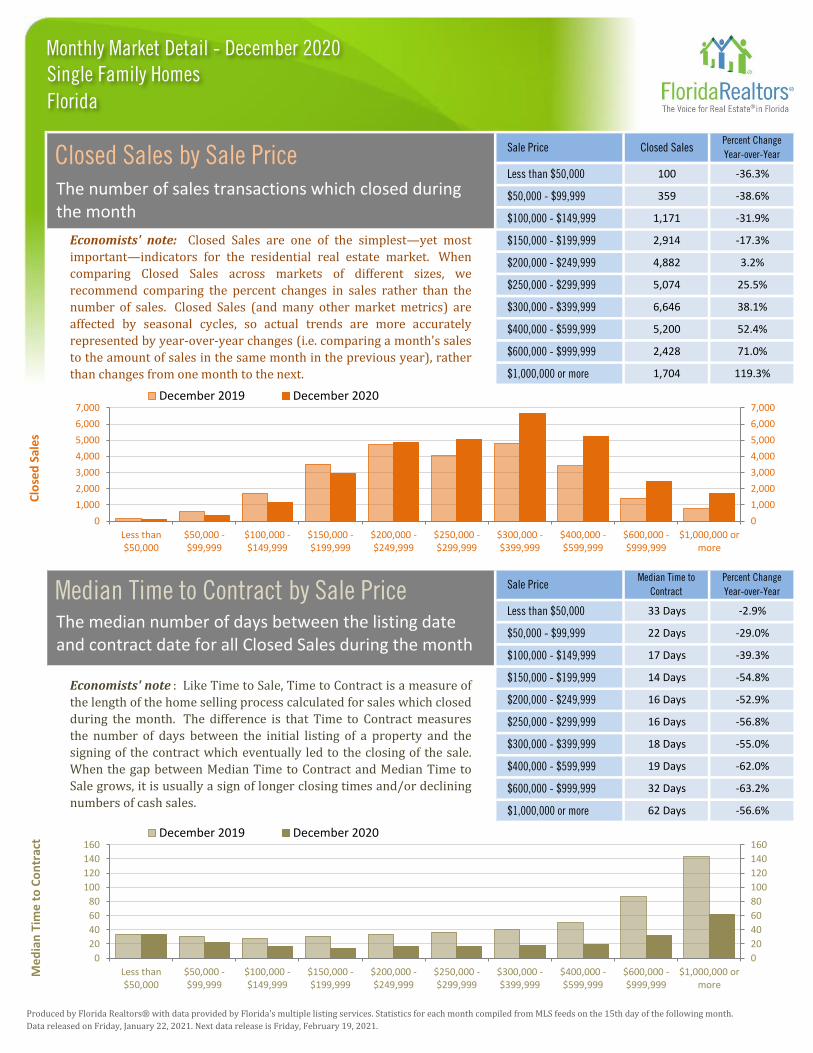
$600,000 - $999,999 32 Days -63.2%
$1,000,000 or more 62 Days -56.6%
Economists' note : Like Time to Sale, Time to Contract is a measure of
the length of the home selling process calculated for sales which closed
during the month. The difference is that Time to Contract measures
the number of days between the initial listing of a property and the
signing of the contract which eventually led to the closing of the sale.
When the gap between Median Time to Contract and Median Time to
Sale grows, it is usually a sign of longer closing times and/or declining
numbers of cash sales.
$150,000 - $199,999 14 Days -54.8%
$200,000 - $249,999 16 Days -52.9%
$250,000 - $299,999
$400,000 - $599,999 19 Days -62.0%
16 Days -56.8%
$300,000 - $399,999 18 Days -55.0%
Economists' note: Closed Sales are one of the simplest—yet most
important—indicators for the residential real estate market. When
comparing Closed Sales across markets of different sizes, we
recommend comparing the percent changes in sales rather than the
number of sales. Closed Sales (and many other market metrics) are
affected by seasonal cycles, so actual trends are more accurately
represented by year-over-year changes (i.e. comparing a month's sales
to the amount of sales in the same month in the previous year), rather
than changes from one month to the next.
Sale PriceMedian Time to
Contract
Percent Change
Year-over-Year
Less than $50,000 33 Days -2.9%
$1,000,000 or more 1,704 119.3%
$250,000 - $299,999 5,074 25.5%
$300,000 - $399,999 6,646 38.1%
$50,000 - $99,999 22 Days -29.0%
$100,000 - $149,999
$400,000 - $599,999 5,200 52.4%
$600,000 - $999,999 2,428 71.0%
17 Days -39.3%
$150,000 - $199,999 2,914 -17.3%
$200,000 - $249,999 4,882 3.2%
$100,000 - $149,999 1,171 -31.9%
Sale Price Closed SalesPercent Change
Year-over-Year
Less than $50,000 100 -36.3%
$50,000 - $99,999 359 -38.6%
0
20
40
60
80
100
120
140
160
Less than$50,000
$50,000 -$99,999
$100,000 -$149,999
$150,000 -$199,999
$200,000 -$249,999
$250,000 -$299,999
$300,000 -$399,999
$400,000 -$599,999
$600,000 -$999,999
$1,000,000 ormore
Me
dia
n T
ime
to
Co
ntr
act
December 2019 December 2020
0
20
40
60
80
100
120
140
160
0
1,000
2,000
3,000
4,000
5,000
6,000
7,000
Less than$50,000
$50,000 -$99,999
$100,000 -$149,999
$150,000 -$199,999
$200,000 -$249,999
$250,000 -$299,999
$300,000 -$399,999
$400,000 -$599,999
$600,000 -$999,999
$1,000,000 ormore
Clo
sed
Sal
es
December 2019 December 2020
0
1,000
2,000
3,000
4,000
5,000
6,000
7,000
Monthly Market Detail - December 2020
Florida
Single Family Homes
Closed Sales by Sale PriceThe number of sales transactions which closed during the month
Median Time to Contract by Sale PriceThe median number of days between the listing date and contract date for all Closed Sales during the month

Produced by Florida Realtors® with data provided by Florida's multiple listing services. Statistics for each month compiled from MLS feeds on the 15th day of the following month.
Data released on Friday, January 22, 2021. Next data release is Friday, February 19, 2021.
$600,000 - $999,999 5,999 -38.4%
$1,000,000 or more 7,395 -29.8%
Economists' note : There are a number of ways to define and calculate
Inventory. Our method is to simply count the number of active listings
on the last day of the month, and hold this number to compare with the
same month the following year. Inventory rises when New Listings are
outpacing the number of listings that go off-market (regardless of
whether they actually sell). Likewise, it falls when New Listings aren't
keeping up with the rate at which homes are going off-market.
$150,000 - $199,999 3,272 -53.8%
$200,000 - $249,999 4,740 -53.7%
$250,000 - $299,999 5,919 -44.4%
$300,000 - $399,999 8,360 -42.0%
$400,000 - $599,999 7,855 -43.4%
$50,000 - $99,999 618 -56.5%
$100,000 - $149,999 1,486 -58.4%
Current Listing Price InventoryPercent Change
Year-over-Year
Less than $50,000 105 -65.3%
$600,000 - $999,999 2,030 33.4%
$1,000,000 or more 1,449 27.0%
Economists' note: New Listings tend to rise in delayed response to
increasing prices, so they are often seen as a lagging indicator of
market health. As prices rise, potential sellers raise their estimations
of value—and in the most recent cycle, rising prices have freed up
many potential sellers who were previously underwater on their
mortgages. Note that in our calculations, we take care to not include
properties that were recently taken off the market and quickly relisted,
since these are not really new listings.
$150,000 - $199,999 2,277 -19.1%
$200,000 - $249,999 3,437 -7.9%
$250,000 - $299,999 3,957 17.5%
$300,000 - $399,999 5,259 31.9%
$400,000 - $599,999 4,050 35.0%
$50,000 - $99,999 326 -36.5%
$100,000 - $149,999 860 -35.2%
Initial Listing Price New ListingsPercent Change
Year-over-Year
Less than $50,000 58 -57.7%
0
2,000
4,000
6,000
8,000
10,000
12,000
14,000
16,000
Less than$50,000
$50,000 -$99,999
$100,000 -$149,999
$150,000 -$199,999
$200,000 -$249,999
$250,000 -$299,999
$300,000 -$399,999
$400,000 -$599,999
$600,000 -$999,999
$1,000,000 ormore
Inve
nto
ry
December 2019 December 2020
0
1,000
2,000
3,000
4,000
5,000
6,000
Less than$50,000
$50,000 -$99,999
$100,000 -$149,999
$150,000 -$199,999
$200,000 -$249,999
$250,000 -$299,999
$300,000 -$399,999
$400,000 -$599,999
$600,000 -$999,999
$1,000,000 ormore
Ne
w L
isti
ngs
December 2019 December 2020
0
2,000
4,000
6,000
8,000
10,000
12,000
14,000
16,000
0
1,000
2,000
3,000
4,000
5,000
6,000
Monthly Market Detail - December 2020
Florida
Single Family Homes
New Listings by Initial Listing PriceThe number of properties put onto the market during the month
Inventory by Current Listing PriceThe number of property listings active at the end of the month
Closed Sales
Median Sale Price
Closed Sales
Median Sale Price
Closed Sales
Median Sale Price
Produced by Florida Realtors® with data provided by Florida's multiple listing services. Statistics for each month compiled from MLS feeds on the 15th day of the following month.
Data released on Friday, January 22, 2021. Next data release is Friday, February 19, 2021.
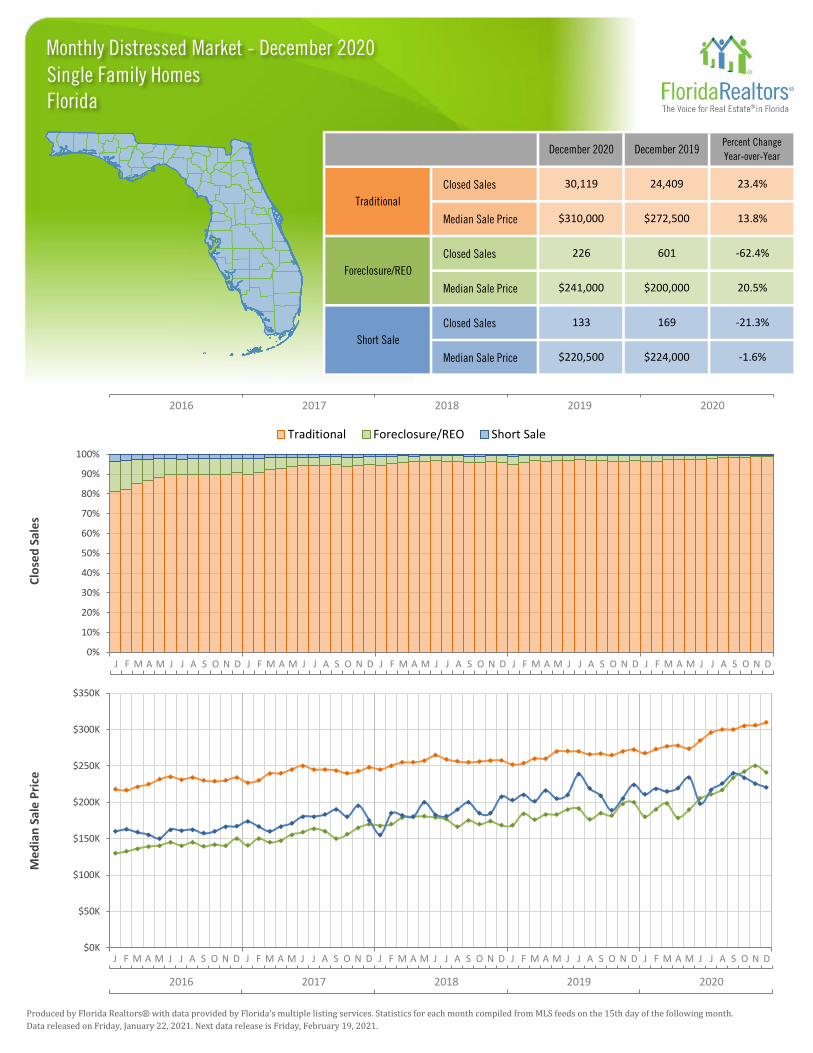
Short Sale
133 169 -21.3%
$220,500 $224,000 -1.6%
Foreclosure/REO
226 601 -62.4%
$241,000 $200,000 20.5%
December 2020 December 2019Percent Change
Year-over-Year
Traditional
30,119 24,409 23.4%
$310,000 $272,500 13.8%
$0K
$50K
$100K
$150K
$200K
$250K
$300K
$350K
Me
dia
n S
ale
Pri
ce
0%
10%
20%
30%
40%
50%
60%
70%
80%
90%
100%
Clo
sed
Sal
es
Traditional Foreclosure/REO Short Sale
J F M A M J J A S O N D J F M A M J J A S O N D J F M A M J J A S O N D J F M A M J J A S O N D J F M A M J J A S O N D
J F M A M J J A S O N D J F M A M J J A S O N D J F M A M J J A S O N D J F M A M J J A S O N D J F M A M J J A S O N D
Monthly Distressed Market - December 2020
FloridaSingle Family Homes
2016 2017 2018 2019 2020
2016 2017 2018 2019 2020
Produced by Florida Realtors® with data provided by Florida's multiple listing services. Statistics for each month compiled from MLS feeds on the 15th day of the following month.
Data released on Friday, January 22, 2021. Next data release is Friday, February 19, 2021.
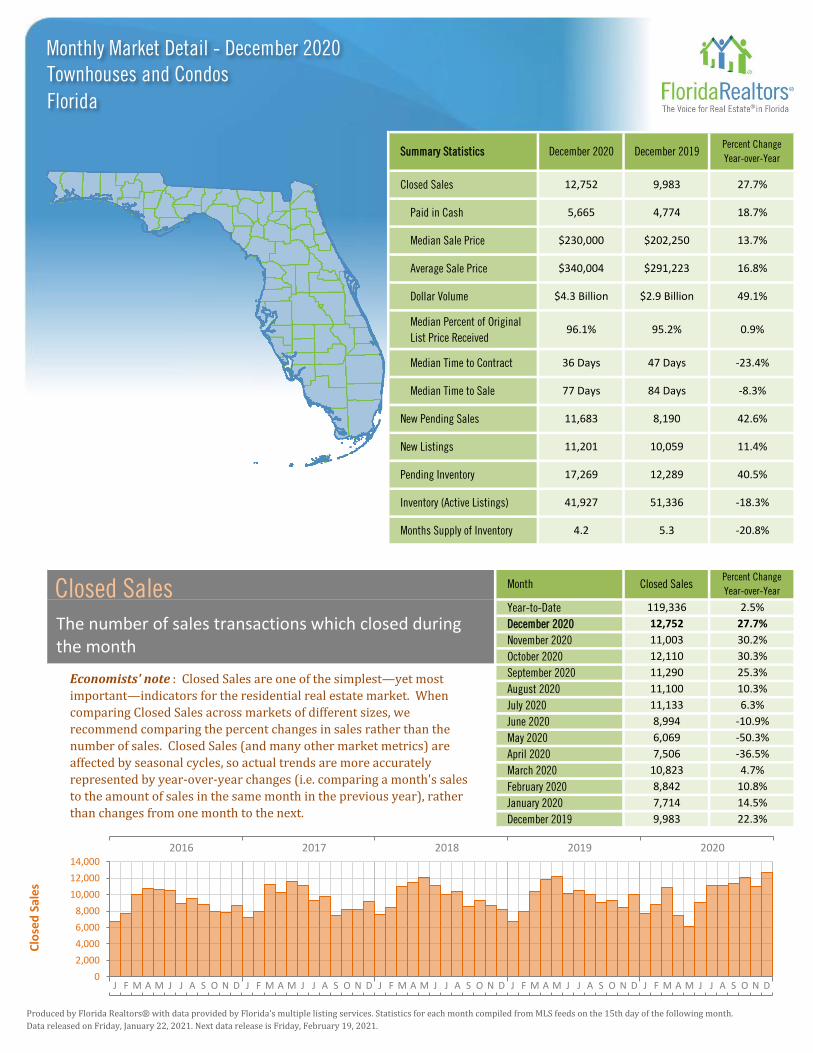
Economists' note : Closed Sales are one of the simplest—yet most
important—indicators for the residential real estate market. When
comparing Closed Sales across markets of different sizes, we
recommend comparing the percent changes in sales rather than the
number of sales. Closed Sales (and many other market metrics) are
affected by seasonal cycles, so actual trends are more accurately
represented by year-over-year changes (i.e. comparing a month's sales
to the amount of sales in the same month in the previous year), rather
than changes from one month to the next.
November 2020 11,003 30.2%
30.3%
25.3%
October 2020 12,110
September 2020 11,290
22.3%
March 2020 10,823
February 2020 8,842
4.7%
10.8%
14.5%
10.3%
6.3%
-50.3%
-36.5%
-10.9%
January 2020 7,714
December 2019 9,983
May 2020 6,069
April 2020 7,506
August 2020 11,100
July 2020 11,133
June 2020 8,994
95.2% 0.9%
36 Days 47 Days -23.4%
December 2020
Median Time to Contract
77 Days
11,683
Median Time to Sale
New Pending Sales
New Listings
Month
11,201
Pending Inventory 17,269
Inventory (Active Listings) 41,927
Months Supply of Inventory 4.2
-8.3%
8,190 42.6%
Percent Change
Year-over-Year
$202,250 13.7%
$4.3 Billion $2.9 Billion 49.1%
$340,004 $291,223 16.8%
December 2019Percent Change
Year-over-Year
5,665 4,774 18.7%
12,752 9,983 27.7%
Summary Statistics
Closed Sales
Paid in Cash
96.1%
December 2020
$230,000Median Sale Price
Average Sale Price
Dollar Volume
Median Percent of Original
List Price Received
Year-to-Date 119,336 2.5%
27.7%
10,059 11.4%
Closed Sales
12,752
84 Days
12,289 40.5%
51,336 -18.3%
5.3 -20.8%
2016 2017 2018 2019 2020
J F M A M J J A S O N D J F M A M J J A S O N D J F M A M J J A S O N D J F M A M J J A S O N D J F M A M J J A S O N D
Monthly Market Detail - December 2020
Florida
Townhouses and Condos
Closed SalesThe number of sales transactions which closed duringthe month
0
2,000
4,000
6,000
8,000
10,000
12,000
14,000
Clo
sed
Sal
es
Produced by Florida Realtors® with data provided by Florida's multiple listing services. Statistics for each month compiled from MLS feeds on the 15th day of the following month.
Data released on Friday, January 22, 2021. Next data release is Friday, February 19, 2021.
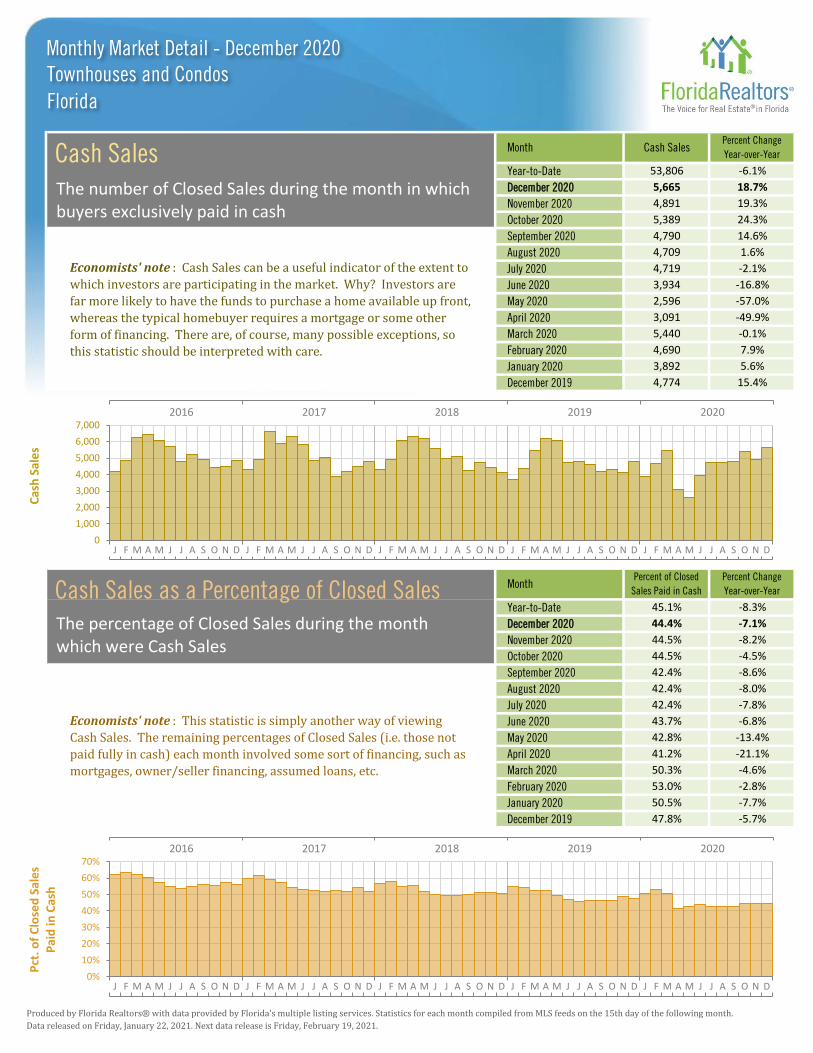
47.8% -5.7%
March 2020 50.3%
April 2020 3,091 -49.9%
March 2020
4,690 7.9%
January 2020 3,892 5.6%
-4.6%
February 2020 53.0%
Economists' note : This statistic is simply another way of viewing
Cash Sales. The remaining percentages of Closed Sales (i.e. those not
paid fully in cash) each month involved some sort of financing, such as
mortgages, owner/seller financing, assumed loans, etc.
Economists' note : Cash Sales can be a useful indicator of the extent to
which investors are participating in the market. Why? Investors are
far more likely to have the funds to purchase a home available up front,
whereas the typical homebuyer requires a mortgage or some other
form of financing. There are, of course, many possible exceptions, so
this statistic should be interpreted with care.
Year-to-Date 45.1% -8.3%
MonthPercent of Closed
Sales Paid in Cash
Percent Change
Year-over-Year
January 2020 50.5% -7.7%
December 2019
December 2019 4,774 15.4%
February 2020
-2.8%
August 2020 42.4% -8.0%
July 2020 42.4% -7.8%
June 2020 43.7% -6.8%
May 2020 42.8% -13.4%
April 2020 41.2% -21.1%
October 2020 44.5% -4.5%
September 2020 42.4% -8.6%
December 2020 44.4% -7.1%
November 2020 44.5% -8.2%
5,440 -0.1%
4,790 14.6%
August 2020 4,709 1.6%
May 2020 2,596 -57.0%
July 2020 4,719 -2.1%
June 2020 3,934 -16.8%
September 2020
Month Cash SalesPercent Change
Year-over-Year
December 2020 5,665 18.7%
November 2020 4,891 19.3%
October 2020 5,389 24.3%
Year-to-Date 53,806 -6.1%
J F M A M J J A S O N D J F M A M J J A S O N D J F M A M J J A S O N D J F M A M J J A S O N D J F M A M J J A S O N D
J F M A M J J A S O N D J F M A M J J A S O N D J F M A M J J A S O N D J F M A M J J A S O N D J F M A M J J A S O N D
0%
10%
20%
30%
40%
50%
60%
70%
Pct
. of
Clo
sed
Sal
es
Pai
d in
Cas
h
0
1,000
2,000
3,000
4,000
5,000
6,000
7,000
Cas
h S
ale
s
Monthly Market Detail - December 2020
2016 2017 2018 2019 2020
Florida
Townhouses and Condos
Cash SalesThe number of Closed Sales during the month in whichbuyers exclusively paid in cash
2016 2017 2018 2019 2020
Cash Sales as a Percentage of Closed SalesThe percentage of Closed Sales during the monthwhich were Cash Sales

Produced by Florida Realtors® with data provided by Florida's multiple listing services. Statistics for each month compiled from MLS feeds on the 15th day of the following month.
Data released on Friday, January 22, 2021. Next data release is Friday, February 19, 2021.
10.9%$303,051Year-to-Date
Economists' note : Median Sale Price is our preferred summary
statistic for price activity because, unlike Average Sale Price, Median
Sale Price is not sensitive to high sale prices for small numbers of
homes that may not be characteristic of the market area. Keep in mind
that median price trends over time are not always solely caused by
changes in the general value of local real estate. Median sale price only
reflects the values of the homes that sold each month, and the mix of
the types of homes that sell can change over time.
Economists' note : Usually, we prefer Median Sale Price over Average
Sale Price as a summary statistic for home prices. However, Average
Sale Price does have its uses—particularly when it is analyzed
alongside the Median Sale Price. For one, the relative difference
between the two statistics can provide some insight into the market for
higher-end homes in an area.January 2020 $295,527 7.5%
December 2019 $291,223 10.4%
March 2020 $305,436 7.2%
February 2020 $286,927 2.6%
August 2020 $305,675 14.6%
July 2020 $289,973 12.6%
June 2020 $288,635 7.3%
May 2020 $281,694 1.0%
April 2020 $285,961 0.7%
October 2020 $300,806 15.2%
September 2020 $304,461 16.4%
December 2020 $340,004 16.8%
November 2020 $322,947 22.0%
December 2019 $202,250 9.3%
Month Average Sale PricePercent Change
Year-over-Year
February 2020 $200,000 6.7%
January 2020 $200,000 9.6%
April 2020 $209,000 7.7%
March 2020 $210,000 10.8%
$217,500 12.7%
August 2020 $217,500 14.5%
May 2020 $201,472 3.3%
November 2020 $228,000 16.9%
October 2020 $221,000 15.9%
July 2020 $210,000 11.7%
June 2020 $210,000 7.7%
September 2020
Month Median Sale PricePercent Change
Year-over-Year
December 2020 $230,000 13.7%
Year-to-Date $215,000 12.0%
J F M A M J J A S O N D J F M A M J J A S O N D J F M A M J J A S O N D J F M A M J J A S O N D J F M A M J J A S O N D
J F M A M J J A S O N D J F M A M J J A S O N D J F M A M J J A S O N D J F M A M J J A S O N D J F M A M J J A S O N D
$0K
$100K
$200K
$300K
$400K
Ave
rage
Sal
e P
rice
$0K
$50K
$100K
$150K
$200K
$250K
Me
dia
n S
ale
Pri
ce
Monthly Market Detail - December 2020
2016 2017 2018 2019 2020
Florida
Townhouses and Condos
Median Sale PriceThe median sale price reported for the month (i.e. 50% of sales were above and 50% of sales were below)
2016 2017 2018 2019 2020
Average Sale PriceThe average sale price reported for the month (i.e. total sales in dollars divided by the number of sales)

Produced by Florida Realtors® with data provided by Florida's multiple listing services. Statistics for each month compiled from MLS feeds on the 15th day of the following month.
Data released on Friday, January 22, 2021. Next data release is Friday, February 19, 2021.
95.2% 0.2%
March 2020 95.5%
April 2020 $2.1 Billion -36.1%
March 2020
$2.5 Billion 13.7%
January 2020 $2.3 Billion 23.1%
0.6%
February 2020 95.2%
Economists' note : The Median Percent of Original List Price Received
is useful as an indicator of market recovery, since it typically rises as
buyers realize that the market may be moving away from them and
they need to match the selling price (or better it) in order to get a
contract on the house. This is usually the last measure to indicate a
market has shifted from down to up, so it is what we would call a
lagging indicator.
Economists' note : Dollar Volume is simply the sum of all sale prices
in a given time period, and can quickly be calculated by multiplying
Closed Sales by Average Sale Price. It is a strong indicator of the health
of the real estate industry in a market, and is of particular interest to
real estate professionals, investors, analysts, and government agencies.
Potential home sellers and home buyers, on the other hand, will likely
be better served by paying attention to trends in the two components
of Dollar Volume (i.e. sales and prices) individually.
0.7%95.7%Year-to-Date
MonthMed. Pct. of Orig.
List Price Received
Percent Change
Year-over-Year
January 2020 95.1% 0.2%
December 2019
December 2019 $2.9 Billion 35.1%
February 2020
0.5%
August 2020 95.9% 0.7%
July 2020 95.6% 0.5%
June 2020 95.3% 0.3%
May 2020 95.1% 0.2%
April 2020 95.6% 1.0%
October 2020 96.0% 0.8%
September 2020 96.0% 0.8%
December 2020 96.1% 0.9%
November 2020 96.3% 0.9%
$3.3 Billion 12.2%
September 2020 $3.4 Billion 45.9%
August 2020 $3.4 Billion 26.4%
July 2020 $3.2 Billion 19.7%
June 2020 $2.6 Billion -4.4%
May 2020 $1.7 Billion -49.8%
November 2020 $3.6 Billion 58.9%
October 2020 $3.6 Billion 50.1%
Month Dollar VolumePercent Change
Year-over-Year
December 2020 $4.3 Billion 49.1%
Year-to-Date $36.2 Billion 13.7%
J F M A M J J A S O N D J F M A M J J A S O N D J F M A M J J A S O N D J F M A M J J A S O N D J F M A M J J A S O N D
J F M A M J J A S O N D J F M A M J J A S O N D J F M A M J J A S O N D J F M A M J J A S O N D J F M A M J J A S O N D
0%
20%
40%
60%
80%
100%
120%
Me
d. P
ct. o
f O
rig.
Li
st P
rice
Re
ceiv
ed
$0
$1 B
$2 B
$3 B
$4 B
$5 B
Do
llar
Vo
lum
e
Monthly Market Detail - December 2020
2016 2017 2018 2019 2020
Florida
Townhouses and Condos
Dollar VolumeThe sum of the sale prices for all sales which closed during the month
2016 2017 2018 2019 2020
Median Percent of Original List Price ReceivedThe median of the sale price (as a percentage of the original list price) across all properties selling during the month
Produced by Florida Realtors® with data provided by Florida's multiple listing services. Statistics for each month compiled from MLS feeds on the 15th day of the following month.
Data released on Friday, January 22, 2021. Next data release is Friday, February 19, 2021.
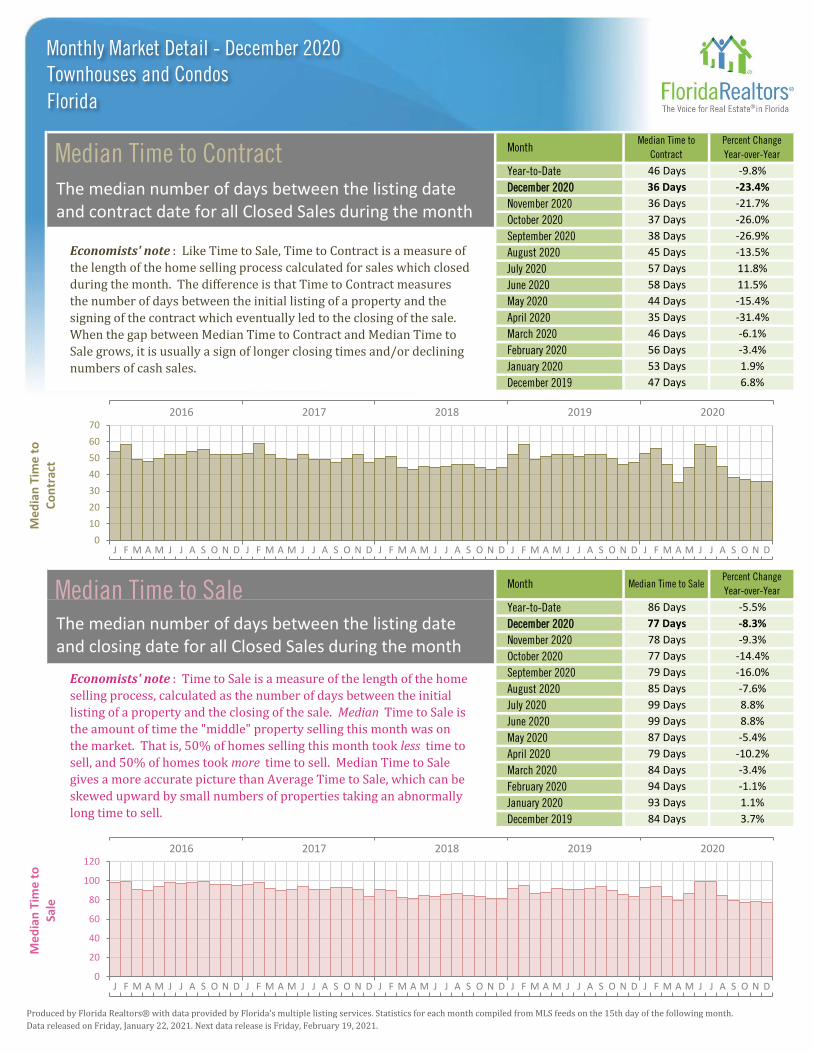
December 2019 84 Days 3.7%
Economists' note : Time to Sale is a measure of the length of the home
selling process, calculated as the number of days between the initial
listing of a property and the closing of the sale. Median Time to Sale is
the amount of time the "middle" property selling this month was on
the market. That is, 50% of homes selling this month took less time to
sell, and 50% of homes took more time to sell. Median Time to Sale
gives a more accurate picture than Average Time to Sale, which can be
skewed upward by small numbers of properties taking an abnormally
long time to sell.
Economists' note : Like Time to Sale, Time to Contract is a measure of
the length of the home selling process calculated for sales which closed
during the month. The difference is that Time to Contract measures
the number of days between the initial listing of a property and the
signing of the contract which eventually led to the closing of the sale.
When the gap between Median Time to Contract and Median Time to
Sale grows, it is usually a sign of longer closing times and/or declining
numbers of cash sales.
February 2020 94 Days -1.1%
January 2020 93 Days 1.1%
April 2020 79 Days -10.2%
March 2020 84 Days -3.4%
September 2020 79 Days -16.0%
August 2020 85 Days -7.6%
July 2020 99 Days 8.8%
June 2020 99 Days 8.8%
May 2020 87 Days -5.4%
November 2020 78 Days -9.3%
October 2020 77 Days -14.4%
Month Median Time to SalePercent Change
Year-over-Year
December 2020 77 Days -8.3%
-5.5%86 DaysYear-to-Date
January 2020 53 Days 1.9%
December 2019 47 Days 6.8%
46 Days -6.1%
February 2020 56 Days -3.4%
March 2020
August 2020 45 Days -13.5%
July 2020 57 Days 11.8%
June 2020 58 Days 11.5%
May 2020 44 Days -15.4%
April 2020 35 Days -31.4%
MonthMedian Time to
Contract
Percent Change
Year-over-Year
December 2020 36 Days -23.4%
46 Days -9.8%Year-to-Date
November 2020 36 Days -21.7%
October 2020 37 Days -26.0%
September 2020 38 Days -26.9%
J F M A M J J A S O N D J F M A M J J A S O N D J F M A M J J A S O N D J F M A M J J A S O N D J F M A M J J A S O N D
J F M A M J J A S O N D J F M A M J J A S O N D J F M A M J J A S O N D J F M A M J J A S O N D J F M A M J J A S O N D0
20
40
60
80
100
120
Me
dia
n T
ime
to
Sa
le
0
10
20
30
40
50
60
70
Me
dia
n T
ime
to
C
on
trac
tMonthly Market Detail - December 2020
2016 2017 2018 2019 2020
Florida
Townhouses and Condos
Median Time to ContractThe median number of days between the listing date and contract date for all Closed Sales during the month
2016 2017 2018 2019 2020
Median Time to SaleThe median number of days between the listing date and closing date for all Closed Sales during the month

Produced by Florida Realtors® with data provided by Florida's multiple listing services. Statistics for each month compiled from MLS feeds on the 15th day of the following month.
Data released on Friday, January 22, 2021. Next data release is Friday, February 19, 2021.
Year-to-Date 160,541 1.1%
January 2020 15,993 -6.3%
August 2020 13,816 15.1%
July 2020 13,863 15.4%
June 2020 13,447 13.6%
May 2020
December 2019 10,059 -2.8%
March 2020 13,443 -10.4%
February 2020 14,382 -1.7%
13,741 1.8%
April 2020 8,782 -38.5%
October 2020 14,623 3.4%
September 2020 14,285 21.1%
December 2020 11,201 11.4%
November 2020 12,965 4.2%
December 2019 8,190 12.5%
Month New ListingsPercent Change
Year-over-Year
February 2020 12,680 13.9%
January 2020 11,598 14.3%
April 2020 5,543 -56.6%
March 2020 8,629 -35.0%
June 2020 12,978 20.0%
September 2020 13,016 43.0%
August 2020 12,713 20.7%
22.4%
October 2020 13,375 29.5%
July 2020 12,780 18.1%
Economists' note : New Listings tend to rise in delayed response to
increasing prices, so they are often seen as a lagging indicator of
market health. As prices rise, potential sellers raise their estimations
of value—and in the most recent cycle, rising prices have freed up
many potential sellers who were previously underwater on their
mortgages. Note that in our calculations, we take care to not include
properties that were recently taken off the market and quickly relisted,
since these are not really new listings.
Economists' note : Because of the typical length of time it takes for a
sale to close, economists consider Pending Sales to be a decent
indicator of potential future Closed Sales. It is important to bear in
mind, however, that not all Pending Sales will be closed successfully.
So, the effectiveness of Pending Sales as a future indicator of Closed
Sales is susceptible to changes in market conditions such as the
availability of financing for homebuyers and the inventory of
distressed properties for sale.
Month New Pending SalesPercent Change
Year-over-Year
December 2020 11,683 42.6%
Year-to-Date 136,946 6.2%
May 2020 10,045 -16.8%
November 2020 11,906
J F M A M J J A S O N D J F M A M J J A S O N D J F M A M J J A S O N D J F M A M J J A S O N D J F M A M J J A S O N D
J F M A M J J A S O N D J F M A M J J A S O N D J F M A M J J A S O N D J F M A M J J A S O N D J F M A M J J A S O N D
0
5,000
10,000
15,000
20,000
Ne
w L
isti
ngs
0
5,000
10,000
15,000
Pe
nd
ing
Sale
s
Monthly Market Detail - December 2020
2016 2017 2018 2019 2020
Florida
Townhouses and Condos
New Pending SalesThe number of listed properties that went under contract during the month
2016 2017 2018 2019 2020
New ListingsThe number of properties put onto the market during the month

Produced by Florida Realtors® with data provided by Florida's multiple listing services. Statistics for each month compiled from MLS feeds on the 15th day of the following month.
Data released on Friday, January 22, 2021. Next data release is Friday, February 19, 2021.
November 2020 45,438 -14.5%
October 2020 46,486 -11.8%
Month InventoryPercent Change
Year-over-Year
December 2020 41,927 -18.3%
50,060 -9.4%YTD (Monthly Avg)
-7.4%
August 2020 48,156 -5.6%
July 2020 50,073 -4.8%
September 2020 47,298
54,715 -8.5%
June 2020 51,105 -6.0%
May 2020 54,221 -4.3%
April 2020 54,533 -6.9%
March 2020
December 2020 4.2 -20.8%
November 2020 4.7 -16.1%
October 2020 4.9 -10.9%
September 2020 5.1 -3.8%
August 2020 5.3 -1.9%
July 2020 5.6 1.8%
June 2020 5.7 0.0%
May 2020 6.0 1.7%
-12.7%
April 2020 5.7 -6.6%
March 2020 5.5 -12.7%
December 2019 51,336 -8.2%
February 2020 53,259 -13.1%
January 2020 53,503 -11.7%
Economists' note : There are a number of ways to define and calculate
Inventory. Our method is to simply count the number of active listings
on the last day of the month, and hold this number to compare with the
same month the following year. Inventory rises when New Listings are
outpacing the number of listings that go off-market (regardless of
whether they actually sell). Likewise, it falls when New Listings aren't
keeping up with the rate at which homes are going off-market.
Economists' note : MSI is a useful indicator of market conditions. The
benchmark for a balanced market (favoring neither buyer nor seller) is
5.5 months of inventory. Anything higher is traditionally a buyers'
market, and anything lower is a sellers' market. There is no single
accepted way of calculating MSI. A common method is to divide
current Inventory by the most recent month's Closed Sales count, but
this count is a usually poor predictor of future Closed Sales due to
seasonal cycles. To eliminate seasonal effects, we use the 12-month
average of monthly Closed Sales instead.
YTD (Monthly Avg) 5.0 -13.8%
Month Months SupplyPercent Change
Year-over-Year
December 2019 5.3 -8.6%
February 2020 5.4 -15.6%
January 2020 5.5
J F M A M J J A S O N D J F M A M J J A S O N D J F M A M J J A S O N D J F M A M J J A S O N D J F M A M J J A S O N D
J F M A M J J A S O N D J F M A M J J A S O N D J F M A M J J A S O N D J F M A M J J A S O N D J F M A M J J A S O N D
0.0
1.0
2.0
3.0
4.0
5.0
6.0
7.0
Mo
nth
s Su
pp
ly o
f In
ven
tory
0
10,000
20,000
30,000
40,000
50,000
60,000
70,000
Inve
nto
ry
Monthly Market Detail - December 2020
2016 2017 2018 2019 2020
Florida
Townhouses and Condos
Inventory (Active Listings)The number of property listings active at the end of the month
2016 2017 2018 2019 2020
Months Supply of InventoryAn estimate of the number of months it will take to deplete the current Inventory given recent sales rates

Produced by Florida Realtors® with data provided by Florida's multiple listing services. Statistics for each month compiled from MLS feeds on the 15th day of the following month.
Data released on Friday, January 22, 2021. Next data release is Friday, February 19, 2021.
$100,000 - $149,999 1,844 4.7%
Sale Price Closed SalesPercent Change
Year-over-Year
Less than $50,000 83 -17.0%
$50,000 - $99,999 958 -8.4%
$150,000 - $199,999 2,252 13.6%
$200,000 - $249,999 1,910 26.8%
$50,000 - $99,999 36 Days -14.3%
$100,000 - $149,999
$400,000 - $599,999 1,202 61.3%
$600,000 - $999,999 716 63.5%
29 Days -19.4%
Economists' note: Closed Sales are one of the simplest—yet most
important—indicators for the residential real estate market. When
comparing Closed Sales across markets of different sizes, we
recommend comparing the percent changes in sales rather than the
number of sales. Closed Sales (and many other market metrics) are
affected by seasonal cycles, so actual trends are more accurately
represented by year-over-year changes (i.e. comparing a month's sales
to the amount of sales in the same month in the previous year), rather
than changes from one month to the next.
Sale PriceMedian Time to
Contract
Percent Change
Year-over-Year
Less than $50,000 28 Days -50.9%
$1,000,000 or more 484 79.9%
$250,000 - $299,999 1,602 44.1%
$300,000 - $399,999 1,701 66.1%
Economists' note : Like Time to Sale, Time to Contract is a measure of
the length of the home selling process calculated for sales which closed
during the month. The difference is that Time to Contract measures
the number of days between the initial listing of a property and the
signing of the contract which eventually led to the closing of the sale.
When the gap between Median Time to Contract and Median Time to
Sale grows, it is usually a sign of longer closing times and/or declining
numbers of cash sales.
$150,000 - $199,999 34 Days -10.5%
$200,000 - $249,999 30 Days -28.6%
$250,000 - $299,999
$400,000 - $599,999 52 Days -37.3%
32 Days -37.3%
$300,000 - $399,999 35 Days -41.7%
$600,000 - $999,999 71 Days -20.2%
$1,000,000 or more 93 Days -36.7%
0
20
40
60
80
100
120
140
160
Less than$50,000
$50,000 -$99,999
$100,000 -$149,999
$150,000 -$199,999
$200,000 -$249,999
$250,000 -$299,999
$300,000 -$399,999
$400,000 -$599,999
$600,000 -$999,999
$1,000,000 ormore
Me
dia
n T
ime
to
Co
ntr
act
December 2019 December 2020
0
20
40
60
80
100
120
140
160
0
500
1,000
1,500
2,000
2,500
Less than$50,000
$50,000 -$99,999
$100,000 -$149,999
$150,000 -$199,999
$200,000 -$249,999
$250,000 -$299,999
$300,000 -$399,999
$400,000 -$599,999
$600,000 -$999,999
$1,000,000 ormore
Clo
sed
Sal
es
December 2019 December 2020
0
500
1,000
1,500
2,000
2,500
Monthly Market Detail - December 2020
Florida
Townhouses and Condos
Closed Sales by Sale PriceThe number of sales transactions which closed during the month
Median Time to Contract by Sale PriceThe median number of days between the listing date and contract date for all Closed Sales during the month
Produced by Florida Realtors® with data provided by Florida's multiple listing services. Statistics for each month compiled from MLS feeds on the 15th day of the following month.
Data released on Friday, January 22, 2021. Next data release is Friday, February 19, 2021.
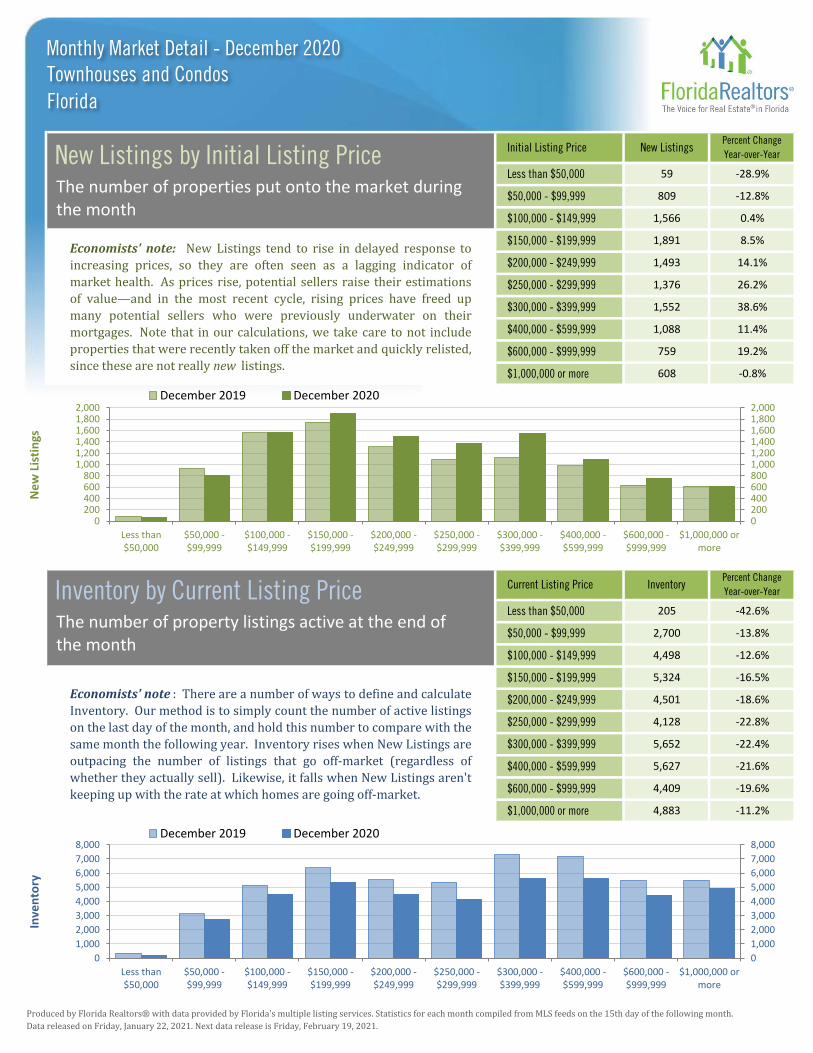
Initial Listing Price New ListingsPercent Change
Year-over-Year
Less than $50,000 59 -28.9%
$50,000 - $99,999 809 -12.8%
$100,000 - $149,999 1,566 0.4%
Economists' note: New Listings tend to rise in delayed response to
increasing prices, so they are often seen as a lagging indicator of
market health. As prices rise, potential sellers raise their estimations
of value—and in the most recent cycle, rising prices have freed up
many potential sellers who were previously underwater on their
mortgages. Note that in our calculations, we take care to not include
properties that were recently taken off the market and quickly relisted,
since these are not really new listings.
$150,000 - $199,999 1,891 8.5%
$200,000 - $249,999 1,493 14.1%
$250,000 - $299,999 1,376 26.2%
$300,000 - $399,999 1,552 38.6%
$400,000 - $599,999 1,088 11.4%
$600,000 - $999,999 759 19.2%
$1,000,000 or more 608 -0.8%
Current Listing Price InventoryPercent Change
Year-over-Year
Less than $50,000 205 -42.6%
$50,000 - $99,999 2,700 -13.8%
$100,000 - $149,999 4,498 -12.6%
Economists' note : There are a number of ways to define and calculate
Inventory. Our method is to simply count the number of active listings
on the last day of the month, and hold this number to compare with the
same month the following year. Inventory rises when New Listings are
outpacing the number of listings that go off-market (regardless of
whether they actually sell). Likewise, it falls when New Listings aren't
keeping up with the rate at which homes are going off-market.
$150,000 - $199,999 5,324 -16.5%
$200,000 - $249,999 4,501 -18.6%
$250,000 - $299,999 4,128 -22.8%
$300,000 - $399,999 5,652 -22.4%
$400,000 - $599,999 5,627 -21.6%
$600,000 - $999,999 4,409 -19.6%
$1,000,000 or more 4,883 -11.2%
0
1,000
2,000
3,000
4,000
5,000
6,000
7,000
8,000
Less than$50,000
$50,000 -$99,999
$100,000 -$149,999
$150,000 -$199,999
$200,000 -$249,999
$250,000 -$299,999
$300,000 -$399,999
$400,000 -$599,999
$600,000 -$999,999
$1,000,000 ormore
Inve
nto
ry
December 2019 December 2020
0200400600800
1,0001,2001,4001,6001,8002,000
Less than$50,000
$50,000 -$99,999
$100,000 -$149,999
$150,000 -$199,999
$200,000 -$249,999
$250,000 -$299,999
$300,000 -$399,999
$400,000 -$599,999
$600,000 -$999,999
$1,000,000 ormore
Ne
w L
isti
ngs
December 2019 December 2020
0
1,000
2,000
3,000
4,000
5,000
6,000
7,000
8,000
02004006008001,0001,2001,4001,6001,8002,000
Monthly Market Detail - December 2020
Florida
Townhouses and Condos
New Listings by Initial Listing PriceThe number of properties put onto the market during the month
Inventory by Current Listing PriceThe number of property listings active at the end of the month
Closed Sales
Median Sale Price
Closed Sales
Median Sale Price
Closed Sales
Median Sale Price
Produced by Florida Realtors® with data provided by Florida's multiple listing services. Statistics for each month compiled from MLS feeds on the 15th day of the following month.
Data released on Friday, January 22, 2021. Next data release is Friday, February 19, 2021.
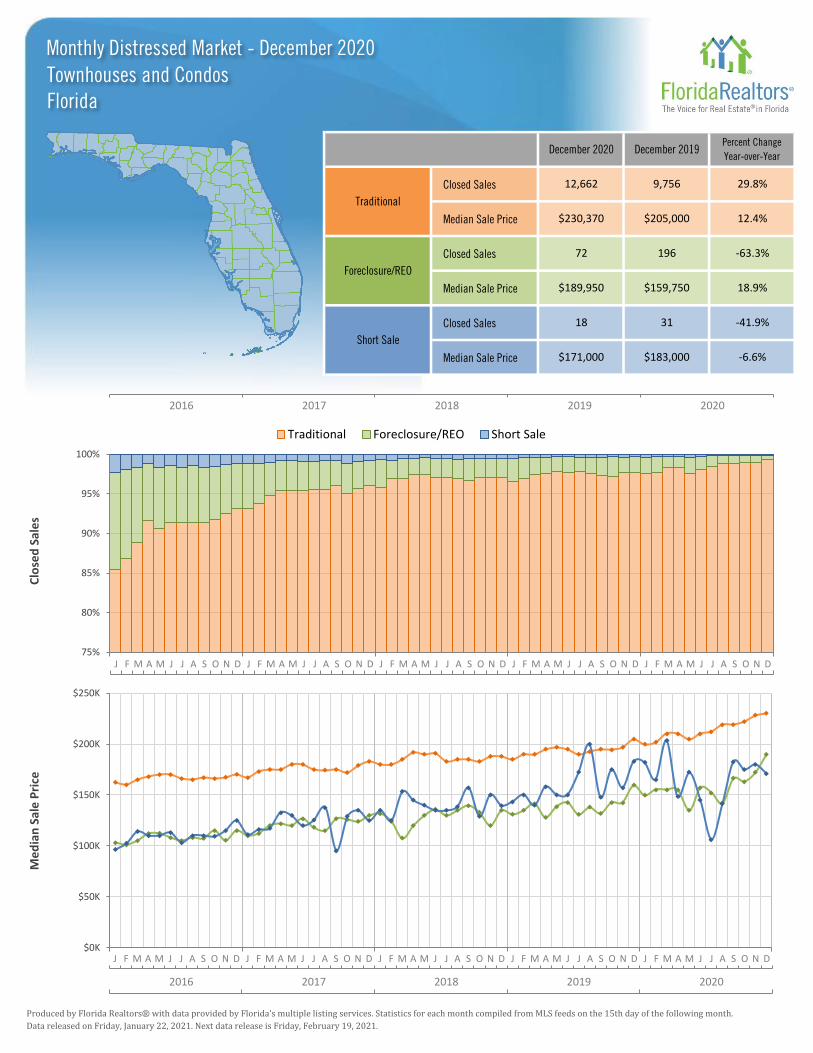
December 2020 December 2019Percent Change
Year-over-Year
Traditional
12,662 9,756 29.8%
$230,370 $205,000 12.4%
Foreclosure/REO
72 196 -63.3%
$189,950 $159,750 18.9%
Short Sale
18 31 -41.9%
$171,000 $183,000 -6.6%
$0K
$50K
$100K
$150K
$200K
$250K
Me
dia
n S
ale
Pri
ce
75%
80%
85%
90%
95%
100%
Clo
sed
Sal
es
Traditional Foreclosure/REO Short Sale
J F M A M J J A S O N D J F M A M J J A S O N D J F M A M J J A S O N D J F M A M J J A S O N D J F M A M J J A S O N D
J F M A M J J A S O N D J F M A M J J A S O N D J F M A M J J A S O N D J F M A M J J A S O N D J F M A M J J A S O N D
Monthly Distressed Market - December 2020
FloridaTownhouses and Condos
2016 2017 2018 2019 2020
2016 2017 2018 2019 2020
Produced by Florida Realtors® with data provided by Florida's multiple listing services. Statistics for each month compiled from MLS feeds on the 15th day of the following month.
Data released on Friday, January 22, 2021. Next data release is Friday, February 19, 2021.
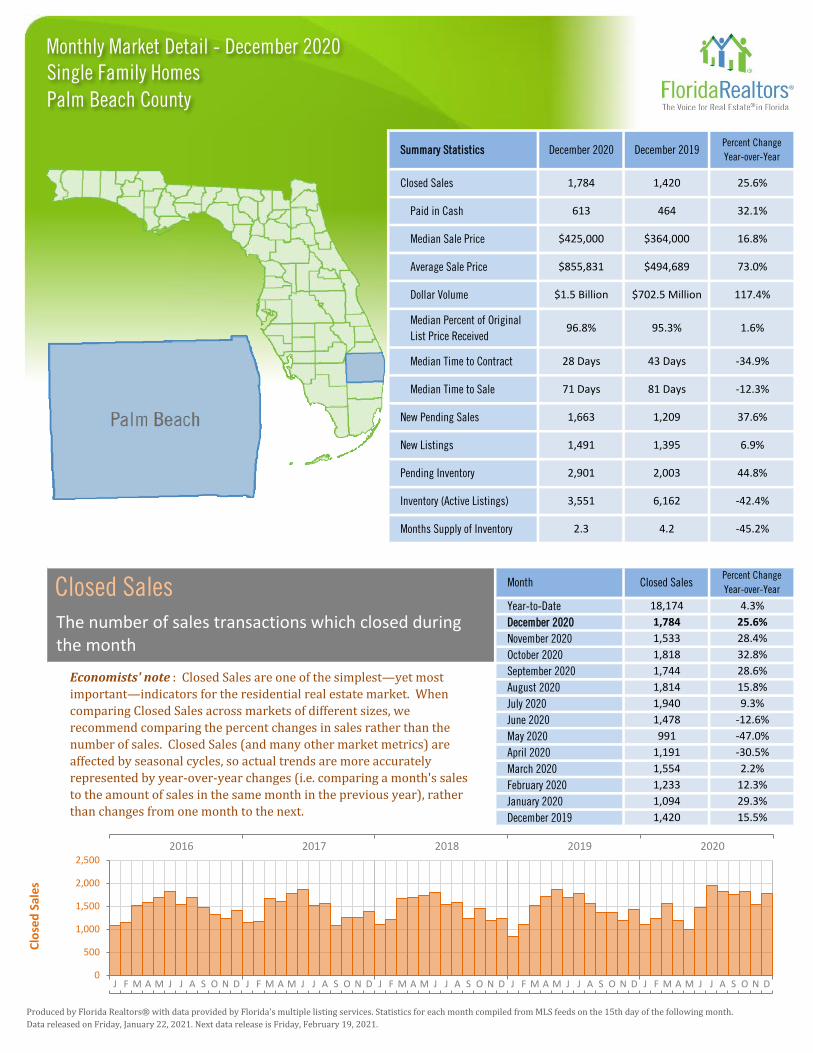
Year-to-Date 18,174 4.3%
25.6%
1,395 6.9%
Closed Sales
1,784
81 Days
2,003 44.8%
6,162 -42.4%
4.2 -45.2%
Summary Statistics
Closed Sales
Paid in Cash
96.8%
December 2020
$425,000Median Sale Price
Average Sale Price
Dollar Volume
Median Percent of Original
List Price Received
$364,000 16.8%
$1.5 Billion $702.5 Million 117.4%
$855,831 $494,689 73.0%
December 2019Percent Change
Year-over-Year
613 464 32.1%
1,784 1,420 25.6%
95.3% 1.6%
28 Days 43 Days -34.9%
December 2020
Median Time to Contract
71 Days
1,663
Median Time to Sale
New Pending Sales
New Listings
Month
1,491
Pending Inventory 2,901
Inventory (Active Listings) 3,551
Months Supply of Inventory 2.3
-12.3%
1,209 37.6%
Percent Change
Year-over-Year
1,094
December 2019 1,420
May 2020 991
April 2020 1,191
August 2020 1,814
July 2020 1,940
June 2020 1,478
Economists' note : Closed Sales are one of the simplest—yet most
important—indicators for the residential real estate market. When
comparing Closed Sales across markets of different sizes, we
recommend comparing the percent changes in sales rather than the
number of sales. Closed Sales (and many other market metrics) are
affected by seasonal cycles, so actual trends are more accurately
represented by year-over-year changes (i.e. comparing a month's sales
to the amount of sales in the same month in the previous year), rather
than changes from one month to the next.
November 2020 1,533 28.4%
32.8%
28.6%
October 2020 1,818
September 2020 1,744
15.5%
March 2020 1,554
February 2020 1,233
2.2%
12.3%
29.3%
15.8%
9.3%
-47.0%
-30.5%
-12.6%
January 2020
2016 2017 2018 2019 2020
J F M A M J J A S O N D J F M A M J J A S O N D J F M A M J J A S O N D J F M A M J J A S O N D J F M A M J J A S O N D
Monthly Market Detail - December 2020
Palm Beach County
Single Family Homes
Closed SalesThe number of sales transactions which closed duringthe month
0
500
1,000
1,500
2,000
2,500
Clo
sed
Sal
es

Produced by Florida Realtors® with data provided by Florida's multiple listing services. Statistics for each month compiled from MLS feeds on the 15th day of the following month.
Data released on Friday, January 22, 2021. Next data release is Friday, February 19, 2021.
September 2020
Month Cash SalesPercent Change
Year-over-Year
December 2020 613 32.1%
November 2020 482 22.3%
October 2020 587 34.9%
Year-to-Date 5,740 1.1%
510 2.2%
539 34.4%
August 2020 534 18.7%
May 2020 315 -49.8%
July 2020 553 4.9%
June 2020 436 -16.5%
December 2020 34.4% 5.2%
November 2020 31.4% -4.8%
October 2020 32.3% 1.6%
September 2020 30.9% 4.4%
-9.4%
August 2020 29.4% 2.4%
July 2020 28.5% -4.0%
June 2020 29.5% -4.5%
May 2020 31.8% -5.4%
April 2020 27.2% -22.7%
Economists' note : This statistic is simply another way of viewing
Cash Sales. The remaining percentages of Closed Sales (i.e. those not
paid fully in cash) each month involved some sort of financing, such as
mortgages, owner/seller financing, assumed loans, etc.
Economists' note : Cash Sales can be a useful indicator of the extent to
which investors are participating in the market. Why? Investors are
far more likely to have the funds to purchase a home available up front,
whereas the typical homebuyer requires a mortgage or some other
form of financing. There are, of course, many possible exceptions, so
this statistic should be interpreted with care.
Year-to-Date 31.6% -3.1%
MonthPercent of Closed
Sales Paid in Cash
Percent Change
Year-over-Year
January 2020 37.4% -2.1%
December 2019
December 2019 464 14.3%
February 2020
32.7% -0.9%
March 2020 32.8%
April 2020 324 -46.3%
March 2020
438 1.9%
January 2020 409 26.6%
0.0%
February 2020 35.5%
J F M A M J J A S O N D J F M A M J J A S O N D J F M A M J J A S O N D J F M A M J J A S O N D J F M A M J J A S O N D
J F M A M J J A S O N D J F M A M J J A S O N D J F M A M J J A S O N D J F M A M J J A S O N D J F M A M J J A S O N D
0%
10%
20%
30%
40%
50%
Pct
. of
Clo
sed
Sal
es
Pai
d in
Cas
h
0
100
200
300
400
500
600
700
Cas
h S
ale
sMonthly Market Detail - December 2020
2016 2017 2018 2019 2020
Palm Beach County
Single Family Homes
Cash SalesThe number of Closed Sales during the month in whichbuyers exclusively paid in cash
2016 2017 2018 2019 2020
Cash Sales as a Percentage of Closed SalesThe percentage of Closed Sales during the monthwhich were Cash Sales

Produced by Florida Realtors® with data provided by Florida's multiple listing services. Statistics for each month compiled from MLS feeds on the 15th day of the following month.
Data released on Friday, January 22, 2021. Next data release is Friday, February 19, 2021.
Month Median Sale PricePercent Change
Year-over-Year
December 2020 $425,000 16.8%
Year-to-Date $389,500 9.7%
May 2020 $365,000 0.0%
November 2020 $418,000 19.4%
October 2020 $420,000 17.0%
July 2020 $399,000 12.4%
June 2020 $376,000 5.3%
September 2020 $400,000 12.7%
August 2020 $399,000 12.4%
April 2020 $365,000 4.3%
March 2020 $370,000 5.7%
February 2020 $363,000 6.8%
January 2020 $363,000 6.8%
December 2019 $364,000 5.6%
Month Average Sale PricePercent Change
Year-over-Year
December 2020 $855,831 73.0%
November 2020 $753,028 53.8%
October 2020 $701,353 35.4%
September 2020 $656,309 15.0%
14.8%
August 2020 $650,286 27.0%
July 2020 $737,439 27.5%
June 2020 $673,758 32.8%
May 2020 $655,752 10.8%
April 2020 $579,898 0.5%
26.0%$683,102Year-to-Date
Economists' note : Median Sale Price is our preferred summary
statistic for price activity because, unlike Average Sale Price, Median
Sale Price is not sensitive to high sale prices for small numbers of
homes that may not be characteristic of the market area. Keep in mind
that median price trends over time are not always solely caused by
changes in the general value of local real estate. Median sale price only
reflects the values of the homes that sold each month, and the mix of
the types of homes that sell can change over time.
Economists' note : Usually, we prefer Median Sale Price over Average
Sale Price as a summary statistic for home prices. However, Average
Sale Price does have its uses—particularly when it is analyzed
alongside the Median Sale Price. For one, the relative difference
between the two statistics can provide some insight into the market for
higher-end homes in an area.January 2020 $609,770 8.0%
December 2019 $494,689 2.4%
March 2020 $611,000 11.5%
February 2020 $608,819
J F M A M J J A S O N D J F M A M J J A S O N D J F M A M J J A S O N D J F M A M J J A S O N D J F M A M J J A S O N D
J F M A M J J A S O N D J F M A M J J A S O N D J F M A M J J A S O N D J F M A M J J A S O N D J F M A M J J A S O N D
$0K
$200K
$400K
$600K
$800K
$1000K
Ave
rage
Sal
e P
rice
$0K
$100K
$200K
$300K
$400K
$500K
Me
dia
n S
ale
Pri
ceMonthly Market Detail - December 2020
2016 2017 2018 2019 2020
Palm Beach County
Single Family Homes
Median Sale PriceThe median sale price reported for the month (i.e. 50% of sales were above and 50% of sales were below)
2016 2017 2018 2019 2020
Average Sale PriceThe average sale price reported for the month (i.e. total sales in dollars divided by the number of sales)

Produced by Florida Realtors® with data provided by Florida's multiple listing services. Statistics for each month compiled from MLS feeds on the 15th day of the following month.
Data released on Friday, January 22, 2021. Next data release is Friday, February 19, 2021.
Month Dollar VolumePercent Change
Year-over-Year
December 2020 $1.5 Billion 117.4%
Year-to-Date $12.4 Billion 31.4%
-41.3%
November 2020 $1.2 Billion 97.5%
October 2020 $1.3 Billion 79.8%
$949.5 Million 14.0%
September 2020 $1.1 Billion 47.9%
August 2020 $1.2 Billion 47.1%
July 2020 $1.4 Billion 39.3%
June 2020 $995.8 Million 16.0%
May 2020 $649.9 Million
December 2020 96.8% 1.6%
November 2020 96.7% 1.6%
October 2020 96.5% 1.5%
September 2020 96.5% 1.6%
0.7%
August 2020 96.1% 1.3%
July 2020 95.9% 0.9%
June 2020 95.0% 0.3%
May 2020 95.0% 0.4%
April 2020 95.8% 1.5%
Economists' note : The Median Percent of Original List Price Received
is useful as an indicator of market recovery, since it typically rises as
buyers realize that the market may be moving away from them and
they need to match the selling price (or better it) in order to get a
contract on the house. This is usually the last measure to indicate a
market has shifted from down to up, so it is what we would call a
lagging indicator.
Economists' note : Dollar Volume is simply the sum of all sale prices
in a given time period, and can quickly be calculated by multiplying
Closed Sales by Average Sale Price. It is a strong indicator of the health
of the real estate industry in a market, and is of particular interest to
real estate professionals, investors, analysts, and government agencies.
Potential home sellers and home buyers, on the other hand, will likely
be better served by paying attention to trends in the two components
of Dollar Volume (i.e. sales and prices) individually.
1.2%95.9%Year-to-Date
MonthMed. Pct. of Orig.
List Price Received
Percent Change
Year-over-Year
January 2020 94.8% 0.4%
December 2019
December 2019 $702.5 Million 18.4%
February 2020
95.3% 0.7%
March 2020 95.4%
April 2020 $690.7 Million -30.2%
March 2020
$750.7 Million 29.0%
January 2020 $667.1 Million 39.6%
1.2%
February 2020 95.0%
J F M A M J J A S O N D J F M A M J J A S O N D J F M A M J J A S O N D J F M A M J J A S O N D J F M A M J J A S O N D
J F M A M J J A S O N D J F M A M J J A S O N D J F M A M J J A S O N D J F M A M J J A S O N D J F M A M J J A S O N D
0%
20%
40%
60%
80%
100%
120%
Me
d. P
ct. o
f O
rig.
Li
st P
rice
Re
ceiv
ed
Monthly Market Detail - December 2020
2016 2017 2018 2019 2020
Palm Beach County
Single Family Homes
Dollar VolumeThe sum of the sale prices for all sales which closed during the month
2016 2017 2018 2019 2020
Median Percent of Original List Price ReceivedThe median of the sale price (as a percentage of the original list price) across all properties selling during the month
$0
$500 M
$1.0 B
$1.5 B
$2.0 B
Do
llar
Vo
lum
e

Produced by Florida Realtors® with data provided by Florida's multiple listing services. Statistics for each month compiled from MLS feeds on the 15th day of the following month.
Data released on Friday, January 22, 2021. Next data release is Friday, February 19, 2021.
21 Days -61.1%
September 2020 27 Days -49.1%
April 2020 29 Days -47.3%
MonthMedian Time to
Contract
Percent Change
Year-over-Year
December 2020 28 Days -34.9%
37 Days -30.2%Year-to-Date
November 2020 24 Days -45.5%
October 2020
June 2020 56 Days 12.0%
May 2020 37 Days -28.8%
August 2020 35 Days -27.1%
July 2020 53 Days 8.2%
44 Days -29.0%
February 2020 61 Days 0.0%
March 2020
January 2020 52 Days -7.1%
December 2019 43 Days -18.9%
Month Median Time to SalePercent Change
Year-over-Year
December 2020 71 Days -12.3%
-12.6%83 DaysYear-to-Date
November 2020 68 Days -22.7%
October 2020 68 Days -28.4%
-13.7%
September 2020 74 Days -24.5%
August 2020 79 Days -13.2%
July 2020 98 Days 4.3%
June 2020 102 Days 5.2%
May 2020 84 Days -13.4%
December 2019 81 Days -11.0%
Economists' note : Time to Sale is a measure of the length of the home
selling process, calculated as the number of days between the initial
listing of a property and the closing of the sale. Median Time to Sale is
the amount of time the "middle" property selling this month was on
the market. That is, 50% of homes selling this month took less time to
sell, and 50% of homes took more time to sell. Median Time to Sale
gives a more accurate picture than Average Time to Sale, which can be
skewed upward by small numbers of properties taking an abnormally
long time to sell.
Economists' note : Like Time to Sale, Time to Contract is a measure of
the length of the home selling process calculated for sales which closed
during the month. The difference is that Time to Contract measures
the number of days between the initial listing of a property and the
signing of the contract which eventually led to the closing of the sale.
When the gap between Median Time to Contract and Median Time to
Sale grows, it is usually a sign of longer closing times and/or declining
numbers of cash sales.
February 2020 103 Days 3.0%
January 2020 97 Days 0.0%
April 2020 76 Days -21.6%
March 2020 88 Days
J F M A M J J A S O N D J F M A M J J A S O N D J F M A M J J A S O N D J F M A M J J A S O N D J F M A M J J A S O N D
J F M A M J J A S O N D J F M A M J J A S O N D J F M A M J J A S O N D J F M A M J J A S O N D J F M A M J J A S O N D0
20
40
60
80
100
120
Me
dia
n T
ime
to
Sa
le
0
10
20
30
40
50
60
70
Me
dia
n T
ime
to
C
on
trac
tMonthly Market Detail - December 2020
2016 2017 2018 2019 2020
Palm Beach County
Single Family Homes
Median Time to ContractThe median number of days between the listing date and contract date for all Closed Sales during the month
2016 2017 2018 2019 2020
Median Time to SaleThe median number of days between the listing date and closing date for all Closed Sales during the month
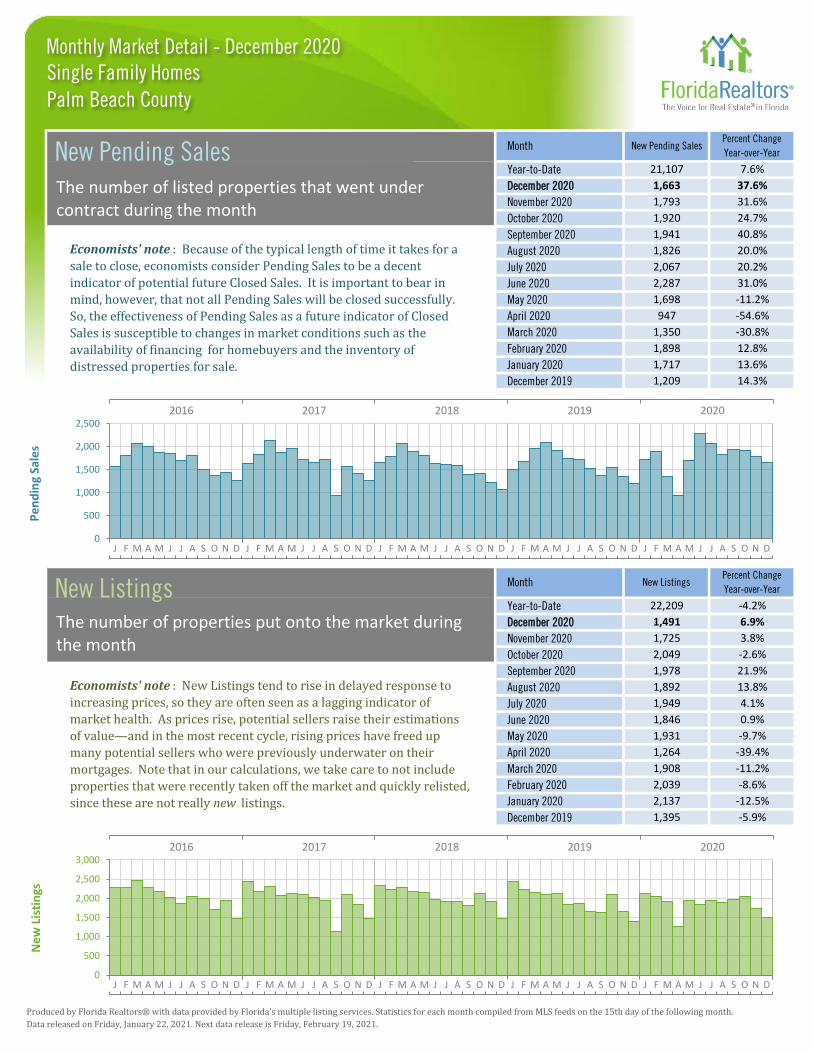
Produced by Florida Realtors® with data provided by Florida's multiple listing services. Statistics for each month compiled from MLS feeds on the 15th day of the following month.
Data released on Friday, January 22, 2021. Next data release is Friday, February 19, 2021.
Economists' note : New Listings tend to rise in delayed response to
increasing prices, so they are often seen as a lagging indicator of
market health. As prices rise, potential sellers raise their estimations
of value—and in the most recent cycle, rising prices have freed up
many potential sellers who were previously underwater on their
mortgages. Note that in our calculations, we take care to not include
properties that were recently taken off the market and quickly relisted,
since these are not really new listings.
Economists' note : Because of the typical length of time it takes for a
sale to close, economists consider Pending Sales to be a decent
indicator of potential future Closed Sales. It is important to bear in
mind, however, that not all Pending Sales will be closed successfully.
So, the effectiveness of Pending Sales as a future indicator of Closed
Sales is susceptible to changes in market conditions such as the
availability of financing for homebuyers and the inventory of
distressed properties for sale.
Month New Pending SalesPercent Change
Year-over-Year
December 2020 1,663 37.6%
Year-to-Date 21,107 7.6%
May 2020 1,698 -11.2%
November 2020 1,793 31.6%
October 2020 1,920 24.7%
July 2020 2,067 20.2%
June 2020 2,287 31.0%
September 2020 1,941 40.8%
August 2020 1,826 20.0%
April 2020 947 -54.6%
March 2020 1,350 -30.8%
February 2020 1,898 12.8%
January 2020 1,717 13.6%
December 2019 1,209 14.3%
Month New ListingsPercent Change
Year-over-Year
December 2020 1,491 6.9%
November 2020 1,725 3.8%
October 2020 2,049 -2.6%
September 2020 1,978 21.9%
1,931 -9.7%
April 2020 1,264 -39.4%
December 2019 1,395 -5.9%
March 2020 1,908 -11.2%
February 2020 2,039 -8.6%
Year-to-Date 22,209 -4.2%
January 2020 2,137 -12.5%
August 2020 1,892 13.8%
July 2020 1,949 4.1%
June 2020 1,846 0.9%
May 2020
J F M A M J J A S O N D J F M A M J J A S O N D J F M A M J J A S O N D J F M A M J J A S O N D J F M A M J J A S O N D
J F M A M J J A S O N D J F M A M J J A S O N D J F M A M J J A S O N D J F M A M J J A S O N D J F M A M J J A S O N D
0
500
1,000
1,500
2,000
2,500
3,000
Ne
w L
isti
ngs
0
500
1,000
1,500
2,000
2,500
Pe
nd
ing
Sale
sMonthly Market Detail - December 2020
2016 2017 2018 2019 2020
Palm Beach County
Single Family Homes
New Pending SalesThe number of listed properties that went under contract during the month
2016 2017 2018 2019 2020
New ListingsThe number of properties put onto the market during the month

Produced by Florida Realtors® with data provided by Florida's multiple listing services. Statistics for each month compiled from MLS feeds on the 15th day of the following month.
Data released on Friday, January 22, 2021. Next data release is Friday, February 19, 2021.
Economists' note : There are a number of ways to define and calculate
Inventory. Our method is to simply count the number of active listings
on the last day of the month, and hold this number to compare with the
same month the following year. Inventory rises when New Listings are
outpacing the number of listings that go off-market (regardless of
whether they actually sell). Likewise, it falls when New Listings aren't
keeping up with the rate at which homes are going off-market.
Economists' note : MSI is a useful indicator of market conditions. The
benchmark for a balanced market (favoring neither buyer nor seller) is
5.5 months of inventory. Anything higher is traditionally a buyers'
market, and anything lower is a sellers' market. There is no single
accepted way of calculating MSI. A common method is to divide
current Inventory by the most recent month's Closed Sales count, but
this count is a usually poor predictor of future Closed Sales due to
seasonal cycles. To eliminate seasonal effects, we use the 12-month
average of monthly Closed Sales instead.
YTD (Monthly Avg) 4.0 -18.4%
Month Months SupplyPercent Change
Year-over-Year
December 2019 4.2 -17.6%
February 2020 4.2 -27.6%
January 2020 4.3
December 2019 6,162 -16.1%
February 2020 6,282 -24.0%
January 2020 6,347 -21.3%
-23.2%
April 2020 4.2 -20.8%
March 2020 4.2 -26.3%
June 2020 3.7 -22.9%
May 2020 4.3 -15.7%
August 2020 3.0 -30.2%
July 2020 3.4 -24.4%
October 2020 2.8 -37.8%
September 2020 2.9 -32.6%
December 2020 2.3 -45.2%
November 2020 2.7 -38.6%
6,265 -21.3%
June 2020 4,989 -26.1%
May 2020 5,850 -18.6%
April 2020 6,126 -18.5%
March 2020
-32.6%
August 2020 4,227 -31.9%
July 2020 4,642 -28.5%
September 2020 4,141
Month InventoryPercent Change
Year-over-Year
December 2020 3,551 -42.4%
5,041 -27.6%YTD (Monthly Avg)
November 2020 3,940 -38.3%
October 2020 4,131 -35.6%
J F M A M J J A S O N D J F M A M J J A S O N D J F M A M J J A S O N D J F M A M J J A S O N D J F M A M J J A S O N D
J F M A M J J A S O N D J F M A M J J A S O N D J F M A M J J A S O N D J F M A M J J A S O N D J F M A M J J A S O N D
0.0
1.0
2.0
3.0
4.0
5.0
6.0
7.0
Mo
nth
s Su
pp
ly o
f In
ven
tory
0
2,000
4,000
6,000
8,000
10,000
Inve
nto
ryMonthly Market Detail - December 2020
2016 2017 2018 2019 2020
Palm Beach County
Single Family Homes
Inventory (Active Listings)The number of property listings active at the end of the month
2016 2017 2018 2019 2020
Months Supply of InventoryAn estimate of the number of months it will take to deplete the current Inventory given recent sales rates

Produced by Florida Realtors® with data provided by Florida's multiple listing services. Statistics for each month compiled from MLS feeds on the 15th day of the following month.
Data released on Friday, January 22, 2021. Next data release is Friday, February 19, 2021.
$600,000 - $999,999 38 Days -54.2%
$1,000,000 or more 85 Days -11.5%
Economists' note : Like Time to Sale, Time to Contract is a measure of
the length of the home selling process calculated for sales which closed
during the month. The difference is that Time to Contract measures
the number of days between the initial listing of a property and the
signing of the contract which eventually led to the closing of the sale.
When the gap between Median Time to Contract and Median Time to
Sale grows, it is usually a sign of longer closing times and/or declining
numbers of cash sales.
$150,000 - $199,999 40 Days 14.3%
$200,000 - $249,999 29 Days 38.1%
$250,000 - $299,999
$400,000 - $599,999 18 Days -62.5%
23 Days -11.5%
$300,000 - $399,999 18 Days -55.0%
Economists' note: Closed Sales are one of the simplest—yet most
important—indicators for the residential real estate market. When
comparing Closed Sales across markets of different sizes, we
recommend comparing the percent changes in sales rather than the
number of sales. Closed Sales (and many other market metrics) are
affected by seasonal cycles, so actual trends are more accurately
represented by year-over-year changes (i.e. comparing a month's sales
to the amount of sales in the same month in the previous year), rather
than changes from one month to the next.
Sale PriceMedian Time to
Contract
Percent Change
Year-over-Year
Less than $50,000 34 Days -66.3%
$1,000,000 or more 235 167.0%
$250,000 - $299,999 153 -11.0%
$300,000 - $399,999 404 0.7%
$50,000 - $99,999 38 Days -32.1%
$100,000 - $149,999
$400,000 - $599,999 505 54.9%
$600,000 - $999,999 252 64.7%
36 Days -12.2%
$150,000 - $199,999 75 -2.6%
$200,000 - $249,999 110 -20.9%
$100,000 - $149,999 30 -36.2%
Sale Price Closed SalesPercent Change
Year-over-Year
Less than $50,000 6 200.0%
$50,000 - $99,999 14 -6.7%
0
20
40
60
80
100
120
Less than$50,000
$50,000 -$99,999
$100,000 -$149,999
$150,000 -$199,999
$200,000 -$249,999
$250,000 -$299,999
$300,000 -$399,999
$400,000 -$599,999
$600,000 -$999,999
$1,000,000 ormore
Me
dia
n T
ime
to
Co
ntr
act
December 2019 December 2020
0
20
40
60
80
100
120
0
100
200
300
400
500
600
Less than$50,000
$50,000 -$99,999
$100,000 -$149,999
$150,000 -$199,999
$200,000 -$249,999
$250,000 -$299,999
$300,000 -$399,999
$400,000 -$599,999
$600,000 -$999,999
$1,000,000 ormore
Clo
sed
Sal
es
December 2019 December 2020
0
100
200
300
400
500
600
Monthly Market Detail - December 2020
Palm Beach County
Single Family Homes
Closed Sales by Sale PriceThe number of sales transactions which closed during the month
Median Time to Contract by Sale PriceThe median number of days between the listing date and contract date for all Closed Sales during the month

Produced by Florida Realtors® with data provided by Florida's multiple listing services. Statistics for each month compiled from MLS feeds on the 15th day of the following month.
Data released on Friday, January 22, 2021. Next data release is Friday, February 19, 2021.
$600,000 - $999,999 605 -36.6%
$1,000,000 or more 1,124 -31.7%
Economists' note : There are a number of ways to define and calculate
Inventory. Our method is to simply count the number of active listings
on the last day of the month, and hold this number to compare with the
same month the following year. Inventory rises when New Listings are
outpacing the number of listings that go off-market (regardless of
whether they actually sell). Likewise, it falls when New Listings aren't
keeping up with the rate at which homes are going off-market.
$150,000 - $199,999 152 -49.0%
$200,000 - $249,999 180 -48.4%
$250,000 - $299,999 209 -55.5%
$300,000 - $399,999 530 -47.4%
$400,000 - $599,999 651 -48.0%
$50,000 - $99,999 32 -17.9%
$100,000 - $149,999 68 -52.8%
Current Listing Price InventoryPercent Change
Year-over-Year
Less than $50,000 0 -100.0%
$600,000 - $999,999 235 48.7%
$1,000,000 or more 210 14.1%
Economists' note: New Listings tend to rise in delayed response to
increasing prices, so they are often seen as a lagging indicator of
market health. As prices rise, potential sellers raise their estimations
of value—and in the most recent cycle, rising prices have freed up
many potential sellers who were previously underwater on their
mortgages. Note that in our calculations, we take care to not include
properties that were recently taken off the market and quickly relisted,
since these are not really new listings.
$150,000 - $199,999 55 -42.1%
$200,000 - $249,999 109 -4.4%
$250,000 - $299,999 128 -19.0%
$300,000 - $399,999 329 1.5%
$400,000 - $599,999 395 22.3%
$50,000 - $99,999 9 50.0%
$100,000 - $149,999 21 -30.0%
Initial Listing Price New ListingsPercent Change
Year-over-Year
Less than $50,000 0 -100.0%
0200400600800
1,0001,2001,4001,6001,800
Less than$50,000
$50,000 -$99,999
$100,000 -$149,999
$150,000 -$199,999
$200,000 -$249,999
$250,000 -$299,999
$300,000 -$399,999
$400,000 -$599,999
$600,000 -$999,999
$1,000,000 ormore
Inve
nto
ry
December 2019 December 2020
050
100150200250300350400450
Less than$50,000
$50,000 -$99,999
$100,000 -$149,999
$150,000 -$199,999
$200,000 -$249,999
$250,000 -$299,999
$300,000 -$399,999
$400,000 -$599,999
$600,000 -$999,999
$1,000,000 ormore
Ne
w L
isti
ngs
December 2019 December 2020
02004006008001,0001,2001,4001,6001,800
050100150200250300350400450
Monthly Market Detail - December 2020
Palm Beach County
Single Family Homes
New Listings by Initial Listing PriceThe number of properties put onto the market during the month
Inventory by Current Listing PriceThe number of property listings active at the end of the month

Closed Sales
Median Sale Price
Closed Sales
Median Sale Price
Closed Sales
Median Sale Price
Produced by Florida Realtors® with data provided by Florida's multiple listing services. Statistics for each month compiled from MLS feeds on the 15th day of the following month.
Data released on Friday, January 22, 2021. Next data release is Friday, February 19, 2021.
Short Sale
7 10 -30.0%
$375,000 $225,000 66.7%
Foreclosure/REO
18 36 -50.0%
$358,450 $293,750 22.0%
December 2020 December 2019Percent Change
Year-over-Year
Traditional
1,759 1,374 28.0%
$425,000 $365,000 16.4%
$0K
$50K
$100K
$150K
$200K
$250K
$300K
$350K
$400K
$450K
Me
dia
n S
ale
Pri
ce
0%
10%
20%
30%
40%
50%
60%
70%
80%
90%
100%
Clo
sed
Sal
es
Traditional Foreclosure/REO Short Sale
J F M A M J J A S O N D J F M A M J J A S O N D J F M A M J J A S O N D J F M A M J J A S O N D J F M A M J J A S O N D
J F M A M J J A S O N D J F M A M J J A S O N D J F M A M J J A S O N D J F M A M J J A S O N D J F M A M J J A S O N D
Monthly Distressed Market - December 2020
Palm Beach CountySingle Family Homes
2016 2017 2018 2019 2020
2016 2017 2018 2019 2020

Produced by Florida Realtors® with data provided by Florida's multiple listing services. Statistics for each month compiled from MLS feeds on the 15th day of the following month.
Data released on Friday, January 22, 2021. Next data release is Friday, February 19, 2021.
Year-to-Date 13,347 -0.4%
6.0%
1,382 6.4%
Closed Sales
1,295
85 Days
1,616 41.4%
5,892 -12.8%
5.3 -13.2%
Summary Statistics
Closed Sales
Paid in Cash
94.7%
December 2020
$230,000Median Sale Price
Average Sale Price
Dollar Volume
Median Percent of Original
List Price Received
$189,900 21.1%
$499.2 Million $438.2 Million 13.9%
$385,488 $358,567 7.5%
December 2019Percent Change
Year-over-Year
687 661 3.9%
1,295 1,222 6.0%
94.3% 0.4%
43 Days 45 Days -4.4%
December 2020
Median Time to Contract
81 Days
1,367
Median Time to Sale
New Pending Sales
New Listings
Month
1,471
Pending Inventory 2,285
Inventory (Active Listings) 5,140
Months Supply of Inventory 4.6
-4.7%
957 42.8%
Percent Change
Year-over-Year
895
December 2019 1,222
May 2020 597
April 2020 861
August 2020 1,200
July 2020 1,316
June 2020 937
Economists' note : Closed Sales are one of the simplest—yet most
important—indicators for the residential real estate market. When
comparing Closed Sales across markets of different sizes, we
recommend comparing the percent changes in sales rather than the
number of sales. Closed Sales (and many other market metrics) are
affected by seasonal cycles, so actual trends are more accurately
represented by year-over-year changes (i.e. comparing a month's sales
to the amount of sales in the same month in the previous year), rather
than changes from one month to the next.
November 2020 1,277 37.3%
35.7%
28.8%
October 2020 1,415
September 2020 1,257
24.7%
March 2020 1,282
February 2020 1,015
6.4%
12.5%
20.3%
5.2%
6.8%
-58.9%
-37.8%
-19.6%
January 2020
2016 2017 2018 2019 2020
J F M A M J J A S O N D J F M A M J J A S O N D J F M A M J J A S O N D J F M A M J J A S O N D J F M A M J J A S O N D
Monthly Market Detail - December 2020
Palm Beach County
Townhouses and Condos
Closed SalesThe number of sales transactions which closed duringthe month
0
500
1,000
1,500
2,000
Clo
sed
Sal
es

Produced by Florida Realtors® with data provided by Florida's multiple listing services. Statistics for each month compiled from MLS feeds on the 15th day of the following month.
Data released on Friday, January 22, 2021. Next data release is Friday, February 19, 2021.
September 2020
Month Cash SalesPercent Change
Year-over-Year
December 2020 687 3.9%
November 2020 665 24.3%
October 2020 717 20.1%
Year-to-Date 7,039 -6.7%
733 0.4%
621 20.1%
August 2020 590 -2.3%
May 2020 318 -62.1%
July 2020 655 3.0%
June 2020 473 -24.9%
December 2020 53.1% -1.8%
November 2020 52.1% -9.4%
October 2020 50.7% -11.4%
September 2020 49.4% -6.8%
4.0%
August 2020 49.2% -7.0%
July 2020 49.8% -3.5%
June 2020 50.5% -6.5%
May 2020 53.3% -7.8%
April 2020 49.5% -15.4%
Economists' note : This statistic is simply another way of viewing
Cash Sales. The remaining percentages of Closed Sales (i.e. those not
paid fully in cash) each month involved some sort of financing, such as
mortgages, owner/seller financing, assumed loans, etc.
Economists' note : Cash Sales can be a useful indicator of the extent to
which investors are participating in the market. Why? Investors are
far more likely to have the funds to purchase a home available up front,
whereas the typical homebuyer requires a mortgage or some other
form of financing. There are, of course, many possible exceptions, so
this statistic should be interpreted with care.
Year-to-Date 52.7% -6.4%
MonthPercent of Closed
Sales Paid in Cash
Percent Change
Year-over-Year
January 2020 58.1% -3.0%
December 2019
December 2019 661 14.8%
February 2020
54.1% -8.0%
March 2020 57.2%
April 2020 426 -47.3%
March 2020
634 17.0%
January 2020 520 16.6%
-5.6%
February 2020 62.5%
J F M A M J J A S O N D J F M A M J J A S O N D J F M A M J J A S O N D J F M A M J J A S O N D J F M A M J J A S O N D
J F M A M J J A S O N D J F M A M J J A S O N D J F M A M J J A S O N D J F M A M J J A S O N D J F M A M J J A S O N D
0%
20%
40%
60%
80%
Pct
. of
Clo
sed
Sal
es
Pai
d in
Cas
h
0
200
400
600
800
1,000
Cas
h S
ale
sMonthly Market Detail - December 2020
2016 2017 2018 2019 2020
Palm Beach County
Townhouses and Condos
Cash SalesThe number of Closed Sales during the month in whichbuyers exclusively paid in cash
2016 2017 2018 2019 2020
Cash Sales as a Percentage of Closed SalesThe percentage of Closed Sales during the monthwhich were Cash Sales

Produced by Florida Realtors® with data provided by Florida's multiple listing services. Statistics for each month compiled from MLS feeds on the 15th day of the following month.
Data released on Friday, January 22, 2021. Next data release is Friday, February 19, 2021.
Month Median Sale PricePercent Change
Year-over-Year
December 2020 $230,000 21.1%
Year-to-Date $205,000 12.6%
May 2020 $200,000 8.1%
November 2020 $220,000 16.9%
October 2020 $211,000 22.7%
July 2020 $205,000 10.8%
June 2020 $205,000 7.9%
September 2020 $206,250 9.4%
August 2020 $215,000 17.8%
April 2020 $195,000 5.4%
March 2020 $199,000 13.7%
February 2020 $189,000 3.3%
January 2020 $195,000 11.4%
December 2019 $189,900 5.6%
Month Average Sale PricePercent Change
Year-over-Year
December 2020 $385,488 7.5%
November 2020 $382,588 16.6%
October 2020 $311,449 14.4%
September 2020 $332,192 7.6%
13.4%
August 2020 $305,311 -4.9%
July 2020 $304,464 3.8%
June 2020 $304,657 7.8%
May 2020 $343,898 21.1%
April 2020 $345,789 6.0%
9.0%$336,637Year-to-Date
Economists' note : Median Sale Price is our preferred summary
statistic for price activity because, unlike Average Sale Price, Median
Sale Price is not sensitive to high sale prices for small numbers of
homes that may not be characteristic of the market area. Keep in mind
that median price trends over time are not always solely caused by
changes in the general value of local real estate. Median sale price only
reflects the values of the homes that sold each month, and the mix of
the types of homes that sell can change over time.
Economists' note : Usually, we prefer Median Sale Price over Average
Sale Price as a summary statistic for home prices. However, Average
Sale Price does have its uses—particularly when it is analyzed
alongside the Median Sale Price. For one, the relative difference
between the two statistics can provide some insight into the market for
higher-end homes in an area.January 2020 $332,928 22.6%
December 2019 $358,567 31.0%
March 2020 $355,747 1.2%
February 2020 $332,494
J F M A M J J A S O N D J F M A M J J A S O N D J F M A M J J A S O N D J F M A M J J A S O N D J F M A M J J A S O N D
J F M A M J J A S O N D J F M A M J J A S O N D J F M A M J J A S O N D J F M A M J J A S O N D J F M A M J J A S O N D
$0K
$100K
$200K
$300K
$400K
$500K
Ave
rage
Sal
e P
rice
$0K
$50K
$100K
$150K
$200K
$250K
Me
dia
n S
ale
Pri
ceMonthly Market Detail - December 2020
2016 2017 2018 2019 2020
Palm Beach County
Townhouses and Condos
Median Sale PriceThe median sale price reported for the month (i.e. 50% of sales were above and 50% of sales were below)
2016 2017 2018 2019 2020
Average Sale PriceThe average sale price reported for the month (i.e. total sales in dollars divided by the number of sales)
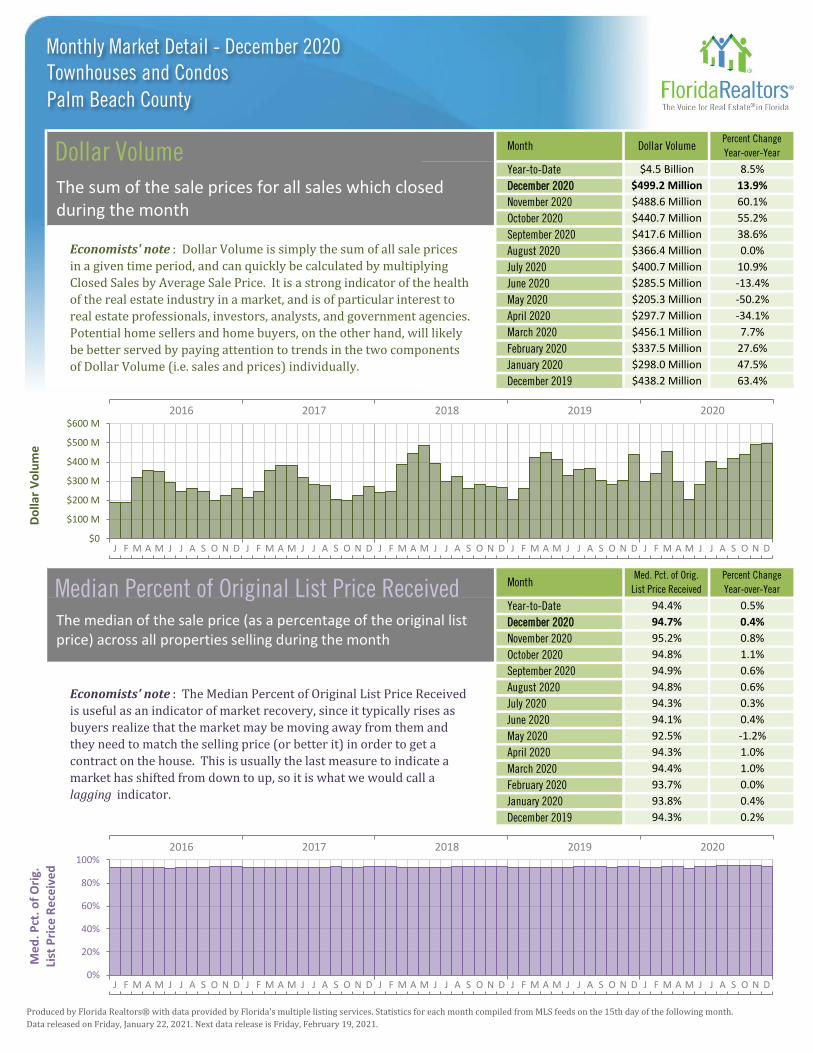
Produced by Florida Realtors® with data provided by Florida's multiple listing services. Statistics for each month compiled from MLS feeds on the 15th day of the following month.
Data released on Friday, January 22, 2021. Next data release is Friday, February 19, 2021.
Month Dollar VolumePercent Change
Year-over-Year
December 2020 $499.2 Million 13.9%
Year-to-Date $4.5 Billion 8.5%
-50.2%
November 2020 $488.6 Million 60.1%
October 2020 $440.7 Million 55.2%
$456.1 Million 7.7%
September 2020 $417.6 Million 38.6%
August 2020 $366.4 Million 0.0%
July 2020 $400.7 Million 10.9%
June 2020 $285.5 Million -13.4%
May 2020 $205.3 Million
December 2020 94.7% 0.4%
November 2020 95.2% 0.8%
October 2020 94.8% 1.1%
September 2020 94.9% 0.6%
0.0%
August 2020 94.8% 0.6%
July 2020 94.3% 0.3%
June 2020 94.1% 0.4%
May 2020 92.5% -1.2%
April 2020 94.3% 1.0%
Economists' note : The Median Percent of Original List Price Received
is useful as an indicator of market recovery, since it typically rises as
buyers realize that the market may be moving away from them and
they need to match the selling price (or better it) in order to get a
contract on the house. This is usually the last measure to indicate a
market has shifted from down to up, so it is what we would call a
lagging indicator.
Economists' note : Dollar Volume is simply the sum of all sale prices
in a given time period, and can quickly be calculated by multiplying
Closed Sales by Average Sale Price. It is a strong indicator of the health
of the real estate industry in a market, and is of particular interest to
real estate professionals, investors, analysts, and government agencies.
Potential home sellers and home buyers, on the other hand, will likely
be better served by paying attention to trends in the two components
of Dollar Volume (i.e. sales and prices) individually.
0.5%94.4%Year-to-Date
MonthMed. Pct. of Orig.
List Price Received
Percent Change
Year-over-Year
January 2020 93.8% 0.4%
December 2019
December 2019 $438.2 Million 63.4%
February 2020
94.3% 0.2%
March 2020 94.4%
April 2020 $297.7 Million -34.1%
March 2020
$337.5 Million 27.6%
January 2020 $298.0 Million 47.5%
1.0%
February 2020 93.7%
J F M A M J J A S O N D J F M A M J J A S O N D J F M A M J J A S O N D J F M A M J J A S O N D J F M A M J J A S O N D
J F M A M J J A S O N D J F M A M J J A S O N D J F M A M J J A S O N D J F M A M J J A S O N D J F M A M J J A S O N D
0%
20%
40%
60%
80%
100%
Me
d. P
ct. o
f O
rig.
Li
st P
rice
Re
ceiv
ed
Monthly Market Detail - December 2020
2016 2017 2018 2019 2020
Palm Beach County
Townhouses and Condos
Dollar VolumeThe sum of the sale prices for all sales which closed during the month
2016 2017 2018 2019 2020
Median Percent of Original List Price ReceivedThe median of the sale price (as a percentage of the original list price) across all properties selling during the month
$0
$100 M
$200 M
$300 M
$400 M
$500 M
$600 M
Do
llar
Vo
lum
e

Produced by Florida Realtors® with data provided by Florida's multiple listing services. Statistics for each month compiled from MLS feeds on the 15th day of the following month.
Data released on Friday, January 22, 2021. Next data release is Friday, February 19, 2021.
36 Days -36.8%
September 2020 35 Days -40.7%
April 2020 37 Days -33.9%
MonthMedian Time to
Contract
Percent Change
Year-over-Year
December 2020 43 Days -4.4%
49 Days -10.9%Year-to-Date
November 2020 42 Days -8.7%
October 2020
June 2020 67 Days 21.8%
May 2020 52 Days -7.1%
August 2020 44 Days -24.1%
July 2020 64 Days 20.8%
48 Days -5.9%
February 2020 59 Days -1.7%
March 2020
January 2020 50 Days -20.6%
December 2019 45 Days -6.3%
Month Median Time to SalePercent Change
Year-over-Year
December 2020 81 Days -4.7%
-5.3%90 DaysYear-to-Date
November 2020 85 Days -1.2%
October 2020 80 Days -19.2%
-2.2%
September 2020 79 Days -20.2%
August 2020 87 Days -10.3%
July 2020 106 Days 11.6%
June 2020 107 Days 12.6%
May 2020 94 Days -4.1%
December 2019 85 Days -2.3%
Economists' note : Time to Sale is a measure of the length of the home
selling process, calculated as the number of days between the initial
listing of a property and the closing of the sale. Median Time to Sale is
the amount of time the "middle" property selling this month was on
the market. That is, 50% of homes selling this month took less time to
sell, and 50% of homes took more time to sell. Median Time to Sale
gives a more accurate picture than Average Time to Sale, which can be
skewed upward by small numbers of properties taking an abnormally
long time to sell.
Economists' note : Like Time to Sale, Time to Contract is a measure of
the length of the home selling process calculated for sales which closed
during the month. The difference is that Time to Contract measures
the number of days between the initial listing of a property and the
signing of the contract which eventually led to the closing of the sale.
When the gap between Median Time to Contract and Median Time to
Sale grows, it is usually a sign of longer closing times and/or declining
numbers of cash sales.
February 2020 97 Days 0.0%
January 2020 91 Days -8.1%
April 2020 85 Days -12.4%
March 2020 89 Days
J F M A M J J A S O N D J F M A M J J A S O N D J F M A M J J A S O N D J F M A M J J A S O N D J F M A M J J A S O N D
J F M A M J J A S O N D J F M A M J J A S O N D J F M A M J J A S O N D J F M A M J J A S O N D J F M A M J J A S O N D0
20
40
60
80
100
120
Me
dia
n T
ime
to
Sa
le
0
20
40
60
80
Me
dia
n T
ime
to
C
on
trac
tMonthly Market Detail - December 2020
2016 2017 2018 2019 2020
Palm Beach County
Townhouses and Condos
Median Time to ContractThe median number of days between the listing date and contract date for all Closed Sales during the month
2016 2017 2018 2019 2020
Median Time to SaleThe median number of days between the listing date and closing date for all Closed Sales during the month

Produced by Florida Realtors® with data provided by Florida's multiple listing services. Statistics for each month compiled from MLS feeds on the 15th day of the following month.
Data released on Friday, January 22, 2021. Next data release is Friday, February 19, 2021.
Economists' note : New Listings tend to rise in delayed response to
increasing prices, so they are often seen as a lagging indicator of
market health. As prices rise, potential sellers raise their estimations
of value—and in the most recent cycle, rising prices have freed up
many potential sellers who were previously underwater on their
mortgages. Note that in our calculations, we take care to not include
properties that were recently taken off the market and quickly relisted,
since these are not really new listings.
Economists' note : Because of the typical length of time it takes for a
sale to close, economists consider Pending Sales to be a decent
indicator of potential future Closed Sales. It is important to bear in
mind, however, that not all Pending Sales will be closed successfully.
So, the effectiveness of Pending Sales as a future indicator of Closed
Sales is susceptible to changes in market conditions such as the
availability of financing for homebuyers and the inventory of
distressed properties for sale.
Month New Pending SalesPercent Change
Year-over-Year
December 2020 1,367 42.8%
Year-to-Date 15,691 4.0%
May 2020 1,104 -20.0%
November 2020 1,340 14.8%
October 2020 1,557 33.6%
July 2020 1,505 19.9%
June 2020 1,486 14.2%
September 2020 1,545 52.7%
August 2020 1,269 6.5%
April 2020 521 -66.6%
March 2020 993 -35.3%
February 2020 1,563 16.6%
January 2020 1,441 18.1%
December 2019 957 11.4%
Month New ListingsPercent Change
Year-over-Year
December 2020 1,471 6.4%
November 2020 1,568 -0.1%
October 2020 1,810 -0.7%
September 2020 1,748 24.3%
1,716 7.3%
April 2020 926 -43.7%
December 2019 1,382 7.5%
March 2020 1,565 -11.4%
February 2020 1,838 2.6%
Year-to-Date 19,706 2.6%
January 2020 2,055 -2.7%
August 2020 1,635 20.2%
July 2020 1,704 23.6%
June 2020 1,670 21.7%
May 2020
J F M A M J J A S O N D J F M A M J J A S O N D J F M A M J J A S O N D J F M A M J J A S O N D J F M A M J J A S O N D
J F M A M J J A S O N D J F M A M J J A S O N D J F M A M J J A S O N D J F M A M J J A S O N D J F M A M J J A S O N D
0
500
1,000
1,500
2,000
2,500
Ne
w L
isti
ngs
0
500
1,000
1,500
2,000
Pe
nd
ing
Sale
sMonthly Market Detail - December 2020
2016 2017 2018 2019 2020
Palm Beach County
Townhouses and Condos
New Pending SalesThe number of listed properties that went under contract during the month
2016 2017 2018 2019 2020
New ListingsThe number of properties put onto the market during the month
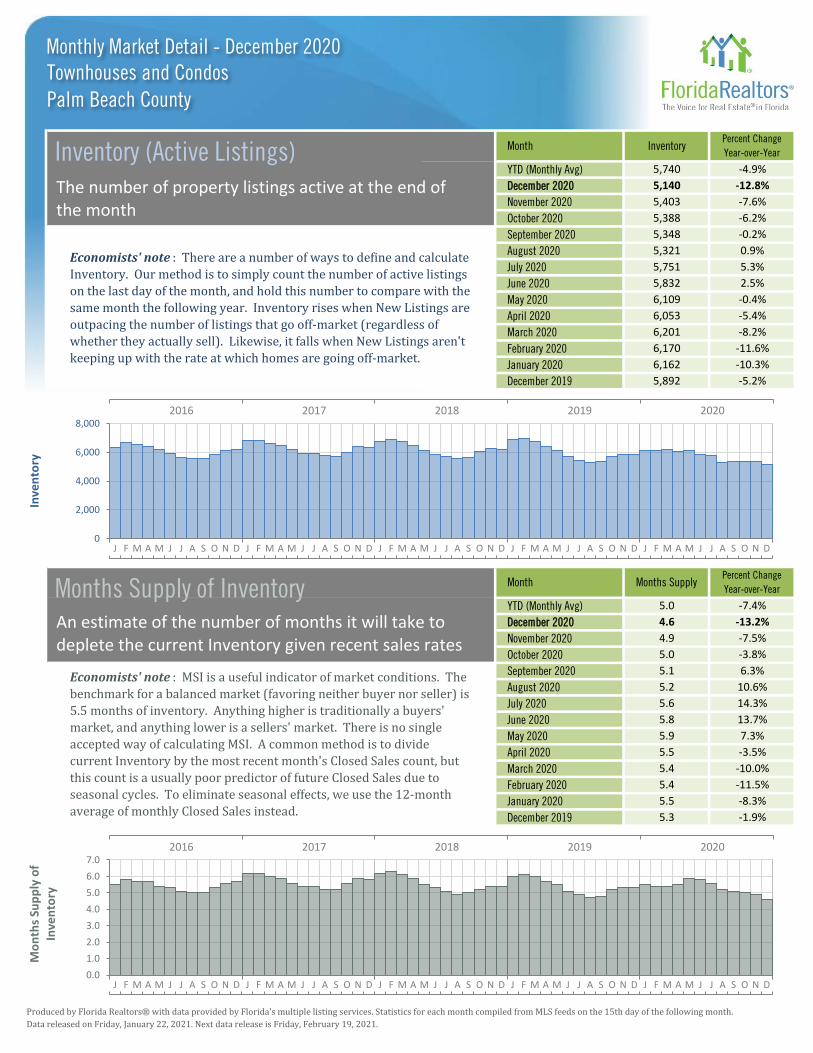
Produced by Florida Realtors® with data provided by Florida's multiple listing services. Statistics for each month compiled from MLS feeds on the 15th day of the following month.
Data released on Friday, January 22, 2021. Next data release is Friday, February 19, 2021.
Economists' note : There are a number of ways to define and calculate
Inventory. Our method is to simply count the number of active listings
on the last day of the month, and hold this number to compare with the
same month the following year. Inventory rises when New Listings are
outpacing the number of listings that go off-market (regardless of
whether they actually sell). Likewise, it falls when New Listings aren't
keeping up with the rate at which homes are going off-market.
Economists' note : MSI is a useful indicator of market conditions. The
benchmark for a balanced market (favoring neither buyer nor seller) is
5.5 months of inventory. Anything higher is traditionally a buyers'
market, and anything lower is a sellers' market. There is no single
accepted way of calculating MSI. A common method is to divide
current Inventory by the most recent month's Closed Sales count, but
this count is a usually poor predictor of future Closed Sales due to
seasonal cycles. To eliminate seasonal effects, we use the 12-month
average of monthly Closed Sales instead.
YTD (Monthly Avg) 5.0 -7.4%
Month Months SupplyPercent Change
Year-over-Year
December 2019 5.3 -1.9%
February 2020 5.4 -11.5%
January 2020 5.5
December 2019 5,892 -5.2%
February 2020 6,170 -11.6%
January 2020 6,162 -10.3%
-8.3%
April 2020 5.5 -3.5%
March 2020 5.4 -10.0%
June 2020 5.8 13.7%
May 2020 5.9 7.3%
August 2020 5.2 10.6%
July 2020 5.6 14.3%
October 2020 5.0 -3.8%
September 2020 5.1 6.3%
December 2020 4.6 -13.2%
November 2020 4.9 -7.5%
6,201 -8.2%
June 2020 5,832 2.5%
May 2020 6,109 -0.4%
April 2020 6,053 -5.4%
March 2020
-0.2%
August 2020 5,321 0.9%
July 2020 5,751 5.3%
September 2020 5,348
Month InventoryPercent Change
Year-over-Year
December 2020 5,140 -12.8%
5,740 -4.9%YTD (Monthly Avg)
November 2020 5,403 -7.6%
October 2020 5,388 -6.2%
J F M A M J J A S O N D J F M A M J J A S O N D J F M A M J J A S O N D J F M A M J J A S O N D J F M A M J J A S O N D
J F M A M J J A S O N D J F M A M J J A S O N D J F M A M J J A S O N D J F M A M J J A S O N D J F M A M J J A S O N D
0.0
1.0
2.0
3.0
4.0
5.0
6.0
7.0
Mo
nth
s Su
pp
ly o
f In
ven
tory
0
2,000
4,000
6,000
8,000
Inve
nto
ryMonthly Market Detail - December 2020
2016 2017 2018 2019 2020
Palm Beach County
Townhouses and Condos
Inventory (Active Listings)The number of property listings active at the end of the month
2016 2017 2018 2019 2020
Months Supply of InventoryAn estimate of the number of months it will take to deplete the current Inventory given recent sales rates

Produced by Florida Realtors® with data provided by Florida's multiple listing services. Statistics for each month compiled from MLS feeds on the 15th day of the following month.
Data released on Friday, January 22, 2021. Next data release is Friday, February 19, 2021.
$600,000 - $999,999 62 Days -43.6%
$1,000,000 or more 159 Days 10.4%
Economists' note : Like Time to Sale, Time to Contract is a measure of
the length of the home selling process calculated for sales which closed
during the month. The difference is that Time to Contract measures
the number of days between the initial listing of a property and the
signing of the contract which eventually led to the closing of the sale.
When the gap between Median Time to Contract and Median Time to
Sale grows, it is usually a sign of longer closing times and/or declining
numbers of cash sales.
$150,000 - $199,999 40 Days -9.1%
$200,000 - $249,999 23 Days -37.8%
$250,000 - $299,999
$400,000 - $599,999 63 Days -35.1%
26 Days -43.5%
$300,000 - $399,999 39 Days -20.4%
Economists' note: Closed Sales are one of the simplest—yet most
important—indicators for the residential real estate market. When
comparing Closed Sales across markets of different sizes, we
recommend comparing the percent changes in sales rather than the
number of sales. Closed Sales (and many other market metrics) are
affected by seasonal cycles, so actual trends are more accurately
represented by year-over-year changes (i.e. comparing a month's sales
to the amount of sales in the same month in the previous year), rather
than changes from one month to the next.
Sale PriceMedian Time to
Contract
Percent Change
Year-over-Year
Less than $50,000 34 Days -20.9%
$1,000,000 or more 79 64.6%
$250,000 - $299,999 149 38.0%
$300,000 - $399,999 133 16.7%
$50,000 - $99,999 51 Days 2.0%
$100,000 - $149,999
$400,000 - $599,999 136 56.3%
$600,000 - $999,999 84 44.8%
37 Days 27.6%
$150,000 - $199,999 202 -17.9%
$200,000 - $249,999 168 4.3%
$100,000 - $149,999 187 -4.1%
Sale Price Closed SalesPercent Change
Year-over-Year
Less than $50,000 26 -18.8%
$50,000 - $99,999 131 -24.3%
020406080
100120140160180
Less than$50,000
$50,000 -$99,999
$100,000 -$149,999
$150,000 -$199,999
$200,000 -$249,999
$250,000 -$299,999
$300,000 -$399,999
$400,000 -$599,999
$600,000 -$999,999
$1,000,000 ormore
Me
dia
n T
ime
to
Co
ntr
act
December 2019 December 2020
020406080100120140160180
0
50
100
150
200
250
300
Less than$50,000
$50,000 -$99,999
$100,000 -$149,999
$150,000 -$199,999
$200,000 -$249,999
$250,000 -$299,999
$300,000 -$399,999
$400,000 -$599,999
$600,000 -$999,999
$1,000,000 ormore
Clo
sed
Sal
es
December 2019 December 2020
0
50
100
150
200
250
300
Monthly Market Detail - December 2020
Palm Beach County
Townhouses and Condos
Closed Sales by Sale PriceThe number of sales transactions which closed during the month
Median Time to Contract by Sale PriceThe median number of days between the listing date and contract date for all Closed Sales during the month
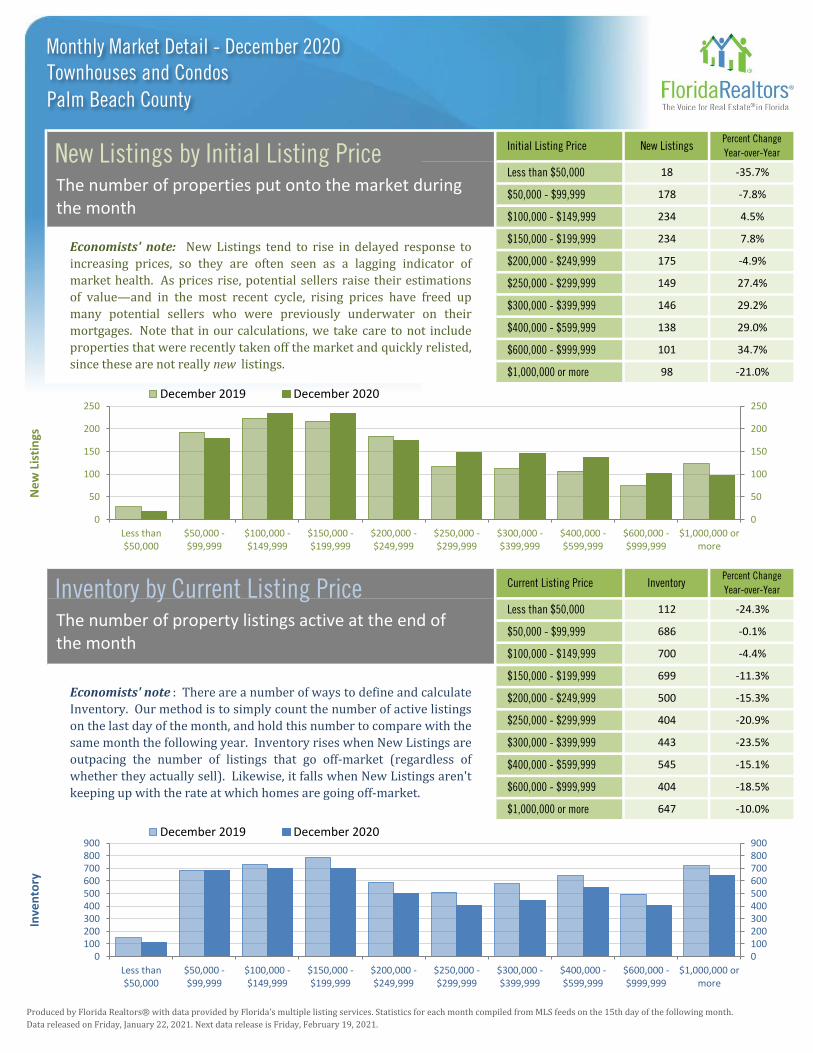
Produced by Florida Realtors® with data provided by Florida's multiple listing services. Statistics for each month compiled from MLS feeds on the 15th day of the following month.
Data released on Friday, January 22, 2021. Next data release is Friday, February 19, 2021.
$600,000 - $999,999 404 -18.5%
$1,000,000 or more 647 -10.0%
Economists' note : There are a number of ways to define and calculate
Inventory. Our method is to simply count the number of active listings
on the last day of the month, and hold this number to compare with the
same month the following year. Inventory rises when New Listings are
outpacing the number of listings that go off-market (regardless of
whether they actually sell). Likewise, it falls when New Listings aren't
keeping up with the rate at which homes are going off-market.
$150,000 - $199,999 699 -11.3%
$200,000 - $249,999 500 -15.3%
$250,000 - $299,999 404 -20.9%
$300,000 - $399,999 443 -23.5%
$400,000 - $599,999 545 -15.1%
$50,000 - $99,999 686 -0.1%
$100,000 - $149,999 700 -4.4%
Current Listing Price InventoryPercent Change
Year-over-Year
Less than $50,000 112 -24.3%
$600,000 - $999,999 101 34.7%
$1,000,000 or more 98 -21.0%
Economists' note: New Listings tend to rise in delayed response to
increasing prices, so they are often seen as a lagging indicator of
market health. As prices rise, potential sellers raise their estimations
of value—and in the most recent cycle, rising prices have freed up
many potential sellers who were previously underwater on their
mortgages. Note that in our calculations, we take care to not include
properties that were recently taken off the market and quickly relisted,
since these are not really new listings.
$150,000 - $199,999 234 7.8%
$200,000 - $249,999 175 -4.9%
$250,000 - $299,999 149 27.4%
$300,000 - $399,999 146 29.2%
$400,000 - $599,999 138 29.0%
$50,000 - $99,999 178 -7.8%
$100,000 - $149,999 234 4.5%
Initial Listing Price New ListingsPercent Change
Year-over-Year
Less than $50,000 18 -35.7%
0100200300400500600700800900
Less than$50,000
$50,000 -$99,999
$100,000 -$149,999
$150,000 -$199,999
$200,000 -$249,999
$250,000 -$299,999
$300,000 -$399,999
$400,000 -$599,999
$600,000 -$999,999
$1,000,000 ormore
Inve
nto
ry
December 2019 December 2020
0
50
100
150
200
250
Less than$50,000
$50,000 -$99,999
$100,000 -$149,999
$150,000 -$199,999
$200,000 -$249,999
$250,000 -$299,999
$300,000 -$399,999
$400,000 -$599,999
$600,000 -$999,999
$1,000,000 ormore
Ne
w L
isti
ngs
December 2019 December 2020
0100200300400500600700800900
0
50
100
150
200
250
Monthly Market Detail - December 2020
Palm Beach County
Townhouses and Condos
New Listings by Initial Listing PriceThe number of properties put onto the market during the month
Inventory by Current Listing PriceThe number of property listings active at the end of the month

Closed Sales
Median Sale Price
Closed Sales
Median Sale Price
Closed Sales
Median Sale Price
Produced by Florida Realtors® with data provided by Florida's multiple listing services. Statistics for each month compiled from MLS feeds on the 15th day of the following month.
Data released on Friday, January 22, 2021. Next data release is Friday, February 19, 2021.
Short Sale
0 3 -100.0%
(No Sales) $78,500 N/A
Foreclosure/REO
9 39 -76.9%
$150,000 $162,000 -7.4%
December 2020 December 2019Percent Change
Year-over-Year
Traditional
1,286 1,180 9.0%
$230,000 $195,000 17.9%
$0K
$100K
$200K
$300K
$400K
$500K
$600K
Me
dia
n S
ale
Pri
ce
80%
82%
84%
86%
88%
90%
92%
94%
96%
98%
100%
Clo
sed
Sal
es
Traditional Foreclosure/REO Short Sale
J F M A M J J A S O N D J F M A M J J A S O N D J F M A M J J A S O N D J F M A M J J A S O N D J F M A M J J A S O N D
J F M A M J J A S O N D J F M A M J J A S O N D J F M A M J J A S O N D J F M A M J J A S O N D J F M A M J J A S O N D
Monthly Distressed Market - December 2020
Palm Beach CountyTownhouses and Condos
2016 2017 2018 2019 2020
2016 2017 2018 2019 2020
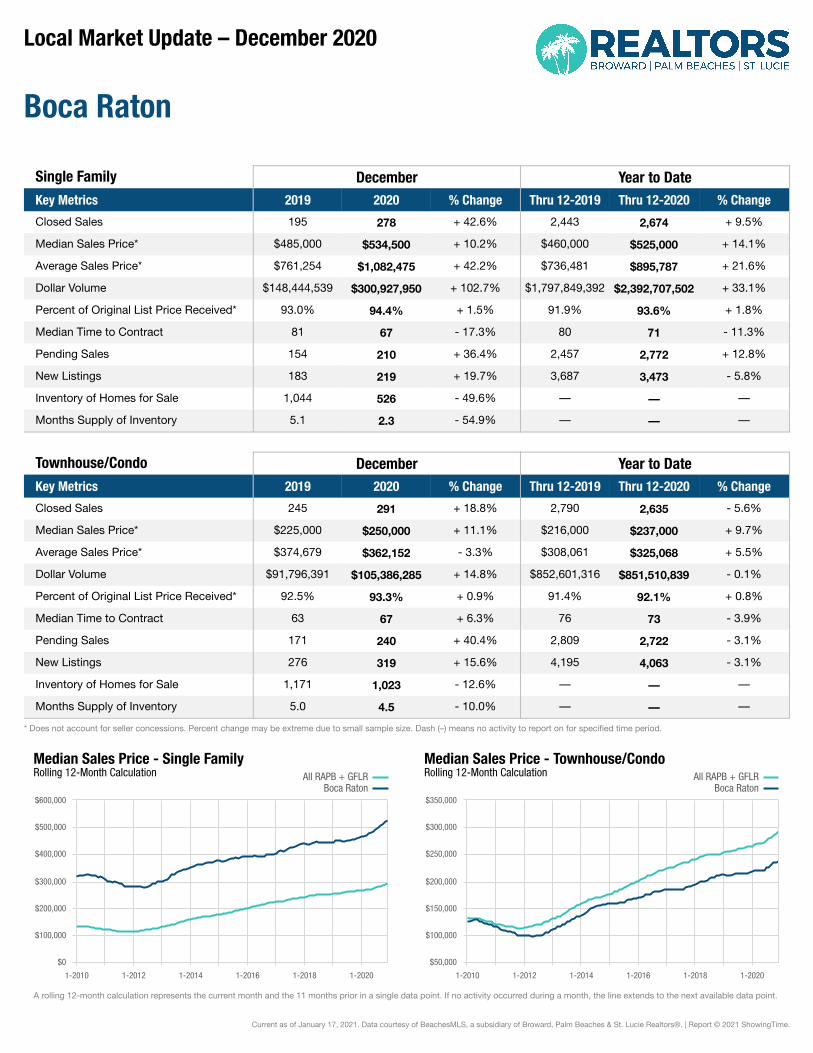
Local Market Update – December 2020
Boca Raton
Single Family December Year to DateKey Metrics 2019 2020 % Change Thru 12-2019 Thru 12-2020 % Change
Closed Sales 195 278 + 42.6% 2,443 2,674 + 9.5%
Median Sales Price* $485,000 $534,500 + 10.2% $460,000 $525,000 + 14.1%
Average Sales Price* $761,254 $1,082,475 + 42.2% $736,481 $895,787 + 21.6%
Dollar Volume $148,444,539 $300,927,950 + 102.7% $1,797,849,392 $2,392,707,502 + 33.1%
Percent of Original List Price Received* 93.0% 94.4% + 1.5% 91.9% 93.6% + 1.8%
Median Time to Contract 81 67 - 17.3% 80 71 - 11.3%
Pending Sales 154 210 + 36.4% 2,457 2,772 + 12.8%
New Listings 183 219 + 19.7% 3,687 3,473 - 5.8%
Inventory of Homes for Sale 1,044 526 - 49.6% –– –– ––
Months Supply of Inventory 5.1 2.3 - 54.9% –– –– ––
Townhouse/Condo December Year to DateKey Metrics 2019 2020 % Change Thru 12-2019 Thru 12-2020 % Change
Closed Sales 245 291 + 18.8% 2,790 2,635 - 5.6%
Median Sales Price* $225,000 $250,000 + 11.1% $216,000 $237,000 + 9.7%
Average Sales Price* $374,679 $362,152 - 3.3% $308,061 $325,068 + 5.5%
Dollar Volume $91,796,391 $105,386,285 + 14.8% $852,601,316 $851,510,839 - 0.1%
Percent of Original List Price Received* 92.5% 93.3% + 0.9% 91.4% 92.1% + 0.8%
Median Time to Contract 63 67 + 6.3% 76 73 - 3.9%
Pending Sales 171 240 + 40.4% 2,809 2,722 - 3.1%
New Listings 276 319 + 15.6% 4,195 4,063 - 3.1%
Inventory of Homes for Sale 1,171 1,023 - 12.6% –– –– ––
Months Supply of Inventory 5.0 4.5 - 10.0% –– –– ––
* Does not account for seller concessions. Percent change may be extreme due to small sample size. Dash (–) means no activity to report on for specified time period.
A rolling 12-month calculation represents the current month and the 11 months prior in a single data point. If no activity occurred during a month, the line extends to the next available data point.
Median Sales Price - Single FamilyRolling 12-Month Calculation All RAPB + GFLR
Boca Raton
1-2010 1-2012 1-2014 1-2016 1-2018 1-2020
$0
$100,000
$200,000
$300,000
$400,000
$500,000
$600,000
Median Sales Price - Townhouse/CondoRolling 12-Month Calculation All RAPB + GFLR
Boca Raton
1-2010 1-2012 1-2014 1-2016 1-2018 1-2020
$50,000
$100,000
$150,000
$200,000
$250,000
$300,000
$350,000
Current as of January 17, 2021. Data courtesy of BeachesMLS, a subsidiary of Broward, Palm Beaches & St. Lucie Realtors®. | Report © 2021 ShowingTime.

Local Market Update – December 2020
Boynton Beach
Single Family December Year to DateKey Metrics 2019 2020 % Change Thru 12-2019 Thru 12-2020 % Change
Closed Sales 189 265 + 40.2% 2,261 2,209 - 2.3%
Median Sales Price* $339,000 $370,000 + 9.1% $329,000 $350,000 + 6.4%
Average Sales Price* $363,262 $418,296 + 15.1% $359,986 $391,576 + 8.8%
Dollar Volume $68,656,573 $110,430,263 + 60.8% $813,928,776 $863,058,715 + 6.0%
Percent of Original List Price Received* 94.5% 96.0% + 1.6% 93.8% 95.2% + 1.5%
Median Time to Contract 58 39 - 32.8% 60 51 - 15.0%
Pending Sales 131 165 + 26.0% 2,285 2,260 - 1.1%
New Listings 180 180 0.0% 3,005 2,747 - 8.6%
Inventory of Homes for Sale 593 318 - 46.4% –– –– ––
Months Supply of Inventory 3.1 1.7 - 45.2% –– –– ––
Townhouse/Condo December Year to DateKey Metrics 2019 2020 % Change Thru 12-2019 Thru 12-2020 % Change
Closed Sales 167 180 + 7.8% 1,865 1,852 - 0.7%
Median Sales Price* $187,250 $209,500 + 11.9% $183,000 $195,000 + 6.6%
Average Sales Price* $187,696 $217,352 + 15.8% $186,816 $203,085 + 8.7%
Dollar Volume $31,197,555 $39,123,400 + 25.4% $346,410,290 $374,635,867 + 8.1%
Percent of Original List Price Received* 92.9% 93.5% + 0.6% 92.3% 93.2% + 1.0%
Median Time to Contract 58 53 - 8.6% 64 63 - 1.6%
Pending Sales 107 123 + 15.0% 1,872 1,876 + 0.2%
New Listings 190 189 - 0.5% 2,606 2,458 - 5.7%
Inventory of Homes for Sale 662 470 - 29.0% –– –– ––
Months Supply of Inventory 4.2 3.0 - 28.6% –– –– ––
* Does not account for seller concessions. Percent change may be extreme due to small sample size. Dash (–) means no activity to report on for specified time period.
A rolling 12-month calculation represents the current month and the 11 months prior in a single data point. If no activity occurred during a month, the line extends to the next available data point.
Median Sales Price - Single FamilyRolling 12-Month Calculation All RAPB + GFLR
Boynton Beach
1-2010 1-2012 1-2014 1-2016 1-2018 1-2020
$100,000
$150,000
$200,000
$250,000
$300,000
$350,000
$400,000
Median Sales Price - Townhouse/CondoRolling 12-Month Calculation All RAPB + GFLR
Boynton Beach
1-2010 1-2012 1-2014 1-2016 1-2018 1-2020
$50,000
$100,000
$150,000
$200,000
$250,000
$300,000
$350,000
Current as of January 17, 2021. Data courtesy of BeachesMLS, a subsidiary of Broward, Palm Beaches & St. Lucie Realtors®. | Report © 2021 ShowingTime.
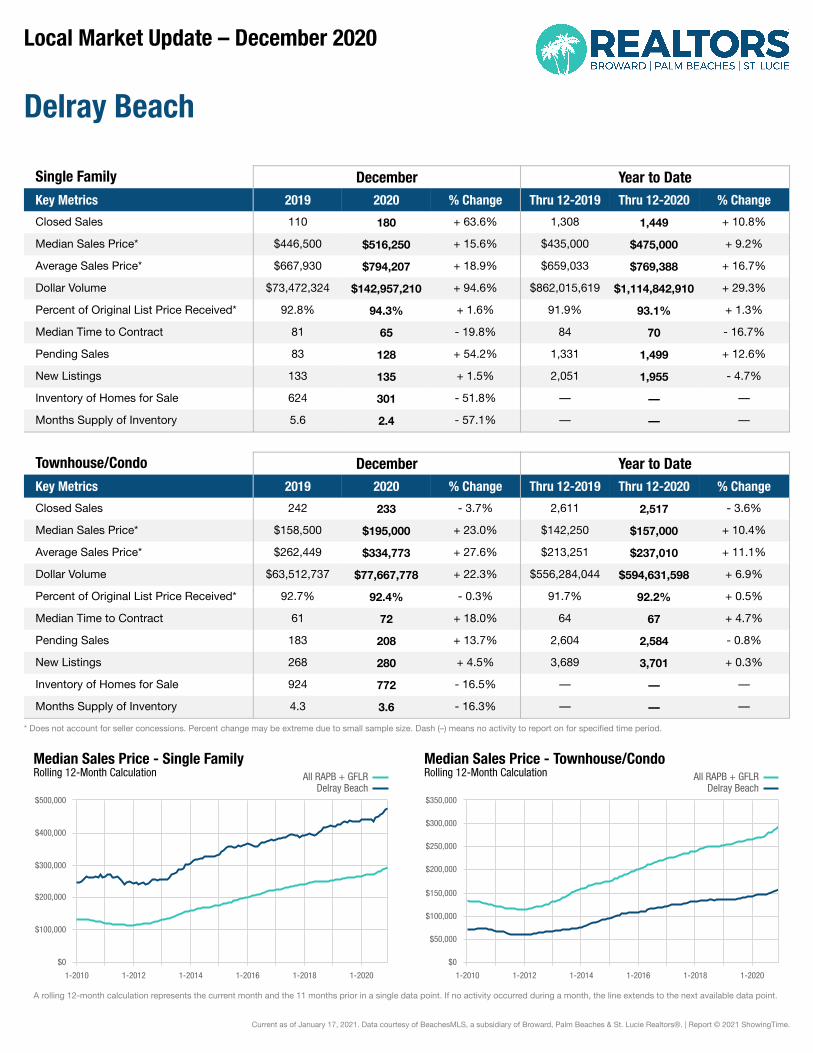
Local Market Update – December 2020
Delray Beach
Single Family December Year to DateKey Metrics 2019 2020 % Change Thru 12-2019 Thru 12-2020 % Change
Closed Sales 110 180 + 63.6% 1,308 1,449 + 10.8%
Median Sales Price* $446,500 $516,250 + 15.6% $435,000 $475,000 + 9.2%
Average Sales Price* $667,930 $794,207 + 18.9% $659,033 $769,388 + 16.7%
Dollar Volume $73,472,324 $142,957,210 + 94.6% $862,015,619 $1,114,842,910 + 29.3%
Percent of Original List Price Received* 92.8% 94.3% + 1.6% 91.9% 93.1% + 1.3%
Median Time to Contract 81 65 - 19.8% 84 70 - 16.7%
Pending Sales 83 128 + 54.2% 1,331 1,499 + 12.6%
New Listings 133 135 + 1.5% 2,051 1,955 - 4.7%
Inventory of Homes for Sale 624 301 - 51.8% –– –– ––
Months Supply of Inventory 5.6 2.4 - 57.1% –– –– ––
Townhouse/Condo December Year to DateKey Metrics 2019 2020 % Change Thru 12-2019 Thru 12-2020 % Change
Closed Sales 242 233 - 3.7% 2,611 2,517 - 3.6%
Median Sales Price* $158,500 $195,000 + 23.0% $142,250 $157,000 + 10.4%
Average Sales Price* $262,449 $334,773 + 27.6% $213,251 $237,010 + 11.1%
Dollar Volume $63,512,737 $77,667,778 + 22.3% $556,284,044 $594,631,598 + 6.9%
Percent of Original List Price Received* 92.7% 92.4% - 0.3% 91.7% 92.2% + 0.5%
Median Time to Contract 61 72 + 18.0% 64 67 + 4.7%
Pending Sales 183 208 + 13.7% 2,604 2,584 - 0.8%
New Listings 268 280 + 4.5% 3,689 3,701 + 0.3%
Inventory of Homes for Sale 924 772 - 16.5% –– –– ––
Months Supply of Inventory 4.3 3.6 - 16.3% –– –– ––
* Does not account for seller concessions. Percent change may be extreme due to small sample size. Dash (–) means no activity to report on for specified time period.
A rolling 12-month calculation represents the current month and the 11 months prior in a single data point. If no activity occurred during a month, the line extends to the next available data point.
Median Sales Price - Single FamilyRolling 12-Month Calculation All RAPB + GFLR
Delray Beach
1-2010 1-2012 1-2014 1-2016 1-2018 1-2020
$0
$100,000
$200,000
$300,000
$400,000
$500,000
Median Sales Price - Townhouse/CondoRolling 12-Month Calculation All RAPB + GFLR
Delray Beach
1-2010 1-2012 1-2014 1-2016 1-2018 1-2020
$0
$50,000
$100,000
$150,000
$200,000
$250,000
$300,000
$350,000
Current as of January 17, 2021. Data courtesy of BeachesMLS, a subsidiary of Broward, Palm Beaches & St. Lucie Realtors®. | Report © 2021 ShowingTime.

Local Market Update – December 2020
Jupiter
Single Family December Year to DateKey Metrics 2019 2020 % Change Thru 12-2019 Thru 12-2020 % Change
Closed Sales 84 98 + 16.7% 1,123 1,157 + 3.0%
Median Sales Price* $540,000 $680,500 + 26.0% $524,750 $580,000 + 10.5%
Average Sales Price* $692,954 $1,382,759 + 99.5% $768,502 $987,000 + 28.4%
Dollar Volume $58,208,105 $135,510,400 + 132.8% $865,659,400 $1,141,958,830 + 31.9%
Percent of Original List Price Received* 93.9% 96.1% + 2.3% 93.4% 94.8% + 1.5%
Median Time to Contract 54 40 - 25.9% 63 57 - 9.5%
Pending Sales 69 63 - 8.7% 1,154 1,157 + 0.3%
New Listings 86 80 - 7.0% 1,509 1,372 - 9.1%
Inventory of Homes for Sale 315 175 - 44.4% –– –– ––
Months Supply of Inventory 3.3 1.8 - 45.5% –– –– ––
Townhouse/Condo December Year to DateKey Metrics 2019 2020 % Change Thru 12-2019 Thru 12-2020 % Change
Closed Sales 85 100 + 17.6% 862 928 + 7.7%
Median Sales Price* $308,000 $375,000 + 21.8% $305,000 $332,500 + 9.0%
Average Sales Price* $376,961 $512,909 + 36.1% $358,237 $398,808 + 11.3%
Dollar Volume $32,041,725 $51,290,900 + 60.1% $308,442,207 $370,094,102 + 20.0%
Percent of Original List Price Received* 93.8% 94.7% + 1.0% 93.6% 94.7% + 1.2%
Median Time to Contract 56 68 + 21.4% 62 53 - 14.5%
Pending Sales 51 73 + 43.1% 867 959 + 10.6%
New Listings 79 74 - 6.3% 1,156 1,232 + 6.6%
Inventory of Homes for Sale 245 171 - 30.2% –– –– ––
Months Supply of Inventory 3.4 2.1 - 38.2% –– –– ––
* Does not account for seller concessions. Percent change may be extreme due to small sample size. Dash (–) means no activity to report on for specified time period.
A rolling 12-month calculation represents the current month and the 11 months prior in a single data point. If no activity occurred during a month, the line extends to the next available data point.
Median Sales Price - Single FamilyRolling 12-Month Calculation All RAPB + GFLR
Jupiter
1-2010 1-2012 1-2014 1-2016 1-2018 1-2020
$0
$100,000
$200,000
$300,000
$400,000
$500,000
$600,000
$700,000
Median Sales Price - Townhouse/CondoRolling 12-Month Calculation All RAPB + GFLR
Jupiter
1-2010 1-2012 1-2014 1-2016 1-2018 1-2020
$100,000
$150,000
$200,000
$250,000
$300,000
$350,000
Current as of January 17, 2021. Data courtesy of BeachesMLS, a subsidiary of Broward, Palm Beaches & St. Lucie Realtors®. | Report © 2021 ShowingTime.
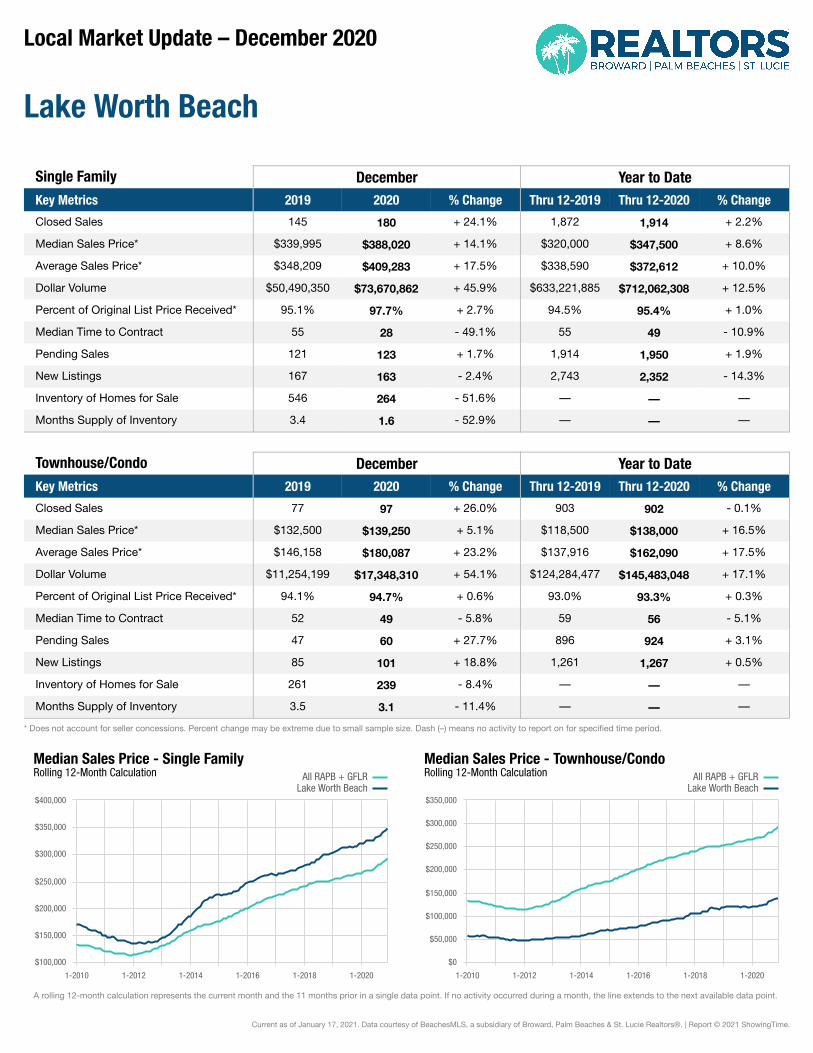
Local Market Update – December 2020
Lake Worth Beach
Single Family December Year to DateKey Metrics 2019 2020 % Change Thru 12-2019 Thru 12-2020 % Change
Closed Sales 145 180 + 24.1% 1,872 1,914 + 2.2%
Median Sales Price* $339,995 $388,020 + 14.1% $320,000 $347,500 + 8.6%
Average Sales Price* $348,209 $409,283 + 17.5% $338,590 $372,612 + 10.0%
Dollar Volume $50,490,350 $73,670,862 + 45.9% $633,221,885 $712,062,308 + 12.5%
Percent of Original List Price Received* 95.1% 97.7% + 2.7% 94.5% 95.4% + 1.0%
Median Time to Contract 55 28 - 49.1% 55 49 - 10.9%
Pending Sales 121 123 + 1.7% 1,914 1,950 + 1.9%
New Listings 167 163 - 2.4% 2,743 2,352 - 14.3%
Inventory of Homes for Sale 546 264 - 51.6% –– –– ––
Months Supply of Inventory 3.4 1.6 - 52.9% –– –– ––
Townhouse/Condo December Year to DateKey Metrics 2019 2020 % Change Thru 12-2019 Thru 12-2020 % Change
Closed Sales 77 97 + 26.0% 903 902 - 0.1%
Median Sales Price* $132,500 $139,250 + 5.1% $118,500 $138,000 + 16.5%
Average Sales Price* $146,158 $180,087 + 23.2% $137,916 $162,090 + 17.5%
Dollar Volume $11,254,199 $17,348,310 + 54.1% $124,284,477 $145,483,048 + 17.1%
Percent of Original List Price Received* 94.1% 94.7% + 0.6% 93.0% 93.3% + 0.3%
Median Time to Contract 52 49 - 5.8% 59 56 - 5.1%
Pending Sales 47 60 + 27.7% 896 924 + 3.1%
New Listings 85 101 + 18.8% 1,261 1,267 + 0.5%
Inventory of Homes for Sale 261 239 - 8.4% –– –– ––
Months Supply of Inventory 3.5 3.1 - 11.4% –– –– ––
* Does not account for seller concessions. Percent change may be extreme due to small sample size. Dash (–) means no activity to report on for specified time period.
A rolling 12-month calculation represents the current month and the 11 months prior in a single data point. If no activity occurred during a month, the line extends to the next available data point.
Median Sales Price - Single FamilyRolling 12-Month Calculation All RAPB + GFLR
Lake Worth Beach
1-2010 1-2012 1-2014 1-2016 1-2018 1-2020
$100,000
$150,000
$200,000
$250,000
$300,000
$350,000
$400,000
Median Sales Price - Townhouse/CondoRolling 12-Month Calculation All RAPB + GFLR
Lake Worth Beach
1-2010 1-2012 1-2014 1-2016 1-2018 1-2020
$0
$50,000
$100,000
$150,000
$200,000
$250,000
$300,000
$350,000
Current as of January 17, 2021. Data courtesy of BeachesMLS, a subsidiary of Broward, Palm Beaches & St. Lucie Realtors®. | Report © 2021 ShowingTime.

Local Market Update – December 2020
Palm Beach
Single Family December Year to DateKey Metrics 2019 2020 % Change Thru 12-2019 Thru 12-2020 % Change
Closed Sales 4 32 + 700.0% 83 180 + 116.9%
Median Sales Price* $4,375,000 $4,820,000 + 10.2% $5,000,000 $5,400,000 + 8.0%
Average Sales Price* $3,827,500 $6,510,466 + 70.1% $7,152,678 $7,225,310 + 1.0%
Dollar Volume $15,310,000 $208,334,900 + 1,260.8% $593,672,281 $1,295,780,532 + 118.3%
Percent of Original List Price Received* 87.5% 88.5% + 1.1% 85.2% 85.5% + 0.4%
Median Time to Contract 225 164 - 27.1% 190 199 + 4.7%
Pending Sales 10 24 + 140.0% 92 189 + 105.4%
New Listings 16 20 + 25.0% 205 185 - 9.8%
Inventory of Homes for Sale 144 57 - 60.4% –– –– ––
Months Supply of Inventory 18.8 3.6 - 80.9% –– –– ––
Townhouse/Condo December Year to DateKey Metrics 2019 2020 % Change Thru 12-2019 Thru 12-2020 % Change
Closed Sales 17 41 + 141.2% 319 339 + 6.3%
Median Sales Price* $625,000 $890,000 + 42.4% $663,750 $830,000 + 25.0%
Average Sales Price* $720,732 $1,614,338 + 124.0% $1,043,967 $1,412,192 + 35.3%
Dollar Volume $12,252,450 $66,187,855 + 440.2% $332,221,561 $478,733,236 + 44.1%
Percent of Original List Price Received* 91.4% 88.1% - 3.6% 88.6% 88.2% - 0.5%
Median Time to Contract 221 185 - 16.3% 128 164 + 28.1%
Pending Sales 22 43 + 95.5% 309 360 + 16.5%
New Listings 48 53 + 10.4% 568 588 + 3.5%
Inventory of Homes for Sale 310 240 - 22.6% –– –– ––
Months Supply of Inventory 12.0 8.0 - 33.3% –– –– ––
* Does not account for seller concessions. Percent change may be extreme due to small sample size. Dash (–) means no activity to report on for specified time period.
A rolling 12-month calculation represents the current month and the 11 months prior in a single data point. If no activity occurred during a month, the line extends to the next available data point.
Median Sales Price - Single FamilyRolling 12-Month Calculation All RAPB + GFLR
Palm Beach
1-2010 1-2012 1-2014 1-2016 1-2018 1-2020
$0
$1,000,000
$2,000,000
$3,000,000
$4,000,000
$5,000,000
$6,000,000
$7,000,000
Median Sales Price - Townhouse/CondoRolling 12-Month Calculation All RAPB + GFLR
Palm Beach
1-2010 1-2012 1-2014 1-2016 1-2018 1-2020
$0
$200,000
$400,000
$600,000
$800,000
$1,000,000
Current as of January 17, 2021. Data courtesy of BeachesMLS, a subsidiary of Broward, Palm Beaches & St. Lucie Realtors®. | Report © 2021 ShowingTime.
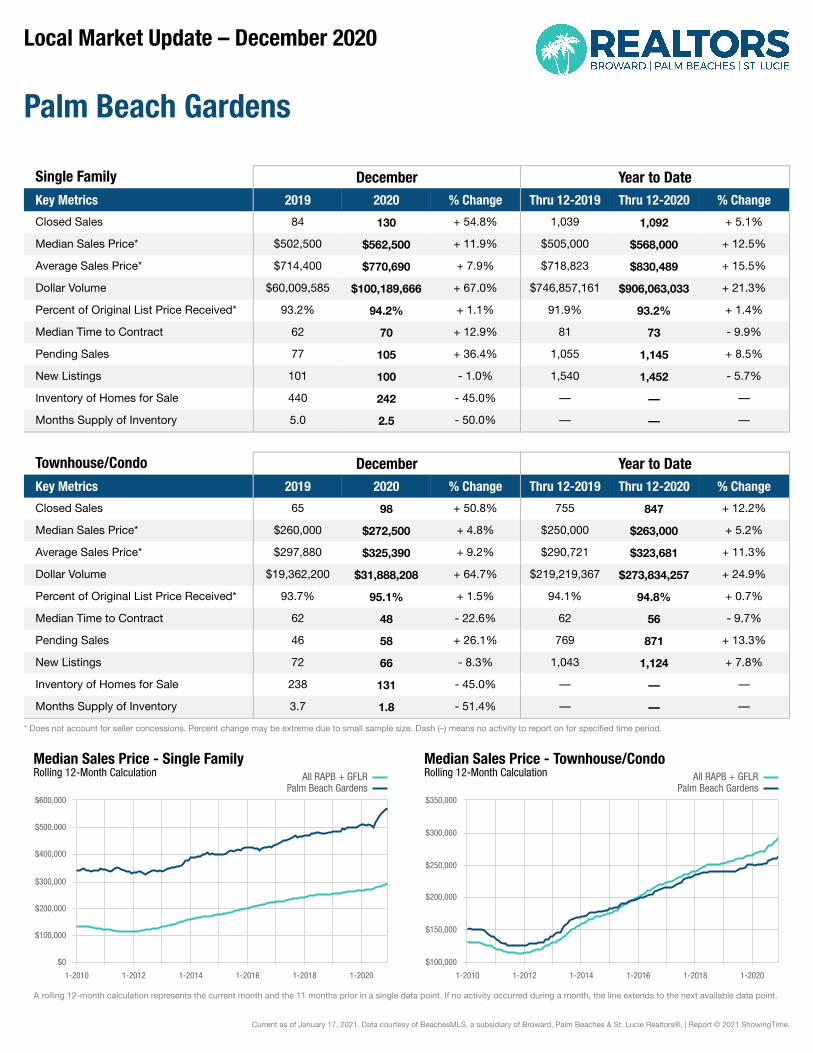
Local Market Update – December 2020
Palm Beach Gardens
Single Family December Year to DateKey Metrics 2019 2020 % Change Thru 12-2019 Thru 12-2020 % Change
Closed Sales 84 130 + 54.8% 1,039 1,092 + 5.1%
Median Sales Price* $502,500 $562,500 + 11.9% $505,000 $568,000 + 12.5%
Average Sales Price* $714,400 $770,690 + 7.9% $718,823 $830,489 + 15.5%
Dollar Volume $60,009,585 $100,189,666 + 67.0% $746,857,161 $906,063,033 + 21.3%
Percent of Original List Price Received* 93.2% 94.2% + 1.1% 91.9% 93.2% + 1.4%
Median Time to Contract 62 70 + 12.9% 81 73 - 9.9%
Pending Sales 77 105 + 36.4% 1,055 1,145 + 8.5%
New Listings 101 100 - 1.0% 1,540 1,452 - 5.7%
Inventory of Homes for Sale 440 242 - 45.0% –– –– ––
Months Supply of Inventory 5.0 2.5 - 50.0% –– –– ––
Townhouse/Condo December Year to DateKey Metrics 2019 2020 % Change Thru 12-2019 Thru 12-2020 % Change
Closed Sales 65 98 + 50.8% 755 847 + 12.2%
Median Sales Price* $260,000 $272,500 + 4.8% $250,000 $263,000 + 5.2%
Average Sales Price* $297,880 $325,390 + 9.2% $290,721 $323,681 + 11.3%
Dollar Volume $19,362,200 $31,888,208 + 64.7% $219,219,367 $273,834,257 + 24.9%
Percent of Original List Price Received* 93.7% 95.1% + 1.5% 94.1% 94.8% + 0.7%
Median Time to Contract 62 48 - 22.6% 62 56 - 9.7%
Pending Sales 46 58 + 26.1% 769 871 + 13.3%
New Listings 72 66 - 8.3% 1,043 1,124 + 7.8%
Inventory of Homes for Sale 238 131 - 45.0% –– –– ––
Months Supply of Inventory 3.7 1.8 - 51.4% –– –– ––
* Does not account for seller concessions. Percent change may be extreme due to small sample size. Dash (–) means no activity to report on for specified time period.
A rolling 12-month calculation represents the current month and the 11 months prior in a single data point. If no activity occurred during a month, the line extends to the next available data point.
Median Sales Price - Single FamilyRolling 12-Month Calculation All RAPB + GFLR
Palm Beach Gardens
1-2010 1-2012 1-2014 1-2016 1-2018 1-2020
$0
$100,000
$200,000
$300,000
$400,000
$500,000
$600,000
Median Sales Price - Townhouse/CondoRolling 12-Month Calculation All RAPB + GFLR
Palm Beach Gardens
1-2010 1-2012 1-2014 1-2016 1-2018 1-2020
$100,000
$150,000
$200,000
$250,000
$300,000
$350,000
Current as of January 17, 2021. Data courtesy of BeachesMLS, a subsidiary of Broward, Palm Beaches & St. Lucie Realtors®. | Report © 2021 ShowingTime.

Local Market Update – December 2020
Wellington
Single Family December Year to DateKey Metrics 2019 2020 % Change Thru 12-2019 Thru 12-2020 % Change
Closed Sales 65 109 + 67.7% 985 1,070 + 8.6%
Median Sales Price* $429,000 $520,000 + 21.2% $426,000 $455,000 + 6.8%
Average Sales Price* $608,232 $894,305 + 47.0% $677,284 $711,787 + 5.1%
Dollar Volume $39,535,050 $97,479,238 + 146.6% $667,124,547 $761,612,097 + 14.2%
Percent of Original List Price Received* 93.3% 95.1% + 1.9% 93.1% 94.8% + 1.8%
Median Time to Contract 78 77 - 1.3% 81 68 - 16.0%
Pending Sales 55 56 + 1.8% 979 1,079 + 10.2%
New Listings 78 78 0.0% 1,498 1,385 - 7.5%
Inventory of Homes for Sale 428 268 - 37.4% –– –– ––
Months Supply of Inventory 5.2 3.0 - 42.3% –– –– ––
Townhouse/Condo December Year to DateKey Metrics 2019 2020 % Change Thru 12-2019 Thru 12-2020 % Change
Closed Sales 17 35 + 105.9% 280 328 + 17.1%
Median Sales Price* $267,500 $275,000 + 2.8% $260,000 $280,000 + 7.7%
Average Sales Price* $313,088 $283,729 - 9.4% $297,941 $324,899 + 9.0%
Dollar Volume $5,322,495 $9,930,500 + 86.6% $83,423,511 $106,566,728 + 27.7%
Percent of Original List Price Received* 95.6% 95.3% - 0.3% 93.9% 94.9% + 1.1%
Median Time to Contract 64 47 - 26.6% 86 63 - 26.7%
Pending Sales 16 23 + 43.8% 284 335 + 18.0%
New Listings 23 22 - 4.3% 396 435 + 9.8%
Inventory of Homes for Sale 92 71 - 22.8% –– –– ––
Months Supply of Inventory 3.9 2.5 - 35.9% –– –– ––
* Does not account for seller concessions. Percent change may be extreme due to small sample size. Dash (–) means no activity to report on for specified time period.
A rolling 12-month calculation represents the current month and the 11 months prior in a single data point. If no activity occurred during a month, the line extends to the next available data point.
Median Sales Price - Single FamilyRolling 12-Month Calculation All RAPB + GFLR
Wellington
1-2010 1-2012 1-2014 1-2016 1-2018 1-2020
$0
$100,000
$200,000
$300,000
$400,000
$500,000
Median Sales Price - Townhouse/CondoRolling 12-Month Calculation All RAPB + GFLR
Wellington
1-2010 1-2012 1-2014 1-2016 1-2018 1-2020
$50,000
$100,000
$150,000
$200,000
$250,000
$300,000
$350,000
Current as of January 17, 2021. Data courtesy of BeachesMLS, a subsidiary of Broward, Palm Beaches & St. Lucie Realtors®. | Report © 2021 ShowingTime.
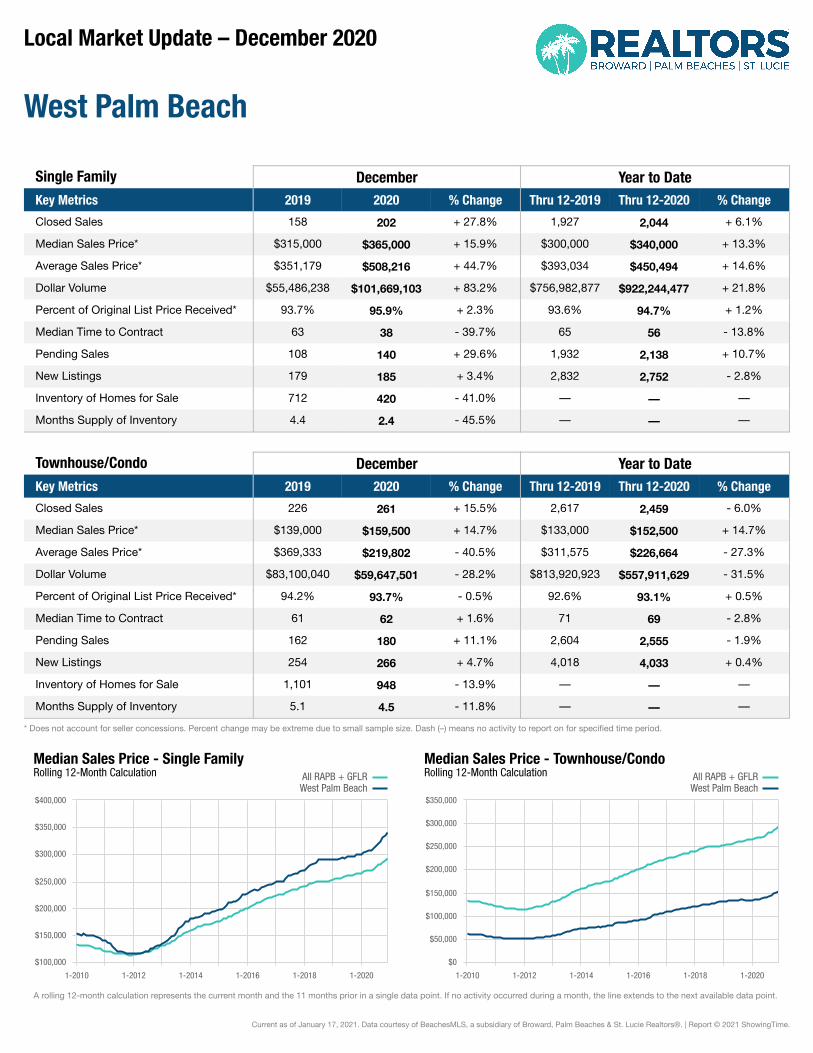
Local Market Update – December 2020
West Palm Beach
Single Family December Year to DateKey Metrics 2019 2020 % Change Thru 12-2019 Thru 12-2020 % Change
Closed Sales 158 202 + 27.8% 1,927 2,044 + 6.1%
Median Sales Price* $315,000 $365,000 + 15.9% $300,000 $340,000 + 13.3%
Average Sales Price* $351,179 $508,216 + 44.7% $393,034 $450,494 + 14.6%
Dollar Volume $55,486,238 $101,669,103 + 83.2% $756,982,877 $922,244,477 + 21.8%
Percent of Original List Price Received* 93.7% 95.9% + 2.3% 93.6% 94.7% + 1.2%
Median Time to Contract 63 38 - 39.7% 65 56 - 13.8%
Pending Sales 108 140 + 29.6% 1,932 2,138 + 10.7%
New Listings 179 185 + 3.4% 2,832 2,752 - 2.8%
Inventory of Homes for Sale 712 420 - 41.0% –– –– ––
Months Supply of Inventory 4.4 2.4 - 45.5% –– –– ––
Townhouse/Condo December Year to DateKey Metrics 2019 2020 % Change Thru 12-2019 Thru 12-2020 % Change
Closed Sales 226 261 + 15.5% 2,617 2,459 - 6.0%
Median Sales Price* $139,000 $159,500 + 14.7% $133,000 $152,500 + 14.7%
Average Sales Price* $369,333 $219,802 - 40.5% $311,575 $226,664 - 27.3%
Dollar Volume $83,100,040 $59,647,501 - 28.2% $813,920,923 $557,911,629 - 31.5%
Percent of Original List Price Received* 94.2% 93.7% - 0.5% 92.6% 93.1% + 0.5%
Median Time to Contract 61 62 + 1.6% 71 69 - 2.8%
Pending Sales 162 180 + 11.1% 2,604 2,555 - 1.9%
New Listings 254 266 + 4.7% 4,018 4,033 + 0.4%
Inventory of Homes for Sale 1,101 948 - 13.9% –– –– ––
Months Supply of Inventory 5.1 4.5 - 11.8% –– –– ––
* Does not account for seller concessions. Percent change may be extreme due to small sample size. Dash (–) means no activity to report on for specified time period.
A rolling 12-month calculation represents the current month and the 11 months prior in a single data point. If no activity occurred during a month, the line extends to the next available data point.
Median Sales Price - Single FamilyRolling 12-Month Calculation All RAPB + GFLR
West Palm Beach
1-2010 1-2012 1-2014 1-2016 1-2018 1-2020
$100,000
$150,000
$200,000
$250,000
$300,000
$350,000
$400,000
Median Sales Price - Townhouse/CondoRolling 12-Month Calculation All RAPB + GFLR
West Palm Beach
1-2010 1-2012 1-2014 1-2016 1-2018 1-2020
$0
$50,000
$100,000
$150,000
$200,000
$250,000
$300,000
$350,000
Current as of January 17, 2021. Data courtesy of BeachesMLS, a subsidiary of Broward, Palm Beaches & St. Lucie Realtors®. | Report © 2021 ShowingTime.