ccs roadmap pt_d1 final (print version).pdf
TRANSCRIPT

CCCCSS RROOAADDMMAAPP FFOORR PPOORRTTUUGGAALL PPHHAASSEE II DDeell iivveerraabbllee 11 CCOO22 TTRRAANNSSPPOORRTT AANNDD SSTTOORRAAGGEE OOPPTTIIOONNSS AANNDD RRIISSKKSS
September 2014
Co-funded by

Dissemination Level
PU Public
PP Restricted to other programme participants
RE Restricted to a group specified by the consortium
CO Confidential, only for members of the consortium
Version Submitted by Review Level* Date Submitted Reviewed
Version 2 UÉvora 30 Sept.2014
* WPL, MB, AB
Editors
Name (organization) e-mail
Leading participant Júlio Carneiro (U. Évora) Ferreira Marques (REN)
[email protected] [email protected]
Contributing participants Paulo Mesquita (U. Évora) Vitor Fernandes (REN) João Toscano (U. Évora)
[email protected] [email protected] [email protected]
Executive Summary
This report constitutes Deliverable 1 of the approved proposal CCS roadmap for Portugal - WORK PLAN, as of 24 November 2013.
Deliverable 1 attempts to clarify the options and risks for CO2 transport and geological storage in Portugal. Previous CCS studies in Portugal, namely the FP7 COMET project and the nationally funded KTEJO project, have conducted site screening for storage locations and defined the most economic pipeline corridors. However, those projects have focused solely on the technical and economic issues. No discussion of the existing alternatives was made and risks associated to those alternatives have not been identified.
This report aims at clarifying the following issues:
Are there geological conditions in Portugal for safe and permanent CO2 storage? What is the location and capacity of potential storage sites? What are the risks and costs involved?
What is the best option for CO2 transport in the country? What are the risks and costs involved? Is there a role for transport by ship?
What activities may have conflicting interests or gain from synergies with the implementation of CO2 storage?
Answer to these questions and this report are provided as a technical background to sub-task 1.1- scenarios of role and need for CCS - sub-task 1.3- economic impact and business opportunities - as well as for task 2 - Communication Process – of the CCS roadmap for Portugal, phase I.
Keywords
CO2 transport and storage, transport and storage risk, costs, conflicts and synergies, pipeline networks, transport by ship.
ACKNOWLEDGEMENTS
Authors would like to thank all the institutions that have supplied data for the consecution of these
results. In particular, DPEP (the Portuguese Division for Oil Exploration and Production) is gratefully
acknowledged for providing access to technical reports and databases. We are grateful to all COMET
and KTEJO project partners and to all researchers involved in the storage capacity assessments
conducted in those projects: Alexandre Araújo, António Correia, Fátima Cardoso, Carlos Ribeiro,
Augusto Costa, Carlos Rosa, Diogo Rosa, Elsa Ramalho, Helena Amaral, João Carvalho, José Borges,
José Sampaio, Mourad Bezzeghoud, Nadine Pereira, Pedro Terrinha, Susana Machado, Tiago Cunha,
Maria Olho Azul and Pablo Gentil.

CCS Roadmap for Portugal, phase I – CO2 storage and transport options and risks
i
TABLE OF CONTENTS
FIGURES ............................................................................................................................................................. iii
TABLES ................................................................................................................................................................ vi
ACRONYMS ..................................................................................................................................................... vii
1. INTRODUCTION ...................................................................................................................................... 1
2. OPTIONS AND RISKS FOR CO2 STORAGE ....................................................................................... 2
2.1. FUNDAMENTALS ABOUT CO2 STORAGE................................................................................. 2
2.2. STORAGE SITES AND CAPACITY IN PORTUGAL .................................................................... 7
2.2.1. Site screening criteria .......................................................................................................... 8
2.2.2. Potential storage areas ..................................................................................................... 10
2.2.3. Storage capacity ................................................................................................................ 16
2.2.4. Storage clusters ................................................................................................................... 18
2.3. STORAGE COSTS ........................................................................................................................ 20
2.3.1. Storage costs components ................................................................................................. 20
2.3.2. Estimating injection rates and number of wells ............................................................. 21
2.3.3. Storage cost per selected area and cluster .................................................................. 24
2.3.4. Average onshore and offshore storage costs ............................................................... 25
2.4. RISKS AND RANKING OF STORAGE SITES ............................................................................ 26
2.4.1. Risk assessment methodology ........................................................................................... 26
2.4.2. Implementation of the risk assessment methodology ................................................... 30
2.4.3. Results of the SRF approach ............................................................................................. 30
2.4.4. Seismo -Tectonic hazard .................................................................................................... 36
2.5. OPTIONS FOR CO2 STORAGE IN PORTUGAL ...................................................................... 42
2.5.1. Methodology – Regions of influence of clusters ........................................................... 42
2.5.2. Base case - all clusters considered .................................................................................. 43
2.5.3. Offshore storage only ....................................................................................................... 44
2.5.4. Allowing storage in Spain ................................................................................................. 45
2.5.5. Offshore storage, only sites with best risk ranking ...................................................... 45
2.6. Summary of CO2 storage options and risks ............................................................................ 47
3. OPTIONS AND RISKS FOR CO2 TRANSPORT ................................................................................. 49
3.1. FUNDAMENTALS ABOUT CO2 TRANSPORT .......................................................................... 49
3.2. PIPELINE NETWORK .................................................................................................................... 55
3.2.1. Selected corridors ............................................................................................................... 55

CCS Roadmap for Portugal, phase I – CO2 storage and transport options and risks
ii
3.3. TRANSPORT COSTS .................................................................................................................... 56
3.3.1. Transport costs components .............................................................................................. 56
3.3.2. Transport cost estimates .................................................................................................... 58
3.4. TRANSPORT RISKS ....................................................................................................................... 60
3.4.1. CO2 transport risk assessment methodologies ............................................................... 60
3.4.2. Identification of main risks along pipeline corridors ................................................... 65
3.5. SHIPS AS AN ALTERNATIVE TO TRANSPORT BY PIPELINE. ................................................. 71
3.5.1. Break-even distance and mass flow for transport by ship ......................................... 72
3.5.2. Possibilities for transport by ship in Portugal ................................................................ 72
3.5.3. Possibilities for transport by ship in point-to-point connections ................................. 74
3.6. Summary of CO2 transport options and risks ......................................................................... 77
4. CONFLICTS AND SYNERGIES WITH OTHER ACTIVITIES .............................................................. 78
4.1. ONSHORE STORAGE .................................................................................................................. 78
4.1.1. Underground activities ....................................................................................................... 80
4.1.2. Surface activities ................................................................................................................. 84
4.2. OFFSHORE STORAGE ................................................................................................................. 87
4.3. SUMMARY OF CONFLICTS AND SYNERGIES ........................................................................ 91
REFERENCES .................................................................................................................................................... 96
APPENDIX A - Database for estimating storage capacity in the selected areas and basin.
APPENDIX B - Complementary data and results from the implementation of the SRF approach. (online version only)
APPENDIX C - Consequences from the pipeline rupture events. (online version only)
APPENDIX D - Comparison of consequences from a CO2 pipeline and a natural gas pipeline releases. (online version only)

CCS Roadmap for Portugal, phase I – CO2 storage and transport options and risks
iii
FIGURES Fig. 1- Options for storage of CO2 in geological formations (Metz et al., 2005). ............................ 3
Fig. 2 - CO2 phase diagram (Bachu, 2000) ............................................................................................... 3
Fig. 3 - Increasing storage effectiveness for CO2 with depth. Note that above critical depth, CO2 is in gaseous state (balloons); below critical depth it is in liquid-like state (droplets). Volumetric relationship shown by blue numbers (e.g. 100 m3 of CO2 at surface would occupy 0.32 m3 at a depth of 1 km) (CO2CRC, 2008). ................................................................................................................ 4
Fig. 4 - Schematic representation of rising CO2 plume. ........................................................................... 4
Fig. 5 - Physical Trapping of CO2. a) CO2 is trapped under the folded cap-rock, unable to move out of the anticline; b) CO2 is retained when there is a sudden change in the permeability of the rock formations, a discontinuity; c) a fault can align a reservoir with an impermeable formation preventing the migration of CO2 or the fault can be sealed by impermeable material; d) CO2 can be immobilized by a facies variation, in which the reservoir looses permeability (CO2CRC, 2011). ................................................................................................................................................................. 5
Fig. 6 – Storage security. Over time, the relevance of the more stable and reliable geochemical trapping increase, while the importance of physical trapping, essentially in the injection phase, decrease (CO2CRC, 2008). ........................................................................................................................... 5
Fig. 7 - Techno-Economic Resource-Reserve pyramid for CO2 storage capacity (CSLF, 2007) ...... 6
Fig. 8 – a) Sedimentary basins in Portugal; b) Oil exploration data available (in 2011) for the site screening in Portugal. Lines – Seismic surveys, yellow circles – offshore boreholes, red circles – onshore boreholes. ........................................................................................................................................ 7
Fig. 9 – a) Stratigraphy of Porto Basin and indication of reservoir and cap-rock pairs. b) Location of selected areas. .......................................................................................................................... 11
Fig. 10 – a) Stratigraphy of the offshore Lusitanian Basin and indication of reservoir and cap-rock pairs. b) Location of selected areas in the offshore Lusitanian. ................................................... 12
Fig. 11 – a) Stratigraphy of the Sines/Santiago do Cacém sector and indication of reservoir and cap-rock pairs. b) Location of selected areas in the Sines/Santiago do Cacém sector. ................. 13
Fig. 12 – a) Stratigraphy of the Algarve basin and indication of reservoir and cap-rock pairs. b) Location of selected areas in the Algarve basin. .................................................................................... 15
Fig. 13 – a) Stratigraphy of the onshore Lusitanian Basin and indication of reservoir and cap-rock pairs. b) Location of selected areas in the onshore Lusitanian Basin. ......................................... 16
Fig. 14- Criteria for selecting the efficiency factor in open to closed aquifers. After Vangkilde-Pedersen et al. (2009). ................................................................................................................................. 17
Fig. 15 - Location of storage sites and capacity per cluster (S# refers to cluster number, see section 2.2.4 for explanation). .................................................................................................................... 19
Fig. 16 – a) Injection rate; b) number of injection wells per selected area ....................................... 23
Fig. 17 - Storage costs: a) per selected area; b) per cluster. .............................................................. 24
Fig. 18 – Schematic representation of risks linked to CO2 storage (Oldenburg, 2008). ................ 27
Fig. 19 – SRF calculation process, according to Li et al. (2013). ......................................................... 28
Fig. 20 – Average Certainty factor (Ck,n) for every property in the SRF approach. ....................... 31
Fig. 21 – SRF approach Certainty score (Ck,n) per Characteristic and per storage site. ................ 32

CCS Roadmap for Portugal, phase I – CO2 storage and transport options and risks
iv
Fig. 22 – Average Attribute Assessment (Sk,n) adopted for every property in the SRF approach. ........................................................................................................................................................................... 34
Fig. 23 – SRF approach Attribute Assessment (Sk,n) per Characteristic and per storage site. ....... 35
Fig. 24 – SRF risk ranking for: a) all storage sites, grouped by cluster, and; b) average for each clusters. ............................................................................................................................................................. 36
Fig. 25 – Tectonic framework of mainland Portugal, showing the main active faults, including the accretionary wedge south from the Algarve and the main historical and instrumental earthquakes in Portugal and Atlantic margin (see list in Table 11)..................................................... 37
Fig. 26 – a) Location with instrumental earthquakes with M≥3 in Portugal and Atlantic; b) Seismic hazard in Portugal – 5% exceedance probability in 975 years (adapted from Montilla and Casado, 2002); c) Maximum seismic velocities in the cluster S05 area in finite difference simulation of an earthquake equivalent to the 1755 earthquake with epicentre at the Gorringe Bank. Also shown the selected storage basins. ......................................................................................... 40
Fig. 27 – Graphic representation of risk ranking and storage costs per cluster. ............................. 42
Fig. 28 – a) Integrated cost distance map for transport and storage of 1Mt CO2; b) CCS Regions considering all clusters. Black dots refer to the hypothetic injection site of a given cluster, and grey lines define the limits of CCS regions. Orange dots are the main stationary sources in Portugal. Only two storage clusters would be active, S05 and S42. The region of influence of clusters S01 and S07 do not reach the onshore, and all other clusters are not cost effective even for sources located nearby. ......................................................................................................................... 44
Fig. 29 - CCS Regions considering only offshore storage. The S# region delimits the area in which it is cost-effective to transport and storage to the # cluster. The black dots represent the hypothetic injection site of each cluster. ..................................................................................................... 45
Fig. 30 - CCS Regions allowing storage in Spain. The S# region delimits the area in which it is cost-effective to transport and storage to the # cluster. The black dots represent the hypothetic injection site of each cluster. ......................................................................................................................... 46
Fig. 31 - CCS Regions for offshore storage, removing the higher risk clusters in the Algarve and Sines, and allowing storage in Spain. The S# region delimits the area in which it is cost-effective to transport and storage to the # cluster. The black dots represent the hypothetic injection site of each cluster. ..................................................................................................................................................... 46
Fig. 32 - CO2 Temperature – Pressure Diagram. Adapted from DNV (2010b). ............................. 49
Fig. 33 – Mass density of pure CO2. Adapted from DNV (2010b). ................................................... 51
Fig.34 – Effect of selected chemical components on phase envelope. Comparison with natural gas. Adapted from DNV (2010b). ............................................................................................................. 52
Fig. 35 – Solubility of water in pure CO2. Adapted from DNV (2010b). ........................................ 53
Fig. 36 – All viable transport corridors according to the COMET scenarios. Some of the corridors represent alternative connections between the same locations. ........................................................... 55
Fig. 37 – Transports costs variation per pipeline, according to the several COMET scenarios. The blue lines show the range of variation in the COMET scenarios (varying CO2 flow rate) and black square shows the mean value. ..................................................................................................................... 59
Fig. 38 –QRA Quantitative Risk Analysis. Risk estimation, analysis and evaluation. Adapted from NORSOK (2001) ............................................................................................................................................ 60
Fig. 39 – CO2 dose-fatality relationship. Adapted from Energy Institute (2010). ........................... 62

CCS Roadmap for Portugal, phase I – CO2 storage and transport options and risks
v
Fig. 40 – Risk Matrix. Adapted from CO2EUROPIPE (2011). .............................................................. 63
Fig. 41 - a) SLOD equivalents, 32 barg release; b) SLOD equivalents, 15 barg release; c) SLOT equivalents, 32 barg release; d) SLOD equivalents, 32 barg release. Adapted from HSE (2009). ........................................................................................................................................................................... 70
Fig. 42 – Schematic configuration of CO2 transport by ship. After DNV (2011) ............................. 71
Fig. 43 – Comparison of vessel and pipeline transport; Distance-mass flow combinations with a cost advantage for vessel transport (blue shaded area) and for offshore pipeline (red area); iso-cost curves [€/t] (dashed). Source: Geske and Berghout (2012). ........................................................ 72
Fig. 44 – Possible connections to ports and ship routes studied in the COMET project for the Portuguese case study. Adapted from Geske and Berghout (2012). ................................................. 73
Fig. 45 – Point-to-point analysis of transport by ship. Maximum capacities for cost-effective ship transport from each of the studied ports to the offshore storage clusters ......................................... 75
Fig. 46 – Ratios between transport cost by ship and transport cost by pipeline for connection between ports and storage clusters. Values below 1 indicate cost-effective connections by ship values above indicate cost-effective transport by pipeline. ................................................................. 76
Fig. 47 –Administrative boundaries of municipalities in the offshore cluster S05............................. 78
Fig. 48 – Characteristics and existing activities in the onshore cluster S05: Hydrocarbon exploration concessions, mineral groundwater resources, mines and quarries. ................................. 81
Fig. 49 – Schematic representation of structural geology impact due to halokynetic movements. Adapted from Kullberg (2000)................................................................................................................... 82
Fig. 50 – Characteristics and existing activities in the onshore cluster S05: Population density. ... 84
Fig. 51 – Characteristics and existing activities in the onshore cluster S05: Land use (COS 2010) ........................................................................................................................................................................... 85
Fig. 52 – Characteristics and existing activities in the onshore cluster S05: Environmental protected areas, tourism and heritage sites. ............................................................................................ 86
Fig. 53 – Map with existing offshore activities (according to POEM (2012). ................................... 92
CCS Roadmap for Portugal, phase I – CO2 storage and transport options and risks
vi
TABLES Table 1 – Criteria for screening sedimentary basins. Adapted from CO2CRC (2008). .................. 9
Table 2 – Screening criteria applied in the COMET project. Compiled after Martínez et al. (2010)................................................................................................................................................................. 9
Table 3 – Parameters used in the storage capacity calculation and sources of data. ................... 18
Table 4 – Main features of storage clusters. ........................................................................................... 19
Table 5 – Storage costs components and basic costs. ............................................................................ 20
Table 6 - Parameters and sources of data. ............................................................................................. 22
Table 7 – Injection rates and storage costs per cluster. ......................................................................... 23
Table 8 – Storage costs per cluster. ........................................................................................................... 24
Table 9 – Indicators, attributes, properties and weights of SRF approach. ...................................... 29
Table 10 – SRF results per cluster, considering the average results for the storage sites in each cluster. The boundary between FAIR and GOOD is given by Tn=3. ................................................... 35
Table 11 – Main historical and instrumental seismic events in mainland Portugal and its Atlantic margin (compiled from Bezzeghoud et al. 2012 and Instituto Português do Mar e da Atmosfera, Lisbon, Portugal). ............................................................................................................................................ 38
Table 12 – Risk ranking (higher Tn indicates increased security) and storage costs per cluster. .. 42
Table 13 - Summary of CO2 storage prospects per cluster ................................................................. 48
Table 14 – CO2 Properties. Adapted from DNV (2010b). .................................................................. 50
Table 15 – Indicative compositions of CO2 streams /IEA GHG/. Unit % by volume. Adapted from (DNV, 2010b). ...................................................................................................................................... 52
Table 16 – List of viable pipeline corridors and characteristics. Some of the corridors represent alternative connections between the same locations. .............................................................................. 56
Table 17 – Terrain factors and pipeline basic costs. .............................................................................. 57
Table 18 – Average transport costs to onshore and offshore storage sites. ..................................... 58
Table 19 – Exposure reactions to carbon dioxide. Adapted from Energy Institute (2010). .......... 62
Table 20 – SLOT and SLOD values for carbon dioxide. Adapted from Energy Institute (2010). 62
Table 21 – Derived probability of fatality for carbon dioxide. Adapted from Energy Institute (2010)............................................................................................................................................................... 62
Table 22– Summary of hazard and risk analysis ................................................................................... 64
Table 23 - Identification of main risks along corridors threads and hazards. Adapted from DNV (2010b). ........................................................................................................................................................... 66
Table 24 – Matrix of distances between ports and storage clusters. ................................................. 74
Table 25 –Average captured CO2 at the emission cluster closer to ports. ........................................ 76
Table 26 – List of characteristics and activities with potential synergies and/or conflicts in cluster S05 .................................................................................................................................................................... 79
Table 27 – Summary of identified conflicts and synergies. .................................................................. 93

CCS Roadmap for Portugal, phase I – CO2 storage and transport options and risks
vii
ACRONYMS
CCS (CO2 Capture and Storage), 1
COF (consequence of failure), 64
DPEP (Divisão para a Pesquisa e Exploração de Petróleo), 8
DTL (dangerous toxic load), 62
ECBM (Enhanced Coal Bed Methane), 2
EOR (Enhanced Oil Recovery), 2
GCCSI (Global CCS Institute), 1
HSE (health, safety, and environmental), 26
OMM (Operating, Maintenance, and Monitoring), 20
POF (probability of failure), 64
QRA (Quantitative Risk Analysis), 62
RAC (Risk acceptance criteria), 64
SLOD (significant likelihood of death), 62
SLOT (specific level of toxicity), 62
SRF (Screening and Ranking Framework), 27
WIM (West Iberia Margin), 10

CCS Roadmap for Portugal, phase I – CO2 storage and transport options and risks
1
1. INTRODUCTION This report attempts to clarify the risks, advantages and disadvantages of the CO2 transport and storage opportunities in Portugal. Previous CCS (CO2 Capture and Storage) studies in Portugal, namely the FP7 COMET project (Boavida et al., 2013) and the nationally funded KTEJO project (Pereira et al., 2011), were responsible the first regional-scale assessments of CO2 storage opportunities in the country and defined the cost-effective pipeline corridors. Those projects have focused on the geological requirements for safe CO2 storage and on the economic costs for defining CO2 transport corridors. No discussion of the existing alternatives (e.g., onshore vs. offshore storage, preferential storage sites, conflicts and synergies for different storage, etc.) was made and risks associated to those alternatives have not been identified.
Building on the results of those projects and complemented by the research now undertaken in terms of risks, conflicts and synergies, this report aims at clarifying the following issues:
• Are there geological conditions in Portugal for safe and permanent CO2 storage? What is the location and capacity of potential storage sites? What are the risks and costs involved?
• What is the best option for CO2 transport in the country? What are the risks and costs involved? Is there a role for transport by ship?
• What activities may have conflicting interests or gain from synergies with CO2 storage?
This report is provided as a technical background to the CCS Roadmap for Portugal – Phase I, a project co-funded by the GCCSI (Global CCS Institute) and undertaken by a consortium comprising the Universidade Nova de Lisboa, Universidade de Évora, Laboratório Nacional de Energia de Geologia, REN - Redes Energéticas Nacionais (the transmission system operator in Portugal), and the Bellona Foundation. The report is the main deliverable from sub-task 1.2 - Risks and options in storage and transport – and was coordinated by the Universidade de Évora, with REN being responsible for the sections related to CO2 pipeline by transport, benefiting from the company vast know-how in natural gas transport .
The report is organised as follows:
• Chapter 2 addresses the options and risks for CO2 storage in Portugal, identifying the existing storage capacity (section 2.2), costs estimated (section 2.3), risks and ranking of storage sites (section 2.4) and what options may be realistically pursued in the country (section 2.5);
• Chapter 3 focuses on the transport component of the CCS chain, including an analysis of the pipeline network under certain scenarios (section 3.2), their costs (section 3.2) and risks (3.4). Section 3.5 discusses the possibility of CO2 transport by ship;
• Chapter 4 addresses the synergies and constraints with other activities identified for CO2 storage onshore (section 4.1) and offshore (4.2).
Sections 2.1 and 3.1 describe the fundamental technical issues about CO2 storage and transport, respectively, and provide enough background for the analysis of the Portuguese case, but they are not intended to present a state-of-the-art review on the CCS technology. The interested reader is directed to the several authoritative references mentioned in those sections.

CCS Roadmap for Portugal, phase I – CO2 storage and transport options and risks
2
2. OPTIONS AND RISKS FOR CO2 STORAGE
2.1. FUNDAMENTALS ABOUT CO2 STORAGE Rocks are the largest reservoir of carbon on the planet, holding it in the form of coal, hydrocarbons and carbonated rocks. Storage of carbon is a natural process in the upper crust of the earth, acting on scale of hundreds of millions of years.
Geological storage of carbon dioxide aims to mimic that natural process, trapping CO2 from anthropogenic sources into deep geological formations for long periods of time, on the order of hundreds to thousands of years, preventing it from being released to the atmosphere and mitigating its greenhouse gas effect.
The operational aspects of storage of CO2 in geological formations are based on the mechanisms and technologies developed by the oil and gas industry, where injection of CO2 in geological formations is a common practice since 1972. CO2 is injected to maintain pressure in the reservoirs, increase mobility and facilitate the extraction of hydrocarbons, a process designated as EOR (Enhanced Oil Recovery). Thus, the concept of CO2 injection in deep geological formations is not new, and storage of CO2 as a methodology for climate change mitigation is based on the successful experience in the oil sector.
There are several options for geological storage of CO2 (Fig. 1):
1. Depleted oil and natural gas reservoirs; 2. Use of CO2 in EOR; 3. Deep saline aquifers; 4. Use of CO2 in ECBM (Enhanced Coal Bed Methane); 5. Unminable coal seams; 6. Other geologic environments (basalts, CO2 hydrates, mineral carbonation, etc.).
Saline aquifers, depleted hydrocarbon reservoirs and the use of CO2 in EOR are indicated as the main options for CO2 storage, in all cases requiring permeable rocks (sandstones, limestones, ...) found in the extensive sedimentary basins existing in many parts of the world. All other possibilities (items 4 to 6 above) are in a less advanced stage of research.
Deep saline aquifers are considered to have the largest potential capacity for CO2 storage due to the distribution of sedimentary basins in the world. Deep saline aquifers are porous and permeable sedimentary formations, capped by an impermeable layer (the cap-rock or seal) that allows the storage of fluids at pressures above the atmospheric pressure. For CO2 storage, aquifers must be at great depths, typically greater than 700-800 m, and saturated with high salinity groundwater unsuitable for drinking, agricultural or industrial uses (CO2CRC, 2008).
However, knowledge about the distribution and characteristics of deep saline aquifers is reduced, when compared to the existing data about hydrocarbon reservoirs, and assessing their potential for CO2 storage involves large uncertainty due to limited data. Moreover, the data usually available to characterize the cap-rock is even scarcer, since it is usually not tested during hydrocarbons exploration (CO2CRC, 2008).

CCS Roadmap for Portugal, phase I – CO2 storage and transport options and risks
3
CO2 storage in oil and natural gas fields can be made during the production stage, when used in EOR, or in depleted reservoirs that are no longer in production. The EOR technology is used by the oil and gas industry for several decades. However, there are disadvantages in the use of depleted hydrocarbon fields since the physical size of the trap can be a stratigraphic or structural constraint, limiting the storage potential. It should also not be neglected the possibility that hydrocarbon production may have led to the collapse of the pores and substantially reduce the storage capacity. The existence of old wells that are potential leak points is a further concern.
The CO2 storage operation involves the injection of the fluid, through injection wells, preferably in supercritical phase, at pressures and temperatures above the critical point, T=31.1 °C and P=7.38 MPa (Bachu, 2003) (Fig. 2). Both temperature and pressure increase with depth but have opposite effects on the density of CO2. Density increases rapidly with rising pressure, but it tends to stabilize or decrease with increasing temperature, depending on the local geothermal gradient. Based on the global average geothermal gradient and hydrostatic pressure, supercritical CO2 should be reached at about 800m depth. Hence, the reservoir selection should focus on depths greater than this threshold.
Fig. 3 illustrates the behaviour of CO2 with depth, increasing the density and reducing the reservoir
volume required for storage. Although injected in the supercritical state, CO2 will remain less
Fig. 2 - CO2 phase diagram (Bachu, 2000)
Fig. 1- Options for storage of CO2 in geological formations (Metz et al., 2005).

CCS Roadmap for Portugal, phase I – CO2 storage and transport options and risks
4
dense (<800 kg/m3) than the typical existing brine in sedimentary basins. It will therefore tend to migrate by buoyancy to the top of the reservoir (Fig. 4). The storage of CO2 in porous and permeable formations is only possible with the existence or formation of a sealing cap-rock, physically trapping the CO2 in the reservoir.
However, this is not the only trapping mechanism. Trapping of CO2 in the reservoir occurs by various processes:
Physical trapping - the free phase CO2 is physically trapped in structural or stratigraphic trap originated by the geometric arrangement of the reservoir and the cap-rock units (Fig. 5); Residual trapping - CO2 is trapped in the pores without connectivity, by capillary pressures, and/or is adsorbed on the surface of some minerals, becoming immobile; Dissolution trapping - CO2 is dissolved in the pore water, eventually leading to an increased density of the brine, which will then sink to the bottom of the reservoir, removing the risk of leakages to the surface; Hydrodynamic trapping - the dissolved and free-phase CO2 moves according to very small regional/basin scale hydraulic gradients, with very low flow velocities (leading to geological scale residence times) increasing the contact of the CO2 plume with the formation water and promoting residual and dissolution trapping;
Fig. 3 - Increasing storage effectiveness for CO2 with depth. Note that above critical depth, CO2 is in gaseous state (balloons); below critical depth it is in liquid-like state (droplets). Volumetric relationship shown by blue numbers (e.g. 100 m3 of CO2 at surface would occupy 0.32 m3 at a depth of 1 km) (CO2CRC, 2008).
Fig. 4 - Schematic representation of rising CO2 plume.

CCS Roadmap for Portugal, phase I – CO2 storage and transport options and risks
5
Mineral trapping or mineral carbonation - CO2 reacts with water and minerals from the reservoir and precipitates, forming new carbonate minerals and becoming permanently stored in the solid phase.
Trapping of CO2 is not achieved by just one type of mechanism. Throughout the storage period, the relevancy of different trapping mechanisms will vary over time, contributing for increased security storage along time (Fig. 6).
Selection of sites for storing significant volumes of CO2 involves progressively more detailed geological assessments (CSLF, 2007):
• Country-scale assessment - high level of assessment performed for a contiguous geographic area defined by national jurisdiction (country) and usually encompasses several sedimentary basins;
• Basin-scale assessment - level of assessment focusing on a particular sedimentary basin to evaluate and quantify its storage
potential and to identify the best (or more prospective) regions and/or sites for CO2 storage and their type; • Regional-scale assessment - increasing level of detail for a large, geographically-contiguous portion of a sedimentary basin, usually defined by the presence of large CO2 sources and/or by its known large potential for CO2; • Local-scale or (Prospect-Level) Assessment - usually performed at a preengineering level when one or several candidate sites for CO2 storage are examined to determine site capacity, injectivity and containment prior to site-selection decisions
Fig. 5 - Physical Trapping of CO2. a) CO2 is trapped under the folded cap-rock, unable to move out of the anticline; b) CO2 is retained when there is a sudden change in the permeability of the rock formations, a discontinuity; c) a fault can align a reservoir with an impermeable formation preventing the migration of CO2 or the fault can be sealed by impermeable material; d) CO2 can be immobilized by a facies variation, in which the reservoir looses permeability (CO2CRC, 2011).
Fig. 6 – Storage security. Over time, the relevance of the more stable and reliable geochemical trapping increase, while the importance of physical trapping, essentially in the injection phase, decrease (CO2CRC, 2008).

CCS Roadmap for Portugal, phase I – CO2 storage and transport options and risks
6
• Site-scale Assessment - performed for the specific storage unit (hydrocarbon reservoir, deep saline aquifer or coal bed), usually to model the behaviour of the injected CO2 (it is equivalent to the reservoir scale in petroleum engineering).
The storage capacity calculations are often framed in terms of the Techno-Economic Resource-Reserve Pyramid (CSLF, 2007), shown in Fig. 7 which considers three levels of storage capacity estimate:
• Theoretical Storage Capacity - the physical limit of what the geological system can accept;
• Effective Storage Capacity - obtained by applying a range of technical (geological and engineering) cut-off limits to a storage capacity assessment, including consideration of that part of theoretical storage capacity that can be physically accessed;
• Practical (or Viable) Storage Capacity - obtained by considering technical, legal and regulatory, infrastructure and general economic barriers to CO2 geological storage;
• Matched Storage Capacity - detailed matching of large stationary CO2 sources with geological storage sites that are adequate in terms of capacity, injectivity and supply rate.
Depending on the scale of the study, different criteria are evaluated, but the increased level of selection involves a greater amount of information, and study time, with a corresponding increase in costs. The progressive increase in detail in the identification and characterization of storage locations reduces inaccuracies but, usually, also reduces the previously estimated storage capacity.
Fig. 7 - Techno-Economic Resource-Reserve pyramid for CO2 storage capacity (CSLF, 2007)

CCS Roadmap for Portugal, phase I – CO2 storage and transport options and risks
7
2.2. STORAGE SITES AND CAPACITY IN PORTUGAL This section provides the essential information about the storage capacity assessment conducted within the scope of the projects COMET and KTEJO. A detailed description can be found in Report D3.4 of the project COMET (Martínez, 2013). The assessment was conducted at regional-scale, although a basin-scale assessment was first performed, in order to discard areas clearly unsuitable for CO2 storage.
Despite the ongoing exploration efforts, exploitable hydrocarbon fields are yet to be identified in Portugal. There are well studied coal seams in the Palaeozoic Douro coal basin, mined until 1994, but the basin is highly faulted and folded. Although studies are being conducted to assess its storage capacity (Lemos de Sousa et al., 2007), it does not seem an immediately valid CO2 storage option. Less common options for geological storage of CO2, such as mafic rocks, CO2 hydrates and mineral carbonation, are not addressed in this report, although there may be some potential for their application in Portugal (Bernardes et al., 2013). Thus, the storage capacity assessment focused on saline aquifers in sedimentary basins1
More than two thirds of Portugal is underlain by basement (Variscan) igneous and metamorphic rocks from the Palaeozoic and, occasionally, from the Proterozoic, where geological storage of CO2 is not feasible. Along the margins of these basement rocks, the following sedimentary basins were formed (
.
Fig. 8a):
1 To avoid ambiguity with the traditional use in Portugal of the term ‘aquifer’, referring to permeable rocks saturated with potable groundwater or groundwater with some economic value, throughout this report we will prefer the term ‘Reservoir’ to refer to deep saline aquifers, since these are by definition saturated with groundwater that is not potable and is not being used for any other purpose.
a) b)
Fig. 8 – a) Sedimentary basins in Portugal; b) Oil exploration data available (in 2011) for the site screening in Portugal. Lines – Seismic surveys, yellow circles – offshore boreholes, red circles – onshore boreholes.

CCS Roadmap for Portugal, phase I – CO2 storage and transport options and risks
8
• the Meso-cenozoic Basins on the Western Iberian Margin, including the Lusitanian Basin and the Porto Basin. For the purposes of this report, the southern sector of the Lusitanian Basin is hereafter designated as the Sines/Santiago do Cacém sector.
• the Meso-cenozoic Algarve Basin, along the south margin of the Portuguese territory; • the Cenozoic Tagus/Sado Basin, a sedimentary basin developed entirely onshore.
The Lusitanian and Algarve Basins extend from onshore to the shallow offshore (defined by a water depth <200m). Together with the entirely offshore Porto Basin, the Lusitanian and the Algarve basins compose most of the continental shelf, with a volume of sedimentary rocks larger than the onshore volume. Hence, offshore CO2 storage is necessarily a possibility worth considering in Portugal.
The sedimentary sequence in the Tagus/Sado Basin is thinner than in the other basins, although in some areas its base can reach 1000 m depth. This basin includes some of the most productive freshwater aquifers in Portugal (Almeida et al., 2000; 2006), being recharged by rainfall or by drainage from overlying water table aquifers. Basin-scale assessment indicated that it does not meet the basic requirements for CO2 storage and it is not further addressed in this report.
The Information about deep sedimentary geology (i.e., at more than 800 m depths) of continental Portugal is scarce and almost entirely restricted to the boreholes and 2-D seismic surveys conducted for oil exploration purposes (Fig. 8b). The CO2 site screening assessment in Portugal was conducted resorting to the DPEP (Divisão para a Pesquisa e Exploração de Petróleo) database, the most reliable source about geology of the sedimentary basins in the country, which comprised, at the time, 110 onshore boreholes deeper than 100 m, of which around 50 were deeper than 500 m. The number of offshore boreholes is smaller, totalling some 30 boreholes, although generally deeper than the onshore boreholes. Both the onshore and offshore sectors are well covered by 2-D seismic lines. The DPEP database is maintained updated and it is an invaluable source of information for any future studies about CO2 storage in Portugal.
In the last few years the oil exploration activities in the country have increased, with new geophysical surveys (2-D seismic, 3-D seismic and aeromagnetic surveys) being conducted, as well as new boreholes being drilled onshore. Results of these recent surveys and boreholes are not yet publicly available and were not used in the site screening process, but it is intended to update the site screening once that information becomes public.
2.2.1. Site screening criteria
CO2CRC (2008), based on Bachu (2003), indicates sixteen criteria for basin-scale site screening, related to the containment security, the volume of storage capacity and the economic or technological feasibility. Several of the criteria do not apply to the sedimentary basins in Portugal (for instance there are no mature hydrocarbon fields) or do not allow distinguishing between different areas of the basin (e.g., hydrocarbons exploration is ongoing in the entire basin, climate is moderate, accessibility is easy, and infrastructures for CO2 storage are inexistent). A first basin-scale assessment in Portugal applied the criteria in Table 1, adapted from the CO2CRC (2008) extended list, and led to discarding the Tagus/Sado basin and the onshore south sector of the Lusitanian basin.
The regional-scale assessment followed a set of criteria defined in the COMET project and described in its deliverable D3.1 (Martínez et al., 2010), but is in essence very similar to the criteria recommended by Chadwick et al. (2008), and are represented in Table 2.

CCS Roadmap for Portugal, phase I – CO2 storage and transport options and risks
9
Table 1 – Criteria for screening sedimentary basins. Adapted from CO2CRC (2008).
Table 2 – Screening criteria applied in the COMET project. Compiled after Martínez et al. (2010).
Criterion Increasing CO2 Storage Potential
Classes 1 2 3 4 5
Seismicity (tectonic setting)
Very high (e.g. subduction)
High (e.g. syn-rift, strike-slip)
Intermediate (e.g. foreland)
Low (e.g. passive margin)
Very low (e.g. cratonic)
Size Very small (<1000 km2)
Small (1000– 5000 km2)
Medium (5000 –25000 km2)
Large (25000– 50000 km2)
Very large (>50000 km2)
Depth Very shallow (<300 m)
Shallow (300–800 m) Deep (>3500
m) Intermediate (800–3500 m)
Faulting intensity Extensive Moderate Limited
Hydrogeology
Shallow, short flow systems, or compaction flow
Intermediate flow systems
Regional, long-range flow systems; topography or erosional flow
Geothermal Warm basin (>40ºC/km) Moderate (30–
40ºC/km) Cold basin (<30ºC/km)
Reservoir–seal pairs Poor Intermediate Excellent
Storage capacity Porosity 6 to 15% porosity, storages will be taken in account depending on other
parameters. More than 15% porosity, storages will be considered.
Trap type Aquifer traps and regional aquifers. Effective Pore volume Discard capacities lower than 3Mt, to ensure minimum storage of 30 years at
injection rate 0.1Mt/a. Depth of reservoir Structures and formations whose top is placed at 800 metres or higher depths to
ensure supercritical conditions. Depths smaller than 2,500 metres due to decrease of effective porosity with depth
Injectivity Trap type Open traps / open aquifers to be favoured over closed traps/closed aquifers to
ensure les pressure build up. Permeability Permeability preferably above 200 mD for a specific reservoir to provide
sufficient injectivity. Lower permeability considered depending on other parameters.
Rock mechanics, diffusivity, evolution of piezometry.
Maximum pressure increases related to the geo-mechanical characteristics of the aquifer, and its propagation into the aquifer governed by diffusivity. Geo-mechanical and diffusivity parameters should be taken into account whenever information is available.
Integrity of seal Permeability Permeability of sealing rocks low enough to prevent CO2 from flowing from the
storage. Maximum permeability of 10-2 mD Seal thickness Sealing rock thicker than 50 metres. Faulting and tectonic activity
Less faulted formations favoured. The regional tectonic activity to be considered from seismo-tectonic maps and recent seismic records. Discard formations/traps crossed by active faults.
Homogeneity of seal rocks
Homogeneous and laterally continuous formations to be favoured

CCS Roadmap for Portugal, phase I – CO2 storage and transport options and risks
10
2.2.2. Potential storage areas
Porto Basin
The Porto Basin is located in the northern WIM (West Iberia Margin), which evolved through a sequence of rift episodes, between the Late Triassic and Early Cretaceous, with the structure of the WIM marginal basins, including the Porto Basin, being strongly controlled by prominent faults and folds originated during the late Palaeozoic (Pinheiro et al., 1996; Ribeiro et al., 1996). The basin is a relatively narrow (∼50km wide), extending between the coast and the outer continental shelf and slope, so fully offshore without connection to sedimentary sequences onshore. The basin is located in the northward extension of the Lusitanian Basin (Fig. 8, page 7), delimited to the east by the Porto-Tomar Fault, a major late Variscan lineament which has been active throughout most of the basin evolution. A horst block on its western side separates the Porto Basin from the Galicia Interior Basin (Alves et al., 2003; Pinheiro et al., 1996).
There are five oil exploration boreholes in the basin and the geophysical logs in those boreholes were analysed to distinguish between potential reservoirs and cap-rocks. From the simplified porosity-depth profiles, two formations were selected as potential reservoirs for CO2 storage:
• The sandstone layers in the Torres Vedras Formation, with porosities ranging between 20% and 40% and thickness varying from 160 m to almost 1000 m. The Torres Vedras Formation is sealed by interlayered clay layers in the Formation itself and by the marls in the Cacém Formation, generally less than 100 m thick, with porosities in the order of 10%.
• The sandstones and conglomerates in the Silves Formation, which exhibit porosities of up to 20% and thickness above 800 m, sealed by low porosity evaporites of the Dagorda Formation.
Supercritical conditions are estimated, based on hydrostatic pressure and geothermal gradient maps, to exist in a bulk volume of 2790 km3 for the Torres Vedras Formation, and of 380 km3 for the Silves potential reservoir, but for the latter only along a narrow band sub-parallel to the coast, since a maximum depth of 2500 m was imposed as economical for CO2 storage (see Table 2).
The reservoirs are heavily compartmentalised by faults, particularly the Silves Formation, but there is insufficient information about the hydraulic behaviour of the faults. For the purpose of assuming a storage efficient factor (Seff), a conservative approach was adopted, and the main faults were assumed impermeable, dividing the reservoirs in several laterally closed storage areas for the Torres Vedras Formation (sites A1 to A8 in Fig. 9), while only one area was defined in the Silves Formation (B1 in Fig. 9).

CCS Roadmap for Portugal, phase I – CO2 storage and transport options and risks
11
Lusitanian Basin – Central and North Sectors
Also situated along the WIM and trending NNE-SSW, the Lusitanian Basin covers approximately 20.000 km2 in the west-central part of mainland Portugal and the adjacent continental shelf. It formed over a sequence of rift pulses, between the Late Triassic and Early Cretaceous, and subsequent opening of the North Atlantic Ocean (Alves et al., 2009; Pinheiro et al., 1996; Rasmussen et al., 1998; Wilson, 1988).
The Lusitanian Basin (Fig. 8a, page 7) is defined as the area between the coastal town of Aveiro, in the north, and the coast south of the Arrábida Chain. To the west, the basin is bounded by the “slope fault system” and, in places, by prominent horsts (e.g. the Berlengas Horst), and to the east by the Porto-Tomar fault, that delimits the Hercynian Massif.
Twelve boreholes were drilled in previous oil exploration campaigns in the Lusitanian Basin (Ca-1, Do-1C, 13E-1, Mo-1, 13C-1, 14A-1, 14A-2, 14C-1A, Fa-1, 16A-1, 17C-1, 20B-1). Most of the available seismic data has also been acquired during oil exploration surveys between the 1970’s and 80’s, associated with those drilling campaigns.
Similarly to the Porto Basin case, an analysis of the borehole geophysical logs was conducted to select the potential reservoirs and cap-rocks:
Fig. 9 – a) Stratigraphy of Porto Basin and indication of reservoir and cap-rock pairs. b) Location of selected areas.
a) b)

CCS Roadmap for Portugal, phase I – CO2 storage and transport options and risks
12
• The sandstones in the Torres Vedras Formation, with porosities ranging between 15% and 40%. The Torres Vedras Formation is topped by the Cacém Formation, with values of porosities on the order of 15%.
• The sandstones and conglomerates in the Silves Formation, which exhibits porosities of up to 15-25% and sealed by low porosity evaporites of the Dagorda Formation. Although usually very deep, the Silves formation is in several areas shallower than 2500, which is considered within the admissible limit for CO2 storage.
Within the required temperature and pressure to ensure supercritical conditions, the bulk reservoir volume of the Torres Vedras Formation was estimated at 1454 km3, while for the Silves Formation, the bulk reservoir volume was estimated at 398 km3.
The same conservative approach used in the Porto Basin was adopted in the Lusitanian basin, assuming all potential storage sites as laterally closed structures, compartmentalised by impermeable faults. Eight closed storage areas were defined for the Torres Vedras Formation (sites A1 to A8 in Fig. 10), and 5 potential areas were defined for the Silves Formation (sites B1 to B5 in Fig. 10).
a) b)
Fig. 10 – a) Stratigraphy of the offshore Lusitanian Basin and indication of reservoir and cap-rock pairs. b) Location of selected areas in the offshore Lusitanian.

CCS Roadmap for Portugal, phase I – CO2 storage and transport options and risks
13
Sines /Santiago do Cacém Sector of the Lusitanian Basin The Sines/ Santiago do Cacém sector of the Lusitanian Basin is located in the west offshore Portuguese rift margin between the Lower Tagus valley fault and Sines/Santiago do Cacém, with a western limit defined by the 200m bathymetric. The area encompasses the southernmost Lusitanian Basin, also referred to by some authors as the Santiago do Cacém sub-basin (onshore) and the continuation of the Alentejo Basin to the north (offshore).
This sub-basin is the least explored in the offshore, with only two oil explorations boreholes (Golfinho-1 and Pescada-1) having been drilled and with lower quality seismic surveys.
From the simplified porosity-depth profiles for the two boreholes, again the Silves Formation strikes as possibly interesting for CO2 storage, with porosities ranging from 15% to 25% and sealed by the low porosity evaporites of the Dagorda Formation (Fig. 11). The top of the Silves formation is in extensive areas between the 800 and 2500m depth; i.e. within the ideal pressure interval for CO2 storage (Vangkilde-Pedersen et al., 2009). The Silves Formation reservoir allows for supercritical CO2 conditions in a bulk volume of 9.4 km3.
The southern sector of the Lusitanian Basin was subdivided into four sub-areas (designated A1 to A4), assumed laterally closed along the main structural features (which may act as natural
Fig. 11 – a) Stratigraphy of the Sines/Santiago do Cacém sector and indication of reservoir and cap-rock pairs. b) Location of selected areas in the Sines/Santiago do Cacém sector.
a)
b)

CCS Roadmap for Portugal, phase I – CO2 storage and transport options and risks
14
barriers for liquid/gas migration) and the physiography of the basin (Fig. 11). Those areas are the most favourable locations for CO2 storage in the Sines/Santiago do Cacém sub-basin, with expected clastic sections in the Silves Formation, probably present in fair to good reservoir characteristics, and laterally varying thickness. Due to its thickness and reology, the thin evaporite coverage of the Dagorda units can act as effective seal. Nevertheless, argillaceous sections in these and other areas to the North can also act as good seals for the Silves formation reservoirs, if proper porosity and permeability conditions are in place.
Algarve Basin
The offshore Algarve Basin (Fig. 8a, page 7) is located on the south-western margin of the Iberian Peninsula, just north of the Azores-Gibraltar Fracture Zone, which marks the present day boundary between the Nubia and Eurasia tectonic plates (Lopes et al., 2006; Terrinha et al., 2006). The structure of the sedimentary basins of southern Portugal is mainly controlled by late Variscan lineaments, striking approximately ENE-WSW. These lineaments have been reactivated both during Mesozoic rifting and Late Cretaceous-to-Recent compressing events (Terrinha et al., 2006; Zitellini et al., 2001).
The adopted stratigraphy of the Algarve Basin is based on five oil exploration boreholes: Imperador-1, Ruivo-1, Corvina-1, Algarve-1 and Algarve-2, and in the extensive 2-D seismic surveys conducted in the 1970’s and 80’s.
The simplified porosity-depth profiles interpreted from the geophysical logs revealed as possible reservoirs the Early Cretaceous sequence, in boreholes Imperador-1 and Corvina-1, and the base Late Cretaceous in borehole Ruivo-1, with porosities ranging between 15% and 30%. However, these sequences do not exhibit great lateral continuity. Moreover, the Cretaceous sequences are topped by Palaeogene limestones, marls, clays and sands with highly variable porosity.
The Miocene sand layers are also possible reservoirs, with porosities from 20% to 33% (Matias, 2007), with extensive shale deposition from the Plio-Miocene providing an effective sealing. Five oil exploration boreholes have intercepted the Miocene sands at depths ranging from 550 m to 950 m, with thickness varying from 250 m to 400 m. Since the depth required for CO2 storage is usually above 700 m, the Miocene Sands could act as reservoirs only at the places with greater depths.
Within the recommended depth range for storage, i.e. between 800 and 2500m of sediment coverage, the bulk reservoir volume for the Early Cretaceous sequence is 663 km3, while the Miocene sands have a bulk volume of 592 km3.
As for the other zones, several laterally closed storage areas were selected with limits imposed by the main faults and structures. Five storage areas (A1 to A5 in Fig. 12) were selected in the Cretaceous reservoir and one site (B1 in Fig. 12) for the Miocene reservoir.

CCS Roadmap for Portugal, phase I – CO2 storage and transport options and risks
15
Onshore Lusitanian Basin
The Lusitanian basin has an extensive onshore area along the western coastal region of Portugal, in which the Mesozoic sedimentary formations outcrop. The stratigraphic sequence in the sedimentary basin shows no major differences from the offshore sequence, where the potential reservoirs are the Lower Cretaceous Torres Vedras Formation and the Upper Triassic Silves Formation.
However, in most of the onshore sector the Torres Vedras Formation has been eroded, outcrops or is too shallow for CO2 storage, frequently being a good freshwater aquifer. Hence, onshore the only possible reservoir is composed by the sandstones and conglomerates from the Upper Triassic Silves Formation. Along most of the onshore Lusitanian basin the Silves Formation is too deep for considering CO2 storage (often more than 3500 m deep). Only in a region in the Leiria District, it occurs within the depth interval considered in the site screening, although always deeper than 1600 m.
Four areas were defined as selected for CO2 storage (Fig. 13): i) S. Mamede; ii) Alcobaça; iii) S. Pedro de Moel and iv) Alvorninha.
Fig. 12 – a) Stratigraphy of the Algarve basin and indication of reservoir and cap-rock pairs. b) Location of selected areas in the Algarve basin.
a) b)

CCS Roadmap for Portugal, phase I – CO2 storage and transport options and risks
16
The reservoir is highly compartmentalized, being crossed by many faults, but there are no indications about the hydraulic behaviour of those faults. Porosity of the reservoir, temperature and salinity of the formation water were assessed using geophysical logs of borehole Aljubarrota-2, in the Alcobaça site (Pereira et al., 2014). Sonic porosity is low, ranging from 3% to 9%, salinity varies from 6 ppm to 35 ppm and maximum temperature is 81◦C.
The reservoir is capped by an excellent seal, the salt, clay and marls of the Lower Jurassic Dagorda Formation, with thickness usually above 400 m and reaching values higher than 1500 m in the S. Mamede and Alcobaça areas. Only in the Alvorninha is the thickness lower than 200 m.
2.2.3. Storage capacity
The screening criteria applied in the sedimentary basin in Portugal considered several geological constraints, including the occurrence of supercritical conditions, geometry of the reservoirs (defined within a Geographic Information System), permeability and porosity of the reservoir, salinity of the formation water, thickness and continuity of the cap-rock, and existence of known active faults. Nevertheless, no legal, infrastructure, or economic barriers were considered (other than discarding potential areas deeper than 2500 m due to being considered uneconomical). Therefore, the storage capacity here indicated is classified under the Techno-Economic Resource-Reserve Pyramid (Fig. 7, page 6) as an Effective Storage Capacity.
The storage capacity of the identified potential injection sites was estimated resorting to the volumetric equation given by Vangkilde-Pedersen, et al. (2009), where the regional storage capacity, MCO2, is given by:
2 2CO CO r effM A h NG Sφ ρ= ⋅ ⋅ ⋅ ⋅ ⋅ (1)
Fig. 13 – a) Stratigraphy of the onshore Lusitanian Basin and indication of reservoir and cap-rock pairs. b) Location of selected areas in the onshore Lusitanian Basin.
a) b)

CCS Roadmap for Portugal, phase I – CO2 storage and transport options and risks
17
where A, h, NG and φ are, respectively, area of trap or regional aquifer, average thickness, average net-to-gross ratio and average porosity of the reservoir. ρCO2 is the CO2 density at reservoir conditions and Seff is the storage efficiency factor.
Equation (1) is a simplification of the methodology proposed by the CSLF (2007) for effective storage capacity in basin- and regional-scale assessments, and was applied in the GEOCAPACITY project (Vangkilde-Pedersen et al., 2009). Since the assessment conducted in Portugal classifies as a regional-scale assessment, with subdivision into multiple potential storage areas, equation (1) is applied using the same criteria as in the GEOCAPACITY project.
Table 3 identifies the source of data for each parameter in equation (1). The efficiency factor (Seff) is the main source of uncertainty, since it is site specific and needs to be determined through numerical simulations (CSLF, 2007). To overcome that difficulty, the GEOCAPACITY project provides guidance for adopting trap-specific efficiency factors for open- and closed-aquifer systems (Vangkilde-Pedersen et al., 2009). For open-aquifers Vangkilde-Pedersen et al. (2009) suggest Seff values between 20% and 40% for high quality reservoirs, between 10% and 20% for low quality reservoirs, while for fully closed-aquifers, the suggested Seff values range from 3% to 5% for high quality reservoirs, and less than 3% for low quality (Fig. 14) . In the assessment here reported a uniform efficiency factor Seff=2% was adopted for all the selected potential storage areas1
The efficiency factor is site specific (
.
CSLF, 2007) and should be estimated from numerical simulations (or at least from the rock and fluid compressibility’s and admissible pressure increase (Goodman et al., 2011)). However, since there is not enough data to make separate estimates of Seff for each selected area or even each basin, and it is more realistic to assume a uniform conservative value.
1 The US DOE (U.S. Department of Energy) indicates efficiency factors varying from 0.5% to 5.4% in clastics aquifers, for the P10 and P90 percent probability range, respectively. The 50% (P50) probability range is precisely 2% (Goodman et al., 2011). However, that approach is applicable to the bulk volume of a regional aquifer and the efficiency factor includes, amongst other, the effect of a net-to-total area and of net-to-gross (NG). These are considered separately from Seff in equation (1), which is meant to be applied to traps or localised areas in a regional aquifer. Therefore, the Seff=2% applied in this report is equivalent to a much smaller US DOE efficiency factor. Since the NG in the assessed sites varies from 18% to 94%, and the area used is only a fraction of the aquifer area, the equivalent US DOE efficiency factor would range from less than 0.36% (for NG=18%) to less than 1.9% (for NG=94%). Thus, the adopted Seff of 2% is regarded as a conservative value in accordance with both GEOCAPACITY and US DOE approaches.
Fig. 14- Criteria for selecting the efficiency factor in open to closed aquifers. After Vangkilde-Pedersen et al. (2009).

CCS Roadmap for Portugal, phase I – CO2 storage and transport options and risks
18
The total storage capacity amounts to 7.56 Gt CO2 in the 36 potential storage areas, for an efficiency factor Seff= 2%. Fig. 15 provides an overview of the locations of the potential storage areas and estimated capacity. The linear dependence of the capacity with Seff shows the importance of this parameter. For instance, an even more conservative value of Seff =1% applied uniformly to the 36 evaluated areas would reduce the storage capacity to 3.8. Gt CO2.
Appendix 1 summarizes the database used to compute the storage capacity in each site for each storage site and the distribution of storage capacity in the several basins.
2.2.4. Storage clusters
Storage clusters were defined aggregating multiple potential injection sites, thus simplifying the definition of CO2 transport networks. Three criteria were used to define the clusters:
• Continuity of geological basin/structure - when multiple potential storage areas are part of the same sedimentary basin, and there is the possibility that the injected CO2 may spread across contiguous areas, those potential storage areas are included in the same cluster;
• Distance between selected areas – distance between potential injection sites is considered when building the clusters, although no constant distance is imposed. For each selected area, the potential injection site is defined as the location of an existing borehole or, in the absence of boreholes, as the centroid of the polygon limiting the selected are. Thus, when following criterion 1, several clusters may still result in the same basin if the injection sites are too distant from each other;
• Onshore /offshore setting – onshore and offshore storage potential storage areas are always included in distinct clusters, even if there is geological continuity between them. This criterion is imposed due to the different costs involved in onshore and offshore storage.
Table 3 – Parameters used in the storage capacity calculation and sources of data. Parameter Description Source of data
A Area of reservoir
Evaluated with GIS for each individual area, considering existence of supercritical conditions. GIS layers including: depth maps of top and bottom of reservoir, built from interpretation of 2-D seismic (see Fig. 8b); hydrostatic pressure maps; geothermal gradient; surface and seabed temperature maps.
h Thickness of aquifer
Evaluated with GIS for each individual area, by difference between top and bottom depth maps of the reservoir. In equation (1) it was used the thickness at the location of an existing borehole or, in the absence of boreholes, at the centroid of the polygon delimiting the area. See Fig. 9 to Fig. 13 for location of existing boreholes.
NG Average net-to-gross ratio
Evaluated from lithology records of the boreholes existing, or nearest, to each individual area. See Fig. 9 to Fig. 13 for location of existing boreholes.
φ Average reservoir porosity
Evaluated from geophysical logs in boreholes existing, or nearest, to each individual area. See Fig. 9 to Fig. 13 for location of existing boreholes.
ρCO2r CO2 density at reservoir conditions
ECO2N data (CO2TAB) of CO2 properties, for reservoir pressure (hydrostatic) and temperature estimated with GIS.
Seff Efficiency factor Uniformly set to 2%, based on the GEOCAPACITY project approaches.

CCS Roadmap for Portugal, phase I – CO2 storage and transport options and risks
19
In total 8 clusters were defined S01 to S07 and S42, the main characteristics of which are given in Table 4. Fig. 15illustrates the spatial distribution and storage capacity of the clusters.
Table 4 – Main features of storage clusters.
Cluster name
Sedimentary basin Setting
Number of selected areas
Selected areas* Cluster storage
capacity (Mt CO2)
S01 Porto Offshore 5 P_A1; P_A2; P_A3; P_A4; P_A5 1230 S02 Porto Offshore 4 P_A6; P_A7; P_A8; P_B1 870
S03 Lusitanian (north) Offshore 5 NL_A1; NL_A2; NL_A3; NL_A6; NL_B1 2200
S04 Lusitanian (north) Offshore 8 NL_A4; NL_A5; NL_A7; NL_A8; NL_B2; NL_B3; NL_B4; NL_B5 1590
S05 Lusitanian (north and central) Onshore 4 S. Mamede; Alcobaça; S. Pedro
de Moel; Alvorninha 340
S06 Lusitanian (Sines- Santiago Cacém) Offshore 4 SL_A1; SL_A2; SL_A3; SL_A4 80
S07 Algarve Offshore 6 A_A1; A_A2; A_A31; A_A4 410 S42 Algarve Offshore 2 A_A5; A_B1 840
*see table 4 for details on selected areas
Fig. 15 - Location of storage sites and capacity per cluster (S# refers to cluster number, see section 2.2.4 for explanation).

CCS Roadmap for Portugal, phase I – CO2 storage and transport options and risks
20
2.3. STORAGE COSTS
2.3.1. Storage costs components
The costs for exploration, implementation and operation of the CO2 storage sites vary strongly depending on the type of reservoir (saline aquifers, hydrocarbon fields), location (onshore, offshore), surface area that needs to be characterised/monitored or the previous existence of wells and/or facilities. In this report, the development costs (i.e., exploration and implementation of facilities) were considered an investment that depends on the volume of the potential storage complex and its injection rate.
The investment costs for each specific storage site were estimated according to van den Broek et al. (2010):
( )d w sf sdI W C H C C C= + + + (2)
where: I - Investment costs (€). W - Number of wells per sink. The number of wells depends on the storage potential of the sink and the injection rate per well for the sink; Cd - Drilling costs (€ per metre). Cd = 0 if old wells can be re-used. This is never the case in Portugal; H - The drilling depth (in metres), being the depth of the reservoir starting at the bottom of the sea (for offshore sites) or the ground surface (for onshore sites) plus the thickness of the reservoir (in meter); Cw - Fixed costs per well (in €). In case of re-use of existing wells, these are the costs for the workovers of those wells (i.e. to make the well suitable for CO2 storage); Csf - Investment costs for the surface facilities on the injection site and investments for monitoring (e.g. purchase and emplacement of permanent monitoring equipment) (in €): Csd - Investment costs for the site development costs, e.g. site investigation costs, costs for preparation of the drilling site and costs for environmental impact assessment study. It also includes monitoring investment costs in pre-operational phase (in €).
Costs of CO2 storage were differentiated for storing CO2 in onshore fields or offshore aquifers. Given that depths to the seabed in Portuguese continental shelf can reach hundreds of metres at relatively short distances (as low as 20 km) from the coast, the costs components distinguish between storage with water column thickness below 60 m, from 60 to 100 m and above 100 m.
For large injection sites many injections wells may be admissible and multiple facilities surface facilities may be required. It was assumed that a surface facility should be considered for each 10 injection wells.
The OMM (Operating, Maintenance, and Monitoring) costs were always based on a fixed percentage (5%) of the Investment costs (I) for development of the CO2 storage site from scratch.
Table 5 lists the value assigned to each CO2 storage cost component in equation (2), with the exception of the number of wells, which depends on the injection rate per well and the admissible annual injection rate for each particular site. These were estimated taking into account the hydraulic, petrophysic and geomechanic parameters of each storage site.
Table 5 – Storage costs components and basic costs.

CCS Roadmap for Portugal, phase I – CO2 storage and transport options and risks
21
Cost component1 Onshore aquifer
Offshore aquifer2
(WD<60 m) Offshore aquifer
(60m<WD<100m) Offshore aquifer
(100m<WD<1000m) Site development costs (Csd) 24 480 k€ 24 097 k€ 24 097 k€ 24 097 k€ Drilling costs per meter (Cd) 4 k€ 10 k€ 18 k€ 26 k€ Well fixed costs (Cw) 0 k€ 8 200 k€ 8 200 k€ 8 200 k€ Surface facilities3 (Csf) 1 530 k€ 61 200 k€ 61 200 k€ 61 200 k€ Monitoring investments 1 530 k€ 1 530 k€ 1 530 k€ 1 530 k€ OMM4 5% 5% 5% 5% 1 in €2007
2 WD – depth to sea bottom 3 One surface facility per each 10 injection wells 4 Operating, Maintenance and Monitoring (OMM) costs are given as a % of investment costs.
2.3.2. Estimating injection rates and number of wells
The importance of the injection rate to the viability of CO2 storage was highlighted by Ehlig-Economides and Economides (2010), in which the authors advocate that low compressibility of fluids and rocks do not allow for large scale storage of CO2. Replies by Cavanagh et al. (2010) stress the importance of clearly distinguishing between closed and open reservoirs, and that evidence from the existing large scale storage sites (e.g. Sleipner, In Salah, Weyburn, etc.) demonstrate that high injection rates can be obtained, although the issue of pressure build-up should be considered carefully. Numerical analysis for determining the storage capacity of the Utsira Formation (Bergmo et al., 2011; Lindeberg et al., 2009), a large size aquifer with excellent permeability, indicate that even for that case, under scenarios of intensive use (injecting of up to 21 Mt/a in Bergmo et al., 2011, and 2.3 Mt/a/well in at least 70 injectors in Lindeberg et al., 2009) pressure build-up control requires a large number of injection and production wells. This issue is particularly relevant for onshore storage, where production wells may be less acceptable, due to the difficulties for discarding the high salinity water in an environmental sound and cost-effective manner, and for closed aquifers. For closed aquifers, the injection induced pressure increase will be accommodated mostly by the rock and fluid (brine and CO2), which have low compressibility.
In order to estimate the injection rate and admissible number of wells in each injection site, a spreadsheet tool was implemented, taking in account parameters such as depth, permeability, radius of influence of wells, interference between wells, pressure build-up, rock and fluids compressibility and CO2 density under storage conditions (Table 6). An admissible pressure build-up of 20% of the initial reservoir pressure was the constraint imposed to define the injection rate in each storage site. All CO2 and brine properties, such as density, viscosity and compressibility were computed taking into account the pressure and temperature dependence (by linking the spreadsheet to the relevant subroutines in TOUGH2 (Pruess et al., 1999) and in ECO2N (Pruess, 2005; Pruess and Spycher, 2007)).
The analytical solutions implemented were those of Dentz and Tartakovsky (2009), Mathias et al.(2009), Nordbotten et al.(2005) and Vilarrasa et al.(2010). A common assumption of the four solutions is that the aquifer is unbounded, i.e., it is infinite. However, all the possible injection sites were considered to be closed structures, due to the faulted nature of the reservoirs and complex tectonic history of some of the sedimentary basins occurring in the study region. Closed structures imply larger pressure build-ups and more conservative injection rates. To simulate the effect of pressure build-up on a closed structure a term was added, according to the solution of Ehlig-Economides and Economides.

CCS Roadmap for Portugal, phase I – CO2 storage and transport options and risks
22
Table 6 - Parameters and sources of data.
The radius of influence of each well was used to estimate the number of wells admissible in each structure. The radius of influence of each well was estimated from the Cooper and Jacobs (1946) equation, except for Mathias et al. (2009) solution which does not require the calculation of a radius of influence. The number of injection wells was calculated as the integer ratio between the area of the reservoir and the radius of influence (or the radial distance corresponding to the admissible pressure interference).
Brine production wells were not considered an option to control pressure build-up. A final assumption was made that no single well could have an injection rate above 1Mt CO2/a. The injection phase was set to 30 years and well efficiency was set to 80%. Rock compressibility was found to be a key parameter for which no estimates existed for any of the potential storage sites and to be very scarce in the literature for the depths under consideration. Rock compressibility’s were computed following Yale et al. (1993) solution, as a function of rock type, reservoir depth and pressure
The total injection rate for the 36 potential storage sites was estimated at 104 MtCO2/a, with an average injection rate of 2.9 MtCO2/a per site, a minimum of 0.2 MtCO2/a in the S_Lusitanian_A4 storage site and a maximum value of 11.5 MtCO2/a in the Algarve_A2 storage site. The injection rate per well is, on average, 0.7 MtCO2/a, with minimum value of 0.2 MtCO2/a in the S_Lusitanian_A4 storage site and a maximum imposed as 1 MtCO2/a (Fig. 16).
The admissible number of wells, without allowing for pressure interference or considering production wells for pressure build-up control, was on average of three wells per storage site, but with a distribution skewed to the lower number of wells (Fig. 16). In fact, in about 23% of the injection sites, a single well was admissible. This reflects the large radius of influence for each well, given the long injection period (30 years) and that all models consider confined aquifers conditions (a pre-requisite for site selection).
Parameters Data sources Re
serv
oir
prop
ertie
s Intrinsic permeability (k)
COMET database
Porosity (φ) Pore volume (Vt) Reservoir Thickness (H) Reservoir Pressure (P0) Reservoir temperature (T0) Reservoir Area (A) Rock compressibility (α) Yale et al. (1993) solution
Brin
e pr
oper
ties
Brine salinity (XS) COMET database Brine compressibility (β)
TOUGH2 - ECO2N subroutines Brine viscosity (µw) Brine density (ρw) Hydraulic conductivity (Kw) 𝑘𝜌𝑤𝑔 𝜇𝑤⁄ Specific storage (Ss) 𝑔𝜌𝑤(𝛼 + ∅𝛽)
CO2
prop
. CO2 viscosity (µc) TOUGH2 - ECO2N subroutines CO2 density (ρc) CO2 permeability (Kc) 𝑘𝜌𝑐𝑔 𝜇𝑐⁄
Radius of influence (R0) – not required in Mathias et al. (2009) solution �2.25𝑡𝑘𝜌𝑤𝑔/(𝑆𝑠µ𝑤)
Closed aquifers – average pressure increase (Ehlig-Economides and Economides, 2010) solution, 𝑉𝐶 (𝑉𝑡𝑐𝑡)⁄
Well radius (rw) 0.15 m Time (t) 30 years Limit to pressure increase (∆P) 0.2P0 Well efficiency 80% Limit to interference between wells <0.25∆P

CCS Roadmap for Portugal, phase I – CO2 storage and transport options and risks
23
However, the low number of injection wells for most storage sites also reflects the option to maximize the injection rate in each well. It is possible to obtain higher total injection rates by allowing for pressure interference between wells, each with lower injection rates than a single well. Nevertheless, the increase in total injection rate is less significant due to the reduction in the injection rate in each well to account for pressure interference.
As for the injection rates per storage cluster, the highest values are found in the S01 (Porto Basin 1) and S07 (Algarve 2) clusters, where the injection rate is of 16.1 MtCO2/a. The lowest injection rate (1.7 MtCO2/a) is obtained in S06 (South Lusitanian) cluster (Table 7 ).
Table 7 – Injection rates and storage costs per cluster.
Cluster Cluster name Storage capacity MtCO2
Injection rate MtCO2/a
Injection rate per well MtCO2/a/well
S01 Porto Basin 1 1205 16.1 <0.8 S02 Porto Basin 2 800 3.8 <0.5 S03 North Lusitanian 1 2211 11.8 <0.8 S04 North Lusitanian 2 1592 11.4 <0.6 S05 Lusitanian Onshore 331 10.7 <0.8 S06 South Lusitanian 85 1.7 <0.4 S07 Algarve 2 402 35.7 <1.0 S42 Algarve 1 845 13.0 1.0
Fig. 16 – a) Injection rate; b) number of injection wells per selected area
a)
b)

CCS Roadmap for Portugal, phase I – CO2 storage and transport options and risks
24
2.3.3. Storage cost per selected area and cluster
The annual injection rates and number of wells are reflected in the investment costs, computed according to equation (2), and varying as shown in Fig. 17 for each potential storage site and summarised in Table 8 for each cluster. The highest storage costs are found in the South Lusitanian basin, with investments per injection rate of 349 €/tCO2/a and total storage costs of 17.5 €/tCO2. As expected the most competitive storage cluster is that located onshore, S05 (Lusitanian Onshore), with investments per injection rate of 27.9 €/tCO2/a and total storage costs of 3.8 €/tCO2. The shallower cluster in the Porto and north Lusitanian basin (clusters S01 and S03, respectively) also show fairly competitive storage costs of 13.6 and 12.6 €/tCO2, respectively.
Table 8 – Storage costs per cluster.
Cluster Onshore / Offshore Sites
Investment costs per injection rate
€/(tCO2/a)
Annual costs (OMM)
€/(tCO2/a)
Total storage costs* (Inv+OMM)
€/ton S01 Offshore 5 100 5.0 13.6 S02 Offshore 4 180 9.0 24.5 S03 Offshore 5 92 4.6 12.6 S04 Offshore 8 128 6.4 17.3 S05 Onshore 4 28 1.4 3.8 S06 Offshore 4 349 17.5 47.4 S07 Offshore 4 90 4.5 12.2 S42 Offshore 2 76 3.8 10.4
* In €2007 for a 30-year injection period at maximum injection rate and considering annual OMM costs equal to 5% of investment costs and a 7% discount rate.
a)
b)
Fig. 17 - Storage costs: a) per selected area; b) per cluster.

CCS Roadmap for Portugal, phase I – CO2 storage and transport options and risks
25
2.3.4. Average onshore and offshore storage costs
Onshore costs are represented by the costs in four selected areas in cluster S05, with investment per injection rate varying from 22.6 to 31.2 €/tCO2/a. The average (weighted over the injection rate) investment is 27.9 €/tCO2/a. Offshore investment shows a minimum of 61.1 €/tCO2/a, not surprisingly much higher than the onshore costs, and with 12 of the 35 offshore areas above 200€/tCO2/a. The highest investments are required in cluster S06 (South Lusitanian), where it can reach values above 500 €/tCO2/a (Fig. 17a). These high costs reflect the considerable depth of the reservoir, but mainly reflect the uncertainty on the hydraulic and petrophysic parameters of the reservoir, and consequent conservative approach to the injection rate and number of wells.
Taking into account all investment costs and OMM components, and assuming continuous injection at each storage site for 30 years at the maximum admissible injection rate and using a 7% discount rate, the average onshore storage costs are estimated to be 3.8 €/tCO2 for the onshore cluster. Offshore storage costs are higher, ranging from 10.4 €/tCO2 in cluster S42 (Algarve 2) to 47.4 €/tCO2 in cluster S06 (South Lusitanian). The average storage costs in the offshore areas is 19.7 €/tCO2, that is about 5 times the onshore storage costs.
The Zero Emission Platform (ZEP) and the IEA Greenhouse Gas R&D Programme (IEAGHG) published in 2001 an analysis of the costs of the several components of the CCS chain, including the cost of storage (ZEP, 2011a). Multiple storage scenarios were considered: onshore vs. offshore; saline aquifers vs. depleted oil and gas fields; and possibility or not of re-using existing wells. For comparison with the Portuguese case only the cases involving saline aquifers, onshore and offshore and no re-use existing wells, are of interest.
The onshore storage costs in saline aquifers found by ZEP (2011a) range from 1 €/tCO2 stored
to a high value of 7 €/tCO2 stored. The medium value is 5 €/tCO2, which compares reasonably with the average value found for the Portuguese onshore S05 cluster, where the storage costs range from 1.6 €/tCO2 to 13.9 €/tCO2, with a mean value of 3.8€/tCO2. The maximum storage cost found in cluster S05 reflects the large depth of the reservoir and low injection rate in some specific areas.
The ZEP (2011a)offshore storage costs range from a low value of 6 €/tCO2 stored to a high value of 20 €/tCO2 stored. The medium value is 14 €/tCO2, which is below the average found for the Portuguese case, 19.7 €/tCO2. However, if the very costly S06 cluster is removed from the possibilities considered for Portugal, the medium offshore storage costs would be 15 €/tCO2,
just one 1€/tCO2 above the medium value found by ZEP and IEAGHG.
The range of values estimated for the Portuguese offshore (10.4 to 47.4 €/tCO2) is also higher. This is thought to be due to: i) the injection rate considered in the ZEP (2011a) study is high, 0.8 Mt/well/a, decreasing the number of required wells, while injection rate lower than 0.4 Mt/well/a were found for some offshore clusters in Portugal; ii) ZEP (2011a) discarded all sites with capacity below 66 Mt in the GEOCAPACITY database, deemed as uneconomical. This approach was not followed in this report, which did not discard any site based on a priori judgment of their cost-effectiveness.

CCS Roadmap for Portugal, phase I – CO2 storage and transport options and risks
26
2.4. RISKS AND RANKING OF STORAGE SITES The EU Directive 2009/31/EC (EC, 2009), commonly referred to as the CCS Directive, provides the general regulation framework for CO2 storage activities and was translated into the Portuguese Decree-Law 60/2012 (MEE, 2012).
Annex I to the DL 60/2012 specifies detailed requirements for the site characterisation and risk assessment, in a direct translation from the text in the EU Directive. Risk assessment is included as a step in the process of characterisation of the dynamic storage behaviour, sensitivity characterisation and risk assessment for candidate storage sites. It is specifically required that such steps are based on numerical modelling results and, in what regards risk assessment, includes inter alia: i) an Hazard characterisation (including information such as leakage pathways, flux rates, etc.), ii) an Exposure Assessment (based on the characteristics of environment and human population), iii) an Effects assessment (based on the sensitivity of particular species, habitats and communities, and iv) a Risk characterisation (based on hazard, exposure and effects).
The Guidance Document 1(EC, 2011) to support the implementation of the EU Directive, details further the requirements for risk assessment, but also mentions that in the phase of storage capacity assessment, a initial assessment of the potential risks should be taken into account, and should give ‘a clear idea of what further information is needed to ensure that a particular site will be suitable and safe’.
The EU Directive, Guidance Document 1 and DL60/2012 are directed towards the characterisation of candidate sites for CO2 injection, which is obviously far more demanding than the regional scale assessment described in this report. Rather than conducting detailed hazard characterisations or risk assessments for each potential storage area, what is relevant to the high-level screening conducted in Portugal is: i) to identify the main risks in each selected area and cluster; ii) to rank the selected areas and clusters in terms of risks; and ii) to provide insights into the information that should be preferentially collected. The choice of the methodology to apply needs not only be able to achieve those results, but also consider the scarcity of detailed data and should not require the use of proprietary software tools.
2.4.1. Risk assessment methodology
In order to reduce the possibility that geologic storage of CO2 will result in HSE (health, safety, and environmental) impacts due to CO2 leakage and seepage, it is essential that sites be chosen to minimize HSE risk. There is a wide variety of recognized potential pathways for leakage from deep geological formations to the near surface environment, e.g., abandoned wells and permeable fault. However, for nearly every leakage pathway, there is also potential for secondary containment at higher levels in the system (Oldenburg, 2008). In addition, CO2 leakage along any of the pathways involves the potential for attenuation or dispersion of a CO2
plume during migration (Fig. 18).
To minimize HSE effects, it is necessary that injected CO2 either does not leak from the storage formation, is secondarily trapped if leakage does occur, or is attenuated or dispersed if leakage occurs (e.g., by mixing in the atmosphere, or by uptake and mixing by groundwater or surface water) and if there is ineffective secondary entrapment.

CCS Roadmap for Portugal, phase I – CO2 storage and transport options and risks
27
Several methodologies have been used for risk assessment for CO2 storage in geological reservoirs and have been recently reviewed by Delprat-Jannaud et al. (2013) and NETL (2013), including the selected approach, the Screening and Ranking Framework1
The SRF (Screening and Ranking Framework)was designed so that it can be applied to sites with limited data, which is the case for Portugal, with selection at an early stage, with multiple sites under consideration and where detailed site characterization data is lacking. The system is sufficiently simple and transparent that anyone can review the assessments done by other users and re-do the assessment if there is disagreement (
.
Oldenburg, 2008).
The SRF approach was developed by Oldenburg (2008) to evaluate multiple potential CO2 geological storage sites on the basis of health, safety, and environmental risk arising from CO2 leakage. The SRF approach is a three grade ranking system. The ranking is built on the assumption that CO2 leakage risk is dependent on three basic Characteristics of a potential geologic CO2 storage site:
• Primary containment - potential of the target formation for long-term containment of CO2; • Secondary containment - potential for containment if the primary target site leaks; • Attenuation potential - potential of the site to attenuate and/or disperse leaking CO2 if
the primary formation leaks and secondary containment fails
These three Characteristics are evaluated for each site and are proxies for combinations of impact and likelihood (i.e., risk) of leakage, secondary entrapment, and attenuation.
The definitions, notations and workflow proposed by Li et al. (2013) for application of the SRF approach are followed in this report. According to those authors, primary containment is 1 The Screening and Ranking Framework is also one of the methodologies recommended in the CO2QUALSTORE workbook with examples (DNV, 2010a).
Fig. 18 – Schematic representation of risks linked to CO2 storage (Oldenburg, 2008).

CCS Roadmap for Portugal, phase I – CO2 storage and transport options and risks
28
composed by the reservoir and the immediately overlying cap-rock. Secondary containment is defined as the place where CO2 or brine will migrate to if: i) there are leakage features that are not well defined prior to commencing injection; ii) leakage features develop during operation; or iii) where CO2 or brine will migrate after a period of time, e.g., decades after injection stops (Li et al., 2013).
The grades derived for the three Characteristics (k) are determined by evaluation of nine secondary Attributes (i) and 42 third-level Properties (j) (Table 9). To the each property (j) of every potential storage (n) site the following grades are given:
• a weight (wj) between 1 and 10 (from least to most important), • an assessment of attribute property associated with HSE risk (aj) between −2 and 2
(negative attribute to positive attribute) • a certainty factor (cj) between 0.1 and 2 (poorly known to very well known)
The SRF approach then calculates an index based on user input to arrive at the Score (Sk,n) for each characteristic, Total Average Attribute (Tasn) and Total Average Certainty (Tacn), and the Magnitude of Total Average (Tn) of the site n are obtained for evaluation. The calculation process is shown in Fig. 19 (Li et al., 2013).
Different sites can be compared through evaluation of the values of Sk,n, Ck,n, Tasn, Tacn, and Tn, which indicate the attributes and certainty of the characteristics (primary containment, secondary containment and attenuation potential), and the attribute, certainty and total average of site n, respectively. Screening and ranking is carried out by comparing results from multiple sites. Output of the method is composed of charts of attribute assessment versus certainty factor allowing to identify poor, fair and good HSE quality ranking of the potential sites.
Fig. 19 – SRF calculation process, according to Li et al. (2013).

CCS Roadmap for Portugal, phase I – CO2 storage and transport options and risks
29
Table 9 – Indicators, attributes, properties and weights of SRF approach.
Characteristics (k) Attribute (i) Property (j) Weight (w)
Potential for primary containment
Primary seal
Thickness 10 Lithology 5
Demonstrated sealing 1 Lateral continuity 5
Depth Distance below surface 5
Reservoir
Lithology 1 Permeability (mD) and
porosity(-) 2
Thickness (m) 1 Fracture or primary porosity 1
Pore fluid 1 Pressure 1 Tectonics 10
Hydrology 2 Deep wells 2
Fault permeability 3
Potential for secondary
containment
Secondary seal
Thickness 10 Lithology 5
Demonstrated sealing 1 Lateral continuity 5
Depth 5
Shallower seals
Thickness 10 Lithology 5
Lateral continuity 5 Evidence of seepage 5
Attenuation Potential
Surface characteristics
Topography 5 Wind 10
Climate 2 Land use 4
Population 10 Surface water 2
Groundwater hydrology
Regional flow 6 Pressure 7
Geochemistry 2 Salinity 4
Existing wells
Deep wells 5 Shallow wells 4
Abandoned wells 10 Disposal wells 1
Faults
Tectonic faults 10 Normal faults 1
Strike-slip faults 1 Fault permeability 5
Uncertainty in the SRF approach is defined broadly and includes parameter uncertainty and variability. It is kept separate, through the certainty factor (cj), from the scores for the characteristics and is a primary graphical output along with the attribute assessment for each of the three characteristics. The overall certainty Ck,n, reflects the user’s confidence in how well the characteristics are known.

CCS Roadmap for Portugal, phase I – CO2 storage and transport options and risks
30
2.4.2. Implementation of the risk assessment methodology
The SRF approach was implemented for the 36 selected storage areas defined in the eight storage clusters (see section 2.2.4 and the spatial distribution of the clusters in Fig. 15, page 19). The database used was the same built in the COMET project (see Appendix A), but manipulated and rearranged according to the properties and attributes used in the SRF.
The first step of the SRF is to define the weights of each Property (j). The default weights in the SRF spreadsheet were adopted, except for the properties Lateral continuity, Fault permeability, and Tectonics that were assigned higher weights since they were found to be important parameters. Properties Demonstrated sealing and Distance below surface were assigned lower weights than the default value, since those were already parameters considered in the site screening process. The properties Tectonics was assigned a weight of 10, much above the default 2, recognizing the importance of the active tectonics and seismicity in Portugal. Table 9 lists the weights assigned.
Weights need also to be assigned to the relative importance of the three Characteristics (k) when computing the final score of each site n (the Magnitude of Total Average, Tn). It was decided to rank all Characteristics with the same importance, so that similar weights of 1 were assigned to Primary Containment, Secondary Containment and Attenuation Potential.
The registry of scores assigned to each property, both in terms of certainty and attribute assessment is included as Appendix B.
2.4.3. Results of the SRF approach
Uncertainty and lack of data
One interesting applications of the SRF approach is to identify the properties that lacks detail or are very uncertain and are influent to the HSE risk. Such uncertainty or lack of data is perceivable by the Certainty (cj). A Certainty of 0.1 identifies poorly known data, a factor of 1 a generally accepted data and a factor of 2 a very well known information.
Fig. 20 depicts the average Certainty (cj) adopted for every property of the 36 potential storage sites. It strikes that some crucial properties from the Primary Containment, Reservoir Attribute, are poorly known. That is the case for the permeability and porosity and fault permeability properties. While the first two properties are crucial to estimate storage capacity and injection rate, there is little that can be done with the existing information. Porosity is, in fact, relatively well known from the geophysical borehole logs, but there are almost no hydraulic test conducted at the required depths for CO2 storage. The lack of information about permeability of the reservoirs can only be solved with hydraulic tests in future oil exploration boreholes or through pilot water/CO2 injection tests.
The lack of information about fault permeability is troublesome for the correct evaluation of the HSE quality of the storage sites. Mesozoic sedimentary basins in Portugal have been tectonised, with many faults perceivable in the 2-D seismic surveys and in the field works in the onshore cluster S05. However, there is a complete absence of information about the hydraulic behaviour of those faults (are they impermeable and barriers to flow, or are they more permeable than the cap-rock and allow for vertical migration of the CO2?). Again, this issue can only be solved through long-term hydraulic tests in future oil exploration boreholes or on pilot sites.

CCS Roadmap for Portugal, phase I – CO2 storage and transport options and risks
31
Other properties from the Reservoir Attribute, such as pressure and hydrology, are classified as uncertain, but their influence to the HSE risk is less important, and it is known that detailed data exists about pressure in the oil exploration boreholes, which can be collected in future studies to decrease the uncertainty in those properties.
Noteworthy is also the lack of information about the Faults Attribute in the Attenuation Potential Characteristic. All four properties of the Faults Attribute are considered poorly known. These
Fig. 20 – Average Certainty factor (Ck,n) for every property in the SRF approach.

CCS Roadmap for Portugal, phase I – CO2 storage and transport options and risks
32
faults refer to the near-surface environment and uncertainty stems from the fact that most storage sites are offshore. Uncertainty in the Faults Attribute will be difficult to overcome for those areas.
Paradoxically, it is in the Secondary Containment Characteristic that the lowest average certainty factors per storage site, Ck,n, are found, particularly for two areas in cluster S04 (Fig. 21). That high uncertainty results from the absence of information about the geology overlying the Torres Vedras Formation reservoir. This uncertainty can be overcome by revisiting the borehole logs and the records of the boreholes.
Clusters S06, S07 and S42, those located in the southern part of the country, show the lowest certainty score for the Primary Containment and Secondary Containment, and decisions to use them as CO2 storage sites requires overcoming that uncertainty. Clusters S04 and S05 (the onshore one) have the best certainty factors for the Primary Containment (Fig. 21).
Attributes Assessment
Identifying which properties affect most the HSE risk can be found from the Average Attribute Assessment of the properties Sk,n (Fig. 22), with an attribute factor of -2 being very negative, a factor of 0 being neutral and a factor of +2 being very positive for the HSE quality of the site.
For the Primary Containment, on average for all sites, the property Tectonics strikes has negative. This average negative value results from the -2 assigned to the storage sites located in clusters S06 (Sines) and S07 and S42 (both in the Algarve basin). Seismicity in these areas is the highest in the country, with historic and instrumental records of earthquakes with magnitude above 6 affecting the region. The other clusters are also affected by seismicity, with attribute assessment ranging from 0 (for the Porto Basin) to -1 (for north sector of the Lusitanian basin), but it is in the Sines and Algarve clusters that tectonics plays an important role. Unlike other
Fig. 21 – SRF approach Certainty score (Ck,n) per Characteristic and per storage site.

CCS Roadmap for Portugal, phase I – CO2 storage and transport options and risks
33
properties described below, in which the negative factor results from a conservative approach due to uncertainty in data, tectonics is a well known property.
The Secondary Containment has several properties assessed with negative influence. That results from the expected permeability of the formations overlying the Torres Vedras reservoir and its cap-rock, the Cacém formation. A very conservative approach was assumed when classifying those properties whenever the reservoir occurs at shallower depths, and that approach is reflected in the average attribute assessment. A similar approach was applied when assessing the Attenuation Potential properties, in which there is considerable uncertainty, (e.g. the properties of the Faults Attribute).
The average attribute assessment (Sk,n) for the Primary Containment is higher in clusters S04 and S05, and lower for several sites in cluster S02 (Porto Basin) and in clusters S07 and S42 (the Algarve basin) (Fig. 23). However, it is the Secondary Containment that returns the lowest attribute assessments, with several clusters showing negative average values, most notably cluster S03, some areas in cluster S01 and again the clusters in the Algarve basin. The Attenuation potential tends, on average, to have higher assessments, an effect of most sites being offshore. Not surprisingly the lowest attribute assessment for the Attenuation Potential is obtained for the onshore cluster S05.
Overall Ranking
Fig. 24a shows the standard SRF chart, plotting the Total Average Certainty (Tac) and the Total Average Attribute (Tas), together with the curves representing the boundary for POOR, FAIR and GOOD reservoirs. The distance of each point (i.e., the Tac and Tas for a given storage site n) to the origin of the axis equals the Magnitude of Total Average (Tn). All potential storage sites are plotted and grouped by colour and symbol according to clusters. Appendix B includes individual charts for selected storage areas in each cluster.
None of the potential storage sites qualify as POOR, since the screening process conducted within the projects COMET and KTEJO already discarded those sites with unsuitable safety conditions.
The selected areas in cluster S04 (offshore north Lusitanian basin) and some of the areas in cluster S02 (Porto basin) rank with the highest Tn factors, showing the best conditions for HSE storage. From the eight selected areas in cluster S04, five qualify as GOOD and the other three qualify as FAIR.
The reservoir in clusters S04 and S02, with the exception of those that qualify as FAIR, is the Silves Formation, which occurs very deep and has an excellent cap-rock, hundreds metres thick of marls, clay and evaporites of the Dagorda Formation. This is the main influence for the GOOD qualification. The reservoir of the three sites qualified as FAIR in the S04 cluster is the Torres Vedras Formation, which occurs shallower and has less reliable Secondary Containment properties.
Three of the four potential sites in cluster S05 qualify as FAIR, with the fourth qualifying as GOOD. Cluster S05 presents the highest certainty factor (Tas), which is not surprising since it is the only one located onshore, where the geological conditions are known best. Storage sites in cluster S03 (still in the north sector of the Lusitanian basin, but primarily composed by sites where the reservoir is the shallower Torres Vedras Formation) qualify mostly as FAIR, although two of them plot on the edge between FAIR and GOOD quality.
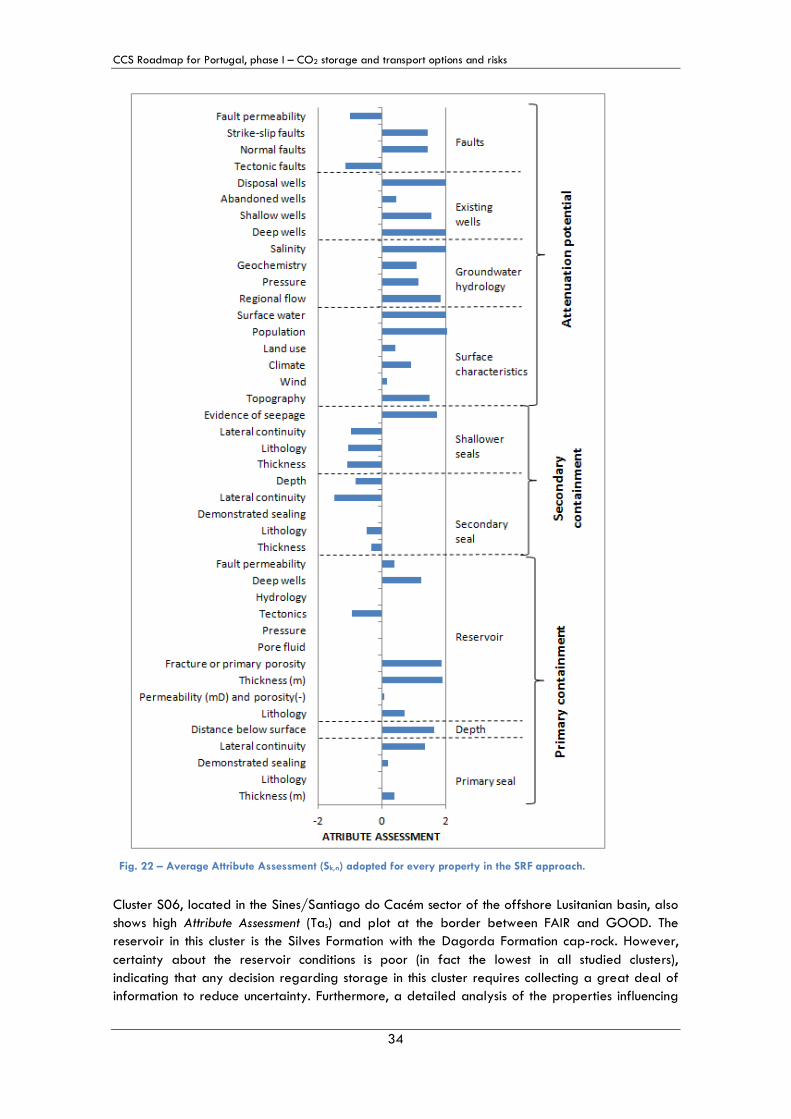
CCS Roadmap for Portugal, phase I – CO2 storage and transport options and risks
34
Cluster S06, located in the Sines/Santiago do Cacém sector of the offshore Lusitanian basin, also shows high Attribute Assessment (Tas) and plot at the border between FAIR and GOOD. The reservoir in this cluster is the Silves Formation with the Dagorda Formation cap-rock. However, certainty about the reservoir conditions is poor (in fact the lowest in all studied clusters), indicating that any decision regarding storage in this cluster requires collecting a great deal of information to reduce uncertainty. Furthermore, a detailed analysis of the properties influencing
Fig. 22 – Average Attribute Assessment (Sk,n) adopted for every property in the SRF approach.

CCS Roadmap for Portugal, phase I – CO2 storage and transport options and risks
35
the qualification of this cluster, reveals some negative ranks, such as tectonics, existence of tectonic faults, and lateral continuity of the secondary seal, all classified with a -2 factor (negative effect on HSE). Since tectonics was assigned a very high weight (the maximum 10), caution is advised when considering storage in this offshore reservoir.
Clusters S06 and S42, in the Algarve basin, return the lowest Magnitude of Total Average (Tn), influenced mostly by the Secondary Containment scores, which may even not exist for some sites in cluster S42, and due to negative influence of the Tectonics property. Nonetheless, those sites still qualify as FAIR.
Averaging the Tn obtained for the selected areas in each cluster (Fig. 24b) indicates the best HSE quality for clusters S02 (Porto basin) and S04 (north Lusitanian basin), both ranking as GOOD, while the clusters at the Algarve basin, S07 and S42, show the lowest average quality, but still qualifying as FAIR. All other clusters plot on or very close to the FAIR/GOOD boundary.
Table 10 – SRF results per cluster, considering the average results for the storage sites in each cluster. The boundary between FAIR and GOOD is given by Tn=3.
Cluster Total Average Certainty (Tac)
Total Average Attribute (Tas)
Magnitude of Total Average (Tn)
S01 1.40 0.10 2.69 S02 1.37 0.44 3.04 S03 1.26 0.26 2.72 S04 1.26 0.62 3.15 S05 1.46 0.06 2.73 S06 1.17 0.50 2.92 S07 1.31 0.07 2.56 S42 1.34 -0.11 2.47
Fig. 23 – SRF approach Attribute Assessment (Sk,n) per Characteristic and per storage site.
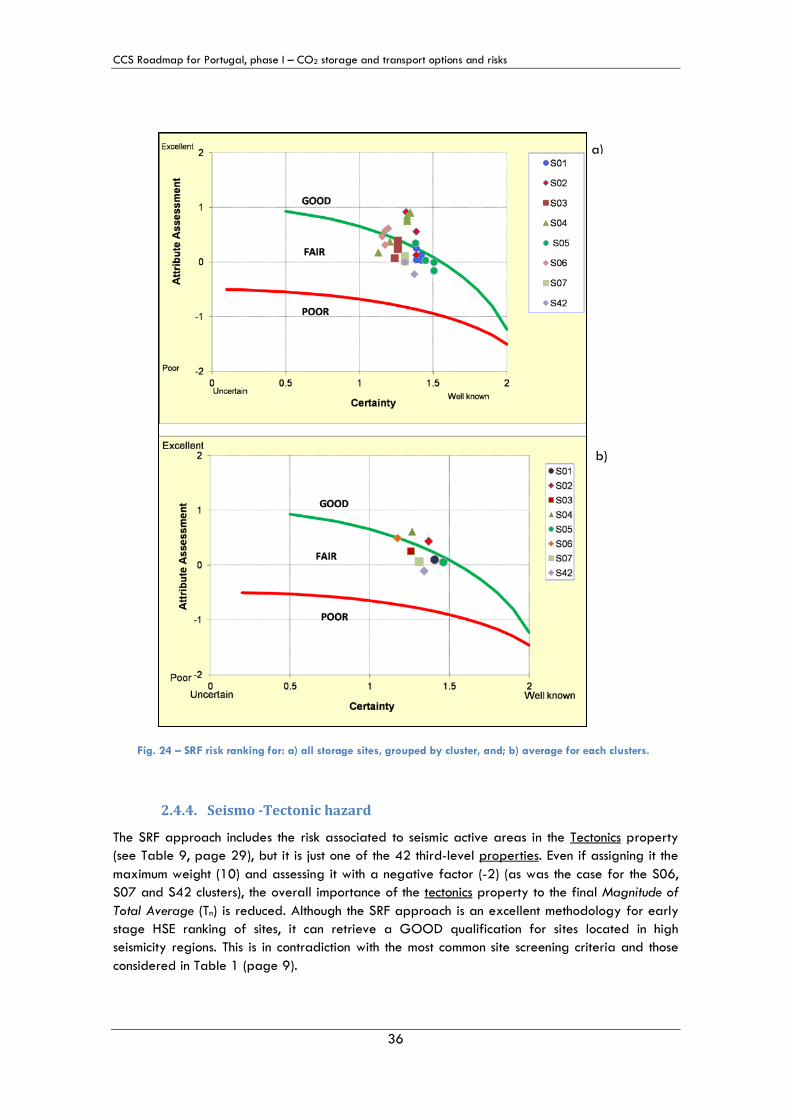
CCS Roadmap for Portugal, phase I – CO2 storage and transport options and risks
36
2.4.4. Seismo -Tectonic hazard
The SRF approach includes the risk associated to seismic active areas in the Tectonics property (see Table 9, page 29), but it is just one of the 42 third-level properties. Even if assigning it the maximum weight (10) and assessing it with a negative factor (-2) (as was the case for the S06, S07 and S42 clusters), the overall importance of the tectonics property to the final Magnitude of Total Average (Tn) is reduced. Although the SRF approach is an excellent methodology for early stage HSE ranking of sites, it can retrieve a GOOD qualification for sites located in high seismicity regions. This is in contradiction with the most common site screening criteria and those considered in Table 1 (page 9).
Fig. 24 – SRF risk ranking for: a) all storage sites, grouped by cluster, and; b) average for each clusters.
a)
b)

CCS Roadmap for Portugal, phase I – CO2 storage and transport options and risks
37
Portugal is not a high seismicity country when compared to other regions of the world or even to other southern Europe countries. Nevertheless it has a record of seismic events, some of which of considerable magnitude. Furthermore, some authors (e.g Gutscher et al., 2012) claim that an active subduction zone exists south from the Algarve. Thus, and despite the results of the SRF approach, it was considered adequate to address in more detail the seismicity in the sedimentary basins of Portugal.
Portugal presents a seismic activity resulting from its proximity to the boundary between the Eurasian and Nubian tectonic plates, in an area stretching from Gibraltar to the archipelago of Azores. The lithosphere fracture contained in that area, although not perfectly delineated, is usually referred to as the Azores-Gibraltar Fracture and is strongly influenced by the interaction between the two tectonic blocks (Fig. 25). The Eurasia–Nubian plate boundary is poorly defined by seismicity between the Gorringe Bank and the Strait of Gibraltar (between 15°W and 6°W), and the convergence of the Nubian and European plates is accommodated through a widespread tectonically active deformation zone (Hayward et al., 1999; Sartori et al., 1994). Two main morphotectonic domains are defined by Tortella et al. (1997)
• The region between the Gorringe Bank and Cape São Vicente to the west: The main topographic structures are the Horseshoe Scarp and the Marquês de Pombal – Pereira de Sousa fault zone and the Gorringe Bank, the most prominent sea-mount. Another relevant
Fig. 25 – Tectonic framework of mainland Portugal, showing the main active faults, including the accretionary wedge south from the Algarve and the main historical and instrumental earthquakes in Portugal and Atlantic margin (see list in Table 11).

CCS Roadmap for Portugal, phase I – CO2 storage and transport options and risks
38
offshore structure is the Portimão Fault that shows seismic activity and can be followed along the Portimão Bank. In land, the E-W striking Loulé Fault may accommodate a significant part of the shortening across the Algarve basin and may have exhibited recent seismic activity (Bezzeghoud et al., 2012; Pro et al., 2013). On the other hand, at the present day the Tagus and the Seine Abyssal Plains are almost aseismic (Zitellini et al., 2009).
• The Gulf of Cadiz, between Cape São Vicente and the Strait of Gibraltar to the east. This domain is characterized by a smoother topography (Tortella et al., 1997). There are two main lines of seismicity one in approximately E-W direction, where the 1964 earthquakes took place, and another one in NE–SW direction with higher seismic activity but of lower magnitude earthquakes along the Guadalquivir Bank.
Seismic record of mainland Portugal
The instrumental seismic record in mainland Portugal reveals a heterogeneous distribution of epicentres, with a higher concentration in the south, SW and adjacent oceanic margin, in the Évora region, and in a strip north from Lisbon, between the Lower Tagus Valley and the coast (Fig. 26a and Table 11). The seismicity is characterized by events of moderate magnitude (M<5) and some ones of higher magnitude (5≤M≤7.8), the latter with particular focus on the South and SW coast.
The Portuguese territory, and in particular the Algarve and south Lusitanian basins, has been affected by large interplate earthquakes with epicentres located in the Atlantic, SW from the Algarve coast, in the region between the Gorringe Bank and the cape São Vicente.
The 1 November 1755 earthquake in Lisbon (M~8.5), which originated a tsunami of up to 15 m high in the Algarve and 6 m high in Lisbon, causing thousands of fatalities in Lisbon, had the epicentre in this region. This earthquake occurred along a passive margin, in a region where plate boundaries are not unequivocally defined by bathymetry and where the existence of an active subduction zone is defended by some (e.g. Gutscher et al., 2012), but not clearly supported by seismological evidence.
Table 11 – Main historical and instrumental seismic events in mainland Portugal and its Atlantic margin (compiled from Bezzeghoud et al. 2012 and Instituto Português do Mar e da Atmosfera, Lisbon, Portugal).
Date Latitude Longitude Depth, km* Magnitude Location 01/01/1344 38.9N 8.8W - 6 Benavente 26/01/1531 38.9N 9.0W - 7.1 Vila Franca de Xira 27/12/1722 37.2N 7.6W - 7.8 Algarve 01/11/1755 37.0N 10.5W - 8.5 SW Cape S. Vicente 31/03/1761 36.0N 10.5W - 7.5 SW Cape S. Vicente 12/04/1777 36.0N 10.0W - 7 SW Cape S. Vicente 11/11/1858 38.2N 9.0W - 7.2 Offshore Setúbal 23/04/1909 38.9N 8.8W 10 6 Benavente 15/03/1964 36.1N 7.8W 12 6.2 SE Cape S. Vicente 28/02/1969 35.9N 10.8W 22 7.5 SW Cape S. Vicente 14/06/1972 36.6N 8.5W 16 5.2 SE Cape S. Vicente 04/06/1987 38.5N 8.0W 9 3.8 Évora district 21/05/1997 42.8N 7.3W 16 5.6 Lugo-Spain 31/07/1998 38.8N 7.9W 5 4 Évora district 30/04/1999 39.7N 9.0W 28 4.5 Tagus valley 29/12/2005 38.9N 8.2W 0* 4.4 Évora district 12/02/2007 35.9N 10.5W 44 5.9 SW Cape S. Vicente 17/12/2009 36.5N 9.9W 31 6 SW Cape S. Vicente
* Depth according to the Instituto Português do Mar e da Atmosfera (Lisbon, Portugal)

CCS Roadmap for Portugal, phase I – CO2 storage and transport options and risks
39
Other important earthquakes were recorded in this region on the 28 February 1969 (Ms=8.1), 21 December 1972 (Ms=5.8), 12 February de 2007 (Mw=6.0) and the recent 17 December 2009 (Mw=6.0) (Table 11). None of them had relevant consequences in mainland Portugal.
In the central and northern sectors of the Lusitanian basin, the largest earthquake recorded occurred in April 1999, with a magnitude of 4.6, and is associated with the Nazaré Fault (Fig. 26a). Despite the low magnitudes recorded in recent years, some of the historical earthquakes with greatest impact in the population had epicentres in this region. Noteworthy are the 1344 and 1531 earthquakes (Sousa et al., 1992), which caused great destruction in Lisbon, the latter being described (Moreira, 1991) with a Maximum Intensity of IX in Benavente, Vila Franca de Xira and Lisbon (Table 11). The April 23, 1909, Benavente earthquake, with a recorded magnitude of 6.0 (Teves-Costa et al., 1999) also occurred in this region. The epicentre was located in the southern sector of the LTV fault. Benavente, where 46 people died and dozens were seriously injured, was the most affected town.
Seismic hazard at the storage clusters
Fig. 26a illustrates the epicentres of instrumental earthquakes from 1961 to 2013, with a minimum magnitude of 3, as well as the location of the sedimentary basins where the potential storage sites are located. There is a nearly absence of epicentres in the Porto basin (where clusters S01 and S02 are located) and in the offshore North sector of the Lusitanian basin (S03 and S04 clusters).
Quite different is the situation for the onshore cluster S05, where some magnitude 4 earthquakes have been recorded, apparently generated in the active Nazaré fault. Similar behaviours are found in the Sines/Santiago do Cacém sector, with earthquakes up to M=5 being detected in the instrumental records. As expected the Algarve basin shows tens of earthquakes with magnitude equal or higher than 3, and at least one with magnitude above 7.
Nevertheless, the seismic hazard is not only a function of the intraplate earthquakes that may occur within the area of influence of the storage clusters, but also of the seismic intensity induced by the large interplate earthquakes originated in the SW of the Algarve.
According to the published maps of seismic intensity (Fig. 26b), in the Algarve basin there is a 5% probability of exceedance (period of 975 years) of seismic intensity above IX (Mercalli modified scale, MM) close to the border with Spain, where cluster S07 is located, up to intensity XII at western Algarve. In the Sines/Santiago de Cacém sector, the 5% exceedance seismic intensities range from IX to X. Given the time scale (thousands of years) for which the CO2 is expected to be stored, those are high expected intensities and caution should be taken when considering CO2 storage in clusters S06, S07 and S42. The expected intensities for the same exceedance probability and period in the north Lusitanian offshore basin (clusters S03 and S04) range from V to VIII, and in the Porto Basin (S01 and S02) from IV to V.
Seismic hazard studies conducted by (Montilla and Casado, 2002) determined for the region of north sectors of the onshore Lusitanian basin, a 5% probability (period of 975 years) of exceedance of intensity IX (Fig. 26b), whereas the probability that the intensity value exceeds VI-VII is 30% for a 100 years period. Numerical modelling of several scenarios of rupture, resorting to a 3-D static model of the crust structure in the SW part of the Iberian Peninsula, and calibrated through comparison between the synthetic and observed intensities (Grandin et al., 2007a, b), indicate that, for an earthquake equivalent to the 1755 earthquake with epicentre at the Gorringe Bank, the maximum expected seismic wave velocity in the storage sites of cluster S05 ranges from 0.01 m/s to 0.27 m/s, which is not very significant (Fig. 26c).

CCS Roadmap for Portugal, phase I – CO2 storage and transport options and risks
40
Fig. 26 – a) Location with instrumental earthquakes with M≥3 in Portugal and Atlantic; b) Seismic hazard in Portugal – 5% exceedance probability in 975 years (adapted from Montilla and Casado, 2002); c) Maximum seismic velocities in the cluster S05 area in finite difference simulation of an earthquake equivalent to the 1755 earthquake with epicentre at the Gorringe Bank. Also shown the selected storage basins.
a)
b) c)

CCS Roadmap for Portugal, phase I – CO2 storage and transport options and risks
41
Finally, according to the seismic zones adopted for Portugal in the Eurocode 8 and translated into the Portuguese standard NP EN1998-1 (Instituto Português da Qualidade, 2000), regulating the design of buildings and infrastructures in seismic areas, the region of cluster S05 is included in:
• Zone 1.5, for type 1 seismic event (i.e. a distant, interplate earthquake), with a base acceleration value (ag) in rocks of 0.6 m/s2. Zone 1.5 is the second lowest occurring in the national territory, with the highest seismicity zone 1.1 located in the eastern tip of Algarve;
• Zone 2.4, for type 2 seismic event (i.e. a near, intraplate earthquake), with a base acceleration value (ag) in rocks of 1.1 m/s2. The type 2 events includes 5 zones, from 2.1 to 2.5 (highest to lowest seismicity), but the two highest levels (2.1 and 2.2) occur only in the Azores.
According to the Eurocode 8, the seismic zones with a base acceleration value ag lower than 0.1g (that is lower than 0.98 m/s2) are considered low seismicity zones. That is the case for the S05 cluster, in what regards type 1 seismic events (stronger magnitude), while for the lower magnitude, but near epicentre, type 2 seismic events, it is slightly above the classification as a low seismicity zone. Therefore, although the S05 cluster is not without seismic risks, they are probably within an acceptable limit for a country with the tectonic framework of Portugal. Nevertheless, further studies are required in terms of the induced seismicity and the effects that injection pressures may have on active structures close to the limits of the injection sites, such as the Nazaré fault.

CCS Roadmap for Portugal, phase I – CO2 storage and transport options and risks
42
2.5. OPTIONS FOR CO2 STORAGE IN PORTUGAL The evaluation of costs and risks for each potential storage site makes it possible to analyse different scenarios of storage in Portugal. Table 12 and Fig. 27 summarises the costs and SRF risk ranging, averaged over each cluster. Although the storage clusters S05 (onshore Lusitanian) and S42 (Algarve) are by far the most economical, they are also among the least qualified in terms of HSE ranking. Furthermore, the choice of storage sites depends also on the optimization of the whole transport and storage network.
Table 12 – Risk ranking (higher Tn indicates increased security) and storage costs per cluster.
Cluster Setting Magnitude of Total Average (Tn)
Total storage costs (€/ton)
S01 Porto Basin, offshore 2.7 13.6 S02 Porto Basin, offshore 3.0 24.5 S03 Lusitanian basin, north sector, offshore 2.7 12.6 S04 Lusitanian basin, north sector, offshore 3.2 17.3
S05 Lusitanian basin, north and central sectors, onshore 2.7 3.8
S06 Lusitanian basin, Sines/Santiago do Cacém, offshore 2.9 47.4
S07 Algarve basin, offshore 2.6 12.2 S42 Algarve basin, offshore 2.5 10.4
2.5.1. Methodology – Regions of influence of clusters
CO2 storage costs are dependent on site conditions, including variables such as depth of reservoir, injection rate, and onshore/offshore location. Transport costs also depend on geographical conditions, such as topography, crossing of water bodies, etc. These cost dependencies imply that proximity between CO2 source and injection site are not necessarily an indicator of cost-effectiveness or a good criteria for source-sink match. Integration of those two costs components enables to find those regions in which a given storage site is more cost-effective than any other alternative site. This methodology, here designated as CCS Regions, is used together with the results of the SRF risk ranking to study different options for CO2 storage in Portugal.
Fig. 27 – Graphic representation of risk ranking and storage costs per cluster.

CCS Roadmap for Portugal, phase I – CO2 storage and transport options and risks
43
As a first step, the methodology implements, in an ARCGIS tool, a linear cost model for pipeline construction considering local conditions that affect the pipeline cost, such as land-use, ground slope, crossings of infrastructures or other criteria thought adequate for a particular region (see section 3.3.1 for further details on the pipeline cost model). These local criteria are included as terrain factors that represent multiplying factors for the basic cost of building a pipeline. Multi-criteria Analysis with those terrain factors, results in cost surface maps representing the cost of a standardized diameter pipeline in any cell of the GIS model.
For each CO2 storage cluster, investment and OMM costs detailed in section 2.3.3 were assigned to the potential injection location in the ARCGIS model, and the resulting map is combined through map algebra with the transport cost surface. The integrated cost surface represents the localised (at cell level) cost of transport and storage.
The cluster region of influence is defined by finding, for each cell in the GIS, the lowest cumulative transport and storage cost and allocating to a given CCS region all the cells that lead to the same storage cluster.
This concept of CCS Region has multiples usages, namely for:
• Prioritising areas for further investments on storage site characterisation; • Conducting source-sink matching in large regions based on cost-effectiveness; • Simplification of CCS chain optimization analysis and processing requirements by
removing elements that are proved uneconomical; • Assisting in planning and optimizing integrated transport networks between multiple
sources and sinks; • Planning the location of future facilities where CO2 capture is considered, in order to
minimise the transport and storage costs; • Visualization of the transport and storage cost impact for any given facility.
This methodology does not aim at optimising the entire transport and storage infrastructure, but instead to define the region in which point-to-point (source-to-sink) direct connections are cost effective for a particular storage cluster.
2.5.2. Base case - all clusters considered
The base case considers the possibility to store CO2 at any cluster, and therefore it is a cost optimisation strategy since choices are made based on cost alone.
Fig. 28a indicates, the lowest cumulative transport and storage costs, normalised for 1Mton CO2, that can be achieved at any location in Portugal. Not surprisingly, the transport and storage costs increase with distance from cluster S05 and reach maximum values at NE and SE Portugal, the most costly places to implement new facilities with CO2 capture.
As expected, cluster S05, with the lowest storage costs, dominates the storage options in Portugal. Fig. 28b illustrates the region of influence of cluster S05, which extends through most of the country, including even parts of north and west Spain. All main CO2 sources (orange circles in Fig. 28b) in Portugal are included in the S05 region of influence, and as long as the volume of CO2 is not above the annual injection rate at S05, CO2 captured at those sources should be stored in this cluster. Only in the Algarve an offshore CCS region develops, centred on cluster S42 that is costs competitive for transport and storage of CO2 from sources located in the Algarve.

CCS Roadmap for Portugal, phase I – CO2 storage and transport options and risks
44
This result is fully in agreement with the results obtained in the COMET project for Portugal, Spain and Morocco.
2.5.3. Offshore storage only
An option considered in some European countries is to restrict CO2 storage to offshore sites, either to decrease risks and/or to increase public acceptance of the CCS technology. Given the results of the SRF risk ranking, with the onshore cluster S05 not being amongst the safer sites, this could also be an interesting scenario for Portugal.
Fig. 29 illustrates the CCS regions in that scenario, i.e., eliminating S05 as an option. The cumulative costs for transport and storage of 1 Mt define three regions of influence:
1. Cluster S01 is the most economic option to store CO2 from sources located in the northernmost part of the country, namely in the Viana do Castelo district, although the sources located around Porto could also store CO2 in cluster S01 at a very similar cost to storage in cluster S03;
2. Cluster S03, in the north Lusitanian basin, is the best option for storing CO2 from sources located around Porto and in the central part of the country, including Lisbon. It contains the majority of the CO2 sources in Portugal within its area of influence;
3. Cluster S42 is cost-effective for storage of CO2 from sources in Setúbal, Sines and Algarve, including several of the main CO2 sources in the country.
Fig. 28 – a) Integrated cost distance map for transport and storage of 1Mt CO2; b) CCS Regions considering all clusters. Black dots refer to the hypothetic injection site of a given cluster, and grey lines define the limits of CCS regions. Orange dots are the main stationary sources in Portugal. Only two storage clusters would be active, S05 and S42. The region of influence of clusters S01 and S07 do not reach the onshore, and all other clusters are not cost effective even for sources located nearby.
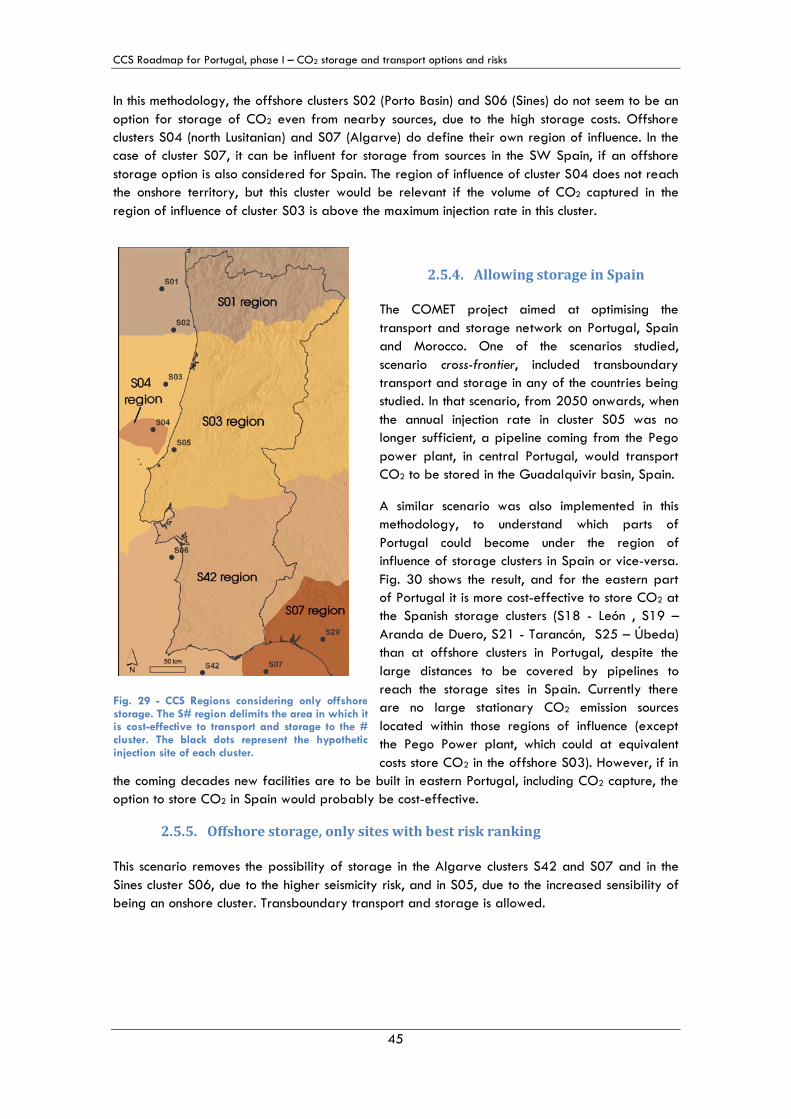
CCS Roadmap for Portugal, phase I – CO2 storage and transport options and risks
45
In this methodology, the offshore clusters S02 (Porto Basin) and S06 (Sines) do not seem to be an option for storage of CO2 even from nearby sources, due to the high storage costs. Offshore clusters S04 (north Lusitanian) and S07 (Algarve) do define their own region of influence. In the case of cluster S07, it can be influent for storage from sources in the SW Spain, if an offshore storage option is also considered for Spain. The region of influence of cluster S04 does not reach the onshore territory, but this cluster would be relevant if the volume of CO2 captured in the region of influence of cluster S03 is above the maximum injection rate in this cluster.
2.5.4. Allowing storage in Spain
The COMET project aimed at optimising the transport and storage network on Portugal, Spain and Morocco. One of the scenarios studied, scenario cross-frontier, included transboundary transport and storage in any of the countries being studied. In that scenario, from 2050 onwards, when the annual injection rate in cluster S05 was no longer sufficient, a pipeline coming from the Pego power plant, in central Portugal, would transport CO2 to be stored in the Guadalquivir basin, Spain.
A similar scenario was also implemented in this methodology, to understand which parts of Portugal could become under the region of influence of storage clusters in Spain or vice-versa. Fig. 30 shows the result, and for the eastern part of Portugal it is more cost-effective to store CO2 at the Spanish storage clusters (S18 - León , S19 – Aranda de Duero, S21 - Tarancón, S25 – Úbeda) than at offshore clusters in Portugal, despite the large distances to be covered by pipelines to reach the storage sites in Spain. Currently there are no large stationary CO2 emission sources located within those regions of influence (except the Pego Power plant, which could at equivalent costs store CO2 in the offshore S03). However, if in
the coming decades new facilities are to be built in eastern Portugal, including CO2 capture, the option to store CO2 in Spain would probably be cost-effective.
2.5.5. Offshore storage, only sites with best risk ranking
This scenario removes the possibility of storage in the Algarve clusters S42 and S07 and in the Sines cluster S06, due to the higher seismicity risk, and in S05, due to the increased sensibility of being an onshore cluster. Transboundary transport and storage is allowed.
Fig. 29 - CCS Regions considering only offshore storage. The S# region delimits the area in which it is cost-effective to transport and storage to the # cluster. The black dots represent the hypothetic injection site of each cluster.

CCS Roadmap for Portugal, phase I – CO2 storage and transport options and risks
46
The same results as for the previous scenario are retrieved for the sources in northern and central parts of the country, for which the cost-effective transport and storage is to clusters S01 and S03 respectively (Fig. 31). However, the region of influence of cluster S25 in the Spanish Guadalquivir basin encompasses the entire south Portugal, becoming the cost-effective option for storage of CO2 from the large stationary sources around the cities of Setúbal and Sines.
Fig. 30 - CCS Regions allowing storage in Spain. The S# region delimits the area in which it is cost-effective to transport and storage to the # cluster. The black dots represent the hypothetic injection site of each cluster.
Fig. 31 - CCS Regions for offshore storage, removing the higher risk clusters in the Algarve and Sines, and allowing storage in Spain. The S# region delimits the area in which it is cost-effective to transport and storage to the # cluster. The black dots represent the hypothetic injection site of each cluster.

CCS Roadmap for Portugal, phase I – CO2 storage and transport options and risks
47
2.6. Summary of CO2 storage options and risks
The effective storage capacity in deep saline aquifers is estimated at 7.56Gt CO2, enough to hold around 200 years of current CO2 emissions from stationary sources in Portugal. However, the vast majority of the storage capacity is in offshore storage sites, with the onshore capacity being assessed in just in 330 Mt CO2. The offshore sites are located in the shallow continental shelf, at very short distance from the coast, which is a favourable location with respect to the main sources in the country, which are mostly along coastal regions.
The storage sites in Portugal are grouped in eight clusters, one cluster onshore (S05) in the district of Leiria, two clusters in the Porto Basin (S01 and S02), two in the North Lusitanian basin (S03 and S04), one offshore from Sines (S06) and two in the Algarve basin (S07 and S42). Thirty-six preferential storage areas were identified in those clusters, and further studies should focus on those selected areas.
The SRF methodology, to estimate the HSE quality and rank the selected areas and clusters, indicates that storage sites in the Porto and North Lusitanian basin present the best qualification to ensure safe and permanent storage of CO2, while the storage sites in the Algarve basin present the least favourable conditions, but still with FAIR quality. The onshore cluster S05 performs worst than the offshore sites in the natural attenuation potential of CO2 leaks. This cluster is within a zone qualified by the Eurocode 8 as with low seismicity for interplate earthquakes and as intermediate seismicity for intraplate earthquakes. Since active faults occur not very distant from the limits of cluster, careful analysis of the induced seismicity impact should be conducted.
The clusters Sines (S06) and in the Algarve (S07, S42) are within the highest seismic hazard regions of the country, and probably should not be considered for CO2 storage. This implies a 1.3 Gt reduction in effective storage capacity, but the remaining 5.3 Gt is enough for the country needs.
Storage costs in the onshore cluster S05 are estimated at 3.8 €/t. Offshore storage costs range from minimum values of 10.4 €/t in the shallower and more permeable reservoirs in the Algarve S42 cluster, to maximum values of 47.4 €/t in the Sines cluster S06. Maximum injection rates are found in the Porto and Algarve basin, allowing to inject around 16 Mt/a, while in the Sines sector the expected injection rate is less than 2 Mt/a. In the onshore cluster S05 the injection rate is estimated in 8.4 Mt/a.
The onshore cluster S05 is, by far, the cost-effective option for storing CO2. In scenarios of offshore only storage (or If the storage capacity or injection rate in that cluster is not sufficient), the cost-effective alternative is the offshore cluster S03, in the north Lusitanian basin, and S01, in the Porto basin (if clusters S07 and S42 in the Algarve are discarded based on risk ranking), but it is possible that storage in Spain (in the Guadalquivir basin) is a good option for sources in southern Portugal.
All reservoirs tend to be very faulted, but there is no information about the hydraulic behaviour of those faults. The SRF methodology indicates as main concerns the lack of data about the permeability of the reservoirs, about the hydraulic behaviour of faults crossing the reservoir and secondary containment, and the tectonic/seismicity conditions of some of the clusters. These uncertainties can only be overcome by conducting hydraulic tests, monitoring the passive seismic and studying the induced seismicity effects. Clusters S01, S03, S04 and S05 are the most competitive in terms of costs and less risk, and where efforts of characterization should focus in future works.

CCS Roadmap for Portugal, phase I – CO2 storage and transport options and risks
48
Table 13 - Summary of CO2 storage prospects per cluster
Cluster Setting Storage capacity and costs Prospects
S01 Porto Basin, offshore
Capacity: 1230Mt
Costs: 13.6 €/t
Cost-effective for storage of CO2 from sources in northern Portugal in “offshore only” scenarios. However, the number of large sources in that region is small and restricted to the area around Porto. With respect to risks, a fair quality reservoir, with efforts required to characterize the primary and secondary seals. Low seismic risk zone.
S02 Porto Basin, offshore
Capacity: 870 Mt
Costs: 24.5 €/t
Too expensive to be cost effective in any scenario, mainly due to the large depth and low reservoir permeability. With respect to risks a good quality reservoir, mainly due to cap-rock quality. The number of nearby large sources is small and restricted to the area around Porto. Efforts required to characterize the petrophysic properties of the reservoir and faults that compartmentalize it.
S03
Lusitanian basin, north sector, offshore
Capacity: 2200Mt
Costs: 12.6 €/t
Cost-effective option for CO2 storage in “offshore only” scenarios or in scenarios where the onshore capacity or injection rate have been reached. Located just offshore from the onshore cluster S05, and thus easy to connect to transport networks that may lead to that cluster. Low seismic risk, but efforts required to better characterize the secondary seals where it exists. The hydraulic behaviour of faults and the petrophysic properties of the reservoir require characterization through in situ hydraulic tests.
S04
Lusitanian basin, north sector, offshore
Capacity: 1560Mt
Costs: 17.3 €/t
Located immediately south from cluster S03, but tapping deeper, lower permeability reservoirs. The quality of the primary and secondary containment provides added security to the cluster, when compared to cluster S03, but the large depth is reflected in the storage costs. Nevertheless, it can be cost-effective in scenarios of “offshore only” storage and if a safer alternative to S03 is required. Large uncertainty about the petrophysic properties of the reservoir.
S05
Lusitanian basin, north and central sectors, onshore
Capacity: 340 Mt
Costs: 3.8 €/t
The only onshore storage cluster. It is the cost-effective option for storing CO2 from sources in most of the country (except from the Algarve), up to an injection rate estimated at 10Mt/a. Low to intermediate seismic risk.
S06
Lusitanian basin, Sines sectors, offshore
Capacity: 80 Mt
Costs: 47.4 €/t
Located just offshore from the main source cluster in Portugal, the Sines industrial area. Existing data indicates low permeability, deep reservoirs, resulting in storage too expensive to be cost-effective in any scenario, even for the nearby sources from Sines. Storage capacity also low for large-scale use. High seismic risk and large uncertainties about the petrophysic properties of the reservoir.
S07 Algarve basin, offshore
Capacity: 410 Mt
Costs: 12.2 €/t
Not cost-competitive when compared to alternative cluster S42 in the Algarve or even to storage sites in the south of Spain, due to the larger depth and less favourable reservoir quality. However, primary and secondary containment are expected to be good quality. Water column depth is up to 600 m. High seismic risk.
S42 Algarve basin, offshore
Capacity: 840 Mt
Costs: 10.4 €/t
Reservoir with good petrophysic properties, but doubts about continuity of the primary and secondary containment. Due to the smaller depth and high injection rate it is the cost-effective option for storage of CO2 from sources in Algarve. However, currently there is only one large source, a cement factory running since 1973.

CCS Roadmap for Portugal, phase I – CO2 storage and transport options and risks
49
3. OPTIONS AND RISKS FOR CO2 TRANSPORT
3.1. FUNDAMENTALS ABOUT CO2 TRANSPORT The process of transporting the captured CO2 depends on the location of emission sources and capture and storage sites; basically the following options may be considered:
• Land transport - "onshore" • Maritime transport - "offshore"
The land transport option is for an onshore pipeline, while the maritime transport option can be either by offshore pipelines or by ship.
The choice of these options is dictated by technical and economic factors - cost and risk. To ensure the best techno-economic conditions in the option by pipeline, that is, to obtain appropriate flow conditions and minimize the size (diameter) of the pipe CO2 must be transported in a dense phase (49Fig. 32).
The basic parameters to be considered for the design of onshore pipelines for CO2 transport would be:
• MAOP - maximum allowable operating pressure = 110 bar, • MOP - Maximum operating pressure = 100 bar ["design pressure"], • T - design temperature = 35°C [temperature at capture], • H2O content <50 ppm, • Pressure class (valves and fittings) - 100 bar (# 600), • Pipeline material - carbon steel, API 5L[X70 for DN 1000 (NPS 40 ") <nominal
diameters> DN 300 (12")]. There are no Portuguese regulations for the design, construction and operation/maintenance of CO2 piping networks; however, various codes and standards may be considered, namely:
Fig. 32 - CO2 Temperature – Pressure Diagram. Adapted from DNV (2010b).

CCS Roadmap for Portugal, phase I – CO2 storage and transport options and risks
50
• ISO 13623 – Petroleum and Natural Gas industries – Pipeline transportation Systems (ISO, 2000)
• from USA: ASME B31.4 - Pipelines transporting liquid hydrocarbons (ASME, 2002), • from Europe: DNV-OS-F101(DNV, 2012), DNV-RP-J202 (DNV, 2010b) or EN 14161
(EN, 2011).
Categorization
According to ISO (2000) and DNV (2012) CO2 is a Category C fluid [Non-flammable fluids which are non-toxic gases at ambient temperature and atmospheric pressure conditions].
The fundamental physical properties of pure CO2 are listed in Table 14.
Table 14 – CO2 Properties. Adapted from DNV (2010b). Property Unit Value
Molecular Weight g/mol 44.01 Critical Pressure bar 73.8 Critical Temperature ºC 31.1 Triple point pressure bar 5.18 Triple point temperature ºC -56.6 Aqueous solubility at 25°C, 1 bar g/L 1.45 Gas density at 0°C, 1 bar kg/m3 1.98 Density at critical point kg/m3 467 Liquid density at 0°C, 70 bar kg/m3 995 Sublimation temp, 1 bar ºC -79 Latent heat of vaporization (1 bar at sublimation temperature) kJ/kg 571 Solid density at freezing point kg/m3 1562 Colour - None
Some important facts on CO2 shall be taken into consideration, when designing an onshore pipeline, namely:
• In combination with free water, CO2 is corrosive for steel pipeline, • At normal atmospheric pressure and temperature, the stable carbon dioxide phase is
vapour, • CO2 has a molecular weight approximately 50% higher than air, i.e. at ambient
condition the density of (gaseous) CO2 will be higher than air, which has implications on how CO2 disperses when released to the ambient,
• At the right combination of pressure and temperature CO2 may turn into the solid state commonly known as dry ice.
CO2 composition – basis for design
A CO2 pressure-enthalpy diagram provides insight to the phase changes, and is the most frequently used diagram for design purposes.
The effect of temperature and pressure on mass density should be considered in optimizing the pipeline transportation capacity, i.e. the pipe dimension (nominal diameter). Fig. 33 shows the mass density of pure CO2 as function of pipeline operating temperature and pressure.

CCS Roadmap for Portugal, phase I – CO2 storage and transport options and risks
51
It should be noted that various types of other chemical components in the CO2 stream may to various degree affect the mass density.
Supercritical CO2 is a highly volatile fluid that will rapidly evaporate when depressurized to ambient conditions.
Implication of CO2 composition on pipeline design and operation
Captured CO2 streams physical properties, defined by its individual chemical components, may vary from the physical properties of pure CO2 and will have implications on both pipeline design and operation.
The composition of the CO2 stream will depend on the source and technology for capturing the CO2.
In the context of CCS, the CO2 may come from large scale combustion of fossil fuels, typically gas, oil or coal fired power plants but also from industrial processes.
The different techniques for capturing the CO2 from combustion power plants are commonly characterized as pre-combustion, post-combustion or oxy-fuel processes. Further, CO2 may be captured from a range of industrial processes (e.g. steel manufacturing, cement manufacturing refineries and chemical industries).
These processes may generate different types and amounts of chemical components in the CO2 flow, such as CH4, H2O, H2S, SOx, NOx, N2, O2, Glycol and others
Table 15 gives a not exhaustive list, for CO2 streams associated with types of power plants/ capture technologies.
Industrial capture plant compositions will differ from these, e.g. steel manufacturing, cement manufacturing, etc.. Typical effects of selected chemical components on the phase envelope are shown in Fig.34.
Fig. 33 – Mass density of pure CO2. Adapted from DNV (2010b).
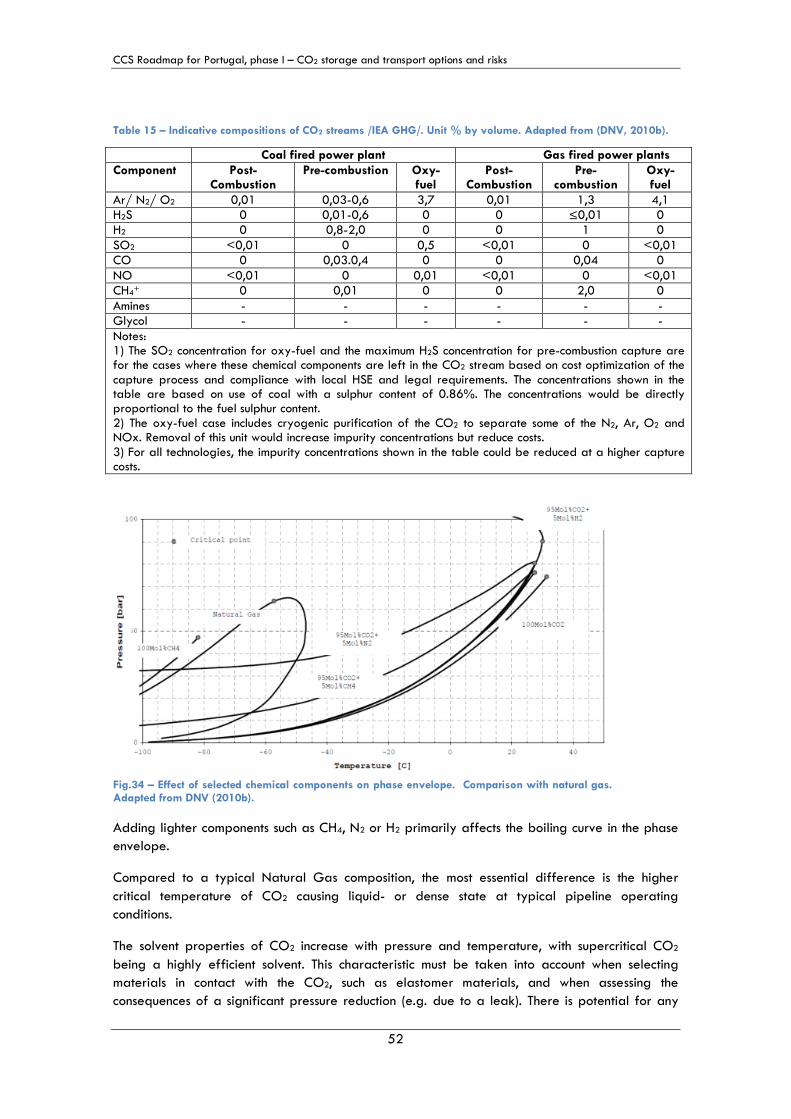
CCS Roadmap for Portugal, phase I – CO2 storage and transport options and risks
52
Table 15 – Indicative compositions of CO2 streams /IEA GHG/. Unit % by volume. Adapted from (DNV, 2010b).
Adding lighter components such as CH4, N2 or H2 primarily affects the boiling curve in the phase envelope.
Compared to a typical Natural Gas composition, the most essential difference is the higher critical temperature of CO2 causing liquid- or dense state at typical pipeline operating conditions.
The solvent properties of CO2 increase with pressure and temperature, with supercritical CO2 being a highly efficient solvent. This characteristic must be taken into account when selecting materials in contact with the CO2, such as elastomer materials, and when assessing the consequences of a significant pressure reduction (e.g. due to a leak). There is potential for any
Coal fired power plant Gas fired power plants Component Post-
Combustion Pre-combustion Oxy-
fuel Post-
Combustion Pre-
combustion Oxy-fuel
Ar/ N2/ O2 0,01 0,03-0,6 3,7 0,01 1,3 4,1 H2S 0 0,01-0,6 0 0 ≤0,01 0 H2 0 0,8-2,0 0 0 1 0 SO2 <0,01 0 0,5 <0,01 0 <0,01 CO 0 0,03.0,4 0 0 0,04 0 NO <0,01 0 0,01 <0,01 0 <0,01 CH4+ 0 0,01 0 0 2,0 0 Amines - - - - - - Glycol - - - - - - Notes: 1) The SO2 concentration for oxy-fuel and the maximum H2S concentration for pre-combustion capture are for the cases where these chemical components are left in the CO2 stream based on cost optimization of the capture process and compliance with local HSE and legal requirements. The concentrations shown in the table are based on use of coal with a sulphur content of 0.86%. The concentrations would be directly proportional to the fuel sulphur content. 2) The oxy-fuel case includes cryogenic purification of the CO2 to separate some of the N2, Ar, O2 and NOx. Removal of this unit would increase impurity concentrations but reduce costs. 3) For all technologies, the impurity concentrations shown in the table could be reduced at a higher capture costs.
Fig.34 – Effect of selected chemical components on phase envelope. Comparison with natural gas. Adapted from DNV (2010b).

CCS Roadmap for Portugal, phase I – CO2 storage and transport options and risks
53
substance that is in solution within a high pressure CO2 pipeline inventory to be precipitated out at the point of pressure drop due to the decrease in solubility of the CO2. The precipitation of any hazardous substance held in solution could then result in harmful human exposure or environmental damage at or near the point of release.
In the vapour state the ability of CO2 to dissolve water increase with increased temperature and reduced pressure as for natural gas. With transition from vapour to liquid state there is a step change in solubility and the solubility increase with increasing pressure which is the opposite effect of what occurs in the vapour state (Fig. 35).
The ability of the CO2 stream to dissolve water may be significantly affected by the fraction of different chemical components, hence this needs consideration.
Design
Basic engineering design
The CO2 transport option would go through a basic engineering design basis, which should include the characteristic physical, environmental and social factors. This includes a system definition for the preliminary route and design aspects for cost-estimating and concept-definition purposes. It is also necessary to consider the process data defining the physical characteristics of product mixture transported, the optimal sizing and pressures for the pipeline, and the mechanical design, such as operating, valves, pumps, compressors, seals, etc.
The topography of the pipeline right-of-way must be examined. Topography may include mountains, river and stream crossings, and for offshore pipelines, the differing challenges of very deep or shallow water, and uneven seabed.
It is also important to include geotechnical considerations. For example, is this pipeline to be constructed on thin soil overlaying granite?
The local environmental data need to be included, as well as the annual variation in temperature during operation and during construction, potentially unstable slopes and seismic activity. Also included are water depth, sea currents, biological growth, aquifers, and other environmental considerations such as protected habitats.
Fig. 35 – Solubility of water in pure CO2. Adapted from DNV (2010b).

CCS Roadmap for Portugal, phase I – CO2 storage and transport options and risks
54
Also how the pipeline will accommodate existing and future infrastructure – road, rail, pipeline crossings and the possible impact of other activities – as well as shipping lanes, rural or urban settings, fishing restrictions, and conflicting uses such as dredging.
Construction of onshore pipelines
Construction planning can begin either before or after rights before a legal right to construct a pipeline is secured and all governmental regulations met. Onshore and underwater CO2 pipelines are constructed in the same way as hydrocarbon pipelines, and for both there is an established and well understood base of engineering experience.
Operations
Operational aspects of pipelines are divided into three areas: daily operations, maintenance, and health, safety and environment.
Overall operational considerations include training, inspections, safety integration, signs and pipeline markers, public education, damage prevention programmes, communication, facility security and leak detection.
Personnel form a central part of operations and must be qualified. Personnel are required to be continuously trained and updated on safety procedures, including safety procedures that apply to contractors working on or near the pipeline, as well as to the public.
Operations include daily maintenance, scheduled planning and policies for inspecting, maintaining and repairing all equipment on the line and the pipeline itself, as well as supporting the line and pipeline. This equipment and support includes valves, compressors, pumps, tanks, rights of way, public signs and line markers as well as periodic pipeline flyovers.
Long-distance pipelines are instrumented at intervals so that the flow can be monitored. The monitoring points, compressor stations and block valves are tied back to a central operations centre. Computers control much of the operation, and manual intervention is necessary only in unusual upsets or emergency conditions. The system has inbuilt redundancies to prevent loss of operational capability if a component fails.
Pipelines are cleaned and inspected by ‘pigs’, piston-like devices driven along the line by the gas pressure. Pigs have reached a high level of sophistication, and can measure internal corrosion, mechanical deformation, external corrosion, the precise position of the line, and the development of spans in underwater lines. Further functionality will develop as pig technology evolves, and there is no reason why pigs used for hydrocarbon pipelines should not be used for carbon dioxide.
Pipelines are also monitored externally. Land pipelines are inspected from the air, at intervals agreed between the operator and the regulatory authorities. Inspection from the air detects unauthorized excavation or construction before damage occurs. Currently, underwater pipelines are monitored by remotely operated vehicles, small unmanned submersibles that move along the line and make video records, and in the future, by autonomous underwater vehicles that do not need to be connected to a mother ship by a cable. Some pipelines have independent leak detection systems that find leaks acoustically or by measuring chemical releases, or by picking up pressure changes or small changes in mass balance. This technology is available and routine.

CCS Roadmap for Portugal, phase I – CO2 storage and transport options and risks
55
3.2. PIPELINE NETWORK The methodology to select viable CO2 transport routes was implemented in the COMET FP7 project and a detailed description can be found in van den Broek et al. (2013b). The approach aimed at finding the least cost pipeline routes between clusters of sources and clusters of storage sites, and it depended on building an accurate, local-scale, description of the geographical, environmental, land use and man-made constraints that affect the cost of building a pipeline in any given location. Those factors affect the basic cost of the pipeline in a positive or negative way, and the least-cost pipeline route between any two points is then found by minimizing a cost function.
The factors influencing pipeline cost variation were implemented in a 300 m resolution model and included i) land use; ii) terrain slope; iii) crossing of existing infrastructures and, iv) the availability of corridors where natural gas or oil pipelines already exist. The model was implemented so as to decrease the probability of crossing urban areas and environmental protected areas.
3.2.1. Selected corridors
The viable pipeline connections between source and sinks develop mainly along the coastal region, where the main CO2 sources are located (Fig. 36). Notice that some of the corridors represent alternative connections between the same locations.
The main cost-effective option to store CO2 is the onshore sink (S05) and the pipeline routes converges to that cluster. The network runs along the coast from Sines to cluster S05 in the onshore Lusitanian basin, and from the northern sources in Porto to the same cluster, albeit with smaller flow rates. Although the majority of the network develops onshore, in some COMET scenarios offshore pipelines may be required to connect to the offshore cluster S42 in the Algarve basin. Once the storage capacity in S05 becomes exhausted the alternative storage is the offshore S03 cluster, in the north Lusitanian basin, with a short offshore pipeline connecting to the injection sites in S03.
Table 16 lists the main features of the cost-effective pipeline corridors.
Fig. 36 – All viable transport corridors according to the COMET scenarios. Some of the corridors represent alternative connections between the same locations.

CCS Roadmap for Portugal, phase I – CO2 storage and transport options and risks
56
Table 16 – List of viable pipeline corridors and characteristics. Some of the corridors represent alternative connections between the same locations.
3.3. TRANSPORT COSTS
3.3.1. Transport costs components
A detailed account of the procedures used to estimate the CO2 pipeline transport networks is given in Technical Note TN6.4 of the COMET project (van den Broek et al., 2013a). This section provides a brief description of the transport costs components considered.
The following components were considered to estimate the CO2 transport costs via a pipeline network:
• Pipeline investment costs (IP); • Booster stations investment costs (IB); • Energy costs at the booster stations (EB); • Operation and Maintenance costs (OM) - assumed to be 3% of the pipeline and
booster stations investment costs.
Total transport costs are given by:
( )P BI +Ic f BT A OM E= ⋅ + + (3)
where Af is the annuity factor, considering a pipeline lifetime of 40 years and a discount rate of 7%.
Pipeline investment costs - IP
A linear modelling approach was implemented in which a GIS (Geographic Information System) model using geospatial data was used to account for geographic cost deviations (van den Broek et al., 2013b). A cost factor grid was constructed, which specifies the absolute or relative cost variation for every cell from the standard construction cost. The factor representing the relative cost variation imposed by each of those variables is designated as terrain factor. The formula used to calculate the pipeline investment costs is the sum of the pipeline investment costs in each GIS cell is as follows:
( ){ }1 0.1 0.1c c s lu cP iI B D F F F N N F L⋅ ⋅ − += ⋅ ⋅ ⋅ ⋅ ⋅∑ (4)
Pipeline Origin End Length (km)
Booster stations Investment costs (M€/m diameter) Quantity Distance
(km) PD_C69-C68 Setubal Lisbon 70.8 1 70.8 112.5 PD_C71-C69 Sines Setubal 74.4 1 74.4 181.7 PD_C71-S42 Sines Algarve 1 153.8 1 76.9 321.2 PD_C73-C70 Porto Leiria 107.6 1 107.6 162.0 PD_C73-S03 Leiria Viana do C. 64.0 0 64.0 188.6 PD_C73-S05 Nazaré Lusitanian Onshore 10.5 0 82.9 15.0 PD_C74-C73 Leiria Nazaré 72.4 1 72.4 103.0 PD_C74-S05 Nazaré Lusitanian Onshore 10.5 0 10.5 15.0 PD_C76-S42 Faro Algarve 1 56.5 0 56.5 175.8 PD_C77-C68 Lisbon Caldas 59.9 1 59.9 88.9 PD_C77-C71 Sines Caldas 189.8 2 94.9 280.8 PD_C77-C74 Caldas Nazaré 60.8 1 60.8 91.2 PD_C77-C75 Santarem Caldas 68.2 1 68.2 105.3 PD_C77-S05 Caldas Lusitanian Onshore 49.6 0 49.6 77.8

CCS Roadmap for Portugal, phase I – CO2 storage and transport options and risks
57
where Bc is a standardized cost factor (€2010/m×m) averaged for several pipeline diameters; N is the number of infrastructures being crossed in a single cell; L is pipeline length; D is pipeline diameter; Fci, Fs, Flu and Fc are the terrain factors for crossing infrastructures, slope, land use and corridors, respectively.
The terrain factors and standardized cost factors applied are shown in Table 17:
Table 17 – Terrain factors and pipeline basic costs. Designation Description Value
Standardized cost factor (Bc) €2010/(m×m) 1357 Terrain Factors
Land use (Flu) Unpopulated 1 Urban and associated areas 1.8
Protected areas 10 Cultivated land 1.1
Forest 1.3 Bare areas 1.1
Regularly flooded 1.2 Water bodies 4
Crossings (Fci) Roads 3 Railways 3
High speed railways 3 Corridors (Fc) Offshore (dev. from exist. pipelines) 3
Offshore (fol. exist. pipelines) 2.7 Onshore (fol. exist. pipelines) 0.9
Onshore (dev. from exist. pipelines) 1.0 Slope (Fs) <10% 1
10-20% 1.1 20-30% 1.2 30-70% 3 >70% 9
Pipeline diameter was computed according to (Strachan et al., 2011): 1/52
2
8 M LD
pλ
π ρ ⋅ ⋅
= ⋅ ⋅ ∆ (5)
where D is the diameter (in m), λ is the friction factor (0.015), ∆p is the admissible pressure drop (in Pa), M is the CO2 mass flow rate (in kg/s), ρ is the CO2 density (kg/m3) and L is pipeline length or distance between booster stations, whichever is smaller (in m).
Booster stations investment costs - IB
The criteria applied for calculation of pipeline diameter assumed an admissible pressure drop of 0.02 MPa/km, and to ensure that the total pressure drop is less than 3MPa booster stations were considered for pipelines longer than 150 km. Because pipelines can also connect two source hubs, and two sink hubs, an additional booster station was considered in those situations.
The investment costs required to build the booster stations was estimated as: 0.547 0.42B cI S= ⋅ + (6)
where Sc is the booster station capacity (in MWe) given by:
ceff
M pS
Bρ⋅ ∆
=⋅
(7)
where Beff is the booster efficiency (set at 80%).
Energy costs at the booster stations - EB

CCS Roadmap for Portugal, phase I – CO2 storage and transport options and risks
58
The energy requirements at the booster stations were computed taking into account the number of booster station stations in each pipeline and its capacity (Sc). An electricity cost of 70€/MWh was considered to compute the costs of energy with booster stations.
Operation, Monitoring and Maintenance costs (OMM)
Operation and maintenance costs were assumed to be 3% of the pipeline and booster stations investment costs:
( ) 0.03P BOM I I= + ⋅ (8)
3.3.2. Transport cost estimates
Overall, the pipeline network appears reasonable, both in terms of usage and investment costs per unit of CO2 transported, as shown in Fig. 37.
The COMET central scenario implied transport cost per unit of transported CO2 range from 2.3 €/t to 6.1 €/t depending on the used capacity of the network. The cost difference from building onshore and offshore pipelines results from the terrain factors applied in equation (4). According to Table 17, a corridor terrain factor (Fc) equal to three applies to offshore pipelines deviating from existing natural gas pipelines. Thus, investments costs for offshore pipelines are at the most three times higher than for onshore pipelines.
However, other terrain factors affect the cost difference between onshore and offshore pipeline networks:
• Land use factors apply to onshore networks, with costs increasing whenever the land use terrain factor is above 1. Crossings of important infrastructures (railways, highways, rivers) are also a source of increased costs onshore;
• Even when opting for offshore networks, there will be a network of onshore pipelines required to conduct the CO2 from the hubs or sources to the seashore;
Analyzing the viable pipeline routes in Portugal (Fig. 36) it is possible to distinguish between the costs of fully onshore pipelines (considering land use, infrastructure crossings, etc.) and the cost of networks mainly offshore (with an onshore component to reach the seashore). The cost difference between those networks is shown in Table 18, with the offshore networks being only 28% more expensive than the onshore pipelines networks.
Table 18 – Average transport costs to onshore and offshore storage sites.
The analysis of CCS costs conducted by ZEP and the IEAGHG includes an assessment of the CO2 transport costs (ZEP, 2011b). Several scenarios are considered, but the scenario most comparable to the Portuguese situation, is transport of 2.5 Mt/a along a 180 km pipeline. ZEP finds transport costs of 5.4 €/t for the onshore pipeline, and 9.3 €/t for the offshore pipeline. This cost compare favourably with those reported in Table 18. However, the costs indicated by ZEP are for demonstration phase projects. For commercially-driven reality, ZEP (2011b) considers scenarios of transport of 20 Mt/a, with costs varying from 1.5 €/t and 3.5 €/t for onshore and offshore pipelines, respectively. The transport of 20 Mt/a is far beyond what is expected to be transported in Portugal, and thus it is difficult to compare our transport results with those reported in ZEP (ZEP, 2011b). Nevertheless,
Year 2030 2040 2050 Total costs (M€/yr) Total costs (€/t)
Onshore 34.93 7.8 5.0 3.3 Offshore* 44.79 9.9 6.4 4.2
Offshore costs / Onshore costs 1.28 1.28 1.28 *with enough onshore pipeline network to reach the seashore.

CCS Roadmap for Portugal, phase I – CO2 storage and transport options and risks
59
Table 18 does indicate a reduction in costs with respect to time, as the transport network becomes fully developed, and is considered a reliable description of the local reality.
Fig. 37 – Transports costs variation per pipeline, according to the several COMET scenarios. The blue lines show the range of variation in the COMET scenarios (varying CO2 flow rate) and black square shows the mean value.
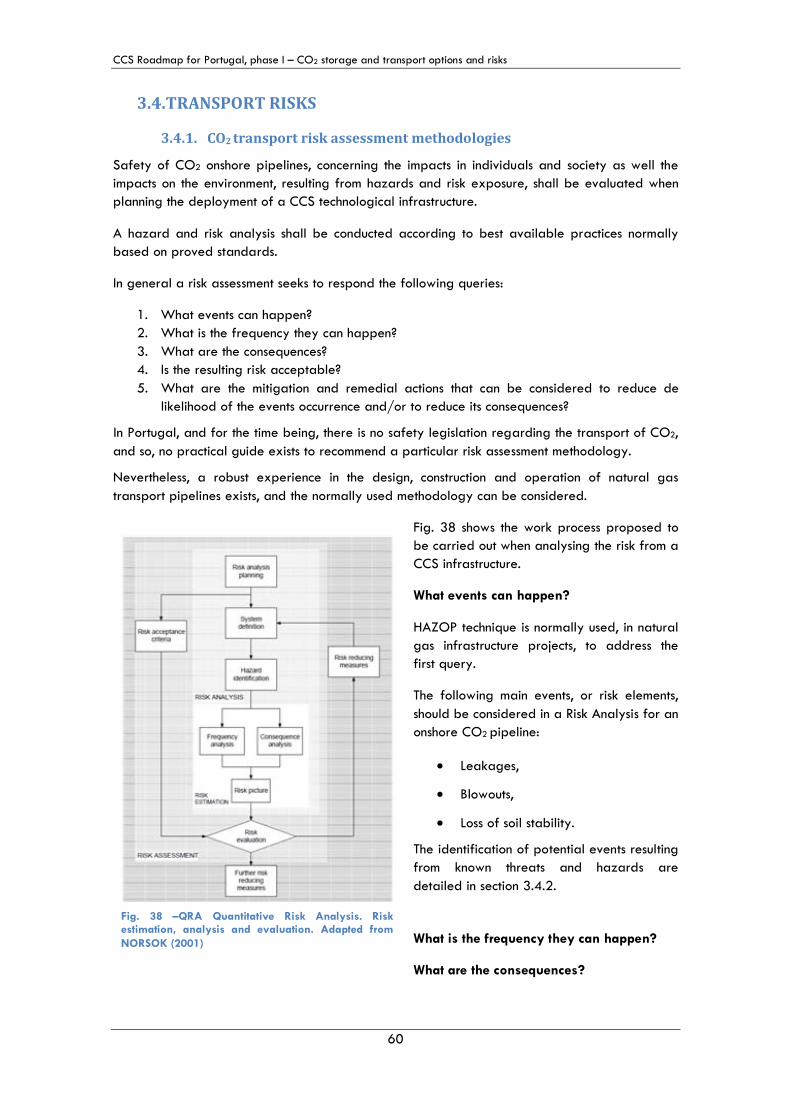
CCS Roadmap for Portugal, phase I – CO2 storage and transport options and risks
60
3.4. TRANSPORT RISKS
3.4.1. CO2 transport risk assessment methodologies
Safety of CO2 onshore pipelines, concerning the impacts in individuals and society as well the impacts on the environment, resulting from hazards and risk exposure, shall be evaluated when planning the deployment of a CCS technological infrastructure.
A hazard and risk analysis shall be conducted according to best available practices normally based on proved standards.
In general a risk assessment seeks to respond the following queries:
1. What events can happen? 2. What is the frequency they can happen? 3. What are the consequences? 4. Is the resulting risk acceptable? 5. What are the mitigation and remedial actions that can be considered to reduce de
likelihood of the events occurrence and/or to reduce its consequences?
In Portugal, and for the time being, there is no safety legislation regarding the transport of CO2, and so, no practical guide exists to recommend a particular risk assessment methodology.
Nevertheless, a robust experience in the design, construction and operation of natural gas transport pipelines exists, and the normally used methodology can be considered.
Fig. 38 shows the work process proposed to be carried out when analysing the risk from a CCS infrastructure.
What events can happen?
HAZOP technique is normally used, in natural gas infrastructure projects, to address the first query.
The following main events, or risk elements, should be considered in a Risk Analysis for an onshore CO2 pipeline:
• Leakages,
• Blowouts,
• Loss of soil stability.
The identification of potential events resulting from known threats and hazards are detailed in section 3.4.2.
What is the frequency they can happen?
What are the consequences?
Fig. 38 –QRA Quantitative Risk Analysis. Risk estimation, analysis and evaluation. Adapted from NORSOK (2001)

CCS Roadmap for Portugal, phase I – CO2 storage and transport options and risks
61
For queries 2 and 3 a QRA (Quantitative Risk Analysis) method, using relevant frequency data, is the most appropriated one.
The elements comprising a QRA method are pictured in Fig. 38. Four levels are to be considered in a QRA:
Level 1: Risk estimation Level 2: Risk analysis Level 3: Risk assessment Level 4: Safety management
The analysis of the possible causes of initiating events can be supported in various tools, like: • FMEA- Failure Modes and Effects Analysis • FTA- Fault Tree Analysis
NOTE: When a quantitative approach would not be possible, an alternative would be to conduct a BowTie risk analysis (http://www.cgerisk.com/knowledge-base/risk-assessment/thebowtiemethod). In what concerns the frequency failures can occur, i.e. failure rates, they can be obtained from well-established incident data sources:
• EGIG • UKOPA • CONCAWE • DOT • OREDA
The frequencies the potential events can occur are detailed in section 3.4.2.
The consequences of an event, resulting in loss of containment, are to be understood by modelling the dispersion of the CO2 release combined with the lethality of its concentration.
There are available various dispersion programmes to model a compressed dense/supercritical fluid release. In Portugal and for the natural gas pipelines risk analysis, DNV PHAST
(http://www.dnv.com/services/software/products/phast_safeti/phast/) is being used and accepted by the Portuguese licensing authorities.
Consequences for humans from the dispersion modelling can be derived knowing the level of harm and population data.
Table 19 gives the reactions of the human body to various concentrations of CO2 in air.
For the level of harm available toxicological information shall be taken into consideration.
The paper HSE (2000) gives the DTL (dangerous toxic load) values for SLOT (specific level of toxicity) and SLOD (significant likelihood of death) from which a Probit formula (http://en.wikipedia.org/wiki/Probit_model) for fatality from exposure to CO2 can be derived, assuming that SLOT is equivalent to 1% probability of mortality in an exposed population (Table 20 and Table 21).

CCS Roadmap for Portugal, phase I – CO2 storage and transport options and risks
62
Table 19 – Exposure reactions to carbon dioxide. Adapted from Energy Institute (2010).
Table 20 – SLOT and SLOD values for carbon dioxide. Adapted from Energy Institute (2010).
Table 21 – Derived probability of fatality for carbon dioxide. Adapted from Energy Institute (2010).
Fig. 39, depicting the CO2 dose-fatality relationship, represents graphically the Probit result.
The Recommended Practice DNV-RP-J202 (DNV, 2010b), under Chapter 3.3 Safety assessments – CO2 specific aspects - also provides data on the toxicology levels and occupational exposure limits for CO2.
Concentration in air (% v/v) Effect
1 % Slight increase in breathing rate.
2 % Breathing rate increases to 50 % above normal level. Prolonged exposure can cause headache, tiredness.
3 % Breathing increases to twice normal rate and becomes laboured. Weak narcotic effect. Impaired hearing, headache, increase in blood pressure and pulse rate.
4-5 % Breathing increases to approximately four times normal rate; symptoms of intoxication become evident and slight choking may be felt.
5-10 % Characteristic sharp odour noticeable. Very laboured breathing, headache, visual impairment, and ringing in the ears. Judgment may be impaired, followed within minutes by loss of consciousness.
10-15% Within a few minutes exposure, dizziness, drowsiness, severe muscle twitching, unconsciousness.
17-30% Within one minute, loss of controlled and purposeful activity, unconsciousness, convulsions, coma, death.
CO2 concentration (%) producing: SLOT SLOD
0,5 11,5 15,3 1 10,5 14,0 10 7,9 10,5 30 6,8 9,2 60 6,3 8,4
120 5,5 7,7
Probit Probability of fatality
(%)
Concentration for one minute exposure
(%)
Concentration for 10 minute
exposure (%)
Concentration for 60 minute
exposure (%) 7,85 99,75 20 15 12 6,06 85,5 16 12 9,5
5 50 14 10,5 8,4 3,76 11 12 9 7,2 2,67 1 10,5 7,9 6,3
Fig. 39 – CO2 dose-fatality relationship. Adapted from Energy Institute (2010).

CCS Roadmap for Portugal, phase I – CO2 storage and transport options and risks
63
Is the resulting risk acceptable?
In order to determine if a certain risk is acceptable, first let us define risk.
From ICM (Institution of Chemical Engineers), the following definition can be derived:
Risk is the likelihood of a specified undesired event occurring within a specified period. It may either be a frequency (the number of specified events in a given period) or a probability (the chance of the specified event following a prior event). Mathematically, risk is a function combining both the failure events and the consequences of them.
Then, a RAC (Risk acceptance criteria), shall be established. For industrial business the risks shall be kept ALARP, i.e. as low as reasonable practicable, and the remaining risk at a level that is acceptable to individuals (including the work force), people at large and environment, as considered appropriate by regulatory authorities.
QRA methods can produce risk results expressed as:
• Individual risk, • Risk contours, • Social risk, • F-N curves on fatalities, and • FAR (Fatal accident rates).
Normally a Risk Matrix is being used in natural gas pipeline projects to identify the risk levels and RACs of potential threats and hazards.
The following equation is commonly used as a definition of risk:
Risk = POF (probability of failure) × COF (consequence of failure)
where the POF is based on failure frequency or remaining lifetime, while the COF is usually related to safety, health, environment, and economics issues.
A risk matrix method is an example of qualitative risk assessment. It uses a matrix dividing the dimensions of frequency (POF) and consequence (COF) into typically three to six categories. Risk matrices can use quantitative definitions of the frequency and consequence to rank the risks of the each hazard or each box on the risk matrix (Fig. 40). In the matrix, A represents very low (VL), B low (L), C medium (M), D high (H) and E very high (VH) level effect on the environment and public safety. If an event happens
frequently and has a fatal effect on environment or public safety, the event is located in the high risk region.
What are the mitigation and remedial actions that can be considered to reduce de likelihood of the events occurrence and/or to reduce its consequences?
Fig. 40 – Risk Matrix. Adapted from CO2EUROPIPE (2011).

CCS Roadmap for Portugal, phase I – CO2 storage and transport options and risks
64
If risk levels are unacceptable, mitigation and remedial actions can be employed to reduce risks further. Reducing the frequency of an event and reducing the severity of an event can both be used to reduce overall risk.
Reducing frequency
By understanding possible causes of failure, it is possible to reduce the likely frequency of an event. For example through: • Protecting against third party interference (e.g. thicker pipe or protective overburden, at
vulnerable pipeline locations, such as road crossings), • Protecting against corrosive failure of equipment (e.g. designing appropriately for wet
environments, moisture control, thicker materials, suitable inspection regimes, cathodic protection),
• Protecting against blockages and other operation issues (e.g. appropriate design of blowdown vessels and vents to prevent blockages), Proactive prevention of leaks (e.g. inspection, test and maintenance, intelligent pigging and pipeline surveillance for small leaks, quality assurance (QA) procedures, change management procedures for plant). Reducing severity
Once an incident has occurred, the severity of that incident can be reduced by a number of mitigation strategies. Examples include: • Appropriate staff training and procedures (e.g. emergency plans, confined space, entry
procedures, low temperature awareness), • Reducing inventory released (e.g. crack arrestors, block valves, appropriate monitoring), • Appropriate emergency plans (e.g. including how to inform local population of a potential
hazard etc.).
Table 22– Summary of hazard and risk analysis Issue Key points What events might happen? Suitable hazard identification techniques and information of known
incidents should be used to identify scenarios that need to be modelled. Scenario setting should take into account topography, impingement, proximity to populations and the case by case assessment of whether additional detailed CFD modelling is required. Scenarios should also assess whether any impurities cause a hazard that has a more severe consequence than carbon dioxide alone.
Understanding the likely frequency
There are sources of failure rate data which could be applied to CCS installations and pipelines, but care must be taken when using these data because either sample sizes are small or data are from a comparable industry but not CCS. Examples of data given in this document are not exhaustive and other options should be explored. With the limited CCS related failure data, participants should ensure that suitable mechanical integrity programmes are set in place.
What are the consequences of an event?
The consequence of an event is the likely fatality rate at specified locations based on a time duration dose of carbon dioxide. Fatality probability can be calculated using probit functions for carbon dioxide combined with carbon dioxide concentrations calculated through dispersion modelling.
Is the risk acceptable? Societal risks set a framework for understanding whether the risk is acceptable or not, as no activity is completely risk free. Risk levels should be discussed with health and safety regulators and company safety specialists.
What can be done to eliminate or reduce risk?
Mitigation strategies focus on reducing frequency of an event

CCS Roadmap for Portugal, phase I – CO2 storage and transport options and risks
65
3.4.2. Identification of main risks along pipeline corridors
As previously stated, CO2 onshore pipelines should be designed, built and operated according national legislation and regulations, normally based on proved standards.
In Portugal, and for the time being, there is no safety legislation regarding the transport of CO2. Nevertheless, the safety regulation for natural gas transport (Portaria 142/2011) can be followed as a reference. Based on the requirements of EN 1594/2009 - Gas supply systems - Pipelines for maximum operating pressure over 16 bar (EN, 2009). Functional requirements, the Portuguese safety regulation requires a PIMS (Pipeline Integrity Management Program) to be implemented, to access risks based on collected data, as per the requirements of ASME B31.8S - Managing system integrity of gas pipelines (ASME, 2010) and of the European specifications CEN/TS 15173:2006 - Gas supply systems. Frame of reference regarding pipeline integrity management systems (PIMS) (CEN/TS, 2006a) and CEN/TS 15174:2006 - Gas supply systems. Guidelines for safety management for natural gas transmission pipelines (CEN/TS, 2006b).
In general, the main issues to be taken into consideration are:
i) The safety objective of CO2 transport shall cover all phases of the onshore pipeline life cycle, from conceptual design until abandonment,
ii) Systematic risk assessments to identify and evaluate threats or hazards and the consequences of failures shall be considered so that mitigation and remedial measures can be taken into consideration,
iii) Risks to individuals (individual risks) and to the people (societal risks), as risks for the environment (environment risks) shall be evaluated and quantified as possible.
Particularly for CO2 onshore pipelines and for an integrity management planning, the requirements of the recommended practice DNV-RP-J202 – Design and Operation of CO2 Pipelines (DNV, 2010b)- can be followed, for the type of data to be collected and for threads and hazards identification.
The types of data which may be required to evaluate specific threats and hazards and its consequences are shown in Table 7-1 of DNV (2010b).
Also, according to DNV (2010b), the threats or hazards, along the corridors, listed in Table 23 can be identified.
3.4.2.1. Events and probability of occurrence and mitigation measures
For a pipeline network, the events that may occur, from the identified threats or hazards, with high consequences for the individuals, people and environment are, typically, those associated to “loss of containment”, being the pipeline rupture the most severe scenario to be addressed.
The probability and potential mitigation measures to be considered for each of the identified threats and hazards that can result in a pipeline rupture are shortly analysed as follows:
Third party damage or external interference
Third party interference is the most reported cause for gas transport pipeline incidents, in Europe, according to the 8th EGIG (EGIG, 2011), accounting for 48,4% of the total incidents experienced since 1970. Also, UKOPA (UK Onshore Pipeline Operator’s Association) (UKOPA, 2013), confirms this fact.

CCS Roadmap for Portugal, phase I – CO2 storage and transport options and risks
66
USA statistics on pipeline incidents reported by DOT/PHMSA (DOT–PHMSA, 2013) shows a different scenario, although ‘Third Party Excavation Damage’ is the primary cause for pipeline incidents.
Table 23 - Identification of main risks along corridors threads and hazards. Adapted from DNV (2010b). Risks (Threads or hazards) Typical to any
pipeline Specific for CO2
pipelines Time dependent External corrosion • Internal corrosion • • Stress corrosion cracking/Hydrogen induced cracking
•
Fatigue • • Degradation of materials • • Manufacturing exposed to CO2 • Welding exposed to CO2 • Equipment defects exposed to CO2 • Stable Manufacturing not exposed to CO2 • Welding not exposed to CO2 • Time independent Third party damage • Incorrect operations • Weather/outside force • Equipment defects not affected by CO2 • Equipment failure • • On-bottom stability • • Operational Repair/Welding issues • Shut in • Blow Down/Depressurization •
In what concerns CO2 onshore pipeline, the only available incident data refers to the USA. Between 1986 and 2008, the 13 reported accidents resulted from equipment failure (46%) corrosion (15,5%), operation error (15,5%), and three of the cases from unknown causes.
A variety of mitigation measures can lessen the incidents frequency, all already practiced by natural gas pipeline TSOs and comprehensively included in the referred codes and standards.
Typical examples of preventing measures are:
• Depth of cover, e.g. bigger than 1,5 m, • Mechanical barriers/protections, e.g. concrete slabs above the pipeline, • Pipeline markers along the ROW of the pipeline, • Surveillance routines, either by helicopter, car or even on foot, • 24/7 on call systems, • PTWs procedures, • Pipeline inspection programs, e.g. Inline inspection by intelligent pigs or DCVG
techniques, • Public education programs.
External corrosion

CCS Roadmap for Portugal, phase I – CO2 storage and transport options and risks
67
Subsurface external corrosion is the third biggest threat to onshore pipelines according to the 8th EGIG (EGIG, 2011). The soil corrosivity, pH, microorganisms, temperature, stress, etc. are the promoting causes to enhance external corrosion phenomena.
Upon coating defects or active cathodic protection failures, external corrosion defects can start and progress, endangering the pipeline integrity.
Controlling and preventive measures are:
• Pipeline coating, • Cathodic Protection (CP) systems, e.g. impressed current, • In Line Inspection Programs, • Coating Inspection, e.g. Direct Assessment programs (DVGW and CIPS), • Stray current control, e.g. insulators and barriers.
Internal Corrosion
Internal corrosion, resulting in a pipeline wall metal loss or damage is caused by a reaction between the pipeline material and the product being transported.
Dry CO2 poses no threat to high resistant steels, manufactured according API 5L standards, the most common materials used for pipeline transport.
The presence of free water, impurities such as oxygen, chlorides, H2S, organic acids, precipitates or sulphur-bearing compounds may promote corrosion. Pitting and crevice type defects are, then, commonly recorded.
To prevent the internal corrosion occurrence the following measures can be used:
• Pipeline internal coating, • Removal of H2O and impurities, • Control of impurities in CO2, • In Line Inspection Programs.
SCC (Stress Corrosion Cracking)
Due to the presence of H2 and impurities in the CO2 flow, propitious chemical environmental can develop to enhance the initiation and acceleration of cracking processes in carbon steel materials, which together with induced stress from applied loads and residual stress from fabrication would result in stress corrosion cracking.
Prevention of the potential occurrence of such phenomena would depend on suitable materials for pipeline fabrication and controlling operation conditions/parameters, such as pressure, temperature and guaranteeing an adequate chemical environment. Additionally the following operational measures can be considered:
• Cathodic Protection system, • Temperature control, • Minimizing pressure variations.

CCS Roadmap for Portugal, phase I – CO2 storage and transport options and risks
68
Hydrogen Induced Cracking
The presence and absorption of hydrogen can cause degradation of the mechanical properties of the pipeline material – known as hydrogen embrittlement. Hydrogen can be generated during construction phase – welding, or from corrosion, soil biological activity (SRB Sulfate Reduction Bacteria) and impressed current effects, during the operational phase.
Adequate corrosion control and cathodic protection operation, supplemented by anti-bacteria pipeline coating when necessary are general preventive measures that should be present in the operational procedures of a CO2 pipeline.
Manufacturing, Equipment and Welding exposed to CO2
Moving CO2 and suspended solid impurities would cause erosive wear. An accelerated loss of pipe, equipment and welding material could result from a joint corrosion and erosion process.
Cladding of carbon steel material and the installation of filtering and scrubbing technologies are preventing measures that can be envisaged to mitigate these risks.
As CO2 will be transported in a dense phase, damage of elastomer type sealing materials has to be considered. To prevent this risk, high durometer materials shall be specified in design phase; typically Viton valve seats, Flexitallic, nitile and EPDM gaskets are normally used in USA CO2 pipelines.
Weather/outside force
Natural occurrences like landslides, earthquakes or soil settlements, can result in forces exerted on the pipeline, potentially leading to failures and in the extreme to total ruptures.
A proper pipeline routing selection, in the design phase, and a close monitoring and repair of the right of way condition, during the operational phase, are the main mitigating measures to be considered.
Fatigue
Thermal cycling or cyclic mechanical loads would induce cyclic tensile stresses and consequent progressive and localized structural damages, known as fatigue.
A proper design and operation parameters monitoring are the preventive measures to mitigate potential risks resulting from fatigue loads.
Incorrect operations
Quality control, O&M procedures, personnel training schemes, etc. are normally considered in the establishment of the operational organization that will be in charge of the CO2 transport infrastructure.
3.4.2.2. Consequences from the events
With regard to risks analysis of CO2 transport infrastructures, namely onshore pipelines, consequences from failure, in particular pipeline rupture, references can be made to several studies developed in Great Britain and Netherlands, and available in the public domain:
• The Application of Individual and Societal Risk assessment to CO2 Pipelines (Cleaver and Hopkins, 2012).

CCS Roadmap for Portugal, phase I – CO2 storage and transport options and risks
69
• Technical guidance on hazard analysis for onshore carbon capture installations and onshore pipelines (Energy Institute, 2010).
• Project no.:226317 - CO2Europipe (CO2EUROPIPE, 2011).
Appendix C summarizes the conclusions of those studies.
3.4.2.3. Comparison of consequences from a CO2 pipeline and a natural gas pipeline releases
The previously referred study by Cleaver and Hopkins (2012) analyzes a total rupture of a pipeline nominal diameter DN 900, 100 Km long, and transporting CO2 in dense phase at an initial pressure of 150 bar and a temperature of 10ºC.
The results are compared with a similar rupture endured by pipeline transporting natural gas at a pressure of 85 barg.
Appendix D summarizes the conclusions of this study.
Also the HSE (Health and Safety Executive, UK) http://www.hse.gov.uk/risk/index.htm developed in 2009, the RR749 study, "Comparison of Risks from carbon dioxide and natural gas pipelines" (HSE, 2009) with the aim, among others, to determine whether CO2 should be regulated as a hazardous fluid in the implementation of safety regulation for pipelines (Pipeline safety Regulations).
For this purpose, they proceeded to compare risk analysis QRA, also with modelling by DNV PHAST software for various scenarios of CO2 transport natural gas, using a pipeline with 18 km long, pipe DN 700 with a thickness of 12,7 mm and X60 material, installed to 1.1 m depth ( characteristics very similar to the natural gas transmission network in Portugal ) at two different pressures - 32 barg and 15 barg.
The main findings were:
• Unlike natural gas, CO2 is not needed for ignition damage; • The safety margin for the same level of risk are roughly comparable between the
transport of CO2 and natural gas; • Increasing pressure results in increased levels of risk, in both cases; • The modelling of the release of the two fluids was performed at pressures lower than
those established for CO2 transport, and normally used in the transportation of natural gas, given the uncertainty in the modelling of CO2 in dense phase; as a result the danger range (hazards) and therefore risk, will be substantially larger, for release at pressures that occur in a situation in dense phase transport.
Fig. 41a) through d) indicate that in areas near the damaged pipeline, risks associated to release of CO2 are higher when compared with a similar release of natural gas. Risks associated to release of natural gas become larger from distances greater than about 30 m, equivalent to a value of SLOD, and from distances of about 60 m to an equivalent SLOT. However, the consequences of releasing the gas produced in an interval of 15 min., after the occurrence of rupture and consequent ignition while you may need to consider a period up to 30 minutes after the event to the permanence of the risks of CO2.

CCS Roadmap for Portugal, phase I – CO2 storage and transport options and risks
70
Fig. 41 - a) SLOD equivalents, 32 barg release; b) SLOD equivalents, 15 barg release; c) SLOT equivalents, 32 barg release; d) SLOD equivalents, 32 barg release. Adapted from HSE (2009).

CCS Roadmap for Portugal, phase I – CO2 storage and transport options and risks
71
3.5. SHIPS AS AN ALTERNATIVE TO TRANSPORT BY PIPELINE. Unlike transport by pipeline, CO2 transport by ship is not confined to a spatially prescribed infrastructure network. Temporal and spatial adaptation of the transport capacities to changes in transport quantities and storage capacities is more cost-effective than for pipeline networks. These cost benefits are referred to as flexibility (Geske and Berghout, 2012). This flexibility allows that a greater part of the capital required for the transport can be reused in the case of a change in the transport route, for instance due to: i) capacity development on the capture site - especially uncertain at early stages of the build-up of a CCS infrastructure -; ii) the storage capacity and its development; and iii) re/co-use of the vessel as LNG transporter.
Even if the cost of both infrastructure options were the same, the more flexible vessel infrastructure could operate more efficiently. Based on this advantage an infrastructure development strategy could be: usage of the vessel transport infrastructure during early phases of the build-up of CCS infrastructures and pipeline transport in later phases as transport volumes and storage capacities stabilise.
At present, only small amounts of CO2 are transported by vessel, for the food industry. No experience with CO2 transport on a scale of several million tonnes per year exists. The best solution is to transport CO2 near the "triple point" (5.2 bar, -56.6 °C) in the liquid phase with a density of 1200 kg/m3 (Fig. 32, page 49). Under these conditions, sea transport entails the following process steps (Fig. 42):
• Liquefaction and conditioning of the CO2 - During liquefaction, water must be removed from the CO2 (drying) in order to prevent hydration, freezing, and corrosion;
• Intermediate storage - Due to the discontinuous nature of the sea transport, intermediate storage is required. The storage tanks needed for this are already operated in the context of LPG storage;
• Loading the vessel - The loading system comprises pumps and pipelines; • Transport by vessel - The size of the shipping fleet and the capacity of the individual
vessels are determined by the volume to be transported and the transport distance;. • Unloading the CO2 - For offshore compression, a loading platform and a hose
connection from the platform to the ship and from the platform to the undersea compression facility must be installed.
Fig. 42 – Schematic configuration of CO2 transport by ship. After DNV (2011)

CCS Roadmap for Portugal, phase I – CO2 storage and transport options and risks
72
3.5.1. Break-even distance and mass flow for transport by ship
In the context of the COMET project, Geske and Berghout (2012) assessed the cost of CO2 transport by ship based on analogies to LPG transport. For any transport capacity combination, those authors identified the break even distance such that vessel transport is possible at lower cost than pipeline transport for higher distances. For further detail on the cost model refer to the original Geske and Berghout (2012) report.
Fig. 43 shows the break-even distance as a function of the transport mass of CO2. Iso-specific-cost curves are also shown. The figure shows that following a specific iso-specific-cost curve the optimal transport mode can change. E.g. for 4€/t the transport is from 0 to 30 Mt/y best conducted by pipeline and above 30 Mt/y by ship. For any capacity to be transported there is a breakeven distance for ship transport. This breakeven distance rises as capacity increases. That means ship transport is advantageous for long distances with low mass flow rates. Pipelines are more cost effective for short distances with high flow rates (Geske and Berghout, 2012).
Although those authors consider several components when comparing the transport costs by ship and by pipeline, they also provide linear approximations to those costs, making it relatively simple to model several scenarios. Transport costs by ships are approximated according to:
( , )vt vt vtC S L b L c S= + (9) where Cvt is the transport cost (€), S is the ship capacity (tonnes), L is the pipeline length (km), bvt is a constant equal to 31796 €/km, and cvt is a constant equal to 4.43 €/tonne.
Transport costs by pipeline are approximated by:
( , )pt pt ptC S L a SL b L= + (10) where Cpt is the transport cost (€), S is the capacity (tonnes), L is the pipeline length (km), apt is a constant equal to 0.0094
€/(t.km), and bpt is a constant equal to 59688 €/km.
For any given capacity S, the distance (in km) above which ship transport is more cost effective than pipeline transport can be approximated from:
6
471.277
2.967 10
S
SL
× +> (11)
3.5.2. Possibilities for transport by ship in Portugal Since the vast majority of CO2 sources in Portugal are located in coastal regions and most storage sites are located offshore, CO2 transport by ship cannot be disregarded as an alternative. Resorting to the linear approximations provided by equations (9) and (10), Geske and Berghout (2012) attempted to identify cost-effective ship transport alternatives to the CO2
Fig. 43 – Comparison of vessel and pipeline transport; Distance-mass flow combinations with a cost advantage for vessel transport (blue shaded area) and for offshore pipeline (red area); iso-cost curves [€/t] (dashed). Source: Geske and Berghout (2012).

CCS Roadmap for Portugal, phase I – CO2 storage and transport options and risks
73
transport network illustrated in Fig. 36 and schematized in Fig. 44. They considered two possibilities in which transport by ship could decrease the cost of the transport network:
• starting with the existing pipeline infrastructure, for given CO2 capture- and injection-volumes, the substitution of single pipeline-connections by vessel-connections was considered without adapting capacities of the existing pipeline infrastructure. In this interpretation CO2 would pass the same routes as within the exclusive pipeline infrastructure;
• the possibility to redirect CO2 to storage sites with lower storage costs. This potential is high as storage cost offshore vary from 10.4 €/ton to 47.4 €/ton.
The ship transport option (Fig. 44) decreases the transport and storage system cost by redirecting CO2 emissions from source cluster C69 (Setúbal) and source cluster C71 (Sines) by ship to the storage cluster S42 (Algarve basin). Setúbal and Sines would be the relevant ports used in this scenario. This redirection makes it possible to store CO2 at 10 €/t in S42 instead of 12 €/t in S03. Thereby storage cost decreased from 100 M€ to 91 M€ and transport cost remained almost constant at 4 €/t. Thus, in 2050 the vessel transport option reduces the system cost from 170 to 157 M€ (10.56 €/t to 9.75 €/t) by 8% compared to 1% in 2040. In this sense the transport of CO2 by ship from the Setúbal and Sines ports to the Algarve storage sites is cost-effective when compared to the alternative transport by pipeline to the offshore clusters in the Lusitanian basin (Geske and Berghout, 2012).
Fig. 44 – Possible connections to ports and ship routes studied in the COMET project for the Portuguese case study. Adapted from Geske and Berghout (2012).

CCS Roadmap for Portugal, phase I – CO2 storage and transport options and risks
74
3.5.3. Possibilities for transport by ship in point-to-point connections
Within the Strategic Plan for Transport and Infrastructures (PETI3+) presented by the Portuguese Government in April 2014, large investments are directed to develop several ports in Portugal, namely the Leixões, Aveiro, Figueira da Foz, Lisboa, Setúbal and the Algarve Ports (Faro will be considered in the following analysis). All these ports are near CO2 emission clusters and, within the strategic development of the ports, it is worth analyzing which, if any, may provide cost-effective shipping routes to CO2 storage sites.
Two sets of analysis can be done: i) starting from the known distance between ports and storage clusters, find the maximum capacity for which the transport by ship is cost-effective; ii) knowing the captured CO2 volume in the emission clusters closer to each port, find the storage cluster(s) to which transport by ship is cost-effective compared to transport by pipeline to the same cluster(s).
These analysis do not attempt to optimize the full chain of the transport and storage costs (unlike the analysis done by Geske and Berghout (2012)), but rather to find point-to-point (port-to-storage cluster and emission cluster-to-storage cluster) connections in which transport by ship may present lower costs than transport by pipeline.
Equation (11), solved for the transport capacity (S), allows calculating for any prescribed distance (L) the maximum capacity for cost-effective transport by ship compared to transport by pipeline. The matrix of distances between ports to storage clusters is provided in Table 24 and represents the distance along hypothetical ship routes.
Table 24 – Matrix of distances between ports and storage clusters.
Calculation of the maximum capacities for cost-effective ship transport is illustrated in Fig. 45. The higher the allowable maximum capacity from any port, the more likely is that transport by ship is cost competitive compared to transport by pipeline. For instance, transport by ship from the Leixões port to the storage clusters located in the Porto Basin (clusters S1 and S2) or in the northern Lusitanian basin (S3) is only cost-effective for small capacities (<1 Mt/a). If larger amounts are to be transported from that port to those storage sites, pipeline transport is probably the best option. On the contrary, transport by ship from Leixões to the south Lusitanian basin (S6) or to the Algarve Basin (S6 and S42) is always cost effective, given that the amount of CO2 that is likely to be captured in Portugal is lower than the maximum capacities from Leixões to those storage clusters.
Sinks Ports Leixões Aveiro Figueira da Foz Lisbon Setubal Sines Faro
Dis
tanc
e (k
m)
S1 70.7 121.0 171.3 393.3 445.4 437.5 639.0 S2 30.7 61.1 111.5 339.0 392.4 383.0 585.4 S3 92.1 42.6 41.0 261.3 315.3 305.3 508.0 S4 158.0 101.7 51.4 194.7 248.7 238.7 441.3 S6 403.6 322.0 280.0 80.7 29.5 34.2 253.7 S7 676.4 601.8 542.6 373.2 340.0 282.0 51.8 S42 563.7 512.7 453.9 288.0 248.0 192.2 48.8

CCS Roadmap for Portugal, phase I – CO2 storage and transport options and risks
75
The most interesting results are obtained for the Lisbon, Setúbal and Sines ports. The maximum capacities for cost-effectiveness ship transport from those ports is always 2 Mt/a (and sometimes much higher), to any of the storage clusters, except for cluster S6, which becomes cost-effective for capacities lower than 0.6 Mt/a. Since the capture volumes in Portugal are likely to be in the range of the 1 Mt/a to 10 Mt/a, transport by ship from those ports is an option to consider, regardless of the storage location (except S6).
The second analysis starts from the matrix of CO2 captured at each of the emission clusters closer to the ports (Table 25), taken here as the average of the captured CO2 in the six COMET scenarios. This analysis assumes that CO2 from emission clusters would be conducted to the nearby port, as listed in Table 25, with the pipeline from the source hub to the port being negligible when compared to the cost for the full transport length. The full volume of CO2 is assumed to be transported to a single storage cluster (a point-to-point connection), and the ratio between equations (9) and (10) allows to identify the storage clusters to which transport by ship is cost-effective. Results are shown in Fig. 46, where transport ratios below 1 identify the port-storage connection for which transport by ship is cheaper than transport by pipeline, and ratios above 1 indicate connections in which transport by pipeline is the economic option.
Transport from Leixões of the CO2 captured in cluster C70 is only cost-effective by ship to storage clusters in the south Lusitanian basin (S6) or in the Algarve (S7 and S42). Transport from Leixões to the storage cluster S4 (in the central Lusitanian basin) could be marginally interesting in the framework of a strategy for development of the port. Transport by ship from the Aveiro and Figueira da Foz ports are only cost-effective for the Algarve storage clusters (S7 and S42) and marginally to the Sines storage cluster (S6).
Fig. 45 – Point-to-point analysis of transport by ship. Maximum capacities for cost-effective ship transport from each of the studied ports to the offshore storage clusters

CCS Roadmap for Portugal, phase I – CO2 storage and transport options and risks
76
Table 25 –Average captured CO2 at the emission cluster closer to ports.
Transport from the Lisbon port is only interesting within the framework of strategic development of the port, since the pipeline and ship transport costs are very similar for storage in every cluster, except for clusters S04 and S06, in which transport by pipeline is clearly cheaper.
The most interesting cases for transport by ship are those for the Setúbal, Sines and Faro ports, which present cost-effective transport costs for the Storage sites in the Porto Basin (S1 and S2) and in the northern Lusitanian Basin (clusters S3, and marginally in cluster S04).
Given that the Algarve (S6 and S42) have considerable seismic risks associated and that the Sines (S06) has the higher storage costs and also some seismic risk, the scenario in which transport by ship to clusters S01 and S04 are cost-effective are the most interesting. Therefore, the Setúbal, Sines and Faro ports are likely to be interesting hubs for developing CO2 transport by ship to the northern and central Lusitanian basin and to the Porto basin. The Lisbon and Leixões ports may also present some potential, albeit only if integrated in a strategy for development of those ports.
Average Capacity (Mt/a)
C70-Leixoes C73-Aveiro C73-Figueira da Foz
C68-Lisbon
C69-Setubal
C71-Sines
C76-Faro
1.109 4.843 4.843 6.986 4.169 3.140 0.585
Fig. 46 – Ratios between transport cost by ship and transport cost by pipeline for connection between ports and storage clusters. Values below 1 indicate cost-effective connections by ship values above indicate cost-effective transport by pipeline.

CCS Roadmap for Portugal, phase I – CO2 storage and transport options and risks
77
3.6. Summary of CO2 transport options and risks
• Within the COMET project, a pipeline network was optimized resorting to a GIS tool including a detailed description of the local terrain conditions. Given the distribution of sources along the coast and the location of sources in the same geographical region, the implementation of a pipeline network approximately oriented along a north-south alignment was the logical option for CO2 transport;
• The average transport costs are 3.3€/t CO2 for onshore storage and 4.2 3.3€/t CO2 for offshore storage. The difference between onshore and offshore transport costs is not higher due to the spatial distribution of the sources along the coast. Offshore storage still requires the majority of the network to develop onshore, with relatively short connections to the offshore storage sites;
• In Portugal, and for the time being, there is no safety legislation regarding the transport of CO2. Nevertheless, a robust experience in the design, construction and operation of natural gas transport pipelines exists, and the normally used methodology can be considered;
• The risks posed by CO2 onshore pipelines are well identified and risk analysis can be performed in the detailed pipeline network defined in the COMET project, in more advanced planning stages for CCS deployment;
• CO2 transport by ships is a valid alternative for some of the national ports, depending on the selection of offshore storage sites, adding flexibility to the transport and storage chain;
• The Sines and Setúbal ports, located in areas with large CO2 emission sources could provide alternatives to CO2 by pipeline, if storage clusters in the north Lusitanian and Porto basins clusters are selected for storage. The Lisbon and Leixões ports can only be competitive for CO2 transport if integrated in a larger strategy of development of the ports;
• CO2 transport by ship could be relevant in the framework of the Portuguese Strategic Plan for Transport and Infrastructures (PETI3+), which aim to develop infrastructures in several ports.

CCS Roadmap for Portugal, phase I – CO2 storage and transport options and risks
78
4. CONFLICTS AND SYNERGIES WITH OTHER ACTIVITIES It is necessary to identify the potentially conflicting activities occurring at surface and underground within the area of influence of the potential CO2 injections sites. Where synergies shall occur it is pertinent to specify the relevant activities at an early stage so that added value results from converging interests.
The area of influence of the storage clusters was taken as the polygons defining the area where the reservoirs are at suitable depths as indicated in Fig. 9 to Fig. 13.
4.1. ONSHORE STORAGE Fig. 47 and Table 26 indicate the administrative boundaries of the municipalities in which the onshore cluster S05 is located. Cluster S05 comprises four potential storage sites: i) São Mamede; ii) Alcobaça; iii) São Pedro de Moel and iv) Alvorninha.
The Municipalities of Rio Maior and Ourém are only marginally affected by the Alvorninha and the S. Mamede storage site, respectively, with the vast majority of the storage sites area being included in several other municipalities, all of which are part of the Leiria District.
Fig. 47 –Administrative boundaries of municipalities in the offshore cluster S05.

CCS Roadmap for Portugal, phase I – CO2 storage and transport options and risks
79
Table 26 – List of characteristics and activities with potential synergies and/or conflicts in cluster S05
Potential storage site Characteristics and activities S. Mamede Alcobaça S. Pedro de
Moel Alvorninha
Municipalities Porto de Mós, Alcobaça, Leiria, Ourém, Batalha,
Marinha Grande, Alcobaça, Nazaré, Porto de Mós, Leiria
Marinha Grande, Alcobaça
Caldas da Rainha, Alcobaça
Hydrocarbon exploration concessions
Rio Maior 2 - Mohave; Aljubarrota 3 - Mohave/Galp
Aljubarrota 3 - Mohave/Galp
Aljubarrota 3 - Mohave/Galp; São Pedro Moel 2 - Mohave
Rio Maior 2 - Mohave; Aljubarrota 3 - Mohave/Galp
Average population density (people /km2) 197 143 89 119
Hot springs and mineral groundwater resources Salgadas da Batalha Termas da
Piedade - -
Freshwater aquifers O20- Maciço Calcário Estremenho
O33 - Caldas da Rainha/Nazaré; O19 – Alpedriz, O18 - Maceira
O12 - Veiria de Leiria/Marinha Grande
O20- Maciço Calcário Estremenho
Main land uses
Forests and grassland (61%); Agriculture (26%); urban areas (9%)
Forests and grassland (72%); Agriculture (19%); urban areas (5%)
Forests and grassland (81%); Agriculture (7%); urban areas (5%)
Forests and grassland (52%); Agriculture (36%); urban areas (6%)
Environmental protected areas
Serras de Aires and Natural Park Candeeiros
Serras de Aires and Natural Park Candeeiros
No. of cultural heritage sites (national monuments, castles, fortresses, museums)
2 castles, 1 fortress, 1 world heritage site (Mosteiro da Batalha)
1 castle, 3 museums, 1 world heritage site (Mosteiro de Alcobaça)
1 fortress
Number of other touristic resources 28 18 5
Quarries Five quarries Four quarries One quarry
Open-pit mines Concession 43809 (kaolin)
Concession 21007 (kaolin), Concession 33007(kaolin and Qz.), Concession 626 (kaolin)

CCS Roadmap for Portugal, phase I – CO2 storage and transport options and risks
80
4.1.1. Underground activities
The inventory of existing underground activities considered the following areas:
• Conventional and unconventional hydrocarbons exploration; • Natural gas storage; • Mineral groundwater, hot springs and geothermal resources; • Groundwater resources.
Conventional and unconventional hydrocarbon exploration
The sedimentary basin in which cluster S05 is included has been the target for oil exploration for more than 50 years, with many oil exploration wells drilled and hundreds of 2-D seismic lines. Hydrocarbon shows have been found in several stratigraphic layers, although so far without conditions for production. The area has seen an increment in hydrocarbon exploration efforts in recent years, with exploration concessions being implemented and new geophysical surveys and deep well drilling targeting the reservoirs in the Jurassic (Brenha Formation) and in the Upper Triassic (Silves Formation).
Fig. 48 depicts the existing hydrocarbons exploration concessions:
• Aljubarrota 3 - held by the consortium Mohave O&D/Galp Energia, and encompassing considerable parts of four potential storage sites in the S05 cluster;
• Rio Maior 2- held by Mohave O&G, and encompassing about half the area of the S. Mamede site and most of the Alvorninha site;
• S. Pedro de Moel 2- held by Mohave O&G, and encompassing part of the S. Pedro de Moel potential CO2 storage site.
From 2011 to 2013 there was exploration activity in the Aljubarrota-3 concession, with 3-D seismic surveys in the most promising prospects, re-entrance and deepening of well Aljubarrota-4, targeting the Jurassic Brenha Formation, and drilling of a new deep well, Alcobaça-1, targeting the pre-salt Silves Formation. Both wells were considered unproductive and abandoned, but new Development and Production Plans for that concession have been presented. 3D-seismic surveys were also conducted in 2011 in the offshore part of the S. Pedro de Moel 2 concession.
These areas have so far been explored for conventional oil and gas, but as of 2012, exploration plans for shale gas and shale oil were presented, targeting the Lias reservoir, and including drilling new deep wells, geophysical and geochemical surveys.
Synergies can result from the exchange of data about the deep geology and the possibility of using oil exploration boreholes as observation boreholes. In case of hydrocarbon production, in later stages perhaps it can be contemplated the use of CO2 in Enhanced Hydrocarbon Recovery.
Constraints can arise if hydrocarbons are found in the same reservoir envisaged for CO2 storage, the Silves Formation. The added value of hydrocarbons could stop efforts to use the reservoir for CO2 storage. In the case of unconventional hydrocarbons (shale oil or shale gas) even if production is not in the same reservoir, the methodology use for production of those resources (fracking) may be incompatible with the required integrity of reservoir and cap-rock.

CCS Roadmap for Portugal, phase I – CO2 storage and transport options and risks
81
Natural gas storage
Natural gas storage is conducted in Portugal at the Carriço salt dome, located in the same sedimentary basin as cluster S05, but outside the area of influence of the potential CO2 storage reservoirs. At Carriço, the natural gas is stored in five cavities built by dissolution of the salt diapirs in the Dagorda Formation, which acts as a cap-rock to the reservoir in the S05 cluster. The concession is hold by REN Armazenagem and Transgás Armazenagem.
Synergies could result from the extensive knowledge gathered in that activity about the geological characteristics of the Dagorda Formation, invaluable to assess its effectiveness as a cap-rock to CO2 storage.
No plans are have been put forward to implement other natural gas storage sites in Portugal, but within the area of cluster S05 there are other salt domes in the Dagorda formation that could in the future be considered for those purposes, causing potential conflicts of use since CO2 storage requires maintenance of the integrity of the cap-rock.
Fig. 48 – Characteristics and existing activities in the onshore cluster S05: Hydrocarbon exploration concessions, mineral groundwater resources, mines and quarries.

CCS Roadmap for Portugal, phase I – CO2 storage and transport options and risks
82
Mineral groundwater, hot springs and geothermal resources
In the municipalities where cluster S05 is located, there are five concessions for mineral groundwater resources for therapeutic purposes (hot springs), and one concession for bottled water from a spring source (Fig. 48 and Table 26).
The existing spring groundwater concession (Águas do Areeiro) is located outside any of the potential sites identified in the S05 cluster and, being of shallow circulation, is not likely to be affected by CO2 storage activities.
Out of the four hot springs concessions, only two are within the area of influence of the CO2 storage sites in cluster S05. Termas Salgadas da Batalha is located within the potential site S. Mamede and Termas da Piedade is located within the Alcobaça storage site.
The detailed description of the groundwater flow systems connected to the Termas da Piedade and Termas da Salgada hot springs are beyond the scope of this report. However, in the Lusitanian basin, the regional flow system is highly constrained by the salt domes in the Lower Jurassic (Hettangian) evaporites in the Dagorda Formation. The evaporite layers rise and cause rupture of the post-Hettangian Mesozoic sedimentary cover. The virtually impermeable salt domes act as a barrier to flow in the permeable Jurassic and Cretaceous formations and groundwater is forced to emerge along faults and contacts between the salt domes and aquifers.
Termas da Piedade shows a groundwater temperature of 27ºC and salinity of 2500 mg/l, while groundwater at Termas das Salgadas has a temperature of 33ºC and salinity of 31670 mg/l (Calado and Brandão, 2009; Lourenço, 1998). Thus, these are deep circulation groundwater’s, likely to have obtained its salinity by contact and leaching of the Dagorda Formation. Fig. 49 illustrates the type of structure induced by the ascending salt domes (Kullberg, 2000; Kullberg et al., 2006).
Consequently, groundwater feeding Termas da Piedade and Termas da Salgada circulate in the layers above the cap-rock of the Silves Formation Reservoir, are not expected to be in contact with the injected CO2.
Nevertheless, it is necessary to study if the pressures induced by injection of CO2 can induce flow changes affecting the aquifers that feed Termas da Piedade and Termas da Salgada.
Information about these hot springs may be of high value for describing
the regional flow conditions in the study area, an important aspect to understand the long-term fate of CO2 in the reservoir.
There are no concessions for exploration or exploitation of geothermal resources in the municipalities under consideration.
Fig. 49 – Schematic representation of structural geology impact due to halokynetic movements. Adapted from Kullberg (2000).

CCS Roadmap for Portugal, phase I – CO2 storage and transport options and risks
83
Groundwater resources
Five freshwater aquifers exist within the area of influence of cluster S05:
• Veiria de Leiria/Marinha Grande aquifer (aquifer system O12, under the classification of Almeida et al. (2000), affects the S. Pedro de Moel storage site. This is a multi-layered aquifer in which water is pumped from Plio-plistocenic sands, Miocene sands and sandstones from the Early Cretaceous. Often the aquifer acts as confined, and sometimes with free-flowing wells. Near S. Pedro de Moel the thickness of the aquifer can reach some 120 m. The groundwater has good quality for public water supply (Almeida et al., 2000);
• Caldas da Rainha/Nazaré aquifer (aquifer system O33), is included within the Alcobaça storage site. The aquifer is composed of plio-plistocenic sands that fill the Caldas da Rainha/Nazaré salt diapir valley. Within the study area, 21 wells are known, with maximum depth of 51 m. The aquifer behaves as a water table aquifer in some areas, but can also be locally confined. The groundwater is considered as of medium quality for public water supply (Almeida et al., 2000);
• Alpedriz aquifer (aquifer system O19), is included within the Alcobaça storage site. The aquifer is composed by Early Cretaceous sandstones, although some wells abstract water from shallower layers. The existing wells can be considerably deep (for groundwater wells), reaching down to 250 m depth. The aquifer is confined for most of the area where it occurs. The groundwater has good quality for public water supply (Almeida et al., 2000);
• Maceira aquifer (aquifer system O18), a small aquifer occurring in the Alcobaça storage site. Unlike the previous aquifers, the Maceira aquifer is composed of carbonated rocks, karstified limestones from Lower and Middle Jurassic. There is very limited information about this small aquifer;
• Macico Calcário Estremenho aquifer (aquifer system O20), an extensive aquifer spreading over 767.6 km2, and including part of the S. Mamede and Alvorninha storage sites. It is a very complex aquifer system, implemented in the thick limestones units of the Jurassic that compose Serra de S. Mamede. The aquifer is of good quality for public water supply.
All these aquifers are much shallower than the CO2 reservoir, which is always deeper than 1600m in cluster S05. It is not anticipated that wells drilled in the freshwater aquifers may reach the reservoir or even its cap-rock, the Dagorda Formation.
Synergies with this activity is the use of groundwater wells as monitoring wells for collecting information about the groundwater chemistry and its evolution, as well as to detect any leaks of CO2 or brine. Information about these shallower aquifers is also required to describe the regional flow conditions and understand the long-term fate of CO2 in the reservoir.
Conflicts may arise if it is required to drill across those aquifers to reach the CO2 reservoir, as the possibility of leaks of CO2 along the wells may lead to a precautionary approach from the regulating authorities.

CCS Roadmap for Portugal, phase I – CO2 storage and transport options and risks
84
4.1.2. Surface activities
The inventory considered the following surface characteristics: • Population density; • Soil use; • Environmental protected areas, tourism and heritage sites; • Mines and quarries.
Population density
Population density, according to the 2012 national census, is illustrated in Fig. 50, reaching maximums of 223.9 people /km2 in the Leiria municipality to minimum value of 92.5 people /km2 in the Porto de Mós Municipality. The average population density in Portugal is 112.3 people/km2.
Fig. 50 illustrates the population density in the municipalities affected by the four potential storage sites. The S. Pedro de Moel selected area shows the lowest population density, together with the Porto de Mós municipality that are included in the S. Mamede selected area. Alvorninha and particularly the Alcobaça selected areas show the highest population density.
The potential for conflict with local activities increases with population density, and in other countries (e.g. Netherlands, Germany) local populations have voiced concerns of safety and property devaluation in areas where CO2 storage was being planned. During the characterisation and monitoring phase, with the need to conduct seismic surveys using an explosive/vibrating source, concerns about damage to property may arise in local populations.
Land Use
Fig. 51 represents the land use according to the 2010 land use and cover mapping (COS 2010). The land cover in the vast majority the four potential storage sites is composed by forests, taking 73% of the land use, agriculture (20%), while urban areas cover 6% of the zone of influence of
Fig. 50 – Characteristics and existing activities in the onshore cluster S05: Population density.

CCS Roadmap for Portugal, phase I – CO2 storage and transport options and risks
85
the storage sites. Forests are largely predominant in the S. Pedro de Moel area and in parts of the S. Mamede selected area.
Environmental protected areas, tourism and cultural heritage sites;
Fig. 52 identifies five Environmental Protected Areas in the study area, but only one is within the cluster S05 zone of influence, the Serra de Aire and Candeeiros Natural Park, which covers about a third of S. Mamede storage site. This poses a considerable constraint to the development of surface activities within the area of the natural park.
Historical monuments or cultural heritage sites are also mapped in Fig. 52. These are areas of economic or social activity and two of them are among the most important Portuguese monuments, namely the Batalha Monastery (in the zone of influence of the S. Mamede storage site) and the
Fig. 51 – Characteristics and existing activities in the onshore cluster S05: Land use (COS 2010)

CCS Roadmap for Portugal, phase I – CO2 storage and transport options and risks
86
Alcobaça Monastery (in the zone of influence of the Alcobaça storage site). Concerns may arise because the pressure induced by injection of CO2 can cause uplift of ground surface, in the order of mm to cm. This needs to be considered carefully for older structures as national monuments.
Seismic surveys during the characterisation and monitoring phase need also to take into account the location of historical buildings to prevent any damage from induced vibration.
Mines and quarries
There no underground mines in the area of influence of cluster S05. Within the study area there four mining concessions (Table 26 and Fig. 48, page 81), two located in the S. Mamede potential storage area and another two in the Alcobaça selected areas. All four concessions are for exploitation of kaolin, white clay used in ceramics and paper industries. The exploitation method is through open-pit mining.
According to the DGEG database of licenses for mineral resources exploration, there is a further exploration license for a kaolin and quartz mine in the study area. Interaction between open-pit mines and CO2 storage can be conceived, for instance, through the effects that use of explosives in open-pit mines may have on the integrity of seal and reservoir. However, kaolin occurs in soft rocks and loose sediments, without the need to resort to explosives. Several quarries exist in the study area (Fig. 52).
Three of those quarries are located in the S. Mamede selected area and produce limestones, and are likely to resort to explosives. Due to the considerable depth of the reservoir it is not anticipated that the use of explosives at surface is a problem. However, its impact needs to be assessed in order to guarantee that no adverse effects result for the integrity of the reservoir and cap-rock. The quarries occurring in the Aljubarrota area are exploiting sands and are not likely to resort to explosives.
Fig. 52 – Characteristics and existing activities in the onshore cluster S05: Environmental protected areas, tourism and heritage sites.

CCS Roadmap for Portugal, phase I – CO2 storage and transport options and risks
87
4.2. OFFSHORE STORAGE Management of the maritime area has been the subject of recent regulatory activity, namely through Law 17/2014 (AR, 2014), which establishes the policy for the National Maritime Spatial Plan. Law 17/2014 defines the two planning tools that shall compose the spatial plans: i) Situation Plans, identifying the maritime protection and preservation sites and the current and potential uses and activities; ii) Allocation Plans, which will designate areas or volumes for different uses and activities. The Situation Plans are the central tools to identify possible constraints and synergies between CCS and other activities, and they are to be published in the six months following publication Law 17/2014. However, given the extensive work developed in recent years in the framework of the POEM - Plano de Ordenamento do Espaço Maritimo (POEM, 2012), and in the context of the Portuguese Ocean Strategy 2013-2020 (MAMAOT, 2012), which include an inventory of the existing and potential activities in the Portuguese Territorial sea and Exclusive Economic Zone, it is likely that the Situation Plans refer significantly to those documents, and thus we shall follow them in the remainder of this section.
The Ocean Strategy 2013-2020 describes the present and potential situation of 21 sectors/activities in the Portuguese extended Continental Shelf, but of these we shall focus only in those that are either active in the area of the offshore storage clusters or for which potential has been identified, namely:
• Preservation of nature and biodiversity; • Hydrocarbon exploration and exploitation; • Renewable Energies; • Nautical tourism; • Submarine cables; • Submarine cultural heritage • Military training and practice areas; • Commercial Fishing.
Preservation of nature and biodiversity
There are five designated Protected Areas defined fully or partly within the maritime waters of Portugal: Litoral Norte natural park; the Arrábida natural park; Berlengas natural reserve,; Santo André and Sancha lagoons natural reserves and Sudoeste Alentejano and Costa Vicentina natural park. The maritime sector of first three has been classified as maritime natural parks and maritime reserves, respectively, under Decree-law 142/2008.
Additionally, four Special Protection Zones under the Birds Directive (79/409/CEE) also include the coastal maritime waters (Berlengas, Cabo Espichel, Santo André and Sancha lagoons, Costa Sudoeste Ria Formosa). Finally, in accordance with the Habitats Directive (92/43/CEE), there are two further sites declared as of Community Importance that are partly delimited in maritime waters (Litoral Norte and Peniche/Santa Cruz).
None of these maritime protected areas are within the limits of the storage clusters, so that no major constraints are expected with respect to CO2 storage. Nevertheless, if offshore storage is planned for the S01 cluster in the Porto Basin, or cluster S42 in the Algarve, CO2 transport by pipeline needs to consider possible constraints imposed by the location of the Litoral Norte and of the Ria Formosa protected areas. The pipeline corridors presented in section 3.2.1 were already optimised in order to avoid those areas.

CCS Roadmap for Portugal, phase I – CO2 storage and transport options and risks
88
Although the storage clusters are not defined within the maritime protected areas, they partly enclose areas designated as of “Interest for preservation of nature and biodiversity” (Fig. 53), that is, areas with the potential to be considered in the future for some sort of protective framework under the Portuguese law. These areas do not impose, for the moment, particular constraints to CO2 storage activities, since they refer mostly to habitats within the water column, but future screening should consider any revision of the legal status of those areas. Obviously, CO2 storage activities should consider the proper environmental procedures and Environmental Impact Assessment, especially in relation to drilling and exploration activities, those that are likely to have the most relevant impact in those habitats. The European Directive 2010/477/UE, in its descriptor 11, and the Portuguese decree-laws DL108/2010 (MAOT, 2010), modified by DL136/2013 (MAM, 2013), refer specifically to the noise levels in the maritime environment as part of a Good Environmental Status. Although it is recognised that the scale of effects of underwater noise on marine animals is not fully understood, it is generally accepted that exposure to anthropogenic sound can induce a range of adverse effects on marine life. These range from insignificant impacts to significant behavioural changes and also include non-injurious type effects including masking of biologically relevant sound signals, such as communication signals (Genesis O&G, 2011). It is also known that the number of animals suffering injury through sound and the area in which this occurs are much smaller than the number of animals that show a behavioural change and the area in which this occurs (Van der Graaf et al., 2012).
The issue of underwater noise is of concern in the Portuguese continental shelf not only due to possible damage to fish, but also due to the migration of cetaceans along the limits of continental shelf, including whales, since the sound patterns used for communication between those mammals could potentially be affected by noise.
The sources of noise connected to CO2 storage are essentially the same as for the hydrocarbons exploration and exploitation. Seismic surveys, either during exploration phase or as monitoring tool, can be the source of impulse noise (through use of the air gun) in the course of campaigns that last for several days or weeks. The effects of that impulse noise on behavioural changes should be considered when planning the seismic surveys, and eventually operations conducted in the most favourable season (for instance to avoid cetaceans migrations, if possible) (IEAGHG, 2014).
During the drilling phases ambient noise is generated by the drilling rigs. Also, piling may be required to fix subsea structures into the seabed such as manifolds and platform legs. Platforms could also be a source of ambient noise, especially due to compressors. However the distance from the coast to the storage cluster is not large and the sensible approach is to consider onshore compression and measuring facilities, discarding the need for permanent platforms.
During the decommissioning phase if infrastructures are to be removed (such as wellheads and platform legs), explosives are often used when the structures that are firmly anchored or difficult to access using cutting methods (Genesis O&G, 2011).
Nevertheless, all these activities are conducted routinely by the oil and gas industry, and extensive research is being conducted on the effects of noise generated in those operations by stakeholders in the USA and Norway. The results of that research should be followed.
Synergies are possible between CO2 storage and the localised protection of the maritime environments. Ordinance 114/2014 from the Ministry of Agriculture and Sea (MAM, 2014), relates to seabed protection, namely to preventing deterioration of habitats due to bottom

CCS Roadmap for Portugal, phase I – CO2 storage and transport options and risks
89
trawling practices. The EU Directive 2010/477/UE also refers specifically to the need of preserving the integrity of the seabed and of maintaining its biodiversity, productivity and underlying ecologic processes. A synergy can be envisaged with CO2 storage, since seabed areas would have to be allocated specifically to injection and monitoring sites, in accordance with aforementioned Allocation Plans. In those wellhead protection areas bottom trawling would not be possible, to minimise the risk of damaging the wellheads. Thus, although initially affected by the drilling activities, those wellhead protection areas could later be developed as areas for preservation of the seabed and of biodiversity, with positive effects not only to the environment, but in the long term also to the fishing industry, since they would allow for the sustainable development of the fish populations.
Hydrocarbon exploration and exploitation
The focus of offshore hydrocarbon exploration in Portugal has shifted in recent years to the deep offshore (bathymetry>200m), and most of the existing offshore concessions are not within the limits of the CO2 storage clusters. Nevertheless, within the area of clusters S03 and S04 (north Lusitanian basin), two oil exploration concessions exist; the Cabo Mondego 2 and the S. Pedro de Moel 2 concessions, both run by Mohave Oil& Gas, and with approved management plans, including 3-D seismic surveys and eventually drilling of deep wells. Additionally, in the Algarve basin, natural gas and oil exploration efforts are ongoing, with the areas of clusters S07 and S42 including partially two concessions; the Lagostim and Lagosta concession, both held by a Repsol/Partex consortium, and another two areas being directly negotiated with the same consortium (Fig. 53). Potential conflicts and synergies with oil and gas exploration activities are similar to those found onshore (see section 4.1.1)., and should be considered for all offshore clusters, since although there is currently no concessions coinciding with clusters S01, S02 and S06, those areas have previously been the target of exploration activities, and could, in the future, become again of interest for oil and gas companies.
Renewable Energies
Energy from waves and offshore wind farms are seen as potential renewable energy sources in Portuguese maritime waters, the former with estimated theoretical potential up to 11,3 GW and the latter with theoretical potential up to 40 GW for floating platforms (MAMAOT, 2012). Currently, there are no commercial scale facilities, but a pilot-scale energy from wave’s facility exists within the area of storage cluster S04, in S. Pedro de Moel (Fig. 53), for which a installed capacity of 250 MW is envisaged by 2020. It is not likely that constraints will arise to CO2 exploration activities, except for pipeline infrastructures, that should consider the location of that concession in the planning stages. There are no commercial or pilot-scale wind farms within the area of the CO2 storage clusters, but since the prospects for offshore wind farms are high, particularly for floating platforms, it is possible that in the future those structures are considered for any of the storage clusters, with the largest probability of clusters S01 to S04 since they are located in the area with the largest offshore wind potential (MAMAOT, 2012). Although conflicts with CO2 storage sites are unlikely, careful planning is necessary since wind platforms include associated submarine power cables, and anchoring systems.
CCS Roadmap for Portugal, phase I – CO2 storage and transport options and risks
90
Submarine cables
Transcontinental communication submarine cables occur within the area of the cluster S06 (Fig. 53), and if commercial scale offshore wind farms develop, other submarine cables will be added to the existing network, possibly affecting other storage clusters. No particular conflicts and synergies are likely to occur with CO2 storage activities, other than considering their location at the planning stages.
Nautical tourism
Tourism related to nautical sports, such as the practice of bodyboard, surf, windsurf, diving, and so on, either for leisure or for competition purposes, is perceived in many coastal municipalities as activities of investment and revenue. Most of those sports are usually restricted to the coastal areas and are not likely to impose direct constraints to offshore storage activities, although the planning of transport routes by pipeline should consider the potential for those nautical sports. Nautical tourism connected to cruises has seen major increases in the main harbours of Portugal, most notably in Lisbon. No significant constraints are expected for CO2 storage activities, although the planning of seismic surveys for exploration or monitoring purposes may consider the seasonal distribution of that nautical tourism (Fig. 53).
Since coastal tourism is a major source of income for Portugal, and specifically for the Algarve, it is more probable that conflicts arise if offshore storage is done through platforms, either for CO2 compressing or controlling purposes. Given that the distance from the coast to the storage clusters is relatively small, the technical viability of conducting the injection from wellhead at the sea-bottom, with compression done only at the onshore facilities, as occurs in Snohvit, should be considered.
Submarine cultural heritage
Submarine cultural heritage sites, such as sunk ships and diving places, are identified in POEM (2012), and three of those sites occur within the S07 cluster boundaries (Fig. 53). However, the size of those areas is very small and conflicts can be easily avoided in the planning stages of CO2 storage activities.
Military training and practice areas
Most of the southern part of Portuguese is used for military navy training and practice purposes, including the entire area of clusters S06, S07 and S42 (Fig. 53). No conflicts or synergies are expected with CO2 storage activities, except when training and practice events are taking place, in which case CO2 storage activities such as seismic surveys will need to be coordinated with the military.
Commercial Fishing
The maritime waters of mainland Portugal are within a zone of transition to warmer ecosystems, which has limited the productive of the fishing sector, with a large diversity of captured species, but low abundance. Thus, viability of the commercial fishing sector requires activity in all the shallow platform (MAMAOT, 2012), therefore including the area of storage clusters. Specifically

CCS Roadmap for Portugal, phase I – CO2 storage and transport options and risks
91
the trawling fishing boats operate always beyond 6 miles distance from the coast, along the entire continental shelf when targeting fish, and along the Alentejo and Algarve coast, at water depths above 150m, when targeting crustaceans (Fig. 53).
Conflicts may arise during the reservoir characterisation (pre-operation) and during the monitoring phase when seismic surveys are expected to be conducted in areas some km2 size, and lasting for a few days to weeks. Fishing activities, namely trawling fishing, are necessarily restricted during those surveys, as occurs during oil exploration seismic surveys. This conflict can, however, be overcome with negotiation between the interested parties, such has been the case for recent 3-D seismic surveys conducted by the oil industry.
Bottom trawling would have to be restricted in the area surrounding the injection wellhead and along pipes connecting the wellhead to the onshore facilities, decreasing, even if in an insignificant proportion, the total bottom trawling area. Nevertheless, and as explained previously, the implementation of these fishing restrictions can be an added value for the fishing industry itself, since those areas could be planned for protection of seabed ecosystems and sustainable development of juvenile populations. Therefore, if properly explained and framed within the context of Ordinance 114/2014 and EU Directive 2010/477/UE, this potential conflict can be overcome.
4.3. SUMMARY OF CONFLICTS AND SYNERGIES
Table 27 summarises the synergies and constraints with ongoing activities in the target areas for CO2 storage, both onshore and offshore.
Overall the most important constraint in the onshore cluster S05 is the existence of a natural park covering part of the S. Mamede selected area, imposing serious limitations to surface activities. Choice of potential injection sites in this onshore cluster needs not only to consider the location of the natural park, but also the population density and land use distribution, since those vary considerably in the several municipalities interested by the onshore cluster, with more favourable conditions found in the S. Pedro de Moel selected area. Under constraint in the onshore cluster refers to the relevance of shallow aquifers for groundwater supply and the existence of hot springs and mineral groundwater potential. These are, however, issues that should not give rise to conflicts as long as they are properly managed with the regulating authorities. Synergies in the onshore cluster are mainly associated with the ongoing hydrocarbon explorations efforts, which could provide invaluable data to characterise the CO2 storage reservoir and cap-rock.
Offshore the most relevant conflicts are likely to be connected to restriction of fishing activities during drilling and seismic surveys, as well as the restriction to bottom trawling fishing practices in the immediate vicinity of the well-head. Furthermore, although none of the existing maritime protected areas are affected by offshore clusters, it is inevitable that localised impacts occur for the conservation of biodiversity and nature at the seabed during the drilling stages. These should not be conflicting issues for CO2 storage activities as long as the proper environmental practices are ensured and regulating authorities are engaged. Interesting synergies with the protection of biodiversity can result if planning is made to manage the wellhead protection areas as an opportunity to protect the seabed ecosystems from the negative effect of excessive bottom trawling fishing, in accordance with recent regulations issued by the Portuguese government.

CCS Roadmap for Portugal, phase I – CO2 storage and transport options and risks
92
Fig. 53 – Map with existing offshore activities (according to POEM (2012).

CCS Roadmap for Portugal, phase I – CO2 storage and transport options and risks
93
Table 27 – Summary of identified conflicts and synergies.
Characteristic / Activity
Storage cluster Synergies and/or positive features Conflicts and /or negative features
Population density S05
Very low population density in the S. Pedro de Moel, Alvorninha and parts of the S. Mamede selected areas.
Population density in the Alcobaça storage site is above the national average. Also the northern part of the S. Mamede site includes some important urban centres, such as Leiria and Batalha. Concerns about safety and property devaluation may arise. Exploration and monitoring activities may raise issues about damage to property.
Soil use and cover S05
Forests and grassland are the main land uses. Forests cover more than 90% in the S. Pedro de Moel area. Vast parts of the S. Mamede area are entirely covered by grassland. Instead of large urban centres, there are many scattered low density populated places in the Alcobaça, Alvorninha and parts of the S. Mamede selected areas.
Although agriculture is not the main land use, there may be issues about surface activities for exploration, drilling and monitoring and possible damage to agriculture. This could be easily solved with proper negotiation.
Environmental protected areas, tourism and heritage sites
S05
No anticipated synergies. About 1/3 of the S. Mamede site is part of the Serra de Aire e Candeeiros Natural park, imposing many constraints to surface activities and installations. Important national monuments occur in the Alcobaça and Batalha Municipalities, increasing concerns about land surface rising due to pressure increases.
Mines and quarries S05
No deep mines exist, but data from previous exploration efforts can be useful for a detailed description of near surface geology.
Limestone quarries in the S. Mamede area will likely resort to explosives, the effect of which in the reservoir and cap-rock integrity needs to be studied.
Groundwater resources
S05
No groundwater wells are deep enough to reach the reservoir or even the cap-rock, so there is no potential for leakage along existing or abandoned wells. Groundwater wells can be useful for a detailed description of near surface geology, understanding the regional groundwater flow conditions and provide access to aquifers for monitoring activities.
Drilling across the freshwater aquifers may raise concerns about increased risk for contamination of aquifers used for public water supply, either by CO2 or brine leaks. This issue can be overcome through coordination with the groundwater regulating authority.

CCS Roadmap for Portugal, phase I – CO2 storage and transport options and risks
94
Characteristic / Activity
Storage cluster Synergies and/or positive features Conflicts and /or negative features
Mineral groundwater, groundwater springs and geothermal resources
S05
There is a very small number of thermal groundwater uses in the study area. Information from hydrogeology and geology studies about those occurrences is important to understand the deep groundwater flow conditions.
It is necessary to study if pressures induced by CO2 injection may propagate to shallower flow systems and induce changes in the flow conditions that originate the thermal springs.
Natural gas storage -
There is no natural gas storage in the area, but the experience with the existing natural gas storage a few kilometres north from the S. Pedro de Moel site is useful for engaging with local communities and for understating the geology of the cap-rock. The knowledge about the geology of the Dagorda formation is relevant to understand its behaviour as a cap-rock for the reservoir.
No anticipated conflicts.
Conventional and unconventional hydrocarbons exploration
S05, S07, S42
All storage sites in clusters S05 and S07, and part of the sites in cluster S42, are within oil exploration concessions. Recent and ongoing seismic surveys and deep well drilling are of great value to understand the deep geology. Recent 3-D seismic surveys in the Alcobaça site and just offshore from the S. Pedro de Moel site are invaluable to understand the structure of the reservoir and cap-rock, as is the drilled Alcobaça-1. Should oil resources be found in the pre-salt reservoir, late stages of the oil exploitation could benefit from the use of CO2 for EOR purposes.
Oil or gas discoveries within the area of the storage clusters would make CO2 storage unfeasible in the same reservoirs. Unconventional hydrocarbons exploration aims at the Brenha formation, overlying the cap-rock in the Alvorninha, S. Pedro de Moel and Alcobaça sites. Should shale gas or shale oil exploitation become a reality in those sites, the effect of fracking to the integrity of the cap-rock underlying the Brenha Formation needs to be assessed
Conservation of biodiversity and nature
S01, S02, S03, S04, S06, S07,
S42
Synergies can be achieved if restrictions necessary to protect the wellheads and pipelines are seen as an opportunity to protect seabed ecosystems and species.
The local impact of wellheads and pipes in the seabed needs to take into consideration the biodiversity and nature conditions at sea-bottom. Drilling activities will have an impact, namely through turbidity and drilling residues. During the exploration and monitoring stages, periodic seismic surveys will require mobilising many seismic receivers and a vibration source. Noise connected to drilling and seismic surveys can be a concern due to potential behavioural changes in migrating cetaceans.
Submarine cultural heritage
No anticipated synergies. No relevant conflicts. Protected areas are localised and conflicts can be avoided by proper location of wellheads and pipes.
Fishing
S01, S02, S03, S04, S06, S07,
S42
No anticipated synergies, but in the long-term.the protection of ecosystems linked to wellhead protection areas can have a positive impact to the fishing sector.
Public acceptance issues need to consider the existence of trawling fishing areas potentially affected by the location of the wellhead and pipes. Periodic seismic surveys for exploration or monitoring will impact the fishing activities.

CCS Roadmap for Portugal, phase I – CO2 storage and transport options and risks
95
Characteristic / Activity
Storage cluster Synergies and/or positive features Conflicts and /or negative features
Military training and practice areas
S06, S07, S42
No anticipated synergies. No relevant conflicts. Periodic seismic surveys for exploration or monitoring will need to be coordinated with military authorities , in order not to coincide with military training events.
Nautical tourism
S01, S02, S03, S04, S06, S07,
S42
No anticipated synergies. No major conflicts. Periodic seismic surveys for exploration or monitoring could impose local constraints to nautical tourism for the duration of the surveys.
Submarine cables S06, S07 No anticipated synergies. No relevant conflicts. Offshore CO2 injection
infrastructures need to consider the location of cables to avoid damage.
Renewable energies S04
No anticipated synergies. No relevant conflicts. There is a concession for generating energy from waves at the eastern limit of the S04 cluster, which may pose conflicts for CO2 pipeline routing. If offshore wind farms will be deployed, the required cables and structures need to be considered during the planning of CO2 storage activities.

CCS Roadmap for Portugal, phase I – CO2 storage and transport options and risks
96
REFERENCES Almeida, C.A., Mendonça, J.L., Jesus, M.R., Gomes, A.J., 2000. Actualização do Inventário dos Sistemas Aquíferos de Portugal Continental. INAG, Lisbon.
Alves, T.M., Gawthorpe, R.L., Hunt, D.W., Monteiro, J.H., 2003. Post-Jurassic tectono-sedimentary evolution of the Northern Lusitanian Basin (Western Iberian margin). Basin Research 15, 227-249.
Alves, T.M., Moita, C., Cunha, T., Ullnaess, M., Myklebust, R., Monteiro, J.H., Manuppella, G., 2009. Diachronous evolution of Late Jurassic-Cretaceous continental rifting in the northeast Atlantic (west Iberian margin). Tectonics 28.
AR, 2014. Lei 17/2014. Bases da Política de Ordenamento e Gestão do Espaço Maritimo.
ASME, 2002. ASME B31.4 - Pipelines transporting liquid hydrocarbons.
ASME, 2010. ASME B31.8S - Managing system integrity of gas pipelines
Bachu, S., 2000. Sequestration of CO2 in geological media: criteria and approach for site selection in response to climate change. Energy Conversion and Management 41, 953-970.
Bachu, S., 2003. Screening and ranking of sedimentary basins for sequestration of CO2 in geological media in response to climate change. Environmental Geology 44, 277-289.
Bergmo, P.E.S., Grimstad, A.-A., Lindeberg, E., 2011. Simultaneous CO2 injection and water production to optimise aquifer storage capacity. Int J Greenh Gas Con 5, 555-564.
Bernardes, L.F., Carneiro, J., de Abreu, M.P., 2013. CO2 hydrates as a climate change mitigation strategy: definition of stability zones in the Portuguese deep offshore. Int J Global Warm 5, 135-151.
Bezzeghoud, M., Borges, J., Caldeira, B., 2012. Fontes sísmicas ao longo da fronteira de placas tectónicas entre os Açores e a Argélia: um modelo sismotectónico. , in: Dias, R., Araújo, A., Terrinha, P., Kullberg, J.C. (Eds.), Geologia de Portuga. Escolar Editora, pp. 747-790.
Boavida, D., Carneiro, J., Martinez, R., van den Broek, M., Ramirez, A., Rimi, A., Tosato, G., Gastine, M., 2013. Planning CCS Development in the West Mediterranean. Energy Procedia 37, 3212-3220.
Calado, C., Brandão, J.M., 2009. Salinas interiores em Portugal.pdf. Geonovas, 45-54.
Cavanagh, A.J., Haszeldine, R.S., Blunt, M.J., 2010. Open or closed? A discussion of the mistaken assumptions in the Economides pressure analysis of carbon sequestration. J Petrol Sci Eng 74, 107-110.
CEN/TS, 2006a. CEN/TS 15173:2006 - Gas supply systems. Frame of reference regarding pipeline integrity management systems (PIMS).
CEN/TS, 2006b. CEN/TS 15174:2006 - Gas supply systems. Guidelines for safety management for natural gas transmission pipelines.
Chadwick, R.A., Arts, R., Bernstone, C., May, F., Thibeau, S., Zweigel, P., 2008. Best practice for the storage of CO2in saline aquifers : observations and guidelines from the SACS and CO2STORE projects, British Geological Survey occasional publication. British Geological Survey, Keyworth, pp. iv, 267 p.
Cleaver, P., Hopkins, H.P., 2012. The application of individual and societal risk assessment to CO2 pipelines. Journal of Pipeline Engineering 11, 191-199.
CO2CRC, 2008. Storage Capacity Estimation, Site Selection and Characterisation for CO2 Storage Projects. Cooperative Research Centre for Greenhouse Gas Technologies,, Canberra, p. 52.
CO2EUROPIPE, 2011. CO2Europipe-Towards a transport infrastructure for large-scale CCS in Europe. D3.2.1 WP3.2 Societal and Environmental Aspects CO2 transport through pipelines: risk characterization and management.
Cooper, H.H., Jacobs, C.E., 1946. A Generalized Graphical Method of Evaluating Formation Constants and Summarizing Well-field History. U.S. Department of the Interior, Geological Survey, Water Resources Division, Ground Water Branch.
CSLF, 2007. Phase II Final Report from the Task Force for Review and Identification of Standards for CO2 Storage Capacity Measurement.
Delprat-Jannaud, F., Korre, A., McConnel, B., 2013. State of the art review of CO2 Storage Site Selection Methods, p. 116.
Dentz, M., Tartakovsky, D.M., 2009. Abrupt-Interface Solution for Carbon Dioxide Injection into Porous Media. Transport in Porous Media 79, 15-27.
DNV, 2010a. CO2QUALSTORE Workbook with Examples of Applications, p. 110.
DNV, 2010b. Recommended practice Det Norske Veritas DNV-rp-j202. Design and operation of CO2 pipelines.
DNV, 2011. Safety study for liquid logistics shipping concept. DNV, Rotterdam, p. 128.

CCS Roadmap for Portugal, phase I – CO2 storage and transport options and risks
97
DNV, 2012. Offshore standard DET NORSKE VERITAS AS DNV-OS-F101. Submarine Pipeline Systems.
DOT–PHMSA, 2013. U.S. Department of Transportation – Pipeline & Hazardous Materials Safety Administration. All Reported Pipeline Incidents.
EC, 2009. Directive 2009/31/EC of the European Parliament and of the Council on the geological storage of carbon dioxide and amending Council Directives 85/337/EEC, 96/61/EC, Directives 2000/60/EC, 2001/80/EC, 2004/35/EC, 2006/12/EC and Regulation (EC) No 1013/2006., Official Journal of the European Union, L140 (5.6.2009).
EC, 2011. Implementation of Directive 2009/31/EC on the Geological Storage of Carbon Dioxide Guidance Document 1. CO2 Storage Life Cycle Risk Management Framework.
EGIG, 2011. EGIG (European Gas pipeline Incident data Group). Gas Pipeline Incidents. 8th Report of the European Gas pipeline Incident data Group. Doc. Number EGIG 11.R.0402 (version 2).
Ehlig-Economides, C., Economides, M.J., 2010. Sequestering carbon dioxide in a closed underground volume. J Petrol Sci Eng 70, 123-130.
EN, 2009. EN 1594/2009 - Gas supply systems - Pipelines for maximum operating pressure over 16 bar.
EN, 2011. EN 14161:2011 Petroleum and natural gas industries. Pipeline transportation systems.
Energy Institute, 2010. Technical guidance on hazard analysis for onshore carbon capture installations and onshore pipelines. Energy Institute London, p. 95.
Genesis O&G, 2011. Review and Assessment of Underwater Sound Produced from Oil and Gas Sound Activities and Potential Reporting Requirements under the Marine Strategy Framework Directive., p. 72.
Geske, J., Berghout, N., 2012. Assessment of alternative developments of CO2 transport infrastructure in the West Mediterranean region: shipping and integration with West European CO2 infrastructure. COMET technical note TN6.2, p. 173 pp.
Goodman, A., Hakala, A., Bromhal, G., Deel, D., Rodosta, T., Frailey, S., Small, M., Allen, D., Romanov, V., Fazio, J., Huerta, N., McIntyre, D., Kutchko, B., Guthrie, G., 2011. U.S. DOE methodology for the development of geologic storage potential for carbon dioxide at the national and regional scale. Int J Greenh Gas Con 5, 952-965.
Grandin, R., Borges, J.F., Bezzeghoud, M., Caldeira, B., Carrilho, F., 2007a. Simulations of strong ground motion in SW Iberia for the 1969 February 28 (M-s=8.0) and the 1755 November 1 (M similar to 8.5) earthquakes - II. Strong ground motion simulations. Geophysical Journal International 171, 807-822.
Grandin, R., Borges, J.F., Bezzeghoud, M., Caldeira, B., Carrilho, F., 2007b. Simulations of strong ground motion in SW Iberia for the 1969 February 28 (M(s)=8.0) and the 1755 November 1 (M similar to 8.5) earthquakes - I. Velocity model. Geophysical Journal International 171, 1144-1161.
Gutscher, M.A., Dominguez, S., Westbrook, G.K., Le Roy, P., Rosas, F., Duarte, J.C., Terrinha, P., Miranda, J.M., Graindorge, D., Gailler, A., Sallares, V., Bartolome, R., 2012. The Gibraltar subduction: A decade of new geophysical data. Tectonophysics 574, 72-91.
Hayward, N., Watts, A.B., Westbrook, G.K., Collier, J.S., 1999. A seismic reflection and GLORIA study of compressional deformation in the Gorringe Bank region, eastern North Atlantic. Geophysical Journal International 138, 831-850.
HSE, 2000. HSE paper Assessment of the dangerous toxic load (DTL) for specific level of toxicity (SLOT) and significant likelihood of death (SLOD). .
HSE, 2009. RR749 study Comparison of Risks from carbon dioxide and natural gas pipelines.
IEAGHG, 2014. Comparing different approaches to managing CO2 storage resources in mature CCS futures, p. 176.
Instituto Português da Qualidade, 2000. Eurocódigo 8: Projecto de estruturas para resistência aos sismos, Lisbon, p. 34+42.
ISO, 2000. ISO 13623 – Petroleum and Natural Gas industries – Pipeline transportation Systems.
Kullberg, J.C., 2000. Evolução tectónica mesozóica da Bacia Lusitaniana. Universidade Nova de Lisboa, Lisbon, p. 361.
Kullberg, J.C., Rocha, R., Soares, A.F., Rey, J., Terrinha, P., Callapez, P., Martins, L., 2006. A Bacia Lusitaniana: Estratigrafia, Paleogeografia e Tectónica, in: Dias, R., Araújo, A., Terrinha, P., Kullberg, J.C. (Eds.), Geologia de Portugal no Contexto da Ibéria. Universidade de Évora, 418 pp. Universidade de Évora, Évora, pp. 317-368.
Lemos de Sousa, M., Correia da Silva, Z.C., Miranda, A., Rodrigues, C.F., 2007. The COSEQ pilot project: CO2 Sequestration in Douro coalfield meta-anthracites (NW Portugal), International Seminar on Perspectives for Near-Term CCS Deployment & Capacity Building for Emerging Economies, Porto Alegre, Brasil.
Li, Q., Liu, G., Liu, X., Li, X., 2013. Application of a health, safety, and environmental screening and ranking framework to the Shenhua CCS project. Int J Greenh Gas Con 17, 504-514.
Lindeberg, E., Vuillaume, J.-F., Ghaderi, A., 2009. Determination of the CO2 storage capacity of the Utsira formation. Energy Procedia 1, 2777-2784.

CCS Roadmap for Portugal, phase I – CO2 storage and transport options and risks
98
Lopes, F.C., Cunha, P.P., Le Gall, B., 2006. Cenozoic seismic stratigraphy and tectonic evolution of the Algarve margin (offshore Portugal, southwestern Iberian Peninsula). Marine Geology 231, 1-36.
Lourenço, M.C., 1998. Recursos Geotérmicos de Baixa Entalpia em Portugal Continental, 4º Congresso da Água, Lisbon.
MAM, 2013. Decreto-lei 136_2013.
MAM, 2014. Portaria n.º 114/2014.
MAMAOT, 2012. Estratégia Marinha para a subdivisão do Continente. Diretiva Quadro Estratégia Marinha. Ministério da Agricultura, do Mar, do Ambiente e do Ordenamento do Território., p. 930.
MAOT, 2010. Decreto-lei 108/2010.
Martínez, R., 2013. WP4 final report. COMET deliverable 3.4., p. 269 pp.
Martínez, R., Suárez, I., Le Nindre, Y.M., 2010. Site selection criteria. COMET deliverable 3.1., p. 10 pp.
Martinho, A.A.M., Duque, J., Chambel, A., Orlando, M., 2006. Hydrogeology of continental Portugal. Boletín geológico y minero 117, 163-185.
Mathias, S., Hardisty, P., Trudell, M., Zimmerman, R., 2009. Approximate Solutions for Pressure Buildup During CO2 Injection in Brine Aquifers. Transport in Porous Media 79, 265-284.
Matias, H., 2007. Hydrocarbon Potential of the Offshore Algarve Basin, Department of Physics. University of Lisbon, Lisbon, p. 324.
MEE, 2012. Decreto Lei L 60/2012, Diário da República, 1.ª série — N.º 53.
Metz, B., Davidson, O., de Coninck, H.C., Loos, M., Meyer, L.A., 2005. IPCC Special Report on Carbon Dioxide Capture and Storage Cambridge University Press.
Montilla, J.A.P., Casado, C.L., 2002. Seismic hazard estimate at the Iberian Peninsula. Pure Appl Geophys 159, 2699-2713.
Moreira, V.S., 1991. Historical Seismicity and seismotectonics of the area situated between the Iberian Peninsula, Morrocco, Selvagens and Azores Islands, in: IGN (Ed.), Seismicity, Seismotectonic and Seismic Risk of the Ibero-Magrebian Region. IGN, Madrid, pp. 213-225.
NETL, 2013. Risk Analysis and Simulation for Geologic Storage of CO2., p. 86.
Nordbotten, J.M., Celia, M.A., Bachu, S., 2005. Injection and storage of CO2 in deep saline aquifers: Analytical solution for CO2 plume evolution during injection. Transport in Porous Media 58, 339-360.
NORSOK, 2001. NORSOK standard Z-013 – Risk and emergency preparedness analysis.
Oldenburg, C.M., 2008. Screening and ranking framework for geologic CO2 storage site selection on the basis of health, safety, and environmental risk. Environmental Geology 54, 1687-1694.
Pereira, N., Araújo, A., Bezzeghoud, M., Borges, J., Carneiro, J., Correia, A., Mirão, J., 2011. Identification of CO2 storage opportunities in the onshore sector of the Lusitanian basin, Portugal. , 5th Post-graduate meeting on Research and Teaching in Physical and Earth Sciences, Évora, Portugal.
Pereira, N., Carneiro, J.F., Araújo, A., Bezzeghoud, M., Borges, J., 2014. Seismic and structural geology constraints to the selection of CO2 storage sites—The case of the onshore Lusitanian basin, Portugal. J Appl Geophys 102, 21-38.
Pinheiro, L.M., Wilson, R.C.L., Pena dos Reis, R., Whitmarsh, R.B., Ribeiro, A., 1996. The western Iberia margin: a geophysical and geological overview, in: Whitmarsh, R.B., Sawyer, D.S., Klaus, A., Masson, D.G. (Eds.), Proceedings of the Ocean Drilling Program, Scientific Results, pp. 3-23.
POEM, 2012. Plano de Ordenamento do Espaço Maritimo. http://www.dgpm.mam.gov.pt/Pages/POEM_PlanoDeOrdenamentoDoEspacoMarinho.aspx, Lisbon.
Pro, C., Buforn, E., Bezzeghoud, M., Udias, A., 2013. The earthquakes of 29 July 2003, 12 February 2007, and 17 December 2009 in the region of Cape Saint Vincent (SW Iberia) and their relation with the 1755 Lisbon earthquake. Tectonophysics 583, 16-27.
Pruess, K., 2005. ECO2N: a TOUGH2 fluid property module for mixtures of water, NaCl, and CO2. Lawrence Berkeley National Laboratory, Berkeley, CA, p. 76.
Pruess, K., Oldenburg, C., Moridis, G., 1999. TOUGH2 User's Guide, Version 2.0. Lawrence Berkeley National Laboratory, Berkeley, CA, p. 210.
Pruess, K., Spycher, N., 2007. ECO2N - A fluid property module for the TOUGH2 code for studies of CO2 storage in saline aquifers. Energy Conversion and Management 48, 1761-1767.
Rasmussen, E.S., Lomholt, S., Andersen, C., Vejbæk, O.V., 1998. Aspects of the structural evolution of the Lusitanian Basin in Portugal and the shelf and slope area offshore Portugal. Tectonophysics 300, 199-225.
Ribeiro, A., Silva, J.B., Cabral, J., Terrinha, P., Kullberg, M.C., Kullberg, J.C., Phipps, S., 1996. Tectonics of the Lusitanian Basin, C. E. C. Project MILUPOBAS, Contract nº JOU2-CT94-0348, Lisbon, p. 126.

CCS Roadmap for Portugal, phase I – CO2 storage and transport options and risks
99
Sartori, R., Torelli, L., Zitellini, N., Peis, D., Lodolo, E., 1994. Eastern Segment of the Azores-Gibraltar Line (Central-Eastern Atlantic) - an Oceanic Plate Boundary with Diffuse Compressional Deformation. Geology 22, 555-558.
Sousa, M.L., Martins, A., Oliveira, C.S., 1992. Compilação de catálogos sísmicos da região Ibérica, in: LNEC (Ed.). LNEC, Lisbon.
Strachan, N., Hoefnagels, R., Ramírez, A., van den Broek, M., Fidje, A., Espegren, K., Seljom, P., Blesl, M., Kober, T., Grohnheit, P.E., 2011. CCS in the North Sea region: A comparison on the cost-effectiveness of storing CO2 in the Utsira formation at regional and national scales. Int J Greenh Gas Con 5, 1517-1532.
Terrinha, P., Rocha, R., Rey, J., Cachão, M., Moura, D., Roque, C., Martins, L., Valadares, V., Cabral, J., Azevedo, M.R., Barbero, L., Clavijo, E., Dias, R.P., Gafeira, J., Matias, H., Matias, L., Madeira, J., Marques da Silva, C., Munhá, J., Rebêlo, L., Ribeiro, C., Vicente, J., Youbi, N., 2006. A Bacia Algarvia: Estratigrafia, paleogeografia e tectónica, in: Dias, R., Araújo, A., Terrinha, P., Kullberg, J.C. (Eds.), Geologia de Portugal no Contexto da Ibéria. Universidade de Évora, 418 pp. Universidade de Évora, Évora, pp. 247-316.
Teves-Costa, P., Borges, J.F., Rio, I., Ribeiro, R., Marreiros, C., 1999. Source parameters of old earthquakes: Semi-automatic digitization of analog records and seismic moment assessment. Nat Hazards 19, 205-220.
Tortella, D., Torne, M., PerezEstaun, A., 1997. Geodynamic evolution of the eastern segment of the Azores-Gibraltar zone: The Gorringe Bank and the Gulf of Cadiz region. Mar Geophys Res 19, 211-230.
UKOPA, 2013. UKOPA United Kingdom Onshore Pipeline Operator’s Association. UKOPA Pipeline Product Loss Incidents and Faults Report (1962-2012).
van den Broek, M., Boavida, D., Cabal, H., Carneiro, J., Fortes, P., Gouveia, J., Labriet, M., Lechón, Y., Martinez, R., Mesquita, P., Seixas, J.M., Tosato, G., Zarhloule, Y., 2013a. Report with selection of most promising CCS infrastructure options. COMET technical note TN6.4, p. 173 pp.
van den Broek, M., Mesquita, P., Carneiro, J., Silva, J.R., Berghout, N., Ramírez, A., Gouveia, J.P., Seixas, J., Cabal, H., Martinez, R., Rimi, A., Zarhloule, Y., Sardinha, M., Boavida, D., Tosato, G., 2013b. Region Specific Challenges of a CO2 Pipeline Infrastructure in the West Mediterranean Area Model Results Versus Stakeholder Views. Energy Procedia 37, 3137-3146.
van den Broek, M., Ramirez, A., Groenenberg, H., Neele, F., Viebahn, P., Turkenburg, W., Faaij, A., 2010. Feasibility of storing CO2 in the Utsira formation as part of a long term Dutch CCS strategy An evaluation based on a GIS/MARKAL toolbox. Int J Greenh Gas Con 4, 351-366.
Van der Graaf, A.J., Ainslie, M.A., André, M., Brensing, K., Dalen, J., Dekeling, R.P.A., Robinson, S., Tasker, M.L., Thomsen, F., Werner, S., 2012. European Marine Strategy Framework Directive Good Environmental Status (MSFD-GES). Report of the Technical Subgroup on Underwater Noise and other forms of energy. , Brussels, p. 75.
Vangkilde-Pedersen, T., Anthonsen, K.L., Smith, N., Kirk, K., Neele, F., van der Meer, B., Le Gallo, Y., Bossie-Codreanu, D., Wojcicki, A., Le Nindre, Y.M., Hendriks, C., Dalhoff, F., Christensen, N.P., 2009. Assessing European capacity for geological storage of carbon dioxide - the EU GeoCapacity project, in: Gale, J., Herzog, H., Braitsch, J. (Eds.), Greenhouse Gas Control Technologies 9, pp. 2663-2670.
Vilarrasa, V., Bolster, D., Olivella, S., Carrera, J., 2010. Coupled hydromechanical modeling of CO2 sequestration in deep saline aquifers. Int J Greenh Gas Con 4, 910-919.
Wilson, R.C.L., 1988. Mesozoic development of the Lusitanian Basin, Portugal,. Revista de la Sociedad Geológica de Espana 1, 393–407.
Yale, D.P., Nabor, G.W., Russell, J.A., Pham, H.D., Yousef, M., 1993. Application of Variable Formation Compressibility for Improved Reservoir Analysis, 68th Annual Technical Conference and Exhibition of the Society of Petroleum Engineers. Society of Petroleum Engineers, Inc. , Houston, Texas, pp. 435-450.
ZEP, 2011a. The costs of CO2 storage, Brussels, p. 42.
ZEP, 2011b. The costs of CO2 transport. 53.
Zitellini, N., Gracia, E., Matias, L., Terrinha, P., Abreu, M.A., DeAlteriis, G., Henriet, J.P., Danobeitia, J.J., Masson, D.G., Mulder, T., Ramella, R., Somoza, L., Diez, S., 2009. The quest for the Africa-Eurasia plate boundary west of the Strait of Gibraltar. Earth and Planetary Science Letters 280, 13-50.
Zitellini, N., Mendes, L.A., Cordoba, D., Danobeitia, J., Nicolich, R., Pellis, G., Ribeiro, A., Sartori, R., Torelli, L., Bartolome, R., Bortoluzzi, G., Calafato, A., Carrilho, F., Casoni, L., Chierici, F., Corela, C., Correggiari, A., Vedova, B.D., Gracia, E., Jornet, P., Landuzzi, M., Ligi, M., Magagnoli, A., Marozzi, G., Matias, L., Penitenti, D., Rodriguez, P., Rovere, M., Terrinha, P., Vigliotti, L., Ruiz, A.Z., 2001. Source of 1755 Lisbon earthquake and tsunami investigated. Eos, Transactions American Geophysical Union 82, 285-291.

CCS Roadmap for Portugal, phase I – CO2 storage and transport options and risks
APPENDIX A - Database for estimating storage capacity in the selected areas and basin.

A-I
Database for estimating storage capacity in the selected areas and basin.
Area Reservoir Depth (m)
A (km2) h (m) NG (-) φ (-) Seff (%) T (ºC) P (MPa) ρCO2r
(kg/m3) MCO2
(Mt CO2)
Port
o ba
sin
Porto_A1 420 420 420 420 420 420 420 420 420 420 420 Porto_A2 510 510 510 510 510 510 510 510 510 510 510 Porto_A3 170 170 170 170 170 170 170 170 170 170 170 Porto_A4 80 80 80 80 80 80 80 80 80 80 80 Porto_A5 50 50 50 50 50 50 50 50 50 50 50 Porto_A6 190 190 190 190 190 190 190 190 190 190 190 Porto_A7 380 380 380 380 380 380 380 380 380 380 380 Porto_A8 170 170 170 170 170 170 170 170 170 170 170 Porto_B1 130 130 130 130 130 130 130 130 130 130 130
Porto Basin storage capacity (Mt CO2) 2100
Lusit
ania
n ba
sin
N_Lusitanian_A1 600 600 600 600 600 600 600 600 600 600 600 N_Lusitanian_A2 320 320 320 320 320 320 320 320 320 320 320 N_Lusitanian_A3 330 330 330 330 330 330 330 330 330 330 330 N_Lusitanian_A4 210 210 210 210 210 210 210 210 210 210 210 N_Lusitanian_A5 160 160 160 160 160 160 160 160 160 160 160 N_Lusitanian_A6 710 710 710 710 710 710 710 710 710 710 710 N_Lusitanian_A7 110 110 110 110 110 110 110 110 110 110 110 N_Lusitanian_A8 1020 1020 1020 1020 1020 1020 1020 1020 1020 1020 1020 N_Lusitanian_B1 240 240 240 240 240 240 240 240 240 240 240 N_Lusitanian_B2 70 70 70 70 70 70 70 70 70 70 70 N_Lusitanian_B3 10 10 10 10 10 10 10 10 10 10 10 N_Lusitanian_B4 10 10 10 10 10 10 10 10 10 10 10 N_Lusitanian_B5 5 5 5 5 5 5 5 5 5 5 5
Offshore storage capacity of the north sector of Lusitanian basin (Mt CO2) 3790 S. Mamede 180 180 180 180 180 180 180 180 180 180 180
Alcobaça 80 80 80 80 80 80 80 80 80 80 80 S. Pedro de Muel 50 50 50 50 50 50 50 50 50 50 50
Alvorninha 30 30 30 30 30 30 30 30 30 30 30 Onshore Lusitanian basin storage capacity (Mt CO2) 340

A-II
S_Lusitanian_A1 20 20 20 20 20 20 20 20 20 20 20 S_Lusitanian_A2 20 20 20 20 20 20 20 20 20 20 20 S_Lusitanian_A3 30 30 30 30 30 30 30 30 30 30 30 S_Lusitanian_A4 10 10 10 10 10 10 10 10 10 10 10
Offshore storage capacity of the Sines/Santiago do Cacém sector of the Lusitanian basin (Mt CO2) 80
Alga
rve
basi
n
Algarve_A1 70 70 70 70 70 70 70 70 70 70 70 Algarve_A2 210 210 210 210 210 210 210 210 210 210 210 Algarve_A3 40 40 40 40 40 40 40 40 40 40 40 Algarve_A4 90 90 90 90 90 90 90 90 90 90 90 Algarve_A5 180 180 180 180 180 180 180 180 180 180 180 Algarve_B1 660 660 660 660 660 660 660 660 660 660 660
Algarve basin storage capacity (Mt CO2) 1250
Total storage capacity (Mt CO2) 7560