c.d. rakopoulos*, d.t. hountalas and e.g. giakoumis · presented for a conventional natural gas,...
TRANSCRIPT

190 Int. J. Alternative Propulsion, Vol. 1, No. 2/3, 2007
Copyright © 2007 Inderscience Enterprises Ltd.
Study of the performance and exhaust emissions of a spark-ignited engine operating on syngas fuel
R.G. Papagiannakis Thermodynamic and Propulsion Systems Section, Aeronautical Sciences Department, Hellenic Air Force Academy, Dekelia Air Force Base, Dekelia Attiki, Greece E-mail: [email protected]
C.D. Rakopoulos*, D.T. Hountalas and E.G. Giakoumis Internal Combustion Engines Laboratory, Thermal Engineering Department, School of Mechanical Engineering, National Technical University of Athens, 9 Heroon Polytechniou St., Zografou Campus, 15780 Athens, Greece E-mail: [email protected] E-mail: [email protected] E-mail: [email protected] *Corresponding author
Abstract: To resolve the problem of depletion of petroleum based liquid fuels, various solutions have been proposed. One of them is the use of gaseous fuels that are generated from the gasification of woods, namely syngas or wood-gas fuels, as full supplement fuels in spark ignition internal combustion (IC) engines. This fuel consists of nearly 40% combustible gases, mainly hydrogen and carbon monoxide (CO), while the rest is non-combustible gases. In the present work, a comparison between experimental and computed results is presented for a conventional natural gas, spark-ignited engine, fuelled with syngas instead of natural gas fuel. For the theoretical investigation, a computer model is developed that simulates the syngas combustion processes in a conventional natural gas, spark-ignited engine. The combustion model is a two-zone one, where the combustion rate of syngas fuel depends on the velocity of the flame front that forms around the area of the burning zone and then spreads inside the combustion chamber. The flame front development takes into account the history of pressure and temperature inside the chamber and the local composition, in order to estimate the flame velocity. An equilibrium model is used to determine the concentration of the chemical species involved, the extended Zeldovich mechanism is used to determine the concentration of nitric oxide (NO) and a CO kinetics scheme is used to estimate the CO emission. To validate the predictive ability of the model, experimental measurements are used from the operation of a multi-cylinder, four-stroke, turbocharged, spark-ignited engine fuelled with syngas fuel, with the measurements corresponding to various values of the air to fuel ratio (load). The experimental results are found to be in good agreement with the respective computed ones obtained from the computer model. Comparing the computed results when operating the engine with natural gas as against syngas fuel, a serious effect of the syngas operation on the cylinder pressure diagrams and the engine brake efficiency is revealed, for all test cases examined. Moreover,

}
Study of the performance and exhaust emissions 191
as far as pollutant emissions are concerned, the use of natural gas instead of syngas has a positive effect on both NO and CO emissions (reduction).
Keywords: syngas fuel; hydrogen; carbon monoxide; spark ignition engine; performance; emissions.
Reference to this paper should be made as follows: Papagiannakis, R.G., Rakopoulos, C.D., Hountalas, D.T. and Giakoumis, E.G. (2007) ‘Study of the performance and exhaust emissions of a spark-ignited engine operating on syngas fuel’, Int. J. Alternative Propulsion, Vol. 1, No. 2/3, pp.190–215.
Biographical notes: Roussos G. Papagiannakis obtained his Dipl.Ing. and Dr.Ing. degrees from the School of Mechanical Engineering of the NTUA, Greece. He is Lecturer at the Thermodynamic and Propulsion Systems Section of the Aeronautical Sciences Department in the Hellenic Air Force Academy, Athens, Greece.
Constantine D. Rakopoulos is Head of the Thermal Engineering Department, Full Professor of Internal Combustion Engines and Director of the IC Engines Laboratory at the School of Mechanical Engineering of the National Technical University of Athens (NTUA), Greece. He graduated (Dipl.Ing.) from the NTUA and obtained his MSc, DIC and PhD degrees from Imperial College of Science, Technology and Medicine, University of London, UK. He has been responsible for the development of engines research at the School of Mechanical Engineering of the NTUA for the last 25 years, with over 140 refereed papers in international journals and conferences.
Dimitrios T. Hountalas is Associate Professor of Internal Combustion Engines at the School of Mechanical Engineering of the NTUA, Greece. He graduated (Dipl.Ing.) from the School of Mechanical Engineering of NTUA where he also obtained his Dr.Ing. degree. His research interests include experimental and simulation analysis of diesel engines in the School of Mechanical Engineering of the NTUA for the last 15 years.
Evangelos G. Giakoumis obtained his Dipl.Ing. and Dr.Ing. degrees from the School of Mechanical Engineering of the NTUA, Greece. He has worked for 6 years as Area Manager at the After-Sales Department of Peugeot Automobiles Distributor in Greece, and has been recently elected Lecturer at the Thermal Engineering Department of the School of Mechanical Engineering of the NTUA. His research interests include diesel engine experimental and simulation analysis under transient conditions, and second-law analysis of internal combustion engines.
1 Introduction
The energy policy, whether in developing or industrialised countries, is an issue frequently discussed under economic, technical and political perspectives. The worldwide energy consumption is constantly increasing and it will certainly increase during at least the 21st century. Nowadays, around 80% of the world primary energy is satisfied by fossil fuels (Duret et al., 2005; Garnier et al., 2005). It has become common belief that today’s main resources of energy, such as the conventional petroleum based liquid fuels, will become scarce within the next generation.
Awareness of limitations of fossil fuels reserves and the fact that burning of fossil fuels has a major contribution to the greenhouse gases emission has led to a growing

192 R.G. Papagiannakis et al.
interest in the use of bio-energy and other renewable energy sources. Biomass is considered to be one of the key renewable energy resources of the future, especially in developing countries, at both small- and large-scale levels. It can lay claim to being considered as a renewable equivalent to fossil fuels. It offers flexibility of fuel supply due to the range and the diversity of fuels that can be produced. Biomass can be converted into liquid (bio-oil) or gaseous (biogas) fuels, which can be used on energy systems, increasing the energy available for economic development without contributing to the greenhouse effect, while most of the biomass fuels are characterised by friendly environmental attributes such as low levels of sulphur and NOX emissions (Chaudari et al., 2003; Huang and Crookes, 1998).
Many internal combustion (IC) engines, usually converted from commercial compression- or spark-ignition engines, have been fuelled with natural gas, liquefied petroleum gas (LPG) and scarcely with biogases (producer gas, landfill gas and digester gas), for use in power generation, transportation and other applications (Kouremenos and Rakopoulos 1986; Rakopoulos and Kyritsis, 2001, 2006; Stone and Ladommatos, 1991; Stone et al., 1993). Advantages of reduced exhaust emissions and improved thermal efficiency under certain conditions with natural gas or LPG operation have been reported.
Landfill gas and sewage gas are both the by-products of anaerobic decomposition of organic matter and are primarily composed of methane (~50–70%) and carbon dioxide (~50–30%). Landfill gas is produced in sanitary landfills, whereas the digester gas is produced at sewage treatment plants (Huang and Crookes, 1998). On the other hand, the producer gas is the product of the partial combustion (a thermo-chemical process, gasification and pyrolysis) of biomass in a gasifier, with its main components being: H2 (~20%), CO (~20%), N2, CO2 and CH4. Specifically, the syngas (wood-gas) producers convert solid biomass (woody chips and powdery) materials such as wood, agricultural and agro-industrial wastes (Garnier et al., 2005; Shridhar et al., 2001).
Thus, with the increasing public interest in the conservation of energy resources and environmental protection, special attention is paid to the development of ecological and efficient combustion technologies. One of these technologies could be the use of syngas (wood-gas) (Cleland and Purvis, 1996; Hindsgaul et al., 2000; Munoz et al., 2000; Sobyanin et al., 2005). Using wood for electrical power generation produces zero net gain of carbon dioxide and other greenhouse gases, essentially eliminates sulphur dioxide (SO2) emission, increases the energy security by using indigenous fuel, contributes to the industrial and forest economy, and improves the environment by using wastes and residues. From the thermodynamic point of view, combining heat and electricity production using wood gasification leads to a major advantage. On the one hand, the high temperature heat in the combustion chamber is used for high quality energy production (electricity), and on the other the lower temperature heat from the exhaust gas is used for low quality energy production (buildings heating).
Biomass energy is labour-intensive to produce, harvest and transport as it is dispersed over large areas. Therefore, there is a limit for the upper size of a biomass power station, which ranges from 10 to 100 MWe, according to location, which means that this technology is suitable for distributed power generation (Bridgwater et al., 2002).
Despite the extensive literature concerning the economic feasibility and environmental impact of biomass power plants, just very few studies can be found about IC engines fitted with wood-gas. Moreover, the information is very general and does not contain any details on the engine behaviour, performance- and emission-wise. It is to be noted that a main challenge converting a gas engine into a wood-gas one is to manage the

}
Study of the performance and exhaust emissions 193
dirtiness of the product gases, which is contaminated by tar, ashes and soot. According to Hindsgaul et al. (2000), the majority of the particulate matter mass is composed of soot particles (organic compound) with diameter of about 70 nm. For the economical long-term operation of the engine, it is essential that the gas has low concentration of harmful contaminants, minimising the maintenance costs.
During the last years, extensive experimental investigations along with computer simulations have been conducted in gasoline spark ignition (SI) engines (Benson et al., 1975; Blizard and Keck, 1974; Lucas and James, 1973; Rakopoulos, 1988, 1993; Tabaczynski et al., 1977) or natural gas SI engines (Karim and Ali, 1975; Nagalingam et al., 1983; Shretha and Karim, 2001). In the present contribution, a two-zone mathematical model has been developed to describe the combustion process in a SI engine, where the conventional fuel (natural gas) is fully substituted with syngas. The model predicts, apart from the cylinder pressure traces and heat releases, the concentration of nitric oxide (NO) and carbon monoxide (CO) pollutant emissions. The main purpose of the model is to describe and understand the combustion process of the syngas–air mixture that takes place in the cylinder of these engines. Computed results are provided at various engine loads and a constant engine speed, given that the application is for electricity generation.
In order to implement the theoretical analysis, results are used from an experimental investigation conducted on a multi-cylinder, turbocharged, water-cooled, spark-ignited, natural gas engine, which is fuelled with syngas instead of natural gas to generate electric and thermal power as well (co-generation). The engine was supplied by a syngas producer, inside which the solid woody material is converted to gaseous fuel through a thermo-chemical process. The data obtained from the experimental investigation has been used to validate the model and understand the complex combustion nature under syngas fuel operation. From the comparison of computed and experimental findings, it is revealed that the simulation model developed predicts adequately the engine performance and pollutant emissions trends with engine load under syngas fuel operation.
From both the computed and experimental findings, important information is derived, revealing the effect of the presence of syngas fuel, in the cylinder charge, on the combustion mechanism. This is accomplished through the comparison of the cylinder pressure traces, ignition delay period and intensity of the heat release and combustion duration under natural gas and syngas fuel operations, respectively. Moreover, concerning pollutant emissions (NO and CO), the effect of syngas fuel on their formation is revealed by comparing these values with those under normal natural gas operation. This information is extremely valuable if one wishes to apply this alternative combustion technology, of using a renewably energy resource, on new or existing spark-ignited engines.
2 General physical description of the model
At the start of the compression stroke, the cylinder charge is assumed to be a homogeneous mixture of air and syngas fuel, which has been properly premixed during the induction stroke. During the compression stroke, the entire charge of the mixture is treated as a single zone up to the initiation of combustion. Here, at each instant of time, the perfect gas law describes the state of the mixture inside the cylinder, while there is uniformity in space of pressure, temperature and composition.

194 R.G. Papagiannakis et al.
As is well known, the combustion process of a SI engine is divided into two processes, that is, the ignition process and the stable flame propagation process (Blizard and Keck, 1974; Lucas and James, 1973). The former one is made of the flame kernel, which is formed by a spark electric discharge and the unstable flame propagation of the kernel. This is, however, treated as a SI delay period. In the proposed model, the initiation of combustion is assumed to take place when a finite volume of the burned mixture (i.e. the volume of the flame kernel formed by the spark discharge) exceeds 0.001 times the total cylinder volume, that is, displacement plus clearance volume (see Figure 1).
Figure 1 Schematic diagram of the flame kernel formation
TDC
A
D
h
Igniter
Flame Kernel
When combustion is initiated, a two-zone phenomenological model is considered to exist for the rest of the closed part of the engine cycle. The first zone consists of air–gaseous fuel mixture (unburned zone), while the second one (burning zone) consists of combustion products and excess air depending on the AFR (air to fuel ratio) (see Figure 2). In each zone, there is uniformity in space of pressure, temperature and composition, at each instant of time, neglecting heat exchange between the zones. After the spark plug ignition, the two zones are separated by a thin flame front that has the shape of a sphere.
The flame front spreads towards the unburned zone, having a flame speed that is calculated by taking into account the turbulent flame propagation mechanism. After the initiation of combustion, the volume of the burning zone changes due to the existence of the flame front, which spreads towards the unburned zone having a turbulent flame speed. The volume change of the burning zone leads to the computation of the quantity of the gaseous fuel and air entrained into the zone. Since the laminar flame thickness under engine conditions is infinitesimal (Heywood, 1988), in the present model the flame is treated as negligibly thin. The gaseous fuel entrained inside the burning zone, due to the flame front spread, is transformed into products. Thus, the combustion rate depends actually on the turbulent flame speed.
After the initiation of combustion, each zone possesses its own temperature and composition, while the pressure is uniform inside the cylinder. Dissociation of combustion products is taken into account by using the Vickland et al. (1962) method,

}
Study of the performance and exhaust emissions 195
incorporating 11 chemical species. For the formation of NO, the extended Zeldovich chain reaction mechanism is considered (Lavoie et al., 1970), while for the prediction of the CO the proposed model assumes that its formation and oxidation mechanisms are kinetically controlled. In the following section, a brief description of the various processes sub-models is given.
Figure 2 Two-zone thermodynamic model of combustion process Burning Zone
Unburned Zone
A A’
Sight A-A’
Flame Front
3 Mathematical treatment of the model
3.1 Conservation and state equations
The model is based on the fundamental laws of mass and energy conservation, and the perfect gas state equations, applied for each zone separately and for the entire cylinder charge. The temperature of the unburned zone Tu the temperature of the burning zone Tb and the cylinder pressure P are obtained from the solution of a set of three ordinary first-order differential equations, derived after some mathematical manipulation from the first law of thermodynamics and the perfect gas state equation (Ferguson, 1986; Heywood, 1988). The first law of thermodynamics and the perfect gas state equations, applied in each zone in a time step dt, read as follows:
j j j j jd d d (d ), j = u, bU Q P V m h− += ⋅ ⋅∑ (1)
j j j j , j = u, bP V m R T⋅ = ⋅ ⋅ (2)
It must be stated that the internal energies and enthalpies in Equation (1) are total ones, that is, they include enthalpies of formation, so that the heat release is taken into account implicitly (Benson and Whitehouse, 1979). Furthermore, by considering the two zones of

196 R.G. Papagiannakis et al.
burned and unburned mixture and the inflow and outflow of gas for each zone, the mass conservation equation, in a time step dt, reads:
u bd dm m= − (3)
where dmb is the mass entrained (in time step dt) into the burning zone and dmu is the mass reduction of the unburned zone.
3.2 Ignition delay sub-model
After the spark discharge, the initiation of combustion inside the burning zone consists of three steps, which are depicted in Figure 3 (Benson et al., 1975; Heywood, 1988). During these steps, the temperatures of both unburned and burning zones and the cylinder pressure are calculated at the initiation of the combustion period. As referred to previously, the proposed model assumes that the initiation of combustion takes place when the volume of the flame kernel formed, after the spark discharge, grows to be greater than 0.1% of the total cylinder volume. Therefore, the ignition delay period is defined as the time interval between the SI and the initiation of combustion. At the nominal ignition time, the mixture is assumed to burn adiabatically at constant volume inside the flame kernel. For this purpose, an internal energy balance is carried out for a unit mass of the mixture inside the kernel. The first estimate of the flame kernel temperature Tp is based on the following expression (Benson and Whitehouse, 1979):
p u
p u
2500 for 1
2500 700 ( 1) for 1
T T
T T
ϕ ϕ
ϕ ϕ ϕ
= + ⋅ ≤
= + ⋅ − ⋅ − > (4)
where φ is the mixture fuel equivalence ratio, that is, the actual AFR divided by its stoichiometric value. An energy balance is made and the temperature Tp is adjusted until the specific internal energy of the products becomes equal to the specific internal energy of the reactants, and then the temperature Tp is determined.
Figure 3 Basis of the first combustion stage calculation
Spark Discharge
.P cyl
0 1V V100
≥
Ignition Delay PeriodTransform at Fixed
Volume
Equilibration of Pressure
Flame Kernel
(1) (2) (3) (4)
Tb, Pb, Vb
Tu, Pu, Vu
Tb, P, Vb
Tu, P, Vu
Furthermore, taking into account the calculated turbulent flame speed St, the volume of the flame kernel is calculated as:
3p (2 / 3)V Rπ= (5)

}
Study of the performance and exhaust emissions 197
where R is the radius of the flame front from the spark plug, which is obtained from:
tS360
R SN
α∆=
⋅ (6)
where ∆α is the degrees crank angle increment and Ns is the engine speed in revolutions per second (rps).
For each instant of time after the spark discharge, if the volume of the flame kernel is less than the 0.1% of the total cylinder volume, the mixture is considered not to have been burned yet and the compression process carries on for the next crank angle step. The process continues for as many crank angles as necessary, until the volume of the flame kernel becomes greater than 0.1% of the total cylinder volume, as seen in Stage 2 of Figure 3. Then, taking into account the volume of the flame kernel, the engine speed and the turbulent flame speed, the ignition delay period in crank angle degrees is calculated (see Figure 3) from the expressions:
p S1/3p p
t
360(3 / 2 ) and
R NR V
Sπ α
⋅ ⋅= ∆ = (7)
When the volume of the flame kernel becomes greater than the 0.1% of the total cylinder volume, the combustion phase initiates and the cylinder chamber is subdivided into a burned (suffix ‘b’) and an unburned (suffix ‘u’) zones, each of them having its own temperature and pressure values (see Stage 3 in Figure 3). It must be stated that the pressure jump arisen during the second stage (Figure 3, Stage 2→3) is actually due to the expansion that is caused by the plasma that causes the ignition. Thus, at the Stage 3, the pressures of the zones have different values. According to the proposed model, there is uniformity in space of the pressure inside the combustion chamber. Thus, during the last step (3→4, as seen in Figure 3), an equilibration of the pressure values of the zones takes place, which is assumed to be an adiabatic constant volume process.
3.3 Definition of the burning zone
During the combustion process, the instantaneous cylinder volume and its derivative with respect to crank angle, the flame front area, and the area of the combustion chamber in contact with the unburned and burning zones, are computed through the respective geometric sub-models. Assuming that the geometry of the flame front formed inside the chamber of a spark-ignited engine has a spherical form (Heywood, 1988), the determination of the instantaneous flame geometry after spark discharge is achieved in the present work by applying a model developed by Annand (1970). According to this model, the net outer surface area of the spherical burning zone Af (see Figure 4), which spreads towards the unburned zone, is calculated depending on the instantaneous flame radius R from the spark plug and the chamber height h, by using the Simpson’s integration scheme (see Figure 4).
As the spherical zone spreads, a homogeneous mixture of air and gaseous fuel is entrained into the burning zone. The quantity of gaseous fuel–air mixture inside the burning zone is controlled by the spread of the zone towards the unburned one. The mass

198 R.G. Papagiannakis et al.
entrainment rate into the burning zone is calculated from the volume change rate of the zone tot
bdV , as: tot
b u b u f td dm V A Sρ ρ= ⋅ = ⋅ ⋅ (8)
Figure 4 Geometry of the burning zone
R
A
h
R < A
R h
A
R > A
Net Area of the Flame
Net Area of the Flame
3.4 Flame propagation mechanism
An important intrinsic property of a combustible fuel–air mixture is its laminar burning velocity. The laminar burning velocity is defined as the velocity, relative to the flame front, with which unburned gas moves into the flame front and is transformed to products. Since the laminar flame thickness under actual engine conditions is around 0.2 mm, which is very small compared to the characteristic chamber dimensions, the flame is treated as negligibly thin. The laminar burning (flame) velocity for several hydrocarbons premixed with air depends on the fuel equivalence ratio, the temperature of the unburned gas and the cylinder pressure (Lucas and James, 1975; Metghalchi and Keck, 1980). The present model assumes that a flame front of negligible thickness propagates into the unburned zone, having a direction perpendicular to the outer spherical surface of the burning zone formed after the initiation of combustion. The laminar flame speed is given by the following correlation:
t t
ref u
ref refl l
a bT P
S ST P
= ⋅ ⋅
(9)
where Tref=298 K, Pref=1 atm, while reflS , at and bt are constants depending on a given
fuel equivalence ratio φ. These constants can be represented by the following equations: ref 2
1 2 m t 3 4 t 5 6( ) , ( 1), ( 1)lS C C a C C b C Cϕ ϕ ϕ ϕ= + − = − − = − + − (10)
where C1…C6 are constants and φm is the equivalence ratio at which reflS has the
maximum value. To allow for the effect of turbulence, a turbulent flame velocity is calculated using the
formula:
t lS S u= + ′ (11)

}
Study of the performance and exhaust emissions 199
It is mentioned that the above equation is a very special case of the generally used models that are of the form St/Sℓ=1+C(u′/Sℓ)n, with C and n being model constants, setting C=1 and n=1 that are usually assumed values for two-zone SI combustion models.
In the above equation, u′ is the turbulence intensity, which, after ignition, is given as follows (Lavoie, 1978; Lucas and James, 1973; Ramos, 1989):
SOI 1/37 u u( / 30) ( / )u C N s ρ ρ= ⋅ ⋅ ⋅′ (12)
where C7 is a constant and SOIuρ is the density of the unburned mixture at the start of
ignition (SOI).
3.5 Combustion sub-model
For realistic predictions, the combustion process must be modelled considering the details of the turbulent flame propagation process, as in a turbulent entrainment model (Blizard and Keck, 1974; Heywood, 1988; Keck, 1982; Keck et al., 1987; Ramos, 1989; Tabaczynski et al., 1977), which is used in the present study. According to this, the combustion rate is calculated by using the characteristic reaction time τb as follows:
combcomb b bB
b
dm m
mτ
−= (13)
where mb is the mass entrained by the flame front and combbm is the mass consumed
during the combustion period. The characteristic reaction time is calculated by taking into account the Taylor
micro-scale L, as follows:
b / lL Sτ = (14)
In the model, the Taylor micro-scale is obtained from the formula:
SOI 1/ 3 SOI 1/38 cyl u u( ) ( / )L C V ρ ρ= ⋅ ⋅ (15)
where C8 is a constant and SOIcylV is the instantaneous cylinder volume at the SOI.
As the combustion process continues, the volume of products increases at a rate determined by the turbulent flame speed, while the volume of the unburned mixture decreases by the same amount, correspondingly. Theoretically, combustion should be terminated when Vb≤0. According to the combustion model, there is a small amount of mixture that has not been consumed yet, when Vb≤0. In the model presented, the combustion rate of the remaining unconsumed mixture during the final burning phase is calculated from (cf. Equation (13)):
comb Fb ,
b
d expb Ft t
m mτ
−=
(16)
where mb,F is the unburned mixture inside the burning zone and subscript F denotes the conditions at the end of the flame propagation.

200 R.G. Papagiannakis et al.
3.6 Knock sub-model
According to the literature, the fundamental theories of knock are based on models for the autoignition of the fuel–air mixture in the cylinder gas (Ferguson, 1986). Engine knock is a spark-ignited engine phenomenon, where the compressed gaseous fuel–air mixture within the cylinder ignites before it has been reached by the propagating flame front. The simplest predictive method to model knock in spark-ignited engines is to utilise the ignition or knock integral, as in phenomenological diesel combustion models, and apply it to the unburned zone of the mixture. Thus, in the proposed model, the autoignition of the mixture occurs when (Ferguson, 1986; Heywood, 1988):
0
1d 1
t kt
τ=∫ (17)
where t is the elapsed time from the start of the mixture compression process, tk is the time of autoignition and τ is the induction time at the instantaneous temperature and pressure conditions. In the present work, the induction time is modelled by an Arrhenius-type equation, which relates it to the cylinder pressure P and the temperature of the unburned zone Tu (Douaud and Eyzat, 1978) as follows:
kn2kn
1 uexp(3800 / )CC P Tτ = ⋅ (18)
where kn1C and kn
2C are experimental constants.
3.7 Heat transfer sub-model
Heat transfer in SI engines is due to convection and radiation. Several empirical correlations have been developed for the determination of the instantaneous heat transfer coefficient. The semi-empirical formula developed by Annand (1963) is used in this study. According to this expression, the heat exchange rate is obtained by the formula:
( ) ( )4 4g w g w
d Re
d
bQA a T T c T T
t Dλ= − + −
(19)
where a, b and c are constants and λ is the thermal conductivity of the working medium. During the combustion phase, since the burning zone is not entirely in contact with the cylinder wall surfaces, a bulk average temperature of both zones is used as follows (Rakopoulos and Hountalas, 1998):
u u u b b bg
u u b b
m c T m c TT
m c m c
+=
+ (20)
Thus, the total heat exchange rate dQ/dt is distributed between the two zones according to their mass, temperature and specific heat capacity as follows:
j j j j
u u u b b b
d d, j u, b
d d
Q m c TQ
t t m c T m c T= =
+
(21)

}
Study of the performance and exhaust emissions 201
3.8 Chemistry of combustion: equilibrium considerations
Combustion products are defined by dissociation considerations. For the C-H-O-N system, the complete chemical equilibrium scheme proposed by Vickland et al. (1962) is used in the present study with some modifications (Rakopoulos et al., 1994, 2004). For the burning zone, given its volume, temperature, mass of fuel burned and mass of air entrained, the concentration of each one of the 11 species, which are considered to be in chemical equilibrium inside the burning zone, can be calculated by solving a system of 11 equations. The gas species considered are: H2O, H2, OH, H, N2, NO, N, CO2, CO, O2 and O.
3.9 NO formation
The NO formation is assumed to be a non-equilibrium process controlled by chemical kinetics. Thus, for the estimation of NO formation, the extended Zeldovich mechanism (Lavoie et al., 1970), with minor modifications, has been adopted in the current work. According to this mechanism, the following three reactions, with their related forward reaction rate constants, are considered:
3 102 1fN NO N O, (m /kmol s) 1.6 10k+ ↔ + = ×
3 102 2f b bN O NO O, (m /kmol s) 6.4 10 exp ( 3125/ ) k T T+ ↔ + = × − (22)
3 103fN OH NO H, (m /kmol s) 4.2 10k+ ↔ + = ×
3.10 CO formation
As reported (Heywood, 1988; Ramos, 1989), CO formed by the combustion process is oxidised to carbon dioxide at a rate that is relatively slow compared to the CO formation rate. The two kinetically controlled reactions, with their related forward reaction rate constants, are as follows (Papagiannakis and Hountalas, 2002; Ramos, 1989):
3 102 1 bCO+HO CO H, (m /kmol s) 6.76 10 exp ( /1102)k T↔ + = × (23a)
3 122 2 2 bCO O CO O , (m /kmol s) 2.51 10 exp ( 22041/ )k T+ ↔ + = × − (23b)
4 Test cases examined
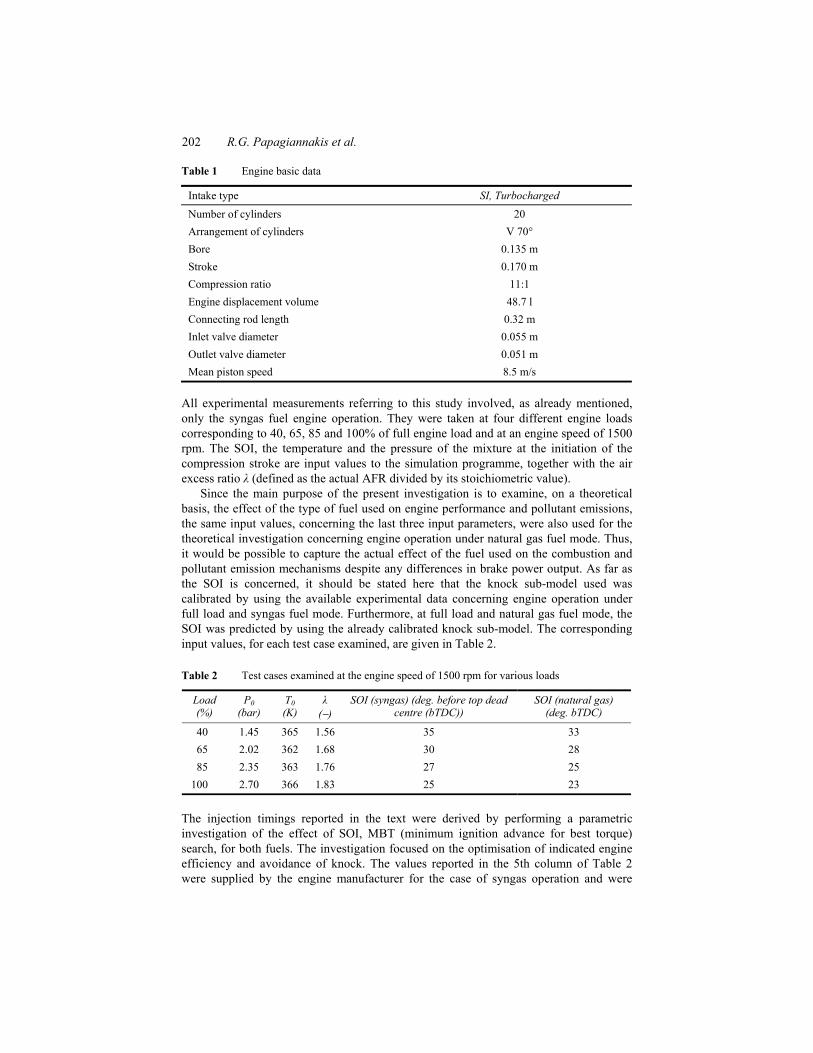
To calibrate the present model, the results are used from an experimental investigation conducted on a ‘GE Jenbacher 320’, multi-cylinder, spark-ignited engine. Furthermore, the experimental results of this investigation are used to evaluate the predictive ability of the proposed model under syngas fuel operation. These results are also used as a basis to evaluate the findings when the same engine operates with natural gas instead of syngas fuel. The basic data related to the simulated engine are presented in Table 1. This is a four-stroke, turbocharged, water-cooled, spark-ignited engine fuelled with syngas. The normal (constant) speed of the engine is 1500 rpm (revolutions per minute), since this is used as an electric power generator (actually in a co-generation mode).
202 R.G. Papagiannakis et al.
Table 1 Engine basic data
Intake type SI, Turbocharged
Number of cylinders 20 Arrangement of cylinders V 70° Bore 0.135 m Stroke 0.170 m Compression ratio 11:1 Engine displacement volume 48.7 l Connecting rod length 0.32 m Inlet valve diameter 0.055 m Outlet valve diameter 0.051 m Mean piston speed 8.5 m/s
All experimental measurements referring to this study involved, as already mentioned, only the syngas fuel engine operation. They were taken at four different engine loads corresponding to 40, 65, 85 and 100% of full engine load and at an engine speed of 1500 rpm. The SOI, the temperature and the pressure of the mixture at the initiation of the compression stroke are input values to the simulation programme, together with the air excess ratio λ (defined as the actual AFR divided by its stoichiometric value).
Since the main purpose of the present investigation is to examine, on a theoretical basis, the effect of the type of fuel used on engine performance and pollutant emissions, the same input values, concerning the last three input parameters, were also used for the theoretical investigation concerning engine operation under natural gas fuel mode. Thus, it would be possible to capture the actual effect of the fuel used on the combustion and pollutant emission mechanisms despite any differences in brake power output. As far as the SOI is concerned, it should be stated here that the knock sub-model used was calibrated by using the available experimental data concerning engine operation under full load and syngas fuel mode. Furthermore, at full load and natural gas fuel mode, the SOI was predicted by using the already calibrated knock sub-model. The corresponding input values, for each test case examined, are given in Table 2.
Table 2 Test cases examined at the engine speed of 1500 rpm for various loads
Load (%)
P0 (bar)
T0 (K)
λ (−)
SOI (syngas) (deg. before top dead centre (bTDC))
SOI (natural gas) (deg. bTDC)
40 1.45 365 1.56 35 33 65 2.02 362 1.68 30 28 85 2.35 363 1.76 27 25
100 2.70 366 1.83 25 23
The injection timings reported in the text were derived by performing a parametric investigation of the effect of SOI, MBT (minimum ignition advance for best torque) search, for both fuels. The investigation focused on the optimisation of indicated engine efficiency and avoidance of knock. The values reported in the 5th column of Table 2 were supplied by the engine manufacturer for the case of syngas operation and were

}
Study of the performance and exhaust emissions 203
limited by the appearance of knock, since indicated efficiency was continuously increasing. Therefore, for the case of syngas, the SOI was defined by the knock limit, while for natural gas, it was defined from the MBT value.
The natural gas used in this investigation is a mixture of methane (CH4) and other hydrocarbons, a typical representative of natural gas fuels. The composition of the natural gas used is given in Table 3, as well as the composition of the syngas fuel (GE Jenbacher, 2005). The net calorific values, which are given in Table 3, have been calculated by taking into account the known composition of the fuels. Furthermore, examining Table 3, one can see that the syngas fuel consists of about 50% combustible gases, mainly CO and hydrogen, while the rest is non-combustible gases.
Table 3 Composition (%, by vol.) and net calorific values of natural gas and syngas fuels
Natural gas
Composition
CH4 C2H6 C3H8 C4H10 C5H12 N2 CO2
98 0.6 0.2 0.2 0.1 0.8 0.1
Net calorific value 41.80 MJ/kg 36.4 MJ/Nm3
Syngas
Composition
CH4 CO H2 N2 CO2
6 29 19 38 8
Net calorific value 13.90 MJ/kg 6.84 MJ/Nm3
For each engine load examined, under both operating fuel modes, the gaseous fuel supply is obtained from the formula:
( )( )0, mix
fuelfuelst
d / dd / d
AFR 1
m tm t
λ=
⋅ + (24)
where (dm/dt)0,mix is the mass flow rate of the air–fuel mixture inside the combustion chamber at the initiation of compression stroke, and fuel
stAFR is the stoichiometric AFR that is calculated from the known composition of each fuel examined.
5 Results and discussion
To validate the ability of the developed two-zone model to predict engine performance, a comparison is given in the present work between measured cylinder pressure diagrams and predicted ones. Figure 5 shows the comparison between computed and experimental pressure traces under syngas fuel operation, for an engine speed of 1500 rpm and 100% engine load. As shown, there is a good agreement between computed and measured

204 R.G. Papagiannakis et al.
traces, which is promising for the use of the proposed model to predict engine performance for spark-ignited engines fuelled with syngas. The model has been calibrated using the available experimental results taken at a speed of 1500 rpm and for 100% engine load under syngas fuel-operating mode. It is emphasised here that the values of the present model’s constants are held constant for the entire range of loads and for the cases of both fuels (syngas and natural gas) considered in the present study.
Figure 5 Comparison of experimental and computed pressure traces at the engine speed of 1500 rpm and 100% load, under syngas fuel operation
0
20
40
60
80
100
120
140
160
Cyl
inde
r Pre
ssur
e (b
ar)
60 90 120 150 180 210 240 270 300Crank Angle (deg)
Syngas Operation1500 rpm - 100% Load
Experimental
ComputedSOI
Figures 6 to 9 present the comparison between computed pressure and heat release traces under syngas and natural gas operating modes, for 1500 rpm engine speed and four different engine loads, namely 40, 65, 85 and 100% of full load, respectively. Observing the computed cylinder pressure traces under syngas and natural gas fuel operation at each test case examined (Figures 6 to 9), it is apparent that the presence of natural gas instead of syngas in the cylinder charge affects the cylinder pressure.
Specifically, during the compression stroke, the pressure under natural gas fuel operation diverges from the respective values under syngas fuel-operating mode, for the same engine conditions. The difference becomes more evident during the last stages of the compression stroke. This emanates from the higher specific heat capacity of the natural gas–air mixture compared to the one for the syngas fuelling mode. After the initiation of combustion and for all loads examined, the cylinder pressure under natural gas fuel mode continues to be lower compared to the respective values observed under syngas operating mode. This emanates from both the higher specific heat capacity of the mixture accompanied by the lower spark advance timing, compared to the respective values under syngas operating conditions. On the other hand, under natural gas fuel mode, as engine load increases (i.e. increase of air excess ratio) the cylinder pressure rise becomes slower compared to the respective one observed under syngas fuel mode. At low air excess ratio, the increase of the flame propagation velocity compared to the respective one observed under syngas fuel operation leads to an improvement of the combustion rate of natural gas, resulting in a faster pressure rise compared to the one observed under

}
Study of the performance and exhaust emissions 205
syngas fuel mode. Thus, at low load, it is observed that the value of maximum cylinder pressure occurring under natural gas operating mode is slightly lower and occurs earlier compared to the respective value observed under syngas fuel operation. As engine load increases, the maximum cylinder pressure prevailing under natural gas operating mode occurs later compared to the respective value under syngas fuel mode, while the difference observed between the maximum cylinder pressure values for both fuel cases increases slightly.
Figure 6 Comparison of computed pressure and heat release traces at 40% load, under syngas and natural gas fuelling modes (HRR, heat release rate)
120 160 200 240 280Crank Angle (deg.)
0
20
40
60
80
100
120
140
Cyl
inde
r Pre
ssur
e (b
ar)
0
100
200
300
400
Hea
t Rel
ease
Rat
e (J
/deg
)
1500 rpm - 40% Load
Cyl. Pres.-Syngas
Cyl. Pres.-Nat. Gas
HRR-Syngas
HRR-Nat. Gas
Figure 7 Comparison of computed pressure and heat release traces at 65% load, under syngas and natural gas fuelling modes
120 160 200 240 280Crank Angle (deg.)
0
20
40
60
80
100
120
140
Cyl
inde
r Pre
ssur
e (b
ar)
0
100
200
300
400
Hea
t Rel
ease
Rat
e (J
/deg
)
1500 rpm - 65% Load
Cyl.Pres.-Syngas
Cyl.Pres.-Nat.Gas
HRR-Syngas
HRR-Nat. Gas

206 R.G. Papagiannakis et al.
Figure 8 Comparison of computed pressure and heat release traces at 85% load, under syngas and natural gas fuelling modes
120 160 200 240 280Crank Angle (deg.)
0
20
40
60
80
100
120
140
Cyl
inde
r Pre
ssur
e (b
ar)
0
100
200
300
400
Hea
t Rel
ease
Rat
e (J
/deg
)
1500 rpm - 85% Load
Cyl.Pres.-Syngas
Cyl.Pres.-Nat.Gas
HRR-Syngas
HRR-Nat. Gas
Figure 9 Comparison between computed pressure and heat release traces at 100% load, under syngas and natural gas fuelling modes
120 160 200 240 280Crank Angle (deg.)
0
20
40
60
80
100
120
140
Cyl
inde
r Pre
ssur
e (b
ar)
0
100
200
300
400
Hea
t Rel
ease
Rat
e (J
/deg
)
1500 rpm-100% Load
Cyl.Pres.-Syngas
Cyl.Pres.-Nat.Gas
HRR-Syngas
HRR-Nat.Gas
Examining the heat release curves shown in Figures 6–9, it is revealed that the presence of natural gas, instead of syngas in the cylinder charge, affects the combustion process. For all loads examined, it is observed that the initiation of combustion under syngas fuel operation starts earlier compared to natural gas operation, while the shape of the heat release rate for both fuels examined is almost the same. According to the engine manufacturer, for very lean mixtures (λ>1.6) the laminar flame speed of natural gas is slightly lower compared to the respective one of syngas fuel, while as the air excess ratio decreases (λ<1.5) a considerable increase in the laminar flame speed of natural gas is

}
Study of the performance and exhaust emissions 207
observed, resulting in higher values of the flame speed compared to the respective one of syngas fuel (GE Jenbacher, 2005). Thus, at low values of the air excess ratio, during the initial stage of combustion under natural gas fuel operation, an interesting behaviour of the burning rate is observed. It is revealed that the combustion rate under natural gas fuel operation is slightly sharper compared to the respective one observed at higher air excess ratios. This improvement results from the fast spread of the flame front surrounding the burning zone. Observing Figures 6–9, it is obvious that the latter difference affects the cylinder pressure traces under natural gas fuel mode.
The variation of the engine power with engine load is given in Figure 10. Comparing the computed values of engine power with the respective measured ones under syngas fuel operating mode, a good coincidence is shown, revealing the ability of the model to predict engine performance under natural gas fuel operating mode for the various engine load conditions examined.
Figure 10 Computed and experimental engine power output under syngas fuel operation and computed one under natural gas fuel operation versus engine load, at the engine speed of 1500 rpm
20 40 60 80 100Engine Load (%)
0
200
400
600
800
1000
Engi
ne P
ower
(kW
)
1500 rpm
Syngas-Experimental
Syngas-Computed
Nat. Gas-Computed
The variation of the computed maximum cylinder pressure with engine load is given in Figure 11. This figure reveals that, for each engine load examined, the maximum cylinder pressure observed under natural gas fuel mode is lower compared to the respective one under syngas fuel operation. The difference becomes slightly higher at full engine load, where the influence of both parameters, that is, SI timing and air excess ratio, is more intense on the natural gas combustion rate.
Figure 12 shows the variation of the brake-specific fuel consumption and engine efficiency with engine load, for the engine speed of 1500 rpm. It is to be noted here that the experimental brake-specific fuel consumption is estimated from the measured brake power output and the measured mass flow rate of the syngas fuel. It is observed that in the case of syngas fuel operation, the proposed model predicts with good accuracy the experimental values for all loads examined. For both fuels examined, the increase of the gaseous fuel (syngas or natural gas) concentration in the charge (i.e. load) results in a decrease of the brake-specific fuel consumption as the combustion of the fuel becomes

208 R.G. Papagiannakis et al.
more efficient. Furthermore, the values of the brake-specific fuel consumption observed under syngas fuel operation are considerably higher compared to the respective ones observed under the natural gas fuelling mode. This is the result of the lower heat of combustion of the syngas fuel compared to the one of natural gas.
Figure 11 Computed maximum cylinder pressure under syngas and natural gas fuel operating modes versus engine load
20 40 60 80 100Engine Load (%)
60
80
100
120
140
160M
ax. C
ylin
der P
ress
ure
(bar
)1500 rpm
Syngas - Computed
Nat. Gas - Computed
Figure 12 Computed and experimental brake specific fuel consumption (bsfc) and efficiency under syngas fuel operation and computed ones under natural gas fuel operation versus engine load, at the engine speed of 1500 rpm
20 40 60 80 100Engine Load (%)
0
20
40
60
80
100
Engi
ne E
ffici
ency
(%) 1500 rpm
Syngas-Experimental
Syngas-Computed
Nat. Gas-Computed
100
200
300
400
500
600
700
800
900
bsfc
(g/k
Wh)
The comparison between measured and computed values of exhaust NO emissions, under syngas fuel operation with engine load, is given in Figure 13, for the engine speed of 1500 rpm. In the same figure, the computed values of NO emissions under natural gas

}
Study of the performance and exhaust emissions 209
fuel operation with engine load are given. Examining the computed and experimental values under syngas fuel operation, it is revealed that the model predicts with adequate accuracy the trend of exhaust NO concentration with load, with the very small under-prediction of NO most probably due to the temperature field that is not adequately predicted by a two-zone model. Owing to this, it is possible to use the model for NO predictions under natural gas fuel operation. The computed values are slightly lower compared to the experimental ones, but this is usual for a two-zone model since it under-predicts the burning zone temperature, a fact affecting seriously the formation mechanism of the NO. It is well known that the formation of NO is favoured in general by high gas temperatures and near stoichiometric mixture conditions towards the lean (Benson and Whitehouse, 1979; Ferguson, 1986).
Figure 13 Computed and experimental NO emissions under syngas fuel operation and computed one under natural gas fuel operation versus engine load, at the engine speed of 1500 rpm
20 40 60 80 100Engine Load (%)
0
50
100
150
200
250
300
350
400
NO
(ppm
)
1500 rpm
Syngas-Experimental
Syngas-Computed
Nat. Gas-Computed
Observing again Figure 13, it is revealed that, for all loads examined, the exhaust NO concentration under natural gas fuel operation is slightly lower compared to the syngas fuel operation. For the same air excess ratio, the burning temperature observed under natural gas fuelling mode is lower compared to the respective one under syngas fuel operation. Despite the fact that the oxygen concentration under syngas fuel operation is slightly lower with respect to the one under natural gas fuelling mode, the lower burning temperatures in combination with the lower spark discharge timing used under natural gas operation provides a possible explanation about the lower NO concentrations observed with natural gas compared to the respective ones under the syngas fuelling mode.
Figure 14 gives the comparison between computed and measured values of exhaust CO emissions under syngas fuel operation, as a function of engine load for the engine speed of 1500 rpm. In the same figure, the computed values of CO emissions under natural gas fuel operation with engine load are given. As observed, the predicted absolute values of CO emissions are close to the respective measured ones, revealing that the model predicts with a relatively good coincidence the absolute values of CO emissions

210 R.G. Papagiannakis et al.
under syngas fuel operation. As far as the effect of engine load on CO emissions is concerned, a slight discrepancy between experimental and computed trends of CO concentrations under syngas fuel operating mode is observed, revealing the necessity for a further improvement of the CO sub-model. Observing again Figure 14, it is revealed that under both syngas and natural gas fuelling modes, CO concentration decreases with the increment in air excess ratio, since the burning temperature levels become lower and the oxygen concentration increases. For each load examined, the CO concentration observed under natural gas fuelling mode is lower compared to the respective one with syngas. This is attributed to the lower oxygen concentration in combination with the lower burning temperatures.
Figure 14 Computed and experimental CO emissions under syngas fuel operation and computed one under natural gas fuel operation versus engine load, at the engine speed of 1500 rpm (ppm, parts per million (by volume))
20 40 60 80 100Engine Load (%)
0
500
1000
1500
2000
2500
CO
(ppm
)
1500 rpm
Syngas-Experimental
Syngas-Computed
Nat. Gas-Computed
6 Conclusions
A mathematical model has been developed to simulate the operation of spark-ignited engines for the prediction of performance and pollutant emissions. This preliminary investigation focuses on such engines where the engine load is controlled by changing the air excess ratio, and thus the amount of the syngas fuel added to and carried by the intake air. The main purpose is to provide, on a fundamental basis, an adequate way to describe the combustion process of the syngas gaseous fuel, in order to estimate, apart from power and efficiency, the concentration of exhaust NO and CO.
The model incorporates details of the syngas fuel combustion processes in a conventional spark-ignited engine. Combustion is initiated by the spark discharge, while the burning rate of the gaseous fuel depends on its entrainment rate into the burning zone, which is controlled by the velocity of the flame front that is formed at the boundary of the burning zone spreading inside the combustion chamber.
To validate the model’s ability to predict engine performance and pollutants emissions under syngas fuel operation, available experimental results have been used.

}
Study of the performance and exhaust emissions 211
The experimental investigation was conducted on a multi-cylinder, turbocharged, spark-ignited engine operating under syngas fuel mode. Measurements have been taken for both performance and emissions at an engine speed of 1500 rpm for various engine load conditions using syngas fuel only.
Comparing computed and measured values under syngas fuel mode, a good coincidence is observed for performance and NO emissions, while the differences observed are relatively small for this type of modelling. As far as CO emissions are concerned, CO predictions follow a slightly different trend with engine load compared to the respective experimental ones even though that the absolute values are close to reality. It must be stated here that due to the preliminary character of the present investigation, a more detailed validation of the model is required. Despite this, the relatively good predictive ability of the proposed model enabled us to use it for predicting the behaviour of the same engine when the syngas fuel was fully substituted with natural gas.
Examining computed and experimental data under syngas fuel operation, it is observed that the increase of syngas fuel concentration as the engine load increases leads to an increase of peak cylinder pressure. Concerning engine efficiency, it is revealed that as the concentration of syngas fuel increases there is an improvement of the engine efficiency. As far as pollutant emissions are concerned, the increase of syngas fuel concentration does not have a significant effect on exhaust NO emissions, while its influence on exhaust CO emissions seems to be rather significant.
Comparing the computed results when operating the engine with natural gas as against syngas fuel, an insignificant effect is revealed of the natural gas operation on the cylinder pressure diagrams. Concerning brake-specific fuel consumption, it is revealed that, for the same load conditions, the use of syngas instead of natural gas leads to a serious increase of the brake-specific fuel consumption. As far as pollutant emissions are concerned, the use of natural gas instead of syngas has a positive effect (decrease) on both NO and CO emissions.
Nomenclature
A Area, m2
cv Specific heat capacity under constant volume, J/kg K
D Cylinder bore, m
h Specific enthalpy, J/kg, or cylinder chamber height, m
L Taylor micro-scale, m
m Mass, kg
N Engine speed, rpm
Ns Engine speed, rps
P Pressure, Pa
Q Heat transfer to the cylinder walls, J
R Gas constant, J/kg K, or flame radius, m
s Stroke, m

212 R.G. Papagiannakis et al.
Sℓ Laminar flame speed, m/s
St Turbulent flame speed, m/s
t Time, s
T Absolute temperature, K
U Internal energy, J
u′ Turbulence intensity, m/s
V Volume, m3
Greek symbols
α Crank angle, deg.
∆α Crank angle increment
λ Thermal conductivity, W/m K, or air excess ratio
ν Kinematic viscosity, m2/s
ρ Density, kg/m3
τb Characteristic reaction time, s
τ Induction time, s
φ Fuel equivalence ratio
Subscripts
b Burning zone
cyl Cylinder
e Equilibrium
F Conditions at the end of the flame propagation
g Gaseous fuel or gas mixture
j Unburned or burned zone
kn Autoignition
P Flame kernel
tot Total
ref Reference conditions
SOI Start of ignition
u Unburned zone
w Wall

}
Study of the performance and exhaust emissions 213
Dimensionless number
Re Reynolds
Abbreviations
AFR Air to fuel ratio
bTDC Before top dead centre
CO Carbon monoxide
HRR Heat release rate
LPG Liquefied petroleum gas
MBT Minimum ignition advance for best torque
NO Nitric oxide
rpm Revolutions per minute
SI Spark ignition
SOI Start of ignition
References Annand, W.J.D. (1963) ‘Heat transfer in the cylinders of reciprocating internal combustion
engines’, Proceedings of the Institute of Mechanical Engineers, Vol. 177, pp.973–990. Annand, W.J.D. (1970) ‘Geometry of spherical flame propagation in a disc-shaped combustion
chamber’, Journal of Mechanical Engineering Science, Vol. 12, pp.146–149. Benson, R.S. and Whitehouse, N.D. (1979) Internal Combustion Engines, Pergamon Press, Oxford. Benson, R.S., Annand, W.J.D. and Baruah, P.C. (1975) ‘A simulation model including intake and
exhaust systems for a single cylinder four-stroke cycle spark ignition engine’, International Journal of Mechanical Sciences, Vol. 17, pp.97–124.
Blizard, N.C. and Keck, J.C. (1974) Experimental and Theoretical Investigation of Turbulent Burning Model for Internal Combustion Engines, SAE Paper No. 740191.
Bridgwater, A.V., Toft, A.J. and Brammer, J.G. (2002) ‘A techno-economic comparison of power production by biomass fast pyrolysis with gasification and combustion’, Renewable and Sustainable Energy Reviews, Vol. 6, pp.181–248.
Chaudhari, S.T., Dalai, A.K. and Bakhshi, N.N. (2003) ‘Production of hydrogen and/or syngas (H2+CO) via steam gasification of biomass-derived chars’, Energy and Fuels, Vol. 17, pp.1062–1067.
Cleland, J.G. and Purvis, C.R. (1996) ‘Independent power plant using wood waste’, Energy Conversion and Management, Vol. 37, pp.1205–1209.
Douaud, A.M. and Eyzat, P. (1978) Four-Octane-Number Method for Predicting the Anti-Knock Behavior of Fuels, SAE Paper No. 780080.
Duret, A., Friedli, C. and Marechal, F. (2005) ‘Process design of synthetic natural gas (SNG) production using wood gasification’, Journal of Cleaner Production, Vol. 13, pp.1434–1446.

214 R.G. Papagiannakis et al.
Ferguson, C.R. (1986) Internal Combustion Engines – Applied Thermosciences, John Wiley, New York.
Garnier, C., Bilcan, A., Le Corre, O. and Rahmouni, C. (2005) Characterisation of a Syngas-Diesel Fuelled CI Engine, SAE Paper No. 2005-01-1731.
GE Jenbacher – Technical Report (2005) Laminar Flame Speed versus Air Fuel Ratio – Experience in Woodgas Plants, June 2005, Jenbach, Austria.
Heywood, J.B. (1988) Internal Combustion Engine Fundamentals, McGraw-Hill, New York. Hindsgaul, C., Schramm, J., Gratz, L., Henriksen, U. and Bentzen, J.D. (2000) ‘Physical and
chemical characterization of particles in producer gas from wood chips’, Bioresource Technology, Vol. 73, pp.147–155.
Huang, J. and Crookes, R.J. (1998) ‘Assessment of simulated biogas as a fuel for the spark ignition engine’, Fuel, Vol. 77, pp.1793–1801.
Karim, G.A. and Ali, I.A. (1975) ‘Combustion, knock and emission characteristics of a natural gas fuelled spark ignition engine with particular reference to low intake temperature conditions’, Proceedings of the Institute of Mechanical Engineers, Vol. 189, pp.139–147.
Keck, J.C. (1982) ‘Turbulent flame structure and speed in spark-ignition engines, Proceedings of the 19th Symposium (International) on Combustion, The Combustion Institute, pp.1451–1466.
Keck, J.C., Heywood, J.B. and Noske, G. (1987) Early Flame Development and Burning Rates in Spark-Ignition Engines, SAE Paper No. 870164.
Kouremenos, D.A. and Rakopoulos, C.D. (1986) ‘The operation of a turbulence chamber diesel engine, with LPG fumigation, for exhaust emissions control’, VDI Forschung im Ingenieurwesen, Vol. 52, pp.185–190.
Lavoie, G. (1978) Correlations of Combustion Data for a SI Engine Calculations-Laminar Flame Speed, Quench Distance and Global Reaction Rates, SAE Paper No. 780229.
Lavoie, G.A., Heywood, J.B. and Keck, J.C. (1970) ‘Experimental and theoretical study of nitric oxide formation in internal combustion engines’, Combustion Science and Technology, Vol. 1, pp.313–326.
Lucas, G.G. and James, E.H. (1973) Computer Simulation of a Spark Ignition Engine, SAE Paper No. 730053.
Metghalchi, M. and Keck, J.C. (1980) ‘Laminar burning velocity of propane air-mixtures at high temperature and pressure’, Combustion and Flame, Vol. 38, pp.143–154.
Munoz, M., Moreno, F., Morea-Roy, J., Ruiz, J. and Arauzo, J. (2000) ‘Low heating value gas on spark ignition engines’, Biomass and Bioenergy, Vol. 18, pp.431–439.
Nagalingam, B., Duebel, F. and Scmillen, K. (1983) ‘Performance study using natural gas, hydrogen-supplemented natural gas and hydrogen in AVL research engine’, International Journal of Hydrogen Energy, Vol. 8, pp.715–720.
Papagiannakis, R.G. and Hountalas, D.T. (2002) Theoretical and Experimental Investigation of a Direct Injection Dual Fuel Diesel–Natural Gas Engine, SAE Paper No. 2002-02-0868.
Ramos, J.I. (1989) Internal Combustion Engine Modeling, Hemisphere, New York. Rakopoulos, C.D. (1988) ‘Ambient temperature and humidity effects on the performance and nitric
oxide emission of spark ignition engined vehicles in Athens/Greece’, Solar and Wind Technology, Vol. 5, pp.315–320.
Rakopoulos, C.D. (1993) ‘Evaluation of a spark ignition engine cycle using first and second law analysis techniques’, Energy Conversion and Management, Vol. 34, pp.1299–1314.
Rakopoulos, C.D. and Hountalas, D.T. (1998) Development and Validation of a 3-D Multi-Zone Combustion Model for the Prediction of DI Diesel Engines Performance and Pollutants Emissions, SAE Paper No. 981021 (also Transactions of the SAE, Journal of Engines, Vol. 107, pp.1413–1429).
Rakopoulos, C.D. and Kyritsis, D.C. (2001) ‘Comparative second-law analysis of internal combustion engine operation for methane, methanol and dodecane fuels’, Energy, Vol. 26, pp.705–722.

}
Study of the performance and exhaust emissions 215
Rakopoulos, C.D. and Kyritsis, D.C. (2006) ‘Hydrogen enrichment effects on the second law analysis of natural and landfill gas combustion in engine cylinders’, International Journal of Hydrogen Energy, Vol. 31, pp.1384–1393.
Rakopoulos, C.D., Hountalas, D.T., Tzanos, E.I. and Taklis, G.N. (1994) ‘A fast algorithm for calculating the composition of diesel combustion products using an eleven species chemical equilibrium scheme’, Advances in Engineering Software, Vol. 19, pp.109–119.
Rakopoulos, C.D., Rakopoulos, D.C., Giakoumis, E.G. and Kyritsis, D.C. (2004) ‘Validation and sensitivity analysis of a two-zone diesel engine model for combustion and emissions prediction’, Energy Conversion and Management, Vol. 45, pp.1471–1495.
Shretha, S.O.B. and Karim, G.A. (2001) ‘An experimental and analytical examination of the combustion period for gas-fuelled spark ignition engine applications’, Proceedings of the Institute of Mechanical Engineers – Part A, Vol. 215, pp.63–74.
Shridar, G., Paul, P.J. and Mukunda, H.S. (2001) ‘Biomass derived producer gas as a reciprocating engine fuel – an experimental analysis’, Biomass and Bioenergy, Vol. 21, pp.61–72.
Sobyanin, V., Sadykov, V., Kirillov, V., Kuzmin, V., Kuzin, N., Vostrikov, Z., Smirnov, E. and Sorokin, A. (2005) ‘Syngas as a fuel for IC and diesel engines: efficiency and harmful emissions cut-off’’, Proceedings of the International Hydrogen Energy Congress and Exposition, Istanbul, Turkey, 13–15 July 2005.
Stone, C.R. and Ladommatos, N. (1991) ‘Design and evaluation of a fast-burn spark-ignition combustion system for gaseous fuels at high compression ratios’, Journal of the Institute of Energy, Vol. 64, pp.202–211.
Stone, C.R., Gould, J. and Ladommatos, N. (1993) ‘Analysis of bio-gas combustion in spark-ignition engines, by means of experimental data and a computer simulation’, Journal of the Institute of Energy, Vol. 66, pp.180–187.
Tabaczynski, R.J., Ferguson, C.R. and Radhakrishnan, K. (1977) A Turbulent Entrainment Model for Spark-Ignition Engine Combustion, SAE Paper No. 770647.
Vickland, C.W., Strange, F.M., Bell, R.A. and Starkman, E.S. (1962) ‘A consideration of the high temperature thermodynamicbs of internal combustion engines’, Transactions of the SAE, Vol. 70, pp.785–793.