cdc infertility prevention project quality assurance guide
TRANSCRIPT

CDC INFERTILITY PREVENTION PROJECT Quality Assurance Guide
1
CDC reviews submitted IPP data to:
check values for validity, consistency, and format of individual records
identify records with an out-of-date-range specimen collection date
compare summary frequencies over time for all core variables to detect significant changes in the distribution
Each region is responsible for providing CDC with an up-to-date data codebook. The codebook should accompany a
memo detailing any issues resulting in anomalous data and should also include a data summary table. The anomalous
data issues might potentially result from reporting problems for an individual state or laboratory or any updates/changes
to the codebook. The summary table should provide the total number of records by month corresponding to each
quarterly and year-end data submission. The regional data codebook and QA memorandum are stored on the IPP server
at CDC.
Validation and continual improvement in the contents and quality of the Facility Reference File is important to correctly
capture geographic information as well as the facility type (formerly a data element in the Prevalence Dataset).
3.1 Validating Number of Records Received
CDC requests that each region send a quarterly and end-of-year summary table with the number of records submitted −
by state or project area and month of specimen collection date. CDC compares the region‟s summary table count to the
number of records uploaded to the CDC data store to ensure that all records were correctly received.
3.2 Validating Date of Specimen Collection
For each region, CDC generates a table showing the total number of records excluded from the national dataset due to a missing specimen collection date. This analysis also identifies the number of records for which the specimen collection date is invalid, i.e., outside appropriate reporting dates. The regions are notified of these anomalies and given an opportunity to review/address them before the end-of-year close out date.
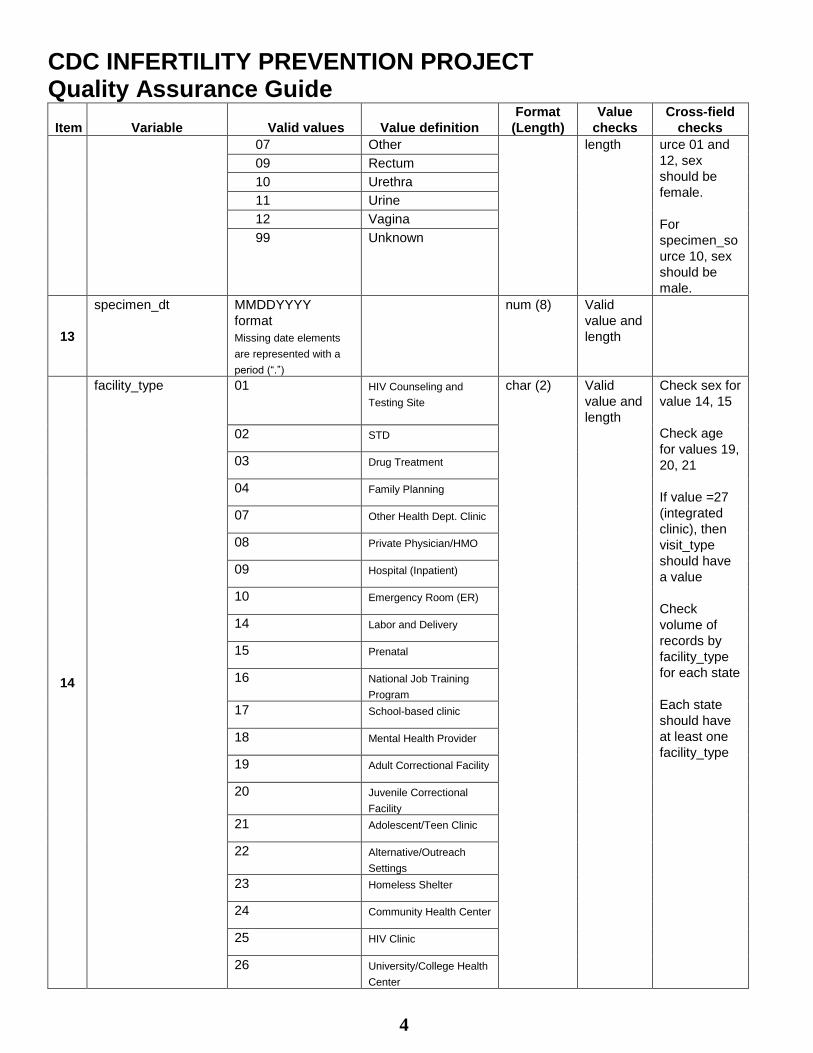
3.3 Variable Format and Length Requirements
CDC will validate regional submission to ensure that they meet the variable format and length requirements outlined in the National Data Codebook for all core variables in the prevalence monitoring and facility reference files. Variable format and length requirements are included in Table 3. Records that do not meet these specifications are identified via report output with a description of the validity check in a summary list. The regions are notified of these invalid records and given an opportunity to review/address them before the end-of-year close out date.
3.4 Value Requirements
Records that do not meet the value specifications shown in Table 3 or that have missing values are identified via report output with a description of the validity check in a summary list. The regions are notified of these invalid or missing data and given an opportunity to review/address them before the end-of-year close out date.
3.5 Cross-field Requirements
Records that do not meet the cross-field specifications shown in Table 3 are identified via report output with a description of the validity check in a summary list. The regions are notified of these invalid records and given an opportunity to review/address them before the end-of-year close out date.

CDC INFERTILITY PREVENTION PROJECT Quality Assurance Guide
2
TABLE 3. Key IPP Variables and corresponding value, format (length), and cross-field specifications
Item Variable Valid values Value definition
Format
(Length)
Value
checks
Cross-field
checks
1
Region 01 Region 1 char (2) Valid
value and
length
Compare
value for
Region
against
source of
regional data
file
02 Region 2
03 Region 3
04 Region 4
05 Region 5
06 Region 6
07 Region 7
08 Region 8
09 Region 9
10 Region 10
2
quarter 0
End of Year char (1) Valid
value and
length
Quarter
must
correspon
d to valid
quarter.
1 Quarter 1
2 Quarter 2
3 Quarter 3
4 Quarter 4
3
year Format: YYYY
Range: 1988 –
present
char (4) Valid
value and
length
Year
must
correspon
d to valid
Year
4
state_code 2-digit code
identifying state of
patient residence
Refer to:
http://www.itl.nist.go
v/fipspubs/
See Section 3 for
more detailed
information
char (2) Valid
value and
length
5
facility_state_code 2-digit code
identifying state of
facility location
Refer to:
http://www.itl.nist.go
v/fipspubs/
See Section 3 for
more detailed
information
char (2) Valid
value and
length
Check that
facility_state
_code
„belongs to‟
the specified
region
6
county_code 3-digit code
identifying county
Refer to:
http://www.itl.nist.go
v/fipspubs/
char (3) Valid
value and
length
Future plan −
Check that
county is
valid for state
7
birth_dt MMDDYYYY format
Missing date elements
are represented with a
period (“.”)
num(8) Valid
value and
length
„YYYY‟
should be

CDC INFERTILITY PREVENTION PROJECT Quality Assurance Guide
3
Item Variable Valid values Value definition
Format
(Length)
Value
checks
Cross-field
checks
between
(current
year-99)
and
current
year
8
age Range: 00 - 99
Unknown values are left
blank
char (2) Valid
value and
length
9
calculated_age Range: 00 - 99
Invalid or unknown
values are left blank
char (2) Valid
value and
length
Note: CDC
creates this
variable
10
sex 1 Male char (1) Valid
value and
length
Note: A blank
field is
captured as
Missing data.
2 Female
9 Unknown
11
race_a 1 Yes char (1) Valid
value and
length
Need at least
one race or
ethnicity value
race_i 1 Yes char (1) Valid
value and
length
Need at least
one race or
ethnicity value
race_b 1 Yes char (1) Valid
value and
length
Need at least
one race or
ethnicity value
race_p 1
Yes char (1) Valid
value and
length
Need at least
one race or
ethnicity value
race_w 1 Yes char (1) Valid
value and
length
Need at least
one race or
ethnicity value
race_o 1 Yes char (1) Valid
value and
length
Need at least
one race or
ethnicity value
race_u 1 Yes char (1) Valid
value and
length
Need at least
one race or
ethnicity value
race_r 1 Yes char (1) Valid
value and
length
Need at least
one race or
ethnicity value
race_al 1 Yes char (1) Valid
value and
length
Need at least
one race or
ethnicity value
ethnicity 1 Yes, Hispanic or
Latino
char (1) Valid
value and
length
Need at least
one race or
ethnicity value 2 No, Not Hispanic or
Latino
9 Unknown
12 specimen_source 01 Cervix/Endocervix char (2) Valid
value and
For
specimen_so05 Oropharnyx
CDC INFERTILITY PREVENTION PROJECT Quality Assurance Guide
4
Item Variable Valid values Value definition
Format
(Length)
Value
checks
Cross-field
checks
07 Other length urce 01 and
12, sex
should be
female.
For
specimen_so
urce 10, sex
should be
male.
09 Rectum
10 Urethra
11 Urine
12 Vagina
99 Unknown
13
specimen_dt MMDDYYYY
format
Missing date elements
are represented with a
period (“.”)
num (8) Valid
value and
length
14
facility_type 01 HIV Counseling and
Testing Site
char (2) Valid
value and
length
Check sex for
value 14, 15
Check age
for values 19,
20, 21
If value =27
(integrated
clinic), then
visit_type
should have
a value
Check
volume of
records by
facility_type
for each state
Each state
should have
at least one
facility_type
02 STD
03 Drug Treatment
04 Family Planning
07 Other Health Dept. Clinic
08 Private Physician/HMO
09 Hospital (Inpatient)
10 Emergency Room (ER)
14 Labor and Delivery
15 Prenatal
16 National Job Training
Program
17 School-based clinic
18 Mental Health Provider
19 Adult Correctional Facility
20 Juvenile Correctional
Facility
21 Adolescent/Teen Clinic
22 Alternative/Outreach
Settings
23 Homeless Shelter
24 Community Health Center
25 HIV Clinic
26 University/College Health
Center

CDC INFERTILITY PREVENTION PROJECT Quality Assurance Guide
5
Item Variable Valid values Value definition
Format
(Length)
Value
checks
Cross-field
checks
27 Integrated Clinic
28 School Screening
29 Hospital (Outpatient)
66 Indian Health Service
77 Military
88 Other
15
visit_type 1 Family Planning char (1) Valid
value and
length
Check sex
for value 3
2 STD
3 Prenatal
4 Other
9 Not Available
16
facility_link_id char (24) Valid
value and
length
17
lab_id Format varies by
region.
char (20) Valid
value and
length
Check
volume of
records by
facility_state_
code (to
ensure that
there is a
lab_id for
every state)
18
ct_test_type 17.1 TMA/GP/Aptima Combo
2CT/GC
char (4) Valid
value and
length
Check the
volume of
records by
ct_test_rslt
because
each
ct_test_rslt
should have
a
ct_test_type.
18.1 SDA/BD/BDProbeTec
CT/GC
19.1 PCR/Roche/Amplicor
CT/GC
19.2 PCR/Roche/COBAS
CT/GC
20 Nucleic Acid
Hybrid./GP/PACE
2CT/GC
21 Signal
Amplification/Digene/Hybr
id Capture 2 CT/GC DNA
09.1 TMA/GP/Aptima CT
06.1 PCR/Roche/Amplicor CT

CDC INFERTILITY PREVENTION PROJECT Quality Assurance Guide
6
Item Variable Valid values Value definition
Format
(Length)
Value
checks
Cross-field
checks
06.2 PCR/Roche/COBAS
Amplicor CT
08.1 SDA/BD/BDProbeTec CT
05.1 Nucleic Acid
Hybrid./GP/PACE 2CT
04 EIA
03 DFA
02 Culture
88 Other
99 Unknown
19
ct_test_rslt 1 - Positive
2 - Negative
3 - Indeterminate/E
quivocal
9 - Unknown
char (1) Valid
value and
length
Check cross-
tab of
gc_test_rslt
and
ct_test_rslt
by
facility_state_
code to verify
that each test
record has
either a ct or
gc test result
(or both).
20
gc_test_type 17.1 TMA/GP/Aptima Combo
2CT/GC
char (4) Valid
value and
length
Check the
volume of
records by
gc_test_rslt
because
each
gc_test_rslt
should have
a
gc_test_type.
18.1 SDA/BD/BDProbeTec
CT/GC
19.1 PCR/Roche/Amplicor
CT/GC
19.2 PCR/Roche/COBAS
CT/GC
20 Nucleic Acid
Hybrid./GP/PACE
2CT/GC

CDC INFERTILITY PREVENTION PROJECT Quality Assurance Guide
7
Item Variable Valid values Value definition
Format
(Length)
Value
checks
Cross-field
checks
21 Signal
Amplification/Digene/Hybr
id Capture 2 CT/GC DNA
16.1 TMA/GP/Aptima GC
11.1 Nucleic Acid
Hybrid./GP/PACE 2GC
12.1 PCR/Roche/Amplicor GC
12.2 PCR/Roche/COBAS
Amplicor NG
15.1 SDA/BD/BDProbeTec GC
10 Culture
88 Other
99 Known
21
gc_test_rslt 1 Positive char (1) Valid
value and
length
Check cross-
tab of
gc_test_rslt
and
ct_test_rslt
by
facility_state_
code to verify
that each test
record has
either a ct or
gc test result
(or both).
2 Negative
3 Indeterminate
/ Equivocal
9 Unknown
22
facility_id char (22) Valid
value and
length
23
facility_name char(100) Valid
value and
length
24
facility_city_code char(6) Valid
value and
length
Future plan -
Check cross-
tab of
facility_city_c
ode and
facility_city_n
ame to verify
that each city
code has a
correspondin
g city name.
25 facility_city_name char(100) Valid
value and

CDC INFERTILITY PREVENTION PROJECT Quality Assurance Guide
8
Item Variable Valid values Value definition
Format
(Length)
Value
checks
Cross-field
checks
length
26
facility_county_code char(3) Valid
value and
length
Future plan-
Check cross-
tab of
facility_count
y_code and
facility_count
y_name to
verify that
each city
code has a
correspondin
g county
name.
27
facility_county_name char(100) Valid
value and
length
28
facility_state_postal char(2) Valid
value and
length
29
facility_zip_code char(5) Valid
value and
length
3.6 Aberration Detection
CDC compares the total number of regional records received by state with the number of records received during the
previous reporting time periods (quarters, years) to identify any significant changes in volume. CDC then compares the
current frequency distributions of variables shown in TABLE 4 with the same distributions from previous reporting
periods. For each variable noted, a volume that varies more than 15% up or down will be flagged for further evaluation.
TABLE 4. Record counts checked for changes in volume over time by region (and state)
Variable Record count trends for:
facility_state_code state
age age (in individual years)
sex gender
race_check race_a Asian
race_b Black
race_i American Indian
race_o Other
race_p Pacific Islander
race_u Unknown
race_w White
ethnicity
specimen_source 10 different sources
facility_type 27 different types
ct_test_type NAATS, non-NAATS
ct_test_rslt
gc_test_type
gc_test_rslt

CDC INFERTILITY PREVENTION PROJECT Quality Assurance Guide
9
3.7 Chlamydia positivity distribution
Chlamydia positivity distribution by state is analyzed by age group and facility type. Table 1 from this output (not
shown here) identifies inconsistencies in chlamydia positivity and the total number of tests by quarter for the
following age ranges:
10−14
15−19
20−24
25−29
30−34
For example, regional data are expected to indicate a higher percent positivity for the age group 15−19 than for the
age group 30-34. Historically, QA reviews have not quantified the expected differences in positivity between age
groups. However, future efforts may include reviewing data trends to identify the expected differences in positivity
levels.
Table 2 from this output (not shown here) identifies the inconsistencies in chlamydia positivity and the total number
of tests by facility type for each quarter. Research is required for any noted:
missing data
large increases and decreases in the percent positivity
changes greater than 15% in the number of tests compared to previously reported counts
For example, regions should research and document any new facility types (as well as any missing data,
increases/decreases in percent positivity, or changes in the number of tests). Also, the percent positivity reported
by the family planning clinics is expected to be lower than for the STD clinics. To capture non-seasonal
differences, quarterly positivity rates should be compared with the quarterly rates from the previous year rather
than with quarters within the same year.
3.8 Laboratory Validation
This validation compares laboratory IDs by region for each state in order to verify that each lab associated with a
chlamydia or gonorrhea test result.CDC also attempts to identify any laboratories no longer included in the regional
datasets.
3.9 Laboratory test method validation
This validation is conducted for each state (by region) using a frequency table for laboratory ID and chlamydia test type.
The table is used to validate the chlamydia test types reported by state (or project area) and to determine if there are
changes in reported ct_test_type. If a laboratory changes test methods, the region must verify that change. This
validation is repeated for gonorrhea test type.
3.10 Merging Prevalence Monitoring data with the Facility Reference File
Merging the prevalence monitoring data with the Facility Reference File generates a facility listing that identifies the data
with which a facility is associated as well as the total number of tests reported by each facility. CDC reviews this listing
for missing facility information.

CDC INFERTILITY PREVENTION PROJECT Quality Assurance Guide
10
Appendix 2
Quality Assurance
Sample SAS Outputs
Output 1. Reference Section 3.1 – Validating Number of Records Received
Table of STATE by month year
STATE Month year
Frequency JAN10 FEB10 MAR10 APR10 MAY10 JUN10 Total
599 664 1274 1351 1234 947 6069
BA 8722 8670 11233 9520 9360 9627 57132
GN 21061 22219 25577 24722 22629 24559 140767
HA 13192 14449 17075 14600 13698 14708 87722
MP 6220 7534 8123 7589 7031 7688 44185
OC 9025 8718 10521 9198 8871 10008 56341
PC 6457 6320 7985 6984 6253 6295 40294
WN 9180 9358 11064 9808 8631 7350 55391
Total 74456 77932 92852 83772 77707 81182 487901
Output 2 . Reference Section 3.2 – Validating Date of Specimen of Collection
3.2 Validating Date of Specimen Collection - '2010 Quarter 2'
Region # - Total records with missing or invalid specimen date by region by state
State
Total
records
BA 0
GN 0
HA 188
MP 0
OC 0
PC 9
WN 0

CDC INFERTILITY PREVENTION PROJECT Quality Assurance Guide
11
Output 3. Reference Sections 3.3, 3.4 and 3.5 – Variable Format, Length, Value & Cross-field Requirements
Check_type Variable Check message
*Invalid
value
*Invalid
Variable
Format
*Invalid
Variable
Length
Number
of
records
3.5 - Cross-field check region invalid region number in region variable . . 1
3.5 - Cross-field check quarter records not in the quarter . . 245
3.4 - Value check facility_state_code missing value . . 606
3.5 - Cross-field check birth_dt records less than specimen date year minus 99 years . . 589
3.5 - Cross-field check birth_dt records greater than specimen year . . 9
3.4 - Value check race_check missing value missing . . 4
3.4 - Value check race_a invalid value . . . 497
3.4 - Value check race_i invalid value . . . 499
3.4 - Value check race_b invalid value . . . 142
3.4 - Value check race_p invalid value . . . 501
3.4 - Value check race_w invalid value . . . 382
3.4 - Value check race_o invalid value . . . 490
3.4 - Value check race_u invalid value . . . 499
3.4 - Value check ethnicity missing value . . 15
3.4 - Value check specimen_source missing value . . 154
3.5 - Cross-field check specimen_source invalid sex for specimen_source(cervix/vagina) . . 255
3.5 - Cross-field check specimen_source invalid sex for specimen_source (urethra) . . 385
3.4 - Value check facility_type missing value . . 606
3.5 - Cross-field check facility_type invalid age for juvenile corrections . . 388
3.5 - Cross-field check facility_type integrated clinics with missing or N/A visit_type . . 431
3.4 - Value check visit_type missing value . . 158
3.5 - Cross-field check visit_type invalid sex for visit type(prenatal) . . 11
3.3 - Format and Length check ct_test_type invalid variable length . 3 .
3.4 - Value check ct_test_type invalid value 08. . . 27
3.4 - Value check ct_test_type invalid value 17. . . 487
3.3 - Format and Length check gc_test_type invalid variable length . 3 .
3.4 - Value check gc_test_type invalid value 17. . . 487
3.5 - Cross-field check gc_test_type gc_test_type without gc_test_rslt . . 12
3.4 - Value check gc_test_rslt missing value . . 12
3.3 - Format and Length check facility_city_code invalid variable length . 4 .

CDC INFERTILITY PREVENTION PROJECT Quality Assurance Guide
12
Output 4. Reference Section 3.6 -- Aberration Detection
3.6 – Sex by Quarter (Percent change is bold, when less than equal -15% or greater than equal 15%)
Region
Sex
2009
Q1 Q2 Q3 Q4
2009
Total
2010
Q1 Q2 Q3 Q4
2010
Total
% change
2009-2010
% change
10q1-10q1
% change
10q2-10q2
00 F 2611 2505 2440 2115 9671 2341 1871 0 0 4212 -56.44 -10.3 -25.3
Output 5. Reference Section 3.7 -- CT positivity distribution (Table 1)
Region 00 - CHLAMYDIA - Females in Family Planning - Positivity by state by Age Group (Percent change is bold, when
less than equal -15% or greater than equal 15%)
ST Age Group
2009 Pvty
2009 #
Tested
Qtr 1 2010 Pvty
Qtr 1 2010
# Tested
Qtr 2 2010 Pvty
Qtr 2 2010
# Tested
Qtr 3 2010 Pvty
Qtr 3 2010
# Tested
Qtr 4 2010 Pvty
Qtr 4 2010
# Tested
2010 Pvty
2010 Total
# Tested
% change 2009-2010 Pvty
% change 2009-2010
# Tested
BA . 6.78% 59 . . . . . . . . . 0 NA -100.0
< 10 . 2 . 48 . 22 5.00% 20 8.33% 24 2.63% 114 NA 5600.0
10 - 14 4.20% 690 2.60% 192 3.40% 147 5.11% 137 5.22% 134 3.93% 610 -6.4 -11.6
15 - 19 6.84% 13059 7.27% 3162 7.90% 2938 8.45% 2676 7.52% 2834 7.76% 11610 13.5 -11.1
20 - 24 6.42% 17940 6.69% 4203 6.52% 4205 7.16% 4272 5.92% 3933 6.59% 16613 2.6 -7.4
25 - 29 5.31% 7009 5.69% 1563 4.43% 1467 4.85% 1443 5.04% 1389 5.02% 5862 -5.5 -16.4
30 - 39 3.54% 4093 3.23% 866 3.07% 748 2.78% 792 2.99% 737 3.02% 3143 -14.7 -23.2
40 - 90 3.16% 2217 1.62% 557 1.17% 426 2.20% 454 1.87% 428 1.72% 1865 -45.7 -15.9
Reference Section 3.7 -- CT positivity distribution (Table 2)
Region 00 - CHLAMYDIA - Positivity by state by facility_type (Percent change is bold, when less than equal -15% or
greater than equal 15%)
ST Fac
type
2009
Pvty
2009
# Tested
Qtr 1
2010 Pvty
Qtr 1
2010 #
Tested
Qtr 2
2010 Pvty
Qtr 2
2010 #
Tested
Qtr 3
2010 Pvty
Qtr 3
2010 #
Tested
Qtr 4
2010 Pvty
Qtr 4
2010 #
Tested
2010
Pvty
2010
Total #
Tested
%
change 2009-2010 Pvty
%
change 2009-2010
# Tested
BA FP 5.63% 36128 6.19% 8317 6.34% 7727 6.73% 7592 5.59% 7364 6.22% 31000 10.4 -14.2
STD 7.55% 3774 6.05% 810 3.62% 857 5.61% 945 7.86% 802 5.74% 3414 -24.0 -9.5
Jail 6.87% 4045 5.15% 1106 5.20% 1038 6.18% 1117 4.75% 948 5.35% 4209 -22.2 4.1
Other 5.88% 1122 5.87% 358 8.76% 331 6.43% 140 9.59% 365 7.87% 1194 33.8 6.4

CDC INFERTILITY PREVENTION PROJECT Quality Assurance Guide
13

CDC INFERTILITY PREVENTION PROJECT Quality Assurance Guide
14
Output 6. Reference Section 3.8 -- Laboratory Validation Table
Laboratory validation by quarter (Percent change is bold, when less than equal -15% or greater than equal 15%)
Region LAB 2009
Q1
Q2 Q3 Q4 2009
Total
2010
Q1
Q2 Q3 Q4 2010
Total
% change
09q1-10q1
% change
09q2-10q2
% change
2009-2010
00 BA-91 2611 2505 2440 2115 9671 2341 1871 0 0 4212 -10.3 -25.3 -56.4
HA-55 3815 3974 3994 3783 15566 3953 3562 0 0 7515 3.6 -10.4 -51.7
Output 7. Reference Section 3.9 -- Laboratory Test Method Validation Table
Lab Test Method Validation – CT Test Type by Lab by Quarter (Percent change is bold, when less than equal -15% or
greater than equal 15%)
Region Lab CT
Test_type
2009
Q1
Q2 Q3 Q4 2009
Total
2010
Q1
Q2 2010
Total
% chg
09q1-
10q1
% chg
09q2-
10q2
% chg
2009-
2010
00 BA-11 SDA/BD/BDProbeTec
CT/GC
2611 2505 2440 2115 9671 2341 1871 4212 -10.3 -25.3 -56.4
GN-31 SDA/BD/BDProbeTec
CT/GC
3815 3974 3994 3783 15566 3953 3562 7515 3.6 -10.4 -51.7
Lab Test Method Validation – GC Test Type by Lab by Quarter (Percent change is bold, when less than equal -15% or
greater than equal 15%)
Region Lab GC
Test_type
2009
Q1
Q2 Q3 Q4 2009
Total
2010
Q1
Q2 2010
Total
% chg
09q1-
10q1
% chg
09q2-
10q2
% chg
2009-
2010
00 BA-11 SDA/BD/BDProbeTec
CT/GC
2611 2505 2440 2115 9671 2341 1871 4212 -10.3 -25.3 -56.4
GN-31 SDA/BD/BDProbeTec
CT/GC
3815 3974 3994 3783 15566 3953 3562 7515 3.6 -10.4 -51.7

CDC INFERTILITY PREVENTION PROJECT Quality Assurance Guide
15
Output 8. Reference Section 3.10 -- Prevalence Monitoring data merge with Facility Reference File
Facility Fac Facility Line Clinic Nbr of link_id st_cd _ID Facility Name Facility_type data file tests
091 09 1 Dustinville Family Planning X X 390