cdf detector operations budget and resource planning rob roser ifc meeting october 17, 2005 1
TRANSCRIPT

CDF Detector Operations Budget
and Resource Planning
Rob Roser
IFC Meeting
October 17, 2005
1

FY05 Year in Review
● Accelerator performed well and met their metric (goals)
● CDF saw luminosities as high as 150e30!● Began slow process of constructing a trigger table for
luminosities of 200-300 e30 – requires setting physics priorities
● Completed installation and commissioning of most upgrades
– level 2 trigger decision crate– Hardware Event builder– New firmware for TDC’s – modified hardware– New secondary vertex track trigger made substantial progress – Central preradiator – a new detector system installed in 2004
shutdown part of stable operations since the beginning of 05● No significant problem of note in FY05 – We collected
data with an average efficiency of 85%
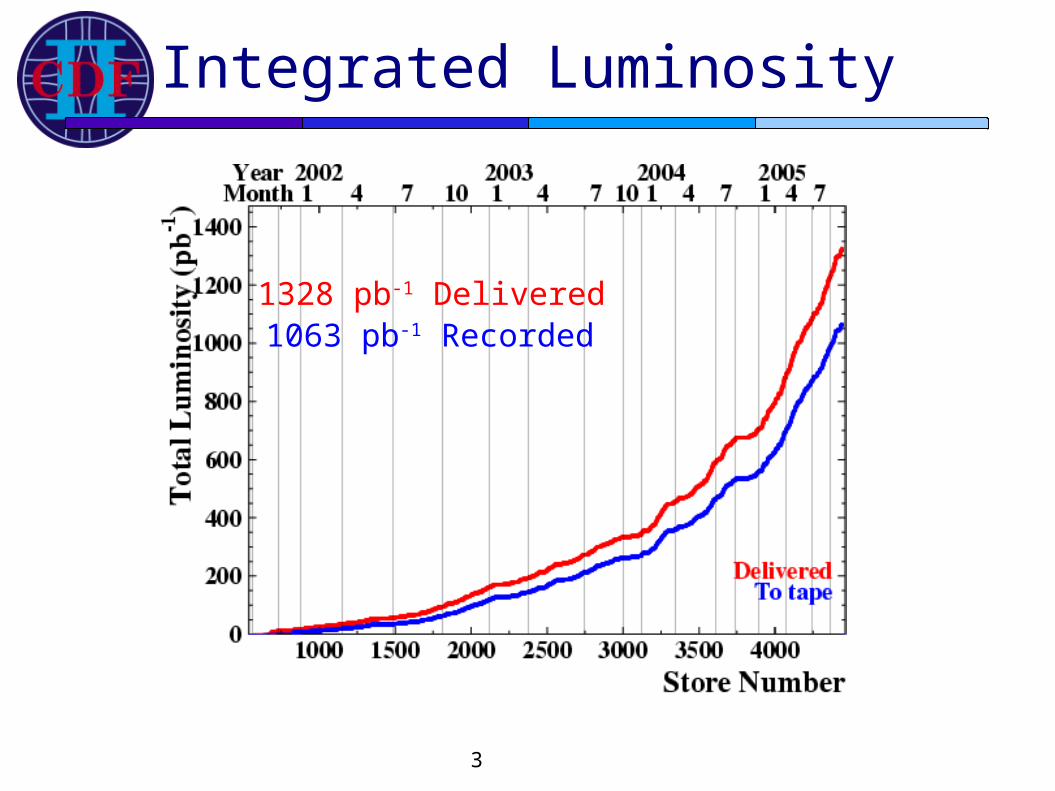
Integrated Luminosity
3
1328 pb-1 Delivered1063 pb-1 Recorded

Data Taking Efficiency
4

Budget Process
● CDF requested $1.4 million for Detector Operations● Expect to get most of what we ask for – a remarkable
demonstration by the lab given its budget situation and financial pressures from future initiatives
● Reminder that much of detector operations deals with fixed costs (flammable gas, cryogens, computer maintenance…) ~$900k can be written now to cover next year
● Visitor budget held constant, no where near sufficient to honor all requests
● Working with the lab to get additional technical staff to reduce burden on scientists where appropriate

M&S Budget
Category Explanation FY05 Actual FY06 Req.Computing On-line DAQ, Level 3,
licensing, slow controls
$500k $350k
Consumables Argon, Ethane, LN2, He, Alcohol
$600k $450k
Time and Materiallabor (T&M)
Electrical, rigging, HVAC Maintenance
$50k $25k
Infrastructure Maintenance
HVAC, Compressors, Engines, pumps
$200k $225k
General Operating phones, pagers, vehicles, office supplies misc catchall
$200k $200k
Mechanical Support Pipes, fittings, bolts, tools, safety
$100k $75k
Upgrades Installation Costs (e.g. Scaffolding..)
$150k $25k
Total $1,800k $1,350k
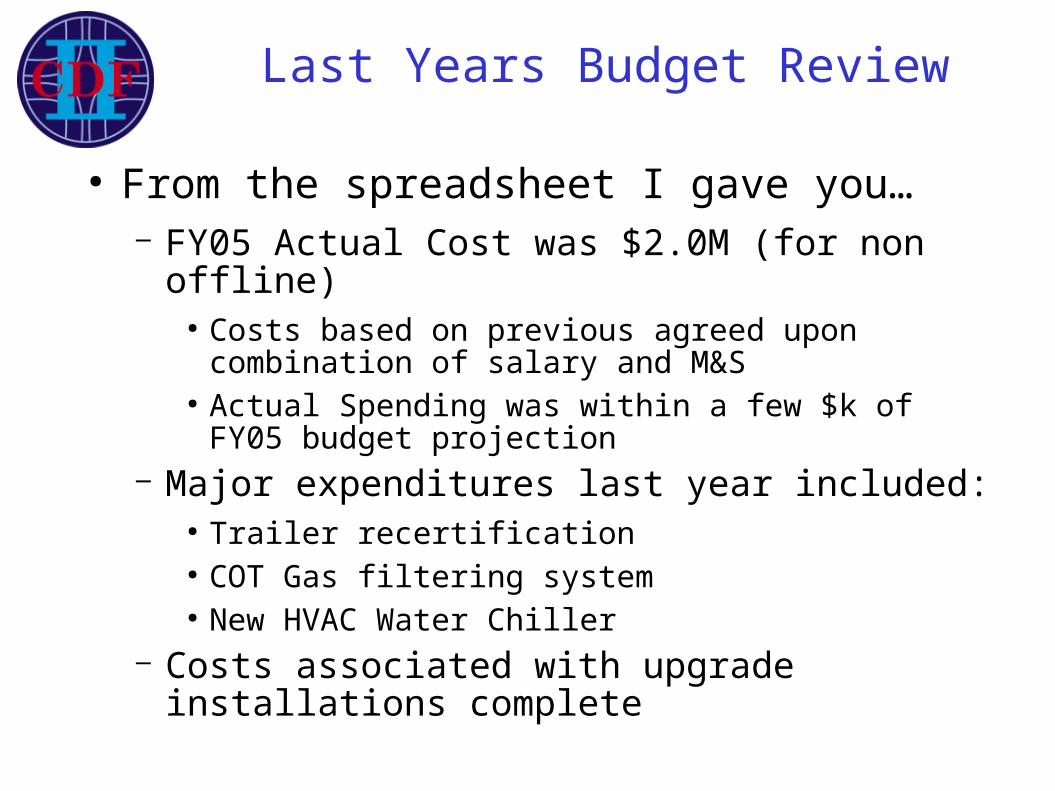
Last Years Budget Review
● From the spreadsheet I gave you…– FY05 Actual Cost was $2.0M (for non offline)
● Costs based on previous agreed upon combination of salary and M&S
● Actual Spending was within a few $k of FY05 budget projection
– Major expenditures last year included:● Trailer recertification● COT Gas filtering system● New HVAC Water Chiller
– Costs associated with upgrade installations complete

Data Taking Operations
● Difficult to keep enthusiasm for taking data over an 8-10 year data run
● Working on ways to either make it easier to participate or reduce the scientific effort required– Testing a remote control room.
● Reduces travel● Covers difficult midnight shift here
– Working with the lab to replace some positions currently staffed by scientists with trained Fermilab technical staff on shift

Evaluating Personnel Resource Availability
http://www.fnal.gov/directorate/program_planning/P5/P5_Sept2005/HEPAP_Subpanel_P5_Meeting.html

Summary Plot of Needs
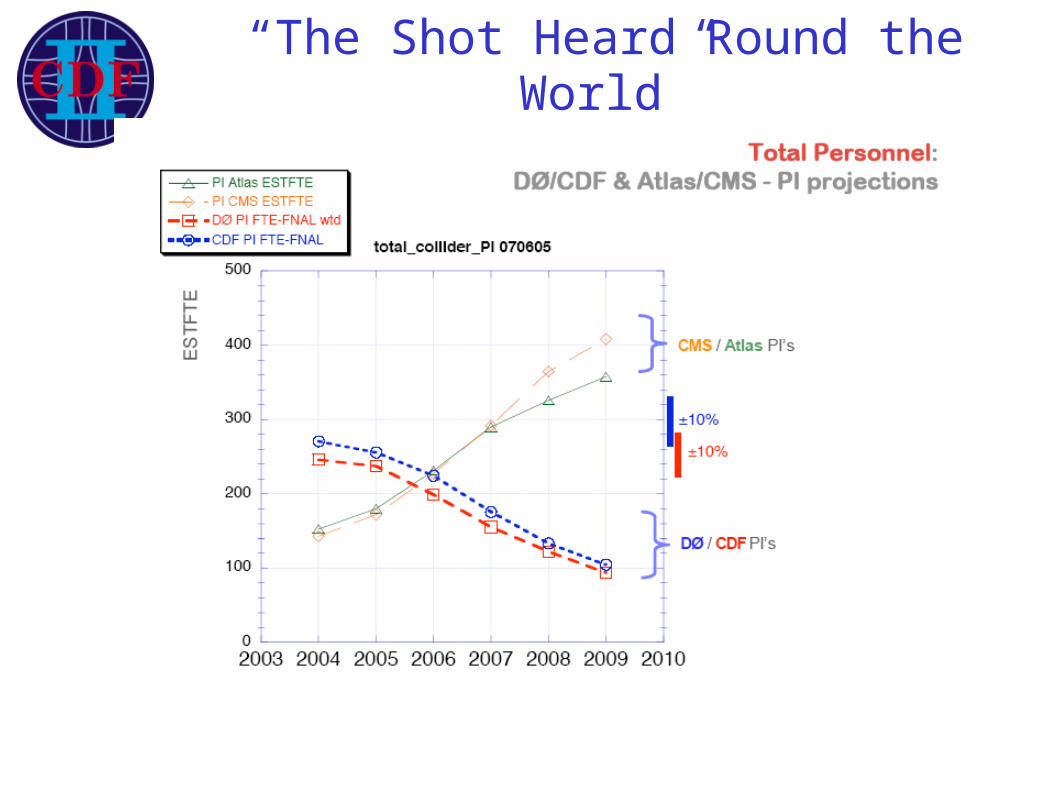
“The Shot Heard Round the World”

Summary of Needsin FTE’s
2007 2009
Operations 55 55
Offline 26 20
Management 10 10
Algorithms 35 26
Total Service 126 111
FTE fraction of total working week. NOT: fraction of research time; NOT fraction of
40 hour week!
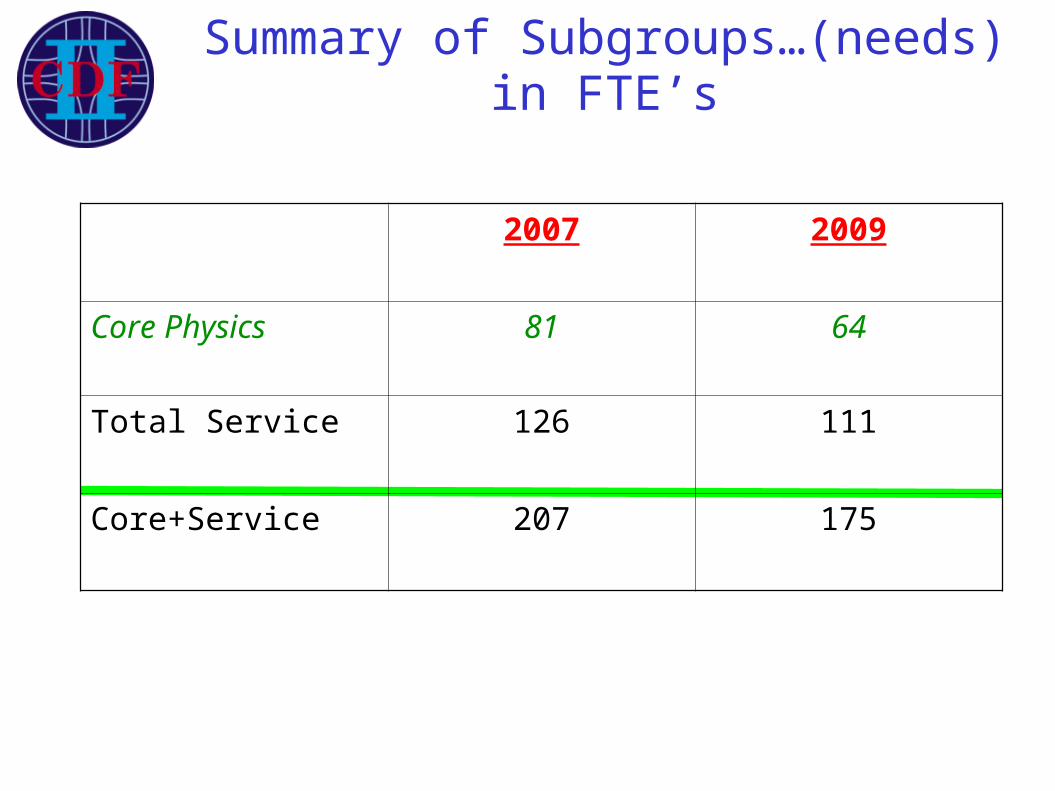
Summary of Subgroups…(needs)in FTE’s
2007 2009
Core Physics 81 64
Total Service 126 111
Core+Service 207 175

“Person-power” survey
● Spreadsheet developed as first stage in DØ 2005-2007 MOU(that we stole)
● Request FTE(2.) effort dedicated to CDF vs Year– Faculty, scientist, postdoc, student
● Request details of institutional commitments ● Notes:
1. 2008-2009 less certain…
2. FTE fraction of total working week.
NOT: fraction of research time; NOT fraction of 40 hour week!
● Responses from 53/57 institutes
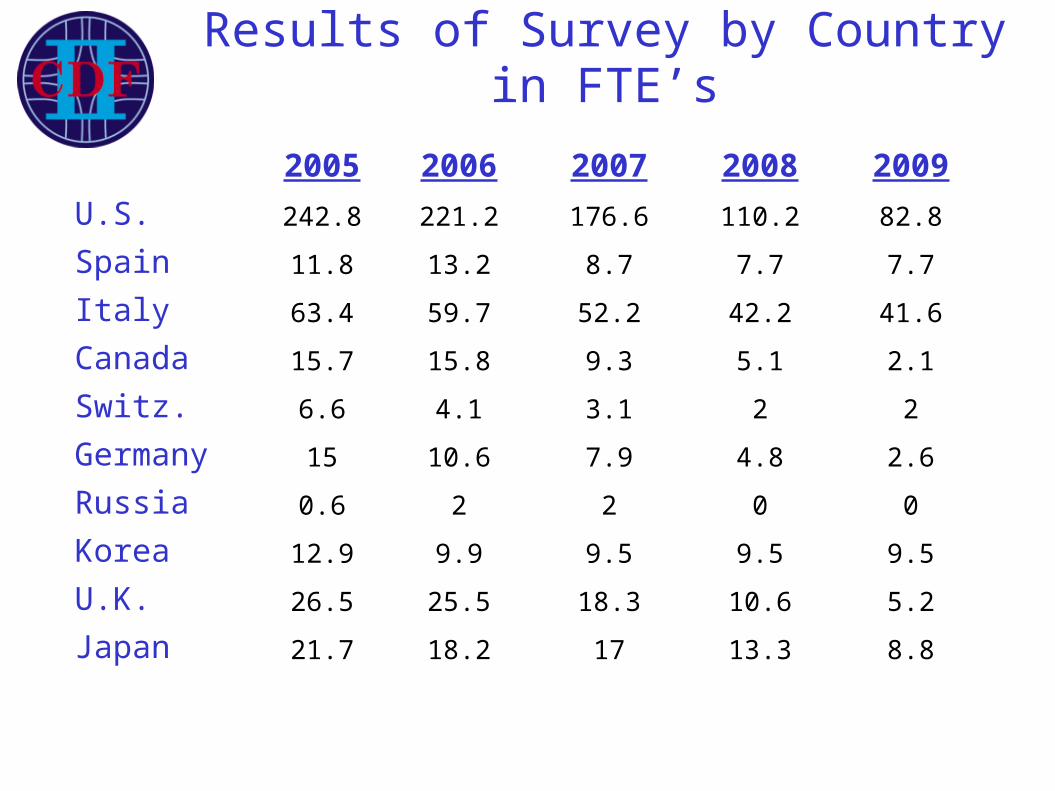
Results of Survey by Countryin FTE’s
2005 2006 2007 2008 2009
U.S. 242.8 221.2 176.6 110.2 82.8
Spain 11.8 13.2 8.7 7.7 7.7
Italy 63.4 59.7 52.2 42.2 41.6
Canada 15.7 15.8 9.3 5.1 2.1
Switz. 6.6 4.1 3.1 2 2
Germany 15 10.6 7.9 4.8 2.6
Russia 0.6 2 2 0 0
Korea 12.9 9.9 9.5 9.5 9.5
U.K. 26.5 25.5 18.3 10.6 5.2
Japan 21.7 18.2 17 13.3 8.8
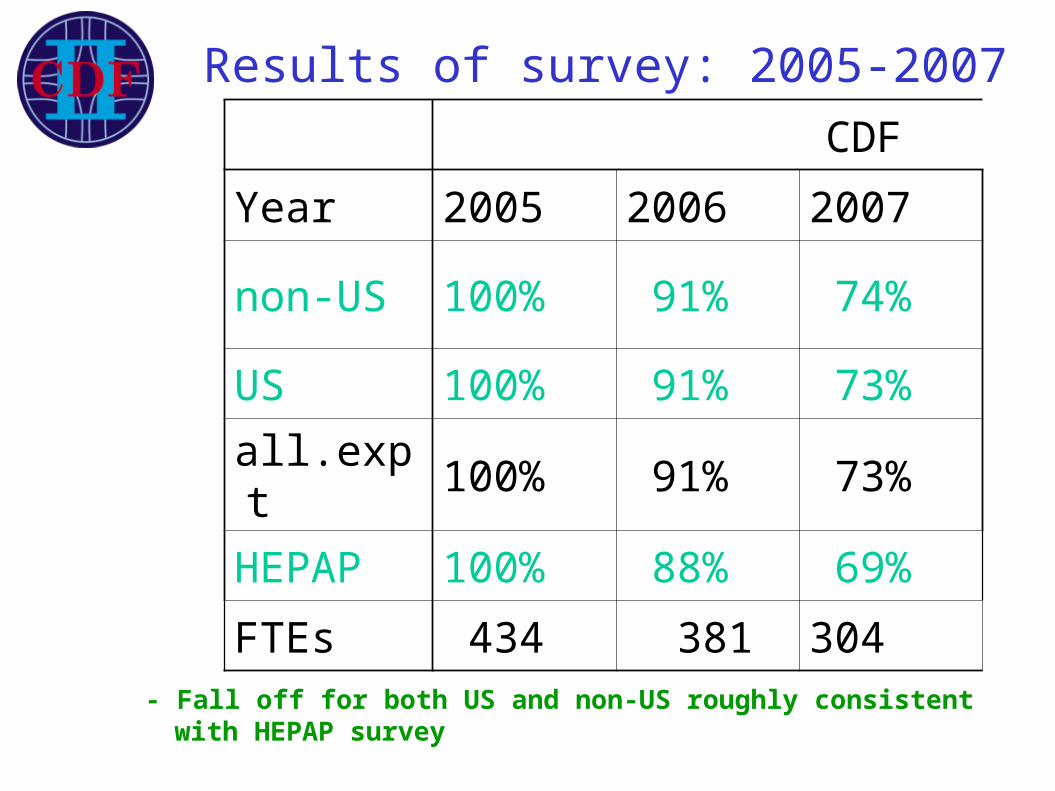
Results of survey: 2005-2007
- Fall off for both US and non-US roughly consistent with HEPAP survey
CDF
Year 2005 2006 2007
non-US 100% 91% 74%
US 100% 91% 73%
all.expt 100% 91% 73%
HEPAP 100% 88% 69%
FTEs 434 381 304
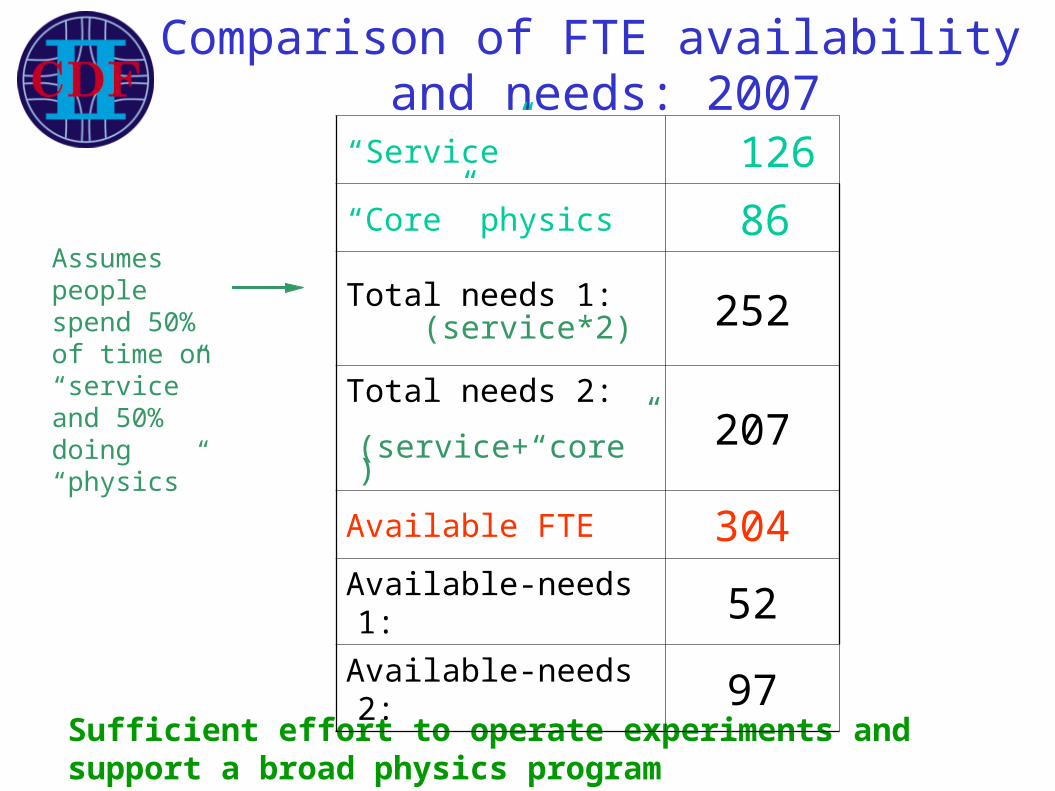
Comparison of FTE availability and needs: 2007
Sufficient effort to operate experiments and support a broad physics program
Assumes people spend 50% of time on “service” and 50% doing “physics”
“Service” 126
“Core” physics 86
Total needs 1: (service*2) 252
Total needs 2: (service+“core”) 207
Available FTE 304
Available-needs 1: 52
Available-needs 2: 97

Results for 2009
Calculated from 2007 MOU FTEs using HEPAP ratio for 2009/2007
Expt. CDF
Available FTEs
non-US 75
US 116
all.expt 191
Needed FTEs1: service*2 222
2: service+core 175
Available -needed FTEs
1: -31
2: 16
If we used the survey, Total available is 162 FTE

Conclusions
● CDF is operating well. FY05 was a very good year for us!
● Spending has been in line with our budget requests.
● Staffing at the moment looks ok – but requires constant attention and management to insure we are able to cover our needs

BACKUP

Detector Operations Detail
Management 5 250
Alarms and Controls 1 100
Online and Data Acquisition 8 350
Data Quality Monitoring 8 110
Silicon Detectors 17 725
Outer Tracker 5 230
Calorimeters 14 260
Muons 13 300
Subgroup
#
Peop
le
Tota
l %
FTE/s
ub
gro
up
Time of Flight 2 50
Luminosity Detector 2 100
Trigger 5 250
Level 1 Trigger 7 225
Level 2 Trigger 8 130
Event Builder/Level 3 Trigger 7 225
Total Scientific Effort 123 3300
Infrastructure Support 21 2040
Shift 312 2241

Diving Down in Operations
• Calorimeter Subsystem is comprised of the following categories…
• Each one has an estimate associated with it.
• For CDF, the numbers are shown to the right…
People FTE
Central EM 1 0.3
Central hadronic
1 0.3
Electronics 4 0.3
Forward 2 0.4
Far Forward 1 0.3
Timing 2 0.2
Leadership 2 0.5
HV 1 0.3
TOTAL 14 2.6

Core Physics Analysis
● Picked 10 physics analyses that are scientifically compelling measurements and demonstrate the potential of the collider program – a combination of precision measurements
and searches/discovery potential– Searches
● SM and MSSM Higgs, SUSY searches, Z’, LED, Bs
– Precision● Top mass, Vtb, W mass, Vtb, Bs mixing, Bs
lifetime
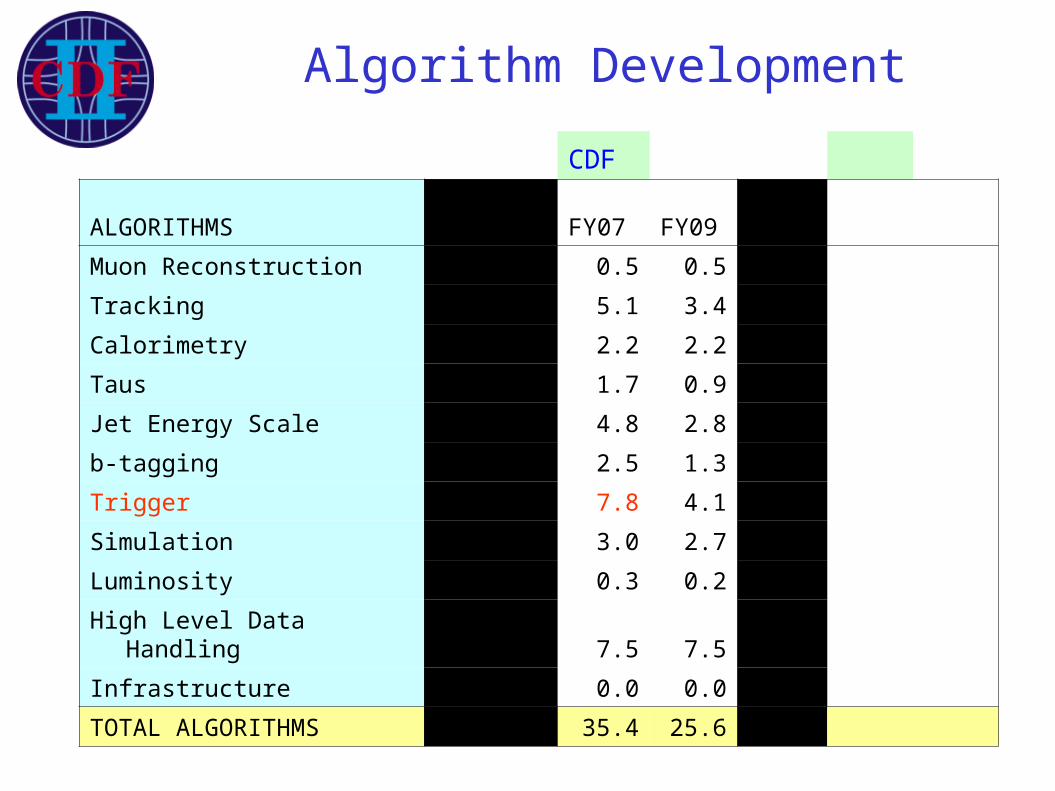
Algorithm Development
CDF
ALGORITHMS FY05 FY07 FY09
Muon Reconstruction 0.5 0.5 0.5
Tracking 8.9 5.1 3.4
Calorimetry 2.7 2.2 2.2
Taus 1.8 1.7 0.9
Jet Energy Scale 10.0 4.8 2.8
b-tagging 3.5 2.5 1.3
Trigger 6.5 7.8 4.1
Simulation 5.5 3.0 2.7
Luminosity 0.3 0.3 0.2
High Level Data Handling 7.5 7.5 7.5
Infrastructure 0.0 0.0 0.0
TOTAL ALGORITHMS 47.2 35.4 25.6
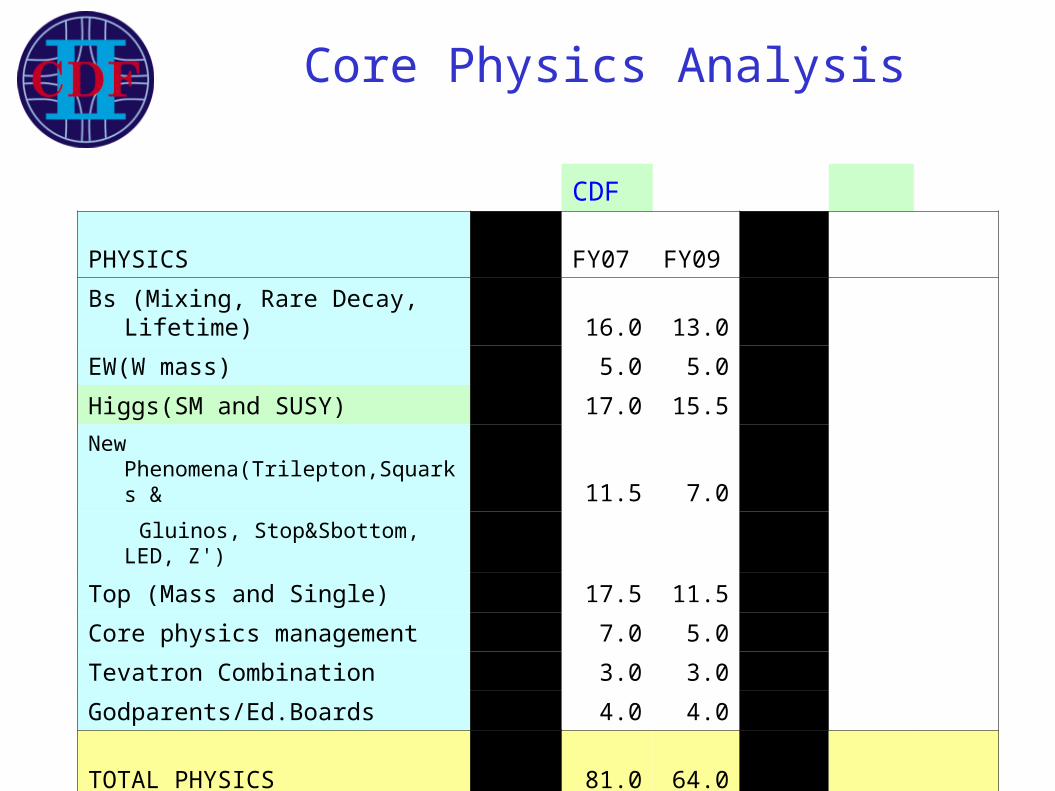
Core Physics Analysis
CDF
PHYSICS FY05 FY07 FY09 FY05
Bs (Mixing, Rare Decay, Lifetime) 18.5 16.0 13.0 22.0
EW(W mass) 5.0 5.0 5.0 13.0
Higgs(SM and SUSY) 17.0 17.0 15.5 19.5
New Phenomena(Trilepton,Squarks & 14.5 11.5 7.0 13.0
Gluinos, Stop&Sbottom, LED, Z')
Top (Mass and Single) 19.5 17.5 11.5 22.5
Core physics management 7.0 7.0 5.0 7.0
Tevatron Combination 0.3 3.0 3.0 0.3
Godparents/Ed.Boards 4.0 4.0 4.0 4.0
TOTAL PHYSICS 88.5 81.0 64.0101.
3