cdp 2014 investor - air products & chemicals/media/files/pdf/company/cdp-2014-response.pdf2...
TRANSCRIPT

CDP 2014 Investor CDP 2014 Information Request

2
Module: Introduction
CC0.1 Introduction
Please give a general description and introduction to your organization Air Products (NYSE:APD) serves customers in technology, energy, healthcare and industrial markets worldwide with a unique portfolio of products, services and solutions, providing atmospheric, process and specialty gases; performance materials; and equipment and services. For over 70 years, the company has enabled customers to become more productive, energy efficient and sustainable. With fiscal 2013 annual revenues of $10 billion, operations in more than 50 countries, and 21,600 employees, we strive to build lasting relationships with our customers and communities based on understanding, integrity and passion.
Air Products ranks 276th in sales among FORTUNE magazine's 2014 list of the 500 largest corporations in the United States. Corporate headquarters are located in eastern Pennsylvania's Lehigh Valley, near Allentown; European headquarters are at Hersham, near London; and Asian headquarters are in Singapore and Shanghai.
This is Air Products’ 12th consecutive response to the Carbon Disclosure Project information request. Our emissions reporting period is January 1, 2013 to December 31, 2013.
We maintain an open dialogue regarding our environmental performance, as detailed in our Corporate Sustainability (GRI) and Annual Reports [2013 Sustainability Report and 2013 Annual Report attached].
From our earliest days as a gases company with atmospheric gas separation at our core, we’ve delivered technologies and solutions that have contributed to cleaner air, energy efficiency improvements, and safer products for our customers and the communities where we live and operate. In bringing this unique capability and real answers to market problems, our commitment to protect the environment has never wavered. Over 70 years later, with the hurdles we all face in protecting the global environment from climate change, we believe the challenge of mitigating greenhouse gases (GHG) must be addressed through a diverse mix of technology solutions.
Our strategy for responding to climate change is straight forward – identify opportunities where our core technology and product strengths bring cost-effective solutions to enable our customers to reduce their overall supply-chain environmental impact, and seek to minimize GHG emissions and the potential cost impact of a carbon-constrained energy supply on our operations through continued technology innovation and energy efficiency. As a subset of Air Products’ Sustainability Council, our Greenhouse Gas (GHG) Strategy Team serves as our company-wide center of excellence on climate change and leads the company’s efforts to explore new markets and technologies. Research and development efforts include partnering with appropriate government agencies and industry consortiums around the world to advance new technologies for energy efficiency and carbon capture. With our core strengths as a leading industrial gases and materials company and a culture of product innovation, Air Products is a leading developer of technologies for capturing CO2 from fossil fuel conversion before it reaches the atmosphere, a key to Carbon Capture and Sequestration (CCS) for GHG mitigation.
We carefully follow pending climate change regulatory developments around the world and engage with governmental and non-governmental stakeholders to support a balance between economic and environmental objectives.
CC0.2 Reporting Year
Please state the start and end date of the year for which you are reporting data.
The current reporting year is the latest/most recent 12-month period for which data is reported. Enter the dates of this year first.
We request data for more than one reporting period for some emission accounting questions. Please provide data for the three years prior to the current reporting year if you have not provided this information before, or if this is the first time you have answered a CDP information request. (This does not apply if you have been offered and selected the option of answering the shorter questionnaire). If you are going to provide additional years of data, please give the dates of those reporting periods here. Work backwards from the most recent reporting year.
Please enter dates in following format: day(DD)/month(MM)/year(YYYY) (i.e. 31/01/2001).
Enter Periods that will be disclosed Tue 01 Jan 2013 - Tue 31 Dec 2013

3
CC0.3 Country List of Configuration
Please select the countries for which you will be supplying data. This selection will be carried forward to assist you in completing your response.
Argentina Netherlands
Belgium Norway
Brazil Peru
Canada Philippines Chile Poland
China Portugal
Colombia Qatar
Czech Republic Russia
Ecuador Singapore
Egypt Slovakia
France South Africa
Germany South Korea
Guatemala Spain
India Switzerland
Indonesia Taiwan
Ireland Thailand
Israel United Arab Emirates
Italy United Kingdom
Japan United States of America
Malaysia Zambia
CC0. 4 Currency selection
Please select the currency in which you would like to submit your response. All financial information contained in the response should be in this currency.
USD($)
CC0. 6 Modules
As part of the request for information on behalf of investors, electric utilities, companies with electric utility activities or assets, companies in the automobile or auto component manufacture sectors, companies in the oil and gas industry, companies in the information technology and telecommunications sectors and companies in the food, beverage and tobacco sectors should complete supplementary questions in addition to the main questionnaire.
If you are in these sectors (according to the Global Industry Classification Standard (GICS)), the corresponding sector modules will not appear below but will automatically appear in the navigation bar when you save this page. If you want to query your classification, please email [email protected].
If you have not been presented with a sector module that you consider would be appropriate for your company to answer, please select the module below. If you wish to view the questions first, please see https://www.cdp.net/en-US/Programmes/Pages/More-questionnaires.aspx.
Further Information
Attachments https://www.cdp.net/sites/2014/35/435/Investor CDP 2014/Shared Documents/Attachments/InvestorCDP2014/CC0.Introduction/2013 Annual Report.pdf https://www.cdp.net/sites/2014/35/435/Investor CDP 2014/Shared Documents/Attachments/InvestorCDP2014/CC0.Introduction/2013 Sustainability Report.pdf

4
Module: Management
CC1 Governance
CC1.1 Where is the highest level of direct responsibility for climate change within your organization?
Individual/Sub-set of the Board or other committee appointed by the Board
CC1.1a Please identify the position of the individual or name of the committee with this responsibility
At the highest level, the Board of Directors’ Environmental, Safety and Public Policy Committee, has formal oversight for environmental performance, including climate change programs, risks and opportunities.
Mr. Guillermo Novo is Sustainability Council Executive Champion and Senior Vice President and General Manager Electronics, Performance Materials, Strategy and Technology. Mr. Novo reports directly to the Chairman, President and CEO, and has direct responsibility for climate change programs within Air Products. He is a member of Air Products’ Corporate Executive Committee (CEC), which includes the seven most senior executives of the company. CEC members conduct regular reviews of climate change risks and opportunities.
Mr. Novo leads Air Products’ Sustainability Council, which is comprised of senior executives and functional experts who define policies, programs and performance indicators for sustainability initiatives, including climate change. The Sustainability Council was chartered by and reports to the Chairman, President and CEO. Mr. Joseph Pietrantonio, Vice President, Environment, Health, Safety & Quality and Corporate Chief Engineer, has direct operating responsibility for climate change policy and GHG inventory programs. He reports to CEC member Patricia Mattimore, Senior Vice President, Supply Chain.
In addition, Air Products’ Greenhouse Gases Strategy Team (comprised of cross-functional representation from each division and functional group) serves as the focal point for the corporation on climate change and GHG matters. The GHG Strategy Team supports Air Products’ Sustainability Council.
CC1.2 Do you provide incentives for the management of climate change issues, including the attainment of targets?
Yes
CC1.2a Please complete the table
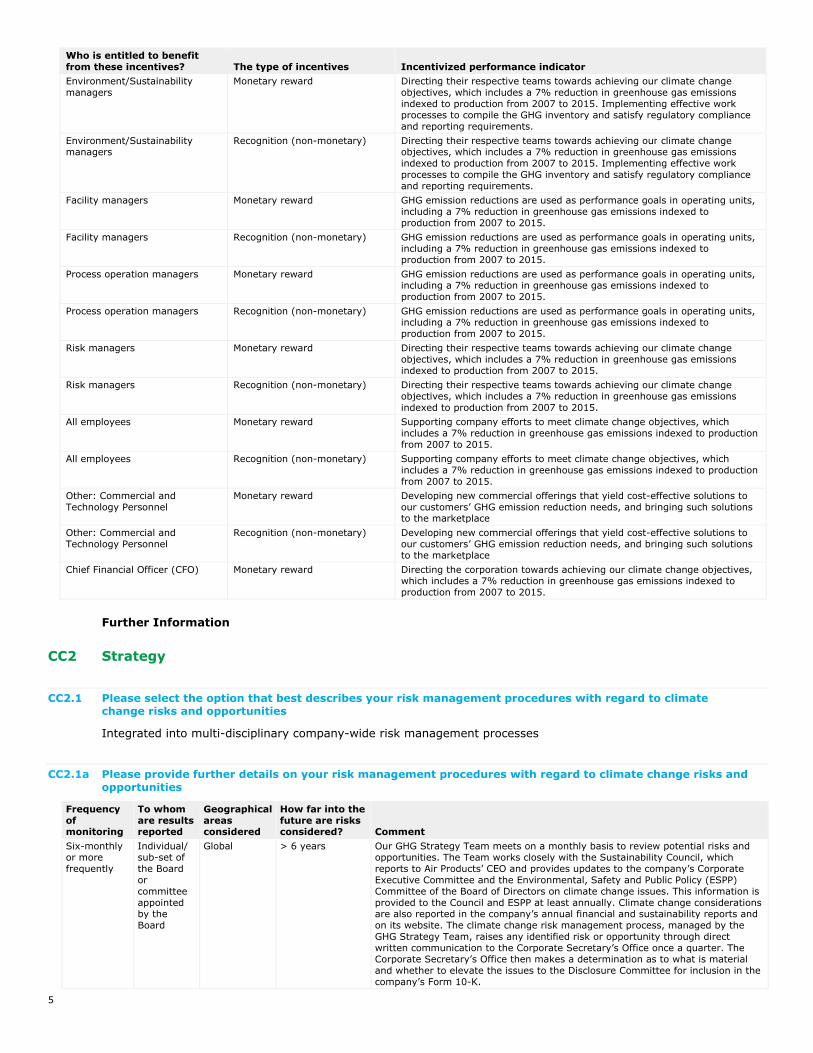
Please provide further details on the incentives provided for the management of climate change issues.
Who is entitled to benefit from these incentives? The type of incentives Incentivized performance indicator Corporate executive team Monetary reward Directing the corporation towards achieving our climate change objectives,
which includes a 7% reduction in greenhouse gas emissions indexed to production from 2007 to 2015.
Chief Executive Officer (CEO) Monetary reward Directing the corporation towards achieving our climate change objectives, which includes a 7% reduction in greenhouse gas emissions indexed to production from 2007 to 2015.
Executive officer Monetary reward Directing the corporation towards achieving our climate change objectives, which includes a 7% reduction in greenhouse gas emissions indexed to production from 2007 to 2015.
Management group Monetary reward Directing the corporation towards achieving our climate change objectives, which includes a 7% reduction in greenhouse gas emissions indexed to production from 2007 to 2015.
Management group Recognition (non-monetary) Directing the corporation towards achieving our climate change objectives, which includes a 7% reduction in greenhouse gas emissions indexed to production from 2007 to 2015.
Business unit managers Monetary reward Directing the corporation towards achieving our climate change objectives, which includes a 7% reduction in greenhouse gas emissions indexed to production from 2007 to 2015.
Business unit managers Recognition (non-monetary) Directing the corporation towards achieving our climate change objectives, which includes a 7% reduction in greenhouse gas emissions indexed to production from 2007 to 2015.
Energy managers Monetary reward Directing the corporation towards achieving our climate change objectives, which includes a 7% reduction in greenhouse gas emissions indexed to production from 2007 to 2015.
Energy managers Recognition (non-monetary) Directing the corporation towards achieving our climate change objectives, which includes a 7% reduction in greenhouse gas emissions indexed to production from 2007 to 2015.
5
Who is entitled to benefit from these incentives? The type of incentives Incentivized performance indicator Environment/Sustainability managers
Monetary reward Directing their respective teams towards achieving our climate change objectives, which includes a 7% reduction in greenhouse gas emissions indexed to production from 2007 to 2015. Implementing effective work processes to compile the GHG inventory and satisfy regulatory compliance and reporting requirements.
Environment/Sustainability managers
Recognition (non-monetary) Directing their respective teams towards achieving our climate change objectives, which includes a 7% reduction in greenhouse gas emissions indexed to production from 2007 to 2015. Implementing effective work processes to compile the GHG inventory and satisfy regulatory compliance and reporting requirements.
Facility managers Monetary reward GHG emission reductions are used as performance goals in operating units, including a 7% reduction in greenhouse gas emissions indexed to production from 2007 to 2015.
Facility managers Recognition (non-monetary) GHG emission reductions are used as performance goals in operating units, including a 7% reduction in greenhouse gas emissions indexed to production from 2007 to 2015.
Process operation managers Monetary reward GHG emission reductions are used as performance goals in operating units, including a 7% reduction in greenhouse gas emissions indexed to production from 2007 to 2015.
Process operation managers Recognition (non-monetary) GHG emission reductions are used as performance goals in operating units, including a 7% reduction in greenhouse gas emissions indexed to production from 2007 to 2015.
Risk managers Monetary reward Directing their respective teams towards achieving our climate change objectives, which includes a 7% reduction in greenhouse gas emissions indexed to production from 2007 to 2015.
Risk managers Recognition (non-monetary) Directing their respective teams towards achieving our climate change objectives, which includes a 7% reduction in greenhouse gas emissions indexed to production from 2007 to 2015.
All employees Monetary reward Supporting company efforts to meet climate change objectives, which includes a 7% reduction in greenhouse gas emissions indexed to production from 2007 to 2015.
All employees Recognition (non-monetary) Supporting company efforts to meet climate change objectives, which includes a 7% reduction in greenhouse gas emissions indexed to production from 2007 to 2015.
Other: Commercial and Technology Personnel
Monetary reward Developing new commercial offerings that yield cost-effective solutions to our customers’ GHG emission reduction needs, and bringing such solutions to the marketplace
Other: Commercial and Technology Personnel
Recognition (non-monetary) Developing new commercial offerings that yield cost-effective solutions to our customers’ GHG emission reduction needs, and bringing such solutions to the marketplace
Chief Financial Officer (CFO) Monetary reward Directing the corporation towards achieving our climate change objectives, which includes a 7% reduction in greenhouse gas emissions indexed to production from 2007 to 2015.
Further Information
CC2 Strategy
CC2.1 Please select the option that best describes your risk management procedures with regard to climate change risks and opportunities
Integrated into multi-disciplinary company-wide risk management processes
CC2.1a Please provide further details on your risk management procedures with regard to climate change risks and opportunities
Frequency of monitoring
To whom are results reported
Geographical areas considered
How far into the future are risks considered? Comment
Six-monthly or more frequently
Individual/ sub-set of the Board or committee appointed by the Board
Global > 6 years Our GHG Strategy Team meets on a monthly basis to review potential risks and opportunities. The Team works closely with the Sustainability Council, which reports to Air Products’ CEO and provides updates to the company’s Corporate Executive Committee and the Environmental, Safety and Public Policy (ESPP) Committee of the Board of Directors on climate change issues. This information is provided to the Council and ESPP at least annually. Climate change considerations are also reported in the company’s annual financial and sustainability reports and on its website. The climate change risk management process, managed by the GHG Strategy Team, raises any identified risk or opportunity through direct written communication to the Corporate Secretary’s Office once a quarter. The Corporate Secretary’s Office then makes a determination as to what is material and whether to elevate the issues to the Disclosure Committee for inclusion in the company’s Form 10-K.

6
CC2.1b Please describe how your risk and opportunity identification processes are applied at both company and asset level
Air Products has a process for identifying risks and opportunities associated with climate change. The GHG Strategy Team manages the process, providing preliminary assessments of the potential financial and operating impacts climate change considerations may have on our businesses and operations. This team, with cross-functional and global representation, works directly with potentially impacted businesses to support analysis of the risks and opportunities, including scenario planning, and serves as a resource for our global businesses to shape strategies and opportunities for growth.
Company level assessments Managed at the enterprise level by its GHG Strategy Team, Air Products has a formalized climate change risk management process that is integrated into its long standing, multi-disciplinary, company-wide risk management process. The GHG Strategy Team has cross-functional representation from each division and functional group, and each of its members are responsible for monitoring GHG developments related to his or her functional area of expertise or business unit and identifying potential climate change related risks and opportunities. During monthly meetings, the GHG Team discusses and analyzes any new or changing risk or opportunity for impacts on specific divisions and on the company as a whole.
Asset level assessments Capital expenditures, engineering and Continuous Improvement (CI) projects may be managed at the asset level, depending on scope. Project teams complete these assessments using documented procedures and criteria.
Air Products has a formal Business Continuity Planning process through which each business area evaluates its operational assets and develops Business Continuity Plans in the event of an impairment of the asset. These plans are used in concert with our Crisis Management Process.
The Corporate Risk Department maintains an evaluation of physical risk from extreme weather in order to ensure our capital assets are suitably protected.
CC2.1c How do you prioritize the risks and opportunities identified?
Air Products’ GHG Strategy Team identifies climate change risks and opportunities and serves as our global company-wide center of excellence for matters on internal policy development, regulations, legislation, and regularly updates management and the Board. The Team prioritizes climate change risks and opportunities based on potential financial and operating impacts on the company. Examples of risks and opportunities examined include those driven by changes in regulation, such as cap and trade schemes; those driven by changes in physical parameters, including droughts; and those from other developments, such as mixed market signals.
From a corporate perspective, on an annual basis, risk elements proposed for review are discussed by risk experts in the Corporate Risk Office, and risk owners from the businesses and functional areas. The Corporate Compliance & Risk Committee reviews and approves elements to be included. Each risk element is mapped for materiality vs. probability and velocity, and shown to the accountable Board oversight committee. In addition, detailed country risk assessments that consider GHG/Climate Change (among other) risks are conducted for new geographies for expansion. Once risks are identified, the business unit or function must create plans to mitigate the risks. The risk of business interruption due to natural disaster, supply chain disruption, pandemic, etc. is assessed and planned for in the Business Continuity Plan (BCP). Each business must complete a Business Impact Analysis (BIA) and a Business Recovery Plan (BRP) on a regular basis.
CC2.1d Please explain why you do not have a process in place for assessing and managing risks and opportunities from climate change, and whether you plan to introduce such a process in future
Main reason for not having a process Do you plan to introduce a process? Comment
CC2.2 Is climate change integrated into your business strategy?
Yes
CC2.2a Please describe the process of how climate change is integrated into your business strategy and any outcomes of this process
i. Influence on business strategy As a solutions provider, Air Products’ strategy for responding to climate change is straight forward – identify
opportunities where our core technology and product strengths bring cost-effective solutions that enable our

7
customers to reduce their overall supply-chain environmental impact, while using innovation and efficiency improvements to reduce GHG emissions and the potential cost impacts of a carbon-constrained energy supply on our operations. These opportunities can drive top-line growth, particularly as the company applies its growth strategy of serving energy, environmental and emerging markets. Examples include:
• Oxygen for oxyfuel combustion that reduces fuel consumption and GHG emissions; for de-bottlenecking catalytic cracking units and sulfur recovery units; for facilitating CO2 capture and sequestration; for use in Integrated Gasification Combined Cycle power facilities; for use in waste gasification; and in biomass combustion/gasification for renewable power and biofuels.
• Hydrogen for use as an emission-free transportation fuel; in the production of biodiesel from renewable feedstocks; and to enable refiners to meet fuels emissions standards while increasing the amount of fuel that can be produced from oil.
• Nitrogen for unconventional natural gas production and increased demand for energy-integrated Liquefied Natural Gas.
• The design, construction and start-up of a state-of-the-art system to capture CO2 from Air Products’ SMRs in the Valero Port Arthur Texas refinery
• High purity process gases and cleaning agents and services that support the drive for renewable energy sources.
• Gases for high efficiency lighting and insulation of windows to reduce energy losses from buildings. • Catalysts and surfactants for polyurethane foam that provides superior insulation. • Curing agents for epoxy resins used in high strength-to-weight composites that enable weight reduction in
transportation vehicles and wind turbines. ii. Climate change aspects influencing the strategy Climate change represents a significant potential for business growth, and managing the potential opportunities and
risks from climate change has influenced the company’s strategy. Managed at the enterprise level by its GHG Strategy Team, Air Products has a formalized climate change risk management process that is integrated into its long standing, multi-disciplinary, company-wide risk management process. Risk management has prompted the quantification and review of the company’s GHG emissions and energy use. Since the company must continually improve its energy efficiency as a supplier, it has set global, company-wide goals for energy efficiency and GHG reduction. The specific goal for energy is to reduce consumption by 7% indexed against production by 2015 for ASUs and HYCO from a 2007 baseline. Likewise the goal for greenhouse gases is to reduce emissions by 7% indexed against production by 2015 from a 2007 baseline. Progress against these goals is enabled through several work processes, including annual budgeting and strategy reviews, annual reporting, and ongoing consideration of environmental issues for new products, processes, mergers and acquisitions, and sourcing.
iii. Short term strategy components Developed and managed by its GHG Strategy Team, Air Products employs a long term strategy for climate change.
Shorter term activities (e.g., 1-5 years) that have been influenced by climate change include efforts to integrate GHG considerations through several work processes, including annual budgeting and strategy reviews, annual reporting, and ongoing consideration of environmental issues for products, processes, mergers and acquisitions, and sourcing.
iv. Long term strategy components From a long term (e.g., 6-10 years) perspective, the company is investing significantly in research and
development of offerings that enable its customers to reduce their environmental footprint and energy consumption. More than 50 percent of the company's R&D spending (~$133.7 million in fiscal 2013) is related to environmental and energy efficiency offerings.
v. How gaining strategic advantage Air Products’ competitive advantage lies in its understanding of environmental and energy issues combined with its
applications expertise to address customer needs. The company is a leader in climate innovation, as exemplified by: • Efficiency-optimized steam methane reforming technology for hydrogen production • Novel CO2 capture technology, including the design, construction and start-up of a state-of-the-art system to
capture CO2 from Air Products’ steam methane reformers (SMRs) in the Valero Port Arthur Texas refinery • Ceramic ion transport membrane technology in development for more energy-efficient oxygen production • World-leading natural gas liquefaction equipment, including recently announced supply of proprietary liquefied
natural gas (LNG) process technology and equipment to Technip for a mid-scale LNG project in the Yangling Demonstration Area, ShaanXi Province, China to help meet the growing demand for clean energy.
• High-purity process gases and cleaning agents for the latest generation photovoltaic solar cell production • Hydrogen fueling capabilities, including more than 160 fueling stations in 20 countries for commercial and
governmental use, as well as fuel cells for material handling such as forklifts vi. Substantial business decisions In 2013, Air Products executed several projects focused on clean energy technologies that demonstrate the
company’s innovative technologies for greenhouse gases, including:

8
• The design, construction and start-up of a state-of-the-art system to capture CO2 from Air Products’ SMRs in the Valero Port Arthur Texas refinery; designed to capture one million tons of CO2 annually to be recovered and purified by Air Products, and transported via pipeline for injection into an enhanced oil recovery project in Texas
• Ongoing construction of the company’s Tees Valley Renewable Energy Facility located near Billingham, Teesside, UK. The advanced gasification energy from waste scheme will convert pre-processed household and commercial waste currently going to landfill into baseload, renewable power for up to 50,000 homes in the North East, producing 49MW of electricity from about 300,000 tonnes of waste. Construction has begun on a second renewable energy facility of the same scope and scale on adjacent land. This second 49MW facility is also based on advanced gasification technology and will divert a similar amount of non-recyclable waste from landfill.
CC2.2b Please explain why climate change is not integrated into your business strategy
CC2.3 Do you engage in activities that could either directly or indirectly influence public policy on climate change through any of the following? (tick all that apply)
Direct engagement with policy makers Trade associations Funding research organizations Other
CC2.3a On what issues have you been engaging directly with policy makers?
Focus of legislation
Corporate Position Details of engagement Proposed legislative solution
Clean energy generation
Support As part of the normal legislative process, Air Products directly engages policy makers through consultation and direct meetings to ensure that developing energy and related policies take appropriate account of the specific characteristics of the renewable energy technology that forms the basis of our investment intentions. As an example of those efforts, Air Products has engaged with the UK government on matters concerning the Renewables Obligation Scheme, and the rollout of the Energy Market Reform policy and attendant regulations.
Air Products supports the development and use of renewable, clean energy, and has helped educate policy makers on the benefits. The company is a member of the UK Renewable Energy Association which takes a strong, public position in support of renewable energy.
Mandatory carbon reporting
Support with minor exceptions
Air Products engages with various agencies on mandatory carbon reporting, particularly the US EPA Greenhouse Gas Reporting Rules (Greenhouse Gas Reporting Rule 40CFR Part 98) and California's Regulation for the Mandatory Reporting of Greenhouse Gas Emissions. The company periodically meets directly with regulatory staff, participates in public regulatory workshops and provides key input to comments submitted by various trade associations to which the Company belongs.
Air Products seeks to ensure reporting methodologies define reasonable measurement requirements, accuracy expectations and alternatives to address missing data points.
Cap and trade Support with minor exceptions
Working through the California Large Energy Consumers Association, we have provided data to the California Public Utility Commission supporting designation of atmospheric gases production as an Energy Intensive/Trade Exposed industry sector worthy of rebates against the electricity cost increase attributed to the California greenhouse gas cap and trade program. Through the vehicles of the European Industrial Gas Association (EIGA) and selected European national industrial gases associations, Air Products has responded to consultations and met directly with EU policy-makers to ensure that the role of our industry in achieving the aims of EU environmental policies can more easily and more cost-effectively be achieved. Examples include policies relating to emissions trading and fluorinated refrigerants.
Air Products seeks comparable treatment under the regulations (e.g., consistent basis for allocation of free allowances) to all producers, regardless of ownership structure, so as to not unduly disadvantage the over-the-fence supply model.
CC2.3b Are you on the Board of any trade associations or provide funding beyond membership?
Yes

9
CC2.3c Please enter the details of those trade associations that are likely to take a position on climate change legislation
Trade association
Is your position on climate change consistent with theirs? Please explain the trade association's position
How have you, or are you attempting to, influence the position?
American Chemistry Council (ACC)
Mixed The ACC does not have a formal position on climate change. ACC has noted that chemistry plays a central role in climate mitigation both in terms of cost efficient reductions in energy consumption as well as providing technologies to decarbonise energy production, thus further reducing GHG emissions. The Association has also engaged with the U.S. Congress to shape climate change policy while promoting the efficient use of resources to promote economic recovery and deliver the most cost-effective reduction in emissions. ACC has challenged certain aspects of legislation and regulations related to climate change in an effort to prevent market distortions that could impact its member companies.
Our business benefits from participation in trade associations that bring together organizations for best practice sharing and working on common issues The members of ACC, like most large trade associations, have a wide range of views, and we do not always agree with all the positions ACC chooses to support. In all cases, any Air Products public position on a matter of public policy is the prevailing company position, irrespective of any trade association position to the contrary.
European Industrial Gas Association (EIGA)
Consistent EIGA does not have a formal position on climatechange. The Association engages on behalf of its members with Member States on a variety of issues related to climate change.
Air Products supports EIGA's efforts to appropriately engage with Member States on climate change issues and to ensure that the industrial gases sector is placed on an equal footing with other industrial sectors with regard to treatment of direct and indirect emissions.
National Association of Manufacturers (NAM)
Mixed "NAM member companies are committed to advancing sustainability efforts that positively impact manufacturing and industry’s contributions to environmental protection, economic performance and the social well-being of the employees, communities, customers and consumers they serve. NAM members recognize these challenges and will respond by encouraging the adoption of sustainable best practices and application of life cycle analysis practices in the manufacturing sector. NAM members will work proactively with relevant stakeholders to ensure that the voice of manufacturing is heard and is contributing its positive story" (Taken from NAM Website)
Our management believes that our business, and thus our shareholders, benefit from our participation in an organization that represents U.S. manufacturing in Washington. The members of NAM, like most large trade associations, have a wide range of views, and we do not always agree with all the positions NAM chooses to support. In all cases, any Air Products public position on a matter of public policy is the prevailing company position, irrespective of any trade association position to the contrary.
CC2.3d Do you publically disclose a list of all the research organizations that you fund?
No
CC2.3e Do you fund any research organizations to produce or disseminate public work on climate change?
Yes
CC2.3f Please describe the work and how it aligns with your own strategy on climate change
Description of the work In 1998, Air Products was a founding member of the Business Environmental Leadership Council (BELC) of the Center for Climate and Energy Solutions (C2ES), formerly the Pew Center on Global Climate Change. C2ES believes “that ensuring safe, reliable, affordable energy for all – while protecting the global climate – is a paramount challenge of the 21st century.” The organization is focused on providing reliable, timely and impartial information and analysis on the various dimensions of climate and energy by bringing together businesses and other stakeholders to develop consensus solutions and pragmatic policies. C2ES’s BELC believes business engagement is critical for developing efficient, effective solutions to the climate problem.
Alignment with company strategy on climate change Air Products’ strategy on climate change is aligned with BELC’s guiding principles:
We accept the scientific consensus that climate change is occurring and that the impacts are already being felt. Delaying action will increase both the risks and the costs.
Businesses can and should incorporate responses to climate change into their core corporate strategies by taking concrete steps in the U.S. and abroad to establish and meet greenhouse gas (GHG) emission reduction targets, and/or invest in low and zero GHG products, practices and technologies.
The United States should significantly reduce its GHG emissions through economy-wide, mandatory approaches, which may vary by economic sector and include a flexible, market-based program. Complementary policies may

10
also be necessary for sectors such as buildings, electricity generation, forestry, agriculture, and transportation that will help drive innovation and ease the transition to a low-carbon economy.
Climate change is a global challenge that ultimately requires a global solution. An international climate framework must establish fair, effective, and binding commitments for all developed and major developing economies.
CC2.3g Please provide details of the other engagement activities that you undertake
Air Products is engaged with several other organizations related to climate change including:
Climate Leadership Program
Method of engagement – Engaging as individual company
Topic of engagement – Support for GHG emissions reduction goal
Nature of engagement - In 2011, Air Products successfully transferred its comprehensive, carbon-intensity metric and 7% GHG emissions reduction goal (by 2015) that covers 100% of our Scope 1 and Scope 2 emissions from the U.S. EPA Climate Leaders program to the successor Climate Leadership Program, jointly sponsored by the U.S. EPA, the Climate Registry, the Center for Climate and Energy Solutions, and the Association of Climate Change Officers.
Actions advocated – Transfer of GHG emissions reduction goal (as noted above).
Global Environmental Leadership (IGEL)
Method of engagement – Engaging through a group
Topic of engagement – Knowledge around sustainability issues, including climate change
Nature of engagement - Based at Wharton at the University of Pennsylvania, IGEL promotes knowledge for business sustainability through world-class research, transformative teaching and constructive dialogue between top alumni, academic, corporate, government, and non-government organizations. The organization provides opportunities for business leaders with high-level environmental responsibilities, including climate change, to consult together and with academic leaders from Wharton and Penn and selected experts.
Actions advocated – Sharing of best practices for addressing sustainability issues, including climate change, and promoting use of these practices
Conference Board Sustainability Council II
Method of engagement – Engaging through a group
Topic of engagement - Knowledge around sustainability issues, including climate change
Nature of engagement - Members share information on product development processes that enable customers and downstream users to reduce their impact on the environment, including GHG reduction.
Actions advocated – Increasing consideration of sustainability issues, including energy savings and GHG emissions reduction, in new product development
CC2.3h What processes do you have in place to ensure that all of your direct and indirect activities that influence policy are consistent with your overall climate change strategy?
Air Products’ GHG Strategy Team identifies climate change risks and opportunities and serves as our global company-wide center of excellence for matters on internal policy development, regulations, legislation, and regularly updates management and the Board. Direct engagement is lead by professionals in our Corporate Government Relations Team who are also members of the GHG Strategy Team. Likewise the Team provides a forum for broad review of indirect activities the company is undertaking in the climate change arena.
CC2.3i Please explain why you do not engage with policy makers
Further Information

11
CC3 Targets and Initiatives
CC3.1 Did you have an emissions reduction target that was active (ongoing or reached completion) in the reporting year? Intensity target
CC3.1a Please provide details of your absolute target
ID Scope % of emissions in scope
% reduction from base year
Base year
Base year emissions (metric tonnes CO2e)
Target year Comment
CC3.1b Please provide details of your intensity target
ID Scope
% of emissions in scope
% reduction from base year Metric
Base year
Normalized base year emissions
Target year Comment
Int1 Scope 1+2
100% 7% Other: Indexed value from Base Year (e.g. Base Year Index = 1.0), where Index values is based on production metrics in the general form of “metric tonnes CO2-e per unit of production."
2007 1 2015 Our intensity goal is configured as the ratio of reporting year (2013) emissions to reporting year production compared to the same emission to production ratio in our Base Yea (2007). Using a ratio allows the intensity value to be dimensionless and protects confidential process efficiency data. For 2013, our GHG intensity figure relative to the base year is 0.877, representing a 12.3% reduction from the Base Year. This metric is the basis for our voluntary GHG Reduction goal, approved by US EPA Climate Leaders Program in 2010.
CC3.1c Please also indicate what change in absolute emissions this intensity target reflects
ID
Direction of change anticipated in absolute Scope 1+2 emissions at target completion?
% change anticipated in absolute Scope 1+2 emissions
Direction of change anticipated in absolute Scope 3 emissions at target completion?
% change anticipated in absolute Scope 3 emissions Comment
Int1 Increase 39
Absolute emissions will increase as production increases, but the rate of the increase will be reduced through efficiency improvement, emission reduction and CO2 capture programs.
CC3.1d For all of your targets, please provide details on the progress made in the reporting year
ID % complete (time)
% complete (emissions) Comment
Int1 75% 100% Scope 1 emission reductions from our HYCO and Electronic Specialty Materials business contributed to a reduction in the composite production Scope 1 intensity metric (and a minimal increase on an absolute basis). ESM reductions resulted from process loss reductions which also increase product yield. Implementation of a large CO2 capture project from two hydrogen plants helped offset emissions increases from new facilities. . Scope 2 emissions increased at pace with production increases. The net result is a combined Scope 1 and Scope 2 Intensity Index reduction of 12.3% that exceeds our 2015 goal of a 7% reduction. Air Products recognizes there are production increases in future years that will continue to challenge our 2015 goal attainment, so will continue to track performance with our combined Scope 1 and Scope 2 Intensity Metric.
CC3.1e Please explain (i) why you do not have a target; and (ii) forecast how your emissions will change over the next five years

12
CC3.2 Does the use of your goods and/or services directly enable GHG emissions to be avoided by a third party?
Yes
CC3.2a Please provide details of how the use of your goods and/or services directly enable GHG emissions to be avoided by a third party
Oxygen (O2) for Combustion: O2 is required for any combustion process. Replacing air with O2 or adding pure O2 (O2 enrichment) improves the overall combustion process. Likewise the use of O2 enables enhanced alternative fuel substitution, reducing the need for fossil fuels.
Fuel efficiency gains of 5-65% are achieved depending on process requirements and capabilities. These gains result in the reduction of direct emissions of CO and CO2 through reduced fossil fuel consumption.
Our oxy-fuel applications technology saves customers 1.6 million MT CO2e every year excluding O2 production, or 1 million MT/yr including O2 production. Over the past few years Air Products has installed O2 systems on several cement kilns to enable increased alternative fuel substitution that has decreased fuel rates (coal and petcoke) by 10% to ~60% on these kilns (avg. reduction of 29%). This represents 99,900 tons/yr of CO2e saved via alternative fuels substitution during operation.
Analyses compare energy consumption using O2 vs. air. The emission factors used were 2.418 kg CO2/kg coal and 3.18 kg CO2/kg coke. The emission factors for the non-renewable alternate fuel in relation to coal were estimated using an equation that considered the LHV of coal (26.3 MJ/kg) and the composition of the alternative fuel (water, ash and carbon content). For the alternative fuels example, analyses are based on field testing. The amount of CO2e saved at these facilities has been calculated as the sum of the change in fossil fuel rate multiplied by the CO2 credit for the alternative fuel (0.9 for Refuse Derived Fuel, and 2.5 for biomass) for each facility. Air Products completed an LCA for oxygen use in cement kilns with alternative fuels that confirmed the CO2e savings from substitution of coal.
No plans to generate CERs/ERUs
Hydrogen (H2) as alternative transportation fuel: Air Products’ H2 fuel stations support the use of fuel cell zero emission vehicles. Our hydrogen stations supporting light-duty fuel cell electric vehicles (FCEV’S) in California (CA) has avoided 271 MT CO2e. Replacing gasoline and diesel internal combustion engine vehicles with H2 powered fuel-cell vehicles allows for reduction in GHG emissions and opens up non-traditional and renewable energy resources for the transportation sector.
Overall fossil fuel consumption and GHG emissions are reduced over the life cycle of fuel by shifting light-duty vehicle fuel combustion from internal combustion engines to more efficient fuel cell light-duty vehicles, using less carbon intensive natural gas as a fuel source and enabling the supply and procurement of renewable biogas that supplies two hydrogen fuel stations.
Through supply of less GHG intensive H2 fuel for fuel cell vehicles, consumers reduced their driving well-to-wheels greenhouse emissions by 65% relative to the CA Low Carbon Fuel Cell (LCFS) 2012 baseline for gasoline vehicle, resulting in 244 g CO2e saved for each mile driven. During 2013, our H2 fuelling stations serving light-duty vehicles substituted 42,561 gallons of gasoline, thus avoiding 271 MT CO2e. Air Products has been awarded projects to construct an additional 10 stations by the end of 2014 as part of a CA Energy Commission Roadmap supported by the Governor’s Executive Order establishing specific milestones on a path toward reaching 1.5 million zero-emission vehicles in California by 2025. This roadmap contains plans to build upwards of 100 hydrogen fueling stations, commensurate with the OEM forecast vehicle deployment of FCEV’s, resulting in significant reductions in GHGs in the CA market.
An LCA was completed to estimate the CO2e avoided. The analysis estimated the lifecycle emission of H2 energy supply considering 33.3% of H2 from eligible renewable on a full well-to-wheels basis; applied an Energy Efficiency Ratio of 2.3 for FCEV’s established under CA LCFS; and estimated emissions performance of traditional gasoline cars based on LCFS 2013 gasoline baseline (422 g CO2e/mile). Emission factors varied from 12.3 to 27 g CO2/g H2 depending on the hydrogen source.
No plans to generate CERs/ERUs
CC3.3 Did you have emissions reduction initiatives that were active within the reporting year (this can include those in the planning and implementation phases)
Yes
13
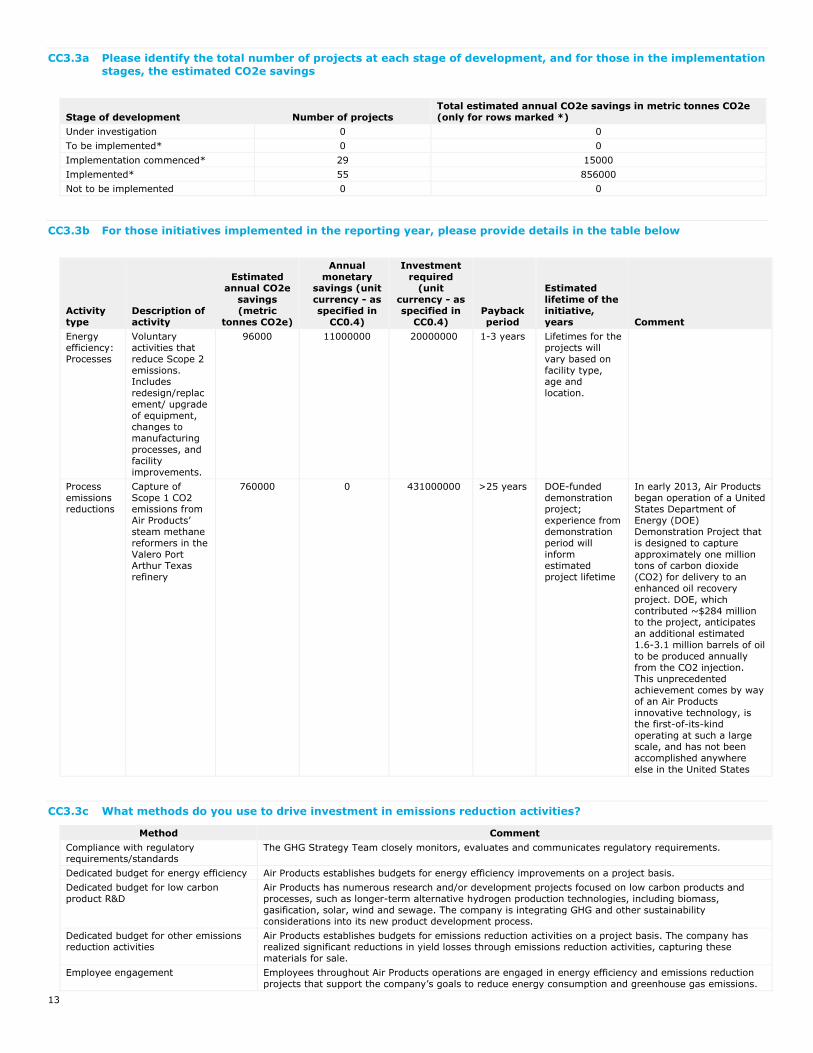
CC3.3a Please identify the total number of projects at each stage of development, and for those in the implementation stages, the estimated CO2e savings
Stage of development Number of projects Total estimated annual CO2e savings in metric tonnes CO2e (only for rows marked *)
Under investigation 0 0 To be implemented* 0 0 Implementation commenced* 29 15000 Implemented* 55 856000 Not to be implemented 0 0
CC3.3b For those initiatives implemented in the reporting year, please provide details in the table below
Activity type
Description of activity
Estimated annual CO2e
savings (metric
tonnes CO2e)
Annual monetary
savings (unit currency - as specified in
CC0.4)
Investment required
(unit currency - as specified in
CC0.4) Payback period
Estimated lifetime of the initiative, years
Comment
Energy efficiency: Processes
Voluntary activities that reduce Scope 2 emissions. Includes redesign/replacement/ upgrade of equipment, changes to manufacturing processes, and facility improvements.
96000 11000000 20000000 1-3 years Lifetimes for the projects will vary based on facility type, age and location.
Process emissions reductions
Capture of Scope 1 CO2 emissions from Air Products’ steam methane reformers in the Valero Port Arthur Texas refinery
760000 0 431000000 >25 years DOE-funded demonstration project; experience from demonstration period will inform estimated project lifetime
In early 2013, Air Products began operation of a United States Department of Energy (DOE) Demonstration Project that is designed to capture approximately one million tons of carbon dioxide (CO2) for delivery to an enhanced oil recovery project. DOE, which contributed ~$284 million to the project, anticipates an additional estimated 1.6-3.1 million barrels of oil to be produced annually from the CO2 injection. This unprecedented achievement comes by way of an Air Products innovative technology, is the first-of-its-kind operating at such a large scale, and has not been accomplished anywhere else in the United States
CC3.3c What methods do you use to drive investment in emissions reduction activities?
Method CommentCompliance with regulatory requirements/standards
The GHG Strategy Team closely monitors, evaluates and communicates regulatory requirements.
Dedicated budget for energy efficiency Air Products establishes budgets for energy efficiency improvements on a project basis.Dedicated budget for low carbon product R&D
Air Products has numerous research and/or development projects focused on low carbon products and processes, such as longer-term alternative hydrogen production technologies, including biomass, gasification, solar, wind and sewage. The company is integrating GHG and other sustainability considerations into its new product development process.
Dedicated budget for other emissions reduction activities
Air Products establishes budgets for emissions reduction activities on a project basis. The company has realized significant reductions in yield losses through emissions reduction activities, capturing these materials for sale.
Employee engagement Employees throughout Air Products operations are engaged in energy efficiency and emissions reduction projects that support the company’s goals to reduce energy consumption and greenhouse gas emissions.

14
Method CommentInternal incentives/recognition programs
Employees are recognized for progress against achieving our climate change objectives, developing new commercial offerings that yield cost-effective solutions to our customers’ GHG emission reduction needs and bringing such solutions to the marketplace, and implementing effective work processes to compile the GHG inventory and satisfy regulatory compliance and reporting requirements. Efforts are recognized through existing compensation and awards programs.
Internal finance mechanisms Air Products has integrated GHG considerations into its global expenditure authorization process, which is used to prepare requests for capital expenditures, marketing and procurement and investment transactions.
Partnering with governments on technology development
Air Products seeks opportunities to collaborate with governments on technology developments. For example, the company is has employed novel CO2 capture technology for some of the largest carbon capture and storage demonstration projects in the world, including pre-combustion capture with the US Department of Energy (DOE) in Texas.
Employee engagement Productivity improvements - Air Products has a robust productivity improvement process. Employee recommendations to improve productivity frequently focus on conservation and emissions reduction projects. These ideas are tracked in a global, central database that includes quantified costs and benefits. Data from this system was used to respond to the above questions (3.3a and 3.3b).
CC3.3d If you do not have any emissions reduction initiatives, please explain why not
Further Information
For question 3.3a: The system the company uses for tracking projects does not distinguish between projects under investigation and to be implemented.
CC4 Communication
CC4.1 Have you published information about your organization’s response to climate change and GHG emissions performance for this reporting year in places other than in your CDP response? If so, please attach the publication(s)
Publication Page/Section reference Attach the document
In mainstream financial reports (complete)
10, 37 https://www.cdp.net/sites/2014/35/435/Investor CDP 2014/Shared Documents/Attachments/CC4.1/2013 Annual Report.pdf
In voluntary communications (complete)
Information provided throughout the report (pages 4, 8, 11, 12, 15, 20, 27, 30, 55, 57, 63, 64, 66, 70). See pages 30 and 70 for performance data.
https://www.cdp.net/sites/2014/35/435/Investor CDP 2014/Shared Documents/Attachments/CC4.1/2013 Sustainability Report.pdf
Module: Risks and Opportunities
CC5. Climate Change Risks
CC5.1 Have you identified any climate change risks that have the potential to generate a substantive change in your business operations, revenue or expenditure? Tick all that apply
Risks driven by changes in regulation Risks driven by changes in physical climate parameters Risks driven by changes in other climate-related developments
CC5.1a Please describe your risks driven by changes in regulation
Please describe your risks driven by changes in regulation
Risk driver Description Potential impact
Time frame
Direct/Indirect Likelihood
Magnitude of impact
Estimated financial implications Mgmt. method Cost of Mgmt.
International agreements
The high degree of uncertainty in the timing and content of any binding international agreement
Increased operational cost
Unknown Direct Unknown Unknown The high degree of uncertainty in the timing and content of an international agreement prevents accurate prediction of the potential risk impact to Air
Our GHG Strategy Team identifies climate change risks and opportunities, serving as our global center of excellence on
The company has not incurred additional costs to actively engage in and monitor these areas as the

15
Risk driver Description Potential impact
Time frame
Direct/Indirect Likelihood
Magnitude of impact
Estimated financial implications Mgmt. method Cost of Mgmt.
prevents accurate prediction of the potential risk impact to Air Products. However any binding agreement that limits or taxes GHG emissions from Air Products’ facilities could impact our value chain and growth by increasing operating costs, both directly and through suppliers.
Products. Given our market capitalization of $23.6 billion as of 31 Dec 2013, a hypothetical impact (from increased operating costs or reduced demand for certain products) that would result in a decreased stock-price of 1% would yield a reduced market value of ~$200 million.
policy development, regulations, legislation, and regularly updating management and the Board. As part of this team, our Government Relations staff works with agencies and NGOs in regions of the world where we have significant business interests to develop strategy, understand business environments, and protect/position our businesses to respond to climate change risks and opportunities. These efforts are augmented through membership in executive leadership forums, including the Business Environmental Leadership Council of the Center for Climate and Energy Solutions that provides insights into the local and international stage. We are involved with trade associations including the American Chemistry Council, Compressed Gas Association and European Industrial Gas Association. We continue to develop technologies that enable our customers and our facilities to lower energy consumption, improve efficiency and reduce emissions. In 2013, nearly half of our total R&D budget of $133.7 million was spent on developing products that reduce GHGs and address other sustainability issues. Our business planning processes focus on energy reduction targets that translate into GHG impact. We have also integrated GHG considerations into other business
efforts of our GHG Strategy and other teams, as well as costs associated with reduction commitments and customer engagement for cost recovery through contracts, are budgeted in the normal course of business. An estimate of the scale of those costs is <$1million/yr. Membership dues for trade organizations are paid in the normal course of business. An estimate of these costs is <$1million.

16
Risk driver Description Potential impact
Time frame
Direct/Indirect Likelihood
Magnitude of impact
Estimated financial implications Mgmt. method Cost of Mgmt.
processes. The company believes it will be able to mitigate some of these potential costs through contractual terms.
International agreements
The high degree of uncertainty in the timing and content of any binding international agreement prevents accurate prediction of the potential risk impact to Air Products. However any binding agreement that limits or taxes GHG emissions from Air Products’ facilities could impact our value chain and growth by reducing demand for certain products.
Reduced demand for goods/services
Unknown Direct Unknown Unknown The high degree of uncertainty in the timing and content of an international agreement prevents accurate prediction of the potential risk impact to Air Products. Given our market capitalization of $23.6 billion as of 31 Dec 2013, a hypothetical impact (from increased operating costs or reduced demand for certain products) that would result in a decreased stock-price of 1% would yield a reduced market value of ~$200 million.
Our GHG Strategy Team identifies climate change risks and opportunities, serving as our global center of excellence on policy development, regulations, legislation, and regularly updating management and the Board. As part of this team, our Government Relations staff works with agencies and NGOs in regions of the world where we have significant business interests to develop strategy, understand business environments, and protect/position our businesses to respond to climate change risks and opportunities. These efforts are augmented through membership in executive leadership forums, including the Business Environmental Leadership Council of the Center for Climate and Energy Solutions that provides insights into the local and international stage. We are involved with trade associations including the American Chemistry Council, Compressed Gas Association and European Industrial Gas Association. We continue to develop technologies that enable our customers and our facilities to lower energy consumption, improve efficiency and reduce emissions. In 2013, nearly half of our total R&D budget of $133.7 million was spent on developing
The company has not incurred additional costs to actively engage in and monitor these areas as the efforts of our GHG Strategy and other teams, as well as costs associated with reduction commitments and customer engagement for cost recovery through contracts, are budgeted in the normal course of business. An estimate of the scale of those costs is <$1million/yr. Membership dues for trade organizations are paid in the normal course of business. An estimate of these costs is <$1million.

17
Risk driver Description Potential impact
Time frame
Direct/Indirect Likelihood
Magnitude of impact
Estimated financial implications Mgmt. method Cost of Mgmt.
products that reduce GHGs and address other sustainability issues. Our business planning processes focus on energy reduction targets that translate into GHG impact. We have also integrated GHG considerations into other business processes. The company believes it will be able to mitigate some of these potential costs through contractual terms.
Air pollution limits
The US Federal EPA requires that new major sources and major modifications to existing sources consider Best Available Control Technology (BACT) in addressing the prevention of significant deterioration (PSD) and title V permitting requirements for GHGs. These requirements are expected to result in increased capital costs to enable monitoring and emission reductions at our hydrogen facilities, although these investments appear modest.
Increased capital cost
Up to 1 year
Direct Virtually certain
Low US EPA requires that new major sources and major modifications to existing sources consider Best Available Control Technology to address the prevention of significant deterioration and title V permitting requirements for GHGs. Air Products permits facilities that are subject to this rule, possibly resulting in increased capital costs, although these investments appear modest. Cost and time for large hydrogen plant environmental permit approval could increase ($200,000 per permit per site).
Our business planning processes focus on energy reduction targets that translate into GHG impact. We formally integrated GHG considerations into our global capital expenditure authorization process, marketing and procurement and investment transactions and continue to more fully integrate considerations into other processes, including product and process design, M&A, and sourcing. We offer our customers products from efficiently designed facilities employing Best Available Control Technologies and work to continually improve the design of those facilities. In 2013, nearly half of our total R&D budget of $133.7 million was spent on developing products that reduce GHGs and address other sustainability issues. The company also believes it will be able to mitigate some of these potential costs through its contractual terms.
The company has not incurred additional costs to actively engage in and monitor these areas as the efforts of our GHG Strategy and other teams, as well as costs associated with reduction commitments and customer engagement for cost recovery through contracts, are budgeted in the normal course of business. An estimate of the scale of those costs is <$1million/yr.
Carbon taxes The UK Climate Change Levy (CCL) is a tax on energy usage that has been in place since 2001. As a
Increased operational cost
Up to 1 year
Direct Virtually certain
Low A carbon tax example is the UK Climate Change Levy (CCL) on energy usage. If we had not been able to secure a renewed energy efficiency agreement, the financial impact
In 2012, Air Products recommitted to and signed a voluntary Climate Change Agreement, committing to an energy efficiency
The company has not incurred additional costs to actively engage in and monitor these areas as the efforts of our

18
Risk driver Description Potential impact
Time frame
Direct/Indirect Likelihood
Magnitude of impact
Estimated financial implications Mgmt. method Cost of Mgmt.
company with energy-intensive processes, such a tax could impact our value chain and growth by increasing operating costs, both directly and through suppliers. However, Air Products recommitted to and signed a voluntary Climate Change Agreement, committing to an energy efficiency target, and received a reduction in the CCL.
of this tax would have been in the range of $2-5 million.
target, and received a reduction in the CCL. We were able to commit to an energy efficiency target as we work to continually improve the design of those facilities to lower energy consumption, improve efficiency and reduce emissions. Consistent with our 7% intensity-based energy reduction goals, we continue to invest in efficiency improvements at our facilities. In 2013, nearly half of our total R&D budget of $133.7 million was spent on developing products that reduce GHGs and address other sustainability issues. Our business planning processes focus on energy reduction targets that translate into GHG impact. We formally integrated GHG considerations into our global capital expenditure authorization process, marketing and procurement and investment transactions and continue to more fully integrate considerations into other processes, including product and process design, M&A, and sourcing. The company also believes it will be able to mitigate some of these potential costs through its contractual terms.
GHG Strategy and other teams, as well as costs associated with reduction commitments and customer engagement for cost recovery through contracts, are budgeted in the normal course of business. An estimate of the scale of those costs is <$1million/yr.
Carbon taxes Carbon taxes are possible in other jurisdictions that could impact the Company. For example, China has discussed the potential for a carbon tax. Carbon taxes in the U.S. are exceptionally unlikely given the environment in Congress. Any regulation that limits or taxes GHG
Increased operational cost
Unknown Direct Unknown Unknown The high degree of uncertainty in the timing and content of future carbon taxes prevents accurate prediction of the potential risk impact to Air Products. Given our market capitalization of $23.6 billion as of 31 Dec 2013, a hypothetical impact (from increased operating costs or reduced demand for certain products) that would result in a decreased stock-price of 1% would yield a reduced market value of
Our GHG Strategy Team identifies climate change risks and opportunities, serving as our global center of excellence on policy development, regulations, legislation, and regularly updating management and the Board. As part of this team, our Government Relations staff works with agencies and
The company has not incurred additional costs to actively engage in and monitor these areas as the efforts of our GHG Strategy and other teams, as well as costs associated with reduction commitments and customer engagement for cost recovery through contracts, are budgeted in the

19
Risk driver Description Potential impact
Time frame
Direct/Indirect Likelihood
Magnitude of impact
Estimated financial implications Mgmt. method Cost of Mgmt.
emissions from company facilities could impact our value chain and growth by increasing operating costs, both directly and through suppliers. The company believes it will be able to mitigate some of these potential costs through its contractual terms, but the lack of definitive regulations prevents accurate prediction of the long-term impact.
~$200 million. NGOs in regions of the world where we have significant business interests to develop strategy, understand business environments, and protect/position our businesses to respond to climate change risks and opportunities. These efforts are augmented through membership in executive leadership forums, including the Business Environmental Leadership Council of the Center for Climate and Energy Solutions that provides insights into the local and international stage. We are involved with trade associations including the American Chemistry Council, Compressed Gas Association and European Industrial Gas Association. We continue to develop technologies that enable our customers and our facilities to lower energy consumption, improve efficiency and reduce emissions. In 2013, nearly half of our total R&D budget of $133.7 million was spent on developing products that reduce GHGs and address other sustainability issues. Our business planning processes focus on energy reduction targets that translate into GHG impact. We have also integrated GHG considerations into other business processes. The company believes it will be able to mitigate some of these potential costs through contractual terms.
normal course of business. An estimate of the scale of those costs is <$1million/yr. Membership dues for trade organizations are paid in the normal course of business. An estimate of these costs is <$1million.
Cap and trade schemes
Phase 3 (2013-2020) EU Emission Trading Scheme (ETS)
Reduced demand for goods/services
1 to 3 years
Direct About as likely as not
Low The company believes it will be able to mitigate some of these potential costs
Our GHG Strategy Team identifies climate change risks and opportunities,
The company has not incurred additional costs to actively

20
Risk driver Description Potential impact
Time frame
Direct/Indirect Likelihood
Magnitude of impact
Estimated financial implications Mgmt. method Cost of Mgmt.
is in force and associated legislative measures continue active consideration. Therefore, it is possible a provision could result in different treatments between our plants and our customers’ alternative in-house supply options. This issue is long-recognized and has been addressed as a “non-distortion principle” in Recital 23 of the relevant EU Directive. To date, that principle has been upheld in all the subsequent rulemaking. Likewise, as part of the implementation of CA AB32, the California Air Resource Board (CARB) has implemented a cap and trade scheme that started January 2013 and active reconsideration is ongoing. In South Korea, an ETS is scheduled to be implemented in 2015 and details are emerging. In China, seven regions (Beijing, Tianjin, Shanghai, Chongqing, and Shenzhen, Guangdong and Hubei) were chosen to start official, state-sanctioned ETS pilots in 2013. Pilots began in Beijing, Tianjin, Shanghai, Shenzhen, and Guangdong over the year. In any jurisdiction were details are still emerging or where active reconsideration is ongoing, any provision that results in difference in treatment could result in
through its contractual terms, but the lack of definitive regulations prevents accurate prediction of the long-term impact. Given our market capitalization of $23.6 billion as of 31 Dec 2013, a hypothetical impact (from increased operating costs or reduced demand for certain products) that would result in a decreased stock-price of 1% would yield a reduced market value of ~$200 million.
serving as our global center of excellence on internal policy development, regulations, legislation, and regularly updating management and the Board. As part of this team, our Government Relations staff works with government agencies and NGOs in regions of the world where we have significant business interests to develop strategy, understand changing business environments, and protect and position our businesses to respond to climate change risks and opportunities. These efforts are augmented through membership in executive leadership forums, including the Business Environmental Leadership Council of the Center for Climate and Energy Solutions that provides insights into the local and international stage. We are involved with trade associations including the American Chemistry Council, Compressed Gas Association and European Industrial Gas Association (EIGA).Through EIGA we supported the quantification of potential market distortions due to EU ETS and how such distortions could harm the EU industrial gas industry and result in increased emissions. Our efforts have been successful; four years ago this issue was addressed as a non-distortion principle in Recital 23 of the relevant EU ETS Directive, and that principle has been upheld in subsequent rulemaking.
engage in and monitor these areas as the efforts of our GHG Strategy and other teams, as well as costs associated with reduction commitments and customer engagement for cost recovery through contracts, are budgeted in the normal course of business. An estimate of the scale of those costs is <$1million/yr. Membership dues for trade organizations are paid in the normal course of business. An estimate of these costs is <$1million.

21
Risk driver Description Potential impact
Time frame
Direct/Indirect Likelihood
Magnitude of impact
Estimated financial implications Mgmt. method Cost of Mgmt.
pricing disadvantages for our products and services. Such distortions could lead some customers to produce products themselves instead of purchasing from Air Products (e.g., refineries making their own hydrogen for cleaner burning transportation fuels).
Through these efforts, the likelihood and magnitude of the risk over the entire EU ETS Phase 3 program from 2013-2020 was significantly decreased.
Cap and trade schemes
Phase 3 (2013-2020) EU Emission Trading Scheme (ETS) is in force and associated legislative measures continue active consideration. Therefore, it is possible a provision could result in different treatments between our plants and our customers’ alternative in-house supply options. This issue is long-recognized and has been addressed as a “non-distortion principle” in Recital 23 of the relevant EU Directive. To date, that principle has been upheld in all the subsequent rulemaking. Likewise, as part of the implementation of CA AB32, the California Air Resource Board (CARB) has implemented a cap and trade scheme that started January 2013 and active reconsideration is ongoing. In South Korea, an ETS is scheduled to be implemented in 2015 and details are emerging. In China, seven regions (Beijing, Tianjin, Shanghai, Chongqing, and Shenzhen,
Increased operational cost
1 to 3 years
Direct About as likely as not
Low The company believes it will be able to mitigate some of these potential costs through its contractual terms, but the lack of definitive regulations prevents accurate prediction of the long-term impact. Given our market capitalization of $23.6 billion as of 31 Dec 2013, a hypothetical impact (from increased operating costs or reduced demand for certain products) that would result in a decreased stock-price of 1% would yield a reduced market value of ~$200 million.
Our GHG Strategy Team identifies climate change risks and opportunities, serving as our global center of excellence on internal policy development, regulations, legislation, and regularly updating management and the Board. As part of this team, our Government Relations staff works with government agencies and NGOs in regions of the world where we have significant business interests to develop strategy, understand changing business environments, and protect and position our businesses to respond to climate change risks and opportunities. These efforts are augmented through membership in executive leadership forums, including the Business Environmental Leadership Council of the Center for Climate and Energy Solutions that provides insights into the local and international stage. We are involved with trade associations including the American Chemistry Council, Compressed Gas Association and European Industrial Gas Association
The company has not incurred additional costs to actively engage in and monitor these areas as the efforts of our GHG Strategy and other teams, as well as costs associated with reduction commitments and customer engagement for cost recovery through contracts, are budgeted in the normal course of business. An estimate of the scale of those costs is <$1million/yr. Membership dues for trade organizations are paid in the normal course of business. An estimate of these costs is <$1million.

22
Risk driver Description Potential impact
Time frame
Direct/Indirect Likelihood
Magnitude of impact
Estimated financial implications Mgmt. method Cost of Mgmt.
Guangdong and Hubei) were chosen to start official, state-sanctioned ETS pilots in 2013. Pilots began in Beijing, Tianjin, Shanghai, Shenzhen, and Guangdong over the year. In any jurisdiction were details are still emerging or where active reconsideration is ongoing, any provision that results in difference in treatment could result in pricing disadvantages for our products and services. Such distortions could lead some customers to produce products themselves instead of purchasing from Air Products (e.g., refineries making their own hydrogen for cleaner burning transportation fuels).
(EIGA).Through EIGA we supported the quantification of potential market distortions due to EU ETS and how such distortions could harm the EU industrial gas industry and result in increased emissions. Our efforts have been successful; four years ago this issue was addressed as a non-distortion principle in Recital 23 of the relevant EU ETS Directive, and that principle has been upheld in subsequent rulemaking. Through these efforts, the likelihood and magnitude of the risk over the entire EU ETS Phase 3 program from 2013-2020 was significantly decreased.
Cap and trade schemes
A cap and trade scheme could also be implemented in several jurisdictions where Air Products has facilities. It would be reasonable to assume emissions from Air Products’ facilities could be included. Cap and trade piloting has been announced in seven areas in China. Additionally, South Korea has passed a law for a cap and trade scheme with a 2015 start. However, a Federal cap and trade scheme in the U.S. is exceptionally unlikely given the current environment in the U.S. Congress. Any regulation that limits or
Reduced demand for goods/services
1 to 3 years
Direct About as likely as not
Low The company believes it will be able to mitigate some of these potential costs through its contractual terms, but the lack of definitive regulations prevents accurate prediction of the long-term impact. Given our market capitalization of $23.6 billion as of 31 Dec 2013, a hypothetical impact (from increased operating costs or reduced demand for certain products) that would result in a decreased stock-price of 1% would yield a reduced market value of ~$200 million.
Our GHG Strategy Team identifies climate change risks and opportunities, serving as our global center of excellence on internal policy development, regulations, legislation, and regularly updating management and the Board. As part of this team, our Government Relations staff works with government agencies and NGOs in regions of the world where we have significant business interests to develop strategy, understand changing business environments, and protect and position our businesses to respond to climate change risks and opportunities. These efforts are augmented
The company has not incurred additional costs to actively engage in and monitor these areas as the efforts of our GHG Strategy and other teams, as well as costs associated with reduction commitments and customer engagement for cost recovery through contracts, are budgeted in the normal course of business. An estimate of the scale of those costs is <$1million/yr. Membership dues for trade organizations are paid in the normal course of business. An estimate of these costs is <$1million.

23
Risk driver Description Potential impact
Time frame
Direct/Indirect Likelihood
Magnitude of impact
Estimated financial implications Mgmt. method Cost of Mgmt.
taxes GHG emissions from company facilities could impact our value chain and growth by increasing operating costs, both directly and through suppliers. The company believes it will be able to mitigate some of these potential costs through its contractual terms, but the lack of definitive regulations prevents accurate prediction of the long-term impact.
through membership in executive leadership forums, including the Business Environmental Leadership Council of the Center for Climate and Energy Solutions that provides insights into the local and international stage. We are involved with trade associations including the American Chemistry Council, Compressed Gas Association and European Industrial Gas Association (EIGA).Through EIGA we supported the quantification of potential market distortions due to EU ETS and how such distortions could harm the EU industrial gas industry and result in increased emissions. Our efforts have been successful; four years ago this issue was addressed as a non-distortion principle in Recital 23 of the relevant EU ETS Directive, and that principle has been upheld in subsequent rulemaking. Through these efforts, the likelihood and magnitude of the risk over the entire EU ETS Phase 3 program from 2013-2020 was significantly decreased.
Fuel/energy taxes and regulations
Fuel/energy taxes and regulations are or could be implemented in several jurisdictions where Air Products has facilities. An active example is South Korea’s energy consumption reduction program that includes electric power under their Target Management System (TMS). As a large consumer of electric power,
Increased operational cost
Unknown Direct Unknown Unknown As a large consumer of electric power, we could be impacted by increased costs due to fuel/energy taxes and regulations. It is difficult to estimate the potential impact of these risks on energy prices. In 2013, Air Products spent approximately $2 billion to purchase energy, so a hypothetical 10% increase in corporate energy cost would have an impact of $200 million. The company believes it would be able to mitigate some of these potential costs through its contractual terms.
Our GHG Strategy Team identifies climate change risks and opportunities, serving as our global center of excellence on policy development, regulations, legislation, and regularly updating management and the Board. As part of this team, our Government Relations staff works with agencies and NGOs in regions of the world where we have significant business interests to
The company has not incurred additional costs to actively engage in and monitor these areas as the efforts of our GHG Strategy and other teams, as well as costs associated with reduction commitments and customer engagement for cost recovery through contracts, are budgeted in the normal course of business. An estimate of the scale of those costs is <$1million/yr.

24
Risk driver Description Potential impact
Time frame
Direct/Indirect Likelihood
Magnitude of impact
Estimated financial implications Mgmt. method Cost of Mgmt.
the company could be impacted by increased costs that could result from taxes and regulatory controls on fuels and energy. The company believes it will be able to mitigate some of these potential costs for fuel and energy taxes and regulation through its existing contractual terms.
develop strategy, understand business environments, and protect/position our businesses to respond to climate change risks and opportunities. These efforts are augmented through membership in executive leadership forums, including the Business Environmental Leadership Council of the Center for Climate and Energy Solutions that provides insights into the local and international stage. We are involved with trade associations including the American Chemistry Council, Compressed Gas Association and European Industrial Gas Association. We continue to develop technologies that enable our customers and our facilities to lower energy consumption, improve efficiency and reduce emissions. In 2013, nearly half of our total R&D budget of $133.7 million was spent on developing products that reduce GHGs and address other sustainability issues. Our business planning processes focus on energy reduction targets that translate into GHG impact. We have also integrated GHG considerations into other business processes. The company believes it will be able to mitigate some of these potential costs through contractual terms.
Membership dues for trade organizations are paid in the normal course of business. An estimate of these costs is <$1million.
CC5.1b Please describe your risks that are driven by change in physical climate parameters
Risk driver Description Potential impact Time frame
Direct/Indirect Likelihood
Magnitude of impact
Estimated financial implications
Management method
Cost of management
Change in precipitation
To the extent there are water
Reduction/disruption in production
Unknown Direct About as likely as
Low Due the uncertainty of
Air Products has a formal Business
There were no additional costs

25
Risk driver Description Potential impact Time frame
Direct/Indirect Likelihood
Magnitude of impact
Estimated financial implications
Management method
Cost of management
extremes and droughts
shortages and scarcity, our hydrogen production and chemicals operations which require water for reactions, steam and cooling may be impacted. An increased frequency of extreme weather could also result in an increased risk of power failures and disruptions to operations. Such events could impact Air Products’ suppliers and disrupt the supply of energy and raw materials. Also, like many companies, we have assets located in coastal zones around the world that could, under conditions of significant sea level rise, be impacted to varying degrees.
capacity not how these risks materialize, we cannot estimate the financial implications, but, based on prior impacts of natural disasters, we would not expect any individual event to have a material impact on financial results. Given our market capitalization of $23.6 billion as of 31st Dec. 2013, a hypothetical impact that would result in a decreased stock-price of 1% would yield a reduced market value of around $200 million.
Continuity Planning process through which each business area evaluates its operational assets and develops Business Continuity Plans to address potential operational disruptions. These plans are used in concert with our Crisis Management Process. In addition our Corporate Risk Department maintains an evaluation of physical risk from extreme weather in order to ensure our capital assets are suitably protected. Our business is distributed across diverse regions and business sectors in over 50 countries. This diversity provides further protection from any dislocations resulting from physical risks potentially attributed to climate change. Air Products has installed regional Operational Service Centers (OSCs) around the world that provide system-wide operational and monitoring services for many of our major air separation unit and hydrogen facilities to optimize labor and supply chains. The OSCs help mitigate operating risk by creating a balance between centralized and plant-based resources. Impacts at any local operating plant location can be monitored both locally and from the highly-secure OSC, providing multiple means to quickly react to any climate related incidents. Orders to shift production loads from one plant to another or to address maintenance needs can be handled from a number of these centralized locations.
for any specific climate change related actions. Our Risk Management process has not identified additional risks beyond those that Air Products is already managing, and our Crisis Management organization has been in place for some time. The costs for the installation of the regional OSCs was budgeted and paid for in the normal course of managing our operations and risks. An estimate of the scale of those costs was ~$20 million.
Tropical cyclones (hurricanes and
Increased frequency of extreme weather may
Reduction/disruption in production capacity
Unknown Direct About as likely as not
Low Due the uncertainty of how these risks materialize, we
Air Products has a formal Business Continuity Planning process
There were no additional costs for any specific climate change

26
Risk driver Description Potential impact Time frame
Direct/Indirect Likelihood
Magnitude of impact
Estimated financial implications
Management method
Cost of management
typhoons) mean an increased risk of power failures as well as disruptions to operations. Like many companies, we have assets located in coastal zones around the world that could, under conditions of significant sea level rise, be impacted to varying degrees. Such events could also impact Air Products’ suppliers, in which case energy and raw materials may be unavailable to us.
cannot estimate the financial implications, but, based on prior impacts of natural disasters, we would not expect any individual event to have a material impact on financial results. Given our market capitalization of $23.6 billion as of 31st Dec. 2013, a hypothetical impact that would result in a decreased stock-price of 1% would yield a reduced market value of around $200 million.
through which each business area evaluates its operational assets and develops Business Continuity Plans to address potential operational disruptions. These plans are used in concert with our Crisis Management Process. In addition our Corporate Risk Department maintains an evaluation of physical risk from extreme weather in order to ensure our capital assets are suitably protected. Our business is distributed across diverse regions and business sectors in over 50 countries. This diversity provides further protection from any dislocations resulting from physical risks potentially attributed to climate change. Air Products has installed regional Operational Service Centers (OSCs) around the world that provide system-wide operational and monitoring services for many of our major air separation unit and hydrogen facilities to optimize labor and supply chains. The OSCs help mitigate operating risk by creating a balance between centralized and plant-based resources. Impacts at any local operating plant location can be monitored both locally and from the highly-secure OSC, providing multiple means to quickly react to any climate related incidents. Orders to shift production loads from one plant to another or to address maintenance needs can be handled from a number of these centralized locations.
related actions. Our Risk Management process has not identified additional risks beyond those that Air Products is already managing, and our Crisis Management organization has been in place for some time. The costs for the installation of the regional OSCs was budgeted and paid for in the normal course of managing our operations and risks. An estimate of the scale of those costs was ~$20 million.

27
CC5.1c Please describe your risks that are driven by changes in other climate-related developments
Risk driver Description Potential impact
Time frame
Direct/ Indirect Likelihood
Magnitude of impact
Estimated Financial Implications
Management method
Cost of management
Reputation As a global industrial gases, materials, equipment and services company, our plants and operations generate a GHG footprint and consume energy. However, the products, equipment and market solutions we provide also enable our customers to reduce their GHG footprint and more efficiently use energy resources. For example, we estimate that 1 million metric tonnes of CO2 emission reductions are achieved each year at oxyfuel or oxygen enrichment installations provided by Air Products, even after accounting for the indirect CO2 emissions required to produce the oxygen. Air Products is the global leader in producing hydrogen that is critical to produce cleaner transportation fuels – it lowers sulfur in fuels and the corresponding sulfur dioxide (SOx), which causes acid rain. Cleaner fuels also enable catalytic converters to more effectively remove other pollutants from transportation fuels such as nitrogen oxides (NOx), particulate matter and volatile organic compounds (VOCs), which cause respiratory problems. Hydrogen also helps conserve natural resources by enabling refiners to increase the amount of fuel that can be
Reduced demand for goods/ services
Unknown Direct Unknown Unknown The business model we operate and its resulting GHG footprint can be misunderstood and could result in reduced access to talent, possible community or local authority concerns with respect to citing a facility, and potential concerns by customers in certain end-markets. Given our market capitalization of $23.6 billion as of 31 Dec 2013, a hypothetical impact that would result in a decreased stock-price of 1% would yield a reduced market value of ~$200 million.
Our GHG Strategy Team identifies climate change risks and opportunities, serving as our global center of excellence on internal policy development, regulations, legislation, and regularly updating management and the Board. We have set and are driving goals to reduce our energy consumption, met our GHG reduction goal, and are helping our customers do the same. Our success in driving the efficiency of our plants to lower emissions has made us the leader in producing hydrogen responsibly for today’s world. Air Products’ franchise business model, which consolidates several customers’ requirements for product into a single, more efficient world-scale facility, also reduces overall emissions versus the alternative of smaller, individual production plants at customers’ sites. Air Products continues to develop technologies that enable our customers’ and our own facilities to lower energy consumption, improve efficiency and reduce emissions. An example is Air Products’ state-of-the-art project to capture CO2 from its two
The company has not incurred additional costs to engage in and monitor these areas as the efforts of our GHG Strategy and other teams, and costs associated with reduction commitments and customer engagement for cost recovery, are budgeted in the normal course of business. An estimate of those costs is <$1 million per year. Membership dues for the trade organizations are also paid in the normal course of business. An estimate of the scale of those costs is <$1 million per year.

28
Risk driver Description Potential impact
Time frame
Direct/ Indirect Likelihood
Magnitude of impact
Estimated Financial Implications
Management method
Cost of management
produced from every barrel of crude oil. By using hydrogen to increase production of transportation fuels, refineries have avoided building new facilities, saved imports and reduced the associated CO2 emissions. Misunderstanding of our critical role in various value chains could pose reputation risks, potentially leading to less access to talented employees, possible community or local authority concerns about citing a facility, and potential issues serving customers in some end markets.
steam methane reformers located within the Valero Refinery in Port Arthur, TX. The units are designed to recover, purify and deliver approximately 1 million tons of CO2 annually via a pipeline owned by Denbury for injection into their enhanced oil recovery projects in the state. We are also pursuing longer-term alternative hydrogen production technologies, including biomass, gasification, solar, wind and sewage.
Uncertainty in market signals
The uncertainty in national and international future climate regulations creates risks when Air Products is making investment decisions and planning for the long-term. For an impression of the order of magnitude, our capital expenditure forecast is approximately $2 billion as publically reported today. A volatile allowance market might be expected given the projected sizes of various cap and trade allowance markets. Should regulations that increase costs be imposed in one area of the world and not in other areas, the potential exists for our customers and suppliers to relocate or face increased costs that their competitors in other regions might not face. As often our facilities are tied to our customers via pipelines, Air
Increased operational cost
Unknown Direct Unknown Unknown Given our market capitalization of $23.6 billion as of 31 Dec 2013, a hypothetical impact that would result in a decreased stock-price of 1% would yield a reduced market value of ~$200 million.
Our GHG Strategy Team identifies climate change risks and opportunities, serving as our global center of excellence on internal policy development, regulations, legislation, and regularly updating management and the Board. We have set and are driving goals to reduce our energy consumption, met our GHG reduction goal, and are helping our customers do the same. Our success in driving the efficiency of our plants to lower emissions has made us the leader in producing hydrogen responsibly for today’s world. Air Products’ franchise business model, which consolidates several customers’ requirements for product into a single, more efficient world-scale facility,
The company has not incurred additional costs to engage in and monitor these areas as the efforts of our GHG Strategy and other teams, and costs associated with reduction commitments and customer engagement for cost recovery, are budgeted in the normal course of business. An estimate of those costs is <$1 million per year. Membership dues for the trade organizations are also paid in the normal course of business. An estimate of the scale of those costs is <$1 million per year.

29
Risk driver Description Potential impact
Time frame
Direct/ Indirect Likelihood
Magnitude of impact
Estimated Financial Implications
Management method
Cost of management
Products would have to relocate or face increased costs as well.
also reduces overall emissions versus the alternative of smaller, individual production plants at customers’ sites. Air Products continues to develop technologies that enable our customers’ and our own facilities to lower energy consumption, improve efficiency and reduce emissions. An example is Air Products’ state-of-the-art project to capture CO2 from its two steam methane reformers located within the Valero Refinery in Port Arthur, TX. The units are designed to recover, purify and deliver approximately 1 million tons of CO2 annually via a pipeline owned by Denbury for injection into their enhanced oil recovery projects in the state. We are also pursuing longer-term alternative hydrogen production technologies, including biomass, gasification, solar, wind and sewage.
Uncertainty in market signals
The uncertainty in national and international future climate regulations creates risks when Air Products is making investment decisions and planning for the long-term. For an impression of the order of magnitude, our capital expenditure forecast is approximately $2 billion as publically
Reduced demand for goods/services
Unknown Indirect (Client)
Unknown Unknown Given our market capitalization of $23.6 billion as of 31 Dec 2013, a hypothetical impact that would result in a decreased stock-price of 1% would yield a reduced market value of ~$200 million.
Our GHG Strategy Team identifies climate change risks and opportunities, serving as our global center of excellence on internal policy development, regulations, legislation, and regularly updating management and the Board. We have set and are driving goals to reduce our energy consumption,
The company has not incurred additional costs to engage in and monitor these areas as the efforts of our GHG Strategy and other teams, and costs associated with reduction commitments and customer engagement for cost recovery, are budgeted in the normal course of business. An estimate of those costs is <$1
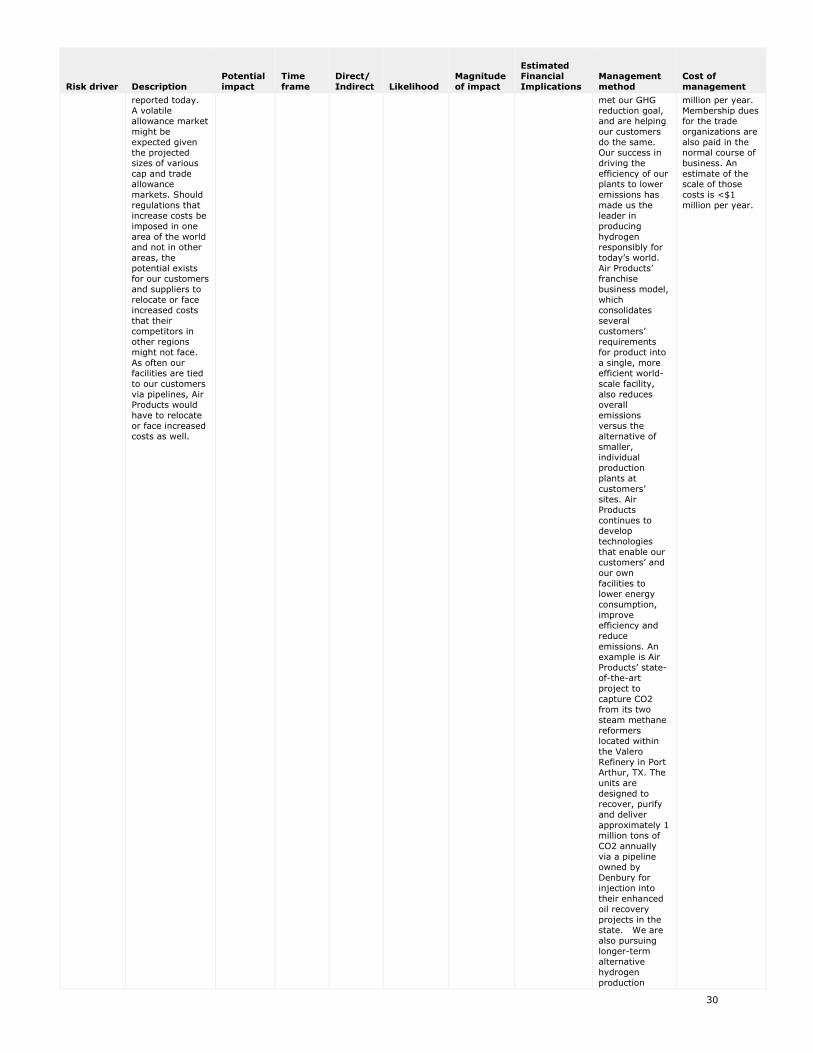
30
Risk driver Description Potential impact
Time frame
Direct/ Indirect Likelihood
Magnitude of impact
Estimated Financial Implications
Management method
Cost of management
reported today. A volatile allowance market might be expected given the projected sizes of various cap and trade allowance markets. Should regulations that increase costs be imposed in one area of the world and not in other areas, the potential exists for our customers and suppliers to relocate or face increased costs that their competitors in other regions might not face. As often our facilities are tied to our customers via pipelines, Air Products would have to relocate or face increased costs as well.
met our GHG reduction goal, and are helping our customers do the same. Our success in driving the efficiency of our plants to lower emissions has made us the leader in producing hydrogen responsibly for today’s world. Air Products’ franchise business model, which consolidates several customers’ requirements for product into a single, more efficient world-scale facility, also reduces overall emissions versus the alternative of smaller, individual production plants at customers’ sites. Air Products continues to develop technologies that enable our customers’ and our own facilities to lower energy consumption, improve efficiency and reduce emissions. An example is Air Products’ state-of-the-art project to capture CO2 from its two steam methane reformers located within the Valero Refinery in Port Arthur, TX. The units are designed to recover, purify and deliver approximately 1 million tons of CO2 annually via a pipeline owned by Denbury for injection into their enhanced oil recovery projects in the state. We are also pursuing longer-term alternative hydrogen production
million per year. Membership dues for the trade organizations are also paid in the normal course of business. An estimate of the scale of those costs is <$1 million per year.

31
Risk driver Description Potential impact
Time frame
Direct/ Indirect Likelihood
Magnitude of impact
Estimated Financial Implications
Management method
Cost of management
technologies, including biomass, gasification, solar, wind and sewage.
CC5.1d Please explain why you do not consider your company to be exposed to risks driven by changes in regulation that have the potential to generate a substantive change in your business operations, revenue or expenditure
CC5.1e Please explain why you do not consider your company to be exposed to risks driven by physical climate parameters that have the potential to generate a substantive change in your business operations, revenue or expenditure
CC5.1f Please explain why you do not consider your company to be exposed to risks driven by changes in other climate-related developments that have the potential to generate a substantive change in your business operations, revenue or expenditure
Further Information
CC6. Climate Change Opportunities
CC6.1 Have you identified any climate change opportunities that have the potential to generate a substantive change in your business operations, revenue or expenditure? Tick all that apply
Opportunities driven by changes in regulation Opportunities driven by changes in physical climate parameters Opportunities driven by changes in other climate-related developments
CC6.1a Please describe your opportunities that are driven by changes in regulation
Opportunity driver Description
Potential impact
Time frame
Direct/ Indirect Likelihood
Magnitude of impact
Estimated financial implications
Management method
Cost of management
International agreements
Any binding international agreement could lead to country-level programs aimed at decreasing GHG emissions or other mechanisms such as carbon trading and clean development activities. These developments could potentially increase demand for company products and services that reduce energy consumption and GHG emissions, or increase demand for Air Products’ CO2 capture technologies.
Increased demand for existing products/ services
Unknown Direct Unknown Unknown The high degree of uncertainty in timing and content prevents accurate prediction of the potential opportunity impact to Air Products in creating new markets or growing existing ones. A hypothetical 1% increase in sales revenue would result in approximately $100 million based on FY2013 data.
Our GHG Strategy Team identifies climate change risks and opportunities, serving as our global center of excellence on policy development, regulations, legislation, and regularly updating management and the Board. As part of this team, our Government Relations staff works with government agencies and NGOs in regions of the
Costs to engage in and monitor these areas are budgeted in the normal course of business and estimated at <$1million per year. Membership dues for the trade organizations are also paid in the normal course of business and estimated at <$1million per year. R&D and business development efforts are resourced in the normal

32
Opportunity driver Description
Potential impact
Time frame
Direct/ Indirect Likelihood
Magnitude of impact
Estimated financial implications
Management method
Cost of management
Increased demand for environmentally beneficial products and technologies may increase sales from current and developing products and solutions. Oxygen sales may increase from: oxyfuel combustion efficiency enhancement applications, which reduce fuel use, as well as the resulting GHG emissions in such markets as metals, glass, lime and cement; sales to the oil refining industry to debottleneck catalytic cracking units and sulfur recovery units; use of oxyfuel to facilitate carbon capture and sequestration (CCS), especially from large-scale operations such as power/utility boilers; and use in biomass combustion, gasification, and waste gasification. Demand may rise for our combined heat and power solutions and developing power solutions–such as our advanced CO2 separation technology that facilitates CO2 capture and sequestration from reforming, gasification and combustion applications–and our innovative Ion Transport Membrane (ITM) technology under development for high-efficiency oxygen production, enhancing the economic viability of large-scale applications. Hydrogen sales may increase from its use: for emission-free transportation fuel; in the production of biofuels from renewable feedstocks; and to enable refiners to meet increasing fuel emissions standards and to maximize the fuel produced from every barrel of
world where we have significant business interests to develop strategy, understand changing business environments, and position our businesses to respond to climate change opportunities. These efforts are augmented through membership in executive leadership forums, including the Business Environmental Leadership Council of the Center for Climate and Energy Solutions that provides insights into the local and international stage. We are involved with trade associations including the American Chemistry Council, Compressed Gas Association and European Industrial Gas Association. R&D efforts include partnering with government agencies and industry consortiums around the world to advance new technologies. For example, we are leveraging our competencies and collaborating with companies, governments and universities, to develop specialized CO2 capture technologies to enable cost effective and environmentally sound CO2 capture, purification and compression. We focus on providing solutions for natural gas
course of business. In 2013, nearly half of our total R&D budget of $133.7 million was spent on developing products that reduce GHGs and address other sustainability issues.

33
Opportunity driver Description
Potential impact
Time frame
Direct/ Indirect Likelihood
Magnitude of impact
Estimated financial implications
Management method
Cost of management
crude oil. We may also experience increased sales of nitrogen for unconventional natural gas production as well as increased demand for our Liquefied Natural Gas (LNG) solutions. We continue to develop technologies that enable our customers’ and our own facilities to lower energy consumption, improve efficiency and reduce emissions. An example is our state-of-the-art project to capture CO2 from two steam methane reformers at the Valero Port Arthur, TX refinery. The units are designed to recover, purify and deliver approximately 1 million tons of CO2 annually via a pipeline owned by Denbury for injection into their enhanced oil recovery projects in the state.
reforming, gasification and new-build oil-fired and coal-fired power plants and for retrofitting the large installed base of existing coal-fired assets.
International agreements
Any binding international agreement could lead to country-level programs aimed at decreasing GHG emissions or other mechanisms such as carbon trading and clean development activities. These developments could potentially increase demand for R&D, new products and services that reduce energy consumption and GHG emissions, or increase demand for Air Products’ CO2 capture technologies. To stimulate interest in our CO2 capture technologies, which require large amounts of O2, the carbon price would need to be set high enough to make CCS economical. The EU ETS is an example where the price of CO2 has not reached a level that would make CCS attractive without other
New products/business services
Unknown Direct Unknown Unknown The high degree of uncertainty in timing and content prevents accurate prediction of the potential opportunity impact to Air Products in creating new markets or growing existing ones. A hypothetical 1% increase in sales revenue would result in approximately $100 million based on FY2013 data.
Our GHG Strategy Team identifies climate change risks and opportunities, serving as our global center of excellence on policy development, regulations, legislation, and regularly updating management and the Board. As part of this team, our Government Relations staff works with government agencies and NGOs in regions of the world where we have significant business interests to develop strategy, understand changing business environments, and position our businesses to respond to climate change opportunities. These efforts
Costs to engage in and monitor these areas are budgeted and estimated at <$1million per year. Membership dues for trade organizations are also paid in the normal course of business and estimated at <$1million per year. In 2013, nearly half of our total R&D budget of $133.7 million was spent on developing products that reduce GHGs and address other sustainability issues. Costs for construction of our two Renewable Energy Facilities, are estimated at ~$950 million.

34
Opportunity driver Description
Potential impact
Time frame
Direct/ Indirect Likelihood
Magnitude of impact
Estimated financial implications
Management method
Cost of management
incentives. Capitalizing on an innovative growth opportunity, Air Products is constructing the company’s first Tees Valley Renewable Energy Facility located near Billingham, Teeside, UK. The advanced gasification energy from waste facility will convert pre-processed household and commercial waste currently going to landfill into baseload, renewable power for up to 50,000 homes in the North East, producing 49MW of electricity from about 300,000 tonnes of waste. Construction has begun on a second renewable energy facility of the same scope and scale on adjacent land. This second 49MW facility is also based on advanced gasification technology and will divert a similar amount of non-recyclable waste from landfill. Longer term, the potential generation of renewable hydrogen could be deployed for commercial use, such as fuelling public transport.
are augmented through membership in executive leadership forums, including the Business Environmental Leadership Council of the Center for Climate and Energy Solutions that provides insights into the local and international stage. We are involved with trade associations including the American Chemistry Council, Compressed Gas Association and European Industrial Gas Association. R&D efforts include partnering with government agencies and industry consortiums around the world to advance new technologies. For example, we are leveraging our competencies and collaborating with companies, governments and universities, to develop specialized CO2 capture technologies to enable cost effective and environmentally sound CO2 capture, purification and compression. We focus on providing solutions for natural gas reforming, gasification and new-build oil-fired and coal-fired power plants and for retrofitting the large installed base of existing coal-fired assets.
International agreements
Any binding international agreement could lead to country-level programs
Investment opportunities
Unknown Direct Unknown Unknown The high degree of uncertainty in timing and content prevents accurate prediction of the
Our GHG Strategy Team identifies climate change risks and
Costs to engage in and monitor these areas are budgeted and

35
Opportunity driver Description
Potential impact
Time frame
Direct/ Indirect Likelihood
Magnitude of impact
Estimated financial implications
Management method
Cost of management
aimed at decreasing GHG emissions or other mechanisms such as carbon trading and clean development activities. These developments could potentially increase investment in company products and equipment that reduce energy consumption and GHG emissions. Increased demand for environmentally beneficial products and technologies may increase sales of current and developing products and solutions. Oxygen sales may increase from: oxyfuel combustion efficiency enhancement applications, which reduce fuel use, as well as the resulting GHG emissions in such markets as metals, glass, lime and cement; sales to the oil refining industry to debottleneck catalytic cracking units and sulfur recovery units; use of oxyfuel to facilitate carbon capture and sequestration (CCS), especially from large-scale operations such as power/utility boilers; and use in biomass combustion, gasification, and waste gasification. Demand may rise for our combined heat and power solution and developing power solutions–such as our advanced CO2 separation technology that facilitates CO2 capture and sequestration from reforming, gasification and combustion applications–and our innovative Ion Transport Membrane (ITM) technology under development for high-efficiency oxygen production. Hydrogen sales may increase from its use: for
potential opportunity impact to Air Products in creating new markets or growing existing ones. A hypothetical 1% increase in sales revenue would result in approximately $100 million based on FY2013 data.
opportunities, serving as our global center of excellence on policy development, regulations, legislation, and regularly updating management and the Board. As part of this team, our Government Relations staff works with government agencies and NGOs in regions of the world where we have significant business interests to develop strategy, understand changing business environments, and position our businesses to respond to climate change opportunities. These efforts are augmented through membership in executive leadership forums, including the Business Environmental Leadership Council of the Center for Climate and Energy Solutions that provides insights into the local and international stage. We are involved with trade associations including the American Chemistry Council, Compressed Gas Association and European Industrial Gas Association. R&D efforts include partnering with government agencies and industry consortiums around the world to advance new technologies. For example, we are leveraging our competencies and
estimated at <$1million per year. Membership dues for trade organizations are also paid in the normal course of business and estimated at <$1million per year. In 2013, nearly half of our total R&D budget of $133.7 million was spent on developing products that reduce GHGs and address other sustainability issues. Costs for construction of our two Renewable Energy Facilities are estimated at ~$950 million.

36
Opportunity driver Description
Potential impact
Time frame
Direct/ Indirect Likelihood
Magnitude of impact
Estimated financial implications
Management method
Cost of management
emission-free transportation fuel; in the production of biofuels from renewable feedstocks; and to enable refiners to meet increasing fuel emissions standards and maximize the fuel from every barrel of crude oil. We may also experience increased sales of nitrogen for unconventional natural gas production and increased demand for our Liquefied Natural Gas (LNG) solutions. Air Products is constructing the company’s first Tees Valley Renewable Energy Facility located near Billingham, Teeside, UK. The advanced gasification energy from waste facility will convert pre-processed household and commercial waste currently going to landfill into baseload, renewable power for up to 50,000 homes, producing 49MW of electricity from about 300,000 tonnes of waste. Construction has begun on a second renewable energy facility of the same scope and scale on adjacent land. Longer term, the potential generation of renewable hydrogen could be deployed for commercial use, such as fuelling public transport.
collaborating with companies, governments and universities, to develop specialized CO2 capture technologies to enable cost effective and environmentally sound CO2 capture, purification and compression. We focus on providing solutions for natural gas reforming, gasification and new-build oil-fired and coal-fired power plants and for retrofitting the large installed base of existing coal-fired assets.
Air pollution limits
Beginning January 2, 2011, US EPA began covering GHG emissions from the largest stationary sources by the Prevention of Significant Deterioration (PSD) and Title V Operating Permit Programs. For PSD, this will include state determinations of what constitutes Best Available Control Technology (BACT) that affected facilities will be required to
Increased demand for existing products/services
Up to 1 year
Direct About as likely as not
Low US EPA’s requirement to consider Best Available Control Technology (BACT) for GHGs could grow existing markets and create new ones. Carbon capture is a potential BACT for power plants and could stimulate interest in our CO2 capture technologies that also require large amounts of oxygen. BACT requirements could grow existing oxyfuel combustion
Our GHG Strategy Team identifies climate change risks and opportunities, serving as our global center of excellence on policy development, regulations, legislation, and regularly updating management and the Board. As part of this team, our Government Relations staff
Costs to engage in and monitor these areas are budgeted and estimated at <$1million per year. Membership dues for the trade organizations are also budgeted and estimated at <$1million per year. In 2013, nearly half of our total R&D budget of $133.7 million

37
Opportunity driver Description
Potential impact
Time frame
Direct/ Indirect Likelihood
Magnitude of impact
Estimated financial implications
Management method
Cost of management
install. For example if BACT for power plants became a performance standard, it could increase interest in our CO2 capture technologies, which also require large amounts of oxygen. BACT requirements could also grow existing markets. For example, oxygen sales may increase from its use in oxyfuel combustion efficiency enhancement applications, reducing the use of fuel as well as the resulting GHG emissions in such markets as metals (iron, steel, copper, aluminum, etc.), glass, lime and cement. Similar opportunities could result from air pollution limits as a part of California Air Resource Board (CARB) actions.
efficiency enhancement applications. A hypothetical 1% increase in sales revenue would result in approximately $100 million based on FY2013 data.
works with government agencies and NGOs in regions of the world where we have significant business interests to develop strategy, understand changing business environments, and position our businesses to respond to climate change opportunities. These efforts are augmented through membership in executive leadership forums, including the Business Environmental Leadership Council of the Center for Climate and Energy Solutions that provides insights into the local and international stage. We are involved with trade associations including the American Chemistry Council, Compressed Gas Association and European Industrial Gas Association. R&D efforts include partnering with government agencies and industry consortiums around the world to advance new technologies. For example, we are leveraging our competencies and collaborating with companies, governments and universities, to develop specialized CO2 capture technologies to enable cost effective and environmentally sound CO2 capture, purification and
was spent on developing products that reduce GHGs and address other sustainability issues. We also sought and won government funding for our $431 million carbon capture project in Texas, receiving $284 million from US DOE.

38
Opportunity driver Description
Potential impact
Time frame
Direct/ Indirect Likelihood
Magnitude of impact
Estimated financial implications
Management method
Cost of management
compression. We focus on providing solutions for natural gas reforming, gasification and new-build oil-fired and coal-fired power plants and for retrofitting the large installed base of existing coal-fired assets.
Air pollution limits
Beginning January 2, 2011, US EPA began covering GHG emissions from the largest stationary sources by the Prevention of Significant Deterioration (PSD) and Title V Operating Permit Programs. For PSD, this will include state determinations of what constitutes Best Available Control Technology (BACT) that affected facilities will be required to install. For example, if BACT for power plants became a performance standard, it could increase interest in our CO2 capture technologies, and promote development of adjacent technologies. Similar opportunities could result from air pollution limits as a part of California Air Resource Board (CARB) actions.
New products/business services
Up to 1 year
Direct About as likely as not
Low US EPA’s requirement to consider Best Available Control Technology (BACT) for GHGs could grow existing markets and create new ones. Carbon capture is a potential BACT for power plants and could stimulate interest in our CO2 capture technologies that also require large amounts of oxygen. BACT requirements could grow existing oxyfuel combustion efficiency enhancement applications. A hypothetical 1% increase in sales revenue would result in approximately $100 million based on FY2013 data.
Our GHG Strategy Team identifies climate change risks and opportunities, serving as our global center of excellence on policy development, regulations, legislation, and regularly updating management and the Board. As part of this team, our Government Relations staff works with government agencies and NGOs in regions of the world where we have significant business interests to develop strategy, understand changing business environments, and position our businesses to respond to climate change opportunities. These efforts are augmented through membership in executive leadership forums, including the Business Environmental Leadership Council of the Center for Climate and Energy Solutions that provides insights into the local and international stage. We are involved with trade associations including the American Chemistry Council,
Costs to engage in and monitor these areas are budgeted in the normal course of business and estimated at <$1million per year. Membership dues for the trade organizations are similarly paid and estimated at <$1million per year. In 2013, nearly half of our total R&D budget of $133.7 million was spent on developing products that reduce GHGs and address other sustainability issues.

39
Opportunity driver Description
Potential impact
Time frame
Direct/ Indirect Likelihood
Magnitude of impact
Estimated financial implications
Management method
Cost of management
Compressed Gas Association and European Industrial Gas Association. R&D efforts include partnering with government agencies and industry consortiums around the world to advance new technologies. For example, we are leveraging our competencies and collaborating with companies, governments and universities, to develop specialized CO2 capture technologies to enable cost effective and environmentally sound CO2 capture, purification and compression. We focus on providing solutions for natural gas reforming, gasification and new-build oil-fired and coal-fired power plants and for retrofitting the large installed base of existing coal-fired assets.
Air pollution limits
Beginning January 2, 2011, US EPA began covering GHG emissions from the largest stationary sources by the Prevention of Significant Deterioration (PSD) and Title V Operating Permit Programs. For PSD, this will include state determinations of what constitutes Best Available Control Technology (BACT) that affected facilities will be required to install. For example if BACT for power plants became a performance standard, it could stimulate investment in our CO2 capture technologies, which also require
Investment opportunities
Up to 1 year
Direct About as likely as not
Low US EPA’s requirement to consider Best Available Control Technology (BACT) for GHGs could grow existing markets and create new ones. Carbon capture is a potential BACT for power plants and could stimulate interest in our CO2 capture technologies that also require large amounts of oxygen. BACT requirements could grow existing oxyfuel combustion efficiency enhancement applications. A hypothetical 1% increase in sales revenue would result in approximately $100 million based on FY2013 data.
Our GHG Strategy Team identifies climate change risks and opportunities, serving as our global center of excellence on policy development, regulations, legislation, and regularly updating management and the Board. As part of this team, our Government Relations staff works with government agencies and NGOs in regions of the world where we have significant business interests to develop strategy,
Costs to engage in and monitor these areas are budgeted and estimated at <$1million per year. Membership dues for the trade organizations are also budgeted and estimated at <$1million per year. In 2013, nearly half of our total R&D budget of $133.7 million was spent on developing products that reduce GHGs and address other sustainability issues. We also sought and won government funding for our

40
Opportunity driver Description
Potential impact
Time frame
Direct/ Indirect Likelihood
Magnitude of impact
Estimated financial implications
Management method
Cost of management
large amounts of oxygen. Similar opportunities could result from air pollution limits as a part of California Air Resource Board (CARB) actions. We continue to develop technologies that enable our customers’ and our own facilities to lower energy consumption, improve efficiency and reduce emissions. An example is our investment in a state-of-the-art $431 million project to capture CO2 from two steam methane reformers at the Valero Port Arthur, TX refinery. The units are designed to recover, purify and deliver approximately 1 million tons of CO2 annually via a pipeline owned by Denbury for injection into their enhanced oil recovery projects in the state. This project is also an example of where we have actively sought and won government funding (~$284 million from US DOE) to aid in the development and advancement of new technologies.
understand changing business environments, and position our businesses to respond to climate change opportunities. These efforts are augmented through membership in executive leadership forums, including the Business Environmental Leadership Council of the Center for Climate and Energy Solutions that provides insights into the local and international stage. We are involved with trade associations including the American Chemistry Council, Compressed Gas Association and European Industrial Gas Association. R&D efforts include partnering with government agencies and industry consortiums around the world to advance new technologies. For example, we are leveraging our competencies and collaborating with companies, governments and universities, to develop specialized CO2 capture technologies to enable cost effective and environmentally sound CO2 capture, purification and compression. We focus on providing solutions for natural gas reforming, gasification and new-build oil-fired and coal-fired power plants and for
$431 million carbon capture project in Texas, receiving $284 million from US DOE.

41
Opportunity driver Description
Potential impact
Time frame
Direct/ Indirect Likelihood
Magnitude of impact
Estimated financial implications
Management method
Cost of management
retrofitting the large installed base of existing coal-fired assets.
Carbon taxes An example of a carbon tax includes the UK Climate Change Levy (CCL) on energy usage. Any such carbon tax could increase demand for our products and services. For example, oxygen sales may increase from its use in oxyfuel combustion efficiency enhancement applications, reducing the use of fuel as well as the resulting GHG emissions in such markets as metals (iron, steel, copper, aluminum, etc.), glass, lime and cement).
Increased demand for existing products/services
Up to 1 year
Direct About as likely as not
Low Tax or cap and trade schemes that put a price on carbon may provide opportunities to grow demand and drive new markets. The carbon price would need to be set high enough to make CCS economical and stimulate interest in our CO2 capture technologies. The EU ETS is an example where the price of CO2 has not reached a level that would make CCS attractive without other incentives. A hypothetical 1% increase in sales revenue would result in approximately $100 million based on FY2013 data.
Our GHG Strategy Team identifies climate change risks and opportunities, serving as our global center of excellence on policy development, regulations, legislation, and regularly updating management and the Board. These efforts are augmented through membership in executive leadership forums, including the Business Environmental Leadership Council of the Center for Climate and Energy Solutions, and various trade associations. R&D efforts include partnering with agencies and industry consortiums to advance new technologies. For example, we are collaborating to develop specialized CO2 capture technologies to enable cost effective and environmentally sound CO2 capture, purification and compression. We focus on solutions for natural gas reforming, gasification, and new-build oil-fired and coal-fired power plants and for retrofits. We continue to develop technologies that enable our customers and our facilities to lower energy consumption, improve efficiency and reduce emissions. An
Costs to engage in and monitor these areas are budgeted and estimated at <$1million per year. Membership dues for the trade organizations are also budgeted and estimated at <$1million per year. In 2013, nearly half of our total R&D budget of $133.7 million was spent on developing products that reduce GHGs and address other sustainability issues. We also sought and won government funding for our $431 million carbon capture project in Texas, receiving $284 million from US DOE.

42
Opportunity driver Description
Potential impact
Time frame
Direct/ Indirect Likelihood
Magnitude of impact
Estimated financial implications
Management method
Cost of management
example is our investment in a state-of-the-art $431 million project to capture CO2 from two steam methane reformers at the Valero Port Arthur, TX refinery. The units are designed to recover, purify and deliver approximately 1 million tons of CO2 annually via a pipeline for injection into an enhanced oil recovery projects in the state. For this project we actively sought and won government funding (~$284 million from US DOE) to aid in the development and advancement of new technologies.
Carbon taxes An example of a carbon tax includes the UK Climate Change Levy (CCL) on energy usage. Any tax that puts a price on carbon could drive new markets and/or grow existing ones. However, to grow new markets, the cost on carbon would be key. In order to stimulate interest in our CO2 capture technologies, which also require large amounts of oxygen, the carbon price would need to be set high enough to make Carbon Capture and Sequestration economical. Capitalizing on an innovative growth opportunity, Air Products is constructing the company’s first Tees Valley Renewable Energy Facility located near Billingham, Teeside, UK. The advanced gasification energy from waste facility will convert pre-processed household and commercial waste currently going to
New products/business services
Up to 1 year
Direct About as likely as not
Low Tax or cap and trade schemes that put a price on carbon may provide opportunities to grow demand and drive new markets. The carbon price would need to be set high enough to make CCS economical and stimulate interest in our CO2 capture technologies. The EU ETS is an example where the price of CO2 has not reached a level that would make CCS attractive without other incentives. A hypothetical 1% increase in sales revenue would result in approximately $100 million based on FY2013 data.
Our GHG Strategy Team identifies climate change risks and opportunities, serving as our global center of excellence on policy development, regulations, legislation, and regularly updating management and the Board. As part of this team, our Government Relations staff works with government agencies and NGOs in regions of the world where we have significant business interests to develop strategy, understand changing business environments, and position our businesses to respond to climate change opportunities. These efforts are augmented through membership in executive
Costs to engage in and monitor these areas are budgeted in the normal course of business and estimated at <$1million per year. Membership dues for the trade organizations are similarly budgeted and estimated at <$1million per year. In 2013, nearly half of our total R&D budget of $133.7 million was spent on developing products that reduce GHGs and address other sustainability issues. Capital costs for the renewable energy facilities are estimated at ~$950 million.

43
Opportunity driver Description
Potential impact
Time frame
Direct/ Indirect Likelihood
Magnitude of impact
Estimated financial implications
Management method
Cost of management
landfill into baseload, renewable power for up to 50,000 homes in the North East, producing 49MW of electricity from about 300,000 tonnes of waste. Construction has begun on a second renewable energy facility of the same scope and scale on adjacent land. This second 49MW facility is also based on advanced gasification technology and will divert a similar amount of non-recyclable waste from landfill. Longer term, the potential generation of renewable hydrogen could be deployed for commercial use, such as fuelling public transport.
leadership forums, including the Business Environmental Leadership Council of the Center for Climate and Energy Solutions that provides insights into the local and international stage. We are involved with trade associations including the American Chemistry Council, Compressed Gas Association and European Industrial Gas Association. R&D efforts include partnering with government agencies and industry consortiums around the world to advance new technologies. For example, we are leveraging our competencies and collaborating with companies, governments and universities, to develop specialized CO2 capture technologies to enable cost effective and environmentally sound CO2 capture, purification and compression. We focus on providing solutions for natural gas reforming, gasification and new-build oil-fired and coal-fired power plants and for retrofitting the large installed base of existing coal-fired assets.
Carbon taxes An example of a carbon tax includes the UK Climate Change Levy (CCL) on energy usage. Any tax that puts a price on carbon could drive investment
Investment opportunities
Up to 1 year
Direct About as likely as not
Low Tax or cap and trade schemes that put a price on carbon may provide opportunities to grow demand and drive new markets. The carbon price would need to be
Our GHG Strategy Team identifies climate change risks and opportunities, serving as our global center of excellence on
Costs to engage in and monitor these areas are budgeted in the normal course of business and estimated at <$1million per

44
Opportunity driver Description
Potential impact
Time frame
Direct/ Indirect Likelihood
Magnitude of impact
Estimated financial implications
Management method
Cost of management
opportunities. However to promote investment, the cost on carbon would be key. In order to stimulate investment in our CO2 capture technologies, the carbon price would need to be set high enough to make Carbon Capture and Sequestration economical. We continue to develop technologies that enable our customers’ and our own facilities to lower energy consumption, improve efficiency and reduce emissions. An example is our investment in a state-of-the-art $431 million project to capture CO2 from two steam methane reformers at the Valero Port Arthur, TX refinery. The units are designed to recover, purify and deliver approximately 1 million tons of CO2 annually via a pipeline owned by Denbury for injection into their enhanced oil recovery projects in the state. This project is also an example of where we have actively sought and won government funding (~$284 million from US DOE) to aid in the development and advancement of new technologies. Capitalizing on an innovative growth opportunity, Air Products is constructing the company’s first Tees Valley Renewable Energy Facility located near Billingham, Teeside, UK. The advanced gasification energy from waste facility will convert pre-processed household and commercial waste currently going to landfill into baseload, renewable power for up to 50,000 homes in the North East, producing
set high enough to make CCS economical and stimulate interest in our CO2 capture technologies. The EU ETS is an example where the price of CO2 has not reached a level that would make CCS attractive without other incentives. A hypothetical 1% increase in sales revenue would result in approximately $100 million based on FY2013 data.
policy development, regulations, legislation, and regularly updating management and the Board. As part of this team, our Government Relations staff works with government agencies and NGOs in regions of the world where we have significant business interests to develop strategy, understand changing business environments, and position our businesses to respond to climate change opportunities. These efforts are augmented through membership in executive leadership forums, including the Business Environmental Leadership Council of the Center for Climate and Energy Solutions that provides insights into the local and international stage. We are involved with trade associations including the American Chemistry Council, Compressed Gas Association and European Industrial Gas Association. R&D efforts include partnering with government agencies and industry consortiums around the world to advance new technologies. For example, we are leveraging our competencies and collaborating with companies, governments
year. Membership dues for the trade organizations are similarly budgeted and estimated at <$1million per year. In 2013, nearly half of our total R&D budget of $133.7 million was spent on developing products that reduce GHGs and address other sustainability issues. Capital costs for the renewable energy facilities are estimated at ~$950 million.

45
Opportunity driver Description
Potential impact
Time frame
Direct/ Indirect Likelihood
Magnitude of impact
Estimated financial implications
Management method
Cost of management
49MW of electricity from about 300,000 tonnes of waste. Construction has begun on a second renewable energy facility of the same scope and scale on adjacent land. This second 49MW facility is also based on advanced gasification technology and will divert a similar amount of non-recyclable waste from landfill. Longer term, the potential generation of renewable hydrogen could be deployed for commercial use, such as fuelling public transport.
and universities, to develop specialized CO2 capture technologies to enable cost effective and environmentally sound CO2 capture, purification and compression. We focus on providing solutions for natural gas reforming, gasification and new-build oil-fired and coal-fired power plants and for retrofitting the large installed base of existing coal-fired assets.
Cap and trade schemes
Phase 3 (2013-2020) EU Emission Trading Scheme (ETS) is in force and associated legislative measures continue active consideration. Likewise, as part of the implementation of CA AB32, the California Air Resource Board (CARB) has implemented a cap and trade scheme that started January 2013. In South Korea, an ETS is scheduled to be implemented in 2015 and details are emerging. In China, seven regions (Beijing, Tianjin, Shanghai, Chongqing, and Shenzhen, Guangdong and Hubei) were chosen to start official, state-sanctioned ETS pilots in 2013. Pilots began in Beijing, Tianjin, Shanghai, Shenzhen, and Guangdong over the year. Cap and trade schemes could also be implemented in several other jurisdictions where Air Products has facilities. Cap and trade schemes could increase demand for existing products and services. For example, oxygen sales may increase from its use in
Increased demand for existing products/services
1 to 3 years
Direct About as likely as not
Low Tax or cap and trade schemes that put a price on carbon may provide opportunities to grow demand and drive new markets. The carbon price would need to be set high enough to make CCS economical and stimulate interest in our CO2 capture technologies. The EU ETS is an example where the price of CO2 has not reached a level that would make CCS attractive without other incentives. A hypothetical 1% increase in sales revenue would result in approximately $100 million based on FY2013 data.
Our GHG Strategy Team identifies climate change risks and opportunities, serving as our global center of excellence on policy development, regulations, legislation, and regularly updating management and the Board. As part of this team, our Government Relations staff works with government agencies and NGOs in regions of the world where we have significant business interests to develop strategy, understand changing business environments, and position our businesses to respond to climate change opportunities. These efforts are augmented through membership in executive leadership forums, including the Business Environmental Leadership Council of the Center for Climate and Energy Solutions that
Costs to engage in and monitor these areas are budgeted and estimated at <$1million per year. Membership dues for the trade organizations are also budgeted and estimated at <$1million per year. In 2013, nearly half of our total R&D budget of $133.7 million was spent on developing products that reduce GHGs and address other sustainability issues. We also sought and won government funding for our $431 million carbon capture project in Texas, receiving $284 million from US DOE.

46
Opportunity driver Description
Potential impact
Time frame
Direct/ Indirect Likelihood
Magnitude of impact
Estimated financial implications
Management method
Cost of management
oxyfuel combustion efficiency enhancement applications, reducing the use of fuel as well as the resulting GHG emissions in such markets as metals (iron, steel, copper, aluminum, etc.), glass, lime and cement. We continue to develop technologies that enable our customers’ and our own facilities to lower energy consumption, improve efficiency and reduce emissions. An example is our investment in a state-of-the-art $431 million project to capture CO2 from two steam methane reformers at the Valero Port Arthur, TX refinery. The units are designed to recover, purify and deliver approximately 1 million tons of CO2 annually via a pipeline owned by Denbury for injection into their enhanced oil recovery projects in the state. This project is also an example of where we have actively sought and won government funding (~$284 million from US DOE) to aid in the development and advancement of new technologies.
provides insights into the local and international stage. We are involved with trade associations including the American Chemistry Council, Compressed Gas Association and European Industrial Gas Association. R&D efforts include partnering with government agencies and industry consortiums around the world to advance new technologies. For example, we are leveraging our competencies and collaborating with companies, governments and universities, to develop specialized CO2 capture technologies to enable cost effective and environmentally sound CO2 capture, purification and compression. We focus on providing solutions for natural gas reforming, gasification and new-build oil-fired and coal-fired power plants and for retrofitting the large installed base of existing coal-fired assets.
Cap and trade schemes
Phase 3 (2013-2020) EU Emission Trading Scheme (ETS) is in force and associated legislative measures continue active consideration. Likewise, as part of the implementation of CA AB32, the California Air Resource Board (CARB) has implemented a cap and trade scheme that started January 2013. In
New products/business services
1 to 3 years
Direct About as likely as not
Low Tax or cap and trade schemes that put a price on carbon may provide opportunities to grow demand and drive new markets. The carbon price would need to be set high enough to make CCS economical and stimulate interest in our CO2 capture technologies. The EU ETS is an example where the price of CO2 has not reached a level that would make
Our GHG Strategy Team identifies climate change risks and opportunities, serving as our global center of excellence on policy development, regulations, legislation, and regularly updating management and the Board. As part of this team, our Government
Costs to engage in and monitor these areas are budgeted in the normal course of business and estimated at <$1million per year. Membership dues for the trade organizations are similarly budgeted and estimated at <$1million per year. In 2013, nearly half of

47
Opportunity driver Description
Potential impact
Time frame
Direct/ Indirect Likelihood
Magnitude of impact
Estimated financial implications
Management method
Cost of management
South Korea, an ETS is scheduled to be implemented in 2015 and details are emerging. In China, seven regions (Beijing, Tianjin, Shanghai, Chongqing, and Shenzhen, Guangdong and Hubei) were chosen to start official, state-sanctioned ETS pilots in 2013. Pilots began in Beijing, Tianjin, Shanghai, Shenzhen, and Guangdong over the year. Cap and trade schemes could also be implemented in several other jurisdictions where Air Products has facilities. Any cap and trade scheme that puts a price on carbon could drive new markets and/or grow existing ones. For example, interest in high-efficiency cogeneration facilities may increase. However to grow new markets, the cost on carbon would be key. In order to stimulate interest in our CO2 capture technologies, which also require large amounts of oxygen, the carbon price would need to be set high enough to make CCS economical. Capitalizing on an innovative growth opportunity, Air Products is constructing the company’s first Tees Valley Renewable Energy Facility located near Billingham, Teeside, UK. The advanced gasification energy from waste facility will convert pre-processed household and commercial waste currently going to landfill into baseload, renewable power for up to 50,000 homes in the North East, producing 49MW of electricity from about 300,000 tonnes of waste. Construction has begun on a second
CCS attractive without other incentives. A hypothetical 1% increase in sales revenue would result in approximately $100 million based on FY2013 data.
Relations staff works with government agencies and NGOs in regions of the world where we have significant business interests to develop strategy, understand changing business environments, and position our businesses to respond to climate change opportunities. These efforts are augmented through membership in executive leadership forums, including the Business Environmental Leadership Council of the Center for Climate and Energy Solutions that provides insights into the local and international stage. We are involved with trade associations including the American Chemistry Council, Compressed Gas Association and European Industrial Gas Association. R&D efforts include partnering with government agencies and industry consortiums around the world to advance new technologies. For example, we are leveraging our competencies and collaborating with companies, governments and universities, to develop specialized CO2 capture technologies to enable cost effective and environmentally sound CO2 capture,
our total R&D budget of $133.7 million was spent on developing products that reduce GHGs and address other sustainability issues. Capital costs for the renewable energy facilities are estimated at ~$950 million.

48
Opportunity driver Description
Potential impact
Time frame
Direct/ Indirect Likelihood
Magnitude of impact
Estimated financial implications
Management method
Cost of management
renewable energy facility of the same scope and scale on adjacent land. This second 49MW facility is also based on advanced gasification technology and will divert a similar amount of non-recyclable waste from landfill. Longer term, the potential generation of renewable hydrogen could be deployed for commercial use, such as fuelling public transport.
purification andcompression. We focus on providing solutions for natural gas reforming, gasification and new-build oil-fired and coal-fired power plants and for retrofitting the large installed base of existing coal-fired assets.
Cap and trade schemes
Phase 3 (2013-2020) EU Emission Trading Scheme (ETS) is in force and associated legislative measures continue active consideration. Likewise, as part of the implementation of CA AB32, the California Air Resource Board (CARB) has implemented a cap and trade scheme that started January 2013. In South Korea, an ETS is scheduled to be implemented in 2015 and details are emerging. In China, seven regions (Beijing, Tianjin, Shanghai, Chongqing, and Shenzhen, Guangdong and Hubei) were chosen to start official, state-sanctioned ETS pilots in 2013. Pilots began in Beijing, Tianjin, Shanghai, Shenzhen, and Guangdong over the year. Cap and trade schemes could also be implemented in several other jurisdictions where Air Products has facilities. Any cap and trade scheme that puts a price on carbon could drive investment opportunities. For example, interest in high-efficiency cogeneration facilities may increase. However to promote investment, the cost on carbon would be key. In
Investment opportunities
1 to 3 years
Direct About as likely as not
Low Tax or cap and trade schemes that put a price on carbon may provide opportunities to grow demand and drive new markets. The carbon price would need to be set high enough to make CCS economical and stimulate interest in our CO2 capture technologies. The EU ETS is an example where the price of CO2 has not reached a level that would make CCS attractive without other incentives. A hypothetical 1% increase in sales revenue would result in approximately $100 million based on FY2013 data.
Our GHG Strategy Team identifies climate change risks and opportunities, serving as our global center of excellence on policy development, regulations, legislation, and regularly updating management and the Board. As part of this team, our Government Relations staff works with government agencies and NGOs in regions of the world where we have significant business interests to develop strategy, understand changing business environments, and position our businesses to respond to climate change opportunities. These efforts are augmented through membership in executive leadership forums, including the Business Environmental Leadership Council of the Center for Climate and Energy Solutions that provides insights into the local and international stage. We are involved with
Costs to engage in and monitor these areas are budgeted in the normal course of business and estimated at <$1million per year. Membership dues for the trade organizations are similarly budgeted and estimated at <$1million per year. In 2013, nearly half of our total R&D budget of $133.7 million was spent on developing products that reduce GHGs and address other sustainability issues. Capital costs for the renewable energy facilities are estimated at ~$950 million.
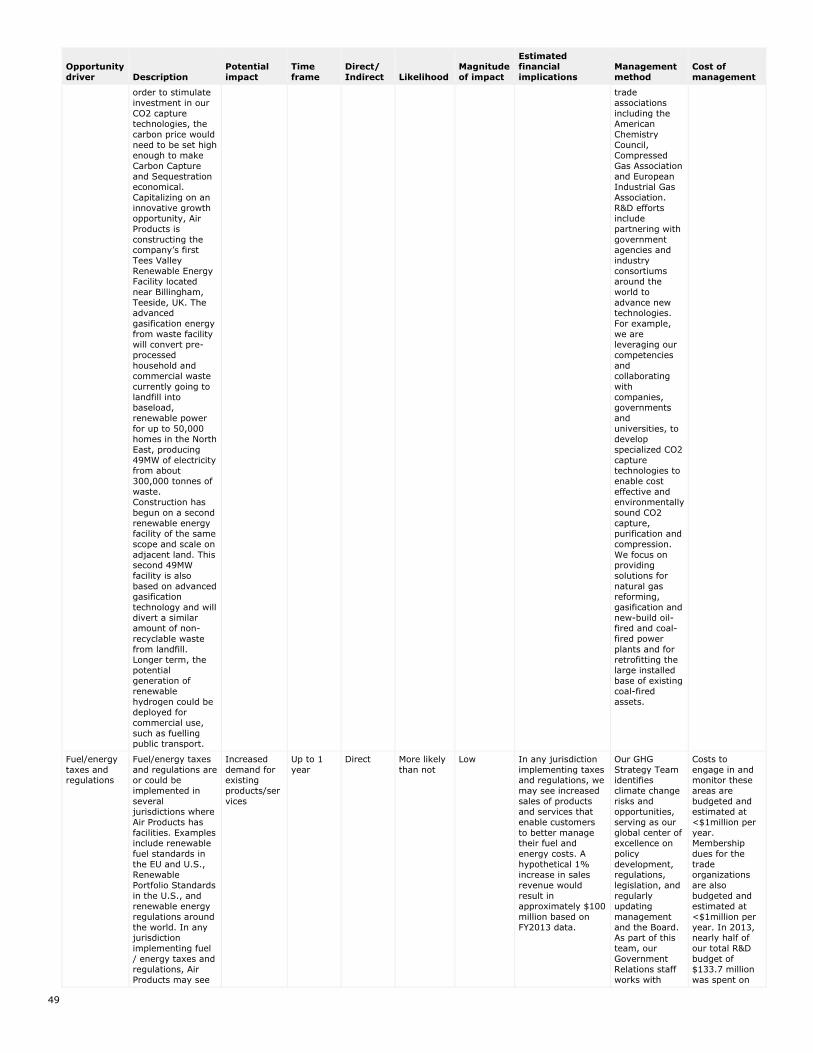
49
Opportunity driver Description
Potential impact
Time frame
Direct/ Indirect Likelihood
Magnitude of impact
Estimated financial implications
Management method
Cost of management
order to stimulate investment in our CO2 capture technologies, the carbon price would need to be set high enough to make Carbon Capture and Sequestration economical. Capitalizing on an innovative growth opportunity, Air Products is constructing the company’s first Tees Valley Renewable Energy Facility located near Billingham, Teeside, UK. The advanced gasification energy from waste facility will convert pre-processed household and commercial waste currently going to landfill into baseload, renewable power for up to 50,000 homes in the North East, producing 49MW of electricity from about 300,000 tonnes of waste. Construction has begun on a second renewable energy facility of the same scope and scale on adjacent land. This second 49MW facility is also based on advanced gasification technology and will divert a similar amount of non-recyclable waste from landfill. Longer term, the potential generation of renewable hydrogen could be deployed for commercial use, such as fuelling public transport.
trade associations including the American Chemistry Council, Compressed Gas Association and European Industrial Gas Association. R&D efforts include partnering with government agencies and industry consortiums around the world to advance new technologies. For example, we are leveraging our competencies and collaborating with companies, governments and universities, to develop specialized CO2 capture technologies to enable cost effective and environmentally sound CO2 capture, purification and compression. We focus on providing solutions for natural gas reforming, gasification and new-build oil-fired and coal-fired power plants and for retrofitting the large installed base of existing coal-fired assets.
Fuel/energy taxes and regulations
Fuel/energy taxes and regulations are or could be implemented in several jurisdictions where Air Products has facilities. Examples include renewable fuel standards in the EU and U.S., Renewable Portfolio Standards in the U.S., and renewable energy regulations around the world. In any jurisdiction implementing fuel / energy taxes and regulations, Air Products may see
Increased demand for existing products/services
Up to 1 year
Direct More likely than not
Low In any jurisdiction implementing taxes and regulations, we may see increased sales of products and services that enable customers to better manage their fuel and energy costs. A hypothetical 1% increase in sales revenue would result in approximately $100 million based on FY2013 data.
Our GHG Strategy Team identifies climate change risks and opportunities, serving as our global center of excellence on policy development, regulations, legislation, and regularly updating management and the Board. As part of this team, our Government Relations staff works with
Costs to engage in and monitor these areas are budgeted and estimated at <$1million per year. Membership dues for the trade organizations are also budgeted and estimated at <$1million per year. In 2013, nearly half of our total R&D budget of $133.7 million was spent on

50
Opportunity driver Description
Potential impact
Time frame
Direct/ Indirect Likelihood
Magnitude of impact
Estimated financial implications
Management method
Cost of management
increased sales of products and services that enable customers to better manage fuel and energy costs. To meet increased needs for renewable energy sources, demand may rise for high purity process gases and cleaning agents and services that facilitate production of the latest generation of PV solar energy cells as well as increased demand for our Liquefied Natural Gas (LNG) solutions. Sales of performance products, such as curing agents for epoxy resins that enable weight reduction in vehicles and wind turbines, may also increase. Renewable Fuel Standards in the US and the EU reinforce the market for biofuels and therefore the oxygen and hydrogen gases used in those processes. We continue to develop technologies that enable our customers’ and our own facilities to lower energy consumption, improve efficiency and reduce emissions. An example is our investment in a state-of-the-art $431 million project to capture CO2 from two steam methane reformers at the Valero Port Arthur, TX refinery. The units are designed to recover, purify and deliver approximately 1 million tons of CO2 annually via a pipeline owned by Denbury for injection into their enhanced oil recovery projects in the state. This project is also an example of where we have actively sought and won government funding (~$284 million from US DOE) to aid in the development and
government agencies and NGOs in regions of the world where we have significant business interests to develop strategy, understand changing business environments, and position our businesses to respond to climate change opportunities. These efforts are augmented through membership in executive leadership forums, including the Business Environmental Leadership Council of the Center for Climate and Energy Solutions that provides insights into the local and international stage. We are involved with trade associations including the American Chemistry Council, Compressed Gas Association and European Industrial Gas Association. R&D efforts include partnering with government agencies and industry consortiums around the world to advance new technologies. For example, we are leveraging our competencies and collaborating with companies, governments and universities, to develop specialized CO2 capture technologies to enable cost effective and environmentally sound CO2 capture, purification and compression.
developing products that reduce GHGs and address other sustainability issues. We also sought and won government funding for our $431 million carbon capture project in Texas, receiving $284 million from US DOE.

51
Opportunity driver Description
Potential impact
Time frame
Direct/ Indirect Likelihood
Magnitude of impact
Estimated financial implications
Management method
Cost of management
advancement of new technologies.
We focus onproviding solutions for natural gas reforming, gasification and new-build oil-fired and coal-fired power plants and for retrofitting the large installed base of existing coal-fired assets.
Fuel/energy taxes and regulations
Fuel/energy taxes and regulations are or could be implemented in several jurisdictions where Air Products has facilities. Examples include renewable fuel standards in the EU and U.S., Renewable Portfolio Standards in the U.S., and renewable energy regulations around the world. In any jurisdiction implementing fuel / energy taxes and regulations, Air Products may see increased R&D and sales of new products and services that enable customers to better manage fuel and energy costs. To meet increased needs for renewable energy sources, demand may rise for high purity process gases and cleaning agents and services that facilitate production of the latest generation of PV solar energy cells as well as increased demand for our Liquefied Natural Gas (LNG) solutions. Sales of performance products, such as curing agents for epoxy resins that enable weight reduction in vehicles and wind turbines, may also increase. Renewable Fuel Standards in the US and the EU reinforce the market for biofuels and therefore the oxygen and hydrogen gases used in those processes. Capitalizing on an innovative growth opportunity, Air Products is
New products/business services
Up to 1 year
Direct More likely than not
Low In any jurisdiction implementing taxes and regulations, we may see increased sales of products and services that enable customers to better manage their fuel and energy costs. A hypothetical 1% increase in sales revenue would result in approximately $100 million based on FY2013 data.
Our GHG Strategy Team identifies climate change risks and opportunities, serving as our global center of excellence on policy development, regulations, legislation, and regularly updating management and the Board. As part of this team, our Government Relations staff works with government agencies and NGOs in regions of the world where we have significant business interests to develop strategy, understand changing business environments, and position our businesses to respond to climate change opportunities. These efforts are augmented through membership in executive leadership forums, including the Business Environmental Leadership Council of the Center for Climate and Energy Solutions that provides insights into the local and international stage. We are involved with trade associations including the American Chemistry Council, Compressed
Costs to engage in and monitor these areas are budgeted and estimated at <$1million per year. Membership dues for trade organizations are also paid in the normal course of business and estimated at <$1million per year. In 2013, nearly half of our total R&D budget of $133.7 million was spent on developing products that reduce GHGs and address other sustainability issues. Costs for construction of our two Renewable Energy Facilities are estimated at ~$950 million.

52
Opportunity driver Description
Potential impact
Time frame
Direct/ Indirect Likelihood
Magnitude of impact
Estimated financial implications
Management method
Cost of management
constructing the company’s first Tees Valley Renewable Energy Facility located near Billingham, Teeside, UK. The advanced gasification energy from waste facility will convert pre-processed household and commercial waste currently going to landfill into baseload, renewable power for up to 50,000 homes in the North East, producing 49MW of electricity from about 300,000 tonnes of waste. Construction has begun on a second renewable energy facility of the same scope and scale on adjacent land. This second 49MW facility is also based on advanced gasification technology and will divert a similar amount of non-recyclable waste from landfill. Longer term, the potential generation of renewable hydrogen could be deployed for commercial use, such as fuelling public transport.
Gas Association and European Industrial Gas Association. R&D efforts include partnering with government agencies and industry consortiums around the world to advance new technologies. For example, we are leveraging our competencies and collaborating with companies, governments and universities, to develop specialized CO2 capture technologies to enable cost effective and environmentally sound CO2 capture, purification and compression. We focus on providing solutions for natural gas reforming, gasification and new-build oil-fired and coal-fired power plants and for retrofitting the large installed base of existing coal-fired assets.
Fuel/energy taxes and regulations
Fuel/energy taxes and regulations are or could be implemented in several jurisdictions where Air Products has facilities. Examples include renewable fuel standards in the EU and U.S., Renewable Portfolio Standards in the U.S., and renewable energy regulations around the world. In any jurisdiction implementing fuel / energy taxes and regulations, Air Products may see increased investment in products and equipment that enable customers to better manage fuel and energy costs. To meet increased needs for renewable energy sources,
Investment opportunities
Up to 1 year
Direct More likely than not
Low In any jurisdiction implementing taxes and regulations, we may see increased sales of products and services that enable customers to better manage their fuel and energy costs. A hypothetical 1% increase in sales revenue would result in approximately $100 million based on FY2013 data.
Our GHG Strategy Team identifies climate change risks and opportunities, serving as our global center of excellence on policy development, regulations, legislation, and regularly updating management and the Board. As part of this team, our Government Relations staff works with government agencies and NGOs in regions of the world where we have significant business interests to develop strategy, understand
Costs to engage in and monitor these areas are budgeted and estimated at <$1million per year. Membership dues for trade organizations are also paid in the normal course of business and estimated at <$1million per year. In 2013, nearly half of our total R&D budget of $133.7 million was spent on developing products that reduce GHGs and address other sustainability issues. Costs for construction of our two Renewable

53
Opportunity driver Description
Potential impact
Time frame
Direct/ Indirect Likelihood
Magnitude of impact
Estimated financial implications
Management method
Cost of management
demand may rise for high purity process gases and cleaning agents and services that facilitate production of the latest generation of PV solar energy cells as well as increased demand for our Liquefied Natural Gas (LNG) solutions. Sales of performance products, such as curing agents for epoxy resins that enable weight reduction in vehicles and wind turbines, may also increase. Renewable Fuel Standards in the US and the EU reinforce the market for biofuels and therefore the oxygen and hydrogen gases used in those processes. Capitalizing on an innovative growth opportunity, Air Products is constructing the company’s first Tees Valley Renewable Energy Facility located near Billingham, Teeside, UK. The advanced gasification energy from waste facility will convert pre-processed household and commercial waste currently going to landfill into baseload, renewable power for up to 50,000 homes in the North East, producing 49MW of electricity from about 300,000 tonnes of waste. Construction has begun on a second renewable energy facility of the same scope and scale on adjacent land. This second 49MW facility is also based on advanced gasification technology and will divert a similar amount of non-recyclable waste from landfill. Longer term, the potential generation of renewable hydrogen could be deployed for commercial use, such as fuelling
changing business environments, and position our businesses to respond to climate change opportunities. These efforts are augmented through membership in executive leadership forums, including the Business Environmental Leadership Council of the Center for Climate and Energy Solutions that provides insights into the local and international stage. We are involved with trade associations including the American Chemistry Council, Compressed Gas Association and European Industrial Gas Association. R&D efforts include partnering with government agencies and industry consortiums around the world to advance new technologies. For example, we are leveraging our competencies and collaborating with companies, governments and universities, to develop specialized CO2 capture technologies to enable cost effective and environmentally sound CO2 capture, purification and compression. We focus on providing solutions for natural gas reforming, gasification and new-build oil-fired and coal-fired power plants and for retrofitting the
Energy Facilities are estimated at ~$950 million.
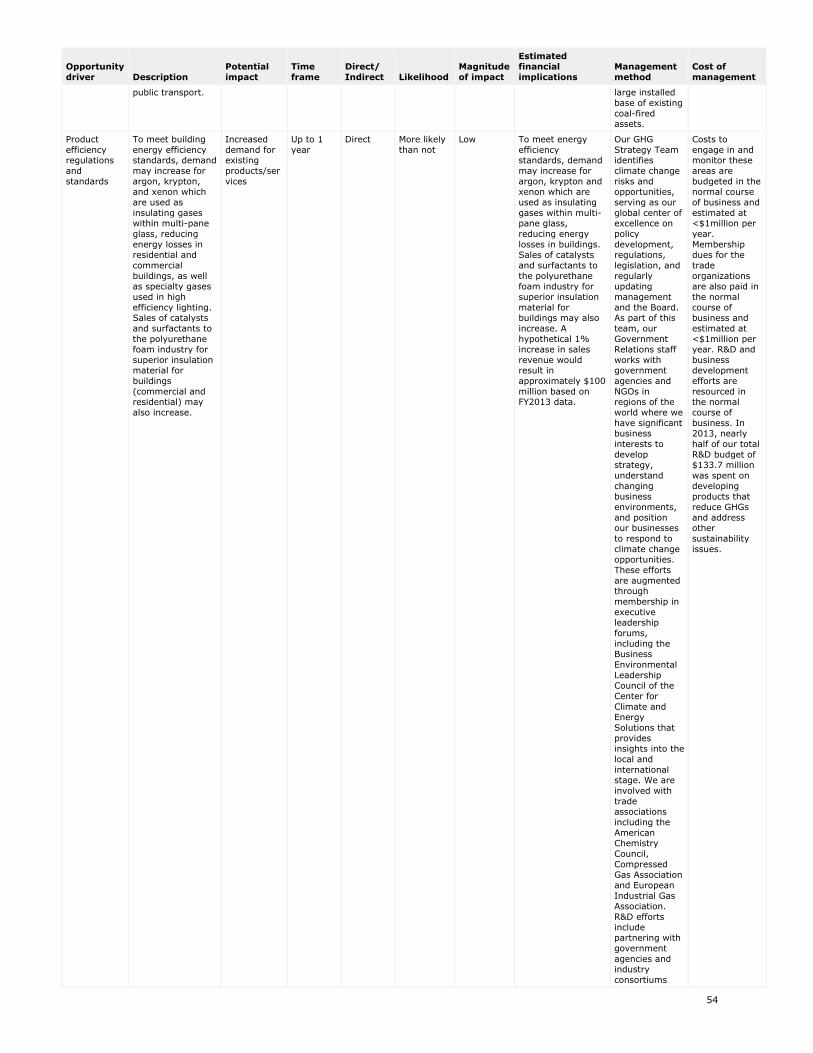
54
Opportunity driver Description
Potential impact
Time frame
Direct/ Indirect Likelihood
Magnitude of impact
Estimated financial implications
Management method
Cost of management
public transport. large installed base of existing coal-fired assets.
Product efficiency regulations and standards
To meet building energy efficiency standards, demand may increase for argon, krypton, and xenon which are used as insulating gases within multi-pane glass, reducing energy losses in residential and commercial buildings, as well as specialty gases used in high efficiency lighting. Sales of catalysts and surfactants to the polyurethane foam industry for superior insulation material for buildings (commercial and residential) may also increase.
Increased demand for existing products/services
Up to 1 year
Direct More likely than not
Low To meet energy efficiency standards, demand may increase for argon, krypton and xenon which are used as insulating gases within multi-pane glass, reducing energy losses in buildings. Sales of catalysts and surfactants to the polyurethane foam industry for superior insulation material for buildings may also increase. A hypothetical 1% increase in sales revenue would result in approximately $100 million based on FY2013 data.
Our GHG Strategy Team identifies climate change risks and opportunities, serving as our global center of excellence on policy development, regulations, legislation, and regularly updating management and the Board. As part of this team, our Government Relations staff works with government agencies and NGOs in regions of the world where we have significant business interests to develop strategy, understand changing business environments, and position our businesses to respond to climate change opportunities. These efforts are augmented through membership in executive leadership forums, including the Business Environmental Leadership Council of the Center for Climate and Energy Solutions that provides insights into the local and international stage. We are involved with trade associations including the American Chemistry Council, Compressed Gas Association and European Industrial Gas Association. R&D efforts include partnering with government agencies and industry consortiums
Costs to engage in and monitor these areas are budgeted in the normal course of business and estimated at <$1million per year. Membership dues for the trade organizations are also paid in the normal course of business and estimated at <$1million per year. R&D and business development efforts are resourced in the normal course of business. In 2013, nearly half of our total R&D budget of $133.7 million was spent on developing products that reduce GHGs and address other sustainability issues.

55
Opportunity driver Description
Potential impact
Time frame
Direct/ Indirect Likelihood
Magnitude of impact
Estimated financial implications
Management method
Cost of management
around the world to advance new technologies. For example, we are leveraging our competencies and collaborating with companies, governments and universities, to develop specialized CO2 capture technologies to enable cost effective and environmentally sound CO2 capture, purification and compression. We focus on providing solutions for natural gas reforming, gasification and new-build oil-fired and coal-fired power plants and for retrofitting the large installed base of existing coal-fired assets.
CC6.1b Please describe the opportunities that are driven by changes in physical climate parameters
Opportunity driver Description
Potential impact
Time frame
Direct/ Indirect Likelihood
Magnitude of impact
Estimated financial implications
Management method
Cost of management
Change in precipitation extremes and droughts
Lack of quality water in specific regions requires treating existing sources, which could be amplified by extreme droughts. This may result in increased sales of our Halia™ water treatment process technology.
Increased demand for existing products/ services
Up to 1 year
Direct About as likely as not
Low Lack of quality water in specific regions requires treating existing sources, which could be amplified by extreme droughts. This may result in increased sales of our Halia™ water treatment process technology. Further, our ozone offerings help develop sustainable water supply. A hypothetical 1% increase in sales revenue would result in less than a 1% increase in Merchant Gases sales or <$40 million based on FY2013 data.
Air Products continues to invest in developing water and wastewater treatment technologies that enable the provision of clean water for human and industrial use. For example, Air Products has developed Halia™ aeration systems for use in activated sludge processes that can result in higher treatment rates, reduced energy consumption, less foaming and lower VOC emissions than air systems.
A recent review of our R&D investment indicated that just under 50% of our $133.7 million in R&D spending is directed at environmental and energy offerings, including Halia™.

56
CC6.1c Please describe the opportunities that are driven by changes in other climate-related developments
Opportunity driver Description
Potential impact
Time frame
Direct/ Indirect Likelihood
Magnitude of impact
Estimated financial implications
Management method
Cost of management
Changing consumer behavior
It is plausible that climate change could induce changes in customer preferences for various products/services (e.g., more insulation for homes). If so, Air Products might see increased demand for its products or the desire for new products to meet changing needs. Higher building energy efficiency standards may drive demand for argon, krypton and xenon, which are used as insulating gases within multi-pane glass and reduce energy losses in residential and commercial buildings, as well as specialty gases used in high efficiency lighting. Sales of catalysts and surfactants to the polyurethane foam industry for superior insulation material for buildings (commercial and residential) may increase. Sales of other performance products, such as curing agents for epoxy resins used in high strength-to-weight composites that enable weight reduction in transportation vehicles and wind turbines, may also increase.
Increased demand for existing products/ services
Unknown Direct About as likely as not
Low It is plausible that climate change could induce changes in customer preferences for various products/services (e.g., more insulation for homes, etc. If so, Air Products might see increased demand for its products. A hypothetical 1% increase in sales revenue would result in approximately $100 million based on FY2013 data.
Our GHG Strategy Team identifies climate change risks and opportunities, serving as our global center of excellence on policy development, regulations, legislation, and regularly updating management and the Board. As part of this team, our Government Relations staff works with government agencies and NGOs in regions of the world where we have significant business interests to develop strategy, understand changing business environments, and position our businesses to respond to climate change opportunities. These efforts are augmented through membership in executive leadership forums, including the Business Environmental Leadership Council of the Center for Climate and Energy Solutions that provides insights into the local and international stage. We are involved with trade associations including the American Chemistry Council, Compressed Gas Association and European Industrial Gas Association. R&D efforts include partnering with government agencies and industry consortiums around the world to advance new technologies.
Costs to engage in and monitor these areas are budgeted in the normal course of business and estimated at <$1million per year. Membership dues for the trade organizations are also paid in the normal course of business and estimated at <$1million per year. R&D and business development efforts are resourced in the normal course of business. In 2013, nearly half of our total R&D budget of $133.7 million was spent on developing products that reduce GHGs and address other sustainability issues.

57
CC6.1d Please explain why you do not consider your company to be exposed to opportunities driven by changes in regulation that have the potential to generate a substantive change in your business operations, revenue or expenditure
CC6.1e Please explain why you do not consider your company to be exposed to opportunities driven by physical climate parameters that have the potential to generate a substantive change in your business operations, revenue or expenditure
CC6.1f Please explain why you do not consider your company to be exposed to opportunities driven by changes in other climate-related developments that have the potential to generate a substantive change in your business operations, revenue or expenditure
Further Information
Module: GHG Emissions Accounting, Energy and Fuel Use, and Trading
CC7. Emissions Methodology
CC7.1 Please provide your base year and base year emissions (Scopes 1 and 2)
Base year Scope 1 Base year emissions (metric tonnes CO2e)
Scope 2 Base year emissions (metric tonnes CO2e)
Mon 01 Jan 2007 - Mon 31 Dec 2007 12762690 9578816
CC7.2 Please give the name of the standard, protocol or methodology you have used to collect activity data and calculate Scope 1 and Scope 2 emissions
Please select the published methodologies that you useThe Greenhouse Gas Protocol: A Corporate Accounting and Reporting Standard (Revised Edition)US EPA Climate Leaders: Direct Emissions from Stationary CombustionUS EPA Climate Leaders: Indirect Emissions from Purchases/Sales of Electricity and SteamUS EPA Climate Leaders: Direct HFC and PFC Emissions from Manufacturing Refrigeration and Air Conditioning Equipment European Union Emission Trading System (EU ETS): The Monitoring and Reporting Regulation (MMR) – General guidance for installationsUS EPA Mandatory Greenhouse Gas Reporting Rule Other
CC7.2a If you have selected "Other" in CC7.2 please provide details of the standard, protocol or methodology you have used to collect activity data and calculate Scope 1 and Scope 2 emissions
The Greenhouse Gas Protocol standard is used to define organizational boundaries, operational boundaries, emission calculation methodologies (general and specific), sector-specific calculation protocols (nitric acid production), and inventory quality aspects. We continue to maintain a formal Inventory Management Plan that was created in cooperation with the U.S. EPA staff under their Climate Leaders program. Energy consumption, refrigerant losses, and relevant production activity and process emissions raw data are compiled through existing, centralized production and purchasing databases, augmented with discrete data requests to operating staff to complete the required input data. Calculations are performed through a custom spreadsheet tool following calculation algorithms defined in 23 process- or activity-specific calculation protocol documents. Standard emission factors (typically U.S. EPA references) are used for fuels and electricity consumption. Electricity factors are selected specific to the location of the consuming source, ensuring an appropriate representation of the generating fuels mixture by region/county. Further, 28 of our largest emitting plants are subject to mandatory GHG emission reporting in their respective regulatory jurisdictions. The largest number of such facilities are subject to the US EPA Mandatory Greenhouse Gas Reporting Rule and follow that methodology. Other similar methodologies are those defined by the Province of Alberta’s Specified Gases Emitters Regulation, the Province of Ontario’s Greenhouse Gas Emission Reporting

58
regulation, and the California Greenhouse Gas Mandatory Reporting Rule. These facilities follow the emission reporting methodologies, data accuracy and missing data substitution protocols required under their respective regulations and, where required, are further subject to third-party verification of the emissions report. Where any jurisdiction does not include a source of GHG emissions we recognize as within the Financial Control boundary defined by WRI, these emissions are added to the mandatory reporting emission value for such facilities. The calculation and data are subjected to several levels of quality assurance to ensure completeness and accuracy of the resulting emissions inventory. The entire inventory process is documented and subsequently summarized in the Inventory Management Plan. Air Products continues to summarize its emissions in the “Annual GHG Inventory Summary and Goal Tracking Form.” format established under the Climate Leaders program, The Inventory Management Plan and the Annual GHG Inventory Summary and Goal Tracking Form emissions report are then reviewed as part of our external verification process.
CC7.3 Please give the source for the global warming potentials you have used
Gas ReferenceCO2 IPCC Fourth Assessment Report (AR4 - 100 year)CH4 IPCC Fourth Assessment Report (AR4 - 100 year)N2O IPCC Fourth Assessment Report (AR4 - 100 year)HFCs IPCC Fourth Assessment Report (AR4 - 100 year)SF6 IPCC Fourth Assessment Report (AR4 - 100 year)Other: CF4 IPCC Fourth Assessment Report (AR4 - 100 year)Other: C2F6 IPCC Fourth Assessment Report (AR4 - 100 year)Other: NF3 IPCC Fourth Assessment Report (AR4 - 100 year)
7.4 Please give the emissions factors you have applied and their origin; alternatively, please attach an Excel spreadsheet with this data at the bottom of this page
Fuel/Material/ Energy
Emission Factor Unit Reference
Natural gas 117.1 lb CO2e per million BTU
Derived from EPA Climate Leaders GHG Inventory Protocol – Stationary Combustion Sources Guidance – Tables A-1 and B3 (May 2008).
Distillate fuel oil No 2 163.61 lb CO2e per million BTU
Derived from 2013 Revisions to the Greenhouse Gas Reporting Rule and Final Confidentiality
Motor gasoline 155.37 lb CO2e per million BTU
Derived from 2013 Revisions to the Greenhouse Gas Reporting Rule and Final Confidentiality
Jet kerosene 159.78 lb CO2e per million BTU
Derived from 2013 Revisions to the Greenhouse Gas Reporting Rule and Final Confidentiality
Bituminous coal 207.3 lb CO2e per million BTU
Derived from 2013 Revisions to the Greenhouse Gas Reporting Rule and Final Confidentiality
Petroleum coke 227.43 lb CO2e per million BTU
Derived from 2013 Revisions to the Greenhouse Gas Reporting Rule and Final Confidentiality
Page: CC8. Emissions Data - (1 Jan 2013 - 31 Dec 2013)
CC8.1 Please select the boundary you are using for your Scope 1 and 2 greenhouse gas inventor
Financial control
CC8.2 Please provide your gross global Scope 1 emissions figures in metric tonnes CO2e
14972268
CC8.3 Please provide your gross global Scope 2 emissions figures in metric tonnes CO2e
10853989

59
CC8.4 Are there are any sources (e.g. facilities, specific GHGs, activities, geographies, etc.) of Scope 1 and Scope 2 emissions that are within your selected reporting boundary which are not included in your disclosure?
No
CC8.4a Please provide details of the sources of Scope 1 and Scope 2 emissions that are within your selected reporting boundary which are not included in your disclosure
Source Relevance of Scope 1 emissions from this source
Relevance of Scope 2 emissions excluded from this source
Explain why the source is excluded
CC8.5 Please estimate the level of uncertainty of the total gross global Scope 1 and 2 emissions figures that you have supplied and specify the sources of uncertainty in your data gathering, handling and calculations
Scope 1 emissions: Uncertainty range
Scope 1 emissions: Main sources of uncertainty
Scope 1 emissions: Please expand on the uncertainty in your data
Scope 2 emissions: Uncertainty range
Scope 2 emissions: Main sources of uncertainty
Scope 2 emissions: Please expand on the uncertainty in your data
Less than or equal to 2%
Data Gaps Metering/ Measurement Constraints Other: unit errors
Air Products utilizes WRI's “Measurement and Uncertainty of GHG Emissions” spreadsheet, Ver 1.0 (Sep 2003) (http://www.ghgprotocol.org/calculation-tools/all-tools) to perform a statistical assessment of the various sources of uncertainty by emission source type. For example, the majority of fuel consumption data is from invoice-quality consumption data and presumed accurate to < or = 1%. Process emissions derived from production measurements are presumed accurate to 3%. Since this form of calculation represents just 6% of our emissions, the net error is < 0.2%. The weighted average uncertainty for Scope 1 emissions is estimated at 1.0%. Data gaps and units errors are subject to multiple quality assurance and completeness checks, rendering such sources of uncertainty to negligible.
More than 2% but less than or equal to 5%
Data Gaps Assumptions Metering/ Measurement Constraints Other: Unit errors
A process of weighted-average uncertainty assessment is used, that assigns an estimated uncertainty to different data classes and derives a net uncertainty for the entire emission estimate by weight-averaging based on emissions of each data sub-group. For example, the majority of electricity consumption data is from invoice-quality consumption data and presumed accurate to < or = 1%. Where electricity is provided by the host customer to operate Air Products owned assets, correlations were established from actual operating data and engineering relationships to allow a representative maximum energy consumption to be estimated for every such asset (approximately 500 facilities representing 17% of our Scope 2 emissions). This energy:production correlation was updated in 2011 to reflect advances in process design for newly constructed assets. A much higher percentage of facilities were used as the sample set for this updated correlation, reducing the uncertainty of the average value. Conservative assumptions regarding electricity consumption are employed for operating assets where the electricity is supplied by the host customer. Over estimation may be a great as 20% on that portion of our business which represents 17% of our electricity consumption, resulting in a net error as great as 3%. The weighted average uncertainty for Scope 2 emissions is estimated at 3.5%. Data gaps and units errors are subject to multiple quality assurance and completeness checks, rendering such sources of uncertainty to negligible.

60
CC8.6 Please indicate the verification/assurance status that applies to your reported Scope 1 emissions
Third party verification or assurance complete
CC8.6a Please provide further details of the verification/assurance undertaken for your Scope 1 emissions, and attach the relevant statements
Type of verification or assurance Attach the statement
Page/section
reference Relevant standard
Proportion of reported Scope 1 emissions
verified (%) Limited assurance
https://www.cdp.net/sites/2014/35/435/Investor CDP 2014/Shared Documents/Attachments/CC8.6a/Air Products CY2013 GHG Assurance Review Letter_05 27 14.pdf
3 ISO14064-3 100
Reasonable assurance
https://www.cdp.net/sites/2014/35/435/Investor CDP 2014/Shared Documents/Attachments/CC8.6a/Carson CA - CO2 Emissions Verification.pdf
13, 14, 42 California Mandatory GHG Reporting Regulations (CARB)
5
Reasonable assurance
https://www.cdp.net/sites/2014/35/435/Investor CDP 2014/Shared Documents/Attachments/CC8.6a/Martinez CA - CO2 Emissions Verification.pdf
13, 14, 41 California Mandatory GHG Reporting Regulations (CARB)
2
Reasonable assurance
https://www.cdp.net/sites/2014/35/435/Investor CDP 2014/Shared Documents/Attachments/CC8.6a/Sacramento CA - CO2 Emissions Verification.pdf
13, 14, 41 California Mandatory GHG Reporting Regulations (CARB)
1
Reasonable assurance
https://www.cdp.net/sites/2014/35/435/Investor CDP 2014/Shared Documents/Attachments/CC8.6a/Wilmington CA - CO2 Emissions Verification.pdf
13, 14, 42 California Mandatory GHG Reporting Regulations (CARB)
4
Reasonable assurance
https://www.cdp.net/sites/2014/35/435/Investor CDP 2014/Shared Documents/Attachments/CC8.6a/Edmonton Alberta Hydrogen Plant - CO2 Verification Statement.PDF
1 Alberta Specified Gas Emitters Regulation (SGER)
7
Reasonable assurance
https://www.cdp.net/sites/2014/35/435/Investor CDP 2014/Shared Documents/Attachments/CC8.6a/Botlek CO2 Verification Statement.pdf
1 European Union Emissions Trading System (EU ETS)
1
Reasonable assurance
https://www.cdp.net/sites/2014/35/435/Investor CDP 2014/Shared Documents/Attachments/CC8.6a/Rotterdam CO2 Verification Statement.pdf
1 European Union Emissions Trading System (EU ETS)
4
Reasonable assurance
https://www.cdp.net/sites/2014/35/435/Investor CDP 2014/Shared Documents/Attachments/CC8.6a/2013_Informe_Anual_Seguimiento_Verificado_Tarragona.pdf
7, 8, 14 European Union Emissions Trading System (EU ETS)
2
Reasonable assurance
https://www.cdp.net/sites/2014/35/435/Investor CDP 2014/Shared Documents/Attachments/CC8.6a/Corunna_27Aug2013_CY2012-GHG-CRA-Ltd-Assurance Statement.pdf
2 Other: Ontario Canada - mandatory reporting and verification program, per Sections 5 and 11 of Regulation 452/09 Greenhouse Gas Emission Reporting
3
CC8.6b Please provide further details of the regulatory regime to which you are complying that specifies the use of Continuous Emissions Monitoring Systems (CEMS)
Regulation % of emissions covered by the system Compliance period Evidence of submission
CC8.7 Please indicate the verification/assurance status that applies to your reported Scope 2 emissions
Third party verification or assurance complete

61
CC8.7a Please provide further details of the verification/assurance undertaken for your Scope 2 emissions, and attach the relevant statements
Type of verification or assurance Attach the statement
Page/Section reference
Relevant standard
Proportion of Scope 2 emissions
verified (%) Limited assurance
https://www.cdp.net/sites/2014/35/435/Investor CDP 2014/Shared Documents/Attachments/CC8.7a/Air Products CY2013 GHG Assurance Review Letter_05 27 14.pdf
3 ISO14064-3 100
Reasonable assurance
https://www.cdp.net/sites/2014/35/435/Investor CDP 2014/Shared Documents/Attachments/CC8.7a/Carson CA - CO2 Emissions Verification.pdf
13, 14, 42 Other: California Mandatory GHG Reporting Regulations (CARB)
1
Reasonable assurance
https://www.cdp.net/sites/2014/35/435/Investor CDP 2014/Shared Documents/Attachments/CC8.7a/Martinez CA - CO2 Emissions Verification.pdf
13, 14, 41 Other: California Mandatory GHG Reporting Regulations (CARB)
1
Reasonable assurance
https://www.cdp.net/sites/2014/35/435/Investor CDP 2014/Shared Documents/Attachments/CC8.7a/Sacramento CA - CO2 Emissions Verification.pdf
13, 14, 41 Other: California Mandatory GHG Reporting Regulations (CARB)
1
Reasonable assurance
https://www.cdp.net/sites/2014/35/435/Investor CDP 2014/Shared Documents/Attachments/CC8.7a/Wilmington CA - CO2 Emissions Verification.pdf
13, 14, 42 Other: California Mandatory GHG Reporting Regulations (CARB)
1
CC8.8 Please identify if any data points other than emissions figures have been verified as part of the third party verification work undertaken
Additional data points verified Comment Year on year change in emissions (Scope 1)
WSP Environment & Energy conducted a limited assurance review of Air Products’ 2013 Scope 1, Scope 2 and selected elements of Scope 3 greenhouse gas inventory, including the year on year change in Scope 1 emissions.
Year on year change in emissions (Scope 2)
WSP Environment & Energy conducted a limited assurance review of Air Products’ 2013 Scope 1, Scope 2 and selected elements of Scope 3 greenhouse gas inventory, including the year on year change in Scope 2 emissions.
Year on year change in emissions (Scope 1 and 2)
WSP Environment & Energy conducted a limited assurance review of Air Products’ 2013 Scope 1, Scope 2 and selected elements of Scope 3 greenhouse gas inventory, including the year on year change in Scope 1 and 2 emissions.
Year on year emissions intensity figure WSP Environment & Energy conducted a limited assurance review of Air Products’ 2013 Scope 1, Scope 2 and selected elements of Scope 3 greenhouse gas inventory, including the year on year change in emissions intensity.
CC8.9 Are carbon dioxide emissions from biologically sequestered carbon relevant to your organization?
Yes
CC8.9a Please provide the emissions from biologically sequestered carbon relevant to your organization in metric tonnes CO2
1200
Further Information Thirty-two percent of our Scope 1 emissions are from sources which are currently subject to mandatory third part verification. An additional 64% of Scope 1 emissions are from facilities subject to mandatory GHG emission reporting, subject to regulatory and/or criminal sanction for any misrepresentation of the reported data. These additional obligations provide another level of work process and data quality assurance. Scope 2 emissions are indirectly verified for California facilities subject to the state’s mandatory reporting rule. The four plants reported by Air Products also must disclose their electricity consumption, and hence their Scope 2 emissions. All plants separately represent less than 1% of the total Scope 2 emissions, and together only represent 0.3% of our Scope 2 emissions.

62
CC9. Scope 1 Emissions Breakdown - (1 Jan 2013 - 31 Dec 2013)
CC9.1 Do you have Scope 1 emissions sources in more than one country?
Yes
CC9.1a Please break down your total gross global Scope 1 emissions by country/region
Country/Region Scope 1 metric tonnes CO2eUnited States of America 11692704North America 1600386South America 104763Europe, Middle East and Africa (EMEA) 938233Asia, Australasia 636183
CC9.2 Please indicate which other Scope 1 emissions breakdowns you are able to provide (tick all that apply)
CC9.2a Please break down your total gross global Scope 1 emissions by business division
Business division Scope 1 emissions (metric tonnes CO2e)
CC9.2b Please break down your total gross global Scope 1 emissions by facility
Facility Scope 1 emissions (metric tonnes CO2e) Latitude Longitude
CC9.2c Please break down your total gross global Scope 1 emissions by GHG type
GHG type Scope 1 emissions (metric tonnes CO2e)
CC9.2d Please break down your total gross global Scope 1 emissions by activity
Activity Scope 1 emissions (metric tonnes CO2e)
CC9.2e Please break down your total gross global Scope 1 emissions by legal structure
Legal structure Scope 1 emissions (metric tonnes CO2e)
Further Information
CC10. Scope 2 Emissions Breakdown - (1 Jan 2013 - 31 Dec 2013)
CC10.1 Do you have Scope 2 emissions sources in more than one country?
Yes
CC10.1a Please break down your total gross global Scope 2 emissions and energy consumption by country/region
Country/Region Scope 2 metric tonnes CO2e
Purchased and consumed electricity, heat, steam or cooling (MWh)
Purchased and consumed low carbon electricity, heat, steam or cooling accounted for CC8.3 (MWh)
United States of America 4804330 9264423 9264423 North America 174494 532207 532207 South America 139196 615826 615826 Europe, Middle East and Africa (EMEA)
1770615 4164095 4164095
Asia, Australasia 3965354 6921777 6921777

63
CC10.2 Please indicate which other Scope 2 emissions breakdowns you are able to provide (tick all that apply)
CC10.2a Please break down your total gross global Scope 2 emissions by business division
Business division Scope 2 emissions (metric tonnes CO2e)
CC10.2b Please break down your total gross global Scope 2 emissions by facility
Facility Scope 2 emissions (metric tonnes CO2e)
CC10.2c Please break down your total gross global Scope 2 emissions by activity
Activity Scope 2 emissions (metric tonnes CO2e)
CC10.2d Please break down your total gross global Scope 2 emissions by legal structure
Legal structure
Scope 2 emissions (metric tonnes CO2e)
Further Information
CC11. Energy
CC11.1 What percentage of your total operational spend in the reporting year was on energy?
More than 20% but less than or equal to 25%
CC11.2 Please state how much fuel, electricity, heat, steam, and cooling in MWh your organization has purchased and consumed during the reporting year
Energy type MWh Fuel 81936651 Electricity 20255373 Heat 0 Steam 1242955 Cooling 0
CC11.3 Please complete the table by breaking down the total "Fuel" figure entered above by fuel type
Fuels MWh Other: Natural gas and refinery off-gas combined 81075632 Bituminous coal 356 Petroleum coke 368 Distillate fuel oil No 2 820827 Motor gasoline 27125 Jet kerosene 11992 Other: assorted biomass 352
CC11.4 Please provide details of the electricity, heat, steam or cooling amounts that were accounted at a low carbon emission factor in the Scope 2 figure reported in CC8.3
Basis for applying a low carbon emission factor MWh associated with low carbon electricity, heat, steam or cooling Comment
No purchases or generation of low carbon electricity, heat, steam or cooling accounted with a low carbon emissions factor

64
Further Information
Air Products does own a grid-connected solar electricity generating facility and transfers the SRECs generated periodically under contract terms and on the open market.
CC12. Emissions Performance
CC12.1 How do your gross global emissions (Scope 1 and 2 combined) for the reporting year compare to the previous year?
Increased
CC12.1a Please identify the reasons for any change in your gross global emissions (Scope 1 and 2 combined) and for each of them specify how your emissions compare to the previous year
Reason Emissions value (percentage)
Direction of change Comment
Emissions reduction activities
3.8 Decrease A significant carbon capture and utilization project, resulting in a reduction of nearly 800,000 tonnes of CO2, drove the significant reductions in this category. In addition, approximately 70 other discrete projects resulting in emission reduction were identified.
Divestment 0.3 Decrease This reflects the sale of a South American hydrogen plant in CY13.
Acquisitions 1.1 Increase Acquisition of the EPCO CO2 business assets and two Asia air separation facilities in CY13
Mergers 0 No change No material merger activity under the company’s financial control.
Change in output 5.6 Increase This reflects increased production activity across all business lines, particularly from the start-up of new air separation units in Asia.
Change in methodology
0.1 Increase This reflects changes in GWP factors to all AR4 100Year values and access to additional data and more accurate data sources.
Change in boundary 0 No change There were no changes in ownership designation of any joint ventures.
Change in physical operating conditions
0 No change There were no material changes in physical operating conditions.
Unidentified 0.6 Decrease Correction of historical reporting errors Other
CC12.2 Please describe your gross global combined Scope 1 and 2 emissions for the reporting year in metric tonnes CO2e per unit currency total revenue
Intensity figure
Metric numerator
Metric denominator
% change from previous year
Direction of change from previous year Reason for change
2541 metric tonnes CO2e
unit total revenue
1.2 Decrease Revenue increased approximately 3.2% versus an emissions increase of just 2%, resulting in a net decrease in emission intensity per dollar of revenue. The revenue generation of the CO2 capture project is an example where revenue increased while emissions decreased.

65
CC12.3 Please describe your gross global combined Scope 1 and 2 emissions for the reporting year in metric tonnes CO2e per full time equivalent (FTE) employee
Intensity figure
Metric numerator
Metric denominator
% change from previous year
Direction of change from previous year Reason for change
1196 metric tonnes CO2e
FTE employee 0.6 Increase Emissions intensity per employee increased as emissions increased 2% but employee count increased only 1.4%, reflecting increased labor productivity.
CC12.4 Please provide an additional intensity (normalized) metric that is appropriate to your business operations
Intensity figure
Metric numerator Metric denominator
% change from previous year
Direction of change from previous year Reason for change
0.877 metric tonnes CO2e
Other: Our intensity goal is configured as the ratio of reporting year (2013) emissions to reporting year production compared to the same emission to production ratio in our Base Yea (2007).
1.8 Increase The increase in the production related intensity from CY12 performance reflects the addition, through acquisition of some lower efficiency production units, particularly the addition of the EPCO CO2 business for which the product is not included in the production metrics originally configured for our GHG emission reduction goal methodology.
Further Information
Page: CC13. Emissions Trading
CC13.1 Do you participate in any emissions trading schemes?
Yes
CC13.1a Please complete the following table for each of the emission trading schemes in which you participate
Scheme name Period for which data is supplied
Allowances allocated
Allowances purchased
Verified emissions in metric tonnes CO2e
Details of ownership
European Union ETS Tue 01 Jan 2013 - Tue 31 Dec 2013
1197456 19289 1276066 Facilities we own and operate
Alberta Emissions Trading Regulation
Tue 01 Jan 2013 - Tue 31 Dec 2013
1076381 0 1082103 Facilities we own and operate
California’s Greenhouse Gas Cap and Trade Program
Tue 01 Jan 2013 - Tue 31 Dec 2013
1644321 Facilities we own and operate
CC13.1bWhat is your strategy for complying with the schemes in which you participate or anticipate participating?
Our current strategy regarding allowance trading under all emission trading schemes is to properly manage the compliance obligations of our facilities. Air Products pursues operating efficiency improvements wherever possible to minimize our compliance obligation. Where necessary, Air Products will purchase allowances/compliance instruments to satisfy it compliance obligations. If allowances allocated to the company exceed the current compliance obligations, allowances will be retained for future compliance needs. Air Products is not trading allowances speculatively.
CC13.2 Has your organization originated any project-based carbon credits or purchased any within the reporting period?
No

66
CC13.2a Please provide details on the project-based carbon credits originated or purchased by your organization in the reporting period
Credit origination or credit purchase
Project type
Project identification
Verified to which standard
Number of credits (metric tonnes of CO2e)
Number of credits (metric tonnes CO2e): Risk adjusted volume
Credits cancelled
Purpose, e.g. compliance
Further Information
Allowances allocated and/or purchased under the California Greenhouse Cap and Trade Program are considered confidential business information.
CC14. Scope 3 Emissions
CC14.1 Please account for your organization’s Scope 3 emissions, disclosing and explaining any exclusions
Sources of Scope 3 emissions
Evaluation status
metric tonnes CO2e Emissions calculation methodology
Percentage of emissions calculated using primary data
Explanation
Purchased goods and services
Relevant, calculated
690000 GHG emissions of purchased raw materials were calculated based on the quantity of material purchased and cradle-to-gate emissions factors for the individual materials. Over 80% of raw materials were quantified by weight using invoice-quality consumption data. Cradle-to-gate emissions factors for these materials were obtained from SimaPro (SP), a life cycle assessment tool that uses ecoinvent (EI) other databases. Emissions were subsequently scaled up to 100%. Data sources include: Cradle-to-gate LCI of nine plastic resins and two polyurethane precursors/2007; Life Cycle Inventories of Chemicals/2007/Althaus, H. J.;Life Cycle Inventories of Petrochemical Solvents/2007/Sutter, J.; and other sources incorporated by EI2.2 and USLCI datasets (as implemented in SP7.3.3); IPCC AR4 (2007) as implemented by TRACI 2 V3.03 impact assessment method in SP7.3.3. SimaPro is an LCA software that allows one to easily model and analyze complex life cycles in a systematic and transparent way, measure the environmental impact of products and services across life cycle stages and identify the hotspots in supply chains. SimaPro utilizes 10 databases, including ecoinvent v3 LCI database, the European reference Life Cycle Database (ELCD) and the Franklin US LCI 98 library, to name a few. The ecoinvent database is currently the most widely used Life Cycle Inventory database and contains over 10,000 interlinked datasets that cover all relevant environmental flows, such as resource extractions, land use and emissions, as well as all material and energy inputs and products of an activity at a process level. The Tool for the Reduction and Assessment of Chemical and other environmental Impacts (TRACI) is a stand-alone computer program developed by the U.S. Environmental Protection Agency specifically for the US using input parameters consistent with US locations. TRACI facilitates the characterization of environmental stressors that have potential effects.
100.00% Air Products applied the WRI GHG Scope 3 Standard for determining the percentage of emission calculated using primary data. Bases for calculations are described under emissions calculation methodology.
Capital goods Not relevant, calculated
170000 GHG emissions of capital goods were calculated for plants and pipelines commissioned in 2013. For HYCO plants, emissions were based on the quantity of steel and concrete required to build a typical HYCO plant. Cradle-to-gate emissions factors for steel and concrete were obtained from SimaPro (SP), a life cycle assessment tool that uses ecoinvent (EI) and other databases. Per plant emissions were multiplied by the number of plants commissioned in 2013 to determine the total emissions for HYCO plants. Per plant emissions for air separation units were obtained from SimaPro. These per plant emissions were multiplied by the number of plants commissioned in 2013. Likewise emissions per unit of pipe were multiplied by the total amount of pipe commissioned in 2013. Emissions from the plants and pipeline were subsequently summed. Data sources include: internal LCA study using EI2.2 datasets as implemented in SP7.3.3; Life Cycle Inventories of Chemicals/2007/Althaus, H. J.; and Erdgas 2007 incorporated by EI3.0 datasets as implemented in SP8.0; IPCC AR4 (2007) as implemented by ReCiPe Midpoint (H) V1.04 impact
0.00% Relevant Scope 3 emissions categories include those for which emissions exceed 275,000 metric tonnes CO2e, or 2% of our total Scope 3 emissions. Emissions for this Scope 3 category do not meet this threshold, therefore the emissions are deemed not relevant. Air Products applied the WRI GHG Scope 3 Standard for determining the percentage of

67
Sources of Scope 3 emissions
Evaluation status
metric tonnes CO2e Emissions calculation methodology
Percentage of emissions calculated using primary data
Explanation
assessment method in SP7.3.3; IPCC AR4 (2007) as implemented by TRACI 2.1 V1.01 impact assessment method in SP8.0. SimaPro is an LCA software that allows one to easily model and analyze complex life cycles in a systematic and transparent way, measure the environmental impact of products and services across life cycle stages and identify the hotspots in supply chains. SimaPro utilizes 10 databases, including ecoinvent v3 LCI database, the European reference Life Cycle Database (ELCD) and the Franklin US LCI 98 library, to name a few. The ecoinvent database is currently the most widely used Life Cycle Inventory database and contains over 10,000 interlinked datasets that cover all relevant environmental flows, such as resource extractions, land use and emissions, as well as all material and energy inputs and products of an activity at a process level. The Tool for the Reduction and Assessment of Chemical and other environmental Impacts (TRACI) is a stand-alone computer program developed by the U.S. Environmental Protection Agency specifically for the US using input parameters consistent with US locations. TRACI facilitates the characterization of environmental stressors that have potential effects.
emission calculated using primary data. Bases for calculations are described under emissions calculation methodology.
Fuel-and-energy-related activities (not included in Scope 1 or 2)
Relevant, calculated
7000000 The amounts of various fuels were determined from invoice-quality consumption data. The consumption quantities were grouped based on the region of consumption. Cradle-to-gate emissions factors for the production of each fuel type were obtained from SimaPro (SP), a life cycle assessment tool that uses ecoinvent (EI) and other databases for various regions. For each fuel type, the amount consumed was multiplied by the fuel’s cradle-to-gate emissions factor specific to the respective regions to calculate the individual emissions that were subsequently summed to the total emissions amount. For the electricity consumption, the fuel types and the amount of each were determined based on regional grid mixes, heat rates for respective fuel-type power plants and heating value of fuel types. Further, the amount of fuel types for electricity were adjusted to account for the transmission and distribution losses for the respective regions as per data from World Development Indicators. Scope 1 and Scope 2 emissions for the production of electricity that were lost were included in Scope 3 besides the emissions from production and distribution of fuels. The Scope 1 & 2 emission factors were found using IEA’s CO2, CH4, and N2O factors for international emissions. Data sources include: Energy Statistics and Balances of Non-OECD Countries and Energy Statistics of OECD Countries, and United Nations, Energy Statistics Yearbook; eGRID 9th Edition Version 1.0, February 2014 (International Energy Agency, as cited by EIA for 1605b); CN statistics 2005, IEA statistics 2008, Strommix und Stromnetz/2007/Frischknecht, R., and Life Cycle Inventories of electricity mixes/2012/Itten, R., used by EI3.0 datasets (as implemented in SP8.0); U.S. Energy Information Administration, Form EIA-923, ""Power Plant Operations Report,"" and predecessor form(s) including U.S. Energy; Table 8.1. Average Operating Heat Rate for Selected Energy Sources from EIA.gov; IPCC AR4 (2007) as implemented by ReCiPe Midpoint (H) V1.04 impact assessment method in SP7.3.3; IPCC AR4 (2007) as implemented by TRACI 2.1 V1.01 impact assessment method in SP8.0; IPCC AR4 (2007) as implemented by ReCiPe Midpoint (H) V1.09 impact assessment method in SP8.0.
100.00% Air Products applied the WRI GHG Scope 3 Standard for determining the percentage of emission calculated using primary data. Bases for calculations are described under emissions calculation methodology.
Upstream transportation and distribution
Relevant, calculated
320000 GHG emissions due to the transportation and distribution of purchased raw materials were calculated based on the quantity of material purchased and maximum estimated transportation distances. Diesel truck emissions factors from SimaPro (SP), a life cycle assessment tool that uses ecoinvent (EI) and other databases, were multiplied by the delivery distance and purchased raw material mass to estimate the emissions. Emissions for transportation and distribution of gaseous and liquid/bulk products were calculated based on global product transportation in 2013 and applying emissions factors from the US EPA GHG Emission Factors Hub based on available data. For sources with fuel consumption, diesel fuel CO2 emissions were applied on a per volume basis and CH4 and N2O emissions were applied on a per distance basis. For similar business areas in other regions that lacked fuel volume data, a factor was developed from our primary method and applied to these regions. For datasets without fuel consumption and no other comparable market, emissions were found on a per mile basis
20.00% Air Products applied the WRI GHG Scope 3 Standard for determining the percentage of emission calculated using primary data. Bases for calculations are described under emissions calculation methodology.
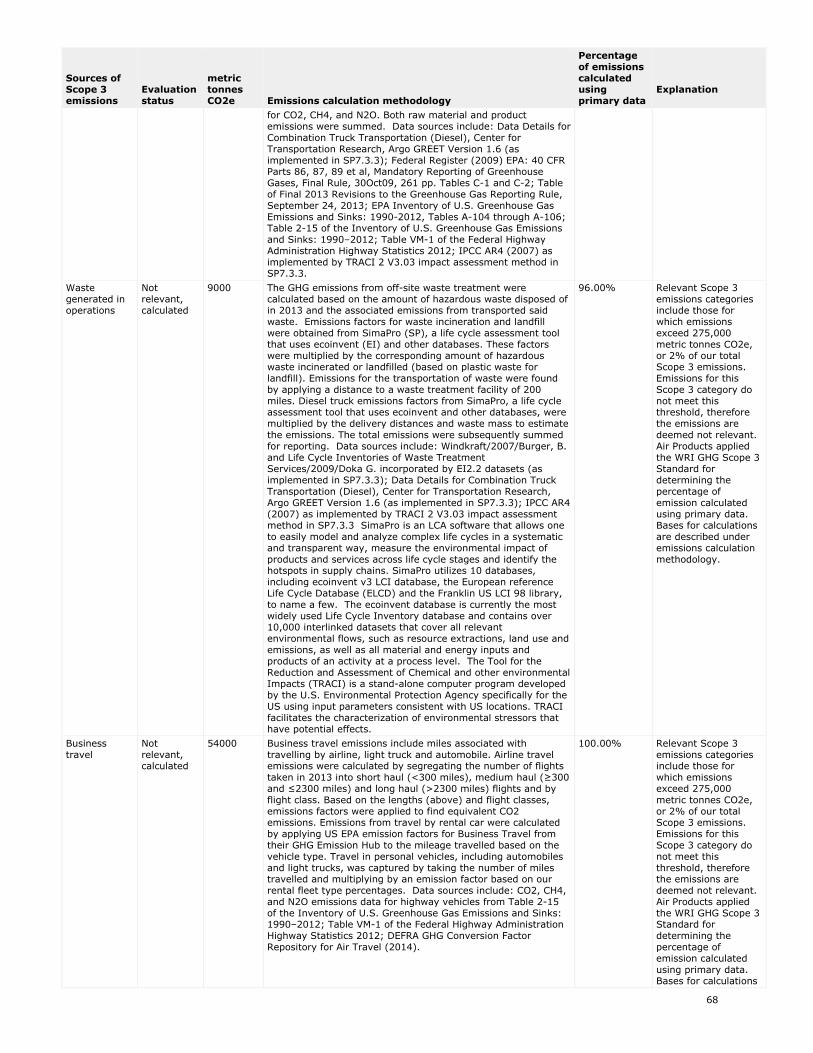
68
Sources of Scope 3 emissions
Evaluation status
metric tonnes CO2e Emissions calculation methodology
Percentage of emissions calculated using primary data
Explanation
for CO2, CH4, and N2O. Both raw material and product emissions were summed. Data sources include: Data Details for Combination Truck Transportation (Diesel), Center for Transportation Research, Argo GREET Version 1.6 (as implemented in SP7.3.3); Federal Register (2009) EPA: 40 CFR Parts 86, 87, 89 et al, Mandatory Reporting of Greenhouse Gases, Final Rule, 30Oct09, 261 pp. Tables C-1 and C-2; Table of Final 2013 Revisions to the Greenhouse Gas Reporting Rule, September 24, 2013; EPA Inventory of U.S. Greenhouse Gas Emissions and Sinks: 1990-2012, Tables A-104 through A-106; Table 2-15 of the Inventory of U.S. Greenhouse Gas Emissions and Sinks: 1990–2012; Table VM-1 of the Federal Highway Administration Highway Statistics 2012; IPCC AR4 (2007) as implemented by TRACI 2 V3.03 impact assessment method in SP7.3.3.
Waste generated in operations
Not relevant, calculated
9000 The GHG emissions from off-site waste treatment were calculated based on the amount of hazardous waste disposed of in 2013 and the associated emissions from transported said waste. Emissions factors for waste incineration and landfill were obtained from SimaPro (SP), a life cycle assessment tool that uses ecoinvent (EI) and other databases. These factors were multiplied by the corresponding amount of hazardous waste incinerated or landfilled (based on plastic waste for landfill). Emissions for the transportation of waste were found by applying a distance to a waste treatment facility of 200 miles. Diesel truck emissions factors from SimaPro, a life cycle assessment tool that uses ecoinvent and other databases, were multiplied by the delivery distances and waste mass to estimate the emissions. The total emissions were subsequently summed for reporting. Data sources include: Windkraft/2007/Burger, B. and Life Cycle Inventories of Waste Treatment Services/2009/Doka G. incorporated by EI2.2 datasets (as implemented in SP7.3.3); Data Details for Combination Truck Transportation (Diesel), Center for Transportation Research, Argo GREET Version 1.6 (as implemented in SP7.3.3); IPCC AR4 (2007) as implemented by TRACI 2 V3.03 impact assessment method in SP7.3.3 SimaPro is an LCA software that allows one to easily model and analyze complex life cycles in a systematic and transparent way, measure the environmental impact of products and services across life cycle stages and identify the hotspots in supply chains. SimaPro utilizes 10 databases, including ecoinvent v3 LCI database, the European reference Life Cycle Database (ELCD) and the Franklin US LCI 98 library, to name a few. The ecoinvent database is currently the most widely used Life Cycle Inventory database and contains over 10,000 interlinked datasets that cover all relevant environmental flows, such as resource extractions, land use and emissions, as well as all material and energy inputs and products of an activity at a process level. The Tool for the Reduction and Assessment of Chemical and other environmental Impacts (TRACI) is a stand-alone computer program developed by the U.S. Environmental Protection Agency specifically for the US using input parameters consistent with US locations. TRACI facilitates the characterization of environmental stressors that have potential effects.
96.00% Relevant Scope 3 emissions categories include those for which emissions exceed 275,000 metric tonnes CO2e, or 2% of our total Scope 3 emissions. Emissions for this Scope 3 category do not meet this threshold, therefore the emissions are deemed not relevant. Air Products applied the WRI GHG Scope 3 Standard for determining the percentage of emission calculated using primary data. Bases for calculations are described under emissions calculation methodology.
Business travel
Not relevant, calculated
54000 Business travel emissions include miles associated with travelling by airline, light truck and automobile. Airline travel emissions were calculated by segregating the number of flights taken in 2013 into short haul (<300 miles), medium haul (≥300 and ≤2300 miles) and long haul (>2300 miles) flights and by flight class. Based on the lengths (above) and flight classes, emissions factors were applied to find equivalent CO2 emissions. Emissions from travel by rental car were calculated by applying US EPA emission factors for Business Travel from their GHG Emission Hub to the mileage travelled based on the vehicle type. Travel in personal vehicles, including automobiles and light trucks, was captured by taking the number of miles travelled and multiplying by an emission factor based on our rental fleet type percentages. Data sources include: CO2, CH4, and N2O emissions data for highway vehicles from Table 2-15 of the Inventory of U.S. Greenhouse Gas Emissions and Sinks: 1990–2012; Table VM-1 of the Federal Highway Administration Highway Statistics 2012; DEFRA GHG Conversion Factor Repository for Air Travel (2014).
100.00% Relevant Scope 3 emissions categories include those for which emissions exceed 275,000 metric tonnes CO2e, or 2% of our total Scope 3 emissions. Emissions for this Scope 3 category do not meet this threshold, therefore the emissions are deemed not relevant. Air Products applied the WRI GHG Scope 3 Standard for determining the percentage of emission calculated using primary data. Bases for calculations

69
Sources of Scope 3 emissions
Evaluation status
metric tonnes CO2e Emissions calculation methodology
Percentage of emissions calculated using primary data
Explanation are described under emissions calculation methodology.
Employee commuting
Not relevant, calculated
62000 Employee commuting was estimated based on the location of employee residences and work places. Commuting distances for over 40% of employees were calculated by determining the straight-line distance between the zip code of the employee work site and the employee’s home and multiplying this distance by two to represent a daily round trip. An additional mileage factor of 20% was applied to adjust for roadways and turns. The total annual mileage travelled by these employees was multiplied by an average emissions factor for car transportation in SimaPro (SP), a life cycle assessment tool that uses the ecoinvent (EI) database. The calculated emissions were subsequently scaled to represent 100% of employees. Data sources include: Life Cycle Inventories of Transport Services/2007/Spielmann M. incorporated by EI2.2 ecoinvent database as implemented in SP7.3.3. SimaPro is an LCA software that allows one to easily model and analyze complex life cycles in a systematic and transparent way, measure the environmental impact of products and services across life cycle stages and identify the hotspots in supply chains. SimaPro utilizes 10 databases, including ecoinvent v3 LCI database, the European reference Life Cycle Database (ELCD) and the Franklin US LCI 98 library, to name a few. The ecoinvent database is currently the most widely used Life Cycle Inventory database and contains over 10,000 interlinked datasets that cover all relevant environmental flows, such as resource extractions, land use and emissions, as well as all material and energy inputs and products of an activity at a process level.
0.00% Relevant Scope 3 emissions categories include those for which emissions exceed 275,000 metric tonnes CO2e, or 2% of our total Scope 3 emissions. Emissions for this Scope 3 category do not meet this threshold, therefore the emissions are deemed not relevant. Air Products applied the WRI GHG Scope 3 Standard for determining the percentage of emission calculated using primary data. Bases for calculations are described under emissions calculation methodology.
Upstream leased assets
Not relevant, calculated
22000 Emissions from leased assets were calculated by multiplying the square footage of the leased asset, when available, by an electricity consumption factor per square foot of office space per the EPA Climate Leaders protocol and the appropriate local electricity factor. When the square footage was not available, an estimated square footage of leased offices was applied to the asset to find an estimated emission. Emissions for each leased space were calculated and subsequently summed to estimate the total emissions. Data sources include: Year 2010 eGRID Subregion Emission Factors (Source: eGRID 9th Edition Version 1.0, February 2014); CO2 Emissions from Fuel Combustion (2013 Edition), IEA, Paris; International Electricity Emission Factors by Country, 1999-2002.
0.00% Relevant Scope 3 emissions categories include those for which emissions exceed 275,000 metric tonnes CO2e, or 2% of our total Scope 3 emissions. Emissions for this Scope 3 category do not meet this threshold, therefore the emissions are deemed not relevant. Air Products applied the WRI GHG Scope 3 Standard for determining the percentage of emission calculated using primary data. Bases for calculations are described under emissions calculation methodology.
Downstream transportation and distribution
Not relevant, explanation provided
Air Products distributes its primary products directly to the consuming customers using our own transportation equipment or through contracted transportation services. Emissions from these activities are included in Scope 1 and Scope 3 Upstream Transportation and Distribution emissions, respectively. As such, any subsequent re-distribution of our products is negligible.

70
Sources of Scope 3 emissions
Evaluation status
metric tonnes CO2e Emissions calculation methodology
Percentage of emissions calculated using primary data
Explanation
Processing of sold products
Relevant, not yet calculated
Air Products manufactures a variety of gases and specialty materials that are used in 40 industries. Emissions from the processing of these products cannot be reliably estimated.
Use of sold products
Relevant, calculated
3800000 Most company products are gases or specialty chemical intermediates that are consumed in customer processes. Exceptions include certain fluorinated gas and nitrous oxide applications. Emissions were calculated for fluorinated gases based on customer use levels and emissions abatement efficiencies. The amount of gas emitted was subsequently multiplied by the appropriate emissions factor. Nitrous oxide used in medical applications was assumed to be fully exhaled by patients; therefore the total amount of nitrous oxide sold for medical applications was multiplied by its emissions factor to estimate total emissions. The emissions for these fluorinated gases and nitrous oxide were subsequently summed. These results were also validated using SimaPro (SP), a life cycle assessment tool that uses Ecoinvent (EI) and other databases. Emissions from our refrigerant buy/resell industry were also included. Data sources include: EU Regulation 842 - Public Consultation; IPCC AR4 (2007). SimaPro is an LCA software that allows one to easily model and analyze complex life cycles in a systematic and transparent way, measure the environmental impact of products and services across life cycle stages and identify the hotspots in supply chains. SimaPro utilizes 10 databases, including ecoinvent v3 LCI database, the European reference Life Cycle Database (ELCD) and the Franklin US LCI 98 library, to name a few. The ecoinvent database is currently the most widely used Life Cycle Inventory database and contains over 10,000 interlinked datasets that cover all relevant environmental flows, such as resource extractions, land use and emissions, as well as all material and energy inputs and products of an activity at a process level. The Tool for the Reduction and Assessment of Chemical and other environmental Impacts (TRACI) is a stand-alone computer program developed by the U.S. Environmental Protection Agency specifically for the US using input parameters consistent with US locations. TRACI facilitates the characterization of environmental stressors that have potential effects.
0.00% Air Products applied the WRI GHG Scope 3 Standard for determining the percentage of emission calculated using primary data. Bases for calculations are described under emissions calculation methodology.
End of life treatment of sold products
Not relevant, calculated
120000 Emissions from the disposal of products were calculated assuming that all specialty chemical products were disposed of at the end of their lives in the countries where they were sold and using the predominant waste treatment method in the country of sale. Specifically products sold in Europe were assumed to be incinerated while those sold in the rest of the world were assumed to be landfilled. Emissions from incinerated products were calculated based on the carbon content of the products which was estimated based on the products sold in 2013. Emissions from landfilled products were estimated using factors from SimaPro (SP), a life cycle assessment tool that uses ecoinvent (EI) and other databases. Finally the emissions from the end of life treatment options were summed into a final emission value. Data sources include: ELCD dataset (created by PE International for JRC-IES, Italy) as implemented in SP7.3.3 (incineration); molecular weight conversion of landfilled C to CO2 as implemented by TRACI 2 V3.03 impact assessment method in SP7.3.3. SimaPro is an LCA software that allows one to easily model and analyze complex life cycles in a systematic and transparent way, measure the environmental impact of products and services across life cycle stages and identify the hotspots in supply chains. SimaPro utilizes 10 databases, including ecoinvent v3 LCI database, the European reference Life Cycle Database (ELCD) and the Franklin US LCI 98 library, to name a few. The ecoinvent database is currently the most widely used Life Cycle Inventory database and contains over 10,000 interlinked datasets that cover all relevant environmental flows, such as resource extractions, land use and emissions, as well as all material and energy inputs and products of an activity at a process level. The Tool for the Reduction and Assessment of Chemical and other environmental Impacts (TRACI) is a stand-alone computer program developed by the U.S. Environmental Protection Agency specifically for the
0.00% Relevant Scope 3 emissions categories include those for which emissions exceed 275,000 metric tonnes CO2e, or 2% of our total Scope 3 emissions. Emissions for this Scope 3 category do not meet this threshold, therefore the emissions are deemed not relevant. Air Products applied the WRI GHG Scope 3 Standard for determining the percentage of emission calculated using primary data. Bases for calculations are described under emissions calculation methodology.

71
Sources of Scope 3 emissions
Evaluation status
metric tonnes CO2e Emissions calculation methodology
Percentage of emissions calculated using primary data
Explanation
US using input parameters consistent with US locations. TRACI facilitates the characterization of environmental stressors that have potential effects.
Downstream leased assets
Not relevant, explanation provided
Air Products does not have downstream leased assets.
Franchises Not relevant, explanation provided
Air Products does not have franchises.
Investments Relevant, calculated
1500000 Emissions were estimated for equity affiliates that are not under Air Products control. Emissions per revenue were calculated for Air Products facilities and these factors were applied to the incomes from the equity affiliates by business type. These emissions were subsequently summed to estimate the total emissions for equity affiliates. Data sources include: EPA Climate Leaders GHG Inventory Protocol – Stationary Combustion Sources Guidance – Tables A-1 and B3 (May 2008); 2013 Revisions to the Greenhouse Gas Reporting Rule and Final Confidentiality Determinations for New or Substantially Revised Data Elements - Table C-1 (November 2013); Year 2010 eGRID Subregion Emission Factors (Source: eGRID 9th Edition Version 1.0, February 2014); CO2 Emissions from Fuel Combustion (2013 Edition), IEA, Paris; International Electricity Emission Factors by Country, 1999-2002; IPCC AR4 (2007).
0.00% Air Products applied the WRI GHG Scope 3 Standard for determining the percentage of emission calculated using primary data. Bases for calculations are described under emissions calculation methodology.
Other (upstream)
Other (downstream)
CC14.2 Please indicate the verification/assurance status that applies to your reported Scope 3 emission
Third party verification or assurance complete
CC14.2a Please provide further details of the verification/assurance undertaken, and attach the relevant statements
Type of verification or assurance Attach the statement
Page/ Section reference
Relevant standard
Proportion of Scope 3 emissions verified (%)
Limited assurance
https://www.cdp.net/sites/2014/35/435/Investor CDP 2014/Shared Documents/Attachments/CC14.2a/Air Products CY2013 GHG Assurance Review Letter_05 27 14.pdf
3 ISO14064-3 52
CC14.3 Are you able to compare your Scope 3 emissions for the reporting year with those for the previous year for any sources?
Yes
CC14.3a Please identify the reasons for any change in your Scope 3 emissions and for each of them specify how your emissions compare to the previous year
Sources of Scope 3 emissions Reason for change
Emissions value (percentage)
Direction of change Comment
Purchased goods & services
Change in output 11 Decrease The reduction in emissions was due to decreased purchases of certain raw materials in 2013 compared to 2012.
Capital goods Change in boundary 395 Increase Capital goods used for pipelines that convey gaseous products were included in the 2013 Scope 3 estimate.
Fuel- and energy-related activities
Change in methodology 36 Increase Several enhancements were made to the estimate of fuel and energy related activities in

72
Sources of Scope 3 emissions Reason for change
Emissions value (percentage)
Direction of change Comment
(not included in Scopes 1 or 2)
2013, such as accounting for energy transmission and distribution losses and power plant heat rates, as well as applying regional emissions factors and grid mixes.
Upstream transportation & distribution
Change in boundary 159 Increase Air Products distributes its primary products directly to the consuming customers using our own transportation equipment or through contracted transportation services. In 2013 emissions from contracted transportation services was shifted to Scope 3 Upstream Transportation and Distribution emissions.
Waste generated in operations
Emissions reduction activities
18 Decrease Air Products generated less hazardous waste in 2013 due to efforts to eliminate, minimize and/or beneficially reuse waste. As a result, Scope 3 emissions from waste generated in operations declined.
Business travel Change in methodology 29 Increase Changes in business travel emissions were due to updates of emissions factors.
Employee commuting
Change in methodology 56 Increase Changes in employee commuting emissions were due to an updated assumption that employees did not carpool on a significant basis.
Upstream leased assets
Change in methodology 32 Decrease The change in methodology for the estimation of emissions from upstream leased assets including shifting from calculation based on energy consumption per asset to energy consumption per square feet.
Investments Change in methodology 12 Increase Emissions were estimated for equity affiliates that are not under Air Products control. In 2013, emissions were estimated based on revenue rather than on an income basis as had been used in 2012.
Downstream transportation and distribution
Change in boundary 100 Decrease Air Products distributes its primary products directly to the consuming customers using our own transportation equipment or through contracted transportation services. In 2013 emissions from contracted transportation services was shifted to Scope 3 Upstream Transportation and Distribution emissions.
Use of sold products
Acquisitions 75 Increase Use of sold products increased primarily due to the acquisition of a liquid CO2 business in 2013.
End-of-life treatment of sold products
Change in output 7 Increase The increase in estimated emissions was due to increased production of certain products in 2013 compared to 2012.
CC14.4 Do you engage with any of the elements of your value chain on GHG emissions and climate change strategies? (Tick all that apply)
Yes, our suppliers Yes, our customers Yes, other partners in the value chain
CC14.4a Please give details of methods of engagement, your strategy for prioritizing engagements and measures of success
Suppliers:
i. Methods of Engagement – Air Products has established supplier sustainability expectations that encourage suppliers to reduce greenhouse gas emissions. These expectations are communicated via the company’s website and discussed during supplier meetings. Likewise Air Products has surveyed its top suppliers to understand their programs and goals undertaken to reduce greenhouse gas emissions.
ii. Strategy for prioritizing and measures of success – Suppliers were prioritized based on percent of Air Products’ spend. The company’s top 300 suppliers represent 55% of Air Products annual spend. Based on the survey, nearly two-thirds of the responding top suppliers have programs and/or goals aimed at reducing

73
greenhouse gas emissions and improving energy conservation and efficiency. The company is engaging these suppliers in further dialogue about greenhouse gases and other environmental considerations to identify opportunities to improve sustainability for Air Products and its suppliers. We also have an Ideation and Market Intelligence program through which we actively engage with our suppliers to develop new concepts and approaches, including those which support more sustainable outcomes. This program covers the broad range of materials, goods and services which Air Products' purchases.
Customers:
i. Methods of Engagement – Air Products engages directly with customers through meetings, events and collaborative projects to help reduce their GHG emissions. Many of Air Products’ core technologies and products provide cost-effective solutions that enable customers to reduce their overall supply-chain environmental impact. Examples include:
• Oxygen for oxyfuel combustion that reduces fuel consumption and GHG emissions; for de-bottlenecking catalytic cracking units and sulfur recovery units; for facilitating CO2 capture and sequestration; for use in Integrated Gasification Combined Cycle power facilities; for use in waste gasification; and in biomass combustion/gasification for renewable power and biofuels.
• Hydrogen for use as an emission-free transportation fuel; in the production of biodiesel from renewable feedstocks; and to enable refiners to meet fuels emissions standards while increasing the amount of fuel that can be produced from oil. In addition, Air Products participates each year in the CDP Supply Chain questionnaire process. The company also responds directly to various customer requests for product and plant level CO2 data.
ii. Strategy for prioritizing and measures of success – Air Products has identified a series of offerings that can reduce customer GHG emissions directly or through energy efficiency improvements, as well as provide other sustainability-related benefits. These offerings can be used to prioritize customer outreach activities. Measures of success include the reduction of customer GHG emissions and fuel use. For example, oxy-fuel applications technology saves customers 1.6 million MT CO2e every year excluding O2 production, or 1 million MT/yr including O2 production. Likewise this technology enables cement manufacturers to use alternative fuels rather than coal – over the past several years Air Products has installed oxygen systems on cement kilns to enable increased alternative fuel substitution that has decreased fuel rates (coal and petcoke) by 10% to ~60% on these kilns (avg. reduction of 29%).
Other Value Chain Partners:
i. Methods of Engagement – Air Products has engaged directly with transportation firms to reduce the company’s fleet emissions. Engagement is typically through a series of meetings/discussions that review potential opportunities for improving fleet efficiency or using alternative fuels that enable reduced emissions. ii. Strategy for prioritizing and measures of success – Priority is given to regions in which Air Products has a large distribution fleet or mileage, and the measure of success is reduced CO2 emissions. Air Products is a member of the SmartWaySM program, a collaboration between the U.S. EPA and major companies and associations that helps freight shippers, carriers, and logistics companies improve fuel efficiency, reduce costs and lower emissions.
CC14.4b To give a sense of scale of this engagement, please give the number of suppliers with whom you are engaging and the proportion of your total spend that they represent
Number of suppliers
% of total spend Comment
300 55% Nearly two-thirds of Air Products’ top suppliers have programs and/or goals aimed at reducing greenhouse gas emissions and improving energy conservation and efficiency. The company plans to engage these suppliers in dialogue about greenhouse gases and other environmental considerations to identify opportunities to improve sustainability for Air Products and its suppliers.
74
CC14.4c If you have data on your suppliers’ GHG emissions and climate change strategies, please explain how you make use of that data
How you make use of the data Please give details Use in supplier scorecards Air Products includes sustainability as an element of supplier risk in its supplier scorecards.
This element specifically includes effective, documented company programs to manage emissions and energy consumption, as well as other sustainability issues.
CC14.4d Please explain why you do not engage with any elements of your value chain on GHG emissions and climate change strategies, and any plans you have to develop an engagement strategy in the future
Further Information
WSP Environment & Energy conducted a limited assurance review of Air Products’ 2013 Scope 1, Scope 2 and Scope 3 greenhouse gas inventory (selected elements). In addition, WSP completed a comprehensive review of our Scope 3 methodology, in accordance with which we updated our Scope 3 emissions estimates. Additional improvements are planned.
Module: Sign Off
CC15. Sign Off
CC15.1 Please provide the following information for the person that has signed off (approved) your CDP climate change response
Name Job title Corresponding job category Julie K. O'Brien Director, Corporate Sustainability Environment/Sustainability manager
tell me more For more information, please contact us at:
Air Products 7201 Hamilton Boulevard Allentown, PA 18195-1501 Tel 800-654-4567 Tel 610-706-4730 Fax 800-272-4449 Fax 610-706-6890
www.airproducts.com