cdp global 500 report 2011 accelerating low carbon … global 500 report 2011 accelerating low...
TRANSCRIPT
CDP Global 500 Report 2011Accelerating Low Carbon Growth
On behalf of 551 investors with assets of US$71 trillion
Report written for Carbon Disclosure Project by:
Carbon Disclosure [email protected]+44 (0) 20 7970 5660www.cdproject.net

2
ABRAPP - Associação Brasileira das Entidades Fechadas de Previdência ComplementarAEGON N.V.AKBANK T.A.S. Allianz Global Investors Kapitalanlagegesellschaft mbHATP GroupAviva InvestorsBank of America Merrill LynchBlackRockBP Investment Management LimitedCalifornia Public Employees’ Retirement SystemCalifornia State Teachers’ Retirement SystemCalvert Asset Management Company, Inc.
Catholic SuperCCLA Investment Management LtdEthos FoundationGeneration Investment ManagementHSBC Holdings plcINGKB Kookmin BankKLPLegg Mason, Inc.London Pensions Fund AuthorityMitsubishi UFJ Financial Group (MUFG)Morgan Stanley National Australia BankNEI InvestmentsNeuberger BermanNewton Investment Management LimitedNordea Investment Management
PFA PensionRaiffeisen SchweizRoyal Bank of Scotland GroupRobecoRockefeller & Co., Inc.SAM GroupSchroders Scottish Widows Investment PartnershipSEBSompo Japan Insurance Inc.Standard CharteredSun Life Financial Inc.TD Asset Management Inc. and TDAM USA Inc.The Wellcome TrustZurich Cantonal Bank
CDP works with investors globally to advance the investment opportunities and reduce the risks posed by climate change by asking almost 6,000 of the world’s largest companies to report on their climate strategies, GHG emissions and energy use in the standardized Investor CDP format. To learn more about CDP’s member offering and becoming a member, please contact us or visit the CDP Investor Member section at www.cdproject.net/investormembers
2011 Carbon Disclosure Project Investor Members

3
CDP Signatories
Carbon Disclosure Project 2011 551 financial institutions with assets of US$71 trillion were signatories to the CDP 2011 information request dated February 1st, 2011 Aberdeen Asset ManagersAberdeen Immobilien KAG mbHABRAPP - Associação Brasileira das Entidades Fechadas de Previdência ComplementarActive Earth Investment ManagementAcuity Investment ManagementAddenda Capital Inc.Advanced Investment PartnersAdvantage Asset Managers (Pty) LtdAEGON Magyarország Befektetési Alapkezelo Zrt.AEGON N.V.AEGON-INDUSTRIAL Fund Management Co., LtdAFP IntegraAIG Asset ManagementAk Asset Management AKBANK T.A.S.Alberta Investment Management Corporation (AIMCo)Alberta Teachers Retirement FundAlcyone FinanceAllianz Elementar Versicherungs-AGAllianz GroupAltira GroupAmalgamated BankAMP Capital InvestorsAmpegaGerling Investment GmbHAmundi AMANBIMA – Associação Brasileira das Entidades dos Mercados Financeiro e de CapitaisAntera Gestão de Recursos S.A.APG GroupAprionisAquila CapitalARIA (Australian Reward Investment Alliance)Arisaig Partners Asia Pte LtdARK Investment Advisors Inc.Arma Portföy Yönetimi A.S.ASB Community TrustASM Administradora de Recursos S.A.ASN BankAssicurazioni Generali SpaATP GroupAustralia and New Zealand Banking Group LimitedAustralian Central Credit Union incorporating Savings & Loans Credit UnionAustralian Ethical Investment LimitedAustralianSuperAvivaAviva InvestorsAXA GroupBaillie Gifford & Co.Bakers Investment Group (Australia) Pty LtdBanco Bradesco S/ABanco de Credito del Peru BCPBanco de Galicia y Buenos Aires S.A.Banco do Brasil S/ABanco Nacional de Desenvolvimento Econômico e Social - BNDESBanco SantanderBanesprev – Fundo Banespa de Seguridade SocialBanesto (Banco Español de Crédito S.A.)Bank of America Merrill LynchBank of MontrealBank Sarasin & Cie AGBank VontobelBankhaus Schelhammer & Schattera Kapitalanlagegesellschaft m.b.H.BANKINTER S.A.BankInvestBanque DegroofBarclays
Baumann and Partners S.A.BAWAG P.S.K. INVEST GmbHBayern LBBayernInvest Kapitalanlagegesellschaft mbHBBC Pension Trust LtdBBVABedfordshire Pension FundBentall KennedyBeutel Goodman and Co. LtdBioFinance Administração de Recursos de Terceiros LtdaBlackRockBlumenthal FoundationBNP Paribas Investment PartnersBNY MellonBNY Mellon Service Kapitalanlage GesellschaftBoston Common Asset Management, LLCBP Investment Management LimitedBrasilprev Seguros e Previdência S/A.British Columbia Investment Management Corporation (bcIMC)BT Investment ManagementBusan BankCAAT Pension PlanCadiz Holdings LimitedCaisse de dépôt et placement du QuébecCaisse des DépôtsCaixa Beneficente dos Empregados da Companhia Siderurgica Nacional - CBSCaixa de Previdência dos Funcionários do Banco do Nordeste do Brasil (CAPEF)Caixa Econômica FederalCaixa Geral de DepositosCaja de Ahorros de Valencia, Castellón y Valencia, BANCAJACaja NavarraCalifornia Public Employees’ Retirement SystemCalifornia State Teachers’ Retirement SystemCalifornia State TreasurerCalvert Asset Management Company, IncCanada Pension Plan Investment BoardCanadian Friends Service Committee (Quakers)Canadian Imperial Bank of Commerce (CIBC)CAPESESPCapital Innovations, LLCCARE Super Pty LtdCarlson Investment ManagementCarmignac GestionCatherine Donnelly FoundationCatholic SuperCbus Superannuation FundCCLA Investment Management LtdCeleste Funds Management LimitedCentral Finance Board of the Methodist ChurchCeresChristian SuperChristopher Reynolds FoundationChurch Commissioners for EnglandChurch of England Pensions BoardCI Mutual Funds’ Signature Global AdvisorsClean Yield Group, Inc.Cleantech Invest AGClearBridge AdvisorsClimate Change Capital Group LtdCM-CIC Asset ManagementColonial First State Global Asset ManagementComerica IncorporatedComite syndical national de retraite BâtirenteCommerzbank AGCommInsureCommonwealth Bank of AustraliaCompton Foundation, Inc.Concordia VersicherungsgruppeConnecticut Retirement Plans and Trust FundsCo-operative Financial Services (CFS)Corston-Smith Asset Management Sdn. Bhd.CRD AnalyticsCrédit AgricoleCredit SuisseGruppo Credito ValtellineseDaegu BankDaiwa Securities Group Inc.
de Pury Pictet Turrettini & Cie S.A.DekaBank Deutsche GirozentraleDeutsche Asset Management Investmentgesellschaft mbHDeutsche Bank AGDeutsche Postbank Vermögensmanagement S.A.Development Bank of Japan Inc.Development Bank of the Philippines (DBP)Dexia Asset ManagementDexus Property GroupDnB NOR ASADomini Social Investments LLCDongbu InsuranceDWS Investment GmbHEarth Capital Partners LLPEast Sussex Pension FundEcclesiastical Investment ManagementEcofi Investissements - Groupe Credit CooperatifEdward W. Hazen FoundationEEA Group LtdElan Capital PartnersElement Investment ManagersELETRA - Fundação Celg de Seguros e PrevidênciaEnvironment Agency Active Pension fundEpworth Investment ManagementEquilibrium Capital GroupErste Asset ManagementErste Group BankEssex Investment Management Company, LLCESSSuperEthos FoundationEureko B.V.Eurizon Capital SGREvangelical Lutheran Church in Canada Pension Plan for Clergy and Lay WorkersEvli Bank PlcF&C Management Ltd FAELCE – Fundacao Coelce de Seguridade SocialFAPERS- Fundação Assistencial e Previdenciária da Extensão Rural do Rio Grande do SulFASERN - Fundação COSERN de Previdência ComplementarFédéris Gestion d’ActifsFIDURA Capital Consult GmbHFIM Asset Management LtdFIPECq - Fundação de Previdência Complementar dos Empregados e Servidores da FINEP, do IPEA, do CNPqFIRA. - Banco de MexicoFirst Affirmative Financial Network, LLCFirst Swedish National Pension Fund (AP1)Firstrand LimitedFive Oceans Asset Management Pty LimitedFlorida State Board of Administration (SBA)FolketrygdfondetFolksamFondaction CSNFondation de LuxembourgFondiaria-SAIFonds de Réserve pour les Retraites – FRRFourth Swedish National Pension Fund (AP4)FRANKFURT-TRUST Investment-Gesellschaft mbHFukoku Capital Management IncFUNCEF - Fundação dos Economiários FederaisFundação AMPLA de Seguridade Social - BrasiletrosFundação Atlântico de Seguridade SocialFundação Attilio Francisco Xavier FontanaFundação Banrisul de Seguridade SocialFundação de Assistência e Previdência Social do BNDES - FAPESFUNDAÇÃO ELETROBRÁS DE SEGURIDADE SOCIAL - ELETROSFundação Forluminas de Seguridade Social - FORLUZFUNDAÇÃO ITAUBANCOFundação Itaúsa IndustrialFundação Promon de Previdência SocialFundação Vale do Rio Doce de Seguridade Social - VALIAFundação Rede Ferroviaria de Seguridade Social – ReferFundação Sistel de Seguridade Social (Sistel)FUNDIÁGUA - FUNDAÇÃO DE PREVIDENCIA COMPLEMENTAR DA CAESBFuturegrowth Asset ManagementGartmore Investment Management LtdGEAP Fundação de Seguridade SocialGenerali Deutschland Holding AG
´´
2011 Carbon Disclosure Project Investor Signatories
4
Carbon Disclosure Project 2011 – Global 500 Report
Generation Investment ManagementGenus Capital ManagementGjensidige Forsikring ASAGLS Gemeinschaftsbank eGGoldman Sachs Group Inc.GOOD GROWTH INSTITUT für globale Vermögensentwicklung mbHGovernance for OwnersGovernment Employees Pension Fund (“GEPF”), Republic of South AfricaGreen Cay Asset ManagementGreen Century Capital ManagementGroupe Crédit CoopératifGroupe Investissement Responsable Inc.GROUPE OFI AMGrupo Banco PopularGrupo Santander BrasilGruppo Credito ValtellineseGruppo MontepaschiGuardian Ethical Management IncGuardians of New Zealand SuperannuationGuosen Securities Co., LTD.Hang Seng BankHarbourmaster CapitalHarrington Investments, IncHauck & Aufhäuser Asset Management GmbHHazel Capital LLPHDFC Bank LtdHealth Super FundHealthcare of Ontario Pension Plan (HOOPP)Henderson Global InvestorsHermes Fund ManagersHESTA SuperHSBC Global Asset Management (Deutschland) GmbHHSBC Holdings plcHSBC INKA Internationale Kapitalanlagegesellschaft mbHHyundai Marine & Fire Insurance. Co., Ltd.Hyundai Securities Co., Ltd.Ibgeana Society of Assistance and Security SIAS / Sociedade Ibgeana de Assistência e Seguridade (SIAS)IDBI Bank LtdIlmarinen Mutual Pension Insurance CompanyImpax Group plcIndusInd Bank LimitedIndustrial Bank (A)Industrial Bank of KoreaIndustry Funds ManagementInfrastructure Development Finance CompanyINGInsight Investment Management (Global) LtdInstituto de Seguridade Social dos Correios e Telégrafos- PostalisInstituto Infraero de Seguridade Social - INFRAPREVInstituto Sebrae De Seguridade Social - SEBRAEPREVInsurance Australia GroupInvestec Asset ManagementIrish Life Investment ManagersItau Asset ManagementItaú Unibanco Holding S AJanus Capital Group Inc.Jarislowsky Fraser LimitedJPMorgan Chase & Co.Jubitz Family FoundationJupiter Asset ManagementKaiser Ritter Partner (Schweiz) AGKB asset ManagementKB Kookmin BankKBC Asset Management NVKDB Asset Management Co., Ltd.KEPLER-FONDS Kapitalanlagegesellschaft m. b. H.KfW BankengruppeKlimaINVESTKLPKorea Investment Management Co., Ltd.The Korea Teachers Pension (KTP)Korea Technology Finance Corporation (KOTEC)KPA PensionLa Banque Postale Asset ManagementLa Financiere ResponsableLampe Asset Management GmbHLandsorganisationen i Sverige
LBBW - Landesbank Baden-WürttembergLBBW Asset Management Investmentgesellschaft mbHLD Lønmodtagernes DyrtidsfondLegal & General Investment ManagementLegg Mason, Inc.LGT Capital Management Ltd.LIG Insurance Co., LtdLight Green Advisors, LLCLiving Planet Fund Management Company S.A.Local Authority Pension Fund ForumLocal Government SuperLocal SuperLombard Odier Darier Hentsch & CieLondon Pensions Fund AuthorityLothian Pension FundLupus alpha Asset Management GmbHMacif GestionMacquarie Group LimitedMAMA Sustainable Incubation AGManMaple-Brown Abbott LimitedMarc J. Lane Investment Management, Inc.Maryland State TreasurerMatrix Asset ManagementMcLean BuddenMEAG MUNICH ERGO Asset Management GmbHMeeschaert Gestion PrivéeMeiji Yasuda Life Insurance CompanyMendesprev Sociedade PrevidenciáriaMerck Family FundMeritas Mutual FundsMetallRente GmbHMetrus – Instituto de Seguridade SocialMetzler Investment GmbhMFS Investment ManagementMidas International Asset ManagementMiller/Howard InvestmentsMirae Asset Global Investments Co. Ltd.Mirae Asset Securities Co., Ltd.Missionary Oblates of Mary ImmaculateMistra, Foundation for Strategic Environmental ResearchMitsubishi UFJ Financial Group (MUFG)Mizuho Financial Group, Inc.Mn ServicesMonega Kapitalanlagegesellschaft mbHMorgan StanleyMotor Trades Association of Australia Superannuation Fund Pty LtdMutual Insurance Company Pension-FenniaNatcan Investment ManagementNathan Cummings Foundation, TheNational Australia BankNational Bank of CanadaNational Grid Electricity Group of the Electricity Supply Pension SchemeNational Grid UK Pension SchemeNational Pensions Reserve Fund of IrelandNational Union of Public and General Employees (NUPGE)NATIXISNedbank LimitedNeedmor FundNEI InvestmentsNelson Capital Management, LLCNest SammelstiftungNeuberger BermanNew Amsterdam Partners LLCNew Mexico State TreasurerNew York City Employees Retirement SystemNew York City Teachers Retirement SystemNew York State Common Retirement Fund (NYSCRF)New Zealand Earthquake CommissionNewton Investment Management LimitedNGS SuperNH-CA Asset ManagementNikko Asset Management Co., Ltd.Nikko Cordial SecuritiesNissay Asset Management CorporationNORD/LB Kapitalanlagegesellschaft AGNordea Investment ManagementNorfolk Pension Fund
Norges Bank Investment Management (NBIM)North Carolina Retirement SystemNorthern Ireland Local Government Officers’ Superannuation Committee (NILGOSC)Northern TrustNykreditOddo & CieOECO Capital Lebensversicherung AGOld Mutual plcOMERS Administration CorporationOntario Teachers’ Pension PlanOP Fund Management Company LtdOppenheim Fonds Trust GmbHOpplysningsvesenets fond (The Norwegian Church Endowment)OPSEU Pension TrustOregon State TreasurerOrion Asset Management LLCParnassus InvestmentsPax World FundsPensioenfonds VervoerPension DenmarkPension Fund for Danish Lawyers and EconomistsPension Protection FundPensionsmyndighetenPETROS - The Fundação Petrobras de Seguridade SocialPFA PensionPGGMPhillips, Hager & North Investment Management Ltd.PhiTrust Active InvestorsPhoenix Asset Management Inc.Pictet Asset Management SAPKAPluris Sustainable Investments SAPNC Financial Services Group, Inc.Pohjola Asset Management LtdPortfolio 21 InvestmentsPorto Seguro S.A.PREVHAB PREVIDÊNCIA COMPLEMENTARPREVI Caixa de Previdência dos Funcionários do Banco do BrasilPREVIG Sociedade de Previdência ComplementarProvinzial Rheinland HoldingPrudential Investment ManagementPsagot Investment House LtdPSP InvestmentsPSS - Seguridade SocialQ Capital Partners Co. LtdQBE Insurance GroupRabobankRaiffeisen SchweizRailpen InvestmentsRathbones / Rathbone Greenbank InvestmentsReal Grandeza Fundação de Previdência e Assistência SocialRei SuperReliance Capital LtdResolutionResona Bank, LimitedReynders McVeigh Capital ManagementRLAMRobecoRockefeller Financial Rose Foundation for Communities and the EnvironmentRoyal Bank of CanadaRoyal Bank of Scotland GroupRREEF Investment GmbHSAM GroupSAMPENSION KP LIVSFORSIKRING A/SSAMSUNG FIRE & MARINE INSURANCESamsung SecuritiesSanlamSanta Fé Portfolios LtdaSAS Trustee CorporationSauren Finanzdienstleistungen GmbH & Co. KGSchrodersScotiabankScottish Widows Investment PartnershipSEBSEB Asset Management AGSecond Swedish National Pension Fund (AP2)SEIU Master Trust

5
CDP SignatoriesCDP Signatories
Seligson & Co Fund Management PlcSentinel InvestmentsSERPROS - Fundo MultipatrocinadoSeventh Swedish National Pension Fund (AP7)Shinhan BankShinhan BNP Paribas Investment Trust Management Co., LtdShinkin Asset Management Co., LtdSiemens Kapitalanlagegesellschaft mbHSignet Capital Management LtdSMBC Friend Securities Co., LTDSmith Pierce, LLCSNS Asset ManagementSocial(k)Sociedade de Previdencia Complementar da Dataprev - PrevdataSolaris Investment Management LimitedSompo Japan Insurance Inc.Sopher Investment ManagementSPF Beheer bvSprucegrove Investment Management LtdStandard CharteredStandard Chartered Korea LimitedStandard Life InvestmentsState Bank of IndiaState Street CorporationStatewideSuperStoreBrand ASAStrathclyde Pension FundStratus GroupSumitomo Mitsui Banking CorporationSumitomo Mitsui Card Company, LimitedSumitomo Mitsui Finance & Leasing Co., LtdSumitomo Mitsui Financial GroupThe Sumitomo Trust & Banking Co., Ltd.Sun Life Financial Inc.Superfund Asset Management GmbHSUSI Partners AGSustainable CapitalSvenska Kyrkan, Church of SwedenSwedbank ABSwiss ReSwisscanto Holding AGSyntrus Achmea Asset ManagementT. Rowe PriceT. SINAI KALKINMA BANKASI A.S.T.GARANTI BANKASI A.S.Tata Capital Limited TD Asset Management Inc. and TDAM USA Inc.Teachers Insurance and Annuity Association – College Retirement Equities Fund (TIAA-CREF)Telluride AssociationTempis Asset Management Co. LtdTerra Forvaltning ASTerraVerde Capital Management LLCThe Brainerd FoundationThe Bullitt FoundationThe Central Church Fund of FinlandThe Collins FoundationThe Co-operative Asset ManagementThe Co-operators Group LtdThe Daly FoundationThe GPT GroupThe Hartford Financial Services Group, Inc.The Japan Research Institute, LimitedThe Joseph Rowntree Charitable TrustThe Local Government Pensions InstitutionThe Pension Plan For Employees of the Public Service Alliance of CanadaThe Pinch GroupThe Presbyterian Church in CanadaThe Russell Family FoundationThe Shiga Bank, Ltd.The Standard Bank GroupThe United Church of Canada - General CouncilThe University of Edinburgh Endowment FundThe Wellcome TrustThird Swedish National Pension Fund (AP3)Threadneedle Asset ManagementTokio Marine & Nichido Fire Insurance Co., Ltd.Toronto Atmospheric Fund
Trillium Asset Management CorporationTriodos Investment ManagementTrygUBSUniCredit GroupUnion Asset Management Holding AGUnipensionUNISON staff pension schemeUniSuperUnitarian Universalist AssociationUnited Methodist Church General Board of Pension and Health BenefitsUnited Nations FoundationUniversities Superannuation Scheme (USS)Vancity Group of CompaniesVCH Vermögensverwaltung AGVeris Wealth PartnersVeritas Investment Trust GmbHVermont State TreasurerVexiom Capital, L.P.VicSuper Pty LtdVictorian Funds Management CorporationVietNam Holding Ltd.Vision SuperVOLKSBANK INVESTMENTSWaikato Community Trust IncWalden Asset Management, a division of Boston Trust & Investment Management CompanyWARBURG - HENDERSON Kapitalanlagegesellschaft für Immobilien mbHWARBURG INVEST KAPITALANLAGEGESELLSCHAFT MBHWells Fargo & CompanyWest Yorkshire Pension FundWestLB Mellon Asset Management (WMAM)Westpac Banking CorporationWhite Owl Capital AGWinslow Management, A Brown Advisory Investment GroupWoori BankWoori Investment & Securities Co., Ltd.YES BANK LimitedYork University Pension FundYouville Provident Fund Inc.Zegora Investment ManagementZevin Asset ManagementZurich Cantonal Bank
Figure 1: 2011 Signatory Investor Breakdown
Asset ManagersAsset OwnersBanksInsuranceOther
1% 37%
5%23%
34%
Figure 2: CDP Investor Signatories & Assets over time
600
500
400
300
200
100
0
80
70
60
50
40
30
20
10
0
Num
ber
of S
igna
torie
s
Ass
ets
(US
$ tr
illio
ns)
Signatories Assets
2003 2004 2005 2006 2007 2008 2009 2010 2011
Carbon Disclosure Project 2011 – Global 500 Report
6
For HSBC, climate change is a cornerstone of our ongoing business strategy, and so it gives me great pleasure to introduce the 2011 Carbon Disclosure Report. The reporting framework that the CDP has pioneered over the past decade has helped us both as respondent and signatory to improve our understanding of the strategic risks and opportunities in this area.
In the past year, we have sought to support financially as well as through advocacy the huge business potential of low carbon growth. Our own research suggests that the low carbon energy market alone will triple in size by 2020 to US$2.2 trillion. We expect the fastest growth will take place in emerging economies. To take one example: China plans to expand the share of seven strategic industries – all with a low carbon dimension – from 3 to 15% of GDP by 2020. This is perhaps the clearest statement yet of the economic growth that could flow from a determined focus on resource efficiency, technological innovation and long-term investment.
For us, “climate business” starts with our clients, and financing lies at the heart of the solution. The technologies and business models needed to deliver clean energy, cut emissions and drive down inefficient resource use can often involve higher upfront capital costs, which are then more than repaid through much lower operating costs. Project finance and equity markets have long been involved in supplying capital to the climate economy. But the full range of capital market instruments will need to be deployed, including fixed income and bonds. To enable HSBC to address this opportunity at a strategic level, a Climate Business Council has been established, which is chaired by Stuart Gulliver, Group Chief Executive, and includes the heads of all our business lines. The Council has already uncovered new ways of enabling our clients to pursue profitable growth in this arena.
But climate change is also serving to intensify the commodity constraints facing the global economy. Food yields have already been hit by warming global temperatures. And the scale and intensity of extreme weather events over the past 12 months have reminded us of the vulnerability of economies and societies to natural hazards. The scientific evidence has
also become ever clearer that climate change is increasing the probabilities of these extremes. As the world’s leading emerging markets bank, we are particularly alert to the vulnerability of Asia and Latin America to climate impacts, and our Group Risk, Operations and Sustainability teams are routinely investigating this as yet another stress that the bank needs to weather.
In an uncertain period with pressing concerns about the fate of the global economy, it would be easy - but foolish - to regard climate change as a luxury issue only to be addressed in the good times. Around the world, we are seeing encouraging signs that climate responsive business could drive an investment-led recovery. Governments are responding with new instruments to leverage private capital, such as the UK’s Green Investment Bank, which will start operations in 2012. It is at moments such as these that businesses with a long-term perspective can help shape the contours of the coming revival and thereby accelerate clean and profitable growth.
Commentary for the Carbon Disclosure Project: Douglas Flint, Group Chairman, HSBC Holdings plc
7
CEO Foreword Corporations, investors and governments today are faced with a choice: to compete aggressively for finite resources, or to advance towards a low carbon economy that enables sustainable, profitable growth, whilst reducing reliance on increasingly scarce materials.
Last year, global energy-related carbon dioxide emissions reached a record high. The International Energy Agency’s estimates made for bleak reading but compounded the necessity to take bold and decisive action if we are to have any chance of limiting temperature increase to the 2°C level agreed by world leaders to protect against catastrophic climate change.
What’s more, rising energy demands are competing for a limited supply of fossil fuels. The competition for increasingly scarce natural resources is putting pressure on commodity prices and having a growing impact both socially and economically. It is clear that today, more than ever, we must build momentum to decouple economic growth from emissions.
Managing carbon emissions and protecting the business from climate change impacts is fundamental to achieving sustainable and strong shareholder returns. Earlier this year, the investment consultancy Mercer released a report concluding that the best way for institutional investors to manage portfolio risk associated with climate change may be to shift 40% of their portfolios into climate-sensitive assets with an emphasis on those that can adapt to a low carbon environment.
An important part of an investor’s strategy should be to engage with the companies in which they invest to encourage performance improvement. Carbon Action is a new initiative launched by CDP this year. It is driven by a leading group of investors to encourage their portfolio companies to reduce emissions by investing in emissions reduction activities with a satisfactory payback period. Carbon Action reflects a growing recognition that there is a huge range of carbon reduction activities that companies can undertake that have a very clear business case. It is therefore in the interests of all investors, and not just the more active owners of investments, to ensure these actions are taken.
As the management of carbon continues to move into companies’ core business strategies and mainstream investment thinking, demand for primary corporate climate change information grows around the world. As well as working on behalf of 551 institutional investors to gather relevant information from large corporations around the world, CDP is also working with global businesses and governments to strengthen the resilience and sustainability of their supply chains through the CDP Supply Chain program. CDP Cities has launched to help the world’s major cities reduce climate change risk and bolster economic growth, whilst CDP Water Disclosure is now in its second year of working with major global companies to improve water management. A key part of CDP’s strategy is to ensure the effective use of data collected. To assist with this companies are able to obtain tools that help them to measure, report and manage carbon more effectively, through CDP Reporter Services.
It is through partnerships that CDP can achieve the largest impact. We are delighted to be working again this year with PwC, our Global Advisor, as well as with Accenture, Microsoft, SAP and Bloomberg. These and our other partners around the world are integral to the acceleration of CDP’s mission.
Whilst we wait patiently for much needed global regulation, business must continue to forge ahead, innovate and seek out opportunities by doing more with less. The decisions that perpetuate a legitimate, low carbon and high growth economy will bring considerable value to those that have the foresight to make them. The information contained in this report and the companies’ responses assist in illuminating that path.
Paul SimpsonCEOCarbon Disclosure Project
CEO Foreword
Carbon Disclosure Project 2011 – Global 500 Report
8
Contents 2011 Carbon Disclosure Project Members 02
2011 Carbon Disclosure Project Signatories 03
Commentary for the Carbon Disclosure Project: Douglas Flint, Group Chairman, HSBC Holdings plc 06
Foreword: Paul Simpson, CEO, Carbon Disclosure Project 07
Executive Summary 09
2011 Key Themes and Highlights 13
PwC Commentary: Alan McGill, Partner, PwC 20
2011 Leaders 21
The 2011 Carbon Disclosure Leadership Index 22
The 2011 Carbon Performance Leadership Index 29
Sector Analysis 35
Consumer Discretionary 36
Consumer Staples 38
Energy 40
Financials 42
Health Care 44
Industrials 46
Information Technology 48
Materials 50
Telecommunications 52
Utilities 54
Appendix I: Table of Emissions 56
Appendix II: Global Key Trends 74
Appendix III: Global 500 Companies by Country 76
9
Accelerating Low Carbon Growth
Low carbon growth is now widely accepted as fundamental to generating long term shareholder value, avoiding dangerous climate change and helping the global economy recover from recent turmoil1. It is for these reasons that in 2011, the Carbon Disclosure Project (CDP) sent its annual request to the Global 5002 companies on behalf of 551 investors with US$71 trillion of assets, asking them to measure and report what climate change means for their business. This year, 81% (404) of corporations from the Global 500 responded to the CDP questionnaire.
These responses provide a valuable insight into how companies are preparing for a resource constrained world and show a shift in company strategy to prepare better for a low carbon economy and act on the business opportunities. The report3 looks at how companies that are strategically focused on accelerating low carbon growth – i.e. those in the Carbon Performance Leadership Index (CPLI) – tend to perform better, not only in terms of greenhouse gas emissions management, but also in terms of financial performance.
Key findings
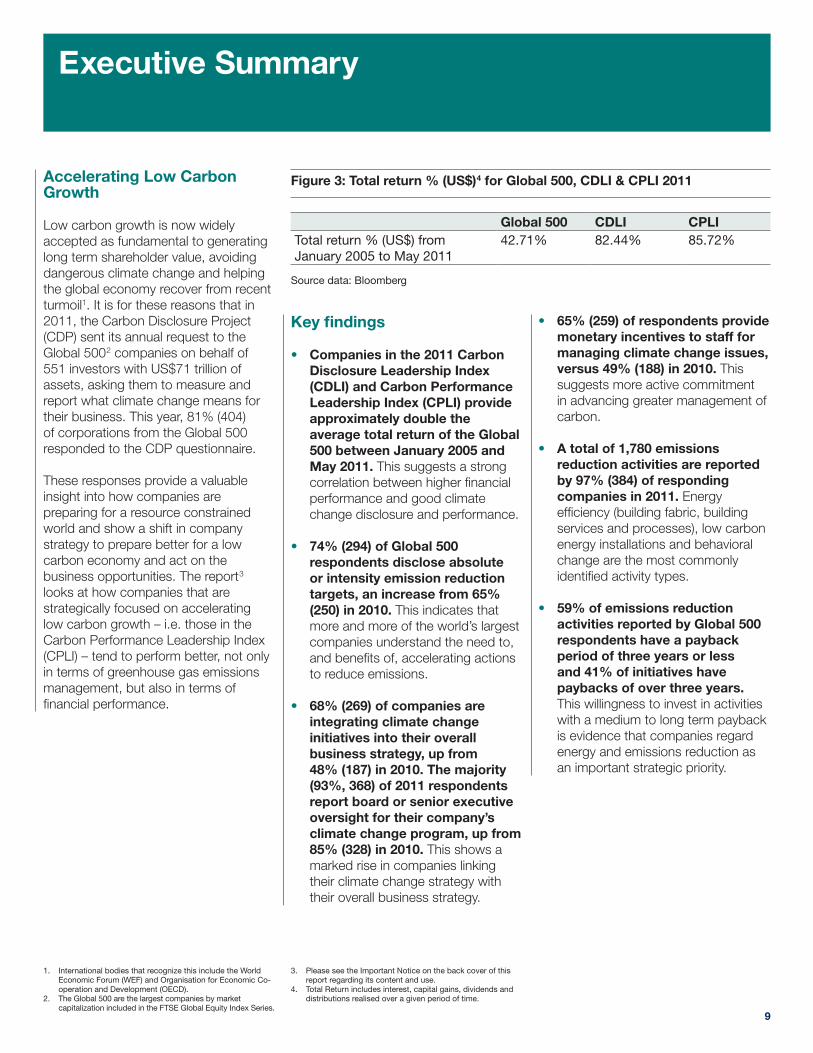
• Companies in the 2011 Carbon Disclosure Leadership Index (CDLI) and Carbon Performance Leadership Index (CPLI) provide approximately double the average total return of the Global 500 between January 2005 and May 2011. This suggests a strong correlation between higher financial performance and good climate change disclosure and performance.
• 74% (294) of Global 500 respondents disclose absolute or intensity emission reduction targets, an increase from 65% (250) in 2010. This indicates that more and more of the world’s largest companies understand the need to, and benefits of, accelerating actions to reduce emissions.
• 68% (269) of companies are integrating climate change initiatives into their overall business strategy, up from 48% (187) in 2010. The majority (93%, 368) of 2011 respondents report board or senior executive oversight for their company’s climate change program, up from 85% (328) in 2010. This shows a marked rise in companies linking their climate change strategy with their overall business strategy.
• 65% (259) of respondents provide monetary incentives to staff for managing climate change issues, versus 49% (188) in 2010. This suggests more active commitment in advancing greater management of carbon.
• A total of 1,780 emissions reduction activities are reported by 97% (384) of responding companies in 2011. Energy efficiency (building fabric, building services and processes), low carbon energy installations and behavioral change are the most commonly identified activity types.
• 59% of emissions reduction activities reported by Global 500 respondents have a payback period of three years or less and 41% of initiatives have paybacks of over three years. This willingness to invest in activities with a medium to long term payback is evidence that companies regard energy and emissions reduction as an important strategic priority.
Executive Summary
Global 500 CDLI CPLITotal return % (US$) from January 2005 to May 2011
42.71% 82.44% 85.72%
Figure 3: Total return % (US$)4 for Global 500, CDLI & CPLI 2011
Source data: Bloomberg
1. International bodies that recognize this include the World Economic Forum (WEF) and Organisation for Economic Co-operation and Development (OECD).
2. The Global 500 are the largest companies by market capitalization included in the FTSE Global Equity Index Series.
3. Please see the Important Notice on the back cover of this report regarding its content and use.
4. Total Return includes interest, capital gains, dividends and distributions realised over a given period of time.
Carbon Disclosure Project 2011 – Global 500 Report
10
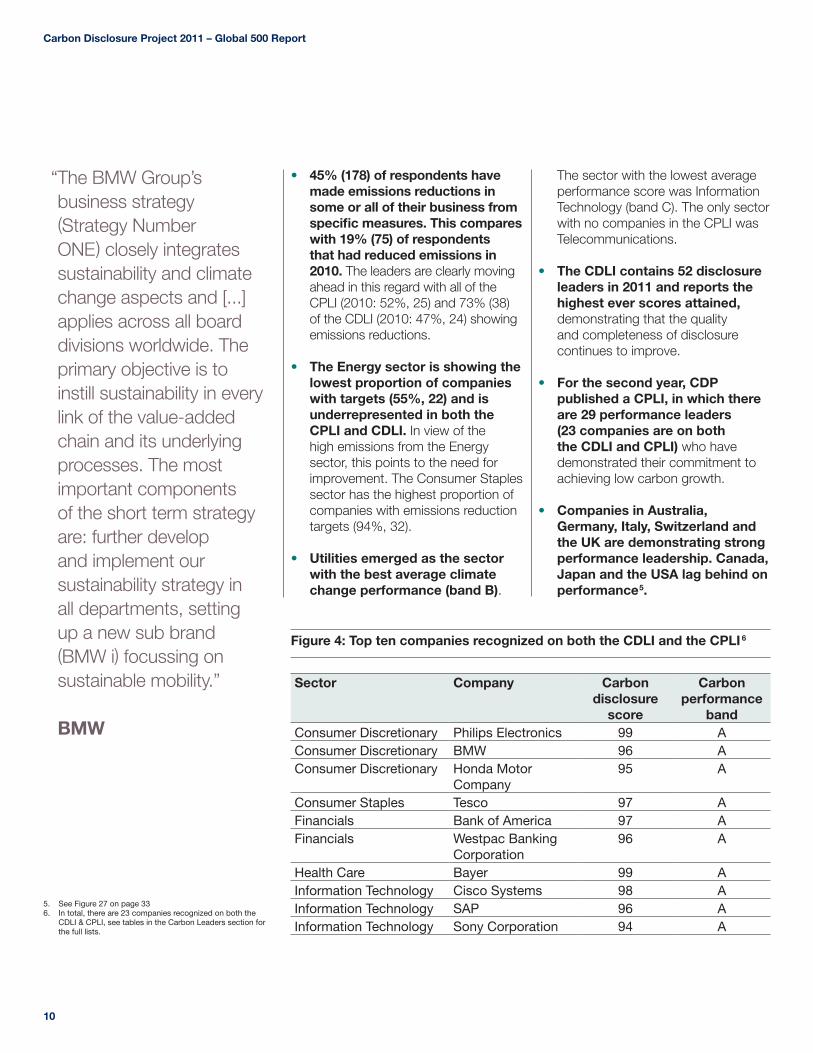
• 45% (178) of respondents have made emissions reductions in some or all of their business from specific measures. This compares with 19% (75) of respondents that had reduced emissions in 2010. The leaders are clearly moving ahead in this regard with all of the CPLI (2010: 52%, 25) and 73% (38) of the CDLI (2010: 47%, 24) showing emissions reductions.
• The Energy sector is showing the lowest proportion of companies with targets (55%, 22) and is underrepresented in both the CPLI and CDLI. In view of the high emissions from the Energy sector, this points to the need for improvement. The Consumer Staples sector has the highest proportion of companies with emissions reduction targets (94%, 32).
• Utilities emerged as the sector with the best average climate change performance (band B).
The sector with the lowest average performance score was Information Technology (band C). The only sector with no companies in the CPLI was Telecommunications.
• The CDLI contains 52 disclosure leaders in 2011 and reports the highest ever scores attained, demonstrating that the quality and completeness of disclosure continues to improve.
• For the second year, CDP published a CPLI, in which there are 29 performance leaders (23 companies are on both the CDLI and CPLI) who have demonstrated their commitment to achieving low carbon growth.
• Companies in Australia, Germany, Italy, Switzerland and the UK are demonstrating strong performance leadership. Canada, Japan and the USA lag behind on performance5.
“ The BMW Group’s business strategy (Strategy Number ONE) closely integrates sustainability and climate change aspects and [...] applies across all board divisions worldwide. The primary objective is to instill sustainability in every link of the value-added chain and its underlying processes. The most important components of the short term strategy are: further develop and implement our sustainability strategy in all departments, setting up a new sub brand (BMW i) focussing on sustainable mobility.” BMW
Sector Company Carbon disclosure
score
Carbon performance
bandConsumer Discretionary Philips Electronics 99 AConsumer Discretionary BMW 96 AConsumer Discretionary Honda Motor
Company95 A
Consumer Staples Tesco 97 AFinancials Bank of America 97 AFinancials Westpac Banking
Corporation96 A
Health Care Bayer 99 AInformation Technology Cisco Systems 98 AInformation Technology SAP 96 AInformation Technology Sony Corporation 94 A
Figure 4: Top ten companies recognized on both the CDLI and the CPLI 6
5. See Figure 27 on page 336. In total, there are 23 companies recognized on both the
CDLI & CPLI, see tables in the Carbon Leaders section for the full lists.
11
Executive Summary
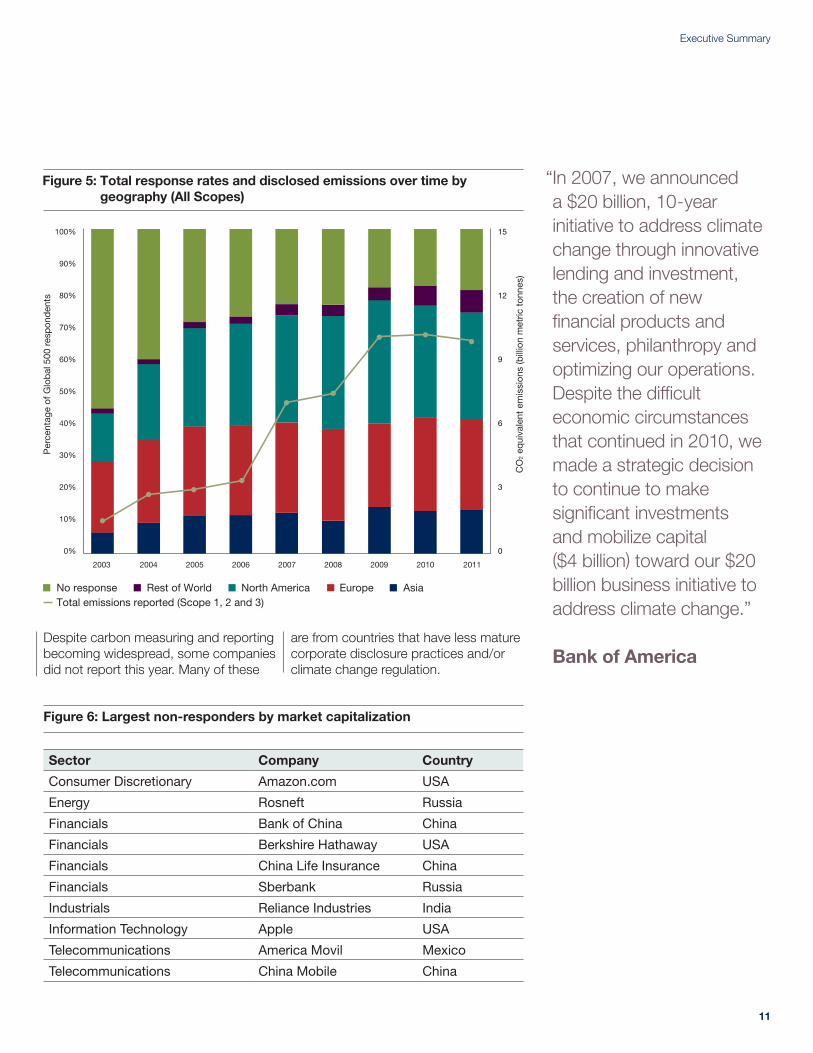
Sector Company Country
Consumer Discretionary Amazon.com USA
Energy Rosneft Russia
Financials Bank of China China
Financials Berkshire Hathaway USA
Financials China Life Insurance China
Financials Sberbank Russia
Industrials Reliance Industries India
Information Technology Apple USA
Telecommunications America Movil Mexico
Telecommunications China Mobile China
Figure 5: Total response rates and disclosed emissions over time by geography (All Scopes)
100%
90%
80%
70%
60%
50%
40%
30%
20%
10%
0%
15
12
9
6
3
0
Per
cent
age
of G
lob
al 5
00 r
esp
ond
ents
CO
2 eq
uiva
lent
em
issi
ons
(bill
ion
met
ric t
onne
s)
2003 2004 2005 2006 2007 2008 2009 2010 2011
Asset Managers Asset Owners
No response Rest of World North America Europe AsiaTotal emissions reported (Scope 1, 2 and 3)
Figure 6: Largest non-responders by market capitalization
Despite carbon measuring and reporting becoming widespread, some companies did not report this year. Many of these
are from countries that have less mature corporate disclosure practices and/or climate change regulation.
“ In 2007, we announced a $20 billion, 10-year initiative to address climate change through innovative lending and investment, the creation of new financial products and services, philanthropy and optimizing our operations. Despite the difficult economic circumstances that continued in 2010, we made a strategic decision to continue to make significant investments and mobilize capital ($4 billion) toward our $20 billion business initiative to address climate change.” Bank of America
Carbon Disclosure Project 2011 – Global 500 Report
12
317328
214
207248
349308
324311
338
206
250257
346275
383
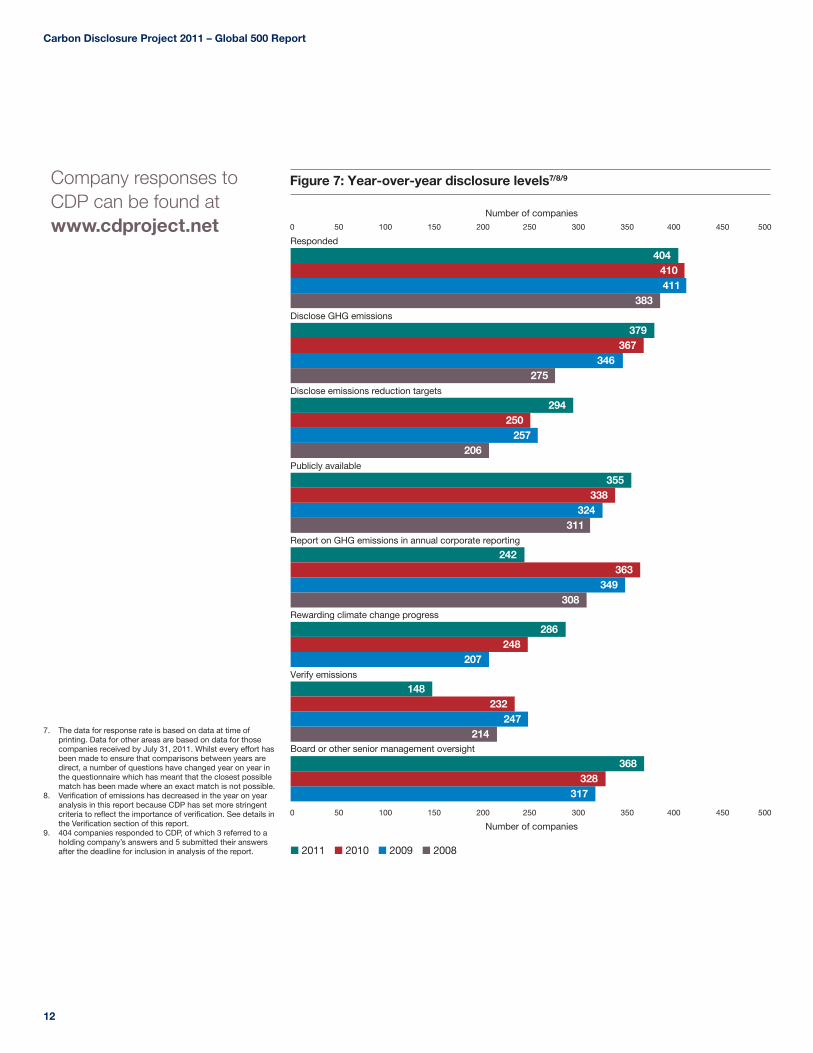
Figure 7: Year-over-year disclosure levels7/8/9
0 50 100 150 200 250 300 350 400 450 500
Number of companies
0 50 100 150 200 250 300 350 400 450 500
Number of companies 500
404410411
379367
294
355
242363
286
148232
247
368
■ 2011 ■ 2010 ■ 2009 ■ 2008
Responded
Disclose GHG emissions
Disclose emissions reduction targets
Publicly available
Report on GHG emissions in annual corporate reporting
Rewarding climate change progress
Verify emissions
Board or other senior management oversight
Company responses to CDP can be found at www.cdproject.net
7. The data for response rate is based on data at time of printing. Data for other areas are based on data for those companies received by July 31, 2011. Whilst every effort has been made to ensure that comparisons between years are direct, a number of questions have changed year on year in the questionnaire which has meant that the closest possible match has been made where an exact match is not possible.
8. Verification of emissions has decreased in the year on year analysis in this report because CDP has set more stringent criteria to reflect the importance of verification. See details in the Verification section of this report.
9. 404 companies responded to CDP, of which 3 referred to a holding company’s answers and 5 submitted their answers after the deadline for inclusion in analysis of the report.
Finding strategic advantage through climate change action
13
2011 Key Themes and Highlights
Accelerating Low Carbon Growth
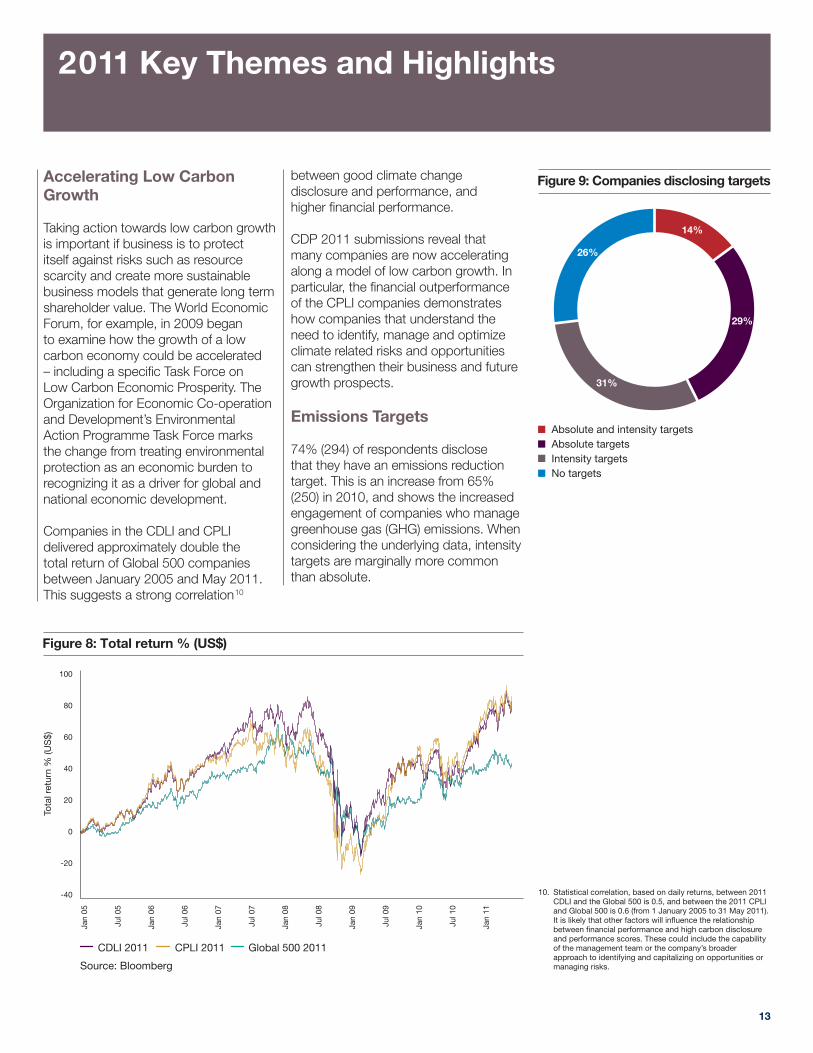
Taking action towards low carbon growth is important if business is to protect itself against risks such as resource scarcity and create more sustainable business models that generate long term shareholder value. The World Economic Forum, for example, in 2009 began to examine how the growth of a low carbon economy could be accelerated – including a specific Task Force on Low Carbon Economic Prosperity. The Organization for Economic Co-operation and Development’s Environmental Action Programme Task Force marks the change from treating environmental protection as an economic burden to recognizing it as a driver for global and national economic development.
Companies in the CDLI and CPLI delivered approximately double the total return of Global 500 companies between January 2005 and May 2011. This suggests a strong correlation10
between good climate change disclosure and performance, and higher financial performance.
CDP 2011 submissions reveal that many companies are now accelerating along a model of low carbon growth. In particular, the financial outperformance of the CPLI companies demonstrates how companies that understand the need to identify, manage and optimize climate related risks and opportunities can strengthen their business and future growth prospects.
Emissions Targets
74% (294) of respondents disclose that they have an emissions reduction target. This is an increase from 65% (250) in 2010, and shows the increased engagement of companies who manage greenhouse gas (GHG) emissions. When considering the underlying data, intensity targets are marginally more common than absolute.
Figure 8: Total return % (US$)
100
80
60
40
20
0
-20
-40
120
100
80
60
40
20
0
-20
-40
CDLI 2011 CPLI 2011 Global 500 2011
Jan
05
Jul 0
5
Jan
06
Jul 0
6
Jan
07
Jul 0
7
Jan
08
Jul 0
8
Jan
09
Jul 0
9
Jan
10
Jul 1
0
Jan
11
Source: Bloomberg
Tota
l ret
urn
% (U
S$)
Figure 9: Companies disclosing targets
29%
31%
26%
6%
3%
14%
Absolute and intensity targetsAbsolute targetsIntensity targetsNo targets
10. Statistical correlation, based on daily returns, between 2011 CDLI and the Global 500 is 0.5, and between the 2011 CPLI and Global 500 is 0.6 (from 1 January 2005 to 31 May 2011). It is likely that other factors will influence the relationship between financial performance and high carbon disclosure and performance scores. These could include the capability of the management team or the company’s broader approach to identifying and capitalizing on opportunities or managing risks.

Carbon Disclosure Project 2011 – Global 500 Report
14
The target setting practice of companies varies significantly across sectors. The sector with the highest proportion of responding companies with targets is Consumer Staples at 94% (34). Energy has the lowest proportion of responding companies with targets at 55% (22), which, in view of the high emissions from this sector points to a need for significant improvement.
A large majority of companies with absolute or intensity reduction targets are on track to achieve or are outperforming their targets. The average emissions reduction already attained by the Global 500 against their targets is 60%, which has taken on average 57% of their allotted ‘target time’. Overall, companies are currently outperforming 71% (338) of their
emissions reduction targets. The recent economic downturn has had an impact on companies’ emissions and should also be considered alongside progress in meeting targets and in relation to reduced emissions disclosure.
Figure 10: Companies with targets by sector
0
5
10
15
20
25
30
35
40
45 100%
90%
80%
70%
60%
50%
40%
30%
20%
10%
0%
% o
f sec
tor
Num
ber
of c
omp
anie
s
■ Absolute and intensity targets ■ Absolute targets ■ Intensity targets ■ No targets Percentage of sector with any target
ConsumerDiscretionary
Health Care InformationTechnology
Materials Telecoms UtilitiesConsumerStaples
Energy Financials Industrials
7
10
16
9
79%
5
9
18
2
94%
4
8
10
18
55%
5
41
19
26
71%
7
11
8
5
84%
910
15
8
81%
7
109 9
74%
4
9
16
9
76%
4
67
4
81%
6
4
8
2
90%
15
2011 Key Themes and Highlights
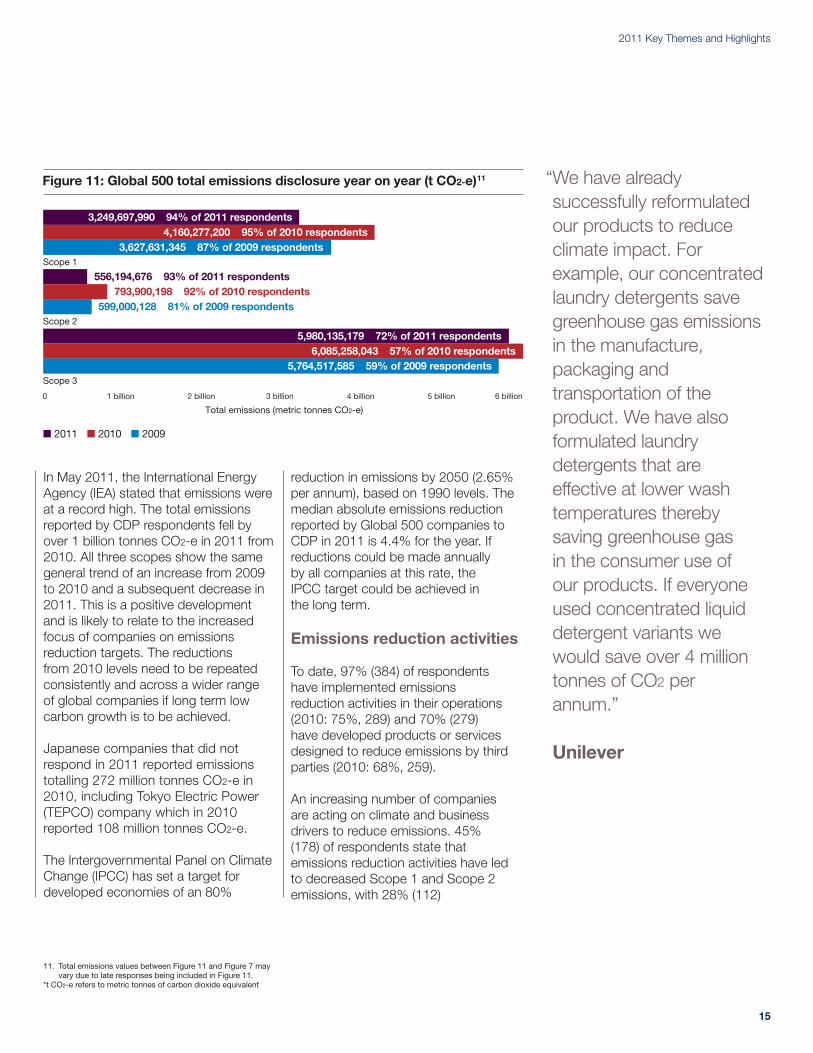
In May 2011, the International Energy Agency (IEA) stated that emissions were at a record high. The total emissions reported by CDP respondents fell by over 1 billion tonnes CO2-e in 2011 from 2010. All three scopes show the same general trend of an increase from 2009 to 2010 and a subsequent decrease in 2011. This is a positive development and is likely to relate to the increased focus of companies on emissions reduction targets. The reductions from 2010 levels need to be repeated consistently and across a wider range of global companies if long term low carbon growth is to be achieved.
Japanese companies that did not respond in 2011 reported emissions totalling 272 million tonnes CO2-e in 2010, including Tokyo Electric Power (TEPCO) company which in 2010 reported 108 million tonnes CO2-e.
The Intergovernmental Panel on Climate Change (IPCC) has set a target for developed economies of an 80%
reduction in emissions by 2050 (2.65% per annum), based on 1990 levels. The median absolute emissions reduction reported by Global 500 companies to CDP in 2011 is 4.4% for the year. If reductions could be made annually by all companies at this rate, the IPCC target could be achieved in the long term.
Emissions reduction activities
To date, 97% (384) of respondents have implemented emissions reduction activities in their operations (2010: 75%, 289) and 70% (279) have developed products or services designed to reduce emissions by third parties (2010: 68%, 259).
An increasing number of companies are acting on climate and business drivers to reduce emissions. 45% (178) of respondents state that emissions reduction activities have led to decreased Scope 1 and Scope 2 emissions, with 28% (112)
“ We have already successfully reformulated our products to reduce climate impact. For example, our concentrated laundry detergents save greenhouse gas emissions in the manufacture, packaging and transportation of the product. We have also formulated laundry detergents that are effective at lower wash temperatures thereby saving greenhouse gas in the consumer use of our products. If everyone used concentrated liquid detergent variants we would save over 4 million tonnes of CO2 per annum.” Unilever
Figure 11: Global 500 total emissions disclosure year on year (t CO2-e)11
0 1 billion 2 billion 3 billion 4 billion 5 billion 6 billion
Total emissions (metric tonnes CO2-e)
Scope 1
3,249,697,990 94% of 2011 respondents4,160,277,200 95% of 2010 respondents
3,627,631,345 87% of 2009 respondents
Scope 2
556,194,676 93% of 2011 respondents793,900,198 92% of 2010 respondents
599,000,128 81% of 2009 respondents
Scope 3
5,980,135,179 72% of 2011 respondents6,085,258,043 57% of 2010 respondents
5,764,517,585 59% of 2009 respondents
■ 2011 ■ 2010 ■ 2009
11. Total emissions values between Figure 11 and Figure 7 may vary due to late responses being included in Figure 11.
*t CO2-e refers to metric tonnes of carbon dioxide equivalent
Carbon Disclosure Project 2011 – Global 500 Report
16
of respondents confirming that this reduction was of at least 2.65%. This is an increase since 2010 when only 19% (75) of companies with reduced Scope 1 and 2 emissions attributed them to emissions reduction activities. This may result from the application of experience and knowledge, with earlier less-effective emissions reduction activities being replaced by more cost-effective activities that have a greater impact. The CDLI and CPLI companies have engaged in emissions reduction activities to a much greater degree than the other Global 500 companies, with a marked increase from 2010. 73% (38) of the CDLI and 100% (29) of the CPLI companies in 2011 report that they have active projects in the reporting year compared to only 45% (24) of the CDLI and 52% (25) of the CPLI in 2010.
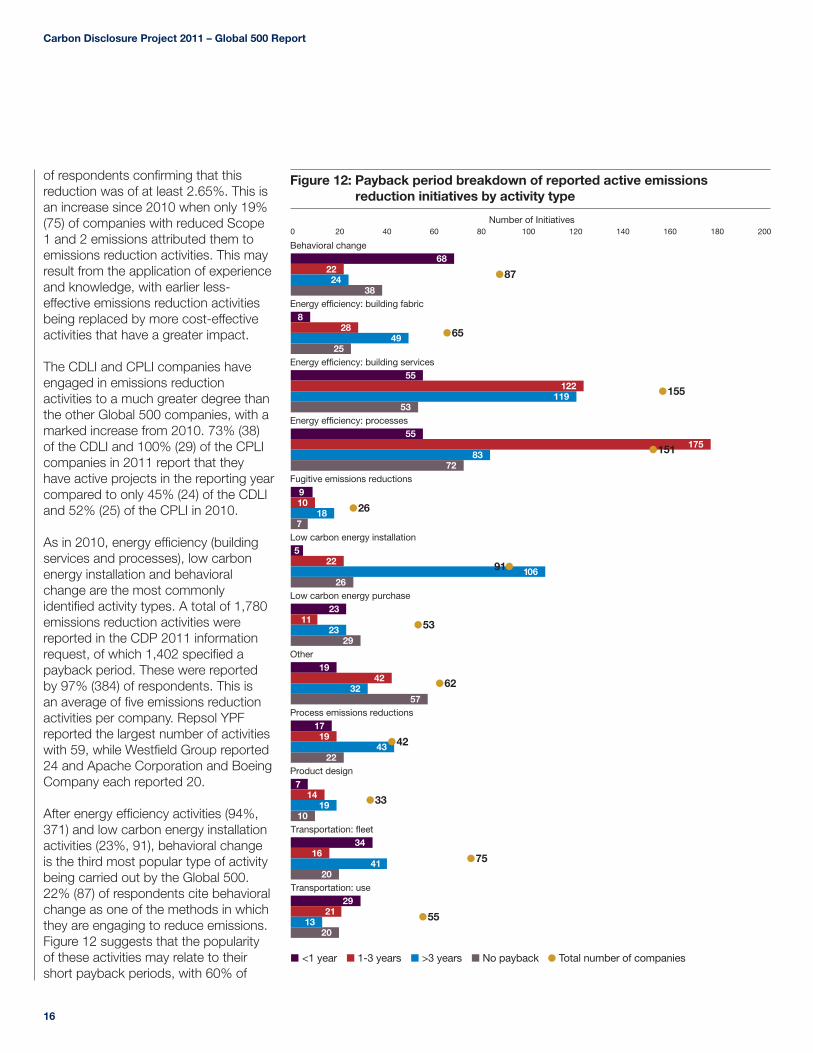
As in 2010, energy efficiency (building services and processes), low carbon energy installation and behavioral change are the most commonly identified activity types. A total of 1,780 emissions reduction activities were reported in the CDP 2011 information request, of which 1,402 specified a payback period. These were reported by 97% (384) of respondents. This is an average of five emissions reduction activities per company. Repsol YPF reported the largest number of activities with 59, while Westfield Group reported 24 and Apache Corporation and Boeing Company each reported 20.
After energy efficiency activities (94%, 371) and low carbon energy installation activities (23%, 91), behavioral change is the third most popular type of activity being carried out by the Global 500. 22% (87) of respondents cite behavioral change as one of the methods in which they are engaging to reduce emissions. Figure 12 suggests that the popularity of these activities may relate to their short payback periods, with 60% of
Figure 12: Payback period breakdown of reported active emissions reduction initiatives by activity type
0 20 40 60 80 100 120 140 160 180 200 Number of Initiatives
682224
38
828
4925
55122
11953
17583
72
910
187
522
10626
29
22
2311
23
1942
32
1719
43
10
714
19
20
3416
41
20
2921
13
■ <1 year ■ 1-3 years ■ >3 years ■ No payback Total number of companies
57
55
87
65
155
151
26
53
62
42
33
75
55
91
Behavioral change
Energy efficiency: building fabric
Energy efficiency: building services
Energy efficiency: processes
Fugitive emissions reductions
Low carbon energy installation
Low carbon energy purchase
Process emissions reductions
Product design
Transportation: fleet
Transportation: use
Other
17
2011 Key Themes and Highlights
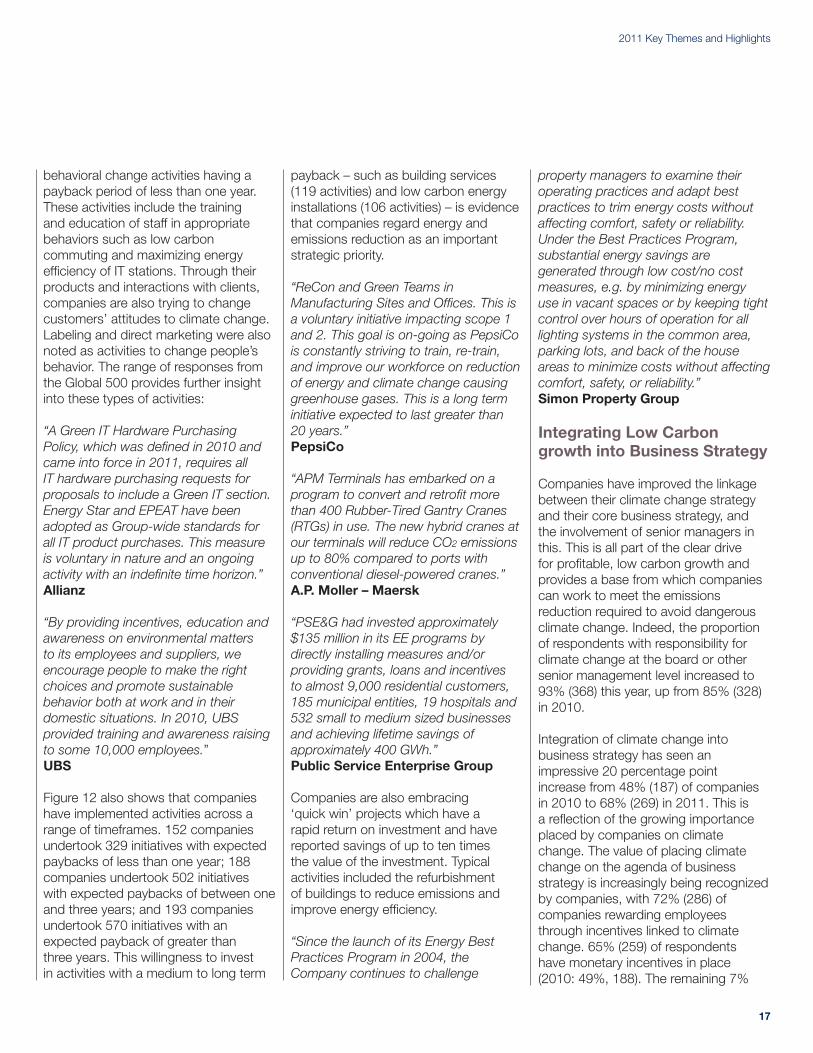
behavioral change activities having a payback period of less than one year. These activities include the training and education of staff in appropriate behaviors such as low carbon commuting and maximizing energy efficiency of IT stations. Through their products and interactions with clients, companies are also trying to change customers’ attitudes to climate change. Labeling and direct marketing were also noted as activities to change people’s behavior. The range of responses from the Global 500 provides further insight into these types of activities:
“A Green IT Hardware Purchasing Policy, which was defined in 2010 and came into force in 2011, requires all IT hardware purchasing requests for proposals to include a Green IT section. Energy Star and EPEAT have been adopted as Group-wide standards for all IT product purchases. This measure is voluntary in nature and an ongoing activity with an indefinite time horizon.” Allianz
“By providing incentives, education and awareness on environmental matters to its employees and suppliers, we encourage people to make the right choices and promote sustainable behavior both at work and in their domestic situations. In 2010, UBS provided training and awareness raising to some 10,000 employees.”UBS
Figure 12 also shows that companies have implemented activities across a range of timeframes. 152 companies undertook 329 initiatives with expected paybacks of less than one year; 188 companies undertook 502 initiatives with expected paybacks of between one and three years; and 193 companies undertook 570 initiatives with an expected payback of greater than three years. This willingness to invest in activities with a medium to long term
payback – such as building services (119 activities) and low carbon energy installations (106 activities) – is evidence that companies regard energy and emissions reduction as an important strategic priority.
“ReCon and Green Teams in Manufacturing Sites and Offices. This is a voluntary initiative impacting scope 1 and 2. This goal is on-going as PepsiCo is constantly striving to train, re-train, and improve our workforce on reduction of energy and climate change causing greenhouse gases. This is a long term initiative expected to last greater than 20 years.”PepsiCo
“APM Terminals has embarked on a program to convert and retrofit more than 400 Rubber-Tired Gantry Cranes (RTGs) in use. The new hybrid cranes at our terminals will reduce CO2 emissions up to 80% compared to ports with conventional diesel-powered cranes.” A.P. Moller – Maersk
“PSE&G had invested approximately $135 million in its EE programs by directly installing measures and/or providing grants, loans and incentives to almost 9,000 residential customers, 185 municipal entities, 19 hospitals and 532 small to medium sized businesses and achieving lifetime savings of approximately 400 GWh.”Public Service Enterprise Group
Companies are also embracing ‘quick win’ projects which have a rapid return on investment and have reported savings of up to ten times the value of the investment. Typical activities included the refurbishment of buildings to reduce emissions and improve energy efficiency.
“Since the launch of its Energy Best Practices Program in 2004, the Company continues to challenge
property managers to examine their operating practices and adapt best practices to trim energy costs without affecting comfort, safety or reliability. Under the Best Practices Program, substantial energy savings are generated through low cost/no cost measures, e.g. by minimizing energy use in vacant spaces or by keeping tight control over hours of operation for all lighting systems in the common area, parking lots, and back of the house areas to minimize costs without affecting comfort, safety, or reliability.”Simon Property Group
Integrating Low Carbon growth into Business Strategy
Companies have improved the linkage between their climate change strategy and their core business strategy, and the involvement of senior managers in this. This is all part of the clear drive for profitable, low carbon growth and provides a base from which companies can work to meet the emissions reduction required to avoid dangerous climate change. Indeed, the proportion of respondents with responsibility for climate change at the board or other senior management level increased to 93% (368) this year, up from 85% (328) in 2010.
Integration of climate change into business strategy has seen an impressive 20 percentage point increase from 48% (187) of companies in 2010 to 68% (269) in 2011. This is a reflection of the growing importance placed by companies on climate change. The value of placing climate change on the agenda of business strategy is increasingly being recognized by companies, with 72% (286) of companies rewarding employees through incentives linked to climate change. 65% (259) of respondents have monetary incentives in place (2010: 49%, 188). The remaining 7%
Carbon Disclosure Project 2011 – Global 500 Report
18
(27) of respondents have disclosed that they have a mixture of recognition and other non-monetary incentives. A distinguishing mark of all 29 CPLI companies is that they have one or more climate change related monetary incentives for staff.
“Our Chairman’s Award recognises individual and team excellence in climate change as well as other corporate responsibility areas such as safety, customer service, and community engagement. The Awards are open to all employees.”National Grid
“Energy Excellence Awards programme that rewards associates who develop energy saving or renewable energy projects.”Novartis
Opportunities
85% (337) of 2011 respondents (2010: 86%, 329) show a continued awareness of significant opportunities relating to climate change, indicating that the overwhelming majority of companies see that climate change offers them a positive means of transformation to deliver sustainable, low carbon products and services. It is this increasing
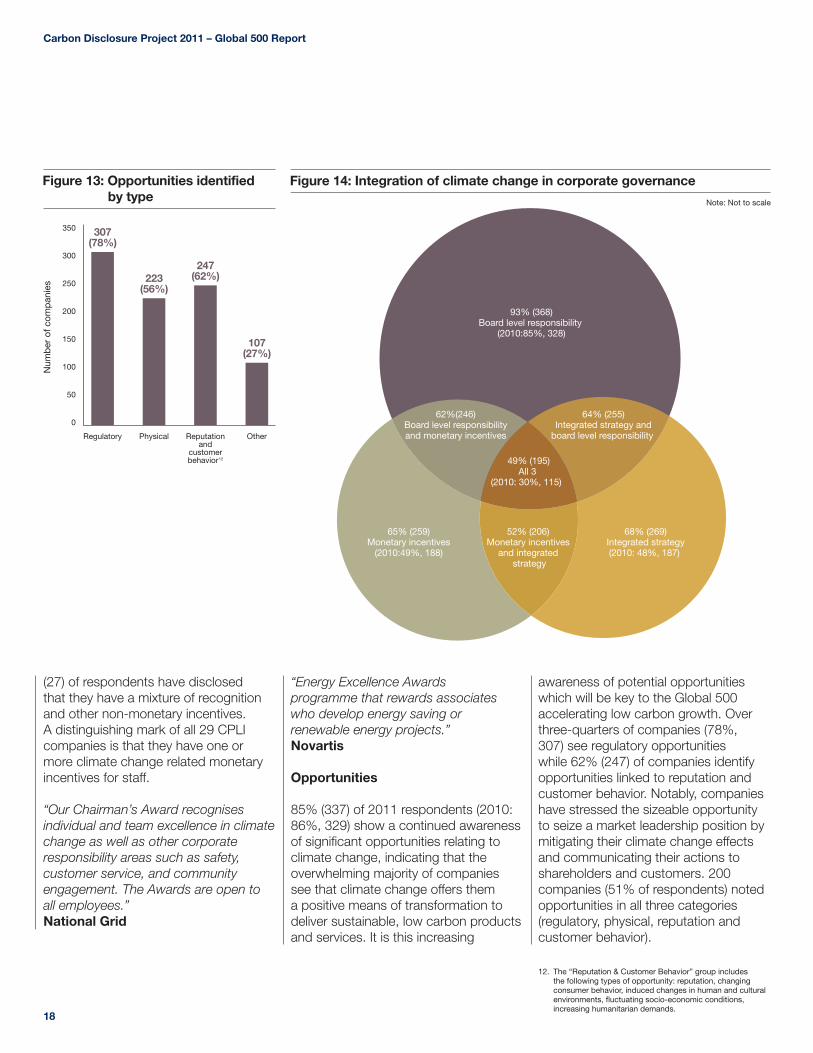
awareness of potential opportunities which will be key to the Global 500 accelerating low carbon growth. Over three-quarters of companies (78%, 307) see regulatory opportunities while 62% (247) of companies identify opportunities linked to reputation and customer behavior. Notably, companies have stressed the sizeable opportunity to seize a market leadership position by mitigating their climate change effects and communicating their actions to shareholders and customers. 200 companies (51% of respondents) noted opportunities in all three categories (regulatory, physical, reputation and customer behavior).
Figure 14: Integration of climate change in corporate governance
93% (368)Board level responsibility
(2010:85%, 328)
Note: Not to scale
65% (259)Monetary incentives
(2010:49%, 188)
68% (269) Integrated strategy (2010: 48%, 187)
64% (255) Integrated strategy and
board level responsibility
62%(246)Board level responsibilityand monetary incentives
49% (195)All 3
(2010: 30%, 115)
52% (206) Monetary incentives
and integrated strategy
Figure 13: Opportunities identified by type
350
300
250
200
150
100
50
0
Num
ber
of c
omp
anie
s
Regulatory Physical Reputationand
customerbehavior12
Other
307(78%)
223(56%)
247(62%)
107(27%)
12. The “Reputation & Customer Behavior” group includes the following types of opportunity: reputation, changing consumer behavior, induced changes in human and cultural environments, fluctuating socio-economic conditions, increasing humanitarian demands.
19
2011 Key Themes and Highlights
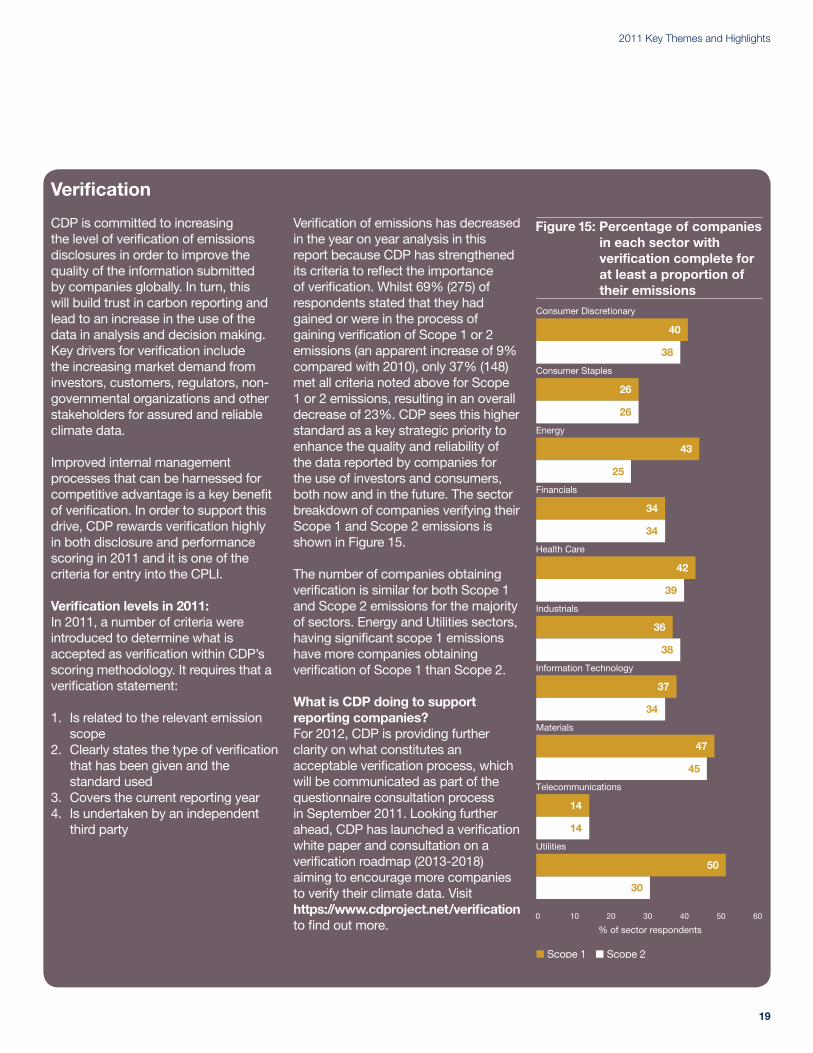
CDP is committed to increasing the level of verification of emissions disclosures in order to improve the quality of the information submitted by companies globally. In turn, this will build trust in carbon reporting and lead to an increase in the use of the data in analysis and decision making. Key drivers for verification include the increasing market demand from investors, customers, regulators, non-governmental organizations and other stakeholders for assured and reliable climate data.
Improved internal management processes that can be harnessed for competitive advantage is a key benefit of verification. In order to support this drive, CDP rewards verification highly in both disclosure and performance scoring in 2011 and it is one of the criteria for entry into the CPLI.
Verification levels in 2011: In 2011, a number of criteria were introduced to determine what is accepted as verification within CDP’s scoring methodology. It requires that a verification statement:
1. Is related to the relevant emission scope
2. Clearly states the type of verification that has been given and the standard used
3. Covers the current reporting year 4. Is undertaken by an independent
third party
Verification of emissions has decreased in the year on year analysis in this report because CDP has strengthened its criteria to reflect the importance of verification. Whilst 69% (275) of respondents stated that they had gained or were in the process of gaining verification of Scope 1 or 2 emissions (an apparent increase of 9% compared with 2010), only 37% (148) met all criteria noted above for Scope 1 or 2 emissions, resulting in an overall decrease of 23%. CDP sees this higher standard as a key strategic priority to enhance the quality and reliability of the data reported by companies for the use of investors and consumers, both now and in the future. The sector breakdown of companies verifying their Scope 1 and Scope 2 emissions is shown in Figure 15.
The number of companies obtaining verification is similar for both Scope 1 and Scope 2 emissions for the majority of sectors. Energy and Utilities sectors, having significant scope 1 emissions have more companies obtaining verification of Scope 1 than Scope 2.
What is CDP doing to support reporting companies? For 2012, CDP is providing further clarity on what constitutes an acceptable verification process, which will be communicated as part of the questionnaire consultation process in September 2011. Looking further ahead, CDP has launched a verification white paper and consultation on a verification roadmap (2013-2018) aiming to encourage more companies to verify their climate data. Visit https://www.cdproject.net/verification to find out more.
Verification
Figure 15: Percentage of companies in each sector with verification complete for at least a proportion of their emissions
0 10 20 30 40 50 60
% of sector respondents
40
38
26
43
25
34
42
39
36
38
37
34
47
30
■ Scope 1 ■ Scope 2
45
14
50
26
14
34
Consumer Discretionary
Consumer Staples
Energy
Financials
Health Care
Industrials
Information Technology
Materials
Telecommunications
Utilities

Carbon Disclosure Project 2011 – Global 500 Report
20
The 2011 responses to the CDP Global 500 Investor questionnaire clearly show that organizations are incorporating sustainability concepts into their business strategies. Corporations are acknowledging the business opportunities presented by a low carbon and sustainable growth environment, and are reporting on a broad range of initiatives to inform investors of their low carbon objectives.
Currently, profit remains the dominant measure of success in our economic system. Increasingly though, there is recognition that historic financial performance is unlikely to be sufficient for an assessment of the long term prospects of a business where the dynamic of wealth creation is changing. In response to this, the business community is disclosing significantly more non-financial information which underpins how value is and will be created. Disclosures include detailed plans for low carbon products and services, and employee incentives to reduce greenhouse gas emissions. This type of additional information gives a broader perspective on a company’s strategy and positioning and reflects a growing recognition that this type of information is important to stakeholders and the ability of a business to retain its long term license to operate. This shift in thinking is occurring at a time when global reporting frameworks continue to place heavy emphasis on financial disclosure and performance. While financial systems were not designed to capture all of the non-
financial inputs needed to reflect the contribution of business to society, there is a growing realization that a more progressive reporting model is needed. A few leading companies are beginning to experiment and challenge established boundaries of how performance is measured and reported.
These leading corporations are going so far as to rethink their business and reporting models, how they manage and drive sustainable, profitable growth and how they measure critical non-financial information. In turn, this shift in mindset appears to help corporations envision the future and build competitive advantage – enhancing their brand, influencing consumer behavior and supporting new product development. This is all being achieved in a manner which also helps redefines the business’ overall contribution to society. The examples in this report show how companies are forging ahead in these areas.
These innovations in business cry out for a new reporting model, one that recognizes the importance of non-financial issues such as carbon emissions and climate change. By its nature, regulatory reporting is slow to change but the speed of innovation inside many progressive companies suggests that the regulatory model will adapt more quickly than many believe. The opportunity for most companies is not to wait for regulation but to ensure that their internal reporting is moving forward and remaining ahead of the curve.
PwC commentary: Non-Financial Reporting Alan McGill, Partner, PwC
“ To face these challenges, the Carbon Strategy unit has been created in 2010. The components of the long term strategy that have been influenced by climate change are: the investment portfolio strategy (e.g. investments in renewable energy sources and energy efficiency); and the research & development strategy (Enel focuses on low carbon technologies and emission reductions from existing technologies e.g. CCS, smart metering, smart grids, electric cars).” Enel
21
Introduction to the Carbon Disclosure Leadership Index (CDLI) and the Carbon Performance Leadership Index (CPLI)
Each year, company responses are reviewed, analyzed and scored for the quality of disclosure and performance on actions taken to mitigate climate change. This results in a disclosure score and, where sufficient disclosure exists, a performance band.
Disclosure scores • Disclosure scores are an assessment
of the quality and completeness of a company’s response; they are not a measure of a company’s performance in relation to climate change management
• Scores are plotted over a 100-point normalized scale
• Companies are assessed based on their level of disclosure of carbon emissions measurement techniques and subsequent public disclosure
• Companies with the highest disclosure scores are listed in the CDLI
Performance bands • Where a company’s disclosure
score is 50 or more, its performance in contributing to climate change mitigation, adaptation and transparency is assessed and ranked in a performance band
• In 2011 there are six performance bands (there were four bands in 2010)
• Companies with the highest performance bands that meet additional CPLI criteria are listed in the CPLI
Analysis of the CDLI and CPLI provides insights into the characteristics and common trends among the leading companies on carbon disclosure, and highlights good practices in reporting, governance, risk management, emissions reductions and other areas. Interrelations between the CDLI and CPLI companies are analyzed to determine if those companies with better data use it within the business to drive value adding activities. The financial performance of CDLI and CPLI companies is examined and compared against the benchmark index of the Global 500.
“ Fiat is one of the automotive groups most strongly committed to reducing the environmental impacts of transportation: between 2000 and 2010, average CO2 emissions for vehicles sold by Fiat Group Automobiles (FGA) in Europe fell 20%.” Fiat
2011 Leaders
22
The 2011 Carbon Disclosure Leadership Index (CDLI)
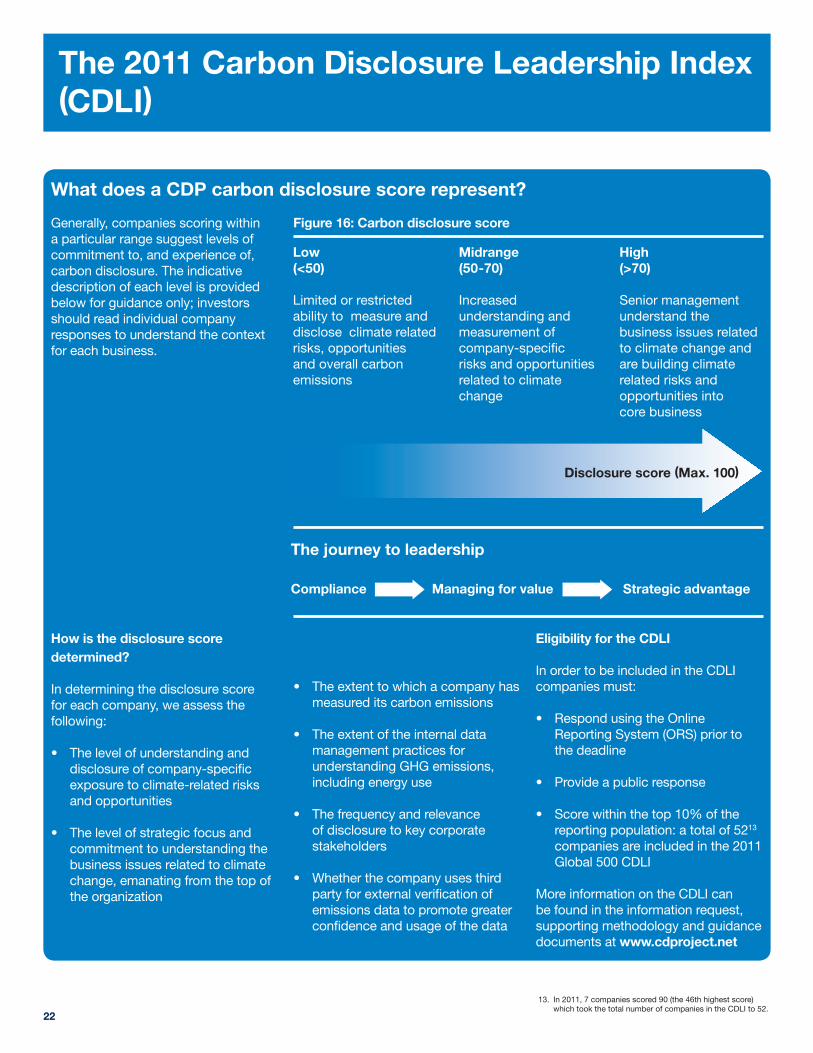
Generally, companies scoring within a particular range suggest levels of commitment to, and experience of, carbon disclosure. The indicative description of each level is provided below for guidance only; investors should read individual company responses to understand the context for each business.
How is the disclosure score determined?
In determining the disclosure score for each company, we assess the following:
• Thelevelofunderstandinganddisclosure of company-specific exposure to climate-related risks and opportunities
• Thelevelofstrategicfocusandcommitment to understanding the business issues related to climate change, emanating from the top of the organization
• Theextenttowhichacompanyhasmeasured its carbon emissions
• Theextentoftheinternaldatamanagement practices for understanding GHG emissions, including energy use
• Thefrequencyandrelevanceof disclosure to key corporate stakeholders
• Whetherthecompanyusesthirdparty for external verification of emissions data to promote greater confidence and usage of the data
Eligibility for the CDLI
In order to be included in the CDLI companies must:
• RespondusingtheOnlineReporting System (ORS) prior to the deadline
• Provideapublicresponse
• Scorewithinthetop10%ofthereporting population: a total of 5213 companies are included in the 2011 Global 500 CDLI
More information on the CDLI can be found in the information request, supporting methodology and guidance documents at www.cdproject.net
What does a CDP carbon disclosure score represent?
The journey to leadership
High (>70) Senior management understand the business issues related to climate change and are building climate related risks and opportunities into core business
Midrange (50-70) Increased understanding and measurement of company-specific risks and opportunities related to climate change
Low (<50)
Limited or restricted ability to measure and disclose climate related risks, opportunities and overall carbon emissions
Disclosure score (Max. 100)
13. In 2011, 7 companies scored 90 (the 46th highest score) which took the total number of companies in the CDLI to 52.
Compliance Managing for value Strategic advantage
Figure 16: Carbon disclosure score
23
2011 Carbon Disclosure Leadership Index (CDLI)
Sector Company Disclosure score
Consumer Discretionary Philips Electronics 99BMW 96Honda Motor Company 95News Corporation 93Panasonic 93Fiat 93Volkswagen 91Metro 90British Sky Broadcasting 90
Consumer Staples Tesco 97Nestle 91British American Tobacco 91PepsiCo 90
Energy Suncor Energy 92Hess 91Royal Dutch Shell 90
Financials Bank of America 97Westpac Banking 96Simon Property 96HSBC Holdings 95AXA Group 92Allianz 92Swiss Re 91UBS 91Royal Bank of Scotland Group 91National Australia Bank 91
Health Care Bayer 99Gilead Sciences 95Novartis 94GlaxoSmithKline 93
Industrials Deutsche Post 99UPS 99Siemens 97Saint-Gobain 94Boeing 92Schneider Electric 91Lockheed Martin 90
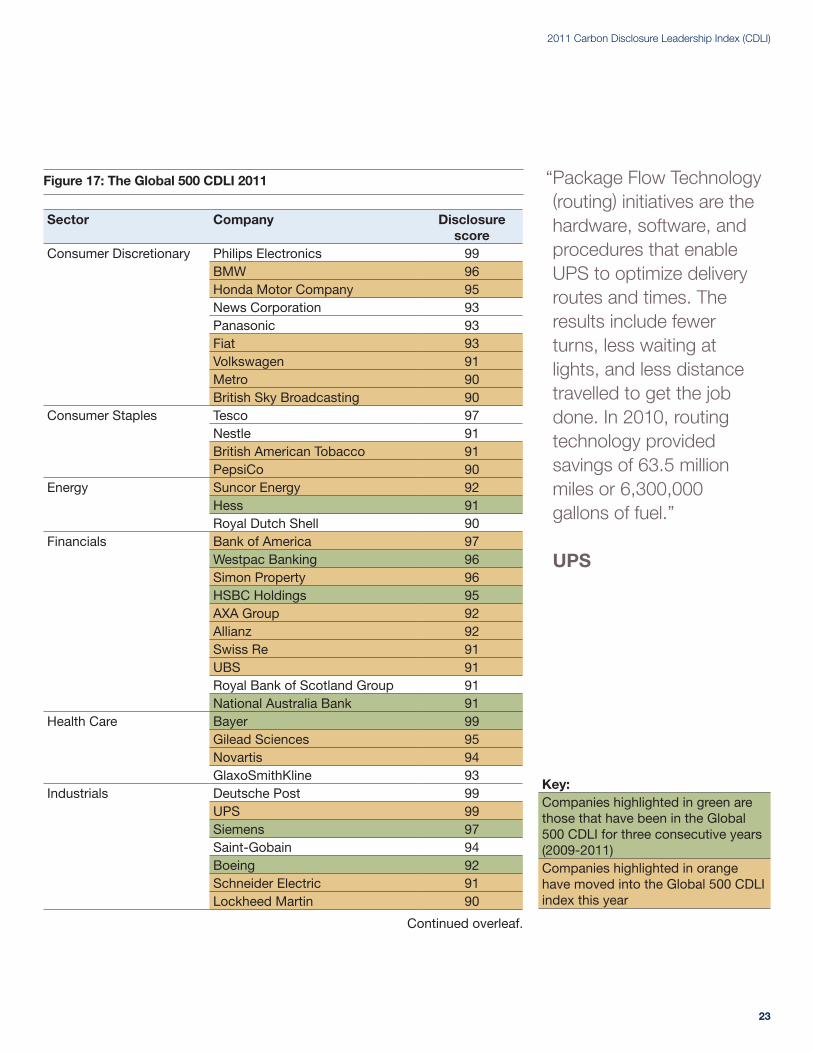
Figure 17: The Global 500 CDLI 2011
Continued overleaf.
Key:Companies highlighted in green are those that have been in the Global 500 CDLI for three consecutive years (2009-2011)Companies highlighted in orange have moved into the Global 500 CDLI index this year
“ Package Flow Technology (routing) initiatives are the hardware, software, and procedures that enable UPS to optimize delivery routes and times. The results include fewer turns, less waiting at lights, and less distance travelled to get the job done. In 2010, routing technology provided savings of 63.5 million miles or 6,300,000 gallons of fuel.” UPS
Carbon Disclosure Project 2011 – Global 500 Report
24
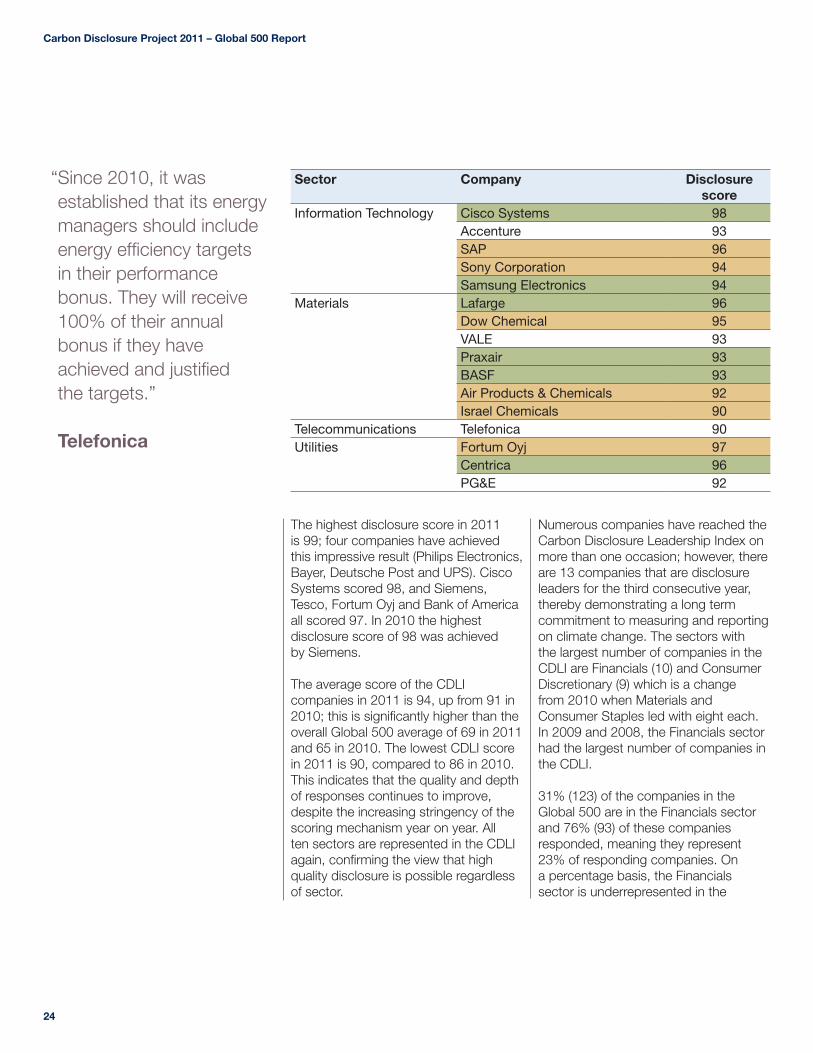
“ Since 2010, it was established that its energy managers should include energy efficiency targets in their performance bonus. They will receive 100% of their annual bonus if they have achieved and justified the targets.” Telefonica
Sector Company Disclosure score
Information Technology Cisco Systems 98Accenture 93SAP 96Sony Corporation 94Samsung Electronics 94
Materials Lafarge 96Dow Chemical 95VALE 93Praxair 93BASF 93Air Products & Chemicals 92Israel Chemicals 90
Telecommunications Telefonica 90Utilities Fortum Oyj 97
Centrica 96PG&E 92
The highest disclosure score in 2011 is 99; four companies have achieved this impressive result (Philips Electronics, Bayer, Deutsche Post and UPS). Cisco Systems scored 98, and Siemens, Tesco, Fortum Oyj and Bank of America all scored 97. In 2010 the highest disclosure score of 98 was achieved by Siemens.
The average score of the CDLI companies in 2011 is 94, up from 91 in 2010; this is significantly higher than the overall Global 500 average of 69 in 2011 and 65 in 2010. The lowest CDLI score in 2011 is 90, compared to 86 in 2010. This indicates that the quality and depth of responses continues to improve, despite the increasing stringency of the scoring mechanism year on year. All ten sectors are represented in the CDLI again, confirming the view that high quality disclosure is possible regardless of sector.
Numerous companies have reached the Carbon Disclosure Leadership Index on more than one occasion; however, there are 13 companies that are disclosure leaders for the third consecutive year, thereby demonstrating a long term commitment to measuring and reporting on climate change. The sectors with the largest number of companies in the CDLI are Financials (10) and Consumer Discretionary (9) which is a change from 2010 when Materials and Consumer Staples led with eight each. In 2009 and 2008, the Financials sector had the largest number of companies in the CDLI.
31% (123) of the companies in the Global 500 are in the Financials sector and 76% (93) of these companies responded, meaning they represent 23% of responding companies. On a percentage basis, the Financials sector is underrepresented in the
25
2011 Carbon Disclosure Leadership Index (CDLI)
CDLI (at 19%) showing that, whilst there is some strong leadership in the sector, improvement is possible. The Consumer Discretionary sector may have moved into a stronger position in the CDLI (17%) because consumers are becoming increasingly carbon conscious in their spending habits. This requires companies in the sector to understand and disclose more as they seek to retain and win market share.
CDLI companies show consistent leadership across all areas of disclosure
The Global 500 respondents show a strong overall improvement in disclosure. In 2011, 33% (129) of total respondents score 80 or more compared to 24% (90) in 2010. As the overall quality of emissions disclosure has improved in 2011, the leaders (CDLI) have reported a much stronger understanding of the impact of climate change on their business, and as a result may derive a strategic advantage.
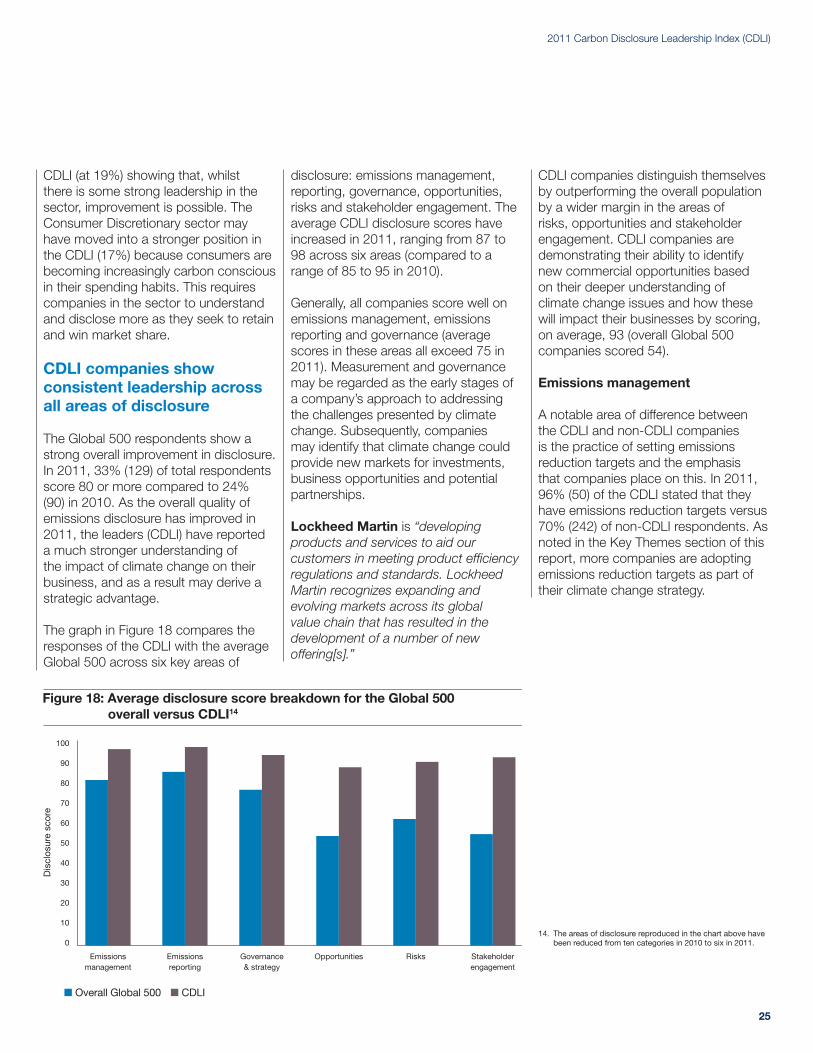
The graph in Figure 18 compares the responses of the CDLI with the average Global 500 across six key areas of
disclosure: emissions management, reporting, governance, opportunities, risks and stakeholder engagement. The average CDLI disclosure scores have increased in 2011, ranging from 87 to 98 across six areas (compared to a range of 85 to 95 in 2010).
Generally, all companies score well on emissions management, emissions reporting and governance (average scores in these areas all exceed 75 in 2011). Measurement and governance may be regarded as the early stages of a company’s approach to addressing the challenges presented by climate change. Subsequently, companies may identify that climate change could provide new markets for investments, business opportunities and potential partnerships.
Lockheed Martin is “developing products and services to aid our customers in meeting product efficiency regulations and standards. Lockheed Martin recognizes expanding and evolving markets across its global value chain that has resulted in the development of a number of new offering[s].”
CDLI companies distinguish themselves by outperforming the overall population by a wider margin in the areas of risks, opportunities and stakeholder engagement. CDLI companies are demonstrating their ability to identify new commercial opportunities based on their deeper understanding of climate change issues and how these will impact their businesses by scoring, on average, 93 (overall Global 500 companies scored 54).
Emissions management
A notable area of difference between the CDLI and non-CDLI companies is the practice of setting emissions reduction targets and the emphasis that companies place on this. In 2011, 96% (50) of the CDLI stated that they have emissions reduction targets versus 70% (242) of non-CDLI respondents. As noted in the Key Themes section of this report, more companies are adopting emissions reduction targets as part of their climate change strategy.
Figure 18: Average disclosure score breakdown for the Global 500 overall versus CDLI14
100
90
80
70
60
50
40
30
20
10
0
Emissionsmanagement
Emissionsreporting
Dis
clos
ure
scor
e
Governance& strategy
Opportunities Risks Stakeholderengagement
■ Overall Global 500 ■ CDLI
14. The areas of disclosure reproduced in the chart above have been reduced from ten categories in 2010 to six in 2011.
Carbon Disclosure Project 2011 – Global 500 Report
26
“One of the company’s strategic goals is to minimize its own contribution to global warming. This goal was implemented in 2003 when our CEO committed the company to going carbon neutral over a ten year period and set KPIs. The original target was to reduce our own carbon emissions by 15% per FTE and to compensate the remainder through the retirement of high quality emissions reduction certificates. The reduction target has been increased twice since 2003 to the current level of -45% per FTE basis. In 2010 the goal was exceeded as CO2 per FTE had been reduced by 50.6%. Although our carbon neutrality goal was achieved in 2007 the programme is still in force.” Swiss Re
Emissions reporting
The CDLI companies showed consistent leadership in emissions reporting by gaining an average score of 98 (2010: 97), thereby showing the value that these companies place on measuring and monitoring their emissions. In 2011, particular emphasis has been placed on verification of emissions by companies. 100% (52) of the CDLI have their Scope 1 and Scope 2 emissions verified (complete or underway) in the reporting year (90% of these companies have been awarded the full marks available by attaching the appropriate third party opinion for the appropriate year and standard). The fact that these companies undertook the verification of their emissions is a strong contributing factor to their inclusion in the CDLI.
Governance & strategy
Governance continues to be a strong area for disclosure for both CDLI and non-CDLI companies in 2011 and forms a significant part of their corporate strategy. 100% of CDLI respondents
stated that the Board or senior management has responsibility for climate change in the company (96% in 2010). 94% (371) of the overall Global 500 respondents stated that they had this level of governance (89% in 2010).
Opportunities
The CDLI significantly outperform the Global 500 population in terms of identifying and disclosing climate change opportunities. The average score for the CDLI in this area is 88 compared to 54 across all respondents. Companies that dedicate resources and time to the identification of opportunities may be better placed to capitalize on the opportunities that arise from a low carbon economy. The following examples highlight how companies are responding to and driving opportunities by considering stakeholder opinion, customer base and supply chain as part of their risk assessment process. “In January 2011, we published a report with Barclays Capital focusing on opportunities for the financial sector to finance low carbon technologies. The most important components of our long-term strategy influenced by climate change are driving new business practices for a carbon-constrained economy. We aim to reduce Accenture’s carbon emissions and support our clients to reduce theirs.”Accenture “Current and future regulatory requirements related to climate change are connected with business opportunities for BASF as they increase the demand for existing climate protection products, open up new markets and boost access to market shares. The market for these technologies is expected to grow at an above average rate due to regulatory influences.”BASF
“Employees are increasingly choosing to work for companies that reflect their values and hence, our response to climate change has potential to impact on our ability to attract and retain employees.”National Australia Bank
Risks 85% (338) of respondents reported risk from climate change in 2011 (2010: 78%, 301).
Undertaking work on risk identification and then disclosing risks could be an area of greater focus for the Global 500 in the future given the comparatively low average overall disclosure score of 62 for this area, although the CDLI companies are further ahead with a disclosure score of 91. The following examples highlight how some companies are identifying and responding to regulatory, physical and other risks brought about by climate change.
“Although the EU has committed itself to emissions reduction also beyond 2012 and to the continuation of the emissions trading system (ETS), the uncertainty related to the post-2012 global policy is the main regulatory risk for the future investments of the energy industry. This might result in wrong investment decisions (technology, fuels, location).” Fortum Oyj
“Consumers’ behaviors are affected by regional conditions from where they belong. Demands on micro plants for electricity generation with renewable energy sources will be increased in areas where centralized energy supply infrastructures are in short supply. However, in general, demands on high energy efficient and low carbon products will continuously grow in global setting due to increase of energy price and limitation on GHG /carbon emissions.”Samsung Electronics
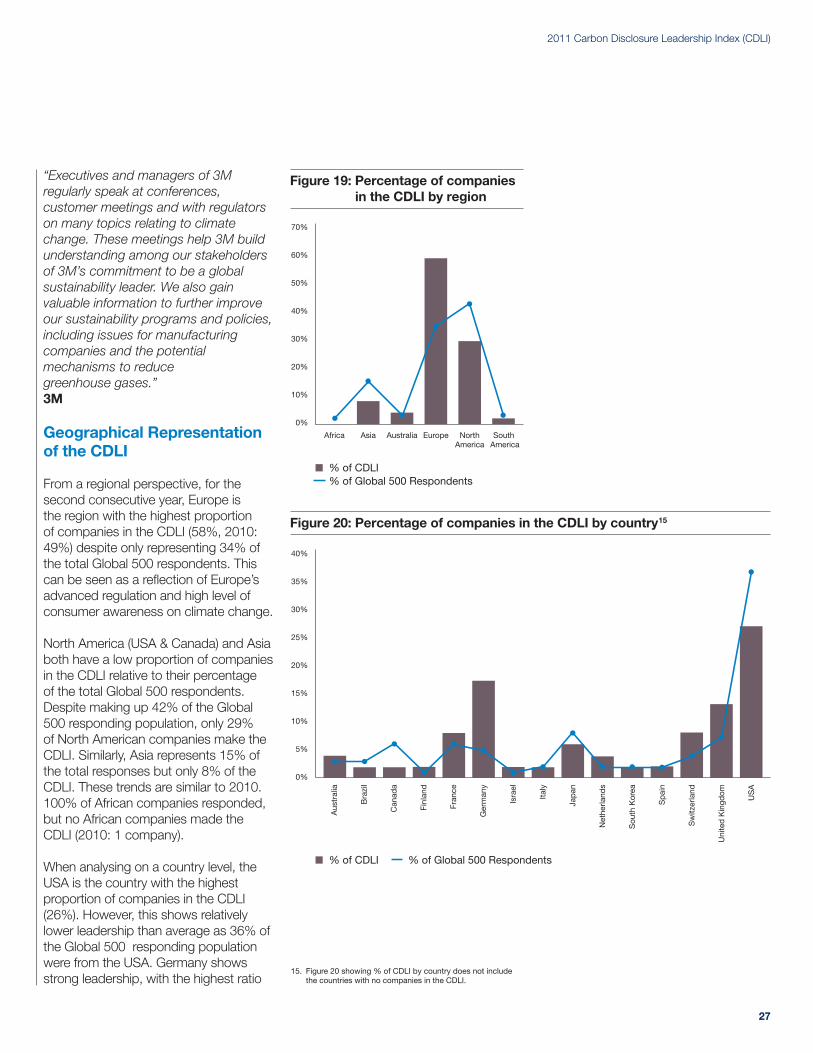
27
2011 Carbon Disclosure Leadership Index (CDLI)
“Executives and managers of 3M regularly speak at conferences, customer meetings and with regulators on many topics relating to climate change. These meetings help 3M build understanding among our stakeholders of 3M’s commitment to be a global sustainability leader. We also gain valuable information to further improve our sustainability programs and policies, including issues for manufacturing companies and the potential mechanisms to reduce greenhouse gases.”3M
Geographical Representation of the CDLI
From a regional perspective, for the second consecutive year, Europe is the region with the highest proportion of companies in the CDLI (58%, 2010: 49%) despite only representing 34% of the total Global 500 respondents. This can be seen as a reflection of Europe’s advanced regulation and high level of consumer awareness on climate change.
North America (USA & Canada) and Asia both have a low proportion of companies in the CDLI relative to their percentage of the total Global 500 respondents. Despite making up 42% of the Global 500 responding population, only 29% of North American companies make the CDLI. Similarly, Asia represents 15% of the total responses but only 8% of the CDLI. These trends are similar to 2010. 100% of African companies responded, but no African companies made the CDLI (2010: 1 company).
When analysing on a country level, the USA is the country with the highest proportion of companies in the CDLI (26%). However, this shows relatively lower leadership than average as 36% of the Global 500 responding population were from the USA. Germany shows strong leadership, with the highest ratio
Figure 19: Percentage of companies in the CDLI by region
70%
60%
50%
40%
30%
20%
10%
0%
% of CDLI % of Global 500 Respondents
Africa Asia Australia Europe NorthAmerica
South America
Figure 20: Percentage of companies in the CDLI by country15
40%
35%
30%
25%
20%
15%
10%
5%
0%
% of CDLI % of Global 500 Respondents
Aus
tral
ia
Bra
zil
Can
ada
Finl
and
Fran
ce
Ger
man
y
Isra
el
Italy
Jap
an
Net
herla
nds
Sou
th K
orea
Sp
ain
Uni
ted
Kin
gdom
US
A
Sw
itzer
land
15. Figure 20 showing % of CDLI by country does not include the countries with no companies in the CDLI.
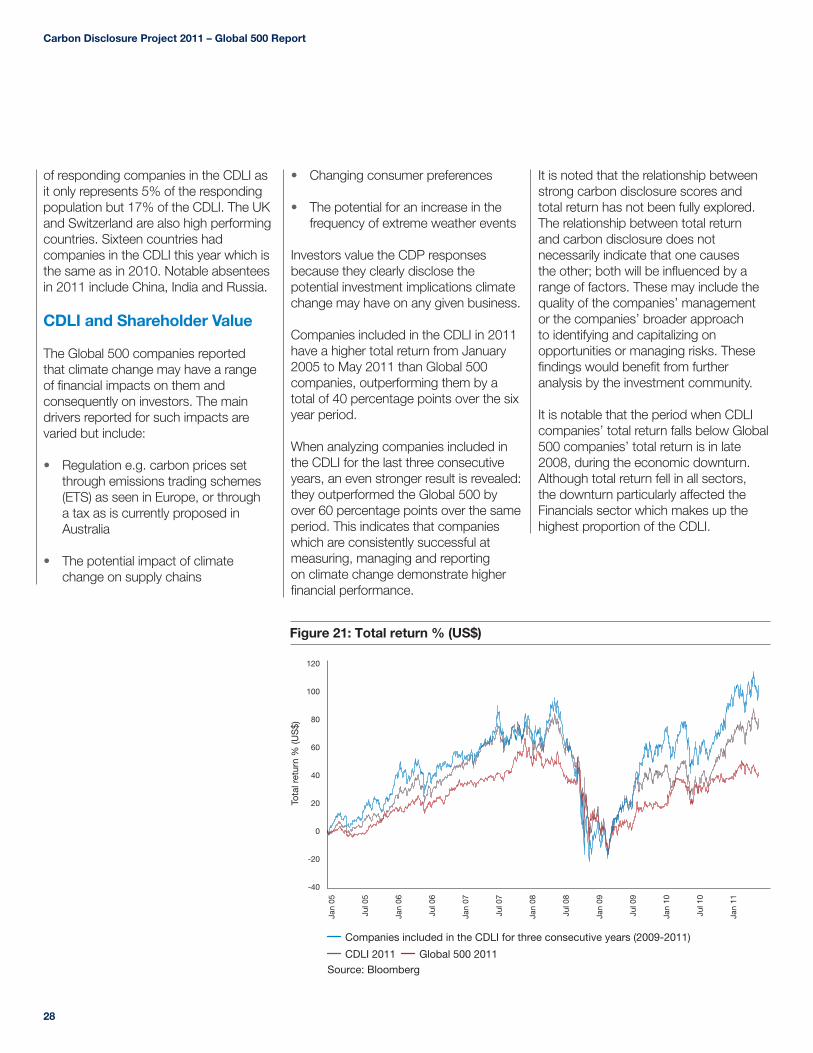
Carbon Disclosure Project 2011 – Global 500 Report
28
of responding companies in the CDLI as it only represents 5% of the responding population but 17% of the CDLI. The UK and Switzerland are also high performing countries. Sixteen countries had companies in the CDLI this year which is the same as in 2010. Notable absentees in 2011 include China, India and Russia.
CDLI and Shareholder Value
The Global 500 companies reported that climate change may have a range of financial impacts on them and consequently on investors. The main drivers reported for such impacts are varied but include:
• Regulation e.g. carbon prices set through emissions trading schemes (ETS) as seen in Europe, or through a tax as is currently proposed in Australia
• The potential impact of climate change on supply chains
• Changing consumer preferences
• The potential for an increase in the frequency of extreme weather events
Investors value the CDP responses because they clearly disclose the potential investment implications climate change may have on any given business.
Companies included in the CDLI in 2011 have a higher total return from January 2005 to May 2011 than Global 500 companies, outperforming them by a total of 40 percentage points over the six year period.
When analyzing companies included in the CDLI for the last three consecutive years, an even stronger result is revealed: they outperformed the Global 500 by over 60 percentage points over the same period. This indicates that companies which are consistently successful at measuring, managing and reporting on climate change demonstrate higher financial performance.
It is noted that the relationship between strong carbon disclosure scores and total return has not been fully explored. The relationship between total return and carbon disclosure does not necessarily indicate that one causes the other; both will be influenced by a range of factors. These may include the quality of the companies’ management or the companies’ broader approach to identifying and capitalizing on opportunities or managing risks. These findings would benefit from further analysis by the investment community.
It is notable that the period when CDLI companies’ total return falls below Global 500 companies’ total return is in late 2008, during the economic downturn. Although total return fell in all sectors, the downturn particularly affected the Financials sector which makes up the highest proportion of the CDLI.
Figure 21: Total return % (US$)
120
100
80
60
40
20
0
-20
-40
Companies included in the CDLI for three consecutive years (2009-2011)
CDLI 2011 Global 500 2011 Source: Bloomberg
Total return % (US$)
Tota
l ret
urn
% (U
S$)
Jan
05
Jul 0
5
Jan
06
Jul 0
6
Jan
07
Jul 0
7
Jan
08
Jul 0
8
Jan
09
Jul 0
9
Jan
10
Jul 1
0
Jan
11

29
This year, for the second time, all companies with a sufficiently high disclosure score received a performance band; the qualifying threshold to receive a performance band was a disclosure score of 50. Disclosure scores of less than 50 do not necessarily indicate poor performance; rather, they indicate insufficient information to evaluate performance. However, it can be assumed that companies which do not disclose are inactive on climate change.
Performance is grouped into six bands: A, A-, B, C, D and E (see Figure 22).
The Carbon Performance Leadership Index (CPLI) includes the companies in the highest performance band (A) and provides a valuable perspective on the range and quality of activities being performed by the Global 500 in response to climate change.
Eligibility for the CPLI (Band A) • Attainadisclosurescoreof50or
above
• Attainaperformancescoregreaterthan 70
• Scoremaximumperformancepoints on question 13.1a (absolute emissions performance); at least a 2.65%16 reduction in carbon emissions must have been achieved as a result of emissions reduction activities over the last year
• DisclosegrossglobalScope1 and Scope 2 figures
• Scoremaximumperformance
points for verification of Scope 1 and Scope 2
Notes:
• BandA-(Aminus)companiesarenot in the CPLI. They are strong performers, with a performance score high enough to warrant inclusion in the CPLI but they do not meet all other CPLI requirements
• CDPreservestherighttoexclude a company from the CPLI if there is anything in its response that calls into question its suitability for inclusion
Performance scoring is an instructive exercise for all stakeholders. The score provides an indication of the extent to which companies are addressing the potential opportunities and risks presented by climate change. CDP recognizes that this is a process that will evolve over time. It is important for investors to keep in mind that the carbon performance band is not:
• Ameasureofhowlowcarbonacompany is
• Anassessmentoftheextenttowhich a company’s actions have reduced carbon intensity relative to other companies in its sector
• Anassessmentofhowmateriala company’s actions are relative to the business; the score simply recognizes evidence of action
It is possible to review individual company disclosures in addition to performance rankings in order to gain the most comprehensive understanding of company performance. A listing of companies and their bands is included in Appendix I. Companies that did not qualify for a performance band appear in Appendix I with a dash (-) in the performance band column.
More information can be found in the information request, supporting methodology and guidance documents, as well as within individual company responses at www.cdproject.net.
16. The Intergovernmental Panel on Climate Change (IPCC) has set a target of 80% reduction in emissions by 2050, based on 1990 levels. This equates to a 2.65% annual reduction.
The 2011 Carbon Performance Leadership Index (CPLI)
Band A/A- (>70) Fully integrated climate change strategy driving significant maturity in climate change initiatives
Band B (>50) Integration of climate change recognized as priority for strategy, not all initiatives fully established
Band C (>30) Some activity on climate change with varied levels of integration of those initiatives into strategy
Band D (>15) Limited evidence of mitigation or adaptation initiatives and no/limited strategy on climate change
Band E (≤15) Little evidence of initiatives on carbon management potentially due to companies just beginning to take action on climate change
Per
form
ance
ban
d (A
is h
ighe
st)
No performance score allocated below a disclosure of 50%
Figure 22: Carbon performance elements
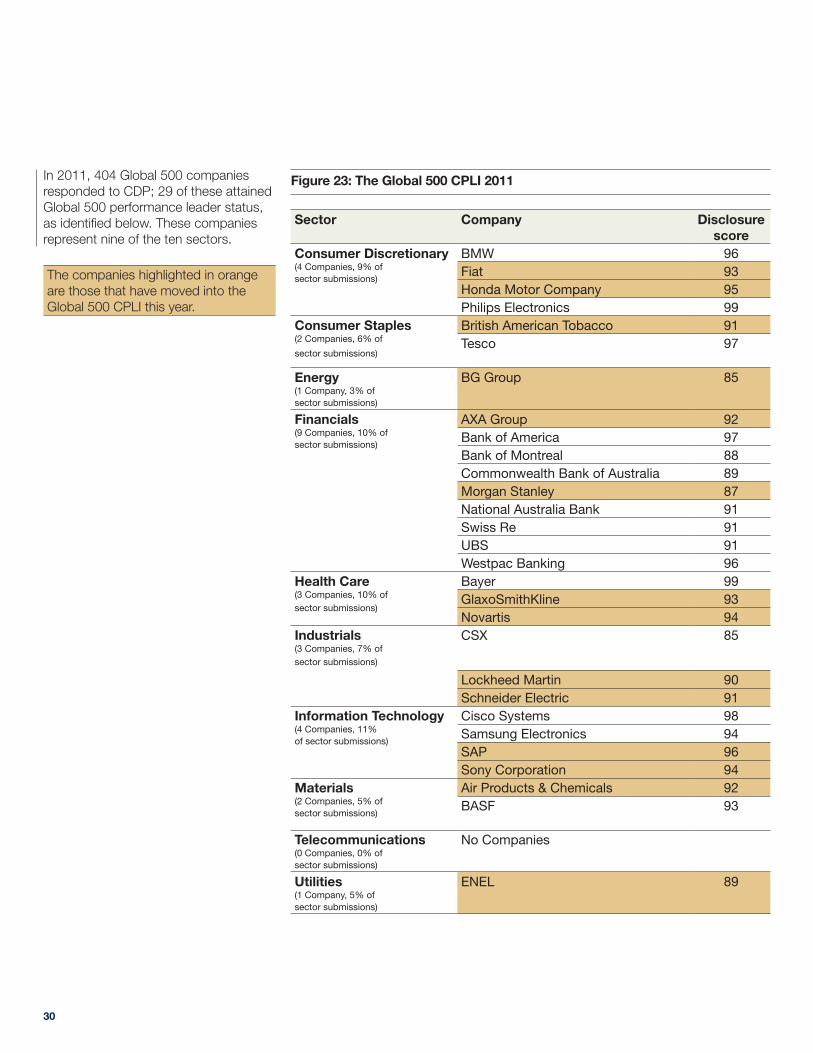
30
In 2011, 404 Global 500 companies responded to CDP; 29 of these attained Global 500 performance leader status, as identified below. These companies represent nine of the ten sectors.
The companies highlighted in orange are those that have moved into the Global 500 CPLI this year.
Sector Company Disclosure score
BMW 96Fiat 93Honda Motor Company 95Philips Electronics 99British American Tobacco 91Tesco 97
Energy(1 Company, 3% of sector submissions)
BG Group 85
AXA Group 92Bank of America 97Bank of Montreal 88Commonwealth Bank of Australia 89Morgan Stanley 87National Australia Bank 91Swiss Re 91UBS 91Westpac Banking 96Bayer 99GlaxoSmithKline 93Novartis 94CSX 85
Lockheed Martin 90Schneider Electric 91Cisco Systems 98Samsung Electronics 94SAP 96Sony Corporation 94Air Products & Chemicals 92BASF 93
Telecommunications (0 Companies, 0% of sector submissions)
No Companies
Utilities (1 Company, 5% of sector submissions)
ENEL 89
Figure 23: The Global 500 CPLI 2011
Consumer Discretionary (4 Companies, 9% of sector submissions)
Consumer Staples(2 Companies, 6% of
sector submissions)
Financials (9 Companies, 10% of sector submissions)
Health Care (3 Companies, 10% of sector submissions)
Industrials (3 Companies, 7% of sector submissions)
Information Technology (4 Companies, 11% of sector submissions)
Materials (2 Companies, 5% of sector submissions)

31
The 2011 Carbon Performance Leadership Index (CPLI)
In 2011, CDP has raised the bar by enhancing the scoring methodology for both disclosure and performance questions to make the scoring results more relevant to investors and other stakeholders.
The average performance score for 2011 is 4 points lower than in 2010. This is primarily the result of a change in focus of the performance scoring rather than a change in corporate performance. In 2010, the focus was to measure the extent to which a company had a framework in place to address carbon management. This year, performance focuses more on measuring the ambition and success of a company’s short and long term actions to mitigate climate change.
Overall, 338 Global 500 companies (85%) received a performance band compared to 310 companies in 2010 (76%). However, as a consequence of more stringent CPLI entrance criteria on emissions reductions and verification, the number of companies included in the CPLI dropped from 48 to 29. A lower percentage (36%) of companies achieved a high performance band (A, A- or B) in 2011 than 2010 (52%). This is, again, largely due to the qualifying criteria being more stringent.
79% (23) of the CPLI companies were also in the CDLI – this is an improvement on 2010 (69%, 33) and indicates that senior executives in an increasing number of companies are not only aiming to be transparent about their emissions but are also actively striving to reduce their emissions. Many companies with a high disclosure score, combined with a high performance band, note the strategic benefits that taking a leadership position in carbon adaptation and mitigation offers.
It is important to note that performance improvements take longer to implement and often lag behind improvements in disclosure. As companies measure, they can manage and then begin to perform and optimize results. True performance enhancements take longer to achieve and the expectation is that companies’ performance will continue to improve over the coming years.
For the second consecutive year, the Financials sector has the most companies in the CPLI (9 companies – 31% of the total CPLI). This is partly because Financials is highly represented in the Global 500, but it also clearly shows that some financial services companies have prioritized action on climate change. The only sector with no companies in the CPLI is Telecommunications. This is surprising given that the Telecommunications sector is increasingly seen as providing technology that can support emissions reduction activities. Utilities is the best performing sector with an average performance band ‘B’. This may be a reflection of the impact of regulations on the Utilities sector and shows that these companies are taking a range of actions on climate change.
The sector with the lowest average performance band was Information Technology (band C). This reflects their lower than average number of emissions reductions activities as well as less frequent verification. As with the Telecommunications sector, this result is surprising given the expectation that Information Technology has the potential to support a wide range of emissions reduction activities.
Figure 24: Comparison of performance bands between 2010 and 2011
350
300
250
200
150
100
50
0
Num
ber
of c
omp
anie
s ga
inin
gp
erfo
rman
ce b
and
s
20112010
� A � A- � B � C � D � E
29
6099
10
153
48
107
87
2629
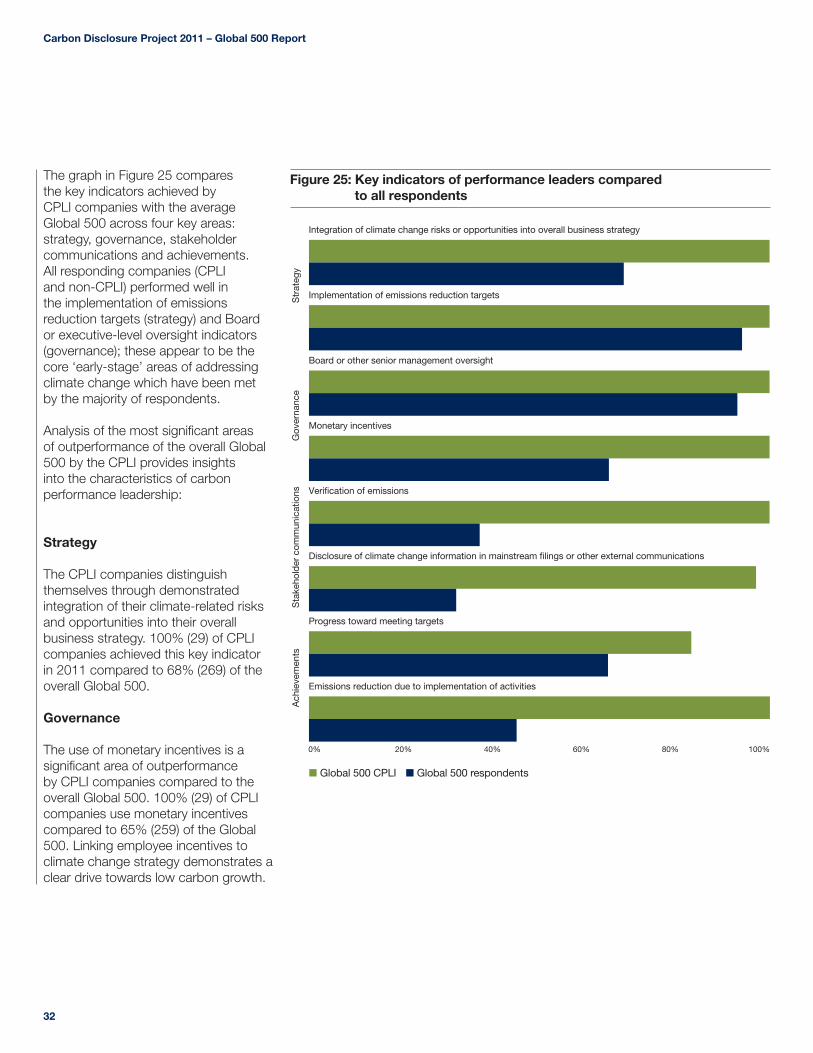
32
Carbon Disclosure Project 2011 – Global 500 Report
The graph in Figure 25 compares the key indicators achieved by CPLI companies with the average Global 500 across four key areas: strategy, governance, stakeholder communications and achievements. All responding companies (CPLI and non-CPLI) performed well in the implementation of emissions reduction targets (strategy) and Board or executive-level oversight indicators (governance); these appear to be the core ‘early-stage’ areas of addressing climate change which have been met by the majority of respondents.
Analysis of the most significant areas of outperformance of the overall Global 500 by the CPLI provides insights into the characteristics of carbon performance leadership:
Strategy
The CPLI companies distinguish themselves through demonstrated integration of their climate-related risks and opportunities into their overall business strategy. 100% (29) of CPLI companies achieved this key indicator in 2011 compared to 68% (269) of the overall Global 500.
Governance
The use of monetary incentives is a significant area of outperformance by CPLI companies compared to the overall Global 500. 100% (29) of CPLI companies use monetary incentives compared to 65% (259) of the Global 500. Linking employee incentives to climate change strategy demonstrates a clear drive towards low carbon growth.
Figure 25: Key indicators of performance leaders compared to all respondents
0% 20% 40% 60% 80% 100%
� Global 500 CPLI � Global 500 respondents
Integration of climate change risks or opportunities into overall business strategy
Implementation of emissions reduction targets
Board or other senior management oversight
Monetary incentives
Verification of emissions
Disclosure of climate change information in mainstream filings or other external communications
Progress toward meeting targets
Emissions reduction due to implementation of activities
Str
ateg
yG
over
nanc
eS
take
hold
er c
omm
unic
atio
nsA
chie
vem
ents
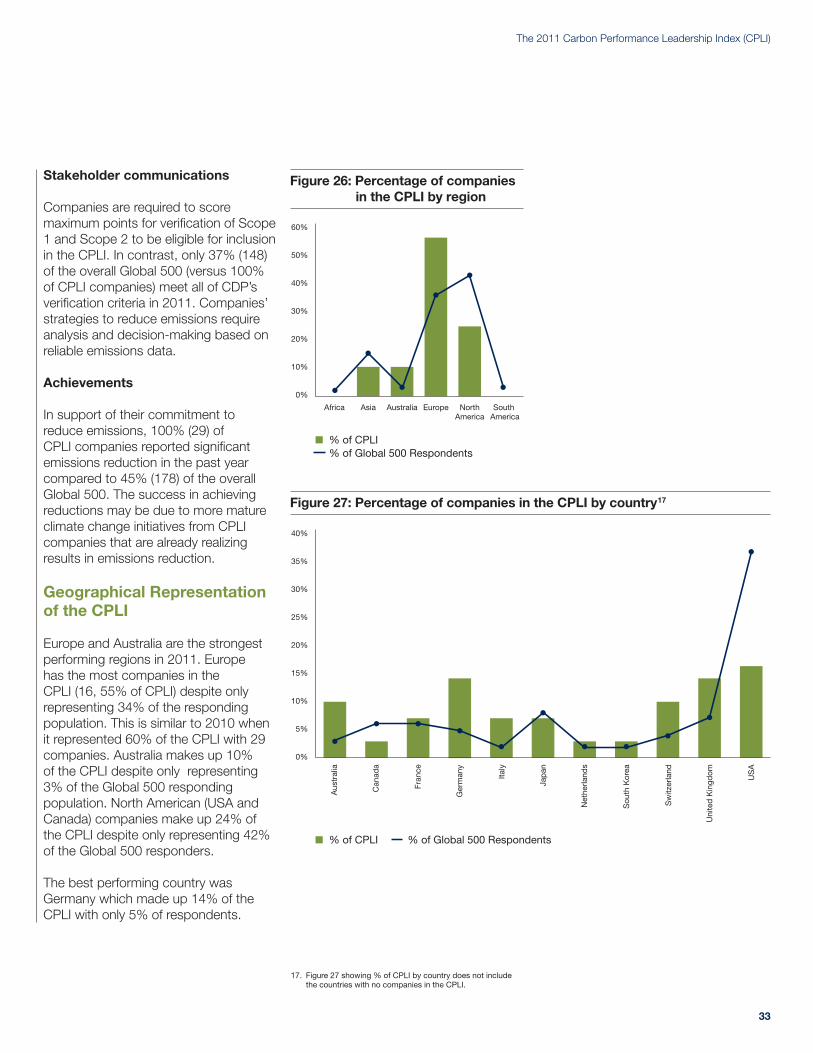
33
The 2011 Carbon Performance Leadership Index (CPLI)
Stakeholder communications
Companies are required to score maximum points for verification of Scope 1 and Scope 2 to be eligible for inclusion in the CPLI. In contrast, only 37% (148) of the overall Global 500 (versus 100% of CPLI companies) meet all of CDP’s verification criteria in 2011. Companies’ strategies to reduce emissions require analysis and decision-making based on reliable emissions data.
Achievements
In support of their commitment to reduce emissions, 100% (29) of CPLI companies reported significant emissions reduction in the past year compared to 45% (178) of the overall Global 500. The success in achieving reductions may be due to more mature climate change initiatives from CPLI companies that are already realizing results in emissions reduction.
Geographical Representation of the CPLI
Europe and Australia are the strongest performing regions in 2011. Europe has the most companies in the CPLI (16, 55% of CPLI) despite only representing 34% of the responding population. This is similar to 2010 when it represented 60% of the CPLI with 29 companies. Australia makes up 10% of the CPLI despite only representing 3% of the Global 500 responding population. North American (USA and Canada) companies make up 24% of the CPLI despite only representing 42% of the Global 500 responders.
The best performing country was Germany which made up 14% of the CPLI with only 5% of respondents.
Figure 26: Percentage of companies in the CPLI by region
60%
50%
40%
30%
20%
10%
0%
% of CPLI % of Global 500 Respondents
Africa Asia Australia Europe NorthAmerica
South America
Figure 27: Percentage of companies in the CPLI by country17
40%
35%
30%
25%
20%
15%
10%
5%
0%
% of CPLI % of Global 500 Respondents
Aus
tral
ia
Can
ada
Fran
ce
Ger
man
y
Italy
Jap
an
Net
herla
nds
Sou
th K
orea
Sw
itzer
land
Uni
ted
Kin
gdom
US
A
17. Figure 27 showing % of CPLI by country does not include the countries with no companies in the CPLI.

Carbon Disclosure Project 2011 – Global 500 Report
34
Australia, Italy, Switzerland and the UK are also performing relatively well. The USA had the most companies in the CPLI for the second year running with 6 – however, this only represented 21% of the CPLI while the USA represented 36% of respondents. Likewise, Japan and Canada CPLI representation was lower than their proportional number of responses. Notable absentees from the CPLI in 2011 include Brazil, China, Russia, South Africa and Spain. CPLI and Shareholder Value
Companies included in the CPLI in 2011 have a higher total return18 from January 2005 to May 2011 than Global 500 companies, outperforming them by a total of 40 percentage points over the six year period.
When analyzing companies included in the CPLI for the last two19 consecutive years, an even stronger result is revealed: they outperformed the Global 500 by over 50 percentage points over the same period. This indicates that companies which have an integrated climate change strategy and are successfully managing their emissions demonstrate higher financial performance.
It is noted that the relationship between strong carbon performance and total return has not been fully explored. The relationship between total return and carbon performance does not necessarily indicate that one causes the other; both will be influenced by a range of factors. These may include the quality of the company’s management or the company’s broader approach
to identifying and capitalizing on opportunities or managing risks. These findings would benefit from further analysis by the investment community.
It is notable that the period when CPLI companies’ total return falls below Global 500 companies’ total return is in late 2008, during the economic downturn. Although total return fell across all sectors, the downturn particularly affected the Financials sector which makes up the highest proportion of companies in the CPLI.
Figure 28: Total return % (US$)
120
100
80
60
40
20
0
-20
-40
Companies included in the CPLI for two consecutive years (2010-2011)
CPLI 2011 Global 500 2011 Source: Bloomberg
Tota
l ret
urn
% (U
S$)
Jan
05
Jul 0
5
Jan
06
Jul 0
6
Jan
07
Jul 0
7
Jan
08
Jul 0
8
Jan
09
Jul 0
9
Jan
10
Jul 1
0
Jan
11
18. Total Return includes interest, capital gains, dividends and distributions realized over a given period of time.
19. CPLI was launched in 2010 and is now in its second year.

35
Industry Perspectives: Sector Snapshots
Clear industry trends are present when the data is analyzed on a sector level and this is shown through a series of snapshots. All responding companies are scored on the same basis. Sector analysis provides insights into the key risks and opportunities facing each sector, as well as common or contrasting initiatives that are being adopted.
There are vast differences in performance bands between sectors as illustrated by Figure 29 with Telecommunications not having any companies within band ‘A’ compared to Financials (9). There are however, far more Financials respondents (93) compared to the Telecommunications (21). Changes in the CPLI criteria and the increase in maturity of the performance methodology has meant
that direct comparison of the band structure year on year is not possible.
The snapshots contain general sector graphs and tables such as emissions reduction targets and Scope 1, 2 and 3 emissions disclosures. More specific analysis highlights the key themes and challenges in each sector, with comparison to the CDLI and CPLI. Each sector’s risks and opportunities has been analyzed and disclosed to identify underlying trends in the company responses.
The risks and opportunities vary between sectors, however, the uncertainty with regulations especially in emerging markets remains a key risk across all sectors. Consumer trends and reputational risks have increased in frequency in the responses and are present across all sectors.
Figure 29: Number of companies in each performance band (Global 500)
■ Band A ■ Band A- ■ Band B ■ Band C ■ Band D ■ Band E
■ Insufficient disclosure to evaluate performance
9 10 7 1 104 1
9 11 5 32 4
10 8 6 2 111 2
5 16 9 23 4
19 24 15 8 139 5
12 9 3 5 3
3
2 4
5 5 5 11 3
6 7 3 2 3
5 11 5 734
7 6 7 4 43
Consumer Discretionary
Consumer Staples
Energy
Industrials
Financials
Health Care
Materials
Utilities
Telecommunications
Information Technology
Sector Analysis
Company responses to CDP can be found at www.cdproject.net
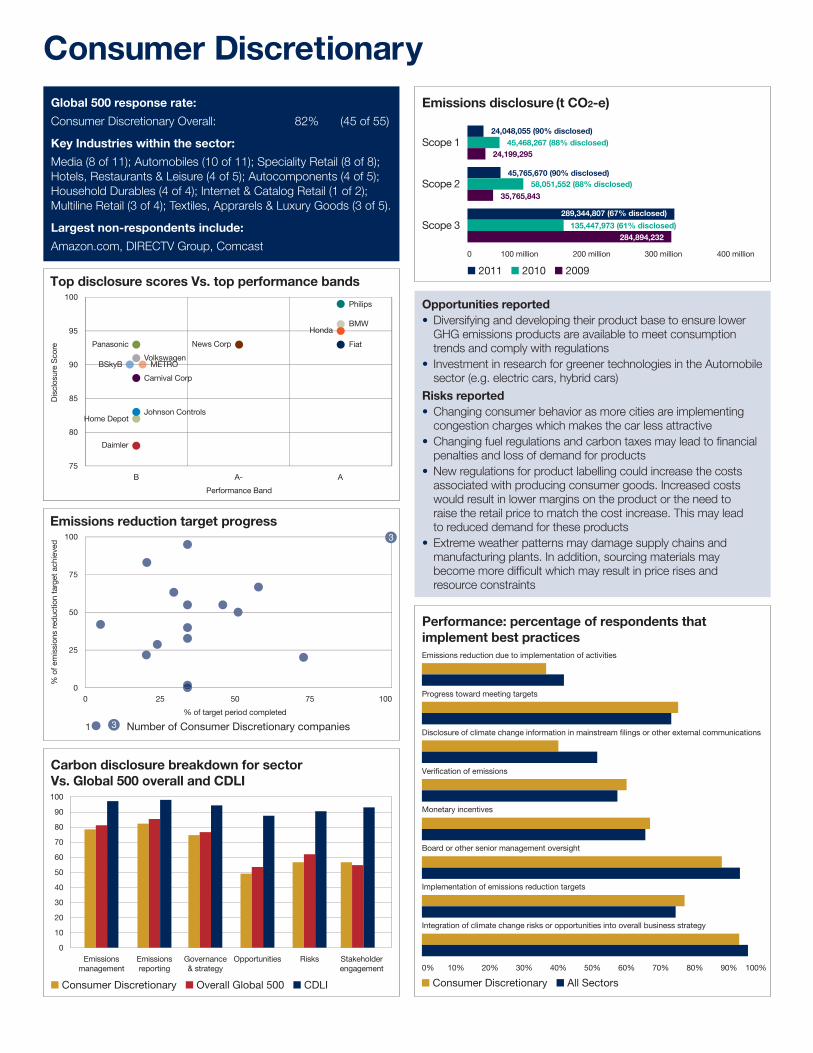
Consumer Discretionary
Opportunities reported• Diversifying and developing their product base to ensure lower
GHG emissions products are available to meet consumption trends and comply with regulations
• Investment in research for greener technologies in the Automobile sector (e.g. electric cars, hybrid cars)
Risks reported• Changing consumer behavior as more cities are implementing
congestion charges which makes the car less attractive • Changing fuel regulations and carbon taxes may lead to financial
penalties and loss of demand for products • New regulations for product labelling could increase the costs
associated with producing consumer goods. Increased costs would result in lower margins on the product or the need to raise the retail price to match the cost increase. This may lead to reduced demand for these products
• Extreme weather patterns may damage supply chains and manufacturing plants. In addition, sourcing materials may become more difficult which may result in price rises and resource constraints
Global 500 response rate:
Consumer Discretionary Overall: 82% (45 of 55)
Key Industries within the sector:
Media (8 of 11); Automobiles (10 of 11); Speciality Retail (8 of 8); Hotels, Restaurants & Leisure (4 of 5); Autocomponents (4 of 5); Household Durables (4 of 4); Internet & Catalog Retail (1 of 2); Multiline Retail (3 of 4); Textiles, Apprarels & Luxury Goods (3 of 5).
Largest non-respondents include:
Amazon.com, DIRECTV Group, Comcast
24,048,055 (90% disclosed)45,468,267 (88% disclosed)
24,199,295
Emissions disclosure (t CO2-e)
Scope 1
45,765,670 (90% disclosed)58,051,552 (88% disclosed)
35,765,843Scope 2
289,344,807 (67% disclosed)
135,447,973 (61% disclosed)284,894,232
Scope 3
0 400 million300 million200 million100 million
� 2011 � 2010 � 2009 Top disclosure scores Vs. top performance bands
Dis
clos
ure
Sco
re
B
Performance Band
A- A
100
95
90
85
80
75
BMW
News Corp
BSkyB
Fiat
Honda
Philips
Johnson Controls
METROVolkswagen
Panasonic
Home Depot
Carnival Corp
Daimler
Emissions reduction target progress
% o
f em
issi
ons
redu
ctio
n ta
rget
ach
ieve
d
0 25
% of target period completed
50 75 100
Number of Consumer Discretionary companies
100
75
50
25
0
3
3
1
Carbon disclosure breakdown for sector Vs. Global 500 overall and CDLI
Emissionsmanagement
Emissionsreporting
Governance& strategy
Opportunities Risks Stakeholderengagement
� Consumer Discretionary � Overall Global 500 � CDLI
Dis
clo
sure
sco
re r
ang
e
Global 500 CDLI Global 500 Overall Global 500 Telecommunications
Gover
nanc
eRisk
s
Oppor
tunit
ies
Strate
gy an
d ta
rget
s
Achiev
emen
ts
Emiss
ions t
radin
g
Emiss
ions i
nten
sity
and
histo
ry
Comm
unica
tions
Emiss
ions r
epor
ting
para
met
ers
Scope
s 1, 2
& 3
repo
rting
(inc.
ener
gy us
e)
100
80
60
40
20
Carbon disclosure score breakdown for Sector versus Global 500 overall and Global 500 CDLI4
100
90
80
70
60
50
40
30
20
10
0
Performance: percentage of respondents thatimplement best practices
0% 10% 20% 30% 40% 50% 60% 70% 80% 90% 100%
� Consumer Discretionary � All Sectors
Emissions reduction due to implementation of activities
Progress toward meeting targets
Disclosure of climate change information in mainstream filings or other external communications
Verification of emissions
Monetary incentives
Board or other senior management oversight
Implementation of emissions reduction targets
Integration of climate change risks or opportunities into overall business strategy
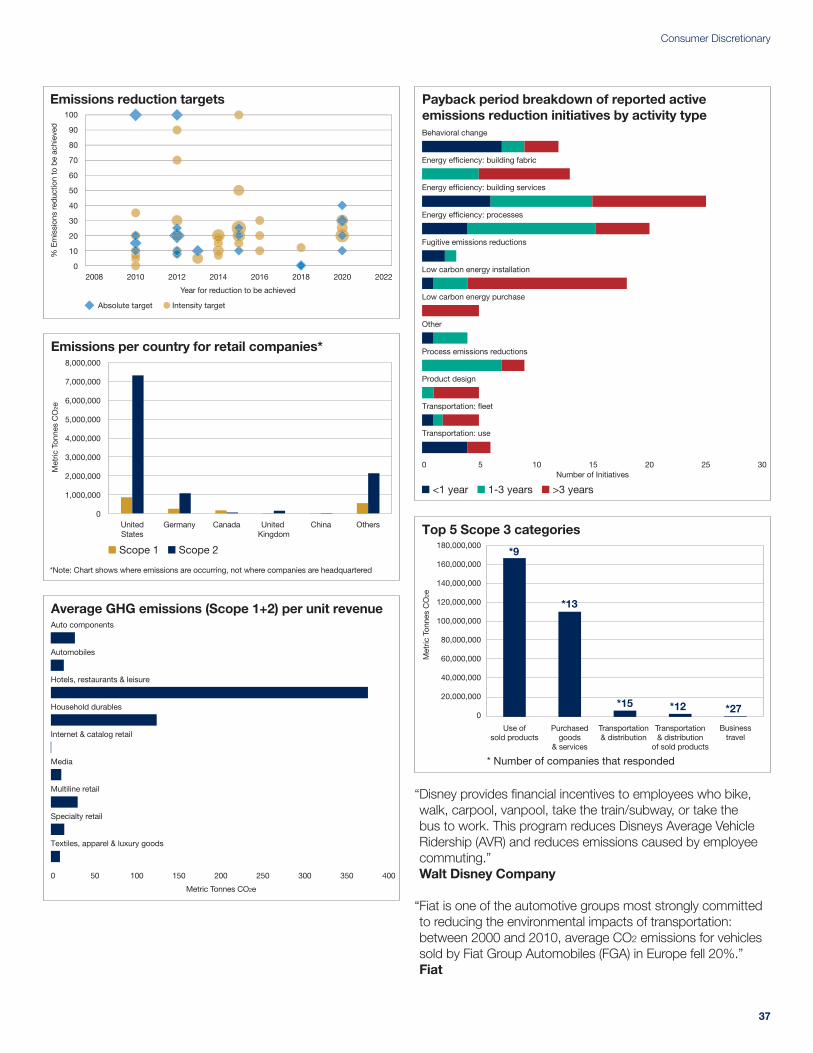
37
Consumer Discretionary
Payback period breakdown of reported active emissions reduction initiatives by activity type
Number of Initiatives300 5 10 15 20 25
� <1 year � 1-3 years � >3 years
Behavioral change
Energy efficiency: building fabric
Energy efficiency: building services
Energy efficiency: processes
Fugitive emissions reductions
Low carbon energy installation
Low carbon energy purchase
Other
Process emissions reductions
Product design
Transportation: fleet
Transportation: use
Emissions per country for retail companies*
UnitedStates
Germany
*Note: Chart shows where emissions are occurring, not where companies are headquartered
Canada United Kingdom
China Others
8,000,000
7,000,000
6,000,000
5,000,000
4,000,000
3,000,000
2,000,000
1,000,000
0
Met
ric T
onne
s C
O2e
� Scope 1 � Scope 2
Average GHG emissions (Scope 1+2) per unit revenue
4003503000 50 100 150 200 250
Metric Tonnes CO2e
Auto components
Automobiles
Hotels, restaurants & leisure
Household durables
Internet & catalog retail
Media
Multiline retail
Specialty retail
Textiles, apparel & luxury goods
Top 5 Scope 3 categories180,000,000
160,000,000
140,000,000
120,000,000
100,000,000
80,000,000
60,000,000
40,000,000
20,000,000
0
Met
ric T
onne
s C
O2e
* Number of companies that responded
Use ofsold products
Purchasedgoods
& services
Transportation& distribution
Transportation& distribution
of sold products
Businesstravel
*9
*13
*15 *12 *27
Emissions reduction targets
% E
mis
sion
s re
duct
ion
to b
e ac
hiev
ed
20102008 2012 2014
Year for reduction to be achieved
2016 2018 2020 2022
Absolute target Intensity target
100
90
80
70
60
50
40
30
20
10
0
765432
“ Disney provides financial incentives to employees who bike, walk, carpool, vanpool, take the train/subway, or take the bus to work. This program reduces Disneys Average Vehicle Ridership (AVR) and reduces emissions caused by employee commuting.” Walt Disney Company
“ Fiat is one of the automotive groups most strongly committed to reducing the environmental impacts of transportation: between 2000 and 2010, average CO2 emissions for vehicles sold by Fiat Group Automobiles (FGA) in Europe fell 20%.” Fiat
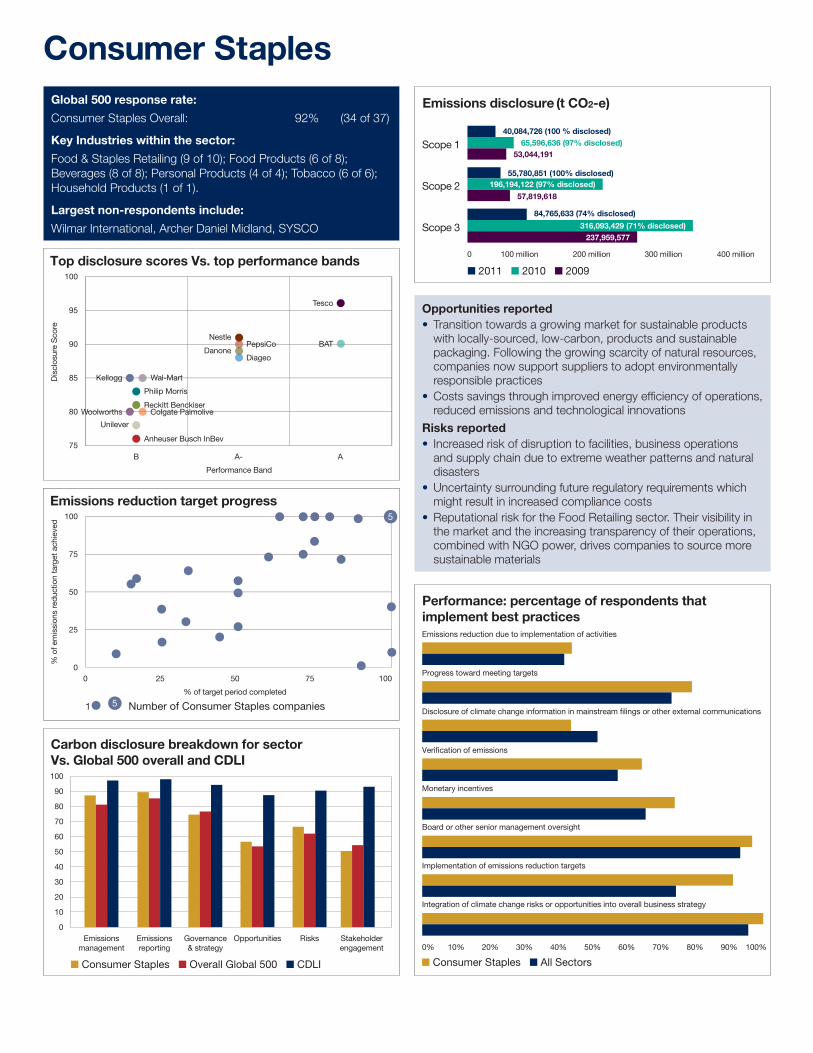
Consumer Staples
Opportunities reported• Transition towards a growing market for sustainable products
with locally-sourced, low-carbon, products and sustainable packaging. Following the growing scarcity of natural resources, companies now support suppliers to adopt environmentally responsible practices
• Costs savings through improved energy efficiency of operations, reduced emissions and technological innovations
Risks reported• Increased risk of disruption to facilities, business operations
and supply chain due to extreme weather patterns and natural disasters
• Uncertainty surrounding future regulatory requirements which might result in increased compliance costs
• Reputational risk for the Food Retailing sector. Their visibility in the market and the increasing transparency of their operations, combined with NGO power, drives companies to source more sustainable materials
40,084,726 (100 % disclosed)65,596,636 (97% disclosed)
53,044,191
Emissions disclosure (t CO2-e)
Scope 1
55,780,851 (100% disclosed)196,194,122 (97% disclosed)
57,819,618Scope 2
84,765,633 (74% disclosed)
316,093,429 (71% disclosed)237,959,577
Scope 3
0 400 million300 million200 million100 million
� 2011 � 2010 � 2009Top disclosure scores Vs. top performance bands
Dis
clos
ure
Sco
re
B
Performance Band
A- A
100
95
90
85
80
75
BAT
Tesco
DanoneDiageo
PepsiCoNestle
Anheuser Busch InBev
Colgate Palmolive
Kellogg
Philip Morris
Reckitt Benckiser
Unilever
Wal-Mart
Woolworths
Emissions reduction target progress
% o
f em
issi
ons
redu
ctio
n ta
rget
ach
ieve
d
0 25
% of target period completed
50 75 100
Number of Consumer Staples companies
100
75
50
25
0
1
5
5
Carbon disclosure breakdown for sector Vs. Global 500 overall and CDLI
Emissionsmanagement
Emissionsreporting
Governance& strategy
Opportunities Risks Stakeholderengagement
� Consumer Staples � Overall Global 500 � CDLI
Dis
clo
sure
sco
re r
ang
e
Global 500 CDLI Global 500 Overall Global 500 Telecommunications
Gover
nanc
eRisk
s
Oppor
tunit
ies
Strate
gy an
d ta
rget
s
Achiev
emen
ts
Emiss
ions t
radin
g
Emiss
ions i
nten
sity
and
histo
ry
Comm
unica
tions
Emiss
ions r
epor
ting
para
met
ers
Scope
s 1, 2
& 3
repo
rting
(inc.
ener
gy us
e)
100
80
60
40
20
Carbon disclosure score breakdown for Sector versus Global 500 overall and Global 500 CDLI4
100
90
80
70
60
50
40
30
20
10
0
Performance: percentage of respondents thatimplement best practices
0% 10% 20% 30% 40% 50% 60% 70% 80% 90% 100%
� Consumer Staples � All Sectors
Emissions reduction due to implementation of activities
Progress toward meeting targets
Disclosure of climate change information in mainstream filings or other external communications
Verification of emissions
Monetary incentives
Board or other senior management oversight
Implementation of emissions reduction targets
Integration of climate change risks or opportunities into overall business strategy
Global 500 response rate:
Consumer Staples Overall: 92% (34 of 37)
Key Industries within the sector:
Food & Staples Retailing (9 of 10); Food Products (6 of 8); Beverages (8 of 8); Personal Products (4 of 4); Tobacco (6 of 6); Household Products (1 of 1).
Largest non-respondents include:
Wilmar International, Archer Daniel Midland, SYSCO

39
Consumer Staples
Payback period breakdown of reported active emissions reduction initiatives by activity type
300 5 10 15 20 25Number of Initiatives
� <1 year � 1-3 years � >3 years
Behavioral change
Energy efficiency: building fabric
Energy efficiency: building services
Energy efficiency: processes
Fugitive emissions reductions
Low carbon energy installation
Low carbon energy purchase
Other
Process emissions reductions
Product design
Transportation: fleet
Transportation: use
9
25
� Yes � No
Number of companies reporting some Scope 3 emissions from their supply chain
Top 5 Scope 3 categories60,000,000
50,000,000
40,000,000
30,000,000
20,000,000
10,000,000
0
Tota
l Met
ric T
onne
s C
O2e
* Number of companies that responded
Total productsvalue chain
Purchasedgoods
& services
Use ofsold products
ImmediateConsumption
Equipment
Transportation &distribution ofsold products
*1
*9
*4*1
*7
Emissions reduction targets
% E
mis
sion
s re
duct
ion
to b
e ac
hiev
ed
20102008 2012 2014
Year for reduction to be achieved
2016 2018 2020 2022
Absolute target Intensity target
100
90
80
70
60
50
40
30
20
10
0
765432
“ Competitor and retailer actions to bring carbon neutral products to market may favour these products over Nestlé products in the eye of the consumers. Perceived climate change performance could have a significant impact on brand value and consumer confidence.” Nestlé
“ We have already successfully reformulated our products to reduce climate impact. For example, our concentrated laundry detergents save greenhouse gas emissions in the manufacture, packaging and transportation of the product. [..] If everyone used concentrated liquid detergent variants we would save over 4 million tonnes of CO2 per annum.” Unilever
“ On average it costs us approximately £1000 to produce a carbon footprint for one product to a new methodology, with additional costs for certification and labelling on top of this. As a global company selling tens of thousands of products ,[...] which increasingly sources on an international basis, we would incur significant additional costs if we needed to comply with a number of different national labelling standards.” Tesco
Company Low carbon solutions
Coca-Cola “ We are expanding our use of heat recovery. This works by reusing heat energy from boilers used for other production processes, so we can reduce our use of natural gas.”
Colgate Palmolive
“ Colgate has three on-site cogeneration units located in Italy, Mexico and the United States.”
Pernod-Ricard “ In Mexico, energy consumption by distilleries has been reduced by 7% by reducing the time required to start boilers, optimising their performance and preheating water using hot combustion gases from the distillation chimneys.”
Walgreens “ Walgreens opened the first drugstore nationwide to meet top environmental requirements of the US Green Building Council for efficiency and design. Four new LEED registered store construction projects were initiated in 2010.”
Woolworths “ Supermarkets energy efficiency projects for refrigeration, air conditioning and lighting.”

Energy
Opportunities reported• International market-based trading mechanism provides an
opportunity to invest in renewable energy and energy efficiency projects
• Energy sector companies could generate additional revenue if they are able to reduce emissions at a marginal cost that would be below the cost of allowances
• Fuel and energy taxes and regulations may stimulate the demand for bio fuels and renewable energy
Risks reported• Uncertainty surrounding future changes in post-Kyoto regulation,
including increased costs due to the introduction of carbon taxes• Optimistic emissions reduction commitment by EU ETS phase III
may result in significant cost implications for all the Energy sector companies. Similarly, introduction of Cap and Trade schemes may impose cost burden if emissions exceed the permissible limit
• Increased frequency of extreme events: ice conditions in the North Sea, wave conditions and cyclones in tropical areas, force companies to focus on climate change adaptation of new projects
979,144,045 (100% disclosed)869,686,948 (97% disclosed)
828,511,028
Emissions disclosure (t CO2-e)
Scope 1
96,875,926 (88% disclosed)95,566,980 (89% disclosed)
89,106,856
Scope 2
3,179,645,704 (60% disclosed)
3,427,500,898 (47% disclosed)3,047,362,659
Scope 3
0 4 billion 3 billion 2 billion 1 billion
� 2011 � 2010 � 2009Top disclosure scores Vs. top performance bands
Dis
clos
ure
Sco
re
B
Performance Band
A- A
100
95
90
85
80
75
Shell
BG
Eni SpA
Suncor Energy
Schlumberger
Hess
Total
xxx
xxx
xxx
xxx
xxx
xxx
xxx
xxx
xxx
xxx
xxx
xxx
xxx
xxx
xxx
Chevron
Repsol YPF
BP
Emissions reduction target progress
% o
f em
issi
ons
redu
ctio
n ta
rget
ach
ieve
d
0 25
% of target period completed
50 75 100
Number of Energy companies
100
75
50
25
0
1
8
8
Carbon disclosure breakdown for sector Vs. Global 500 overall and CDLI
Emissionsmanagement
Emissionsreporting
Governance& strategy
Opportunities Risks Stakeholderengagement
� Energy � Overall Global 500 � CDLI
Dis
clo
sure
sco
re r
ang
e
Global 500 CDLI Global 500 Overall Global 500 Telecommunications
Gover
nanc
eRisk
s
Oppor
tunit
ies
Strate
gy an
d ta
rget
s
Achiev
emen
ts
Emiss
ions t
radin
g
Emiss
ions i
nten
sity
and
histo
ry
Comm
unica
tions
Emiss
ions r
epor
ting
para
met
ers
Scope
s 1, 2
& 3
repo
rting
(inc.
ener
gy us
e)
100
80
60
40
20
Carbon disclosure score breakdown for Sector versus Global 500 overall and Global 500 CDLI4
100
90
80
70
60
50
40
30
20
10
0
Performance: percentage of respondents thatimplement best practices
0% 10% 20% 30% 40% 50% 60% 70% 80% 90% 100%
� Energy � All Sectors
Emissions reduction due to implementation of activities
Progress toward meeting targets
Disclosure of climate change information in mainstream filings or other external communications
Verification of emissions
Monetary incentives
Board or other senior management oversight
Implementation of emissions reduction targets
Integration of climate change risks or opportunities into overall business strategy
Global 500 response rate:
Energy Overall: 75% (40 of 53)
Key Industries within the sector:
Oil, Gas & Consumable Fuels ( 35 of 46); Energy Equipment & Services (5 of 7).
Largest non-respondents include:
Rosneft, Surgutneftegas, Lukoil
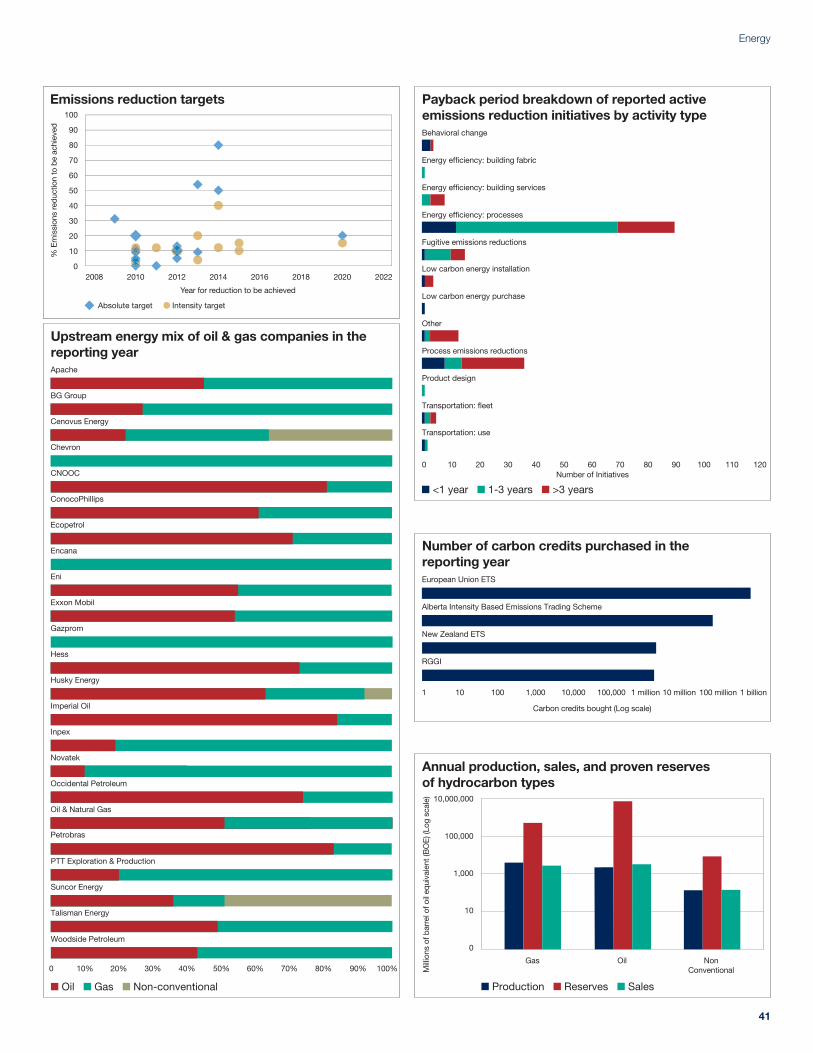
41
Energy
Number of Initiatives
� <1 year � 1-3 years � >3 years
Payback period breakdown of reported active emissions reduction initiatives by activity type
12070 80 90 100 110600 10 20 30 40 50
Behavioral change
Energy efficiency: building fabric
Energy efficiency: building services
Energy efficiency: processes
Fugitive emissions reductions
Low carbon energy installation
Low carbon energy purchase
Other
Process emissions reductions
Product design
Transportation: fleet
Transportation: use
Number of carbon credits purchased in the reporting yearEuropean Union ETS
Alberta Intensity Based Emissions Trading Scheme
New Zealand ETS
RGGI
100 million 1 billion10 million1 million1 10 100 1,000 10,000 100,000
Carbon credits bought (Log scale)
Annual production, sales, and proven reserves of hydrocarbon types
Gas Oil NonConventional
� Production � Reserves � Sales
10,000,000
100,000
1,000
10
0
Mill
ions
of b
arre
l of o
il eq
uiva
lent
(BO
E) (
Log
scal
e)
� Oil � Gas � Non-conventional
100%0 10% 20% 30% 40% 50% 60% 70% 80% 90%
Upstream energy mix of oil & gas companies in the reporting yearApache
BG Group
Cenovus Energy
Chevron
Encana
Gazprom
Hess
Occidental Petroleum
Petrobras
Oil & Natural Gas
Novatek
Inpex
Imperial Oil
Husky Energy
Exxon Mobil
Eni
Ecopetrol
ConocoPhillips
CNOOC
PTT Exploration & Production
Suncor Energy
Talisman Energy
Woodside Petroleum
Emissions reduction targets
% E
mis
sion
s re
duct
ion
to b
e ac
hiev
ed
20102008 2012 2014
Year for reduction to be achieved
2016 2018 2020 2022
Absolute target Intensity target
100
90
80
70
60
50
40
30
20
10
0
765432
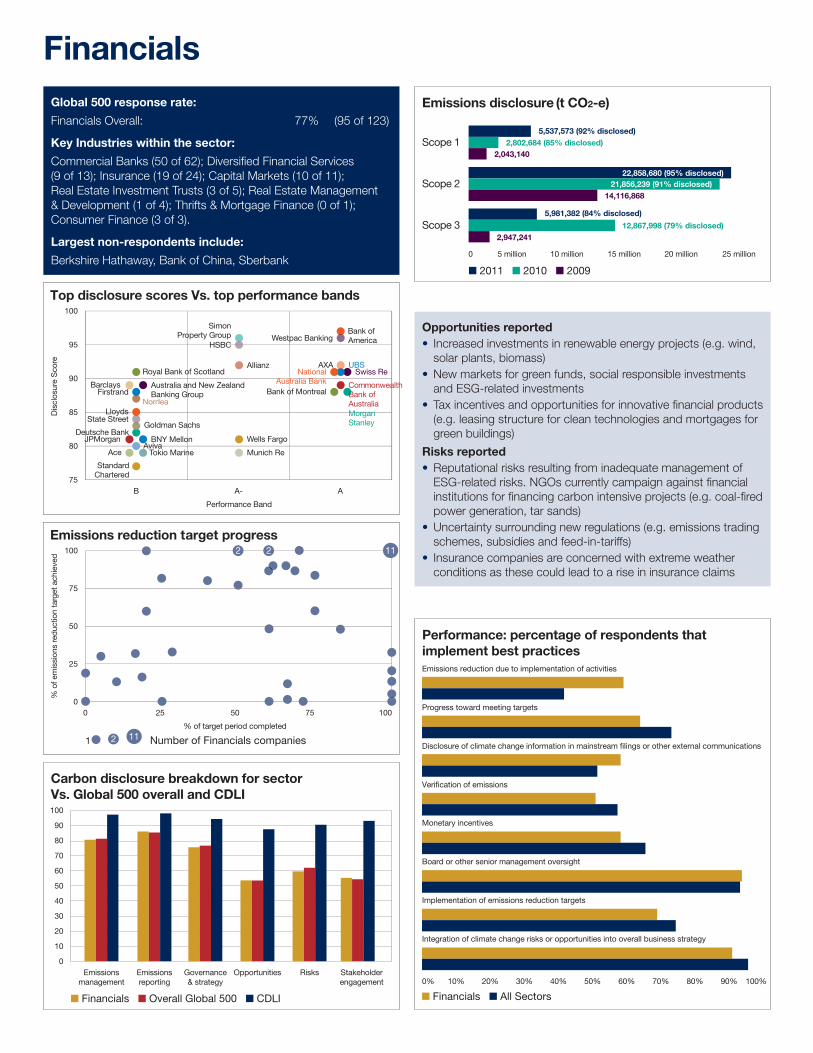
Financials
Opportunities reported• Increased investments in renewable energy projects (e.g. wind,
solar plants, biomass)• New markets for green funds, social responsible investments
and ESG-related investments • Tax incentives and opportunities for innovative financial products
(e.g. leasing structure for clean technologies and mortgages for green buildings)
Risks reported• Reputational risks resulting from inadequate management of
ESG-related risks. NGOs currently campaign against financial institutions for financing carbon intensive projects (e.g. coal-fired power generation, tar sands)
• Uncertainty surrounding new regulations (e.g. emissions trading schemes, subsidies and feed-in-tariffs)
• Insurance companies are concerned with extreme weather conditions as these could lead to a rise in insurance claims
5,537,573 (92% disclosed) 2,802,684 (85% disclosed)
2,043,140
Emissions disclosure (t CO2-e)
Scope 1
22,858,680 (95% disclosed)21,856,239 (91% disclosed)
XX,XXX,XXXScope 2
5,981,382 (84% disclosed)
12,867,998 (79% disclosed)2,947,241
14,116,868
Scope 3
0 25 million20 million15 million10 million5 million
� 2011 � 2010 � 2009
Top disclosure scores Vs. top performance bands
Dis
clos
ure
Sco
re
B
Performance Band
A- A
100
95
90
85
80
75
HSBC
Bank of Montreal
AXA
Bank of America
BNY Mellon
Allianz
Munich Re
Wells Fargo
SimonProperty Groupxxx
xxx
xxx
xxx
xxx
xxx
xxx
xxx
xxx
xxx
xxx
xxx
xxx
xxx
xxx
CommonwealthBank of AustraliaMorgan Stanley
NationalAustralia Bank
Swiss ReUBS
Westpac Banking
Goldman Sachs
Royal Bank of Scotland
StandardChartered
Tokio MarineAviva
LloydsState Street
FirstrandNordea
Barclays
JPMorgan
d
Ace
Deutsche Bank
Australia and New Zealand Banking Group
Emissions reduction target progress
% o
f em
issi
ons
redu
ctio
n ta
rget
ach
ieve
d
0 25
% of target period completed
50 75 100
Number of Financials companies
100
75
50
25
0
1 2 11
112 2
Carbon disclosure breakdown for sector Vs. Global 500 overall and CDLI
Emissionsmanagement
Emissionsreporting
Governance& strategy
Opportunities Risks Stakeholderengagement
� Financials � Overall Global 500 � CDLI
Dis
clo
sure
sco
re r
ang
e
Global 500 CDLI Global 500 Overall Global 500 Telecommunications
Gover
nanc
eRisk
s
Oppor
tunit
ies
Strate
gy an
d ta
rget
s
Achiev
emen
ts
Emiss
ions t
radin
g
Emiss
ions i
nten
sity
and
histo
ry
Comm
unica
tions
Emiss
ions r
epor
ting
para
met
ers
Scope
s 1, 2
& 3
repo
rting
(inc.
ener
gy us
e)
100
80
60
40
20
Carbon disclosure score breakdown for Sector versus Global 500 overall and Global 500 CDLI4
100
90
80
70
60
50
40
30
20
10
0
Performance: percentage of respondents thatimplement best practices
0% 10% 20% 30% 40% 50% 60% 70% 80% 90% 100%
� Financials � All Sectors
Emissions reduction due to implementation of activities
Progress toward meeting targets
Disclosure of climate change information in mainstream filings or other external communications
Verification of emissions
Monetary incentives
Board or other senior management oversight
Implementation of emissions reduction targets
Integration of climate change risks or opportunities into overall business strategy
Global 500 response rate:
Financials Overall: 77% (95 of 123)
Key Industries within the sector:
Commercial Banks (50 of 62); Diversified Financial Services (9 of 13); Insurance (19 of 24); Capital Markets (10 of 11); Real Estate Investment Trusts (3 of 5); Real Estate Management & Development (1 of 4); Thrifts & Mortgage Finance (0 of 1); Consumer Finance (3 of 3).
Largest non-respondents include:
Berkshire Hathaway, Bank of China, Sberbank
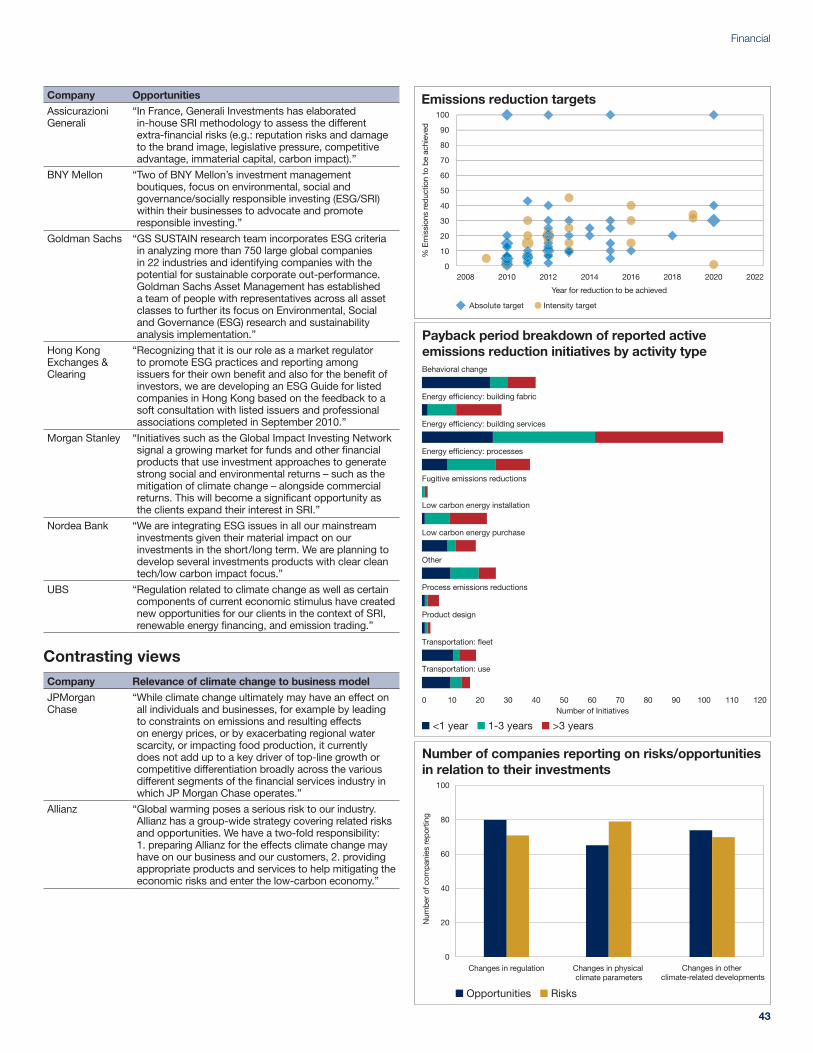
43
Financial
Number of Initiatives
� <1 year � 1-3 years � >3 years
Payback period breakdown of reported active emissions reduction initiatives by activity type
12070 80 90 100 110600 10 20 30 40 50
Behavioral change
Energy efficiency: building fabric
Energy efficiency: building services
Energy efficiency: processes
Fugitive emissions reductions
Low carbon energy installation
Low carbon energy purchase
Other
Process emissions reductions
Product design
Transportation: fleet
Transportation: use
Number of companies reporting on risks/opportunities in relation to their investments
100
80
60
40
20
0
Num
ber
of c
ompa
nies
rep
ortin
g
� Opportunities � Risks
Changes in regulation Changes in physical climate parameters
Changes in other climate-related developments
Emissions reduction targets
% E
mis
sion
s re
duct
ion
to b
e ac
hiev
ed
20102008 2012 2014
Year for reduction to be achieved
2016 2018 2020 2022
Absolute target Intensity target
100
90
80
70
60
50
40
30
20
10
0
765432
Company Opportunities
Assicurazioni Generali
“ In France, Generali Investments has elaborated in-house SRI methodology to assess the different extra-financial risks (e.g.: reputation risks and damage to the brand image, legislative pressure, competitive advantage, immaterial capital, carbon impact).”
BNY Mellon “ Two of BNY Mellon’s investment management boutiques, focus on environmental, social and governance/socially responsible investing (ESG/SRI) within their businesses to advocate and promote responsible investing.”
Goldman Sachs “ GS SUSTAIN research team incorporates ESG criteria in analyzing more than 750 large global companies in 22 industries and identifying companies with the potential for sustainable corporate out-performance. Goldman Sachs Asset Management has established a team of people with representatives across all asset classes to further its focus on Environmental, Social and Governance (ESG) research and sustainability analysis implementation.”
Hong Kong Exchanges & Clearing
“ Recognizing that it is our role as a market regulator to promote ESG practices and reporting among issuers for their own benefit and also for the benefit of investors, we are developing an ESG Guide for listed companies in Hong Kong based on the feedback to a soft consultation with listed issuers and professional associations completed in September 2010.”
Morgan Stanley “ Initiatives such as the Global Impact Investing Network signal a growing market for funds and other financial products that use investment approaches to generate strong social and environmental returns – such as the mitigation of climate change – alongside commercial returns. This will become a significant opportunity as the clients expand their interest in SRI.”
Nordea Bank “ We are integrating ESG issues in all our mainstream investments given their material impact on our investments in the short/long term. We are planning to develop several investments products with clear clean tech/low carbon impact focus.”
UBS “ Regulation related to climate change as well as certain components of current economic stimulus have created new opportunities for our clients in the context of SRI, renewable energy financing, and emission trading.”
Company Relevance of climate change to business model
JPMorgan Chase
“ While climate change ultimately may have an effect on all individuals and businesses, for example by leading to constraints on emissions and resulting effects on energy prices, or by exacerbating regional water scarcity, or impacting food production, it currently does not add up to a key driver of top-line growth or competitive differentiation broadly across the various different segments of the financial services industry in which JP Morgan Chase operates.”
Allianz “ Global warming poses a serious risk to our industry. Allianz has a group-wide strategy covering related risks and opportunities. We have a two-fold responsibility: 1. preparing Allianz for the effects climate change may have on our business and our customers, 2. providing appropriate products and services to help mitigating the economic risks and enter the low-carbon economy.”
Contrasting views

Health Care
Opportunities reported• Changes in frequency of extreme weather conditions will
present companies with opportunities that include the need for greater disease prevention and more patient treatments
• Innovation in product packaging to lower carbon footprint e.g. inhalers
• Financial benefit from selling excess permits in Cap and Trade schemes
• Cost savings from increased energy efficiency in buildings
Risks reported• Regulatory pressure placed on both Health Care providers and
pharmaceutical companies. Potential caps on production for carbon intensive pharmaceuticals
• Reduced availability of raw materials due to the loss of biodiversity
• Disruption of supply chains due to extreme weather• Water scarcity causing disruption to manufacturing processes• Potential difficulties on carrying products labelling due to the
abundance of substances and products
14,038,998 (97% disclosed)14,027,278 (93% disclosed)
12,957,238
Emissions disclosure (t CO2-e)
Scope 1
16,472,768 (97% disclosed)16,481,522 (93% disclosed)
15,785,705Scope 2
48,578,250 (71% disclosed)
43,528,794 (69% disclosed)30,585,607
Scope 3
0 40 million 50 million 60 million30 million20 million10 million
� 2011 � 2010 � 2009Top disclosure scores Vs. top performance bands
Dis
clos
ure
Sco
re
B
Performance Band
A- A
100
95
90
85
80
75
Novartis
Bayer
xxx
xxx
xxx
xxx
xxx
xxx
xxx
xxx
xxx
xxx
xxx
xxx
GSK
Allergan
Genzyme
Merck & Co
Pfizer
Gilead Sciences
Novo Nordisk
Emissions reduction target progress
% o
f em
issi
ons
redu
ctio
n ta
rget
ach
ieve
d
0 25
% of target period completed
50 75 100
Number of Health Care companies
100
75
50
25
0
1 2
2
Carbon disclosure breakdown for sector Vs. Global 500 overall and CDLI
Emissionsmanagement
Emissionsreporting
Governance& strategy
Opportunities Risks Stakeholderengagement
� Health Care � Overall Global 500 � CDLI
Dis
clo
sure
sco
re r
ang
e
Global 500 CDLI Global 500 Overall Global 500 Telecommunications
Gover
nanc
eRisk
s
Oppor
tunit
ies
Strate
gy an
d ta
rget
s
Achiev
emen
ts
Emiss
ions t
radin
g
Emiss
ions i
nten
sity
and
histo
ry
Comm
unica
tions
Emiss
ions r
epor
ting
para
met
ers
Scope
s 1, 2
& 3
repo
rting
(inc.
ener
gy us
e)
100
80
60
40
20
Carbon disclosure score breakdown for Sector versus Global 500 overall and Global 500 CDLI4
100
90
80
70
60
50
40
30
20
10
0
Performance: percentage of respondents thatimplement best practices
0% 10% 20% 30% 40% 50% 60% 70% 80% 90% 100%
� Health Care � All Sectors
Emissions reduction due to implementation of activities
Progress toward meeting targets
Disclosure of climate change information in mainstream filings or other external communications
Verification of emissions
Monetary incentives
Board or other senior management oversight
Implementation of emissions reduction targets
Integration of climate change risks or opportunities into overall business strategy
Global 500 response rate:
Health Care Overall: 91% (31 of 34)
Key Industries within the sector:
Pharmaceuticals (17 of 17); Biotechnology (5 of 5); Health Care Equipment & Supplies (4 of 6); Health Care Providers & Services (4 of 5); Life Sciences Tools & Services (1 of 1).
Largest non-respondents include:
Alcon, Express Scripts, Stryker

45
Health Care
Payback period breakdown of reported active emissions reduction initiatives by activity type
4035300 5 10 15 20 25Number of Initiatives
� <1 year � 1-3 years � >3 years
Behavioral change
Energy efficiency: building fabric
Energy efficiency: building services
Energy efficiency: processes
Low carbon energy installation
Low carbon energy purchase
Other
Process emissions reductions
Product design
Transportation: fleet
Transportation: use
Top 5 Scope 3 categories20,000,000
18,000,000
16,000,000
14,000,000
12,000,000
10,000,000
8,000,000
6,000,000
4,000,000
2,000,000
0
Met
ric T
onne
s C
O2e
* Number of companies that responded
Purchasedgoods andservices
End of lifetreatment of
sold products
Use of soldproducts
Business travel Supplier emissions
*5
*4
*6
*24 *5
Emissions reduction targets
% E
mis
sion
s re
duct
ion
to b
e ac
hiev
ed
20102008 2012 2014
Year for reduction to be achieved
2016 2018 2020 2022
Absolute target Intensity target
100
90
80
70
60
50
40
30
20
10
0
765432
Company Low carbon solutions
Baxter International
“ Baxter Product Sustainability Reviews help customers avoid certain product-related GHG emissions. The design stage is an opportunity to influence a product’s environmental, health and safety performance across the entire product life cycle, including energy efficiency and reduced generation of GHG emissions.”
Becton, Dickinson and Co.
“ We introduced the BD ecoFinity Life Cycle Solution as a way to recycle sharps waste and recover materials for new products. These efforts help our hospital customers reduce their Scope 3 emissions.”
Celgene “ We are actively involved in developing and delivering more effective in-home oral cancer therapies which offer the possibility of significantly reducing the GHG emissions generated by patients travelling to and from hospitals worldwide.”
CSL “ CSL’s manufacturing facility in Bern, exports heat to a nearby sports stadium and a school. This represents an on-going savings of 500 tonnes of CO2 emissions per annum. Waste head space ethanol from the distillation process at CSL’s Bern facility is fed into fouling sludge at the town’s wastewater treatment plant where it contributes to the production of gas for the town’s gas supply.”
Thermo Fisher Scientific
“ Thermo Fisher biological safety cabinets, ultra-low temperature lab freezers and other electric-powered equipment are designed for exceptional energy efficiency, resulting in reduced CO2 emissions and lower operating costs. The Fisher Scientific catalog offers customers an Environmentally Friendly Product Guide containing products that meet one or more of 11 green standards, such as energy efficiency and recycled content.”
“ The rising awareness of climate change issues and the emergence of green consumers are further boosting the demand for GHG abatement solutions. This trend impacts Bayer’s business by creating additional market and revenue opportunities.” Bayer AG
“ Besides its eco-friendly operations and green products, the Company also works with customers, industry and the scientific community to advance environmental management and science. The Company’s goal is strong partnerships that support all sustainability initiatives, for example: decision support tools from the Company, such as a carbon calculator and chemical conversion chart, help our customers facilitate process change and chemical replacement opportunities.” Thermo Fisher Scientific
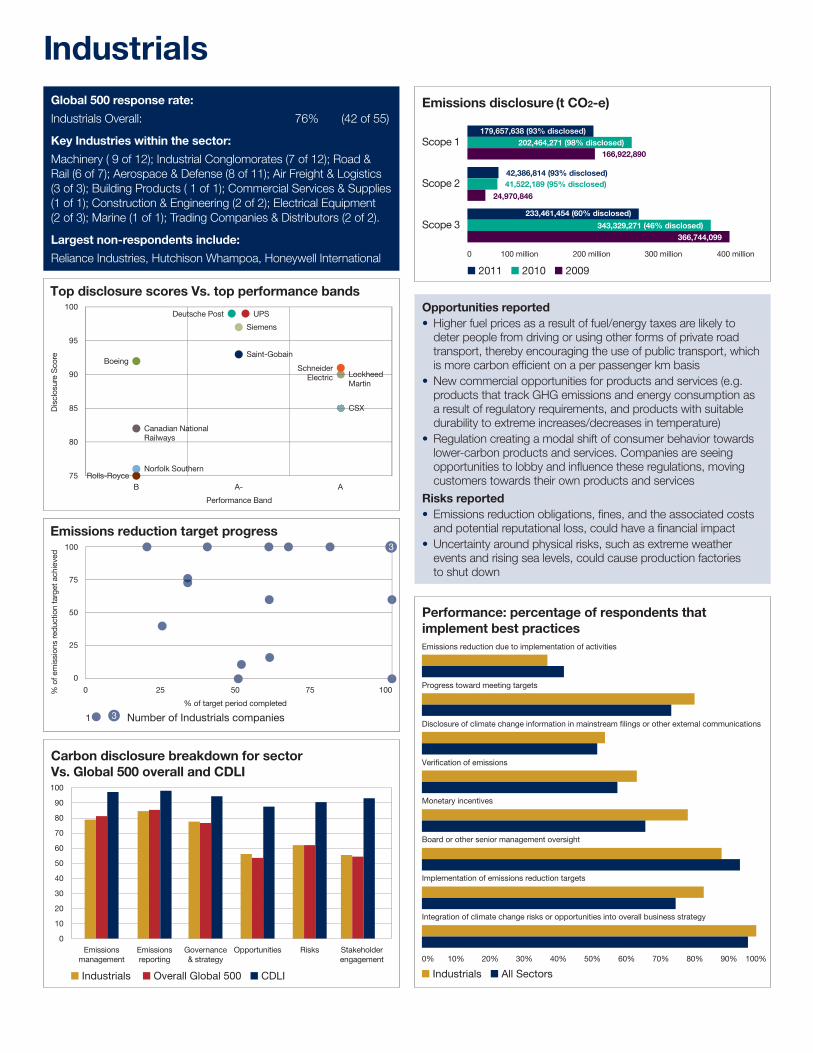
Industrials
179,657,638 (93% disclosed)202,464,271 (98% disclosed)
166,922,890
Emissions disclosure (t CO2-e)
Scope 1
42,386,814 (93% disclosed)41,522,189 (95% disclosed)
24,970,846
Scope 2
233,461,454 (60% disclosed)
343,329,271 (46% disclosed)366,744,099
Scope 3
0 400 million300 million200 million100 million
� 2011 � 2010 � 2009
Top disclosure scores Vs. top performance bands
Dis
clos
ure
Sco
re
B
Performance Band
A- A
100
95
90
85
80
75
Lockheed Martin
SchneiderElectric
xxx
xxx
xxx
xxx
xxx
xxx
xxx
xxx
xxx
xxx
xxx
xxx
UPS
CSX
Norfolk SouthernRolls-Royce
Boeing
Canadian National Railways
Saint-Gobain
Deutsche Post
Siemens
Emissions reduction target progress
% o
f em
issi
ons
redu
ctio
n ta
rget
ach
ieve
d
0 25
% of target period completed
50 75 100
Number of Industrials companies
100
75
50
25
0
1
3
3
Carbon disclosure breakdown for sector Vs. Global 500 overall and CDLI
Emissionsmanagement
Emissionsreporting
Governance& strategy
Opportunities Risks Stakeholderengagement
� Industrials � Overall Global 500 � CDLI
Dis
clo
sure
sco
re r
ang
e
Global 500 CDLI Global 500 Overall Global 500 Telecommunications
Gover
nanc
eRisk
s
Oppor
tunit
ies
Strate
gy an
d ta
rget
s
Achiev
emen
ts
Emiss
ions t
radin
g
Emiss
ions i
nten
sity
and
histo
ry
Comm
unica
tions
Emiss
ions r
epor
ting
para
met
ers
Scope
s 1, 2
& 3
repo
rting
(inc.
ener
gy us
e)
100
80
60
40
20
Carbon disclosure score breakdown for Sector versus Global 500 overall and Global 500 CDLI4
100
90
80
70
60
50
40
30
20
10
0
Performance: percentage of respondents thatimplement best practices
0% 10% 20% 30% 40% 50% 60% 70% 80% 90% 100%
� Industrials � All Sectors
Emissions reduction due to implementation of activities
Progress toward meeting targets
Disclosure of climate change information in mainstream filings or other external communications
Verification of emissions
Monetary incentives
Board or other senior management oversight
Implementation of emissions reduction targets
Integration of climate change risks or opportunities into overall business strategy
Global 500 response rate:
Industrials Overall: 76% (42 of 55)
Key Industries within the sector:
Machinery ( 9 of 12); Industrial Conglomorates (7 of 12); Road & Rail (6 of 7); Aerospace & Defense (8 of 11); Air Freight & Logistics (3 of 3); Building Products ( 1 of 1); Commercial Services & Supplies (1 of 1); Construction & Engineering (2 of 2); Electrical Equipment (2 of 3); Marine (1 of 1); Trading Companies & Distributors (2 of 2).
Largest non-respondents include:
Reliance Industries, Hutchison Whampoa, Honeywell International
Opportunities reported• Higher fuel prices as a result of fuel/energy taxes are likely to
deter people from driving or using other forms of private road transport, thereby encouraging the use of public transport, which is more carbon efficient on a per passenger km basis
• New commercial opportunities for products and services (e.g. products that track GHG emissions and energy consumption as a result of regulatory requirements, and products with suitable durability to extreme increases/decreases in temperature)
• Regulation creating a modal shift of consumer behavior towards lower-carbon products and services. Companies are seeing opportunities to lobby and influence these regulations, moving customers towards their own products and services
Risks reported• Emissions reduction obligations, fines, and the associated costs
and potential reputational loss, could have a financial impact • Uncertainty around physical risks, such as extreme weather
events and rising sea levels, could cause production factories to shut down
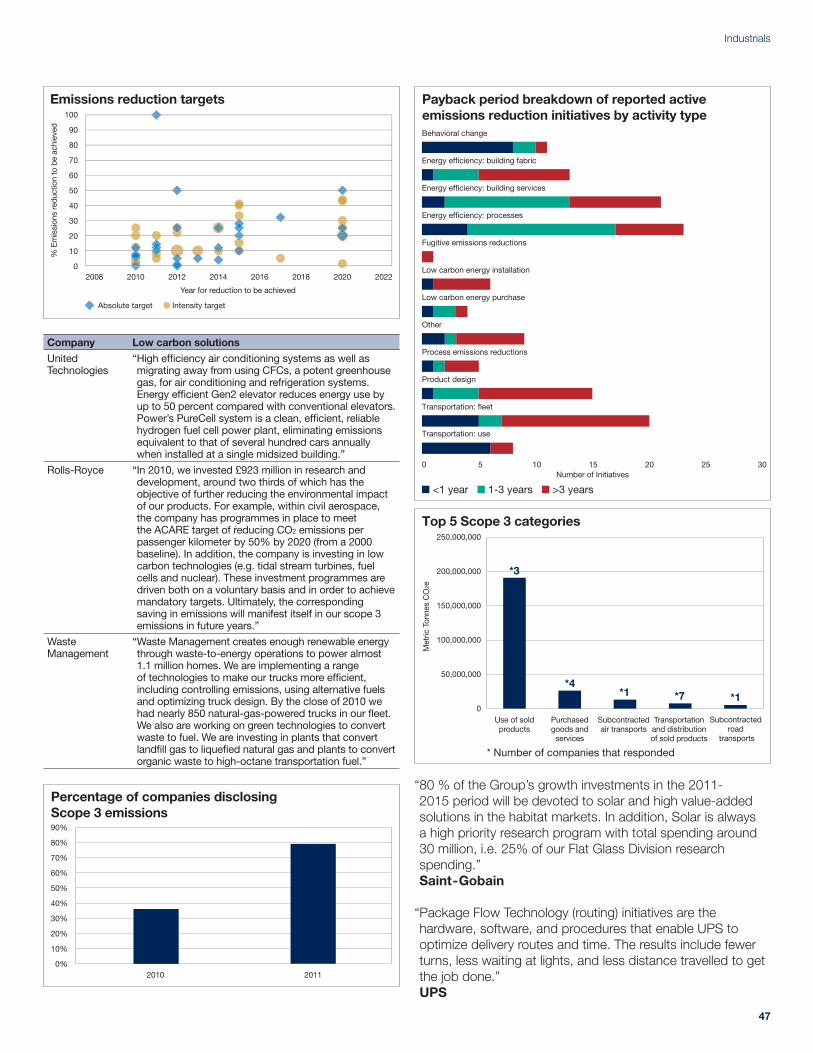
47
Industrials
Number of Initiatives
� <1 year � 1-3 years � >3 years
Payback period breakdown of reported active emissions reduction initiatives by activity type
300 5 10 15 20 25
Behavioral change
Energy efficiency: building fabric
Energy efficiency: building services
Energy efficiency: processes
Fugitive emissions reductions
Low carbon energy installation
Low carbon energy purchase
Other
Process emissions reductions
Product design
Transportation: fleet
Transportation: use
Top 5 Scope 3 categories250,000,000
200,000,000
150,000,000
100,000,000
50,000,000
0
Met
ric T
onne
s C
O2e
* Number of companies that responded
Use of soldproducts
Purchasedgoods andservices
Subcontractedair transports
Transportationand distributionof sold products
Subcontracted road
transports
*3
*4*1 *7 *1
Emissions reduction targets
% E
mis
sion
s re
duct
ion
to b
e ac
hiev
ed
20102008 2012 2014
Year for reduction to be achieved
2016 2018 2020 2022
Absolute target Intensity target
100
90
80
70
60
50
40
30
20
10
0
765432
Company Low carbon solutions
United Technologies
“ High efficiency air conditioning systems as well as migrating away from using CFCs, a potent greenhouse gas, for air conditioning and refrigeration systems. Energy efficient Gen2 elevator reduces energy use by up to 50 percent compared with conventional elevators. Power’s PureCell system is a clean, efficient, reliable hydrogen fuel cell power plant, eliminating emissions equivalent to that of several hundred cars annually when installed at a single midsized building.”
Rolls-Royce “ In 2010, we invested £923 million in research and development, around two thirds of which has the objective of further reducing the environmental impact of our products. For example, within civil aerospace, the company has programmes in place to meet the ACARE target of reducing CO2 emissions per passenger kilometer by 50% by 2020 (from a 2000 baseline). In addition, the company is investing in low carbon technologies (e.g. tidal stream turbines, fuel cells and nuclear). These investment programmes are driven both on a voluntary basis and in order to achieve mandatory targets. Ultimately, the corresponding saving in emissions will manifest itself in our scope 3 emissions in future years.”
Waste Management
“ Waste Management creates enough renewable energy through waste-to-energy operations to power almost 1.1 million homes. We are implementing a range of technologies to make our trucks more efficient, including controlling emissions, using alternative fuels and optimizing truck design. By the close of 2010 we had nearly 850 natural-gas-powered trucks in our fleet. We also are working on green technologies to convert waste to fuel. We are investing in plants that convert landfill gas to liquefied natural gas and plants to convert organic waste to high-octane transportation fuel.”
“ 80 % of the Group’s growth investments in the 2011-2015 period will be devoted to solar and high value-added solutions in the habitat markets. In addition, Solar is always a high priority research program with total spending around 30 million, i.e. 25% of our Flat Glass Division research spending.” Saint-Gobain
“ Package Flow Technology (routing) initiatives are the hardware, software, and procedures that enable UPS to optimize delivery routes and time. The results include fewer turns, less waiting at lights, and less distance travelled to get the job done.” UPS
Percentage of companies disclosing Scope 3 emissions 90%
80%
70%
60%
50%
40%
30%
20%
10%
0%2010 2011
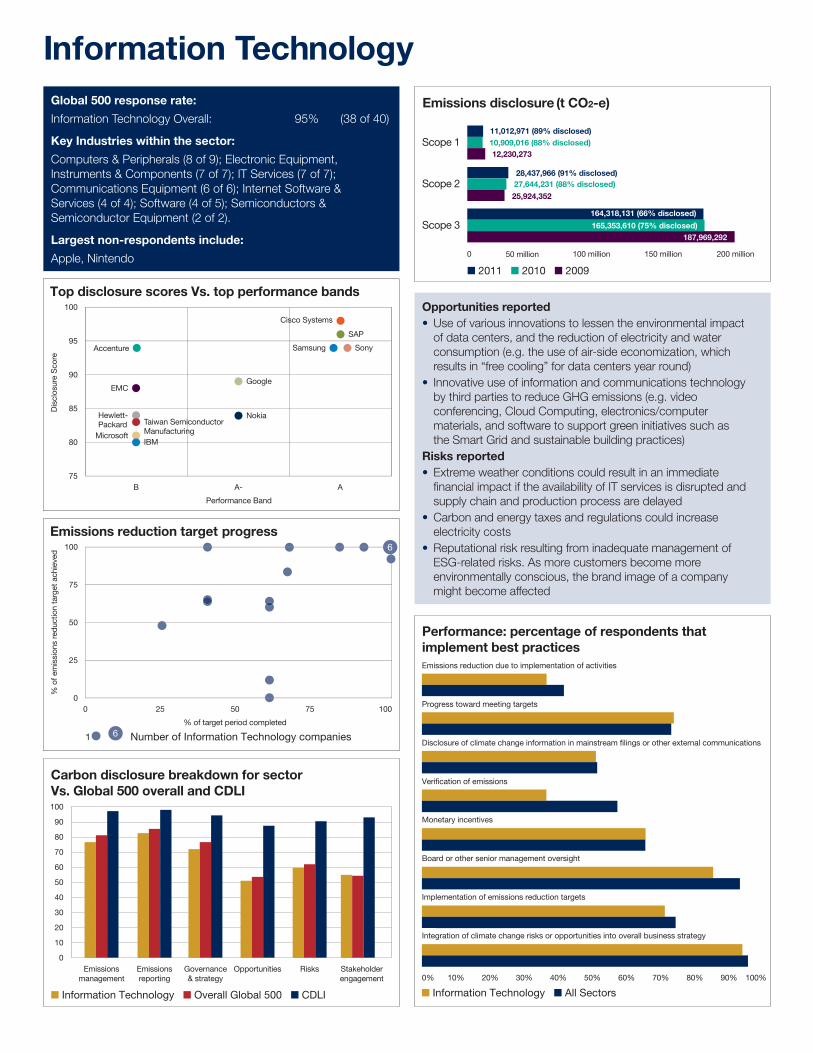
Information Technology
Opportunities reported• Use of various innovations to lessen the environmental impact
of data centers, and the reduction of electricity and water consumption (e.g. the use of air-side economization, which results in “free cooling” for data centers year round)
• Innovative use of information and communications technology by third parties to reduce GHG emissions (e.g. video conferencing, Cloud Computing, electronics/computer materials, and software to support green initiatives such as the Smart Grid and sustainable building practices)
Risks reported• Extreme weather conditions could result in an immediate
financial impact if the availability of IT services is disrupted and supply chain and production process are delayed
• Carbon and energy taxes and regulations could increase electricity costs
• Reputational risk resulting from inadequate management of ESG-related risks. As more customers become more environmentally conscious, the brand image of a company might become affected
11,012,971 (89% disclosed)10,909,016 (88% disclosed)12,230,273
Emissions disclosure (t CO2-e)
Scope 1
28,437,966 (91% disclosed)27,644,231 (88% disclosed)
25,924,352Scope 2
164,318,131 (66% disclosed)
165,353,610 (75% disclosed)187,969,292
Scope 3
0 200 million150 million100 million50 million
� 2011 � 2010 � 2009
Top disclosure scores Vs. top performance bands
Dis
clos
ure
Sco
re
B
Performance Band
A- A
100
95
90
85
80
75
SAP
Cisco Systems
xxx
xxx
xxx
xxx
xxx
xxx
xxx
xxx
xxx
xxx
xxx
xxx
Sony
Taiwan Semiconductor Manufacturing
Samsung
IBMMicrosoft
EMC
Hewlett-Packard
Nokia
Accenture
Emissions reduction target progress
% o
f em
issi
ons
redu
ctio
n ta
rget
ach
ieve
d
0 25
% of target period completed
50 75 100
Number of Information Technology companies
100
75
50
25
0
1
6
6
Carbon disclosure breakdown for sector Vs. Global 500 overall and CDLI
Emissionsmanagement
Emissionsreporting
Governance& strategy
Opportunities Risks Stakeholderengagement
� Information Technology � Overall Global 500 � CDLI
Dis
clo
sure
sco
re r
ang
e
Global 500 CDLI Global 500 Overall Global 500 Telecommunications
Gover
nanc
eRisk
s
Oppor
tunit
ies
Strate
gy an
d ta
rget
s
Achiev
emen
ts
Emiss
ions t
radin
g
Emiss
ions i
nten
sity
and
histo
ry
Comm
unica
tions
Emiss
ions r
epor
ting
para
met
ers
Scope
s 1, 2
& 3
repo
rting
(inc.
ener
gy us
e)
100
80
60
40
20
Carbon disclosure score breakdown for Sector versus Global 500 overall and Global 500 CDLI4
100
90
80
70
60
50
40
30
20
10
0
Performance: percentage of respondents thatimplement best practices
0% 10% 20% 30% 40% 50% 60% 70% 80% 90% 100%
� Information Technology � All Sectors
Emissions reduction due to implementation of activities
Progress toward meeting targets
Disclosure of climate change information in mainstream filings or other external communications
Verification of emissions
Monetary incentives
Board or other senior management oversight
Implementation of emissions reduction targets
Integration of climate change risks or opportunities into overall business strategy
Global 500 response rate:
Information Technology Overall: 95% (38 of 40)
Key Industries within the sector:
Computers & Peripherals (8 of 9); Electronic Equipment, Instruments & Components (7 of 7); IT Services (7 of 7); Communications Equipment (6 of 6); Internet Software & Services (4 of 4); Software (4 of 5); Semiconductors & Semiconductor Equipment (2 of 2).
Largest non-respondents include:
Apple, Nintendo
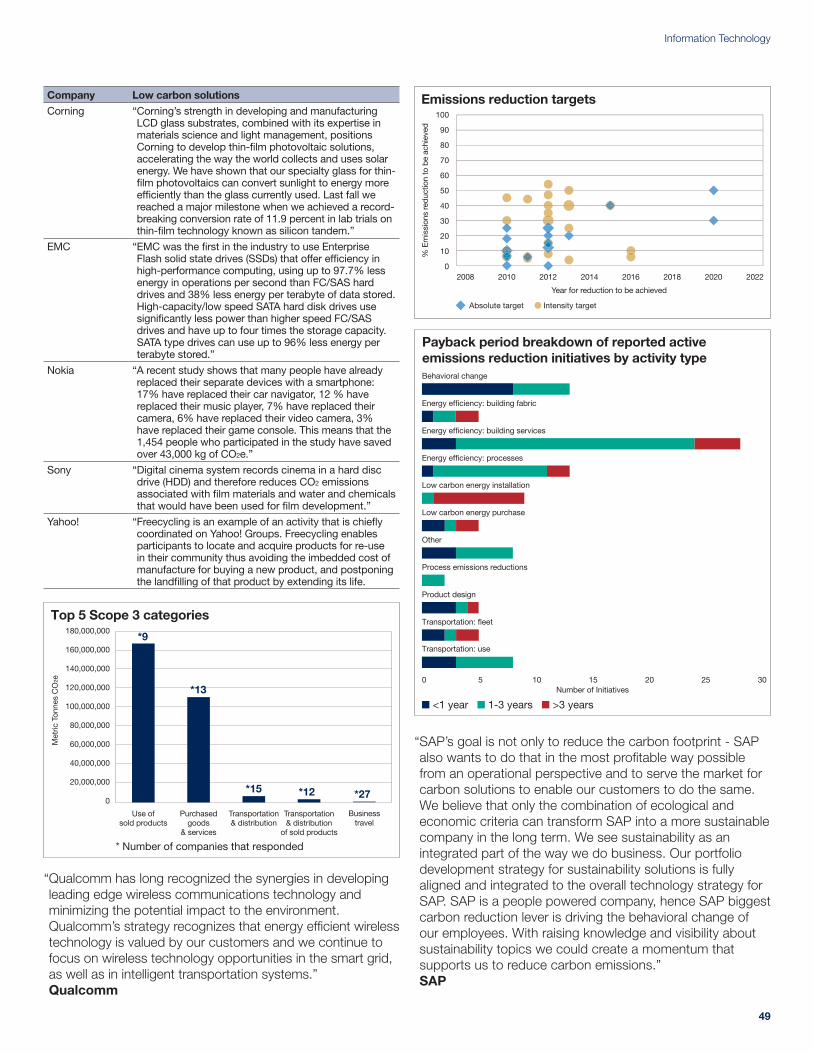
49
Information Technology
Payback period breakdown of reported active emissions reduction initiatives by activity type
300 5 10 15 20 25
� <1 year � 1-3 years � >3 years
Number of Initiatives
Behavioral change
Energy efficiency: building fabric
Energy efficiency: building services
Energy efficiency: processes
Low carbon energy installation
Low carbon energy purchase
Other
Process emissions reductions
Product design
Transportation: fleet
Transportation: use
Top 5 Scope 3 categories180,000,000
160,000,000
140,000,000
120,000,000
100,000,000
80,000,000
60,000,000
40,000,000
20,000,000
0
Met
ric T
onne
s C
O2e
* Number of companies that responded
Use ofsold products
Purchasedgoods
& services
Transportation& distribution
Transportation& distribution
of sold products
Businesstravel
*9
*13
*15 *12 *27
Emissions reduction targets
% E
mis
sion
s re
duct
ion
to b
e ac
hiev
ed
2008 2010 2012 2014
Year for reduction to be achieved
2016 2018 2020 2022
Absolute target Intensity target
100
90
80
70
60
50
40
30
20
10
0
765432
Company Low carbon solutions
Corning “ Corning’s strength in developing and manufacturing LCD glass substrates, combined with its expertise in materials science and light management, positions Corning to develop thin-film photovoltaic solutions, accelerating the way the world collects and uses solar energy. We have shown that our specialty glass for thin-film photovoltaics can convert sunlight to energy more efficiently than the glass currently used. Last fall we reached a major milestone when we achieved a record-breaking conversion rate of 11.9 percent in lab trials on thin-film technology known as silicon tandem.”
EMC “ EMC was the first in the industry to use Enterprise Flash solid state drives (SSDs) that offer efficiency in high-performance computing, using up to 97.7% less energy in operations per second than FC/SAS hard drives and 38% less energy per terabyte of data stored. High-capacity/low speed SATA hard disk drives use significantly less power than higher speed FC/SAS drives and have up to four times the storage capacity. SATA type drives can use up to 96% less energy per terabyte stored.”
Nokia “ A recent study shows that many people have already replaced their separate devices with a smartphone: 17% have replaced their car navigator, 12 % have replaced their music player, 7% have replaced their camera, 6% have replaced their video camera, 3% have replaced their game console. This means that the 1,454 people who participated in the study have saved over 43,000 kg of CO2e.”
Sony “ Digital cinema system records cinema in a hard disc drive (HDD) and therefore reduces CO2 emissions associated with film materials and water and chemicals that would have been used for film development.”
Yahoo! “ Freecycling is an example of an activity that is chiefly coordinated on Yahoo! Groups. Freecycling enables participants to locate and acquire products for re-use in their community thus avoiding the imbedded cost of manufacture for buying a new product, and postponing the landfilling of that product by extending its life.
“ SAP’s goal is not only to reduce the carbon footprint - SAP also wants to do that in the most profitable way possible from an operational perspective and to serve the market for carbon solutions to enable our customers to do the same. We believe that only the combination of ecological and economic criteria can transform SAP into a more sustainable company in the long term. We see sustainability as an integrated part of the way we do business. Our portfolio development strategy for sustainability solutions is fully aligned and integrated to the overall technology strategy for SAP. SAP is a people powered company, hence SAP biggest carbon reduction lever is driving the behavioral change of our employees. With raising knowledge and visibility about sustainability topics we could create a momentum that supports us to reduce carbon emissions.” SAP
“ Qualcomm has long recognized the synergies in developing leading edge wireless communications technology and minimizing the potential impact to the environment. Qualcomm’s strategy recognizes that energy efficient wireless technology is valued by our customers and we continue to focus on wireless technology opportunities in the smart grid, as well as in intelligent transportation systems.” Qualcomm
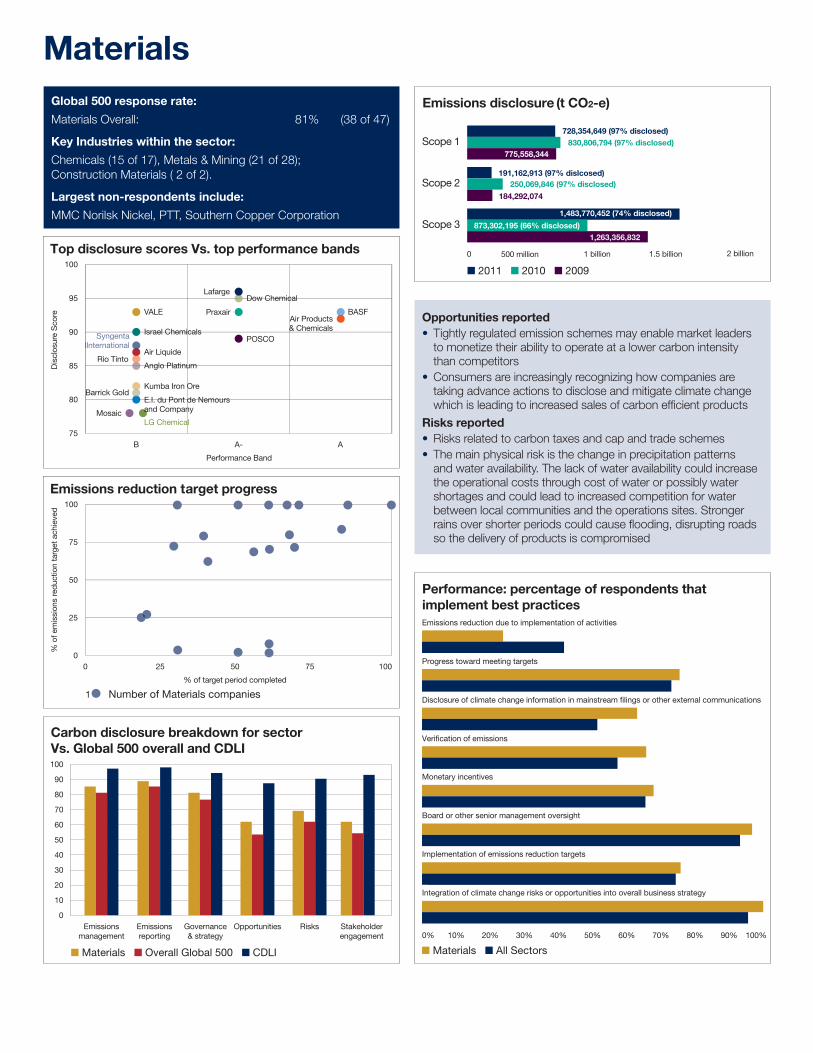
Materials
Opportunities reported• Tightly regulated emission schemes may enable market leaders
to monetize their ability to operate at a lower carbon intensity than competitors
• Consumers are increasingly recognizing how companies are taking advance actions to disclose and mitigate climate change which is leading to increased sales of carbon efficient products
Risks reported• Risks related to carbon taxes and cap and trade schemes• The main physical risk is the change in precipitation patterns
and water availability. The lack of water availability could increase the operational costs through cost of water or possibly water shortages and could lead to increased competition for water between local communities and the operations sites. Stronger rains over shorter periods could cause flooding, disrupting roads so the delivery of products is compromised
728,354,649 (97% disclosed)830,806,794 (97% disclosed)
775,558,344
Emissions disclosure (t CO2-e)
Scope 1
191,162,913 (97% dislcosed) 250,069,846 (97% disclosed)
184,292,074
Scope 2
1,483,770,452 (74% disclosed)
873,302,195 (66% disclosed)1,263,356,832
Scope 3
0 2 billion1.5 billion1 billion500 million
� 2011 � 2010 � 2009
Top disclosure scores Vs. top performance bands
Dis
clos
ure
Sco
re
B
Performance Band
A- A
100
95
90
85
80
75
Dow Chemical
Air Products& Chemicals
Lafarge
Rio Tinto
Syngenta International
VALE
Air Liquide
Anglo Platinum
BASF
Barrick Gold
Mosaic
Kumba Iron Ore
LG Chemical
Israel ChemicalsPOSCO
Praxair
E.I. du Pont de Nemours and Company
Emissions reduction target progress
% o
f em
issi
ons
redu
ctio
n ta
rget
ach
ieve
d
0 25
% of target period completed
50 75 100
Number of Materials companies
100
75
50
25
0
1
Carbon disclosure breakdown for sector Vs. Global 500 overall and CDLI
Emissionsmanagement
Emissionsreporting
Governance& strategy
Opportunities Risks Stakeholderengagement
� Materials � Overall Global 500 � CDLI
Dis
clo
sure
sco
re r
ang
e
Global 500 CDLI Global 500 Overall Global 500 Telecommunications
Gover
nanc
eRisk
s
Oppor
tunit
ies
Strate
gy an
d ta
rget
s
Achiev
emen
ts
Emiss
ions t
radin
g
Emiss
ions i
nten
sity
and
histo
ry
Comm
unica
tions
Emiss
ions r
epor
ting
para
met
ers
Scope
s 1, 2
& 3
repo
rting
(inc.
ener
gy us
e)
100
80
60
40
20
Carbon disclosure score breakdown for Sector versus Global 500 overall and Global 500 CDLI4
100
90
80
70
60
50
40
30
20
10
0
Performance: percentage of respondents thatimplement best practices
0% 10% 20% 30% 40% 50% 60% 70% 80% 90% 100%
� Materials � All Sectors
Emissions reduction due to implementation of activities
Progress toward meeting targets
Disclosure of climate change information in mainstream filings or other external communications
Verification of emissions
Monetary incentives
Board or other senior management oversight
Implementation of emissions reduction targets
Integration of climate change risks or opportunities into overall business strategy
Global 500 response rate:
Materials Overall: 81% (38 of 47)
Key Industries within the sector:
Chemicals (15 of 17), Metals & Mining (21 of 28); Construction Materials ( 2 of 2).
Largest non-respondents include:
MMC Norilsk Nickel, PTT, Southern Copper Corporation
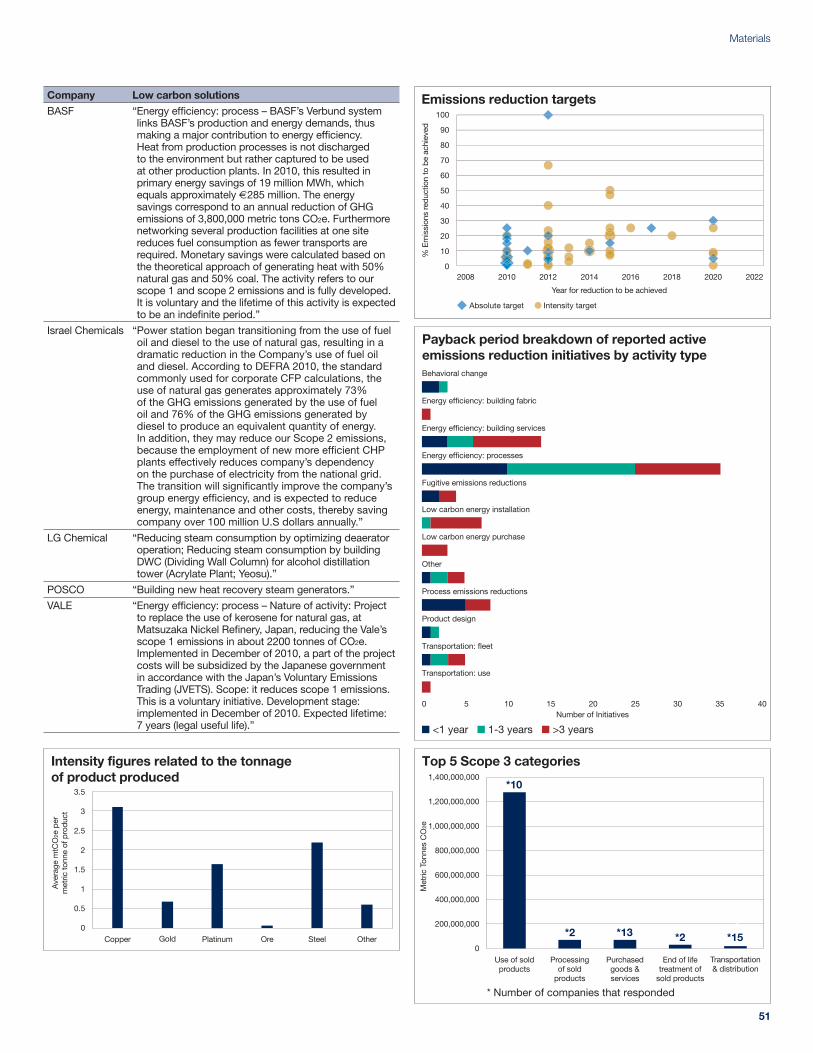
51
Materials
Number of Initiatives
� <1 year � 1-3 years � >3 years
Payback period breakdown of reported active emissions reduction initiatives by activity type
4035300 5 10 15 20 25
Behavioral change
Energy efficiency: building fabric
Energy efficiency: building services
Energy efficiency: processes
Fugitive emissions reductions
Low carbon energy installation
Low carbon energy purchase
Other
Process emissions reductions
Product design
Transportation: fleet
Transportation: use
Top 5 Scope 3 categories1,400,000,000
1,200,000,000
1,000,000,000
800,000,000
600,000,000
400,000,000
200,000,000
0
Met
ric T
onne
s C
O2e
* Number of companies that responded
Use of soldproducts
Processingof sold
products
Purchasedgoods &services
End of lifetreatment of
sold products
Transportation& distribution
*10
*2 *13 *2*7
*15
Intensity figures related to the tonnage of product produced
3.5
3
2.5
2
1.5
1
0.5
0
Ave
rage
mtC
O2e
per
met
ric to
nne
of p
rodu
ct
Copper Platinum Ore OtherSteelGold
Emissions reduction targets
% E
mis
sion
s re
duct
ion
to b
e ac
hiev
ed
20102008 2012 2014
Year for reduction to be achieved
2016 2018 2020 2022
Absolute target Intensity target
100
90
80
70
60
50
40
30
20
10
0
765432
Company Low carbon solutions
BASF “ Energy efficiency: process – BASF’s Verbund system links BASF’s production and energy demands, thus making a major contribution to energy efficiency. Heat from production processes is not discharged to the environment but rather captured to be used at other production plants. In 2010, this resulted in primary energy savings of 19 million MWh, which equals approximately e285 million. The energy savings correspond to an annual reduction of GHG emissions of 3,800,000 metric tons CO2e. Furthermore networking several production facilities at one site reduces fuel consumption as fewer transports are required. Monetary savings were calculated based on the theoretical approach of generating heat with 50% natural gas and 50% coal. The activity refers to our scope 1 and scope 2 emissions and is fully developed. It is voluntary and the lifetime of this activity is expected to be an indefinite period.”
Israel Chemicals “ Power station began transitioning from the use of fuel oil and diesel to the use of natural gas, resulting in a dramatic reduction in the Company’s use of fuel oil and diesel. According to DEFRA 2010, the standard commonly used for corporate CFP calculations, the use of natural gas generates approximately 73% of the GHG emissions generated by the use of fuel oil and 76% of the GHG emissions generated by diesel to produce an equivalent quantity of energy. In addition, they may reduce our Scope 2 emissions, because the employment of new more efficient CHP plants effectively reduces company’s dependency on the purchase of electricity from the national grid. The transition will significantly improve the company’s group energy efficiency, and is expected to reduce energy, maintenance and other costs, thereby saving company over 100 million U.S dollars annually.”
LG Chemical “ Reducing steam consumption by optimizing deaerator operation; Reducing steam consumption by building DWC (Dividing Wall Column) for alcohol distillation tower (Acrylate Plant; Yeosu).”
POSCO “ Building new heat recovery steam generators.”
VALE “ Energy efficiency: process – Nature of activity: Project to replace the use of kerosene for natural gas, at Matsuzaka Nickel Refinery, Japan, reducing the Vale’s scope 1 emissions in about 2200 tonnes of CO2e. Implemented in December of 2010, a part of the project costs will be subsidized by the Japanese government in accordance with the Japan’s Voluntary Emissions Trading (JVETS). Scope: it reduces scope 1 emissions. This is a voluntary initiative. Development stage: implemented in December of 2010. Expected lifetime: 7 years (legal useful life).”
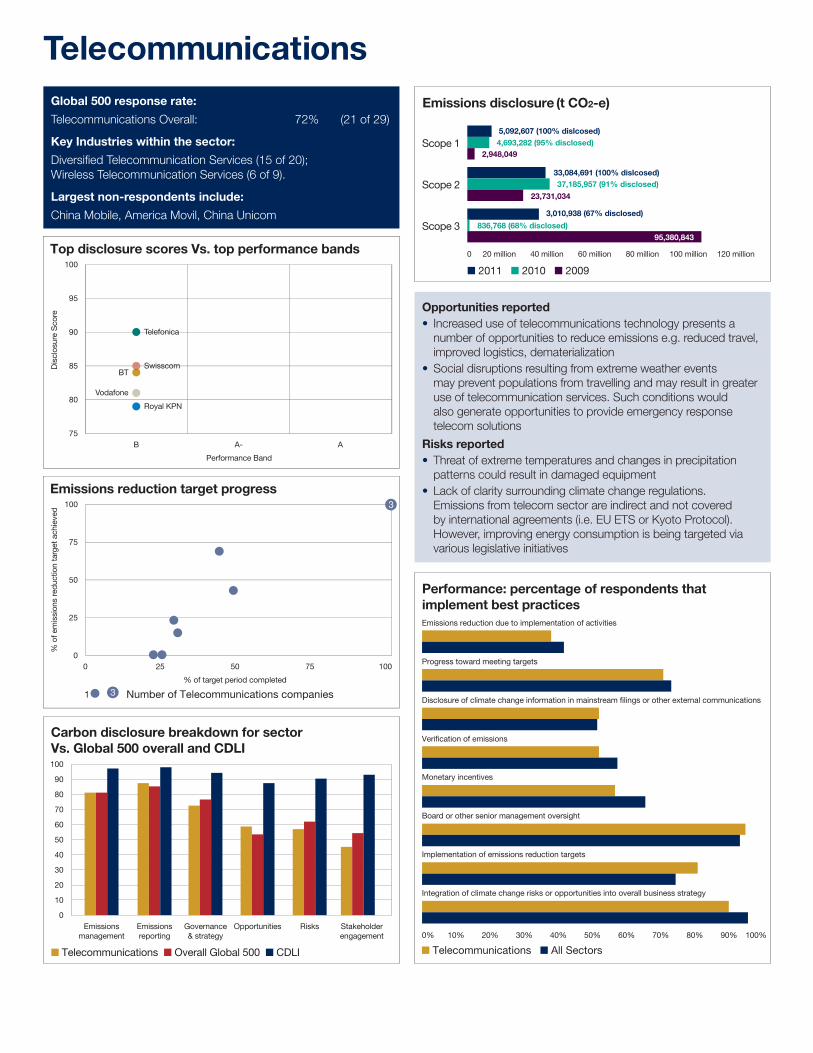
Telecommunications
Opportunities reported• Increased use of telecommunications technology presents a
number of opportunities to reduce emissions e.g. reduced travel, improved logistics, dematerialization
• Social disruptions resulting from extreme weather events may prevent populations from travelling and may result in greater use of telecommunication services. Such conditions would also generate opportunities to provide emergency response telecom solutions
Risks reported• Threat of extreme temperatures and changes in precipitation
patterns could result in damaged equipment • Lack of clarity surrounding climate change regulations.
Emissions from telecom sector are indirect and not covered by international agreements (i.e. EU ETS or Kyoto Protocol). However, improving energy consumption is being targeted via various legislative initiatives
5,092,607 (100% dislcosed)4,693,282 (95% disclosed)
2,948,049
Emissions disclosure (t CO2-e)
Scope 1
33,084,691 (100% dislcosed)37,185,957 (91% disclosed)
23,731,034Scope 2
3,010,938 (67% disclosed)
836,768 (68% disclosed)95,380,843
Scope 3
0 80 million 100 million 120 million60 million40 million20 million
� 2011 � 2010 � 2009
Top disclosure scores Vs. top performance bands
Dis
clos
ure
Sco
re
B
Performance Band
A- A
100
95
90
85
80
75
SwisscomBT
Vodafone
Royal KPN
Telefonica
Emissions reduction target progress
% o
f em
issi
ons
redu
ctio
n ta
rget
ach
ieve
d
0 25
% of target period completed
50 75 100
Number of Telecommunications companies
100
75
50
25
0
31
3
Carbon disclosure breakdown for sector Vs. Global 500 overall and CDLI
Emissionsmanagement
Emissionsreporting
Governance& strategy
Opportunities Risks Stakeholderengagement
� Telecommunications � Overall Global 500 � CDLI
Dis
clo
sure
sco
re r
ang
e
Global 500 CDLI Global 500 Overall Global 500 Telecommunications
Gover
nanc
eRisk
s
Oppor
tunit
ies
Strate
gy an
d ta
rget
s
Achiev
emen
ts
Emiss
ions t
radin
g
Emiss
ions i
nten
sity
and
histo
ry
Comm
unica
tions
Emiss
ions r
epor
ting
para
met
ers
Scope
s 1, 2
& 3
repo
rting
(inc.
ener
gy us
e)
100
80
60
40
20
Carbon disclosure score breakdown for Sector versus Global 500 overall and Global 500 CDLI4
100
90
80
70
60
50
40
30
20
10
0
Performance: percentage of respondents thatimplement best practices
0% 10% 20% 30% 40% 50% 60% 70% 80% 90% 100%
� Telecommunications � All Sectors
Emissions reduction due to implementation of activities
Progress toward meeting targets
Disclosure of climate change information in mainstream filings or other external communications
Verification of emissions
Monetary incentives
Board or other senior management oversight
Implementation of emissions reduction targets
Integration of climate change risks or opportunities into overall business strategy
Global 500 response rate:
Telecommunications Overall: 72% (21 of 29)
Key Industries within the sector:
Diversified Telecommunication Services (15 of 20); Wireless Telecommunication Services (6 of 9).
Largest non-respondents include:
China Mobile, America Movil, China Unicom

53
Telecommunications
Payback period breakdown of reported active emissions reduction initiatives by activity type
300 5 10 15 20 25Number of Initiatives
� <1 year � 1-3 years � >3 years
Behavioral change
Energy efficiency: building fabric
Energy efficiency: building services
Energy efficiency: processes
Fugitive emissions reductions
Low carbon energy installation
Low carbon energy purchase
Other
Product design
Transportation: fleet
Transportation: use
Top 5 Scope 3 categories2,500,000
2,000,000
1,500,000
1,000,000
500,000
0
Met
ric T
onne
s C
O2e
* Number of companies that responded
Investments(not inc. in Scope 1/2)
Businesstravel
Fuel & energyrelated activities
(not inc. in Scope 1/2)
Employeecommuting
Purchased goods &services
*1
*15*2
*4 *2
Breakdown of Scope 2 emissions
12,000
10,000
8000
6000
4000
2000
0
Thou
sand
s m
t CO
2e
Integrated Telecommunication Services
Wireless Telecommunication Services
Emissions reduction targets
% E
mis
sion
s re
duct
ion
to b
e ac
hiev
ed
20102008 2012 2014
Year for reduction to be achieved
2016 2018 20222020
Absolute target Intensity target
100
90
80
70
60
50
40
30
20
10
0
765432
Company Low carbon solutions
American Tower “ Service offering one generator set with the capacity to service all carriers at a site. In the past, each carrier at a wireless tower site would leased space for and located in our compound a backup power generator for purpose of servicing their equipment only. With the introduction of this service, it allows a reduction in the aggregate Scope 1 emissions.”
AT&T “ 1) Decreasing energy-intensive travel through telecommuting, teleconferencing and other services; 2) Providing centralized data management, Internet, communications and software service for customers; 3) Dematerializing public and commercial activities through electronic billing, 4) online provision of governmental services and online delivery of goods and services, such as education, libraries, research, medicine, videos and music; 5) Rationalizing transportation and distribution systems using next-generation dispatching and planning software combined with satellite-based GPS systems; 6) Improving energy efficiency in commercial and residential buildings through more sophisticated monitoring and dispatching systems for more accurate control and delivery of energy.”
France Telecom “ Orange has developed innovative remote monitoring services based on M2M ( Machine to Machine) connectivity; making it possible to carry out various types of operation remotely: remote meter reading (gas; water; etc.); remote stock management; supply chain automation; remote management and maintenance of manufacturing equipment; remote management of public infrastructure (lighting).”
Vodafone “ 1) Smart metering Wireless M2M smart meters deployed across the energy distribution network monitor energy losses and the network’s load capacity. This helps utility companies to locate areas where energy is being lost, and minimise energy shortages and power outages. Smart meters also support the sale of excess energy from small-scale renewable energy generators (such as rooftop solar panels or wind turbines) to the grid. Utility companies can keep track of the amount of electricity fed into the grid from individual locations remotely via M2M mobile connections. 2) Smart logistics Remote tracking systems: Wireless, GPRS-enabled vehicle tracking devices feed data about each vehicle’s position and the latest traffic information into a centralised fleet management system. This then generates routes that cover the shortest distance and alerts drivers about optimum driving speeds.”

Utilities
Opportunities reported• Limits on air pollution (roadside or in urban areas) and carbon
emissions reduction targets could stimulate demand for non-emitting (at point of use) products such as electric vehicles, electric cookers and boilers which will, in turn, increase demand for electricity
• Ageing coal and nuclear power stations could be replaced with renewable energy, new gas and nuclear stations
• Droughts and water shortages may stimulate demand for water related industries such as desalinization and water recycling, which, in turn, would stimulate demand for electricity
Risks reported• Extreme weather conditions could affect operations (e.g.
transmission cables are impacted by higher temperatures and greater electricity use during extreme heat. In addition, generating plant, which are usually in proximity of water, will be most susceptible to storm surges and rises in sea level)
• Increased environmental constraints related to air quality and increased scope of regulation to include additional GHGs (CH4, N2O, HFC, PFC, SF6)
1,262,726,728 (100% disclosed)2,113,822,024 (100% disclosed)
1,749,216,897
Emissions disclosure (t CO2-e)
Scope 1
23,368,400 (90% disclosed)49,327,560 (69% disclosed)
127,486,932
Scope 2
487,258,429 (75% disclosed)
766,997,107 (72% disclosed)247,317,204
Scope 3
0 3 billion2 billion1 billion
� 2011 � 2010 � 2009Top disclosure scores Vs. top performance bands
Dis
clos
ure
Sco
re
B
Performance Band
A- A
100
95
90
85
80
75
Centrica
CLP Holdings
E.ON AG
RWE AG
PG&E Corporation
GDF SuezEndesa
Fortum Oyj
ENEL SpA
Emissions reduction target progress
% o
f em
issi
ons
redu
ctio
n ta
rget
ach
ieve
d
0 25
% of target period completed
50 75 100
Number of Utilities companies
100
75
50
25
0
1 2
2
Carbon disclosure breakdown for sector Vs. Global 500 overall and CDLI
Emissionsmanagement
Emissionsreporting
Governance& strategy
Opportunities Risks Stakeholderengagement
� Utilities � Overall Global 500 � CDLI
Dis
clo
sure
sco
re r
ang
e
Global 500 CDLI Global 500 Overall Global 500 Telecommunications
Gover
nanc
eRisk
s
Oppor
tunit
ies
Strate
gy an
d ta
rget
s
Achiev
emen
ts
Emiss
ions t
radin
g
Emiss
ions i
nten
sity
and
histo
ry
Comm
unica
tions
Emiss
ions r
epor
ting
para
met
ers
Scope
s 1, 2
& 3
repo
rting
(inc.
ener
gy us
e)
100
80
60
40
20
Carbon disclosure score breakdown for Sector versus Global 500 overall and Global 500 CDLI4
100
90
80
70
60
50
40
30
20
10
0
Performance: percentage of respondents thatimplement best practices
0% 10% 20% 30% 40% 50% 60% 70% 80% 90% 100%
� Utilities � All Sectors
Emissions reduction due to implementation of activities
Progress toward meeting targets
Disclosure of climate change information in mainstream filings or other external communications
Verification of emissions
Monetary incentives
Board or other senior management oversight
Implementation of emissions reduction targets
Integration of climate change risks or opportunities into overall business strategy
Global 500 response rate:
Utilities Overall: 77% (20 of 27)
Key Industries within the sector:
Electric Utilities (13 of 19), Gas Utilities (1 of 2),
Multi Utilities (6 of 6).
Largest non-respondents include:
National Thermal Power (NTPC), NextEra Energy, Hong Kong & China Gas

55
Utilities
Payback period breakdown of reported active emissions reduction initiatives by activity type
200 5 10 15Number of Initiatives
� <1 year � 1-3 years � >3 years
Behavioral change
Energy efficiency: building fabric
Energy efficiency: building services
Energy efficiency: processes
Fugitive emissions reductions
Low carbon energy installation
Low carbon energy purchase
Other
Process emissions reductions
Product design
Transportation: fleet
Transportation: use
Energy mixes of utility companies
� Coal � Lignite � Oil & gas � Combined Cycle Gas Turbine � Nuclear � Hydro � Other renewables
100%0 10% 20% 30% 40% 50% 60% 70% 80% 90%
American Electric Power Company
Centrica
CEZ
CLP Holdings
Duke Energy
E.ON AG
Electricite de France (EDF)
Endesa
ENEL SpA
Exelon
Fortum Oyj
GDF Suez
Iberdrola
PG&E
Public Service Enterprise Group
RWE AG
The Southern Company
Emissions reduction targets
% E
mis
sion
s re
duct
ion
to b
e ac
hiev
ed
20102008 2012 2014
Year for reduction to be achieved
2016 2018 20222020
Absolute target Intensity target
100
90
80
70
60
50
40
30
20
10
0
765432
“ AEP is committed to further reduce its emissions footprint and risk. Through a generation transition plan which includes retirement of aging coal assets, retrofitting environmental controls on newer assets and construction of new natural gas facilities, AEP expects to further reduce its GHG profile over the next 10 years. In 2010, coal-fired generation accounted for 80% of AEP’s total energy production. By 2020 the percentage coal generation is expected to drop to 65%, helping achieve a targeted 10% reduction in emission from 2010 levels. The additional environmental controls and new generation will likely require capital expenditures of $6-11 billion over the next ten years.” American Electric Power
“ According to CERES and Natural Resources Defense Council we are in the top 3rd of the national 100 largest U.S. electric utilities in minimizing carbon intensity. Our regulated electric generating fleet utilizes multiple fuel sources (coal, uranium, natural gas, oil and market purchases), each with a different CO2 emission intensity. Sources are dispatched based on the lowest total production costs, so these programs could alter the mix of sources from the business as usual case.” Dominion Resources
“ The feed-in tariff arrangements in China, India and Thailand, and the sales of Renewable Energy Certificates in Australia provide incremental revenue above the normal tariff which is incorporated into the financial model prior to making an investment decision. The costs associated with this are higher investments required for RE generation assets.” CLP Holdings
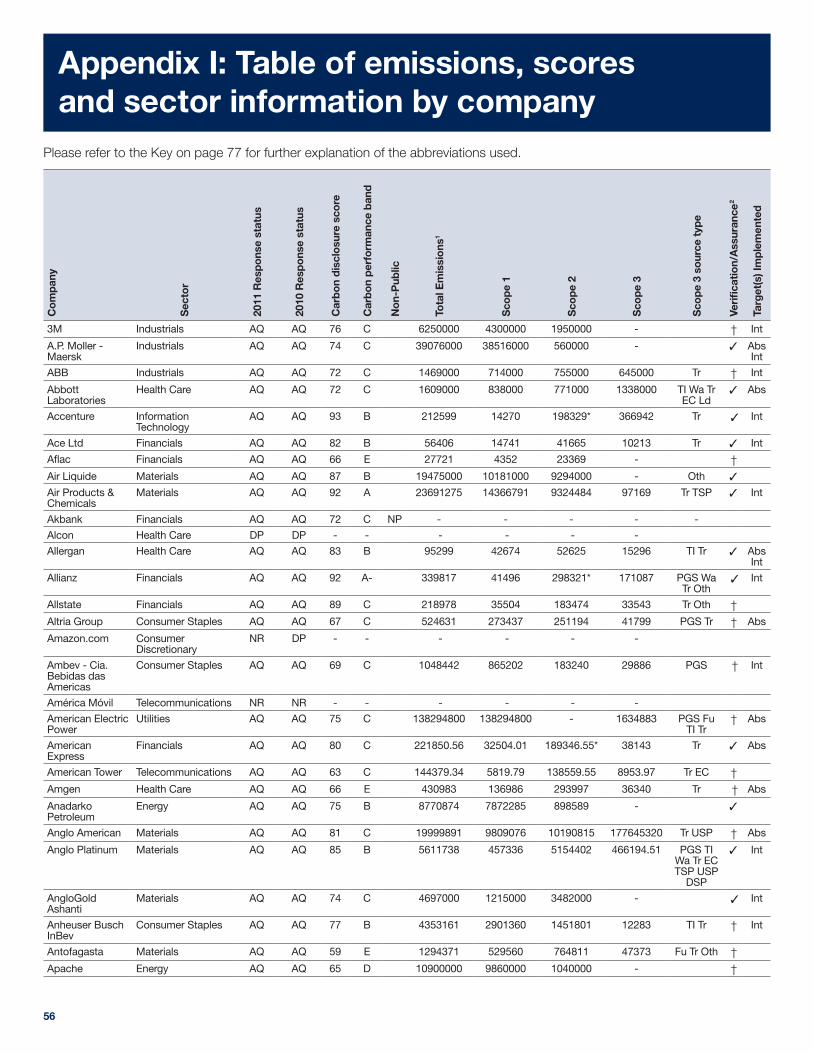
Carbon Disclosure Project 2011 – Global 500 Report
56
Appendix I: Table of emissions, scores and sector information by company
Please refer to the Key on page 77 for further explanation of the abbreviations used.
Co
mp
any
Sec
tor
2011
Res
po
nse
stat
us
2010
Res
po
nse
stat
us
Car
bo
n d
iscl
osu
re s
core
Car
bo
n p
erfo
rman
ce b
and
No
n-P
ublic
Tota
l Em
issi
ons
1
Sco
pe
1
Sco
pe
2
Sco
pe
3
Sco
pe
3 so
urce
typ
e
Veri
fica
tion/
Ass
uran
ce2
Targ
et(s
) Im
ple
men
ted
3M Industrials AQ AQ 76 C 6250000 4300000 1950000 - † Int
A.P. Moller - Maersk
Industrials AQ AQ 74 C 39076000 38516000 560000 - ✓ Abs Int
ABB Industrials AQ AQ 72 C 1469000 714000 755000 645000 Tr † Int
Abbott Laboratories
Health Care AQ AQ 72 C 1609000 838000 771000 1338000 TI Wa Tr EC Ld
✓ Abs
Accenture Information Technology
AQ AQ 93 B 212599 14270 198329* 366942 Tr ✓ Int
Ace Ltd Financials AQ AQ 82 B 56406 14741 41665 10213 Tr ✓ Int
Aflac Financials AQ AQ 66 E 27721 4352 23369 - †Air Liquide Materials AQ AQ 87 B 19475000 10181000 9294000 - Oth ✓
Air Products & Chemicals
Materials AQ AQ 92 A 23691275 14366791 9324484 97169 Tr TSP ✓ Int
Akbank Financials AQ AQ 72 C NP - - - - -
Alcon Health Care DP DP - - - - - -
Allergan Health Care AQ AQ 83 B 95299 42674 52625 15296 TI Tr ✓ Abs Int
Allianz Financials AQ AQ 92 A- 339817 41496 298321* 171087 PGS Wa Tr Oth
✓ Int
Allstate Financials AQ AQ 89 C 218978 35504 183474 33543 Tr Oth †Altria Group Consumer Staples AQ AQ 67 C 524631 273437 251194 41799 PGS Tr † Abs
Amazon.com Consumer Discretionary
NR DP - - - - - -
Ambev - Cia. Bebidas das Americas
Consumer Staples AQ AQ 69 C 1048442 865202 183240 29886 PGS † Int
América Móvil Telecommunications NR NR - - - - - -
American Electric Power
Utilities AQ AQ 75 C 138294800 138294800 - 1634883 PGS Fu TI Tr
† Abs
American Express
Financials AQ AQ 80 C 221850.56 32504.01 189346.55* 38143 Tr ✓ Abs
American Tower Telecommunications AQ AQ 63 C 144379.34 5819.79 138559.55 8953.97 Tr EC †Amgen Health Care AQ AQ 66 E 430983 136986 293997 36340 Tr † Abs
Anadarko Petroleum
Energy AQ AQ 75 B 8770874 7872285 898589 - ✓
Anglo American Materials AQ AQ 81 C 19999891 9809076 10190815 177645320 Tr USP † Abs
Anglo Platinum Materials AQ AQ 85 B 5611738 457336 5154402 466194.51 PGS TI Wa Tr EC TSP USP
DSP
✓ Int
AngloGold Ashanti
Materials AQ AQ 74 C 4697000 1215000 3482000 - ✓ Int
Anheuser Busch InBev
Consumer Staples AQ AQ 77 B 4353161 2901360 1451801 12283 TI Tr † Int
Antofagasta Materials AQ AQ 59 E 1294371 529560 764811 47373 Fu Tr Oth †Apache Energy AQ AQ 65 D 10900000 9860000 1040000 - †

57
Appendix I: Table of emissions, scores and sector information by companyC
om
pan
y
Sec
tor
2011
Res
po
nse
stat
us
2010
Res
po
nse
stat
us
Car
bo
n d
iscl
osu
re s
core
Car
bo
n p
erfo
rman
ce b
and
No
n-P
ublic
Tota
l Em
issi
ons
1
Sco
pe
1
Sco
pe
2
Sco
pe
3
Sco
pe
3 so
urce
typ
e
Veri
fica
tion/
Ass
uran
ce2
Targ
et(s
) Im
ple
men
ted
Apple Inc. Information Technology
DP AQ - - - - - -
Arcelor Mittal Materials AQ AQ 34 - 184825000 165226000 19599000 - † Int
Archer Daniels Midland
Consumer Staples NR NR - - - - - -
Assicurazioni Generali Spa
Financials AQ AQ 68 C 65745.5 12506.2 53239.3* 29090.3 Tr Oth † Abs Int
Astellas Pharma Health Care AQ AQ 60 D 1225638.27 457296.87 768341.4 1999.84 TI † Abs
Astra International
Consumer Discretionary
AQ(L) NR - NP - - - - -
AstraZeneca Health Care AQ AQ 68 C 679391 385210 294181* 365716 PGS TI Wa Tr USP
† Abs
AT&T Telecommunications AQ AQ 72 C 8903473 1105251 7798222 63209 Tr †Atlas Copco Industrials AQ AQ 72 C 116000 25000 91000 202000 TI † Int
Australia and New Zealand Banking Group
Financials AQ AQ 89 B 220577 18278 202299 101090 PGS Fu Wa Tr
✓ Abs Int
Automatic Data Processing
Information Technology
AQ AQ 25 - 173000 18000 155000 - †
Aviva Financials AQ AQ 80 B 132412 63784 68628* 15839.7 Tr EC ✓ Abs
AXA Group Financials AQ AQ 92 A 245701 68554 177147 214266 Tr EC ✓ Int
BAE Systems Industrials AQ AQ 56 E NP - - - - -
Baker Hughes Energy AQ AQ 67 D 600000 300000 300000 116600 Tr ✓ Int
Banco Bradesco Financials AQ AQ 47 - 24875 4554 20321 24216 EC Oth ✓
Banco do Brasil Financials AQ AQ 54 E 35838 6071 29767 8869 Tr Oth †Banco Santander Financials AQ AQ 85 C 453442.19 29882.19 423560 128666.05 Tr EC ✓
Banco Santander Brasil
Financials AQ IN 67 D 19561 5541 14020* 94744 PGS TI Wa Tr SE
¢ Abs
Banco Santander Chile
Financials AQ(SA) AQ(SA) - - - - - -
Bank Central Asia
Financials NR NR - - - - - -
Bank Mandiri Financials NR NR - - - - - -
Bank of America Financials AQ AQ 97 A 1872213 119760 1752453* 1052130 TI Wa Tr EC
✓ Abs
Bank of China Financials NR IN - - - - - -
Bank of Communications (H)
Financials AQ AQ(L) - NP - - - - -
Bank of Montreal Financials AQ AQ 88 A 64907.87 16545.66 48362.21 92796.19 Wa Tr Lu TSP
✓ Abs
Bank of Nova Scotia (Scotiabank)
Financials AQ AQ 54 D 86362 17560 68802 3075 Tr †
Barclays Financials AQ AQ 89 B 993000 57000 936000 110000 Tr ✓ Int
Barrick Gold Materials AQ AQ 82 B 4946281 2823002 2123279 - † Abs
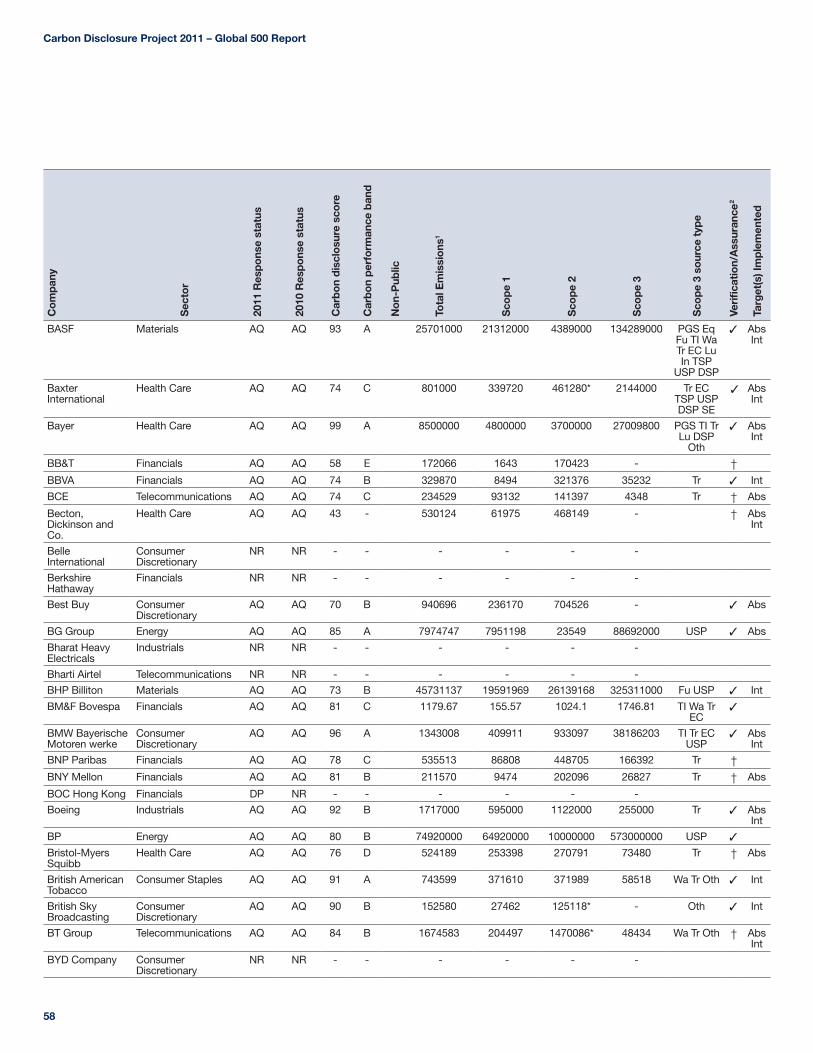
Carbon Disclosure Project 2011 – Global 500 Report
58
Co
mp
any
Sec
tor
2011
Res
po
nse
stat
us
2010
Res
po
nse
stat
us
Car
bo
n d
iscl
osu
re s
core
Car
bo
n p
erfo
rman
ce b
and
No
n-P
ublic
Tota
l Em
issi
ons
1
Sco
pe
1
Sco
pe
2
Sco
pe
3
Sco
pe
3 so
urce
typ
e
Veri
fica
tion/
Ass
uran
ce2
Targ
et(s
) Im
ple
men
ted
BASF Materials AQ AQ 93 A 25701000 21312000 4389000 134289000 PGS Eq Fu TI Wa Tr EC Lu In TSP
USP DSP
✓ Abs Int
Baxter International
Health Care AQ AQ 74 C 801000 339720 461280* 2144000 Tr EC TSP USP DSP SE
✓ Abs Int
Bayer Health Care AQ AQ 99 A 8500000 4800000 3700000 27009800 PGS TI Tr Lu DSP
Oth
✓ Abs Int
BB&T Financials AQ AQ 58 E 172066 1643 170423 - †BBVA Financials AQ AQ 74 B 329870 8494 321376 35232 Tr ✓ Int
BCE Telecommunications AQ AQ 74 C 234529 93132 141397 4348 Tr † Abs
Becton, Dickinson and Co.
Health Care AQ AQ 43 - 530124 61975 468149 - † Abs Int
Belle International
Consumer Discretionary
NR NR - - - - - -
Berkshire Hathaway
Financials NR NR - - - - - -
Best Buy Consumer Discretionary
AQ AQ 70 B 940696 236170 704526 - ✓ Abs
BG Group Energy AQ AQ 85 A 7974747 7951198 23549 88692000 USP ✓ Abs
Bharat Heavy Electricals
Industrials NR NR - - - - - -
Bharti Airtel Telecommunications NR NR - - - - - -
BHP Billiton Materials AQ AQ 73 B 45731137 19591969 26139168 325311000 Fu USP ✓ Int
BM&F Bovespa Financials AQ AQ 81 C 1179.67 155.57 1024.1 1746.81 TI Wa Tr EC
✓
BMW Bayerische Motoren werke
Consumer Discretionary
AQ AQ 96 A 1343008 409911 933097 38186203 TI Tr EC USP
✓ Abs Int
BNP Paribas Financials AQ AQ 78 C 535513 86808 448705 166392 Tr †BNY Mellon Financials AQ AQ 81 B 211570 9474 202096 26827 Tr † Abs
BOC Hong Kong Financials DP NR - - - - - -
Boeing Industrials AQ AQ 92 B 1717000 595000 1122000 255000 Tr ✓ Abs Int
BP Energy AQ AQ 80 B 74920000 64920000 10000000 573000000 USP ✓
Bristol-Myers Squibb
Health Care AQ AQ 76 D 524189 253398 270791 73480 Tr † Abs
British American Tobacco
Consumer Staples AQ AQ 91 A 743599 371610 371989 58518 Wa Tr Oth ✓ Int
British Sky Broadcasting
Consumer Discretionary
AQ AQ 90 B 152580 27462 125118* - Oth ✓ Int
BT Group Telecommunications AQ AQ 84 B 1674583 204497 1470086* 48434 Wa Tr Oth † Abs Int
BYD Company Consumer Discretionary
NR NR - - - - - -
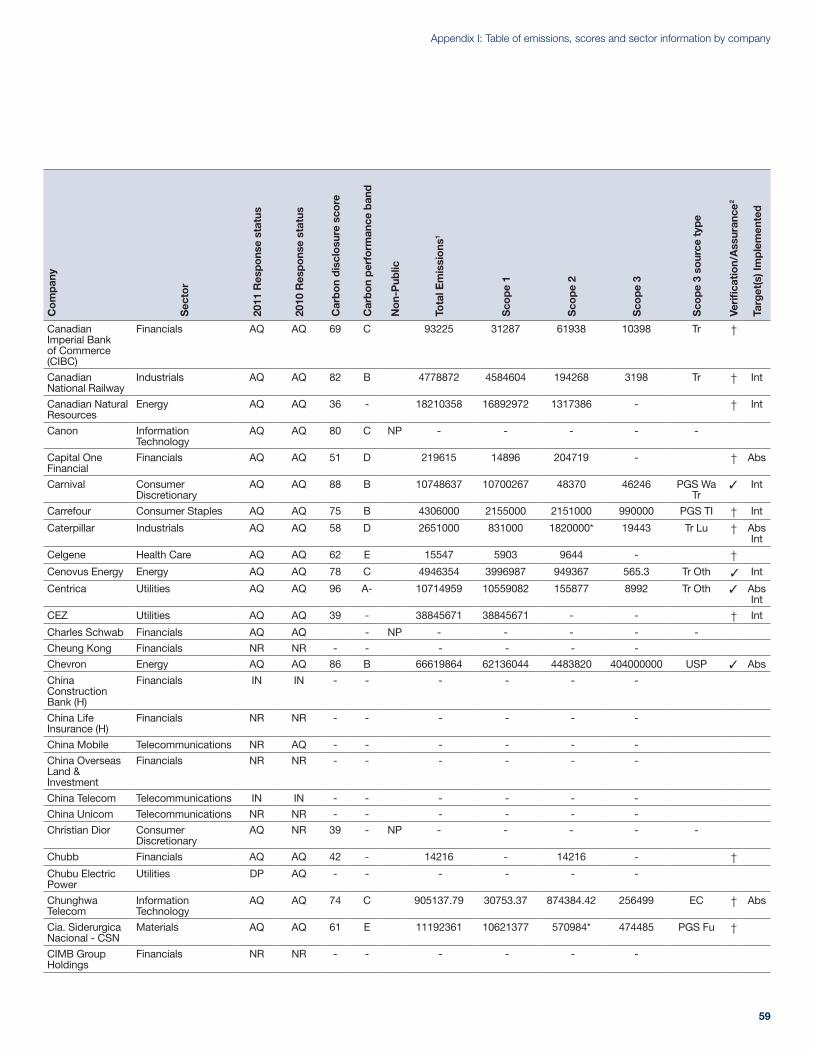
59
Appendix I: Table of emissions, scores and sector information by companyC
om
pan
y
Sec
tor
2011
Res
po
nse
stat
us
2010
Res
po
nse
stat
us
Car
bo
n d
iscl
osu
re s
core
Car
bo
n p
erfo
rman
ce b
and
No
n-P
ublic
Tota
l Em
issi
ons
1
Sco
pe
1
Sco
pe
2
Sco
pe
3
Sco
pe
3 so
urce
typ
e
Veri
fica
tion/
Ass
uran
ce2
Targ
et(s
) Im
ple
men
ted
Canadian Imperial Bank of Commerce (CIBC)
Financials AQ AQ 69 C 93225 31287 61938 10398 Tr †
Canadian National Railway
Industrials AQ AQ 82 B 4778872 4584604 194268 3198 Tr † Int
Canadian Natural Resources
Energy AQ AQ 36 - 18210358 16892972 1317386 - † Int
Canon Information Technology
AQ AQ 80 C NP - - - - -
Capital One Financial
Financials AQ AQ 51 D 219615 14896 204719 - † Abs
Carnival Consumer Discretionary
AQ AQ 88 B 10748637 10700267 48370 46246 PGS Wa Tr
✓ Int
Carrefour Consumer Staples AQ AQ 75 B 4306000 2155000 2151000 990000 PGS TI † Int
Caterpillar Industrials AQ AQ 58 D 2651000 831000 1820000* 19443 Tr Lu † Abs Int
Celgene Health Care AQ AQ 62 E 15547 5903 9644 - †Cenovus Energy Energy AQ AQ 78 C 4946354 3996987 949367 565.3 Tr Oth ✓ Int
Centrica Utilities AQ AQ 96 A- 10714959 10559082 155877 8992 Tr Oth ✓ Abs Int
CEZ Utilities AQ AQ 39 - 38845671 38845671 - - † Int
Charles Schwab Financials AQ AQ - NP - - - - -
Cheung Kong Financials NR NR - - - - - -
Chevron Energy AQ AQ 86 B 66619864 62136044 4483820 404000000 USP ✓ Abs
China Construction Bank (H)
Financials IN IN - - - - - -
China Life Insurance (H)
Financials NR NR - - - - - -
China Mobile Telecommunications NR AQ - - - - - -
China Overseas Land & Investment
Financials NR NR - - - - - -
China Telecom Telecommunications IN IN - - - - - -
China Unicom Telecommunications NR NR - - - - - -
Christian Dior Consumer Discretionary
AQ NR 39 - NP - - - - -
Chubb Financials AQ AQ 42 - 14216 - 14216 - †Chubu Electric Power
Utilities DP AQ - - - - - -
Chunghwa Telecom
Information Technology
AQ AQ 74 C 905137.79 30753.37 874384.42 256499 EC † Abs
Cia. Siderurgica Nacional - CSN
Materials AQ AQ 61 E 11192361 10621377 570984* 474485 PGS Fu †
CIMB Group Holdings
Financials NR NR - - - - - -
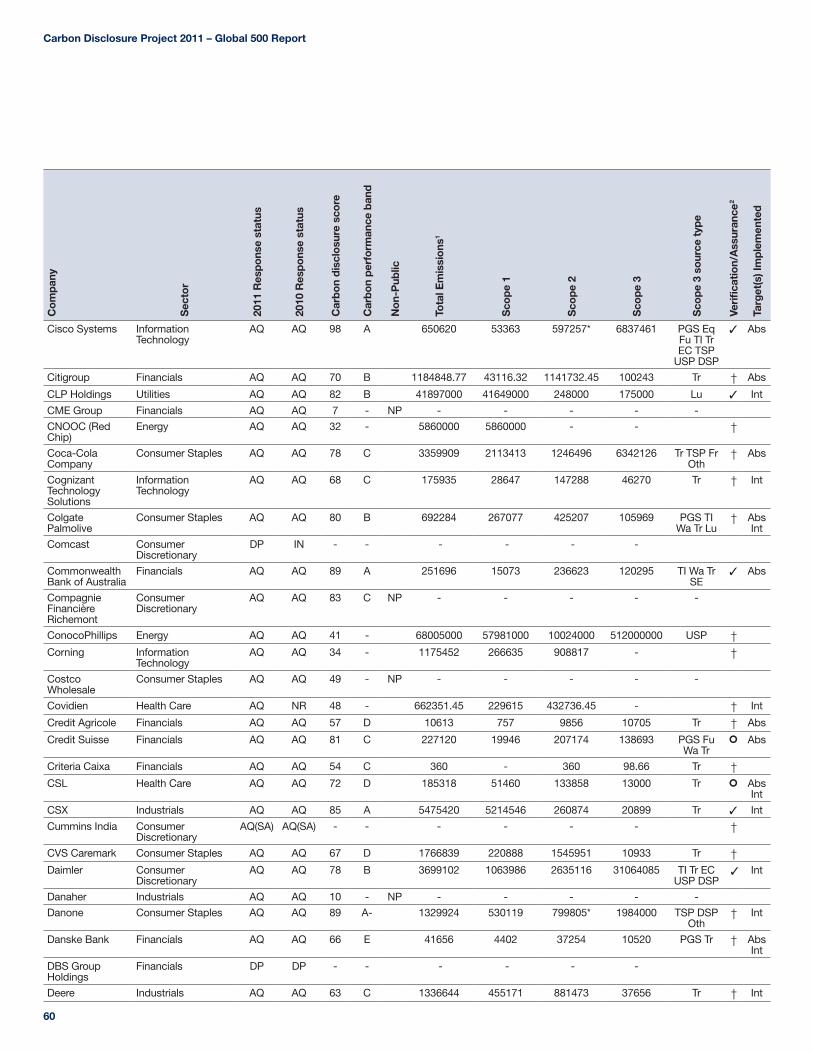
Carbon Disclosure Project 2011 – Global 500 Report
60
Co
mp
any
Sec
tor
2011
Res
po
nse
stat
us
2010
Res
po
nse
stat
us
Car
bo
n d
iscl
osu
re s
core
Car
bo
n p
erfo
rman
ce b
and
No
n-P
ublic
Tota
l Em
issi
ons
1
Sco
pe
1
Sco
pe
2
Sco
pe
3
Sco
pe
3 so
urce
typ
e
Veri
fica
tion/
Ass
uran
ce2
Targ
et(s
) Im
ple
men
ted
Cisco Systems Information Technology
AQ AQ 98 A 650620 53363 597257* 6837461 PGS Eq Fu TI Tr EC TSP
USP DSP
✓ Abs
Citigroup Financials AQ AQ 70 B 1184848.77 43116.32 1141732.45 100243 Tr † Abs
CLP Holdings Utilities AQ AQ 82 B 41897000 41649000 248000 175000 Lu ✓ Int
CME Group Financials AQ AQ 7 - NP - - - - -
CNOOC (Red Chip)
Energy AQ AQ 32 - 5860000 5860000 - - †
Coca-Cola Company
Consumer Staples AQ AQ 78 C 3359909 2113413 1246496 6342126 Tr TSP Fr Oth
† Abs
Cognizant Technology Solutions
Information Technology
AQ AQ 68 C 175935 28647 147288 46270 Tr † Int
Colgate Palmolive
Consumer Staples AQ AQ 80 B 692284 267077 425207 105969 PGS TI Wa Tr Lu
† Abs Int
Comcast Consumer Discretionary
DP IN - - - - - -
Commonwealth Bank of Australia
Financials AQ AQ 89 A 251696 15073 236623 120295 TI Wa Tr SE
✓ Abs
Compagnie Financière Richemont
Consumer Discretionary
AQ AQ 83 C NP - - - - -
ConocoPhillips Energy AQ AQ 41 - 68005000 57981000 10024000 512000000 USP †Corning Information
TechnologyAQ AQ 34 - 1175452 266635 908817 - †
Costco Wholesale
Consumer Staples AQ AQ 49 - NP - - - - -
Covidien Health Care AQ NR 48 - 662351.45 229615 432736.45 - † Int
Credit Agricole Financials AQ AQ 57 D 10613 757 9856 10705 Tr † Abs
Credit Suisse Financials AQ AQ 81 C 227120 19946 207174 138693 PGS Fu Wa Tr
¢ Abs
Criteria Caixa Financials AQ AQ 54 C 360 - 360 98.66 Tr †CSL Health Care AQ AQ 72 D 185318 51460 133858 13000 Tr ¢ Abs
Int
CSX Industrials AQ AQ 85 A 5475420 5214546 260874 20899 Tr ✓ Int
Cummins India Consumer Discretionary
AQ(SA) AQ(SA) - - - - - - †
CVS Caremark Consumer Staples AQ AQ 67 D 1766839 220888 1545951 10933 Tr †Daimler Consumer
DiscretionaryAQ AQ 78 B 3699102 1063986 2635116 31064085 TI Tr EC
USP DSP ✓ Int
Danaher Industrials AQ AQ 10 - NP - - - - -
Danone Consumer Staples AQ AQ 89 A- 1329924 530119 799805* 1984000 TSP DSP Oth
† Int
Danske Bank Financials AQ AQ 66 E 41656 4402 37254 10520 PGS Tr † Abs Int
DBS Group Holdings
Financials DP DP - - - - - -
Deere Industrials AQ AQ 63 C 1336644 455171 881473 37656 Tr † Int

61
Appendix I: Table of emissions, scores and sector information by companyC
om
pan
y
Sec
tor
2011
Res
po
nse
stat
us
2010
Res
po
nse
stat
us
Car
bo
n d
iscl
osu
re s
core
Car
bo
n p
erfo
rman
ce b
and
No
n-P
ublic
Tota
l Em
issi
ons
1
Sco
pe
1
Sco
pe
2
Sco
pe
3
Sco
pe
3 so
urce
typ
e
Veri
fica
tion/
Ass
uran
ce2
Targ
et(s
) Im
ple
men
ted
Dell Information Technology
AQ AQ 72 C 438906 34115 404791* 112679 Tr † Abs Int
Denso Consumer Discretionary
AQ AQ 48 - NP - - - - -
Deutsche Bank Financials AQ AQ 82 B 496933.65 26643.3 470290.35* 115654.44 Tr ✓ Abs
Deutsche Post Industrials AQ AQ 99 A- 6300000 5300000 1000000* 50000 Tr Oth ✓ Int
Deutsche Telekom
Telecommunications AQ AQ 79 C 3484504 391152 3093352* 91184 Tr † Abs Int
Devon Energy Energy AQ AQ 59 D 4170000 3680000 490000 16063 Fu †Diageo Consumer Staples AQ AQ 89 A- 724509 619161 105348 200000 TI † Abs
DIRECTV Group Consumer Discretionary
NR NR - - - - - -
DnB NOR Financials AQ AQ 63 D 11892.46 1176.06 10716.4 8487.6 Wa Tr † Int
Dominion Resources
Utilities AQ AQ 69 D 59353956 59004018 349938 - Oth ¢
Dongfeng Motor Group
Consumer Discretionary
DP NR - - - - - -
Dow Chemical Materials AQ AQ 95 A- 38084000 29043000 9041000 3025000 TI Tr TSP ✓ Abs Int
Duke Energy Utilities AQ AQ 62 C 90612245 90612245 - - † Abs Int
E.I. du Pont de Nemours and Company
Materials AQ AQ 80 B 15432000 10749000 4683000 146253 Tr † Abs
E.ON AG Utilities AQ AQ 80 B 132326014 126884620 5441394 143866848 PGS Eq Fu TI Tr EC USP
✓ Int
EADS Industrials AQ AQ 52 D - - - - ✓ Abs
East Japan Railway
Industrials AQ AQ 43 - 2540000 210000 2330000 - ✓ Abs Int
eBay Consumer Discretionary
AQ AQ 63 C 207746 11462 196284 21600 Tr † Abs
Ecopetrol Energy AQ AQ 40 - 6072260 5880210 192050* - †Electricite de France (EDF)
Utilities AQ AQ 62 D 81246570 80575870 670700 685702 PGS TI Tr ✓ Abs Int
Eli Lilly Health Care AQ AQ 61 C 1621619 454521 1167098 204478 TI Wa Tr EC Oth
† Int
EMC Information Technology
AQ AQ 88 B 346066 28031 318035 105029 Tr ✓ Abs Int
Emerson Electric Industrials AQ AQ 24 - - - - - †Empresas Copec Energy NR NR - - - - - -
Enbridge Energy AQ AQ 61 C 4598000 1733000 2865000 203200 PGS Fu Tr
† Abs
Encana Energy AQ AQ 72 C 5841898 5242617 599281* 2327 Tr ✓
Endesa Utilities AQ AQ 88 A- 39291885 38631310 660575 17184 Tr Oth ✓ Int
ENEL Utilities AQ AQ 89 A 116649738 116404742 244996 991855 PGS Fu Wa Oth
✓ Int
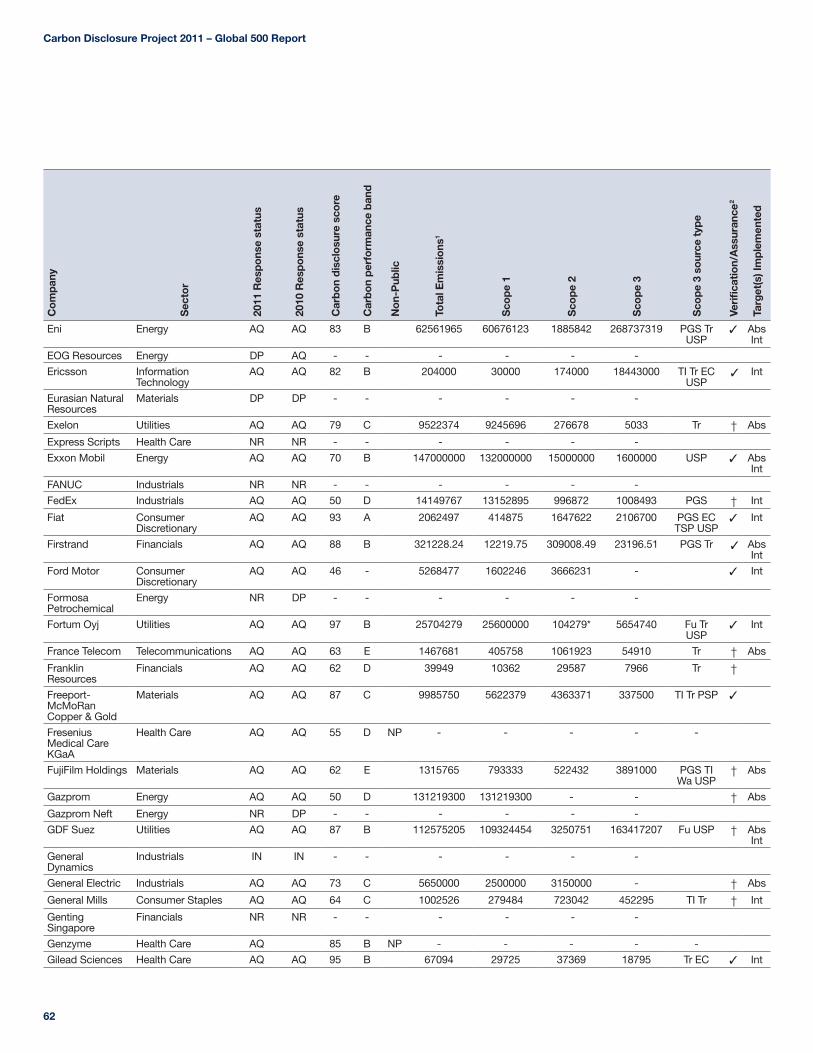
Carbon Disclosure Project 2011 – Global 500 Report
62
Co
mp
any
Sec
tor
2011
Res
po
nse
stat
us
2010
Res
po
nse
stat
us
Car
bo
n d
iscl
osu
re s
core
Car
bo
n p
erfo
rman
ce b
and
No
n-P
ublic
Tota
l Em
issi
ons
1
Sco
pe
1
Sco
pe
2
Sco
pe
3
Sco
pe
3 so
urce
typ
e
Veri
fica
tion/
Ass
uran
ce2
Targ
et(s
) Im
ple
men
ted
Eni Energy AQ AQ 83 B 62561965 60676123 1885842 268737319 PGS Tr USP
✓ Abs Int
EOG Resources Energy DP AQ - - - - - -
Ericsson Information Technology
AQ AQ 82 B 204000 30000 174000 18443000 TI Tr EC USP
✓ Int
Eurasian Natural Resources
Materials DP DP - - - - - -
Exelon Utilities AQ AQ 79 C 9522374 9245696 276678 5033 Tr † Abs
Express Scripts Health Care NR NR - - - - - -
Exxon Mobil Energy AQ AQ 70 B 147000000 132000000 15000000 1600000 USP ✓ Abs Int
FANUC Industrials NR NR - - - - - -
FedEx Industrials AQ AQ 50 D 14149767 13152895 996872 1008493 PGS † Int
Fiat Consumer Discretionary
AQ AQ 93 A 2062497 414875 1647622 2106700 PGS EC TSP USP
✓ Int
Firstrand Financials AQ AQ 88 B 321228.24 12219.75 309008.49 23196.51 PGS Tr ✓ Abs Int
Ford Motor Consumer Discretionary
AQ AQ 46 - 5268477 1602246 3666231 - ✓ Int
Formosa Petrochemical
Energy NR DP - - - - - -
Fortum Oyj Utilities AQ AQ 97 B 25704279 25600000 104279* 5654740 Fu Tr USP
✓ Int
France Telecom Telecommunications AQ AQ 63 E 1467681 405758 1061923 54910 Tr † Abs
Franklin Resources
Financials AQ AQ 62 D 39949 10362 29587 7966 Tr †
Freeport-McMoRan Copper & Gold
Materials AQ AQ 87 C 9985750 5622379 4363371 337500 TI Tr PSP ✓
Fresenius Medical Care KGaA
Health Care AQ AQ 55 D NP - - - - -
FujiFilm Holdings Materials AQ AQ 62 E 1315765 793333 522432 3891000 PGS TI Wa USP
† Abs
Gazprom Energy AQ AQ 50 D 131219300 131219300 - - † Abs
Gazprom Neft Energy NR DP - - - - - -
GDF Suez Utilities AQ AQ 87 B 112575205 109324454 3250751 163417207 Fu USP † Abs Int
General Dynamics
Industrials IN IN - - - - - -
General Electric Industrials AQ AQ 73 C 5650000 2500000 3150000 - † Abs
General Mills Consumer Staples AQ AQ 64 C 1002526 279484 723042 452295 TI Tr † Int
Genting Singapore
Financials NR NR - - - - - -
Genzyme Health Care AQ 85 B NP - - - - -
Gilead Sciences Health Care AQ AQ 95 B 67094 29725 37369 18795 Tr EC ✓ Int
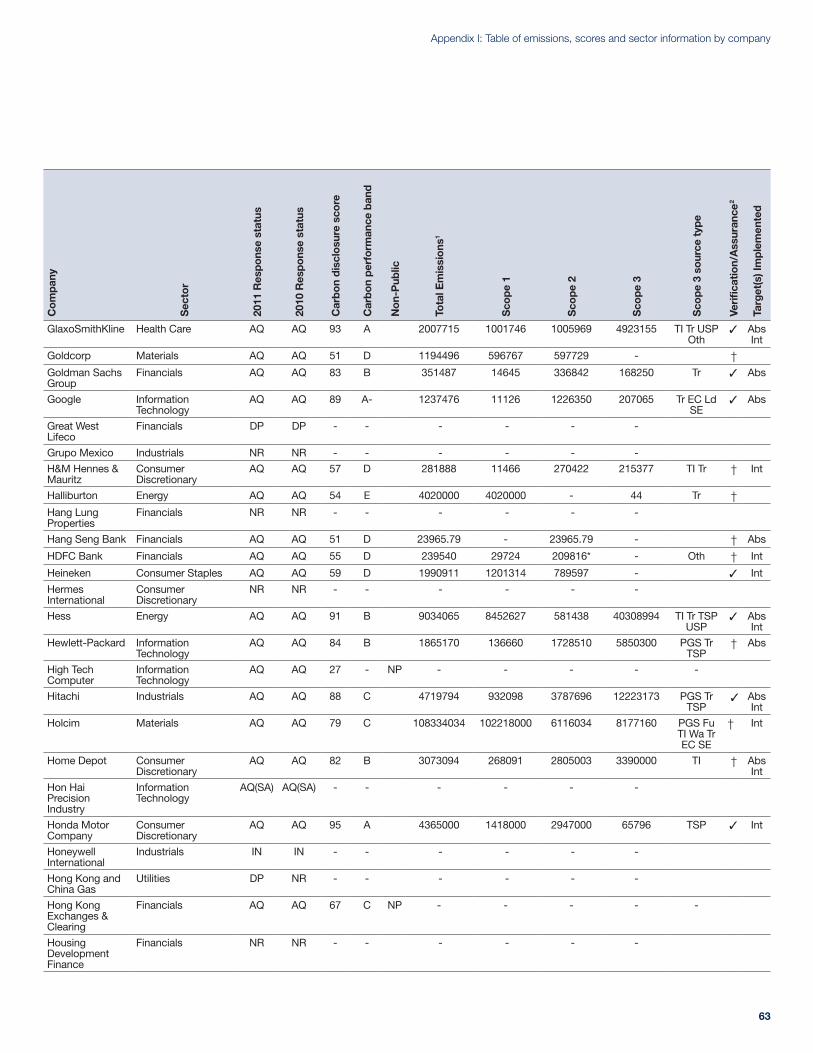
63
Appendix I: Table of emissions, scores and sector information by companyC
om
pan
y
Sec
tor
2011
Res
po
nse
stat
us
2010
Res
po
nse
stat
us
Car
bo
n d
iscl
osu
re s
core
Car
bo
n p
erfo
rman
ce b
and
No
n-P
ublic
Tota
l Em
issi
ons
1
Sco
pe
1
Sco
pe
2
Sco
pe
3
Sco
pe
3 so
urce
typ
e
Veri
fica
tion/
Ass
uran
ce2
Targ
et(s
) Im
ple
men
ted
GlaxoSmithKline Health Care AQ AQ 93 A 2007715 1001746 1005969 4923155 TI Tr USP Oth
✓ Abs Int
Goldcorp Materials AQ AQ 51 D 1194496 596767 597729 - †Goldman Sachs Group
Financials AQ AQ 83 B 351487 14645 336842 168250 Tr ✓ Abs
Google Information Technology
AQ AQ 89 A- 1237476 11126 1226350 207065 Tr EC Ld SE
✓ Abs
Great West Lifeco
Financials DP DP - - - - - -
Grupo Mexico Industrials NR NR - - - - - -
H&M Hennes & Mauritz
Consumer Discretionary
AQ AQ 57 D 281888 11466 270422 215377 TI Tr † Int
Halliburton Energy AQ AQ 54 E 4020000 4020000 - 44 Tr †Hang Lung Properties
Financials NR NR - - - - - -
Hang Seng Bank Financials AQ AQ 51 D 23965.79 - 23965.79 - † Abs
HDFC Bank Financials AQ AQ 55 D 239540 29724 209816* - Oth † Int
Heineken Consumer Staples AQ AQ 59 D 1990911 1201314 789597 - ✓ Int
Hermes International
Consumer Discretionary
NR NR - - - - - -
Hess Energy AQ AQ 91 B 9034065 8452627 581438 40308994 TI Tr TSP USP
✓ Abs Int
Hewlett-Packard Information Technology
AQ AQ 84 B 1865170 136660 1728510 5850300 PGS Tr TSP
† Abs
High Tech Computer
Information Technology
AQ AQ 27 - NP - - - - -
Hitachi Industrials AQ AQ 88 C 4719794 932098 3787696 12223173 PGS Tr TSP
✓ Abs Int
Holcim Materials AQ AQ 79 C 108334034 102218000 6116034 8177160 PGS Fu TI Wa Tr EC SE
† Int
Home Depot Consumer Discretionary
AQ AQ 82 B 3073094 268091 2805003 3390000 TI † Abs Int
Hon Hai Precision Industry
Information Technology
AQ(SA) AQ(SA) - - - - - -
Honda Motor Company
Consumer Discretionary
AQ AQ 95 A 4365000 1418000 2947000 65796 TSP ✓ Int
Honeywell International
Industrials IN IN - - - - - -
Hong Kong and China Gas
Utilities DP NR - - - - - -
Hong Kong Exchanges & Clearing
Financials AQ AQ 67 C NP - - - - -
Housing Development Finance
Financials NR NR - - - - - -
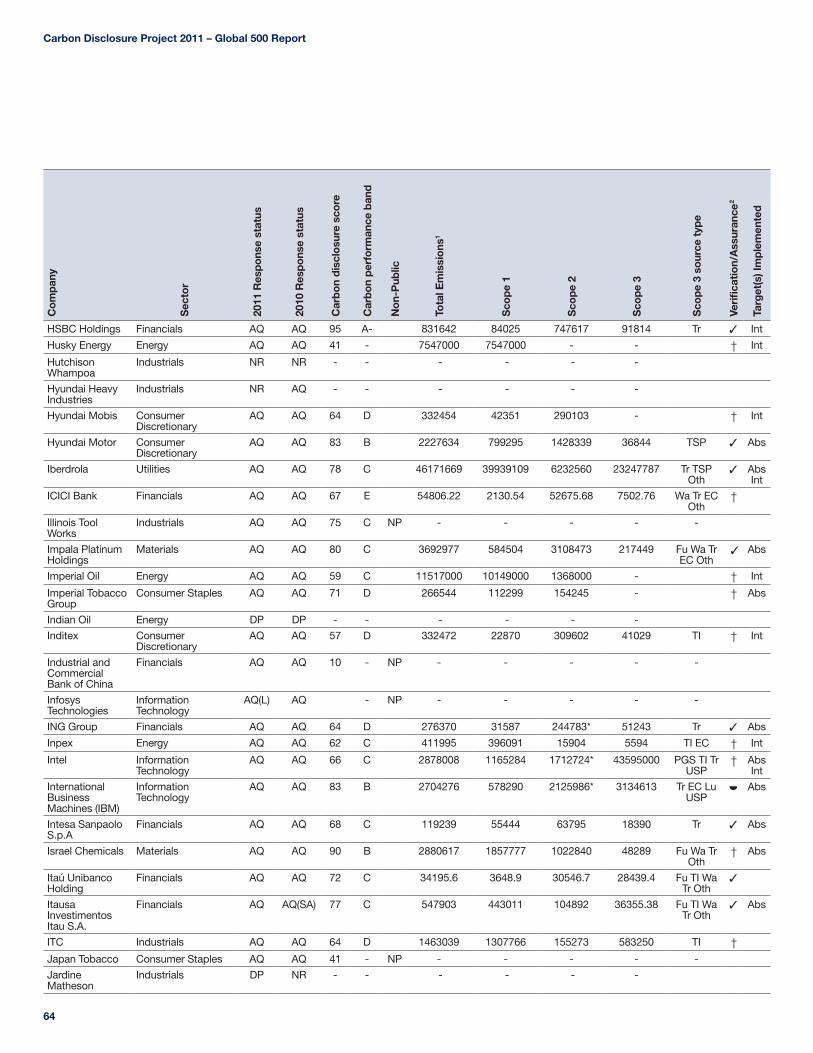
Carbon Disclosure Project 2011 – Global 500 Report
64
Co
mp
any
Sec
tor
2011
Res
po
nse
stat
us
2010
Res
po
nse
stat
us
Car
bo
n d
iscl
osu
re s
core
Car
bo
n p
erfo
rman
ce b
and
No
n-P
ublic
Tota
l Em
issi
ons
1
Sco
pe
1
Sco
pe
2
Sco
pe
3
Sco
pe
3 so
urce
typ
e
Veri
fica
tion/
Ass
uran
ce2
Targ
et(s
) Im
ple
men
ted
HSBC Holdings Financials AQ AQ 95 A- 831642 84025 747617 91814 Tr ✓ Int
Husky Energy Energy AQ AQ 41 - 7547000 7547000 - - † Int
Hutchison Whampoa
Industrials NR NR - - - - - -
Hyundai Heavy Industries
Industrials NR AQ - - - - - -
Hyundai Mobis Consumer Discretionary
AQ AQ 64 D 332454 42351 290103 - † Int
Hyundai Motor Consumer Discretionary
AQ AQ 83 B 2227634 799295 1428339 36844 TSP ✓ Abs
Iberdrola Utilities AQ AQ 78 C 46171669 39939109 6232560 23247787 Tr TSP Oth
✓ Abs Int
ICICI Bank Financials AQ AQ 67 E 54806.22 2130.54 52675.68 7502.76 Wa Tr EC Oth
†
Illinois Tool Works
Industrials AQ AQ 75 C NP - - - - -
Impala Platinum Holdings
Materials AQ AQ 80 C 3692977 584504 3108473 217449 Fu Wa Tr EC Oth
✓ Abs
Imperial Oil Energy AQ AQ 59 C 11517000 10149000 1368000 - † Int
Imperial Tobacco Group
Consumer Staples AQ AQ 71 D 266544 112299 154245 - † Abs
Indian Oil Energy DP DP - - - - - -
Inditex Consumer Discretionary
AQ AQ 57 D 332472 22870 309602 41029 TI † Int
Industrial and Commercial Bank of China
Financials AQ AQ 10 - NP - - - - -
Infosys Technologies
Information Technology
AQ(L) AQ - NP - - - - -
ING Group Financials AQ AQ 64 D 276370 31587 244783* 51243 Tr ✓ Abs
Inpex Energy AQ AQ 62 C 411995 396091 15904 5594 TI EC † Int
Intel Information Technology
AQ AQ 66 C 2878008 1165284 1712724* 43595000 PGS TI Tr USP
† Abs Int
International Business Machines (IBM)
Information Technology
AQ AQ 83 B 2704276 578290 2125986* 3134613 Tr EC Lu USP
½ Abs
Intesa Sanpaolo S.p.A
Financials AQ AQ 68 C 119239 55444 63795 18390 Tr ✓ Abs
Israel Chemicals Materials AQ AQ 90 B 2880617 1857777 1022840 48289 Fu Wa Tr Oth
† Abs
Itaú Unibanco Holding
Financials AQ AQ 72 C 34195.6 3648.9 30546.7 28439.4 Fu TI Wa Tr Oth
✓
Itausa Investimentos Itau S.A.
Financials AQ AQ(SA) 77 C 547903 443011 104892 36355.38 Fu TI Wa Tr Oth
✓ Abs
ITC Industrials AQ AQ 64 D 1463039 1307766 155273 583250 TI †Japan Tobacco Consumer Staples AQ AQ 41 - NP - - - - -
Jardine Matheson
Industrials DP NR - - - - - -
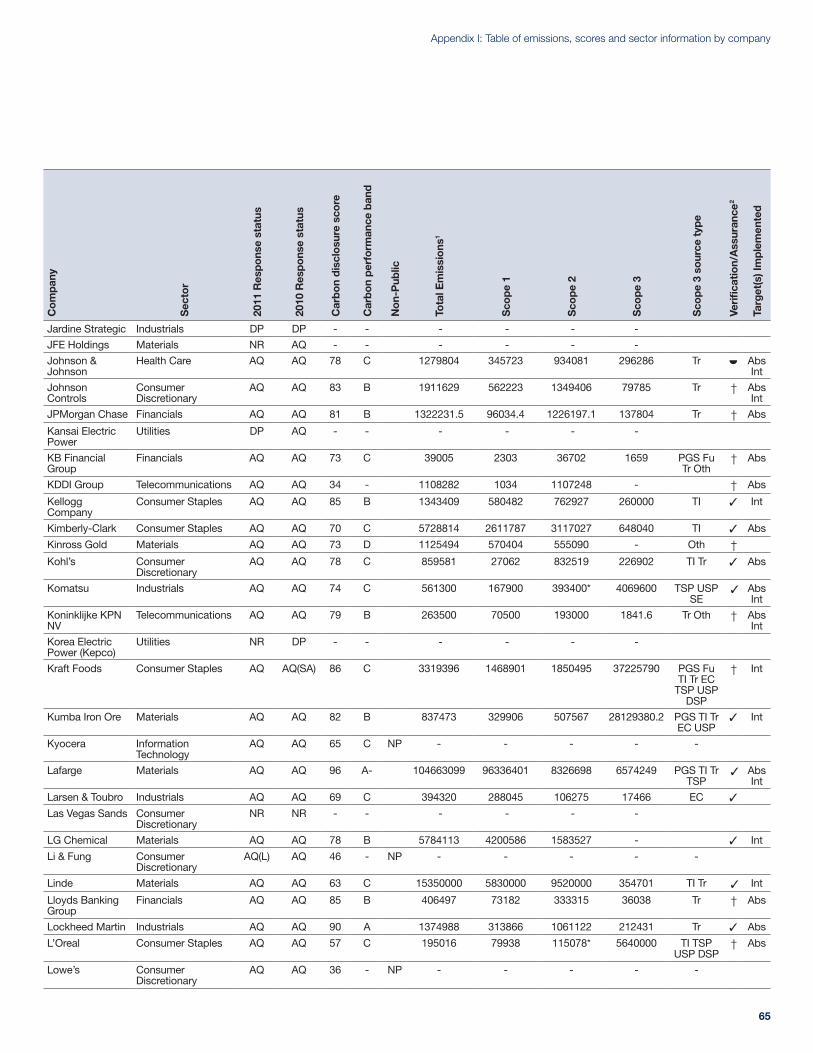
65
Appendix I: Table of emissions, scores and sector information by companyC
om
pan
y
Sec
tor
2011
Res
po
nse
stat
us
2010
Res
po
nse
stat
us
Car
bo
n d
iscl
osu
re s
core
Car
bo
n p
erfo
rman
ce b
and
No
n-P
ublic
Tota
l Em
issi
ons
1
Sco
pe
1
Sco
pe
2
Sco
pe
3
Sco
pe
3 so
urce
typ
e
Veri
fica
tion/
Ass
uran
ce2
Targ
et(s
) Im
ple
men
ted
Jardine Strategic Industrials DP DP - - - - - -
JFE Holdings Materials NR AQ - - - - - -
Johnson & Johnson
Health Care AQ AQ 78 C 1279804 345723 934081 296286 Tr ½ Abs Int
Johnson Controls
Consumer Discretionary
AQ AQ 83 B 1911629 562223 1349406 79785 Tr † Abs Int
JPMorgan Chase Financials AQ AQ 81 B 1322231.5 96034.4 1226197.1 137804 Tr † Abs
Kansai Electric Power
Utilities DP AQ - - - - - -
KB Financial Group
Financials AQ AQ 73 C 39005 2303 36702 1659 PGS Fu Tr Oth
† Abs
KDDI Group Telecommunications AQ AQ 34 - 1108282 1034 1107248 - † Abs
Kellogg Company
Consumer Staples AQ AQ 85 B 1343409 580482 762927 260000 TI ✓ Int
Kimberly-Clark Consumer Staples AQ AQ 70 C 5728814 2611787 3117027 648040 TI ✓ Abs
Kinross Gold Materials AQ AQ 73 D 1125494 570404 555090 - Oth †Kohl’s Consumer
DiscretionaryAQ AQ 78 C 859581 27062 832519 226902 TI Tr ✓ Abs
Komatsu Industrials AQ AQ 74 C 561300 167900 393400* 4069600 TSP USP SE
✓ Abs Int
Koninklijke KPN NV
Telecommunications AQ AQ 79 B 263500 70500 193000 1841.6 Tr Oth † Abs Int
Korea Electric Power (Kepco)
Utilities NR DP - - - - - -
Kraft Foods Consumer Staples AQ AQ(SA) 86 C 3319396 1468901 1850495 37225790 PGS Fu TI Tr EC
TSP USP DSP
† Int
Kumba Iron Ore Materials AQ AQ 82 B 837473 329906 507567 28129380.2 PGS TI Tr EC USP
✓ Int
Kyocera Information Technology
AQ AQ 65 C NP - - - - -
Lafarge Materials AQ AQ 96 A- 104663099 96336401 8326698 6574249 PGS TI Tr TSP
✓ Abs Int
Larsen & Toubro Industrials AQ AQ 69 C 394320 288045 106275 17466 EC ✓
Las Vegas Sands Consumer Discretionary
NR NR - - - - - -
LG Chemical Materials AQ AQ 78 B 5784113 4200586 1583527 - ✓ Int
Li & Fung Consumer Discretionary
AQ(L) AQ 46 - NP - - - - -
Linde Materials AQ AQ 63 C 15350000 5830000 9520000 354701 TI Tr ✓ Int
Lloyds Banking Group
Financials AQ AQ 85 B 406497 73182 333315 36038 Tr † Abs
Lockheed Martin Industrials AQ AQ 90 A 1374988 313866 1061122 212431 Tr ✓ Abs
L’Oreal Consumer Staples AQ AQ 57 C 195016 79938 115078* 5640000 TI TSP USP DSP
† Abs
Lowe’s Consumer Discretionary
AQ AQ 36 - NP - - - - -

Carbon Disclosure Project 2011 – Global 500 Report
66
Co
mp
any
Sec
tor
2011
Res
po
nse
stat
us
2010
Res
po
nse
stat
us
Car
bo
n d
iscl
osu
re s
core
Car
bo
n p
erfo
rman
ce b
and
No
n-P
ublic
Tota
l Em
issi
ons
1
Sco
pe
1
Sco
pe
2
Sco
pe
3
Sco
pe
3 so
urce
typ
e
Veri
fica
tion/
Ass
uran
ce2
Targ
et(s
) Im
ple
men
ted
Lukoil Energy NR AQ - - - - - -
LVMH Consumer Discretionary
AQ AQ 64 C 304782 43100 261682 551235 PGS Wa Tr TSP
Oth
✓ Abs
Malayan Banking Financials AQ AQ 37 - NP - - - - -
Manulife Financial
Financials AQ AQ 47 - NP - - - - -
Marathon Oil Energy AQ AQ 47 - 18809000 13885000 4924000 - ✓ Int
MasterCard Information Technology
AQ AQ 29 - NP - - - - -
McDonald’s Consumer Discretionary
AQ AQ 32 - NP - - - - -
Medco Health Solutions
Health Care AQ AQ 55 E 87211 5914 81297 - †
Medtronic Health Care AQ AQ 43 - 236697 25040 211657 - † Int
Merck & Co. Health Care AQ AQ 79 B 2075661 1046881 1028780 300299 TI Tr USP ✓ Abs
MetLife Financials AQ AQ 33 - - - - 927 Wa † Abs
Metro Consumer Discretionary
AQ AQ 90 B 3374778 759094 2615684 517583 Fu Tr TSP Oth
† Int
Microsoft Information Technology
AQ AQ 81 B 1191654 47383 1144271* 389017 TI Tr SE ✓ Int
Mitsubishi Industrials AQ AQ 73 C 5116416 3205957 1910459 67100 TI ½ Abs
Mitsubishi Electric
Information Technology
AQ AQ 56 E 1200000 358000 842000 351000 TSP † Abs
Mitsubishi Estate Financials AQ AQ 24 - NP - - - - -
Mitsubishi UFJ Financial Group
Financials AQ AQ 74 C 254862 18317 236545 15875 Tr † Abs
Mitsui & Co Industrials AQ AQ 59 D NP - - - - -
Mizuho Financial Group
Financials AQ AQ 85 C 198809.57 17360.56 181449.01 8852.74 TI Tr ½ Abs
MMC Norilsk Nickel
Materials DP DP - - - - - -
Mobile TeleSystems OJSC
Telecommunications NR DP - - - - - -
Monsanto Materials AQ AQ 38 - 1815700 1153800 661900 - † Abs
Morgan Stanley Financials AQ AQ 87 A 359073 14322 344751 63103 Fu Tr ✓ Int
Mosaic Company
Materials AQ AQ 78 B 4169555 2579616 1589939 7800000 PGS † Abs
Motorola3 Information Technology
AQ IN 60 E 279233.85 15793.85 263440 125438 Tr † Abs Int
MTN Group Telecommunications AQ AQ 75 D 1122962 744074 378888 4739 Tr †MTR Industrials AQ AQ 71 C 1150976 37808 1113168 - Oth †Munich Re Financials AQ AQ 79 A- 216588 69621 146967* 28914 Wa Tr Oth † Abs
Nan Ya Plastics Materials NR AQ - - - - - -
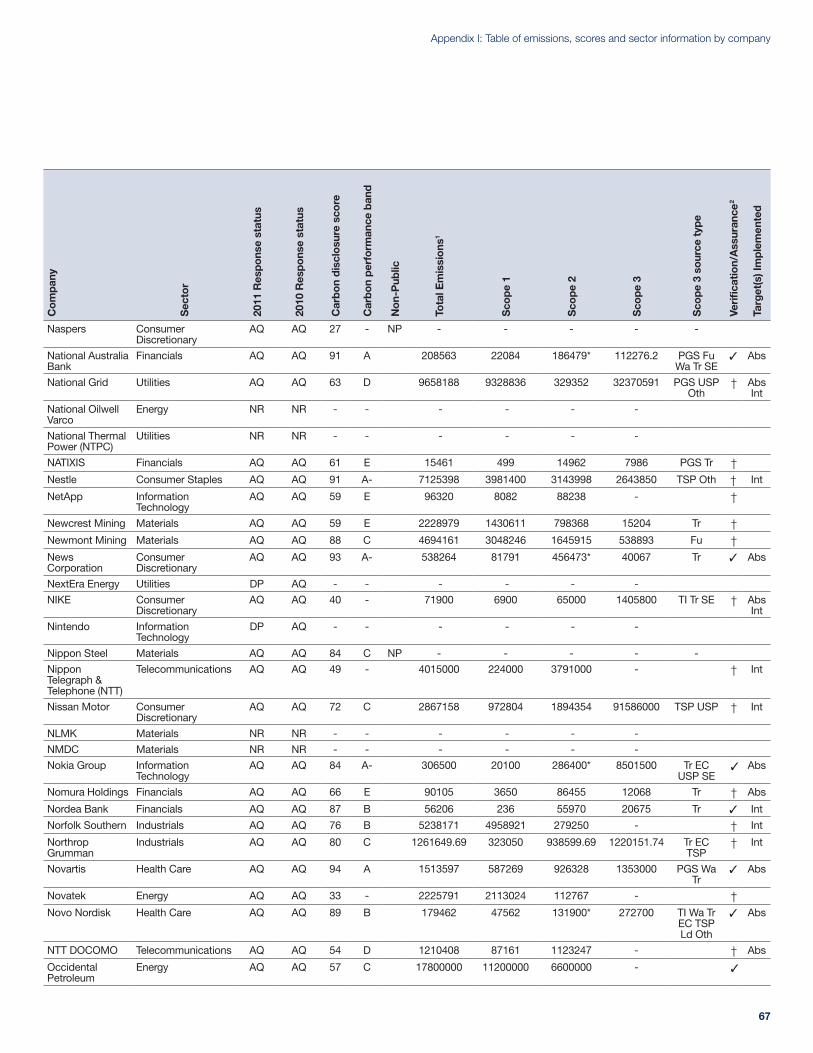
67
Appendix I: Table of emissions, scores and sector information by companyC
om
pan
y
Sec
tor
2011
Res
po
nse
stat
us
2010
Res
po
nse
stat
us
Car
bo
n d
iscl
osu
re s
core
Car
bo
n p
erfo
rman
ce b
and
No
n-P
ublic
Tota
l Em
issi
ons
1
Sco
pe
1
Sco
pe
2
Sco
pe
3
Sco
pe
3 so
urce
typ
e
Veri
fica
tion/
Ass
uran
ce2
Targ
et(s
) Im
ple
men
ted
Naspers Consumer Discretionary
AQ AQ 27 - NP - - - - -
National Australia Bank
Financials AQ AQ 91 A 208563 22084 186479* 112276.2 PGS Fu Wa Tr SE
✓ Abs
National Grid Utilities AQ AQ 63 D 9658188 9328836 329352 32370591 PGS USP Oth
† Abs Int
National Oilwell Varco
Energy NR NR - - - - - -
National Thermal Power (NTPC)
Utilities NR NR - - - - - -
NATIXIS Financials AQ AQ 61 E 15461 499 14962 7986 PGS Tr †Nestle Consumer Staples AQ AQ 91 A- 7125398 3981400 3143998 2643850 TSP Oth † Int
NetApp Information Technology
AQ AQ 59 E 96320 8082 88238 - †
Newcrest Mining Materials AQ AQ 59 E 2228979 1430611 798368 15204 Tr †Newmont Mining Materials AQ AQ 88 C 4694161 3048246 1645915 538893 Fu †News Corporation
Consumer Discretionary
AQ AQ 93 A- 538264 81791 456473* 40067 Tr ✓ Abs
NextEra Energy Utilities DP AQ - - - - - -
NIKE Consumer Discretionary
AQ AQ 40 - 71900 6900 65000 1405800 TI Tr SE † Abs Int
Nintendo Information Technology
DP AQ - - - - - -
Nippon Steel Materials AQ AQ 84 C NP - - - - -
Nippon Telegraph & Telephone (NTT)
Telecommunications AQ AQ 49 - 4015000 224000 3791000 - † Int
Nissan Motor Consumer Discretionary
AQ AQ 72 C 2867158 972804 1894354 91586000 TSP USP † Int
NLMK Materials NR NR - - - - - -
NMDC Materials NR NR - - - - - -
Nokia Group Information Technology
AQ AQ 84 A- 306500 20100 286400* 8501500 Tr EC USP SE
✓ Abs
Nomura Holdings Financials AQ AQ 66 E 90105 3650 86455 12068 Tr † Abs
Nordea Bank Financials AQ AQ 87 B 56206 236 55970 20675 Tr ✓ Int
Norfolk Southern Industrials AQ AQ 76 B 5238171 4958921 279250 - † Int
Northrop Grumman
Industrials AQ AQ 80 C 1261649.69 323050 938599.69 1220151.74 Tr EC TSP
† Int
Novartis Health Care AQ AQ 94 A 1513597 587269 926328 1353000 PGS Wa Tr
✓ Abs
Novatek Energy AQ AQ 33 - 2225791 2113024 112767 - †Novo Nordisk Health Care AQ AQ 89 B 179462 47562 131900* 272700 TI Wa Tr
EC TSP Ld Oth
✓ Abs
NTT DOCOMO Telecommunications AQ AQ 54 D 1210408 87161 1123247 - † Abs
Occidental Petroleum
Energy AQ AQ 57 C 17800000 11200000 6600000 - ✓
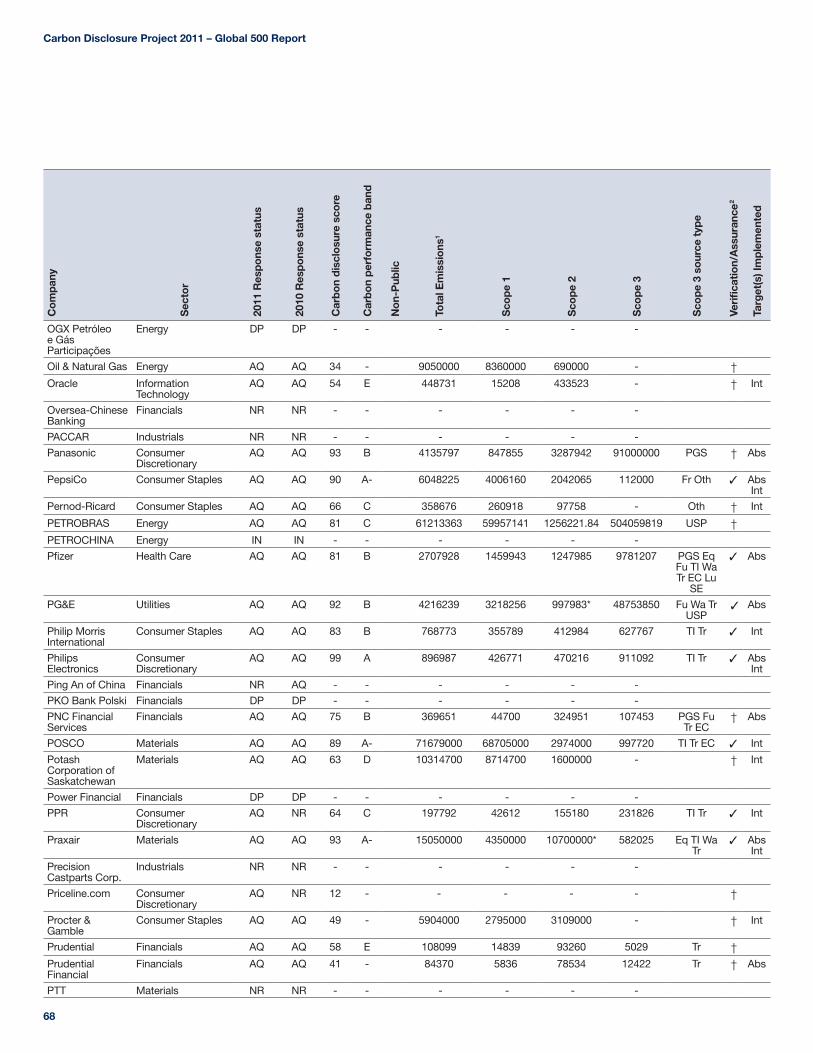
Carbon Disclosure Project 2011 – Global 500 Report
68
Co
mp
any
Sec
tor
2011
Res
po
nse
stat
us
2010
Res
po
nse
stat
us
Car
bo
n d
iscl
osu
re s
core
Car
bo
n p
erfo
rman
ce b
and
No
n-P
ublic
Tota
l Em
issi
ons
1
Sco
pe
1
Sco
pe
2
Sco
pe
3
Sco
pe
3 so
urce
typ
e
Veri
fica
tion/
Ass
uran
ce2
Targ
et(s
) Im
ple
men
ted
OGX Petróleo e Gás Participações
Energy DP DP - - - - - -
Oil & Natural Gas Energy AQ AQ 34 - 9050000 8360000 690000 - †Oracle Information
TechnologyAQ AQ 54 E 448731 15208 433523 - † Int
Oversea-Chinese Banking
Financials NR NR - - - - - -
PACCAR Industrials NR NR - - - - - -
Panasonic Consumer Discretionary
AQ AQ 93 B 4135797 847855 3287942 91000000 PGS † Abs
PepsiCo Consumer Staples AQ AQ 90 A- 6048225 4006160 2042065 112000 Fr Oth ✓ Abs Int
Pernod-Ricard Consumer Staples AQ AQ 66 C 358676 260918 97758 - Oth † Int
PETROBRAS Energy AQ AQ 81 C 61213363 59957141 1256221.84 504059819 USP †PETROCHINA Energy IN IN - - - - - -
Pfizer Health Care AQ AQ 81 B 2707928 1459943 1247985 9781207 PGS Eq Fu TI Wa Tr EC Lu
SE
✓ Abs
PG&E Utilities AQ AQ 92 B 4216239 3218256 997983* 48753850 Fu Wa Tr USP
✓ Abs
Philip Morris International
Consumer Staples AQ AQ 83 B 768773 355789 412984 627767 TI Tr ✓ Int
Philips Electronics
Consumer Discretionary
AQ AQ 99 A 896987 426771 470216 911092 TI Tr ✓ Abs Int
Ping An of China Financials NR AQ - - - - - -
PKO Bank Polski Financials DP DP - - - - - -
PNC Financial Services
Financials AQ AQ 75 B 369651 44700 324951 107453 PGS Fu Tr EC
† Abs
POSCO Materials AQ AQ 89 A- 71679000 68705000 2974000 997720 TI Tr EC ✓ Int
Potash Corporation of Saskatchewan
Materials AQ AQ 63 D 10314700 8714700 1600000 - † Int
Power Financial Financials DP DP - - - - - -
PPR Consumer Discretionary
AQ NR 64 C 197792 42612 155180 231826 TI Tr ✓ Int
Praxair Materials AQ AQ 93 A- 15050000 4350000 10700000* 582025 Eq TI Wa Tr
✓ Abs Int
Precision Castparts Corp.
Industrials NR NR - - - - - -
Priceline.com Consumer Discretionary
AQ NR 12 - - - - - †
Procter & Gamble
Consumer Staples AQ AQ 49 - 5904000 2795000 3109000 - † Int
Prudential Financials AQ AQ 58 E 108099 14839 93260 5029 Tr †Prudential Financial
Financials AQ AQ 41 - 84370 5836 78534 12422 Tr † Abs
PTT Materials NR NR - - - - - -

69
Appendix I: Table of emissions, scores and sector information by companyC
om
pan
y
Sec
tor
2011
Res
po
nse
stat
us
2010
Res
po
nse
stat
us
Car
bo
n d
iscl
osu
re s
core
Car
bo
n p
erfo
rman
ce b
and
No
n-P
ublic
Tota
l Em
issi
ons
1
Sco
pe
1
Sco
pe
2
Sco
pe
3
Sco
pe
3 so
urce
typ
e
Veri
fica
tion/
Ass
uran
ce2
Targ
et(s
) Im
ple
men
ted
PTT Exploration & Production
Energy AQ AQ 69 D 3732909.9 3731455.09 1454.81 4790.21 TI †
Public Service Enterprise Group
Utilities AQ AQ 79 C 24123436 22873019 1250417* 66428619 PGS Fi TI Tr EC Lu
USP
† Abs
Public Storage Financials NR NR - - - - - -
QBE Insurance Group
Financials AQ AQ 47 - 37411 1268 36143 14034 Tr †
Qualcomm Information Technology
AQ AQ 63 C 97537 57713 39824 - ✓
Raytheon Industrials AQ AQ 71 C 602876 98909 503967 - † Abs
Reckitt Benckiser Consumer Staples AQ AQ 81 B 290587 104813 185774 25928065 PGS TI Wa Tr
TSP USP DSP Ld
Oth
† Int
Reliance Industries
Industrials NR NR - - - - - -
Repsol YPF Energy AQ AQ 89 B 25438767 23380302 2058465 150295524 Fu TI Tr TSP USP
✓ Abs
Research In Motion
Telecommunications AQ AQ 47 - 63868 13688 50180 - Oth †
Reynolds American
Consumer Staples AQ AQ 56 D 309614 117383 192231 - † Abs
Rio Tinto Materials AQ AQ 86 B 44600000 27600000 17000000 492000000 PGS Fu TI USP
✓ Int
Roche Holding Health Care AQ NR 66 C 865995 454010 411985 171261 Tr ✓ Int
Rogers Communications
Consumer Discretionary
AQ AQ 60 D 172149 38861 133288 61384 Wa Tr EC Oth
†
Rolls-Royce Industrials AQ AQ 75 B 592123 232009 360114 175056020 TI Tr USP † Abs Int
Rosneft Energy NR DP - - - - - -
Royal Bank of Canada
Financials AQ AQ 71 D 202476 33136 169340 145705 TI Tr †
Royal Bank of Scotland Group
Financials AQ AQ 91 B 708324.75 84290.7 624034.05 143404 Fu Tr ✓ Abs
Royal Dutch Shell
Energy AQ AQ 90 A- 85000000 75000000 10000000 670000000 Fr Oth ✓ Abs
RWE Utilities AQ AQ 85 B 170200000 167100000 3100000 137.98 Fu TI USP
✓ Int
S.A.C.I. Falabella Consumer Discretionary
NR NR - - - - - -
SABMiller Consumer Staples AQ AQ 63 C 2353867.55 1144900.89 1208966.66 261307 TI † Int
Saint-Gobain Industrials AQ AQ 94 A- 18700000 13800000 4900000 132200 Tr ✓ Int
Saipem Energy AQ AQ 45 - NP - - - - -
Samsung Electronics
Information Technology
AQ AQ 94 A 9910000 4034000 5876000 45706000 TI Tr USP SE
✓ Int
Samsung Life Insurance
Financials NR NR - - - - - -
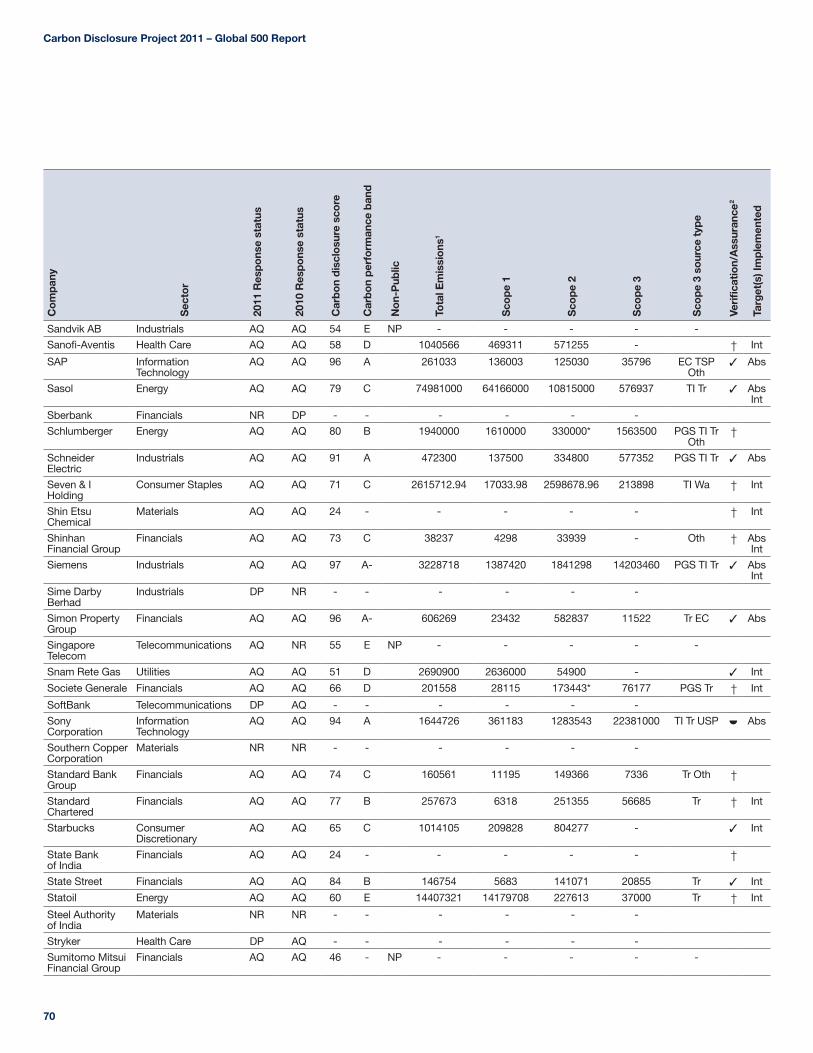
Carbon Disclosure Project 2011 – Global 500 Report
70
Co
mp
any
Sec
tor
2011
Res
po
nse
stat
us
2010
Res
po
nse
stat
us
Car
bo
n d
iscl
osu
re s
core
Car
bo
n p
erfo
rman
ce b
and
No
n-P
ublic
Tota
l Em
issi
ons
1
Sco
pe
1
Sco
pe
2
Sco
pe
3
Sco
pe
3 so
urce
typ
e
Veri
fica
tion/
Ass
uran
ce2
Targ
et(s
) Im
ple
men
ted
Sandvik AB Industrials AQ AQ 54 E NP - - - - -
Sanofi-Aventis Health Care AQ AQ 58 D 1040566 469311 571255 - † Int
SAP Information Technology
AQ AQ 96 A 261033 136003 125030 35796 EC TSP Oth
✓ Abs
Sasol Energy AQ AQ 79 C 74981000 64166000 10815000 576937 TI Tr ✓ Abs Int
Sberbank Financials NR DP - - - - - -
Schlumberger Energy AQ AQ 80 B 1940000 1610000 330000* 1563500 PGS TI Tr Oth
†
Schneider Electric
Industrials AQ AQ 91 A 472300 137500 334800 577352 PGS TI Tr ✓ Abs
Seven & I Holding
Consumer Staples AQ AQ 71 C 2615712.94 17033.98 2598678.96 213898 TI Wa † Int
Shin Etsu Chemical
Materials AQ AQ 24 - - - - - † Int
Shinhan Financial Group
Financials AQ AQ 73 C 38237 4298 33939 - Oth † Abs Int
Siemens Industrials AQ AQ 97 A- 3228718 1387420 1841298 14203460 PGS TI Tr ✓ Abs Int
Sime Darby Berhad
Industrials DP NR - - - - - -
Simon Property Group
Financials AQ AQ 96 A- 606269 23432 582837 11522 Tr EC ✓ Abs
Singapore Telecom
Telecommunications AQ NR 55 E NP - - - - -
Snam Rete Gas Utilities AQ AQ 51 D 2690900 2636000 54900 - ✓ Int
Societe Generale Financials AQ AQ 66 D 201558 28115 173443* 76177 PGS Tr † Int
SoftBank Telecommunications DP AQ - - - - - -
Sony Corporation
Information Technology
AQ AQ 94 A 1644726 361183 1283543 22381000 TI Tr USP ½ Abs
Southern Copper Corporation
Materials NR NR - - - - - -
Standard Bank Group
Financials AQ AQ 74 C 160561 11195 149366 7336 Tr Oth †
Standard Chartered
Financials AQ AQ 77 B 257673 6318 251355 56685 Tr † Int
Starbucks Consumer Discretionary
AQ AQ 65 C 1014105 209828 804277 - ✓ Int
State Bank of India
Financials AQ AQ 24 - - - - - †
State Street Financials AQ AQ 84 B 146754 5683 141071 20855 Tr ✓ Int
Statoil Energy AQ AQ 60 E 14407321 14179708 227613 37000 Tr † Int
Steel Authority of India
Materials NR NR - - - - - -
Stryker Health Care DP AQ - - - - - -
Sumitomo Mitsui Financial Group
Financials AQ AQ 46 - NP - - - - -
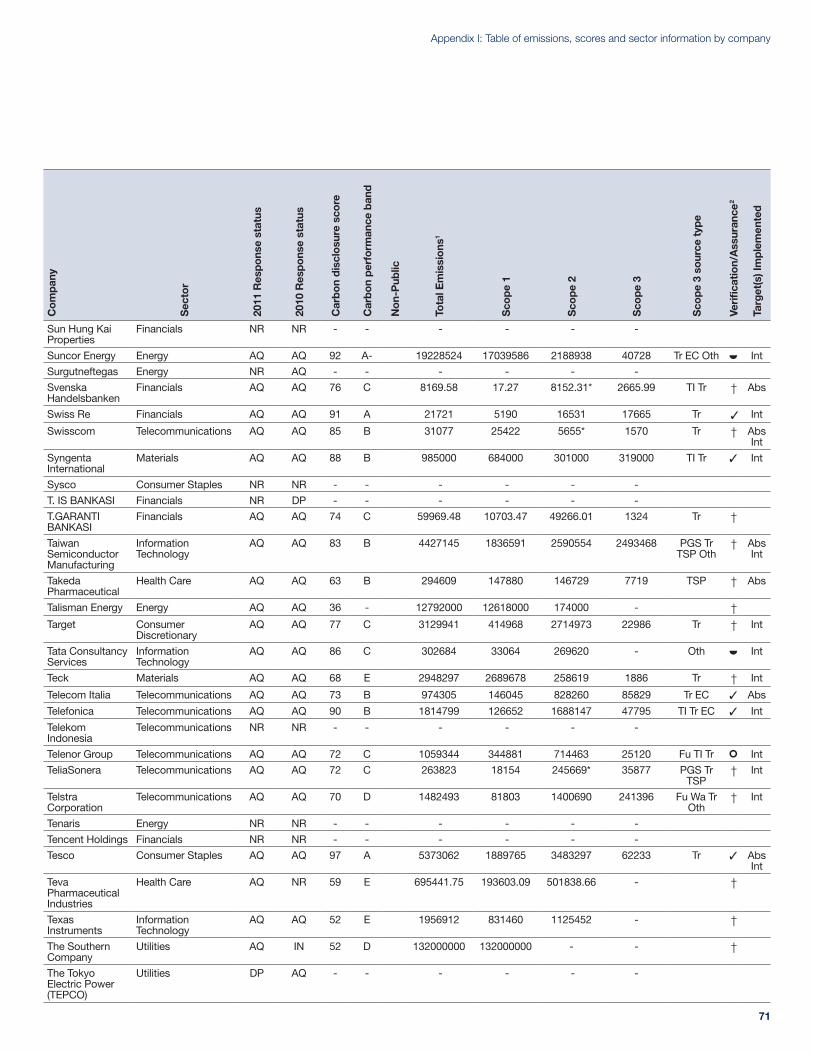
71
Appendix I: Table of emissions, scores and sector information by companyC
om
pan
y
Sec
tor
2011
Res
po
nse
stat
us
2010
Res
po
nse
stat
us
Car
bo
n d
iscl
osu
re s
core
Car
bo
n p
erfo
rman
ce b
and
No
n-P
ublic
Tota
l Em
issi
ons
1
Sco
pe
1
Sco
pe
2
Sco
pe
3
Sco
pe
3 so
urce
typ
e
Veri
fica
tion/
Ass
uran
ce2
Targ
et(s
) Im
ple
men
ted
Sun Hung Kai Properties
Financials NR NR - - - - - -
Suncor Energy Energy AQ AQ 92 A- 19228524 17039586 2188938 40728 Tr EC Oth ½ Int
Surgutneftegas Energy NR AQ - - - - - -
Svenska Handelsbanken
Financials AQ AQ 76 C 8169.58 17.27 8152.31* 2665.99 TI Tr † Abs
Swiss Re Financials AQ AQ 91 A 21721 5190 16531 17665 Tr ✓ Int
Swisscom Telecommunications AQ AQ 85 B 31077 25422 5655* 1570 Tr † Abs Int
Syngenta International
Materials AQ AQ 88 B 985000 684000 301000 319000 TI Tr ✓ Int
Sysco Consumer Staples NR NR - - - - - -
T. IS BANKASI Financials NR DP - - - - - -
T.GARANTI BANKASI
Financials AQ AQ 74 C 59969.48 10703.47 49266.01 1324 Tr †
Taiwan Semiconductor Manufacturing
Information Technology
AQ AQ 83 B 4427145 1836591 2590554 2493468 PGS Tr TSP Oth
† Abs Int
Takeda Pharmaceutical
Health Care AQ AQ 63 B 294609 147880 146729 7719 TSP † Abs
Talisman Energy Energy AQ AQ 36 - 12792000 12618000 174000 - †Target Consumer
DiscretionaryAQ AQ 77 C 3129941 414968 2714973 22986 Tr † Int
Tata Consultancy Services
Information Technology
AQ AQ 86 C 302684 33064 269620 - Oth ½ Int
Teck Materials AQ AQ 68 E 2948297 2689678 258619 1886 Tr † Int
Telecom Italia Telecommunications AQ AQ 73 B 974305 146045 828260 85829 Tr EC ✓ Abs
Telefonica Telecommunications AQ AQ 90 B 1814799 126652 1688147 47795 TI Tr EC ✓ Int
Telekom Indonesia
Telecommunications NR NR - - - - - -
Telenor Group Telecommunications AQ AQ 72 C 1059344 344881 714463 25120 Fu TI Tr ¢ Int
TeliaSonera Telecommunications AQ AQ 72 C 263823 18154 245669* 35877 PGS Tr TSP
† Int
Telstra Corporation
Telecommunications AQ AQ 70 D 1482493 81803 1400690 241396 Fu Wa Tr Oth
† Int
Tenaris Energy NR NR - - - - - -
Tencent Holdings Financials NR NR - - - - - -
Tesco Consumer Staples AQ AQ 97 A 5373062 1889765 3483297 62233 Tr ✓ Abs Int
Teva Pharmaceutical Industries
Health Care AQ NR 59 E 695441.75 193603.09 501838.66 - †
Texas Instruments
Information Technology
AQ AQ 52 E 1956912 831460 1125452 - †
The Southern Company
Utilities AQ IN 52 D 132000000 132000000 - - †
The Tokyo Electric Power (TEPCO)
Utilities DP AQ - - - - - -
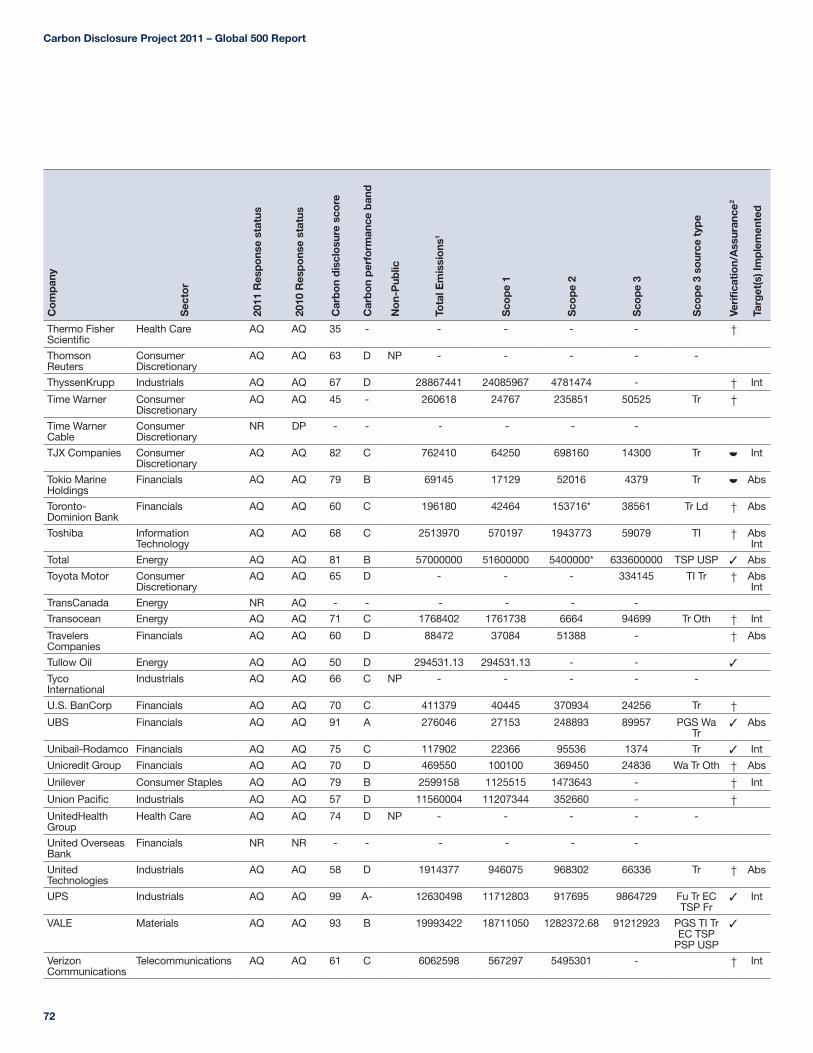
Carbon Disclosure Project 2011 – Global 500 Report
72
Co
mp
any
Sec
tor
2011
Res
po
nse
stat
us
2010
Res
po
nse
stat
us
Car
bo
n d
iscl
osu
re s
core
Car
bo
n p
erfo
rman
ce b
and
No
n-P
ublic
Tota
l Em
issi
ons
1
Sco
pe
1
Sco
pe
2
Sco
pe
3
Sco
pe
3 so
urce
typ
e
Veri
fica
tion/
Ass
uran
ce2
Targ
et(s
) Im
ple
men
ted
Thermo Fisher Scientific
Health Care AQ AQ 35 - - - - - †
Thomson Reuters
Consumer Discretionary
AQ AQ 63 D NP - - - - -
ThyssenKrupp Industrials AQ AQ 67 D 28867441 24085967 4781474 - † Int
Time Warner Consumer Discretionary
AQ AQ 45 - 260618 24767 235851 50525 Tr †
Time Warner Cable
Consumer Discretionary
NR DP - - - - - -
TJX Companies Consumer Discretionary
AQ AQ 82 C 762410 64250 698160 14300 Tr ½ Int
Tokio Marine Holdings
Financials AQ AQ 79 B 69145 17129 52016 4379 Tr ½ Abs
Toronto-Dominion Bank
Financials AQ AQ 60 C 196180 42464 153716* 38561 Tr Ld † Abs
Toshiba Information Technology
AQ AQ 68 C 2513970 570197 1943773 59079 TI † Abs Int
Total Energy AQ AQ 81 B 57000000 51600000 5400000* 633600000 TSP USP ✓ Abs
Toyota Motor Consumer Discretionary
AQ AQ 65 D - - - 334145 TI Tr † Abs Int
TransCanada Energy NR AQ - - - - - -
Transocean Energy AQ AQ 71 C 1768402 1761738 6664 94699 Tr Oth † Int
Travelers Companies
Financials AQ AQ 60 D 88472 37084 51388 - † Abs
Tullow Oil Energy AQ AQ 50 D 294531.13 294531.13 - - ✓
Tyco International
Industrials AQ AQ 66 C NP - - - - -
U.S. BanCorp Financials AQ AQ 70 C 411379 40445 370934 24256 Tr †UBS Financials AQ AQ 91 A 276046 27153 248893 89957 PGS Wa
Tr✓ Abs
Unibail-Rodamco Financials AQ AQ 75 C 117902 22366 95536 1374 Tr ✓ Int
Unicredit Group Financials AQ AQ 70 D 469550 100100 369450 24836 Wa Tr Oth † Abs
Unilever Consumer Staples AQ AQ 79 B 2599158 1125515 1473643 - † Int
Union Pacific Industrials AQ AQ 57 D 11560004 11207344 352660 - †UnitedHealth Group
Health Care AQ AQ 74 D NP - - - - -
United Overseas Bank
Financials NR NR - - - - - -
United Technologies
Industrials AQ AQ 58 D 1914377 946075 968302 66336 Tr † Abs
UPS Industrials AQ AQ 99 A- 12630498 11712803 917695 9864729 Fu Tr EC TSP Fr
✓ Int
VALE Materials AQ AQ 93 B 19993422 18711050 1282372.68 91212923 PGS TI Tr EC TSP
PSP USP
✓
Verizon Communications
Telecommunications AQ AQ 61 C 6062598 567297 5495301 - † Int
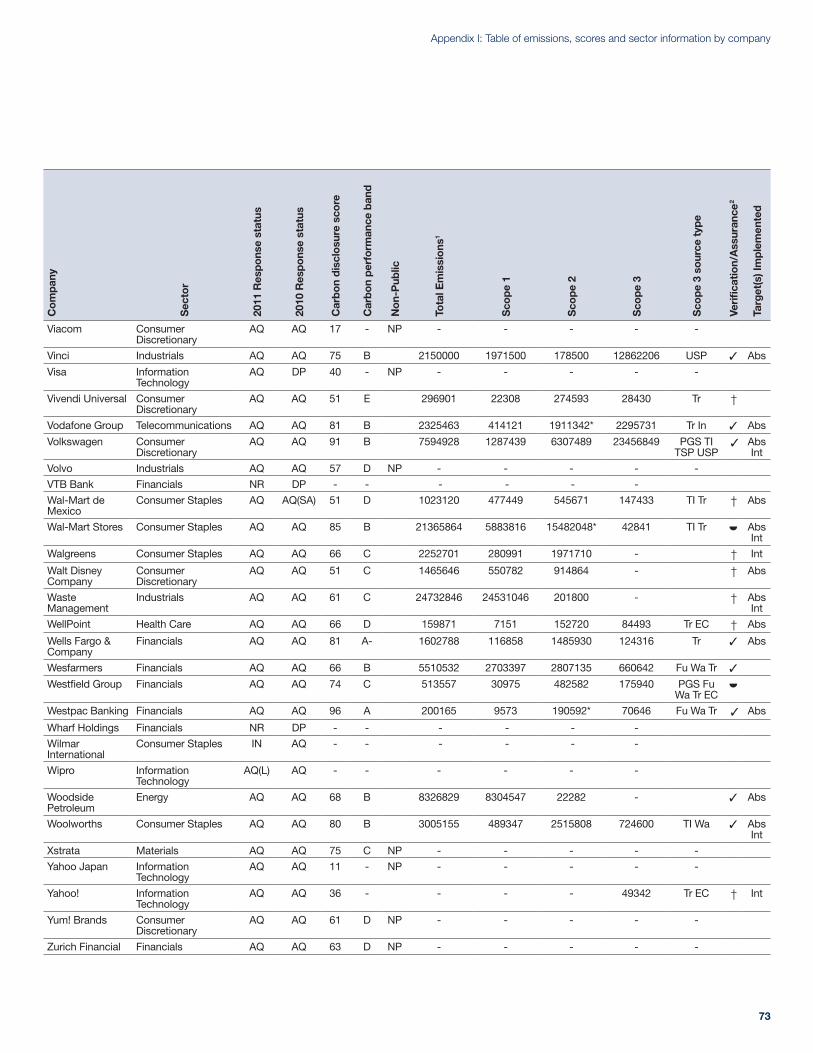
73
Appendix I: Table of emissions, scores and sector information by companyC
om
pan
y
Sec
tor
2011
Res
po
nse
stat
us
2010
Res
po
nse
stat
us
Car
bo
n d
iscl
osu
re s
core
Car
bo
n p
erfo
rman
ce b
and
No
n-P
ublic
Tota
l Em
issi
ons
1
Sco
pe
1
Sco
pe
2
Sco
pe
3
Sco
pe
3 so
urce
typ
e
Veri
fica
tion/
Ass
uran
ce2
Targ
et(s
) Im
ple
men
ted
Viacom Consumer Discretionary
AQ AQ 17 - NP - - - - -
Vinci Industrials AQ AQ 75 B 2150000 1971500 178500 12862206 USP ✓ Abs
Visa Information Technology
AQ DP 40 - NP - - - - -
Vivendi Universal Consumer Discretionary
AQ AQ 51 E 296901 22308 274593 28430 Tr †
Vodafone Group Telecommunications AQ AQ 81 B 2325463 414121 1911342* 2295731 Tr In ✓ Abs
Volkswagen Consumer Discretionary
AQ AQ 91 B 7594928 1287439 6307489 23456849 PGS TI TSP USP
✓ Abs Int
Volvo Industrials AQ AQ 57 D NP - - - - -
VTB Bank Financials NR DP - - - - - -
Wal-Mart de Mexico
Consumer Staples AQ AQ(SA) 51 D 1023120 477449 545671 147433 TI Tr † Abs
Wal-Mart Stores Consumer Staples AQ AQ 85 B 21365864 5883816 15482048* 42841 TI Tr ½ Abs Int
Walgreens Consumer Staples AQ AQ 66 C 2252701 280991 1971710 - † Int
Walt Disney Company
Consumer Discretionary
AQ AQ 51 C 1465646 550782 914864 - † Abs
Waste Management
Industrials AQ AQ 61 C 24732846 24531046 201800 - † Abs Int
WellPoint Health Care AQ AQ 66 D 159871 7151 152720 84493 Tr EC † Abs
Wells Fargo & Company
Financials AQ AQ 81 A- 1602788 116858 1485930 124316 Tr ✓ Abs
Wesfarmers Financials AQ AQ 66 B 5510532 2703397 2807135 660642 Fu Wa Tr ✓
Westfield Group Financials AQ AQ 74 C 513557 30975 482582 175940 PGS Fu Wa Tr EC
½
Westpac Banking Financials AQ AQ 96 A 200165 9573 190592* 70646 Fu Wa Tr ✓ Abs
Wharf Holdings Financials NR DP - - - - - -
Wilmar International
Consumer Staples IN AQ - - - - - -
Wipro Information Technology
AQ(L) AQ - - - - - -
Woodside Petroleum
Energy AQ AQ 68 B 8326829 8304547 22282 - ✓ Abs
Woolworths Consumer Staples AQ AQ 80 B 3005155 489347 2515808 724600 TI Wa ✓ Abs Int
Xstrata Materials AQ AQ 75 C NP - - - - -
Yahoo Japan Information Technology
AQ AQ 11 - NP - - - - -
Yahoo! Information Technology
AQ AQ 36 - - - - 49342 Tr EC † Int
Yum! Brands Consumer Discretionary
AQ AQ 61 D NP - - - - -
Zurich Financial Financials AQ AQ 63 D NP - - - - -
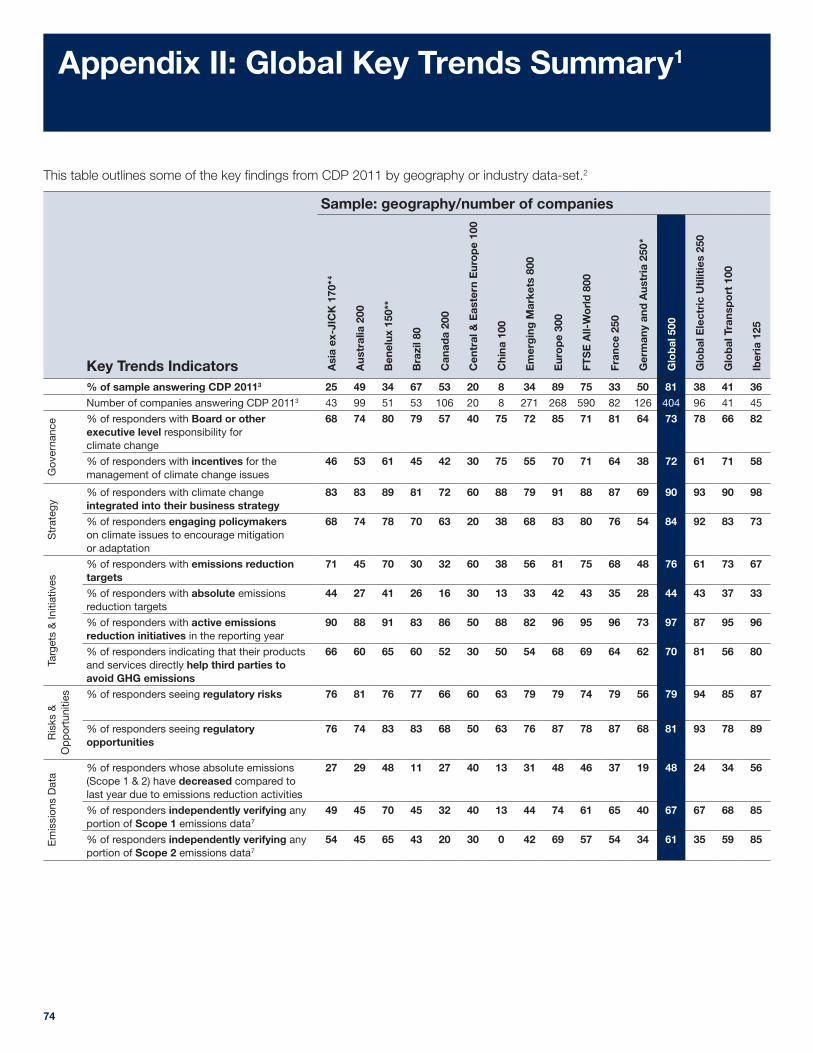
74
Sample: geography/number of companies
Key Trends Indicators Asi
a ex
-JIC
K 1
70*4
Aus
tral
ia 2
00
Ben
elux
150
**
Bra
zil 8
0
Can
ada
200
Cen
tral
& E
aste
rn E
uro
pe
100
Chi
na 1
00
Em
erg
ing
Mar
kets
800
Eur
op
e 30
0
FTS
E A
ll-W
orl
d 8
00
Fran
ce 2
50
Ger
man
y an
d A
ustr
ia 2
50 *
Glo
bal
500
Glo
bal
Ele
ctri
c U
tilit
ies
250
Glo
bal
Tra
nsp
ort
100
Iber
ia 1
25
% of sample answering CDP 20113 25 49 34 67 53 20 8 34 89 75 33 50 81 38 41 36
Number of companies answering CDP 20113 43 99 51 53 106 20 8 271 268 590 82 126 404 96 41 45
Gov
erna
nce % of responders with Board or other
executive level responsibility for climate change
68 74 80 79 57 40 75 72 85 71 81 64 73 78 66 82
% of responders with incentives for the management of climate change issues
46 53 61 45 42 30 75 55 70 71 64 38 72 61 71 58
Str
ateg
y
% of responders with climate change integrated into their business strategy
83 83 89 81 72 60 88 79 91 88 87 69 90 93 90 98
% of responders engaging policymakers on climate issues to encourage mitigation or adaptation
68 74 78 70 63 20 38 68 83 80 76 54 84 92 83 73
Targ
ets
& In
itiat
ives
% of responders with emissions reduction targets
71 45 70 30 32 60 38 56 81 75 68 48 76 61 73 67
% of responders with absolute emissions reduction targets
44 27 41 26 16 30 13 33 42 43 35 28 44 43 37 33
% of responders with active emissions reduction initiatives in the reporting year
90 88 91 83 86 50 88 82 96 95 96 73 97 87 95 96
% of responders indicating that their products and services directly help third parties to avoid GHG emissions
66 60 65 60 52 30 50 54 68 69 64 62 70 81 56 80
Ris
ks &
O
pp
ortu
nitie
s % of responders seeing regulatory risks 76 81 76 77 66 60 63 79 79 74 79 56 79 94 85 87
% of responders seeing regulatory opportunities
76 74 83 83 68 50 63 76 87 78 87 68 81 93 78 89
Em
issi
ons
Dat
a
% of responders whose absolute emissions (Scope 1 & 2) have decreased compared to last year due to emissions reduction activities
27 29 48 11 27 40 13 31 48 46 37 19 48 24 34 56
% of responders independently verifying any portion of Scope 1 emissions data7
49 45 70 45 32 40 13 44 74 61 65 40 67 67 68 85
% of responders independently verifying any portion of Scope 2 emissions data7
54 45 65 43 20 30 0 42 69 57 54 34 61 35 59 85
This table outlines some of the key findings from CDP 2011 by geography or industry data-set.2
Appendix II: Global Key Trends Summary1
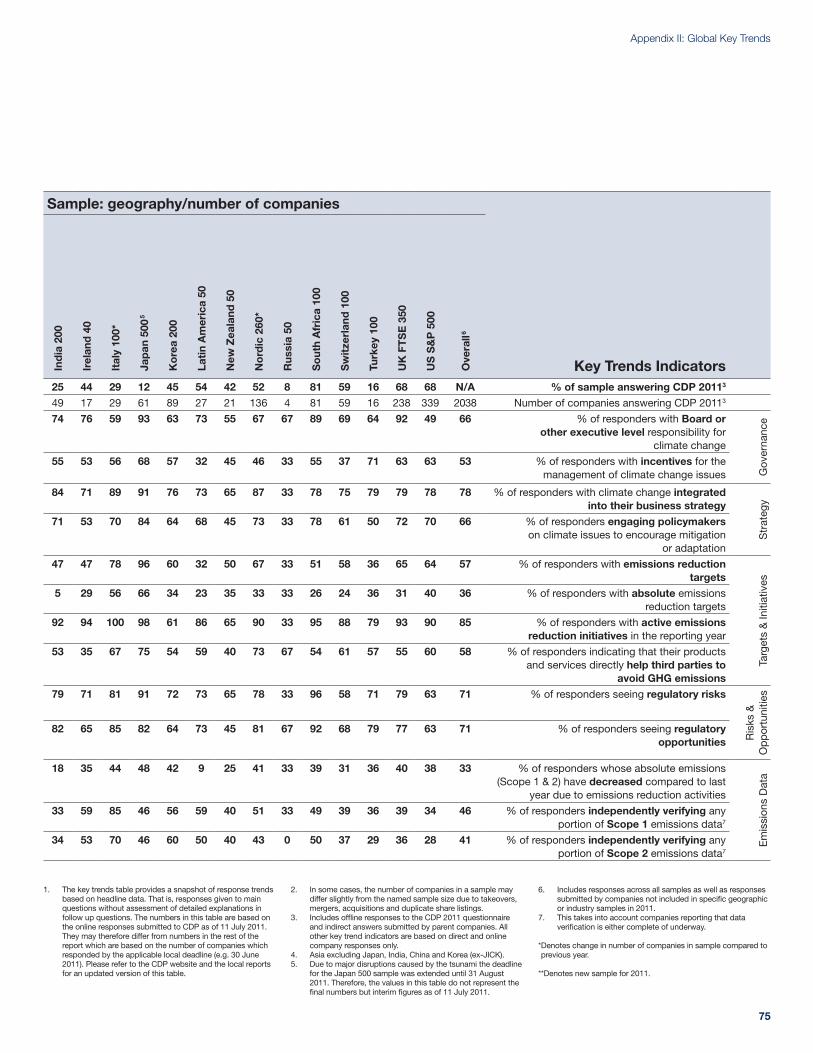
75
1. The key trends table provides a snapshot of response trends based on headline data. That is, responses given to main questions without assessment of detailed explanations in follow up questions. The numbers in this table are based on the online responses submitted to CDP as of 11 July 2011. They may therefore differ from numbers in the rest of the report which are based on the number of companies which responded by the applicable local deadline (e.g. 30 June 2011). Please refer to the CDP website and the local reports for an updated version of this table.
2. In some cases, the number of companies in a sample may differ slightly from the named sample size due to takeovers, mergers, acquisitions and duplicate share listings.
3. Includes offline responses to the CDP 2011 questionnaire and indirect answers submitted by parent companies. All other key trend indicators are based on direct and online company responses only.
4. Asia excluding Japan, India, China and Korea (ex-JICK). 5. Due to major disruptions caused by the tsunami the deadline
for the Japan 500 sample was extended until 31 August 2011. Therefore, the values in this table do not represent the final numbers but interim figures as of 11 July 2011.
6. Includes responses across all samples as well as responses submitted by companies not included in specific geographic or industry samples in 2011.
7. This takes into account companies reporting that data verification is either complete of underway.
* Denotes change in number of companies in sample compared to previous year.
**Denotes new sample for 2011.
Sample: geography/number of companies
Ind
ia 2
00
Irel
and
40
Ital
y 10
0*
Jap
an 5
005
Ko
rea
200
Lati
n A
mer
ica
50
New
Zea
land
50
No
rdic
260
*
Rus
sia
50
So
uth
Afr
ica
100
Sw
itze
rlan
d 1
00
Turk
ey 1
00
UK
FT
SE
350
US
S&
P 5
00
Ove
rall6
Key Trends Indicators25 44 29 12 45 54 42 52 8 81 59 16 68 68 N/A % of sample answering CDP 20113
49 17 29 61 89 27 21 136 4 81 59 16 238 339 2038 Number of companies answering CDP 20113
74 76 59 93 63 73 55 67 67 89 69 64 92 49 66 % of responders with Board or other executive level responsibility for
climate change
Gov
erna
nce
55 53 56 68 57 32 45 46 33 55 37 71 63 63 53 % of responders with incentives for the management of climate change issues
84 71 89 91 76 73 65 87 33 78 75 79 79 78 78 % of responders with climate change integrated into their business strategy
Str
ateg
y
71 53 70 84 64 68 45 73 33 78 61 50 72 70 66 % of responders engaging policymakers on climate issues to encourage mitigation
or adaptation
47 47 78 96 60 32 50 67 33 51 58 36 65 64 57 % of responders with emissions reduction targets
Targ
ets
& In
itiat
ives
5 29 56 66 34 23 35 33 33 26 24 36 31 40 36 % of responders with absolute emissions reduction targets
92 94 100 98 61 86 65 90 33 95 88 79 93 90 85 % of responders with active emissions reduction initiatives in the reporting year
53 35 67 75 54 59 40 73 67 54 61 57 55 60 58 % of responders indicating that their products and services directly help third parties to
avoid GHG emissions79 71 81 91 72 73 65 78 33 96 58 71 79 63 71 % of responders seeing regulatory risks
Ris
ks &
O
pp
ortu
nitie
s
82 65 85 82 64 73 45 81 67 92 68 79 77 63 71 % of responders seeing regulatory opportunities
18 35 44 48 42 9 25 41 33 39 31 36 40 38 33 % of responders whose absolute emissions (Scope 1 & 2) have decreased compared to last
year due to emissions reduction activities
Em
issi
ons
Dat
a
33 59 85 46 56 59 40 51 33 49 39 36 39 34 46 % of responders independently verifying any portion of Scope 1 emissions data7
34 53 70 46 60 50 40 43 0 50 37 29 36 28 41 % of responders independently verifying any portion of Scope 2 emissions data7
Appendix II: Global Key Trends
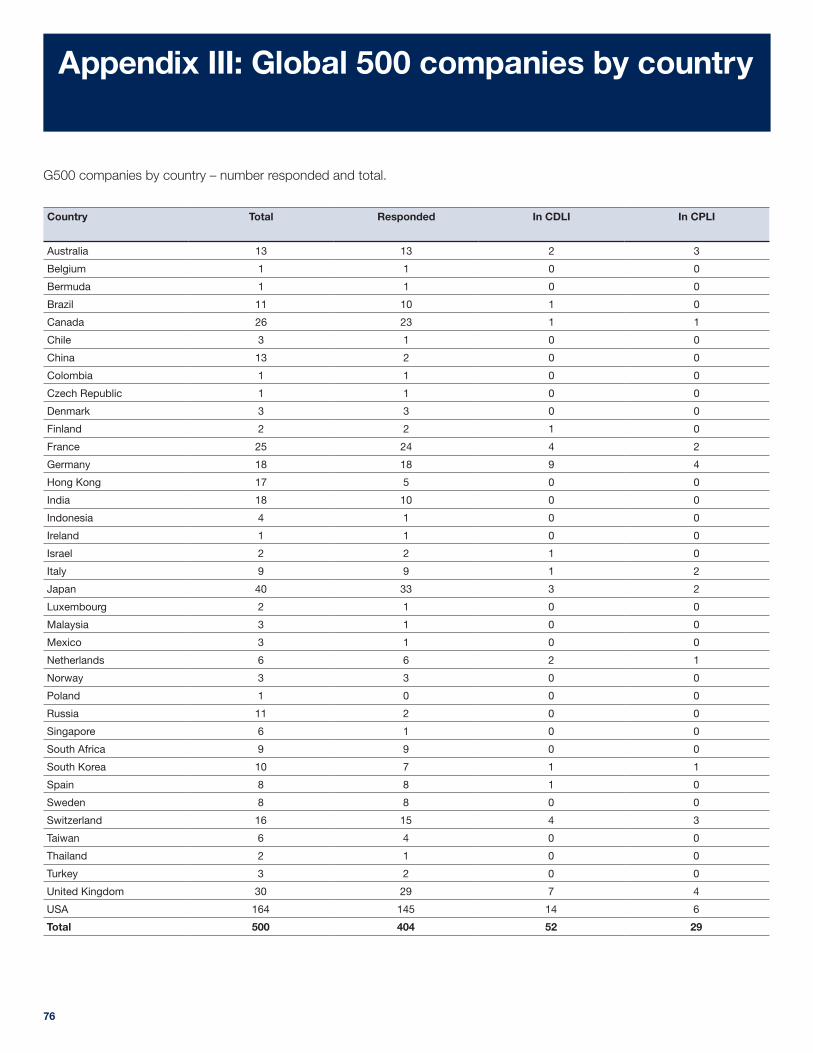
76
Country Total Responded In CDLI In CPLI
Australia 13 13 2 3
Belgium 1 1 0 0
Bermuda 1 1 0 0
Brazil 11 10 1 0
Canada 26 23 1 1
Chile 3 1 0 0
China 13 2 0 0
Colombia 1 1 0 0
Czech Republic 1 1 0 0
Denmark 3 3 0 0
Finland 2 2 1 0
France 25 24 4 2
Germany 18 18 9 4
Hong Kong 17 5 0 0
India 18 10 0 0
Indonesia 4 1 0 0
Ireland 1 1 0 0
Israel 2 2 1 0
Italy 9 9 1 2
Japan 40 33 3 2
Luxembourg 2 1 0 0
Malaysia 3 1 0 0
Mexico 3 1 0 0
Netherlands 6 6 2 1
Norway 3 3 0 0
Poland 1 0 0 0
Russia 11 2 0 0
Singapore 6 1 0 0
South Africa 9 9 0 0
South Korea 10 7 1 1
Spain 8 8 1 0
Sweden 8 8 0 0
Switzerland 16 15 4 3
Taiwan 6 4 0 0
Thailand 2 1 0 0
Turkey 3 2 0 0
United Kingdom 30 29 7 4
USA 164 145 14 6
Total 500 404 52 29
G500 companies by country – number responded and total.
Appendix III: Global 500 companies by country

77
Key to Appendix I
Key to Appendix I
Key:
AQ Answered questionnaire
AQ(L) Answered questionnaire late4
AQ(SA) Company is either a subsidiary or has merged during the reporting process. See company in brackets for further information on company’s status
DP Declined to participate
IN Provided information
NP Answered questionnaire but response not made publicly available
NR No response – Hyphen/dash = Company has
not provided information or the information has not been made publicly available
* Company provided a figure for scope 2 contract arrangements
† No verification or assurance, or verification undertaken did not meet CDP’s verification requirements. For more details, please see www.cdproject.net/verification
✓ Verification complete for
reporting year
¢ Verification ongoing for reporting year - first year started
½ Verification ongoing for reporting year - prior year(s) completed
Scope 3 Source Key:
DSP End of life treatment of sold products
EC Employee commuting
Eq Capital goods
Fr Franchises
Fu Fuel energy – related activities not included in Scope 2
In Investment
Ld Leased assets (downstream) Lu Leased assets (upstream)
Oth Other
PGS Purchased goods and services
PSP Processing sold products
SE Supplier emissions
TI Transportation and distribution (goods and services)
Tr Business travel
TSP Transportation and distribution of sold products inc. warehousing and retail
USP Use of sold products
Wa Waste generated in operations
Footnotes for Appendix I
1. Total of Scope 1 and Scope 2 reported emissions.2. The verification/assurance key provided for each
company is based on the CDP’s criteria. If a company had more than one level of completion of verification/assurance across the different scopes, the highest level was used for purposes of the key. Moving from highest to lowest levels of verification/assurance:
- complete; - prior year(s) complete; - first year started; and - no verification/assurance.3. Motorola Solutions was part of Motorola in 2010.4. Those companies marked AQ(L) in 2011 submitted responses
after the analysis cut off date of July 1, 2011. These companies’ responses are not included in the analysis of this report. PwC presents the overall scores in this report but confirms that we were not involved with the detailed scoring for these companies.

Carbon Disclosure Project 2011 – Global 500 Report
78
Notes

Design and production Lavish is a leading Creative Services agency based in London. We specialise in the creation and management of brand assets and communication materials for clients in the corporate and not-for-profit sectors.
For more information on Lavish visit www.lavishconnect.co.uk
Advisor and Report Writer
In addition, CDP has been generously supported by:
Carbon Disclosure Project 2011 This report and all of the public responses from corporations are available to download from www.cdproject.net
Our sincere thanks are extended to the following:
Allen & Overy, Esben Madsen, Freshfields, Global Reporting Initiative, Institutional Investors Group on Climate Change, Investor Group on Climate Change, Investor Network on Climate Risk, Principles for Responsible Investment, UK Foreign & Commonwealth Office, United Nations Environment Programme Finance Initiative, United Nations Global Compact, World Business Council for Sustainable Development, World Resources Institute.
Global Partners
Consultancy Partners
Verification Partners
Sue HowellsHead of Global Operations
Paul RobinsDirector of Fundraising
Frances Way Program Director
PricewaterhouseCoopers LLP7, More LondonLondon, SE1 2RTUnited KingdomTel: +44 (0) 20 7583 5000Fax: + 44 (0) 20 7822 4652
Chairman: Alan Brown Schroders
Jeremy SmithBerkeley Energy
Emanuele Fanelli Senior Manager Investor CDP
Marcus NortonHead Investor CDP andCDP Water Disclosure
Daniel TurnerHead of Disclosure
Alan McGillPartner
Richard GledhillPartner
Malcolm PrestonPartner
Jon WilliamsPartner
Jonathan GrantAssistant Director
James CameronClimate Change Capital
Takejiro Sueyoshi
PricewaterhouseCoopers LLP300 Madison Avenue24th FloorNew York, NY 10017United States of AmericaTel: +1 (646) 471 4000Fax: +1 (813) 286 6000Email: [email protected]
Chris PageRockefeller Philanthropy Advisors
Tessa TennantThe Ice Organisation
Carbon Disclosure Project40 Bowling Green LaneLondon, EC1R 0NEUnited KingdomTel: + 44 (0) 20 7970 5660Fax: + 44 (0) 20 7691 [email protected]
Carbon Disclosure Projectc/o RPA, 6 W 48th Street10th FloorNew York, NY 10036United States of AmericaTel: + 1 (212) 378 2086Fax: + 1 (212) 812 4335
Douglas KangosPartner
Kathy NielandPartner
Liz LoganPartner
Contact details can be found at the following web address:http://pwc.com/sustainability
Dr. Christoph SchroederTVM Capital
Martin WiseRelationship Capital Partners
Important NoticeThe contents of this report may be used by anyone providing acknowledgement is given to Carbon Disclosure Project (CDP). This does not represent a license to repackage or resell any of the data reported to CDP and presented in this report. If you intend to do this, you need to obtain express permission from CDP before doing so.
PwC and CDP prepared the data and analysis in this report based on responses to the CDP 2011 information request. PwC and CDP do not guarantee the accuracy or completeness of this information. PwC and CDP make no representation or warranty, express or implied, and accept no liability concerning the fairness, accuracy, or completeness of the information and opinions contained herein or for any consequences of you or anyone else acting, or refraining to act, in reliance on the information contained in this publication or for any decision based on it. You should not act upon the information contained in this publication without obtaining specific professional advice. All information and views expressed herein by CDP and/or PwC are based on their judgment at the time of this report and are subject to change without notice due to economic, political, industry and firm-specific factors. Guest commentaries where included in this report reflect the views of their respective authors; their inclusion is not an endorsement of them.
PwC and CDP and their affiliated member firms or companies, or their respective shareholders, members, partners, principals, directors, officers and/or employees, may have a position in the securities of the companies discussed herein. The securities of the companies mentioned in this document may not be eligible for sale in some states or countries, nor suitable for all types of investors; their value and the income they produce may fluctuate and/or be adversely affected by exchange rates.
‘PricewaterhouseCoopers’ and ‘PwC’ refer to PricewaterhouseCoopers LLP (a limited liability partnership in the United Kingdom) or, as the context requires, other member firms of PricewaterhouseCoopers International Limited, each member firm of which is a separate legal entity.
‘Carbon Disclosure Project’ and ‘CDP’ refers to Carbon Disclosure Project, a United Kingdom company limited by guarantee, registered as a United Kingdom charity number 1122330.
© 2011 Carbon Disclosure Project. All rights reserved.
CDP Contacts
Report Writers Contacts
CDP Board of Trustees