ce q4.0 827 - eric · abstract % ff, as.toffler.(1980)-predicts, america is...
TRANSCRIPT
ED 253 769
AUTHORTITLE..
A .-PUB DAT§'NOTE
I
(
1984) .-,,,,,
PUB TYPE Reports - Research /Technical .(143) --,,
Speeches/Conference Paper's (150) C.,
EDRS PRICE' MF01/PCO2 Plus Po stage. .
,
DESCRIPTORS '- *Curriculum Development; EduCational Research;'Expectation; *Futures (of Society); Hiiihar Eduaation;,!,
I *Home Economics Education; *Student Attitudes; 4
*Undergraduate StudentsIDENTIFIERS *Quality of Working Life
DOCUMENT RESUME.
CE Q4.0 827
Blinn, Lynn Marie; Pike; Gary R.How Home Economics Undergraduates Picture Their WorkLives in the Year 2,000: Implications ; for Cdrri6ulum,DevelopMent.Dec 8430p.; Paper presented at the American VocationalAssociation Convention (New Orleans, LA,' December
ABSTRACTThe objective ,of a research project was to describe
how undergraduate hope economics students-perceive.their work livesin the year 2000 according to age, race,gender, marital status, andgeographic region of the country. A valid, field-tested surveyinstrument developed specificilly for this project was administeredto 324 volunteer undergraduate home economics students from New York,Ohio,' Wisconsin,lCansas,-and Texas. Results were analyzed usingfactor analysis, MANOVA, and ANOVA and Seemed to point outperceptions representing .both traditional hnd nontraditional .
lifestyles. Implicatibns*for vocational. education, and particularlyho e economics, durriculuM and instruction were deduced, namely that:.( curriculum needs to be Written to account for differences in
&ions due to age,, gender, and regiorrwithin program areas; (2) '",
curriculdth needs to be written to aid students in sorting' throughpreferences for traditional versus emerging societal. patterns andvalues; (3) the changing relationship between work and familyexpectations needs to be trpssed; and (4) students need tocomprehend and learn to manage the stress that may.result from amultidimensional lifestyle. The methodology was recommended for4Unein research with students in other vocational program areas todetermine if similar perceptions of work and family roles exist;(kLB) +
A
alk
4**************************************************4*********************
* Reproduction-0 suppliediby EDRS are the best that can be madett from: the original document.******************************************************************v***
* .
k

'er
How Home Ebmomics Undergraduates. Picture Their Work Lives In the Year 2,000:
Implications For Curriculum Development
Lynn Mariil\flinn, Ph.D.
Assistan
Department of Human Development andConsumer Sciences .
University of HoustonHouston, Texas 77004
(713) 749-2742
- Gary R. Pigke, Ph.D.
Corporate RelationsTexas Instruments Incorporated
P. O. Box 225012Mail. Station 227
North Central Expressway,Dallas, Texas 75265
(214) 995-6775
O_Lynn Blinn received her Mastexs Degree at the University of Arizona in 1978
and her Doctorate at the Ohio,State University in 1983. Both degrees are inHome Economics Education.
. al
Gary Pike received' his Masters Degrees in Communication at SouthwestMissouri State in 1978 and his doctorate An Communication at the Ohio State
'University in 1985.
*The following individuals need to be recognized for their valuable.assistance in this. study: Connie Blair (the Ohio State); Beverly,Brigg5 (Kansas-State), Maureen Kelley (University of Arizona) and Marion Minbt (CornellUniversity).
1
U.S. DIPASTPANN1 OP IDUCATIONNATIONAL INSTITUTE OF EDUCATION
i OKA TIONAt fit,MitnICIS INFOPMATION(INTFII URIC')
Ii n )),. )I( if timellt 1014 1)0011 10p011iK Rd as
in', olgtI farm the /WWI or orparlitotiononworrtiori itMorlor I Nititiaq room boon rondo lo improveroloorloi tioll IlitrIllly
Pti.ttl ill vlifr IN opt411/1.1 111/1141 ill IiiialliN ii
moral III) not owl troorloly toproft001 official NIF
lifmition ot polltY
"FTFIMISSION tO fitPFLODUCE IIIISMATERIAL HAS BEEN OfIALITED HY
TO tiff F MLA TIONAI SOLIFIC;ES
IN FORMAI ION OEN TER IF;Filc)."

Abstract%
ff, as.Toffler.(1980)-predicts, America is changing"from'an industrial to a
post - industrial. society, vocational educators must recognize when traditional
,
And nontraditional skills and modes of thinking exist and *help their students he
prepared to meet new-work and f lly.challenges. New thinking skills may
include recognizing'and interpreting social and economic trends, recognizing
when to forecast and take risks, knowing how to effectively .use imag)nation in
.futuristi'c'planning, and learning hew to select. from several different alter-
natives in decision making.
This research attempted tb'accompliSh three objectives: 1) describe how
undergraduate home economies. students picture their work lives in theyear
according to age, race, gender, matital status and geographic region of the .
country.; 2) rilake recommendations for vocational education, curriculum and
insthction to foster effecti-ve fUturistic thinking skills;. and 3) 7develop. a
methodology to be used to further investigate how individuals perdeive the
future.
The rbjectives were addressed through the use of a valid, field tested sur-.
.vey instrument, developed specifically for this research project. It was admi-.
. nistered to a total of 324 volunteer undergraduate -home economics students from
A,.
five locations: New York, Ohio, Wisconsin, Xansas, and Texas. Results were aria-A
lyzed using factor analysis, MANOVA and ANOVA and seemed. to point out percev-
tions representing both traditional and hontraditibnal lifestyles. "
el

Introduction
Numerous researchers and scholars are forecasting that work life in the
next decade will be radically different. These predictions range from optimiStic,
to pessimistic. Regardless of the nature,of the prediction, most scholars
agree that there will, indeed, he substantial change.1
To help students deal with this change educational programs must include
three emphases: technology and a ,thanging work environment, adjustment to new
interpretations of work, ani the realization that work skills will change. *throughout the life span (Quilling,'1982), Quilling retommendsthat those who
work with the young deed to helolthem to: (1) recognize and, interpret 4conomc
trends; (2.) recognize the need for psychological and/or monetary assistance
during periods of retraining;And (3) accept the inevitability of change so they
can move i n and out of public and private sectors with a minimum.of stress..
Units of instruction in.mocational'education must include, concepts aimed at
reducing individual min c, against change.
Futuristic thinking is essential in order to make wise decisions about.pre-
sent useof personal res ces.. Everyone must engage in futuristic thinking, to
some degree, in order to plab to achieve personal and professional .goals in a
rapidly changing society. How Iii-prepared 'are present vocational education,
and particular home economics, _undergradvte. students to forecast and plan for
leadership in the predicted post-industrial society?
The sk1119 ecessaryt/for success as a professional futurist and analyst need
to be fostered, if to a lesser degree, in all educated individuals. The Hutch
`sociologist,aeld futurist, rolak, (1973) describes a futurist as demonstrat'i ng'
4n

,a.
9'
faith and visionary powens mixed with philosophic detachment, a rich Tmotional
life and creative fahtasy. While he acknowledges that to meet all of the eri-
teria would require .a 1:superpersonu., Coas (19830ists,ten .characterlsiics of
a" futurist: 1) a sense of thominant key or central iements of society;
2) a grasp of the trends in.societ)\from the point of view of their.con-,
tinuation or possible disruption, 3y a WilliNgness to forecdst and take risks;
4) a sense of.more than one viable, pladsible and Complex alternative to a
problem; 5).comfortmith complex issues; 6) a sense, of the value of oneself and
others; 7) imagination 8) anunderstandingof .social change; 9) optimism,0
.vid 10) a sense of hi Story and willingness to, utilizelboth peronal and formal
history to make decisions.
Since the.ear117 1970's home economises have been predicting what life will
0be like at..,the turn of the century. They,mhave.been forecasting major shifts in
societal patterns and challenging the profession to prepare its members to deal
with a period of.rapid change-on both a personal and professional level.
Compton-(1972).challenged-hoMe economists to -consider if they were ready in
their training and curricula to replace old mechanistic skills' with creative
problem solving in order to prepare studenti to make choices in a new enyiron-,
.. ment. She described the future of the p fession as directly related to its
ability to. adapt.to social change.. _r.
\,'
Spitze.(1976) stated that home economists will be greatly, needed in hOping
individuals to accomodate social change, influencing the'direction and speed of :
change,. and helping to make changeless. traumatic.'. She outlined the .tiills
needed by the home economist in the.last third of .th.e twentieth century: Her.
list parallels that of ,current futurists.in stressing igher'order cognitive
)process such" as: 1) analyzing issues critically, 2) synthesizing solutions to
problems; and 3) evaluating a number of viewpoints and alternatives simultaneously.
_
41 ;
1
1-.
4
4-3-
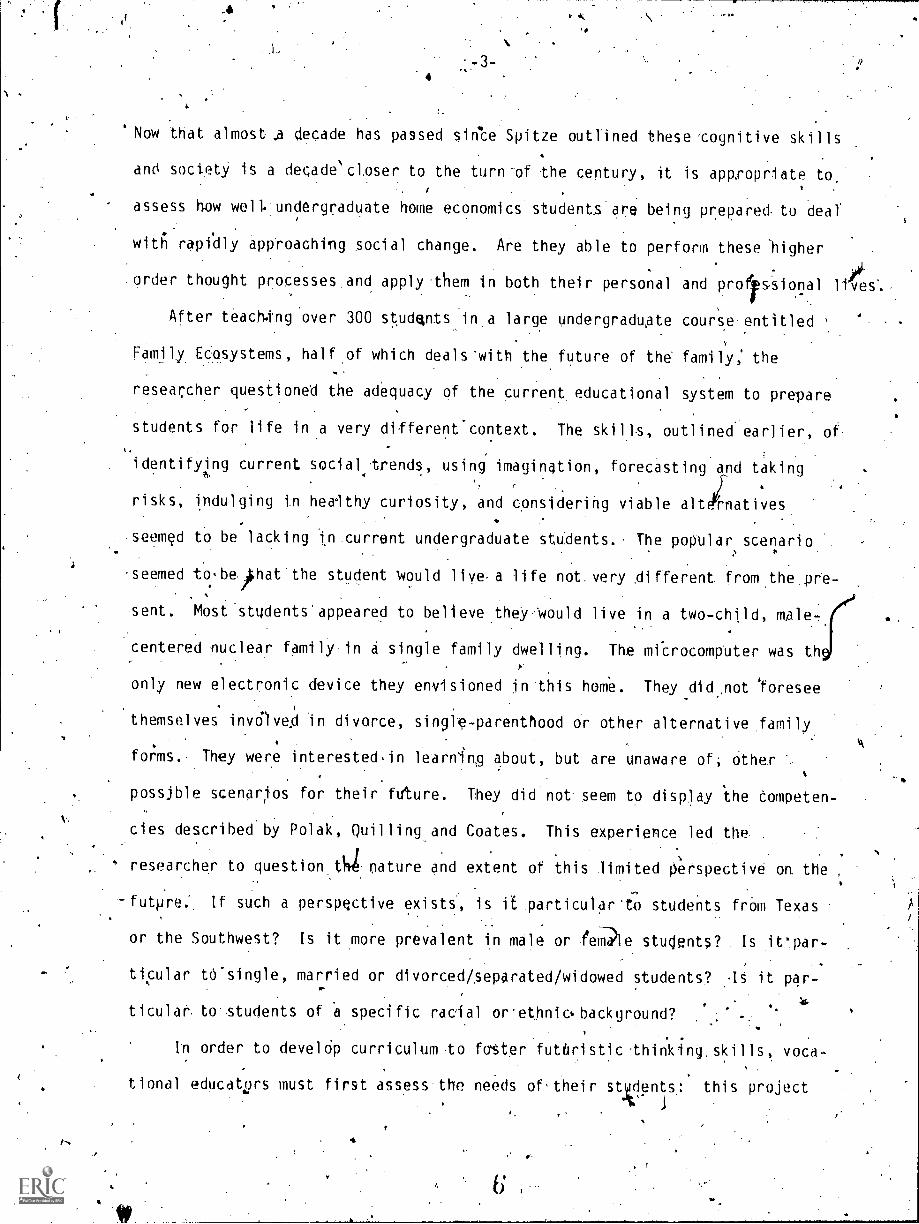
"Now that almost .a decade has passed since Spitze outlined these cognitive skills
and society is a decade` closer to the turn-of the century, it is appropriate to
assess how well undergraduate home economics students are being prepared. to deal
with rapidly app'roaching social change. Are they able to perform these higher
order thought processes and apply -them in both their personal and profirssional
After teaching over 300 students in.a large undergraduge course-entitled
Family ECosystems, half of .which deals'witn the future of the family: the
researcher questioned the adequacy of the current educational system to prepare
students for life in a very different context. The skills, outlined earlier, of
identifying current social4trends, using imagination, forecasting and taking
risks, indulging in healthy curiosity, and considering viable altinatives.
t
seemed to be lacking tn.current undergraduate students.. The popular scenario
seemed to.bepiat'the student would live-a life not. very different from the pre-
sent. Most students'appeared to believethey,Would live in a two-child,
centered nuclear family in a single family dwelling. The microcomputer was tqf
only new electronic device they envisioned in this home. They did .not 'foresee
themselves involved in divorce, single-parenthood or other alternative family,
forms.- They were interested.in learnim about, but are unaware of; Other
possjble scenarios for their fdture. They did not seem to display the Competen-
cies described by Polak, Quilling and Coates. This experience led the
researcher to questionjanature and extent of this limited Perspective on the,
-future: If such a perspective exists, is if particular'to students from Texas
or the Southwest? Is it more prevalent in male or feli1?Ie students ?. Is it'par-
ticular tO'single, married or divorced /,separated /widowed students? Is it par-..
ticulat. to.students of 'a specific racial oretnnic background?
In order to develOp curriculum to faster futhristic thinking, skills, voca-
tional educators must first assess the needs of,their stkients: this project
4
5

.attempted-to assess the state ortheArt i the perteptions of the' future. Of
current unaergraduate'stu*ts,..
The objective's. of project were:to:,, brdescribe how A national sample
of undergraduate. home economics students'perceive'their work lives in the year
2,000 based on age gender, race, marital, status, and geographic location; (2)
develop' ommendations for undergraduate vocat4a1 education curriculum and111
instruction to fosterfuturistiC thinking and (3), develop a methodology for
identifying perceptions f future work/family li;'05.Whip could be used by. voca -.
fti oval educators lb all. program areas.
MethOds
This research was carried out in three phases. In Phase One the researchers,
developed and field tested a. survey dealing with the likelihood of occurence
of specific events in undergraduate stilents' lives by the year L,000. This 100
question,survey was divided into f9ur parts with speCific questions about the
anticipated characteristics of their personal lives, work lives, physical)
.environment and health in the year 2,000. Only the results of the section on
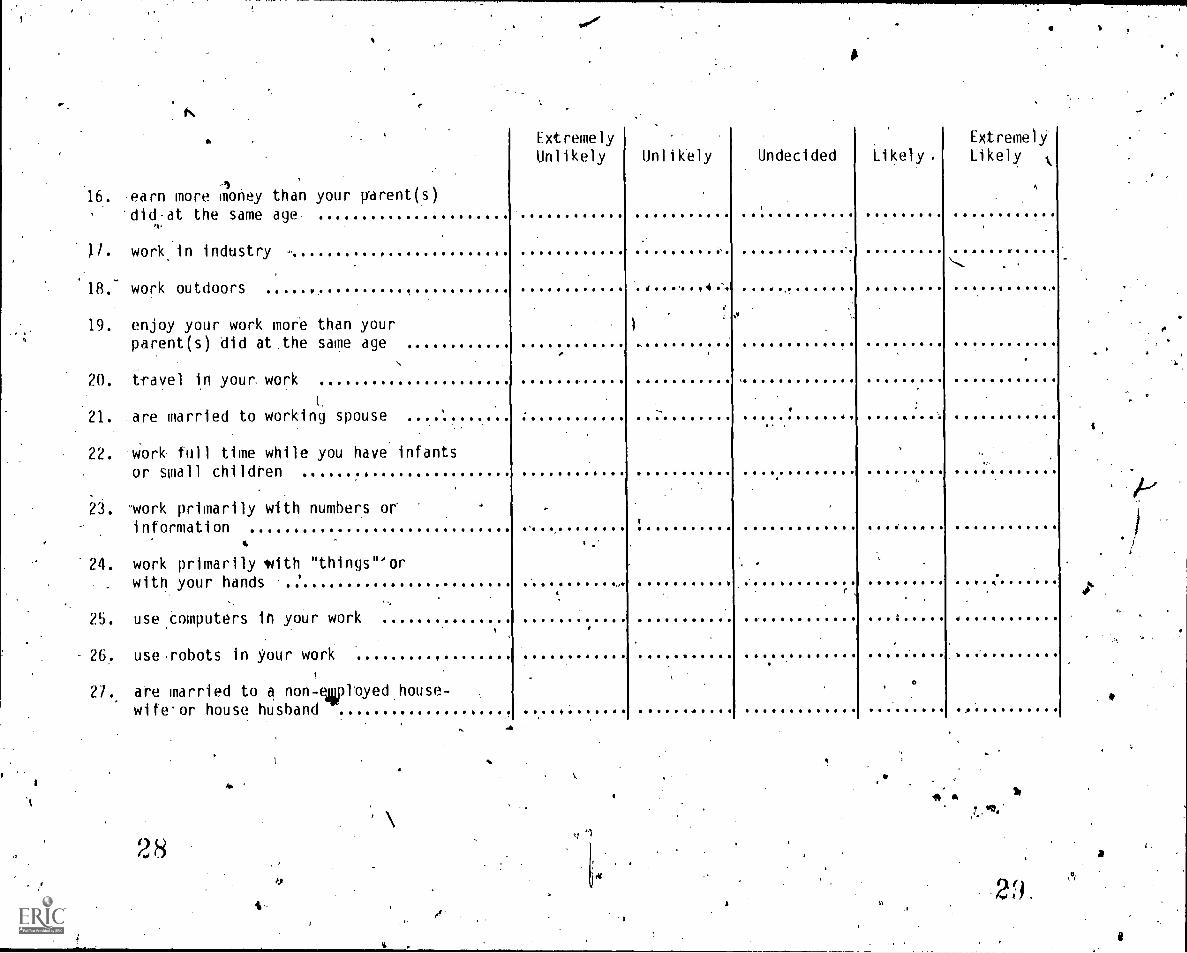
work life I be discussed here. A copy of the work lif portion Of the survey
is included,in Figup 1. Each question was written to reflect one or more of
the current themes.in the "futures" literature, Toffle (1980) describes
"second wave".tifestyles. as involving worki4g full time,. in a large industrial
organization, with few career changes. Questions 6,8,.12,14,16,17, and 24 were
included to address this lifestyle. A "third waver' lifestyle involve alter-..
native choices such as nonpaid work; entrepreneurship, informatiOn-based work,
working with robots and cOmputers and planning'work hours and work environment,
Quesions Afld 25-27 were included to address perceptions
of this lifestyle.

;This survey was reviewed for content validity by members of the facOlty
in the 1)epartment of Human Development And Cpns,Umer-Scjentes-, at
.ij'i.Ooton. 'Their areas of expertise include fa4y and child. d.?.. ,
,'nutrition and health-.consumer science, and.hoMe economics ed6Otion. It was
,
tae Uniyersit
tUdi es human...%b.
field tested using 50undergraduiate students s-enrolled in a faMily_theory.,course
.in the saM department. They Rrovided data on the: content, organi-
zation:and of. administration of the survey. The survey 'AiasTevised acco.r-
di ugly g)
In Phas the validated instrument was'admintstered tb 324 undergraduate
Home EconOmics-studehts in Antact,claSses at five pajor institutions: COrnell...,. !
. r .
Uhiversity,,the Ohio State. University:the University-of WilsconSin, Kansas State-,)
University and the University 'of- Houston,. Home EConOmics educators at each', of
these institutions were contacted. and agreed to i n this study., by
- .
administering the survey to their. students.. The researchers administered the
survey at the University -of 1ton. These institutionsWere*selected to allow
for differences in responsesthatmay be attcibutable to geographic region, a
variable of interest in this study. Th 'students were enrolled in-introductory,
classes-with approximately equal represe ation from.alt' areas of home,econo-'
mics including:. Educatioh.;. ConsumerScience-; foods, Nutrition and Dietetics;
and Child Development and Family Studies,
In Phase Three the researchers analyzed the data and attempted to address
'the research objectives identified earlier, The data were analyzed u§ing.
factor analysis, MANOVA and ANOVA.
Results'
The first step of the data analYsiS sought to fdentify the underlying dimen-
W
sions for subjects' perceptions of work lifein the year 2,000. Accordingly,.thei

o
27wOrk life questions were factor analyzed' ing principalaxis factoring.:.. 4 . 4'
(Rummel , The number of factOrs retained for rotatlon was detei:Oned by. .
several criteria; ('1) 'examination of eigenvalue magnitudes using Kaiser's
_
.(1974) normalization; (2) ,application of Cattell's ('1952) scree:test;
examination of the variance explainedvbieacOactor Factors were rotated
using varimax procedures (Kaiseri,1958)...
Results-4dentified eight factors which were able to exOWn a'substantial
. . ,
portion of the common variance ( 50 i. Factors were interpreted byconsidering-
those'questions with high loadings foie that articular-factor. Factor scores. were
computed by averaging these questions. Stores Were,Tecoded.so that a high score
represented the perception that the factOr would be present in the year 2,000
Examination of the sample'means and standard deviations for the eight work
life factors revealed several -Interesting perception's. Factors, means and stan-
dard.deviations are presented in Table 1. students tendecrto see themselves in
second' wave lifestyles..involving working full-time ( = 3.55), and having a
better job than their paents (3.75). 'Howeer, .tiVyAaw themselves, having
multiple careers (3.44), being self-employed (3.38), and having more than one
wage earner in their family .(2.02). Students* held ambivalent _perceptions of
working fdr a"large organization (2.99),_ Molding an advanced-degree (2.95), and
being'engaged in nontraditional work. (3 02).
Table 1 "about here
.This research questioned ifperceptions,of work life in the year 2,000 would. .
be different for different demographic groups: To address this question scores
for the eight mork life factors. were.categorized according to subject gender,
age, race', marital status, And. GrOup differences were tpsted'using
both multivariate. (MAOVA).and untykriate analysis of variance (AN00A).-4,

7
Genddr0 I.
Table 2 presents the means for males and females on the eight perception of
work life measures. Examination of the data Aesented.in Table 2 revealed that.
males wore more likely than females to,see themselves working for a large orga-0
nization .(3.24 and.2.96 respectively), holding an advanced degree (3,19 and 2:93
respectiely), workingfull-time (3,93 and 3.510 respectivel)): and livin4 in a
family with a single wage earner (2.70 and e.94 respectively). Males' also were)
more likely to See themselves as self-en1006yed (3.60) than were females (3.36).
Table 2 about here
.Multivariate *analysis of variance revealed. that.males and females differed1
in'their"perceptions bf work life in the year 2,000 (Wilks' lambda = .83'; F!-:1:
7.3C; p< .001).. Table 3 presents the standardized discriminant function coefi,
ficients and structure coefficiehts for the eight perception of work life.
measure's. This table also presents the results of the.univariate ANOVAs and
estimate f explained variance.
I'll
Table 3about here
Examination of the sWndatdi,zed discriminant function coefficients and
structure coefficients suggested a dimension_reppesenting a single wage earner
in the family. ThiS measure evidenced a strong positive correlation with the-
function (.95). When group centroids were plotted on a representatilbn of the
function, males were positive and distant (.74) from females (-.74). This
suggested' that males were stgnificantly'mOre likely than females, to see them-
selves as living in a family with a single wage earner by the year 2,000.4

4
Univariate results strongly supported this conclusion. In addition; uni-
variate ANOVM%revealedthat males were significantly more likely than females'
to see themselves working for a large', technologlcally-oriented organization and. .
, to see themselves wlk,ing full7lime. Males were not, more: likely.to see theM--
selves obtAning an.advanced.degree.
Age
Table 2 presents the means for the eight work life measures by the two age
groups. Examination of these means revealed that students'who were under 21.
were less likely to See themselves having multiple careers (3..28) than were qu-.
dents'who were 21 and older (3.54). Those under 21 were.less likely to see
themselves being self-emplPyed (3.15) than were 'students 21 and over (3.45).
Multivariate analysis of, variance revealed that age groups .differed In a
combination of their perceptions abclut. work in the year 2,000 (Wilks' lambda
.93; F ..2.69; p < .01). Results of this analysis- are presented in Table 4.
EXamination of the'standardized discriminant function coefficients and 'structure
coefficients suggested .a dimension' representing 'multiple career changes" .and
"being self-employed." When group centrods were plotted on this function,,stu-
dents who were 21 and older were positive and distant (.33) from students under
21 (-.33). They see themselves having multiple careers and being self-employed at
same time. UniVariate'tests substantiated this interpretation.
Race7
Table 4 about' here
In order to identity racial differences in the perception of work .life
/students were classified as "Anglo" and "Non-Anglo." Means for. these two groups
- .
are presented in Table.2. ipamination of these means revealed that Ndn-Anglos
were more likely than Anglos to see themselvesobUinlg an advanced degre
.11

9-
4
),, \ .
(3.21.vers4S-2.92.
,.having a sinagle wage ea ernr in the tbMily (2.28 versus.
41/4
4#'.
1:0), having:a-better iob than their parents (3.94 Xrsils 3.7j), .and being'
self-emplOyed'(3.69 versus 3.33).. Non-Anglos were less likely than Anglos to see
..themselves hayiniOultiple careers .(3.39,versus 3.58).
..Multivariate analysis of. variance revealed significant racial differences in
.students' perceptiOns of work life (Wilks' Laftibda = .93; F . 2.47; p .< .05).
'The results ofthis analysis are. presented in Table 5 below. .-ExaMination ofv
this data suggested- a dimension contraSting"Multiple career changes" with all.,
otherperceptions. When .group centrOjds were plotted, results indicated that
Non-Anglos were positive and distant (.38) from Antos (-.38). This suggested.1
.,, that Anglos were most likely Co see themselves having multiple careers.
,Conversely, Non-Anglds .were. more likely to emphasize having a Single wage
f ?
earner in the familf* being self-employed. To a lesser extent, they saw.
. ,.
themselv6s.obtaining an advanced degree and having a better job than their
parents. Oniva ia analyses confirmed this interpretation,,with two excep-
111°°ttons. First, esults for perceptions of having a better job approached signi-
ficance, but were not statistically 'significant (F = 3.45; R < .10). Second,
perceptions. regarding multiple career changes were.--significapt,ly different.
Table 5 about Pere
A(
Marital Status
Table 2 presents the means flOrLMarital'status. An examination of th .means
4
revealed little difference in the perceptions of 'single and married stu tS.
Single students were-somewhaXt more likely to see themselves working full- -time,
, '.,
. . ft.
(3.58 versus. 3%37) than married students., Married students were somewhat AO
likely to see themselves A being self - employed (3:51 versus 3.36).
Multivariate 'and univariate analyses confirmed that married and single students

.40:-.4
*,
were.not,signifitant-ly different in any of their perceptions of wark life in the
year 2,000,
Region
ikMidwest,' Plains, Southwest)'` The data were coded. according to where the stu-
dents spent most of their lives,not.necesarfly where they were attending school.
NiN
';44111,44,2 presents the means for students' perceptions cif work life classified`,_
by region. The cduntry was'diVcded into five regions aatt, Midwest, Apper.
.2.....y) This table reveals 'a numberof regional df6eences. ,For.example, studeitS from4
The students were approximately equally divided across all fivp regions, ..,.
.
4 ,
the plains. and from the east did not see themselves wprklng in a large organiza-,
.
tion (2.48 and 2.62'respectivelY). Similarly, students from thesb -Regions -did
gt
not Nei 'strongly Lthat they Would'havebetter jobs than 'their parents (3.42 and
3.57 respectively). In contrast, students from the east were most likely 'to see
themselVes 'abt.aining,an advanced degree. Student's from, the upper midwest were
more likely to see themselves having a single, wage earner in the family (2.16),
than werewere students from the plains (1.72) and the midwest (1.92). ..
Multivariate analysis of variance found significant regional differences
. tudents' perceptions ofwork the future (Wilks' lambda =,-,'74; F = 2.70; p <
Discrippinant analysis revealed two significant functions. The first
produced a Wilks' criterion of .74 (F = 2.7.0; 17) < .004) . The 'second produced a
Wilk' criterion of 89 (F = 1.62; p < .05). Table 6 presents the f.,andardied
discriminant function coefficients and structure coefficients%for the two func-
tions. This table also presents the univariate ANOYAs and estimates of explainedI 1'44
variance.%
Table 6 about here1.

1ti
Examination of theTesults presented above .-Suggested that the first funt-
tion represented d dimension of perception, eMphasizing Vork.fo1 r a jarge,'.. ,
technologically-oriented indwitge aid having a better job than your parents.
'this dimension de-emphasized pbtaining an advanced degree. Wren grouptentroids
were plotted on this function, students from the plains:.and.the ea.st Were nega-,
tive and distant from the other, groups (-.63 and ,.....'65.(respectively). This .
suggested thaf,tudentspfrom tlie'iiiains and east',de..:emphasized working fora
. large,4technology-oriented company and having a better job than their parents..'
These students emphasized obtaining 4n advanced, degreer This'was especially
true for students frofn the east. They saw themselves living in a family With a
,.L singlewage earner, but. not having a better job than .their parents. Exactly.the
opposite, pattern was observed for stud ants from the midwest.' A' ,
i
ussion 4
The data reveal a waivering between what Toffler (1980).calls the second and
third wave mentality. Toffler identifies a third wave societyyas,indicative of
0a new interface between work and famjly. Phenomenal as entreOeneurship,
self-help, voluntary. simplicity, cottage industry, and deentralization of power
are. increasingly prevalent dn a third wave society. This research attempted to. . .
assess the extent to which home economic's students Perceived they would be
4living in Toffler's second versus third wave society in thg year 2,000.
.Overall, as-would be expected of career-minded college students, they
perceived they would be working full-time and have a fairly high level of
O
satisfaction from their work.. However, differences appeared when the data were
broken down by aye, race, ,region, and-gender. These students did riot appear to be
homogeneous gr'oup. When broken ow% by gender and race, males and Non-Anglos
4ppeared to express a traditiJnal,, s cond wave expectation of living in a single
4

- 1 27
t.
.. ,
income family, and working for a large, centralized organization.. On the' other
haod, there is evidence of third wave expectations when males, Non-Anglos and)f
.
.
..
.. .
'I
students twenty-one and older expressed the liketthodd of being self-emOloyed.
Along the same line, males were more likely than females to expect to work for a
technologi cal ly-orientel, organi zati on.
In categorizing 4t4dents according to region of the country there appeared
to t3e differences in expectations of working for a large technologically-
oriented organization, degree of job satisfaction ,and important of an advanced
degree.. Geographic proximity did not appear to accouht,for similarities in
expectations. This-is paticularlytrue. in the similarities between students
from the plains region (primarily.Kansas) and the east (primarily New York).
These two groups were similarly different from the ,other groups in that they
perceived working for a smaller organization,'having in advanced degree and not')A
being more satisfied than their,garents. were at the same age. Students from the#
upper midwest perceived they would live in a single wage earner family and not.
be moreisatisfied than their'p4rents were at the same fige.
Table 7 summarizes the extent of second versus third wave perceptions y
b gender, region, age and race. Three fors were selected which represent what d
Toffler (1980) call's the second versus third wave society. Working for a large,
technological organization; being employed full-time, and being in a single
wage-earner ,family were grouped as. second wave.lBeing involves' in non-
. traditional work, having Iiiultiple,careers, and. being self-employed were grouped
4s third wave.-
It appears that male's, students from the east, upper midwest and midwest and
Non-Anglos tend to-liave perceptions-of living in a second wave lifestyle.
5
Students twenty-one years and older were more likely to see thernselyes in'a
I i5

9-
.1
,t
third wave lifestyle involving multiple- .careers and self-employment. Males 'were.
pore likely to see theMselves being self-employed.
Insert Table 7 Here,
Implications For Curriculum Development
Undergraduate vocational eduCation.students are, often mistakenly described as one.
homogeneous group by area. This study revealed diffdrences in work life eipec-
tations of home economics students basedlon a nu r of demographic v9riables.
Generalizability of the findings baseil. on the graphic variables of age,
marital status, gender. and .race should be itmited because the sample was-prl-
marily under 29 years old sjngle, female, and Anglo, although this accurately
reflects the home economics targetxopulation. It is important to briefly'.
include the results of the entire 100 question survey including questions about
personal life,'environment and health in ordE0 to look at the interrelationship
between work:and family and the implications for curriculum development. The
data reveal perceptions of a multi-dimensional life involving high career com-
mitment, parenthood, stable marriage; high job satisfaction extensive community
and neighborhood interaction, and significant attention A health-relIted acti-
vities. Their work and family life perceptions reveal elements of both second
and third wave ,Phenonena. For example, si- gnificant numbers Of males stated they.
would work for a large organization (2nd)aave) and also be self-employed (3rd
wave). Significant numbers of females stated they would vork with people rather
than numbers and information (2nd wave) and yet work at home and plan their work
hours and Schedule (3rd wave). .One issue appeased to create consion on the
part of the female students. While they expressed high, career and7parenthm.A.
expectations, they were divided about whether to work while they had infants and
small children.' Of 281 females, 84 stated unlikely, 65 stated undecided 'and 94
4
Iro

P -14-
6
.
liPst&likely to the question of whether thekivould work while they had infants. ,
.6..N..«.
and young children ..
, 1,-.
The Implications for voc-atiarq education, and ,particularly home economics,
urriculum and instruction are as follows: 1) curriculum needs to be:written to
account for differences in perceptions due to age, gender; and region, Within
program areas; 2) curriculum needs to be written to aid students in sorting
through preferences or.trad tional \iersbs.emerging societal patterns and
values; 3) the.changing.relo ionship between work and fa.mily expectatiOns needs
toj)e stressed; and 4) stud is need.to comprehend and learn to ranage the'
stress that-may eventually esult .from such*a multi-dirensjonal lifestyle,
including the management of time and energy. Over 170 students (49%) stated
that it was likely or extre ely likely their lives would be more stressful than
their parents' were at ;te same age. TOy need guidance in learnjng to manage
1) this stress in order tachieve the satisfying personal and work lives trey
expect.
Finally; additional research needs to be carried out to determine if similar
perceptions of work and family roles exist in students iin'other vocational
areas. The methodology outlined here may be appropriate for, use in other
program areas, particularly those that are male-dominated.

Table 1 .
r
Factors, Sample Means and Standard Deviations For
Underlying Students' Perceptions of Work Life /in the Year 2,000
Factor Mean
I_ 2.9
II 1 2.95
III 3.55
IV 1 3.02
V 2.02
vf '3.75
VII -34,44
VIII '3.38
SD
6",Description (Survey Question
A
r1,
.71 Working fora technologically-oriented organization
1.79 Obtaining an advanced educational depee (1,2,10).
.90 Being employed full-time (6,22).
.66 Engaged in non -traditional work (7,9,18,23).
4%. .59 Having a sinjle wage earner in the family (5,21,27)..
.69' Having a better job than your parents (16,19,20).
.80 Having one or more career changes"(13,15).
.80 % Being self-,employed (3.,9).
p

Table 2
Means for the.Perception of Work Life Measures_By Gender,
Age,-Race, MaTital Status, gild Region
a
peasu-re
Gender-21 21+
Race
40.
Marital Status
D
SW NainsRegion.
Male, Female Anglo Non-Anglo Tingle .ffarriedi
S
Large Organization 3.24 2.96 3'A6 I. 2.97 2.96 3.13 3.00 2,94 3.01 2.48 3.11
Advanced Degree 3.19 2.93 2.87 2.91 2.92 ..3.21 2.94. 3.04 3.04- 2.95 2.79
Full-Time Work 3.93 3.50 . 3.47 3.57 3.52 3.78' 3.58 3.37 5.58 3.48. 3,64
Non Traditional Work. 2.97 3.03 2.99 .1.11 3.03 2:99 3.14 3.01 3.09 - 3113. 2.86 3.00
Single Wage Earner 2.70 ..1.94 2.08 '2.00 1.99 2.28 -2.04 1.90. 2.07 1.72 2,.16
1444f'
Utter Work 3.83 - 3.75 3.73. 3.76 3.73 3:94. 3.741 3.86 .,3.83 3.42 3.72
1
Multiple Careers 3.60 3.47 3.28 3.54 3.58 3.39 3.48 3.50 3.46 3.3k 3.48
p ..
SelfiEmployed 3.60 3.36 3.15 3.45 3.33 3.69 . 3.36 3.51 3.53 3.27 3.29
MW East
3.14 2.62
2.96v/3.42
3.51 .3,38
3.08 . 2.0
1.92 2.08
,) .
.3.93 3.61
3.60 3.33
40/
3.4? 3.44

I
A
04.
Table 3
Multivailate and Univatiate Results for Perceptions of
6
Work Life by Gender
Measure
targe,Organization
Advanced Degree. -
Full7time Work,
Non - traditional) Work
Single Wage Earner'
iscrim
Coeffic
.91
Better Work- -.12
VMultiple Careers .01
Self- Employed .17
Struct
Coeffic F
.27 4.42*
.23 - , 3.13
.33..,
6.62**
-.07 .25
.95,,
53.70***
.07 .3.2
.11 .69
.20 2.40
eta2
.01_.
.01
.02
-- .00
.16,
.00 .
.00
.01
*.p < .05.
** p < .01
*** p < :001
N's
Males
Females = 287324
4
1

I
Table 4
IMultivariate and Univariatg Results for,Percepttons of
Work Life by Age Gaoups
Measure
Or
Large Orgdnization -:49 -.20:. / .84/
Advanced Degree-. .07 .20 .82
Full-Time Work . t .18, . ,..12 .69
. %
Non-Traditional Work -.25. . .1). . .28P'
SrAgle Wage Earner .:-.33 -.20 .89
i.
Better Work -.01 .06 .09 .00
Multiple Careers ,:70. ..51 6.68*
* ,
Self-Employed, .80 .58-, 7.45?' '
DiscrimCoeffiC.
Struct
Coeffic eta2
.00
.02
..03
*.p < .05* *p < .01
*** p < .001
N's
'under 21 = 96
21 and over = 2.22
324
O
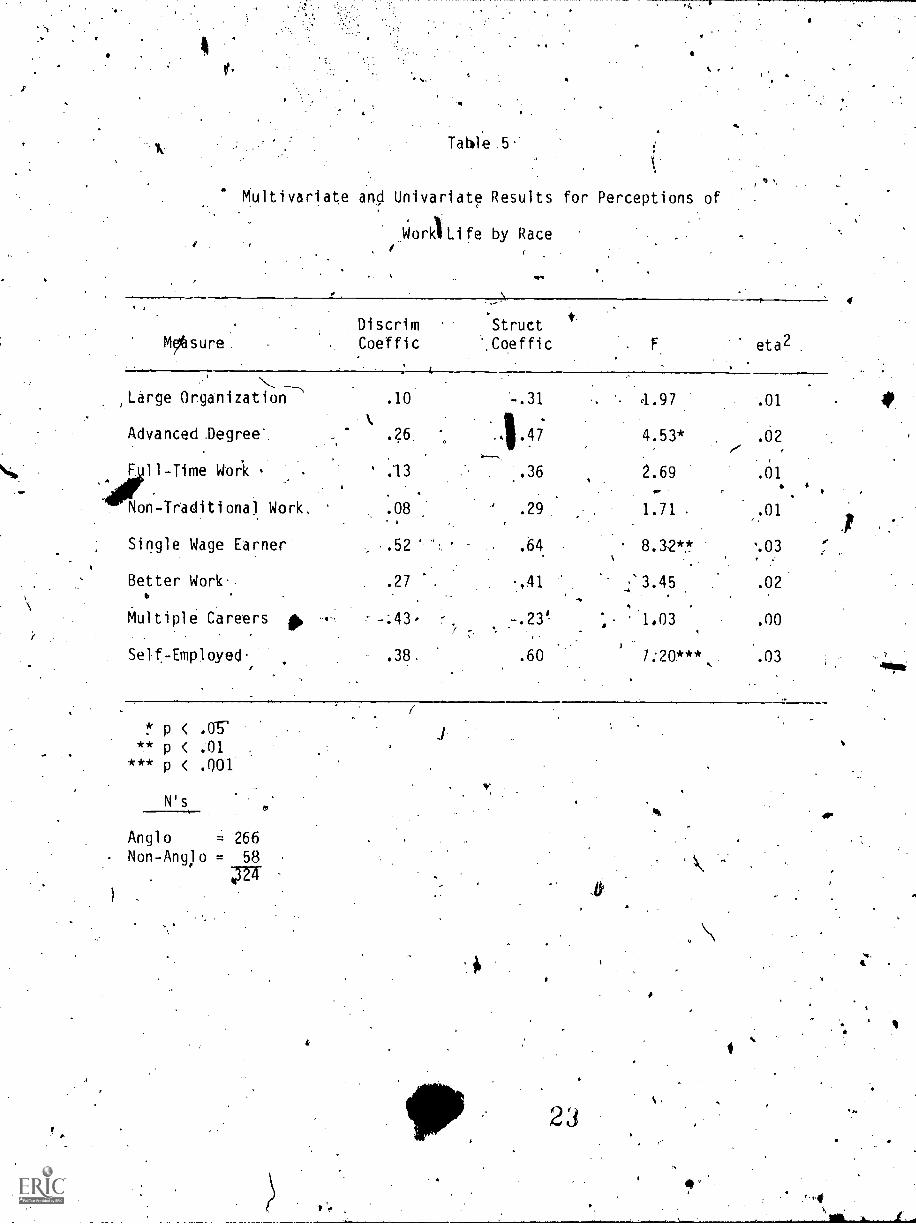
Table .5
r
Multivariate and Univariate Results for Perceptions of
Work Life by RaceI
MOsureDi scrim
CoefficStruct
',Coeffic
Large Organization
Advanced Degree'
F 11-Time Work
Non-Traditional Work.
Single Wage Earner
Better Work.
Multiple Careers
Self - Employed
.10
.26
.13
.08
..52
.27
z..
.38.
-.31
111'47
.36
,
.29
.64
-,41
-.23'
.60
eta2
, 4.97
4.53*
.01
.02
2.69...
.01
1.71 .01
8.32.41' .03
..' 3.45.
.02
1 1.03 .00
7.20*** .03
<
** p < .01
*** P < .001
N's
Anglo ='266
Non-Anglo = 58
4324
ro
(

p
Table 6
Multivariate' and Univariate Results for Perceptions of -
Work Life by Regibn .
MeasurgDistrirn Coefflc
II II
Urge Organi2ation
Advanced Degree0..
Full-Time Work
.7
7.57
.00
-.07
-.27'
.35
.74
-.32
,15 .
Non-TraditiOnal WorkI.
.37 7.12 .21..
Single-Wage Earner-i
.21 .71 '.29.)
Better Work .30. -,54 .42
Multiple. Careers. '
r'',..
4'-.,,,04 -.19 .19
Self-Employed -.19 '-.27 .01.
Struct Coe'ffic
II F eta2
-.14 7.88*** .09
-.30 3.32* ...04
.18 .54 .01.
-.24 - 1.2. .02
.58 4.36** ,.06 .
-.53 4.06*** .05
-.23' .82 .01
-.26 1.01 .01
p < .05p < .01p < .001
N's
E = 29UMW =, 93
MW =.94Plains =-37
SW = 35
288.
I-
24

0
1.0
Factor
Table
Summary of Factors By Variables
Gender Region
ael able
2nd wave .
MW ,
Large organization Mal e UMW
Employed Ful 1 Mal e
Si ngl e _Wage-Earner- Mal e E,UMW
3rd wave
Non - Traditional work
Multiple Careers
-Employed
MW = midwest.
UMW = upper, midwest
E = elst
a
O
Mal e
25
I
A e Race
Nop-An 1 o
Non-Angl o
21+ J Angl o
21+ Non-AngTo
4

to)
imagine it is your, birthday
How' likeriis it that you:
have educatten2or_training bewldthe.Matter7s degree' He .. .
4
n the year 2,000.
ON
W, 2, have education orltraJntng beyon the.doctoral degree . .. ...
M.r ,
3. plan your own wOrichourS and schedule
4. work without pay
5. bring home a large(,0Aychea' thanyour spouse A
Figure.
LIFT 'IN THE YEAR 2,000
r.
ExtremelyUnlikely
ty
4
Unlikely .Undecided
a
Likely
)
Extremely
ikely
.6 IP k
L.-
6. , work full time ........
7. work part time k.
11 :
40! ........
\h.
t),
8, work mainly with people f.
9. are selfemployed'
10. have education or training 4reyond a
bachelors,degree
'4, '41-
11. do at least half of your work at home ..
12. work in a large organization (over 500employees)
13. (are in, your second or third career'
14. work in an office
15, have changed jobs at least once
O.tt4:- 0
A ....... .
........ ,0
. a.
.11
427
17
4'4
r
a
1
-1
. earn more money than your parent(
'did.at the same age
17. work, in industry
18.- work outdoors
19. enjoy your work more than yourparent(s) did at the same age
20. travel in your work
0,`
Extremely
Unlikely Unlikely Undecided
0
Likely .
ExtremelyLikely k
21. are married to working spouse
22. work full time while you have infantsor small children
23. "work primarily with numbers or
information4
24. work primarily vith "things"'orwith your hands '
25. use Computers in your work
26. use,robots in your work
27., are married to a non-)toyed house-wifeor house husband
0
28
4'.
O
A
a

ferences
Cattell, k.13. (1952). Factor Analysis. New York: Harper and Row., 1952.
Coates-, J.F. "Personal communication to W.O. Markley. (In Futures, February1983, 50)..
Compton, N. (1972). Home Economics and Human Ecology. In The Human and HisEnvironment: Bases for Decisions Affecting Family. Proceedings of he JaniceM. Smith Symposium, University of 1111nois at Urbana - Champaign, 13.
Kafser, H.F. (1958). The vari c criterion for analytic rotation in factor analysis.Psychometrika, 23, 187-200.
Kaiser, H.F;* (1974). An'index of factorial simplicity. Psychpmetrika, 89,1K-36.
.Potak, F. (097.3). The image of the future. New York: Elsevter.
. Quilling, J.I. (1982). The challenges of a post-industrial society. Journalof Home Economics, 74, 21 -23.
Rummel, fp. (1970). Applied factor analysis. Evanston, IL: Northwestern'University Press.
Spitze, H.T. (1976). Home economics in. the future: Journal of -Home Economics,September, 69, 5-8.
Toffler, A. (1980). The third wave. New York: Bantum Books: '
t