cedr ee ray - dakota county, minnesota
TRANSCRIPT

CEDAR AVENUE TRANSITWAY Implementation Plan Update
DECEMBER 2015
Table of Contents Executive Summary ..................................................................................................................... i
Funding Sources ....................................................................................................................... v
Next Steps ................................................................................................................................ vi
Land Use and Station Area Planning .................................................................................... vi
Pedestrian and Bicycle Connections .................................................................................... vi
1. What is the Implementation Plan Update and what purpose does it serve? ..................... 1
2015 Implementation Plan Update ............................................................................................ 2
IPU Committees and Decision Making ...................................................................................... 2
IPU Management Team ......................................................................................................... 2
IPU Technical Advisory Committee (TAC) ............................................................................. 4
Steering Committee ............................................................................................................... 4
IPU Policy Makers Group ...................................................................................................... 4
Decision Making Process ...................................................................................................... 4
2. What are the goals for the Cedar Avenue Transitway and how will we measure progress towards the goals? ..................................................................................................................... 6
Goal 1: Provide a variety of safe, reliable, and attractive bus transit services in the corridor. .. 6
Goal 2: Improve mobility and accessibility within the Cedar Avenue Transitway. ..................... 6
Goal 3: Identify improvements that are cost-effective and well-positioned for implementation. 7
Goal 4: Enhance and promote transit oriented development that is compatible with community goals and helps increase ridership. ........................................................................................... 7
3. What was the public involvement process for the IPU? ..................................................... 9
Public Outreach and Engagement Activities ........................................................................... 10
Input from Public Outreach and Engagement ......................................................................... 11
Public Open Houses ............................................................................................................ 11
La Asamblea Bus Tour and Meeting ................................................................................... 12
Policy Makers Workshops ................................................................................................... 12
Draft IPU Public Comment Period ....................................................................................... 14
Resolutions of Support ........................................................................................................ 14
4. What is the Cedar Avenue Transitway? .............................................................................. 15
Existing Runningway ............................................................................................................... 15
Stations ................................................................................................................................... 15
Mall of America (MOA) Transit Station – Existing Offline Station ........................................ 17
Cedar Grove Transit Station – Existing Offline Station ........................................................ 19
140th Street Station – Existing Online Station ..................................................................... 19
147th Street Station – Existing Online Station ..................................................................... 20
Apple Valley Transit Station – Existing Online Station ........................................................ 21
Lakeville Cedar Park and Ride – Existing Offline Station (Express Service Only) .............. 22
Safety in the Corridor .............................................................................................................. 22
Historical Crash Assessment ............................................................................................... 23
MVTA Incidents and Concerns ............................................................................................ 23
Pedestrian and Bicycle Safety ............................................................................................. 23
Summary ............................................................................................................................. 23
Span of Service and Frequencies ........................................................................................... 23
Fleet ........................................................................................................................................ 26
Operations and Maintenance Facilities ................................................................................... 26
Currently Planned Improvements within the Transitway ......................................................... 27
Mall of America Station Renovation ..................................................................................... 27
28th Avenue Station Removal ............................................................................................. 28
Cedar Grove Online Station Construction ........................................................................... 28
Apple Valley Transit Station Expansion ............................................................................... 29
5. What are the future ridership estimates? ........................................................................... 30
Market Areas and Demographic Changes .............................................................................. 30
Ridership Assumptions ............................................................................................................ 31
Existing and Forecasted Ridership .......................................................................................... 32
Existing Transitway Ridership .............................................................................................. 32
Forecasted METRO Red Line and Transitway Ridership .................................................... 33
Ridership Forecasting Sensitivity Tests ............................................................................... 36
6. What improvements are being considered for the Cedar Avenue Transitway? ............. 38
Runningways ....................................................................................................................... 38
Stations ................................................................................................................................ 39
Vehicles ............................................................................................................................... 45
Operations and Maintenance Needs ................................................................................... 45

7. What will the planned improvements cost? ....................................................................... 46
Capital Costs Methodology ..................................................................................................... 46
Capital Costs ........................................................................................................................... 46
Operating and Maintenance Costs Methodology .................................................................... 48
Operating and Maintenance Costs .......................................................................................... 49
8. When will the planned improvements occur? .................................................................... 50
Transitway Staging Plan .......................................................................................................... 53
Estimated Staging Timeframes ............................................................................................ 53
Potential Future Investments ............................................................................................... 56
9. How will the planned improvements be funded? .............................................................. 57
Existing Capital Transitway Funding Sources ......................................................................... 57
Stage 1 ................................................................................................................................ 57
Planned Capital Transitway Funding Sources ........................................................................ 61
Federal Funding ................................................................................................................... 61
State/Regional Funding ....................................................................................................... 61
Counties Transit Improvement Board Funding .................................................................... 62
Dakota County Funding ....................................................................................................... 62
Municipal Funding ................................................................................................................ 62
Capital Funding Sources by Stage .......................................................................................... 63
Stage 2 Committed Transitway Funding Sources ............................................................... 63
Stage 3 - Stage 5 Anticipated Transitway Funding Sources ............................................... 63
Operating Funding Sources .................................................................................................... 63
10. What are the next steps for the Cedar Avenue Transitway, and how can other stakeholders play a role in its successful future? ................................................................. 65
Corridor-Wide Recommended Next Steps .............................................................................. 65
Land Use and Station Area Planning ................................................................................... 65
Local Service Demonstration ............................................................................................... 67
Marketing ............................................................................................................................. 67
Pedestrian and Bicycle Connections ................................................................................... 68
Landscaping and Public Art ................................................................................................. 68
Station-Specific Recommended Next Steps ........................................................................... 70

Existing Stations .................................................................................................................. 70
Cliff Road and Palomino Drive Stations ............................................................................... 71
Lakeville Cedar and 215th Street Stations............................................................................ 71

Executive Summary In 2013, the Twin Cities metropolitan area’s first bus rapid transit (BRT) line, the METRO Red Line, began station-to-station bus service between the Mall of America Station and the Apple Valley Transit Station on the Cedar Avenue Transitway. The service operates every 15 minutes throughout weekdays and every 30 minutes on weekends. The implementation of the METRO Red Line was the outcome of years of planning led by the Dakota County Regional Railroad Authority (DCRRA) and partners to
identify the best transit alternative to serve the needs of the growing south metro communities of Burnsville, Eagan, Apple Valley, and Lakeville in Dakota County.
The purpose of this 2015 Implementation Plan Update (IPU) is to identify service and facility improvements that address the many changing conditions in the corridor, community, and in the region. These changes include recent updates to forecasted employment growth, population growth, and land uses, which provide an opportunity to reassess the demand for transit service around the Cedar Avenue Transitway. Regionally, Counties Transit Improvement Board (CTIB) project funding eligibility and Metropolitan Council Regional Solicitation project prioritization and selection have also changed, which modifies the availability of these funds for the Cedar Avenue Transitway.
As part of the current IPU, goals for the Cedar Avenue Transitway were revised based on feedback from policymakers to better reflect changing conditions in the corridor and in the region, including recent updates to forecasted employment growth, population growth, and land uses. Each goal was developed in tandem with evaluation measures, thresholds, and other progress indicators to help establish priorities and meet performance goals. The revised goals are:
What is Bus Rapid Transit?
Bus rapid transit (BRT) provides fast, frequent, all-day transit service. BRT stations include premium customer amenities similar to light rail transit (LRT) stations, including radiant on-demand heat, ticket vending machines, and real-time NexTrip customer information signage.
i

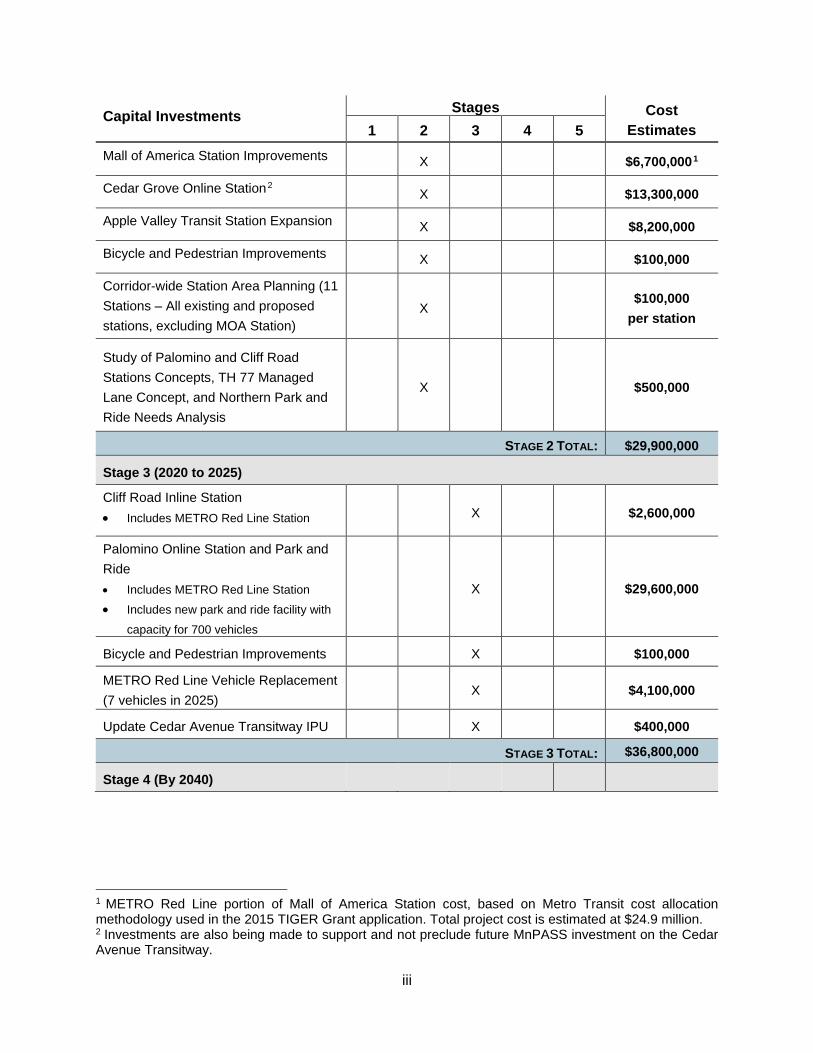
Goal 1: Provide a variety of safe, reliable, and attractive bus transit services in the corridor. Goal 2: Improve mobility and accessibility within the Cedar Avenue Transitway. Goal 3: Identify improvements that are cost-effective and well-positioned for implementation. Goal 4: Enhance and promote transit oriented development that is compatible with community goals and helps increase ridership. The 2010 IPU identified capital investments in the Cedar Avenue Transitway by stage and an associated year. The 2015 IPU establishes priorities based on when projects meet investment thresholds developed as part of the IPU process. As part of revising the goals for the Cedar Avenue Transitway, evaluation measures were developed to establish priorities and meet performance goals. The evaluation measures and thresholds identified are based on industry best practices along with some that are identified in regional planning documents. In particular, 2040 METRO Red Line station boardings and cost-effectiveness were used to prioritize and identify which stages each investment is recommended. The following table identifies future capital investments for the Cedar Avenue Transitway. The capital investments are grouped into various stages; the first stage represents previously completed projects on the Cedar Avenue Transitway. Stage 2 includes currently programmed projects, and projects identified in Stages 3 through 5 are the outcome of the technical evaluation completed for this IPU. Estimated timeframes were developed for the various stages. These actual timeframes will be dependent on when thresholds are met for the identified evaluation measures.
Capital Investments Stages Cost Estimates 1 2 3 4 5
Stage 1: Existing Cedar Avenue Transitway Elements Mall of America Station X
$110,000,000
Cedar Grove Station X
140th Street Station X
147th Street Station X
Apple Valley Transit Station X
Runningway: Bus Shoulder and Highway Improvements X
Vehicle Purchase (7 40-foot, low-floor buses - 2013) X
STAGE 1 TOTAL: $110,000,000
Stage 2: Currently Programmed Improvements (2015 to 2020)
ii
Capital Investments Stages Cost Estimates 1 2 3 4 5
Mall of America Station Improvements X $6,700,0001
Cedar Grove Online Station2 X $13,300,000
Apple Valley Transit Station Expansion X $8,200,000
Bicycle and Pedestrian Improvements X $100,000
Corridor-wide Station Area Planning (11 Stations – All existing and proposed stations, excluding MOA Station)
X $100,000
per station
Study of Palomino and Cliff Road Stations Concepts, TH 77 Managed Lane Concept, and Northern Park and Ride Needs Analysis
X $500,000
STAGE 2 TOTAL: $29,900,000
Stage 3 (2020 to 2025)
Cliff Road Inline Station • Includes METRO Red Line Station X $2,600,000
Palomino Online Station and Park and Ride • Includes METRO Red Line Station
• Includes new park and ride facility with
capacity for 700 vehicles
X $29,600,000
Bicycle and Pedestrian Improvements X $100,000
METRO Red Line Vehicle Replacement (7 vehicles in 2025)
X $4,100,000
Update Cedar Avenue Transitway IPU X $400,000
STAGE 3 TOTAL: $36,800,000
Stage 4 (By 2040)
1 METRO Red Line portion of Mall of America Station cost, based on Metro Transit cost allocation methodology used in the 2015 TIGER Grant application. Total project cost is estimated at $24.9 million. 2 Investments are also being made to support and not preclude future MnPASS investment on the Cedar Avenue Transitway.
iii

Capital Investments Stages Cost Estimates 1 2 3 4 5
Lakeville Cedar Station Improvements • Includes interim terminal station and
potential layover facility with offline
station METRO Red Line and
local/express platforms in existing Park and Ride
X $2,800,000
Park and ride capacity expansion in Northern Apple Valley or Eagan • Location to be determined as part of
stage 2: Study of Palomino and Cliff
Road Stations Concepts, TH 77
Managed Lane Concept, and Northern
Park and Ride Needs Analysis
X $8,500,000
Technology and Restriping (TSP, Fiber) [South of AVTS to Lakeville Cedar]
X $2,900,000
Bicycle and Pedestrian Improvements X $100,000
STAGE 4 TOTAL: $14,300,000
Stage 5 (By 2040)
215th Street Station • Includes new terminal station offline
platform, dedicated bus turnaround,
layover bays, and a 500 sq. ft. driver
support facility
• Current park and pool is converted to
park and ride. No expansion of existing parking lot is included.
X $3,200,000
147th Street Station Pedestrian Bridge X $3,100,000
METRO Red Line BRT Vehicle Purchase (2)
X $1,200,000
Storage and Maintenance Facility Allowance (METRO Red Line)
X $500,000
Technology and Restriping (TSP, Fiber) [Lakeville Cedar to 215th Street]
X $3,500,000
Bicycle and Pedestrian Improvements X $100,000
STAGE 5 TOTAL: $11,600,000
STAGE 2 -5 TOTAL: $92,600,000
iv

As a result of the technical evaluation, there were several projects that did not meet the threshold criteria for implementation within 2040 time horizon. While these projects were not assigned a stage within the 2015 IPU, the priority of these projects could shift to another stage if conditions change during future planning processes, including the next update of the IPU after 2020. These projects include:
• 161st Street Station • Glacier Way Station • 195th Street Station • Bicycle and Pedestrian Improvements associated with 161st Street, Glacier Way, and
195th Street stations • Additional local and express vehicle purchase (up to 12 vehicles) • TH 77 MnPASS Investment
Funding Sources Capital Funding Future stages of the Cedar Avenue Transitway are anticipated to be funded by a mix of federal, state, CTIB, Dakota County Regional Railroad Authority, regional, and municipal sources, continuing the general structure of partnership between multiple levels of government from Stage 1. Project sponsors will seek to maintain the split of 30 percent federal, 30 percent state, 30 percent CTIB, and 10 percent county/local funding for future Cedar Avenue Transitway projects. For local/express project costs, a split of 45 percent federal, 45 percent state, and 10 percent county/local funding will be targeted.
Operating Funding CTIB adopted a resolution in 2008 committing to fund 50 percent of transitway net operating subsidies for five transitways, including new and expanded Cedar Avenue BRT. The funding plan considers one-half of Red Line operations and maintenance costs and limited BRT express service already implemented, excluding fares and other system-generated revenues, to be committed funding from CTIB for Stage 1 and beyond. 46 percent of operations and maintenance costs are paid for through a Congestion Mitigation Air Quality (CMAQ) grant awarded to MVTA by the Federal Transit Administration (FTA). The remainder of net operations and maintenance expenses for Stage 1 are considered to be committed by the Metropolitan Council and MVTA from each agency’s motor vehicle sales tax and other revenues for ongoing operation of existing services.
What is the Counties Transit Improvement Board?
The Counties Transit Improvement Board (CTIB) was established in 2008, and includes five counties – Anoka, Dakota, Hennepin, Ramsey, and Washington – that have used a quarter-cent sales tax and a $20 motor vehicle sales tax to invest in and advance transit projects by awarding annual grants. CTIB works in collaboration with the Metropolitan Council and Carver and Scott Counties.
v

The annual operating cost of the full extension of METRO Red Line service in 2040 to the 215th Street Station is estimated at an additional $1.98 million annually (2015 dollars. New funding sources need to be identified for METRO Red Line and local/express net operating subsidies in Stage 2 and beyond that are not covered by CTIB or MVTA.
Next Steps Near Term Next Steps Planned capital investments and additional study to be completed in Stage 2 (2015-2020) include the following:
• Mall of America Station Improvements • Cedar Grove Online Station • Apple Valley Transit Station Expansion • Study of Palomino and Cliff Road Stations Concepts, TH 77 Managed Lane Concept, and
Northern Park and Ride Needs Analysis
Land Use and Station Area Planning Stage 2 will also include a Station Area Planning process. As part of this process and the comprehensive plan updates required by the Metropolitan Council, communities along the Cedar Avenue Transitway corridor will be asked to consider changes to land use and economic development plans within a half-mile of the planned and existing stations to encourage increased development density and more transit-friendly development patterns, with the exception of Mall of America Station. This type of change in land use and development patterns can enhance potential Transitway investments by concentrating people, jobs, and activity closer to transit.
Pedestrian and Bicycle Connections The construction of local and regional pedestrian and bicycle connections to the existing and planned station areas is included in Stage 2, as well as Stages 3-5. These connections are critical for users to safely access the stations, and will play a major role in increasing the attractiveness of the service and ridership, especially at the walk-up stations. Bicycle and pedestrian facilities connecting to the stations and on Cedar Avenue should be planned and implemented prior to or as the stations are constructed and the runningway is extended. Opportunities for connections into adjacent neighborhoods and on adjacent local and collector roadways should be continuously evaluated as new developments occur, street improvements are designed, or as opportunities to integrate cul-de-sac trail connections or other facilities present themselves.
Update of the Cedar Avenue Transitway IPU The next IPU will be completed by 2020 (Stage 3). At that time, investments will be reevaluated and the priority of projects could shift. Investments proposed in Stages 3-5 are dependent on the comprehensive plan updates and results of the next IPU.
vi

1. What is the Implementation Plan Update and what purpose does it serve? In 2013, the Twin Cities metropolitan area’s first bus rapid transit (BRT) line, the METRO Red Line, began station-to-station bus service between the Mall of America Station and the Apple Valley Transit Station on the Cedar Avenue Transitway. The implementation of the METRO Red Line was the outcome of years of planning led by the Dakota County Regional Railroad Authority (DCRRA) and partners to identify the best transit alternative to serve the needs of the growing south metro communities of Burnsville, Eagan, Apple Valley, and Lakeville in Dakota County.
The METRO Red Line and Minnesota Valley Transit Authority (MVTA) express and local bus service on the Cedar Avenue Transitway are vital components of the larger existing and planned Twin Cities regional transitway system, as displayed in Figure 1. The METRO Red Line and MVTA bus service on the Transitway provide connectivity throughout Dakota County and across the Minnesota River to the Mall of America Transit Station, a regional transit center. The service operates every 15 minutes throughout weekdays and every 30 minutes on weekends and serves five stations:
• Mall of America Station • Cedar Grove Transit Station • 140th Street Station • 147th Street Station • Apple Valley Transit Station
Transit connections to Mall of America (MOA) Station enable Cedar Avenue Transitway users to access the regional transitway network, which provides connectivity to destinations throughout the region. These destinations include downtown Minneapolis, the Minneapolis – St. Paul International Airport, the University of Minnesota, and downtown St. Paul. Transit users can also access destinations along the Cedar Avenue Transitway, including the Eagan Premium Outlet Malls in Eagan and the Minnesota Zoo in Apple Valley.
In May 2015, the METRO Red Line provided an average of 810 weekday, 707 Saturday, and 570 Sunday trips.
What is Bus Rapid Transit?
Bus rapid transit (BRT) provides fast, frequent, all-day transit service. BRT stations include premium customer amenities similar to light rail transit (LRT) stations, including radiant on-demand heat, ticket vending machines, and real-time NexTrip customer information signage.
1

2015 Implementation Plan Update Development and study of the Cedar Avenue Transitway has been underway since the late 1990s. As part of these extensive previous planning and evaluation efforts, detailed in Appendix A (Review of Previous Documents Memorandum), a long-term vision for a transitway in the Cedar Avenue corridor was developed. This vision is to provide station-to-station BRT service between the Mall of America and 215th Street in Lakeville. Previous planning efforts proposed a phased approach to implementing the station-to-station service, known as METRO Red Line. The current extent of the METRO Red Line is the first of several phases working towards the long-term vision.
The purpose of the 2015 Implementation Plan Update (IPU) is to reflect operational experience of the METRO Red Line since 2013 and changing conditions in the corridor and in the region. These changes include recent updates to forecasted employment growth, population growth, and land uses, which provide an opportunity to reassess the demand for transit service around the Cedar Avenue Transitway. Regionally, Counties Transit Improvement Board (CTIB) project funding eligibility and Metropolitan Council Regional Solicitation project prioritization and selection have also changed, which modifies the availability of these funds for the Cedar Avenue Transitway.
Following the 2010 IPU and planning of the METRO Red Line existing stations, the Metropolitan Council also released the Regional Transitway Guidelines in 2012 and amended in February 2015. These guidelines help provide consistency in transitway planning throughout the region, and guided the planning and conceptual design of all new METRO Red Line stations throughout this IPU.
IPU Committees and Decision Making Four committees provided input and direction for the 2015 IPU: the IPU Management Team, the IPU Technical Advisory Committee (TAC), the IPU Steering Committee, and the IPU Policy Makers Group. These committees facilitated discussion between the multiple local, regional, and state agencies that all have an interest in the Cedar Avenue corridor. The structure, roles, and responsibilities of each group are described below.
IPU Management Team The IPU Management Team was tasked with overall project administration and management. The IPU Management Team consisted of Dakota County staff and staff from
What is the Counties Transit Improvement Board?
The Counties Transit Improvement Board (CTIB) was established in 2008, and includes five counties – Anoka, Dakota, Hennepin, Ramsey, and Washington – that have used a quarter-cent sales tax and a $20 motor vehicle sales tax to invest in and advance transit projects by awarding annual grants. CTIB works in collaboration with the Metropolitan Council and Carver and Scott Counties.
2

MVTA, Metropolitan Council, Metro Transit, and the Minnesota Department of Transportation (MnDOT).
IPU Management Team members were actively involved in the day-to-day management of the project, served as the first screen of documentation prepared throughout the project, and guided the technical analysis process. The IPU Management Team also helped to coordinate among the partner agencies, the consultant team, and the other project committees. The IPU Management Team met approximately two times per month throughout the project.
Figure 1. Existing and Planned Transitways (2040 TPP Current Revenue Scenario)
3

IPU Technical Advisory Committee (TAC) The IPU TAC consisted of the IPU Management Team members, in addition to representatives from Hennepin and Scott Counties and the Cities of Bloomington, Eagan, Apple Valley, Farmington, Rosemount, and Lakeville. The purpose of the IPU TAC was to provide technical input to the project, including assisting in the resolution of technical issues in their field and provided guidance to the steering committee on the technical feasibility of project recommendations. The IPU TAC met monthly throughout the project. Additional technical experts that were not part of the IPU TAC were also periodically consulted throughout the project regarding specific technical products (e.g. service planning, MnDOT traffic safety).
Steering Committee The IPU Steering Committee consisted of senior staff from the project partner agencies. The purpose of the IPU Steering Committee was to make formal recommendations regarding potential project outcomes to the Dakota County Regional Railroad Authority, based on input from the Policy Maker Workshops, the other project committees, and the public and agency involvement. The IPU Steering Committee met on a monthly basis beginning in December 2014 through the completion of the project.
IPU Policy Makers Group The IPU Policy Makers Group participated in three workshops during the IPU process. The IPU Policy Makers Group was composed of elected and appointed officials (or their designated representative) from DCRRA, Hennepin County Regional Railroad Authority, the Metropolitan Council, MnDOT, the MVTA Board, and the cities within and near the corridor. The purpose of the workshops was to provide information to the elected officials and to receive input and direction on policy issues that guided and affect the project, including Transitway goals, station area land use, service changes, and evaluation measures for implementation.
Decision Making Process The decision making process for the IPU is shown in Figure 2. The IPU Management Team, IPU TAC, general public, Policy Makers Workshops, and other stakeholders all provided input on the project to the IPU Steering Committee. The IPU Steering Committee, as well as other project partners in the corridor, made formal recommendations regarding potential transit improvements to DCRAA. The DCRRA then made final recommendations to the Metropolitan Council.
4

Figure 2. IPU Decision Making Process
5

2. What are the goals for the Cedar Avenue Transitway and how will we measure progress towards the goals? The 2010 Cedar Avenue Transitway Implementation Plan established seven project goals. These goal statements indicated the desired outcomes of Transitway service and capital investments on Cedar Avenue with a specific focus on METRO Red Line BRT service.
The first of three Policy Maker’s Workshops was held in January 2015. Representatives from the Metropolitan Council, Metro Transit, MVTA, Dakota and Hennepin Counties, the Cities of Apple Valley, Eagan, Lakeville, and Rosemount, Apple Valley Chamber of Commerce, and the Apple Valley Economic Development Authority offered guidance on how goals should be prioritized and modified to reflect updates to forecasted employment growth, population growth, and land uses, which provide an opportunity to reassess the demand for transit service around the Cedar Avenue Transitway. Participants emphasized the importance of mobility, safety, convenience, efficiency, and economic development.
These changes include recent updates to forecasted employment growth, population growth, and land uses,
Following the January 2015 Policy Maker’s Workshop, an updated set of four goals were developed for the Cedar Avenue Transitway. Unlike the 2010 goals, each goal was developed in tandem with evaluation measures, thresholds, and other progress indicators to help assess progress towards reaching the goals, and to help evaluate when certain investments should be considered and shape the IPU staging plan for future investment. The evaluation measures identified were based on standard industry practice along with some that are identified in regional documents, such as the Metropolitan Council’s Regional Transitway Guidelines (2012) and the 2040 Transportation Policy Plan (TPP) (2015).
The four goals are:
Goal 1: Provide a variety of safe, reliable, and attractive bus transit services in the corridor.
The Cedar Avenue Transitway has a variety of transit services that operate within the corridor. Transit services include high frequency BRT, express bus, suburban local bus, and dial-a-ride. These Transitway services meet a diverse set of passenger trip purposes and needs, including travel that is both regionally and locally oriented. Transit service should be convenient to transit customers in the corridor.
Goal 2: Improve mobility and accessibility within the Cedar Avenue Transitway.
Increasing person throughput in the Cedar Avenue corridor is an important transportation goal for the Cedar Avenue Transitway. Transit service will balance
6
directness (fast travel times, simple routing) and access (geographic coverage, connecting transit).
Goal 3: Identify improvements that are cost-effective and well-positioned for implementation.
Project partners should advance Transitway investments that are financially reasonable when costs are considered with customer benefits. Additionally, projects should be coordinated with existing plans, policies and financial support, where applicable.
Goal 4: Enhance and promote transit oriented development that is compatible with community goals and helps increase ridership.
Transit-supportive development has the potential to increase ridership on transitways; likewise, transitways can attract new development. Thus, the opportunities for new development or redevelopment/modifications of parcels near a transitway are an important factor for assessing the potential success of a transitway.
Table 1 lists the four goals, corresponding measures, and thresholds selected to evaluate future investments in the Cedar Avenue Transitway. A detailed overview of the goal update and development process, including the 2010 IPU goals and the full list of potential evaluation measures used to arrive at the selected group of measures can be found in Appendix B (2015 IPU Goals and Evaluation Memorandum).
7

Table 1. Transitway Goals, Measures, and Development Thresholds
Transitway Goal Measure Transit Development Thresholds and Indicators
Provide a variety of safe, reliable, and attractive bus transit services in the corridor.
Station Boardings • Minimum of 200 station boardings per day by 2040
Improve mobility and accessibility within the Cedar Avenue Transitway.
Total Transitway Ridership • Total Transitway ridership to be consistent with forecast in IPU.
Access and Transit Need
• Number of zero-car households within 1/2 mile of a Transitway station
• Minority population within 1/2 mile of a Transitway station
• Low-income households within 1/2 mile of a Transitway station
Identify improvements that are cost-effective and well-positioned for implementation.
Service Effectiveness • 20 passengers per in-service hour.
Cost Effectiveness • Annual cost per rider
Funding Feasibility • Projects should be in approved financial documents. Applicable
grants and financing should be secured.
Enhance and promote transit oriented development that is compatible with community goals and helps increase ridership.
Station Area Activity • 7,000 total residents, jobs, or students within ½ mile of a station.
Density and Land Use • Residential density
8

3. What was the public involvement process for the IPU? To conduct purposeful and effective stakeholder engagement throughout the project and ensure incorporation of public input, an IPU Public Involvement Plan (PIP) was prepared at the beginning of the project. In addition to identifying the project committees and decision making process, the PIP included public outreach strategies (e.g., electronic communications, print communications, and public open houses, other agency meetings, and media relations).
The PIP also identified an extensive list of stakeholders throughout the corridor and outlined the efforts planned to identify people in the corridor that are often under-represented in a public process, including people with disabilities, people who do not speak English or speak English as a second language, ethnic minority groups and organizations, immigrant groups, and aging populations. A summary of outreach activities and feedback received throughout the project is included in this section. Full detail can be found in Appendix C (2015 IPU Public Involvement Plan), Appendix D (2015 IPU Outreach Materials), and Appendix E (2015 IPU Summary of Public Comments).
Figure 3. Example Project Information and Open House Mailer with Spanish Translation
9
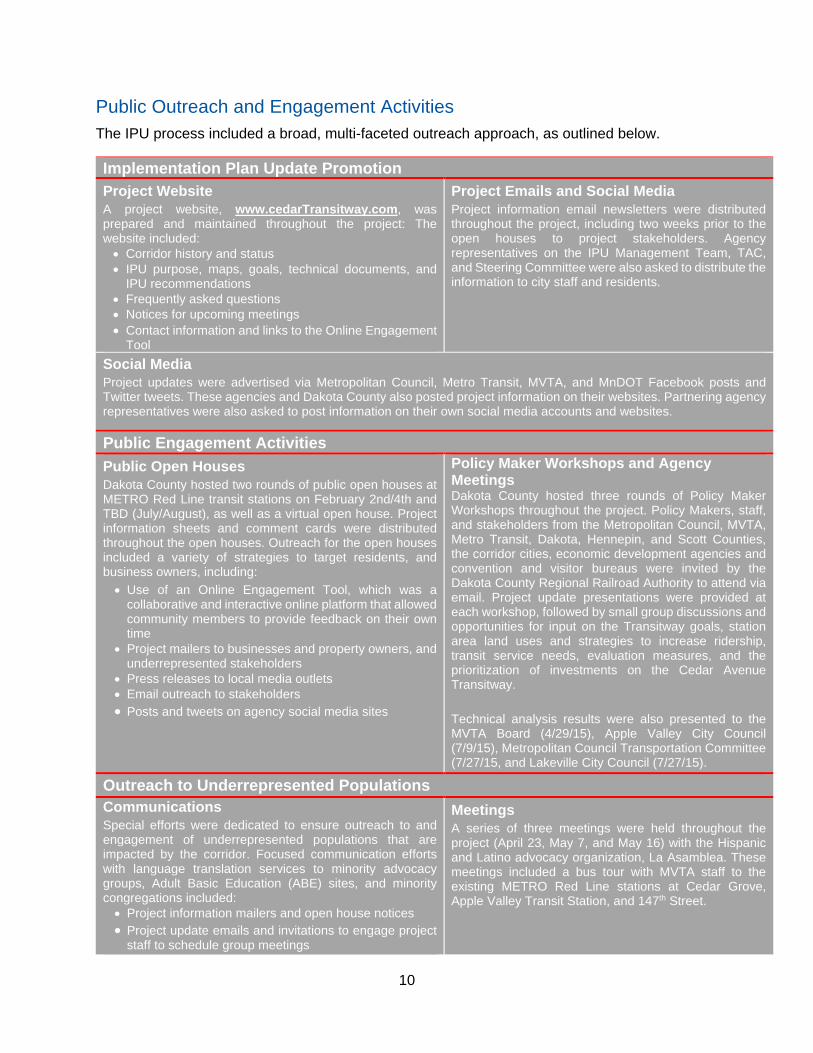
Public Outreach and Engagement Activities The IPU process included a broad, multi-faceted outreach approach, as outlined below.
Implementation Plan Update Promotion Project Website A project website, www.cedarTransitway.com, was prepared and maintained throughout the project: The website included: • Corridor history and status • IPU purpose, maps, goals, technical documents, and
IPU recommendations • Frequently asked questions • Notices for upcoming meetings • Contact information and links to the Online Engagement
Tool
Project Emails and Social Media Project information email newsletters were distributed throughout the project, including two weeks prior to the open houses to project stakeholders. Agency representatives on the IPU Management Team, TAC, and Steering Committee were also asked to distribute the information to city staff and residents.
Social Media Project updates were advertised via Metropolitan Council, Metro Transit, MVTA, and MnDOT Facebook posts and Twitter tweets. These agencies and Dakota County also posted project information on their websites. Partnering agency representatives were also asked to post information on their own social media accounts and websites.
Public Engagement Activities Public Open Houses Dakota County hosted two rounds of public open houses at METRO Red Line transit stations on February 2nd/4th and TBD (July/August), as well as a virtual open house. Project information sheets and comment cards were distributed throughout the open houses. Outreach for the open houses included a variety of strategies to target residents, and business owners, including: • Use of an Online Engagement Tool, which was a
collaborative and interactive online platform that allowed community members to provide feedback on their own time
• Project mailers to businesses and property owners, and underrepresented stakeholders
• Press releases to local media outlets • Email outreach to stakeholders • Posts and tweets on agency social media sites
Policy Maker Workshops and Agency Meetings Dakota County hosted three rounds of Policy Maker Workshops throughout the project. Policy Makers, staff, and stakeholders from the Metropolitan Council, MVTA, Metro Transit, Dakota, Hennepin, and Scott Counties, the corridor cities, economic development agencies and convention and visitor bureaus were invited by the Dakota County Regional Railroad Authority to attend via email. Project update presentations were provided at each workshop, followed by small group discussions and opportunities for input on the Transitway goals, station area land uses and strategies to increase ridership, transit service needs, evaluation measures, and the prioritization of investments on the Cedar Avenue Transitway. Technical analysis results were also presented to the MVTA Board (4/29/15), Apple Valley City Council (7/9/15), Metropolitan Council Transportation Committee (7/27/15, and Lakeville City Council (7/27/15).
Outreach to Underrepresented Populations Communications Special efforts were dedicated to ensure outreach to and engagement of underrepresented populations that are impacted by the corridor. Focused communication efforts with language translation services to minority advocacy groups, Adult Basic Education (ABE) sites, and minority congregations included: • Project information mailers and open house notices • Project update emails and invitations to engage project
staff to schedule group meetings
Meetings A series of three meetings were held throughout the project (April 23, May 7, and May 16) with the Hispanic and Latino advocacy organization, La Asamblea. These meetings included a bus tour with MVTA staff to the existing METRO Red Line stations at Cedar Grove, Apple Valley Transit Station, and 147th Street.
10

Input from Public Outreach and Engagement
Public Open Houses Stakeholder feedback from the public open houses and the online engagement tool was generally positive. Attendees were asked to provide feedback on existing service quality and frequency, amenities, multimodal connections, and needs for additional service. Feedback was complimentary of existing METRO Red Line service, and supportive of geographic expansion of the METRO Red Line service, especially to the existing Palomino Drive/Cedar Avenue area. Additional comments are summarized below.
Availability and Geographic Coverage of Service • The frequency of METRO Red Line
service is great and available when needed;
• Express buses (to Minneapolis and St. Paul) should run more frequently and need more capacity;
• Desire METRO Red Line service to serve transit-dependent populations near Palomino Drive and Cedar Avenue;
• Desire later service on special event days (Twins, Vikings, etc.);
• Route 475 needs more capacity- currently standing room only;
• Desire later and earlier service in Eagan, connections to Eagan Transit Station;
• Desire to increase the frequency on local and express routes (e.g., 445, 446, 472, 484), as existing hourly frequencies are difficult for users; expand span of service
• Desire more service to Rosemount, as well as mid-day service from St. Paul to Eagan;
• Users making weekend connections to local buses from the METRO Red Line endure long waits;
• Users desire weekend service on Route 446.
Connections (Bus, Bike/Ped, LRT) • It is difficult to plan connections to local
buses that do not run as frequently as the Transitway service;
• Existing sidewalk connections at Cedar Grove are good; need improvements to all other station areas, need improved snow clearing;
• 28th Avenue temporary station connection is important to riders;
• Desire local connections to destinations in Eagan (theater, Target) from Cedar Grove;
• Direct METRO Red Line service from Palomino Drive/Cedar Avenue to MOA
• Desire more Express service from MOA to St. Paul;
• More express trips to 46th Street Station (METRO Blue Line);
• Long Meadow Lake (Old Cedar) Bridge opening may decrease bike use of transit service;
11

• Desire local bus connections to redeveloped Lockheed Martin facility - 3333 Pilot Knob Road (Pilot Knob at Yankee Doodle, Eagan, MN).
Customer Amenities • Enclosed stations are appreciated; • Customers desire more Spanish language
customer information; • Desire better heat at shelters and stations,
security cameras, functional ticket vending machines;
• Desire to add Wi-Fi to Apple Valley Transit Station
La Asamblea Bus Tour and Meeting Feedback from the METRO Red Line Bus Tour and meeting held on May 16 with La Asamblea, an organization advocating for Spanish-speaking immigrant communities, was supportive of expansion of service to Palomino Drive and Cedar Avenue. Attendees noted that the service will be highly valuable to reach service-oriented jobs, meetings, and youth activities throughout the area that do not have regular, 8:00 a.m. to 5:00 p.m. schedules. Attendees also support increased frequency of Routes 440 and 442 to serve jobs in Burnsville, Apple Valley, and other transportation needs throughout the Cedar Avenue Transitway corridor.
Policy Makers Workshops Three Policy Maker Workshops were held during the IPU to receive input and share information with Policy Makers and key stakeholders. Key information shared and feedback themes by workshop are included in Table 2.
Table 2. Policy Maker Workshops – Key Topics and Comment Themes
Information Shared Key Themes from Small Group Discussions
Workshop #1: January 2015
Presentation: • Existing transit service
and ridership • Near-term METRO Red
Line improvements • IPU outcomes and
objectives Small Group Discussions: • 2010 IPU Goal
Revisions
2010 IPU Goal Revisions: • Goals should be consolidated to less than five goals, presented in
plain language • Participants emphasized the importance of mobility, safety,
convenience, efficiency, and economic development Transit Service Desire: • East-west transit connections desired throughout Dakota County • Adjustments to service timing at Minneapolis-St. Paul
International Airport are desired • Expanded capacity desired on express service to downtown
12
Information Shared Key Themes from Small Group Discussions
• Future transit service needs
• Station area land uses, bicycle/pedestrian connections, and strategies to increase ridership
Minneapolis, and additional service for reverse commute riders • Additional promotion/marketing – it is currently perceived by local
agencies as an impediment to increased ridership Station Area Land Use/Ridership/Bike-Ped Connections • The lack of pedestrian and bicycle access to stations is perceived
as an impediment to ridership. There is also a strong desire for east-west bicycle/pedestrian connections across Cedar Avenue and within nearby neighborhoods and commercial areas.
• There are significant planned developments which will increase density at the Cedar Grove and Apple Valley Transit Stations. Single-family residential is planned near the Lakeville-Cedar station area.
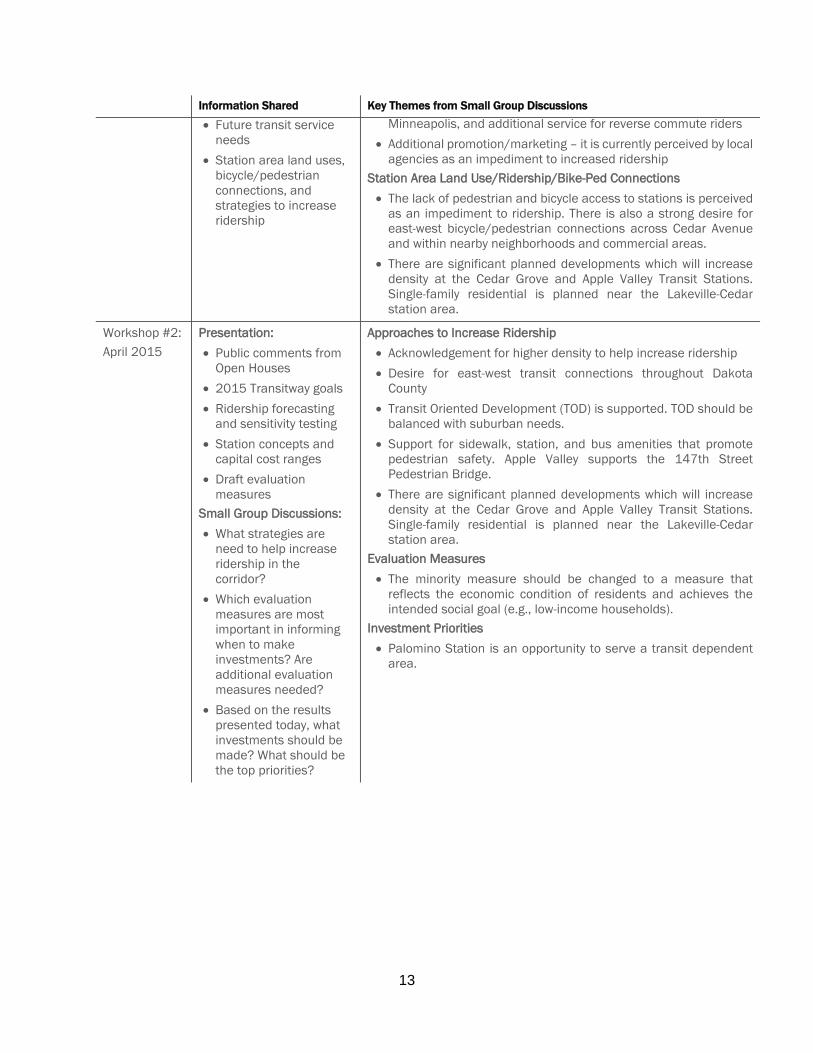
Workshop #2: April 2015
Presentation: • Public comments from
Open Houses • 2015 Transitway goals • Ridership forecasting
and sensitivity testing • Station concepts and
capital cost ranges • Draft evaluation
measures Small Group Discussions: • What strategies are
need to help increase ridership in the corridor?
• Which evaluation measures are most important in informing when to make investments? Are additional evaluation measures needed?
• Based on the results presented today, what investments should be made? What should be the top priorities?
Approaches to Increase Ridership • Acknowledgement for higher density to help increase ridership • Desire for east-west transit connections throughout Dakota
County • Transit Oriented Development (TOD) is supported. TOD should be
balanced with suburban needs. • Support for sidewalk, station, and bus amenities that promote
pedestrian safety. Apple Valley supports the 147th Street Pedestrian Bridge.
• There are significant planned developments which will increase density at the Cedar Grove and Apple Valley Transit Stations. Single-family residential is planned near the Lakeville-Cedar station area.
Evaluation Measures • The minority measure should be changed to a measure that
reflects the economic condition of residents and achieves the intended social goal (e.g., low-income households).
Investment Priorities • Palomino Station is an opportunity to serve a transit dependent
area.
13

Information Shared Key Themes from Small Group Discussions
Workshop #3: July 2015
Presentation: • Policy Workshop #2
Recap • Evaluation Measures • Station concepts and
capital cost ranges • Staging Plan
Small Group Discussions: • What actions can cities
undertake to help realize the proposed investments?
• What are your thoughts on the Staging Plan?
Actions to Help Realize Proposed Investments • Support for increased density in station areas • Acknowledgement of limited funding for proposed investments
Staging Plan Feedback • Support for future Station Area Planning • Support for the future study of Palomino, Cliff, TH 77 to better
understand concepts, costs, operations, and park and ride locations
• City of Apple Valley preference to move the 147th Street Pedestrian Bridge into Stage 4 or Stage 5
Draft IPU Public Comment Period On July 28, 2015, the DCRRA initiated a 30-day public comment period on the Draft IPU. During this period, there were 118 individual submissions with 194 distinct comments. Submissions were primarily received via email. 110 submissions provided 182 distinct comments on the design concept for a Palomino Drive Station for express and METRO Red Line Service. All public and agency comments are included in Appendix E. A majority of the submissions received focused on the loss of accessibility to Highway 77 at Palomino Drive and local traffic impacts. Following the Draft IPU public comment period, minor modifications were made to the Draft IPU to incorporate the input received.
Resolutions of Support Following the IPU Public Comment period, the corridor cities also presented the Draft IPU to their respective city councils and provided resolutions of support. All resolutions are included in Appendix F (2015 IPU Resolutions of Support).
14
4. What is the Cedar Avenue Transitway?
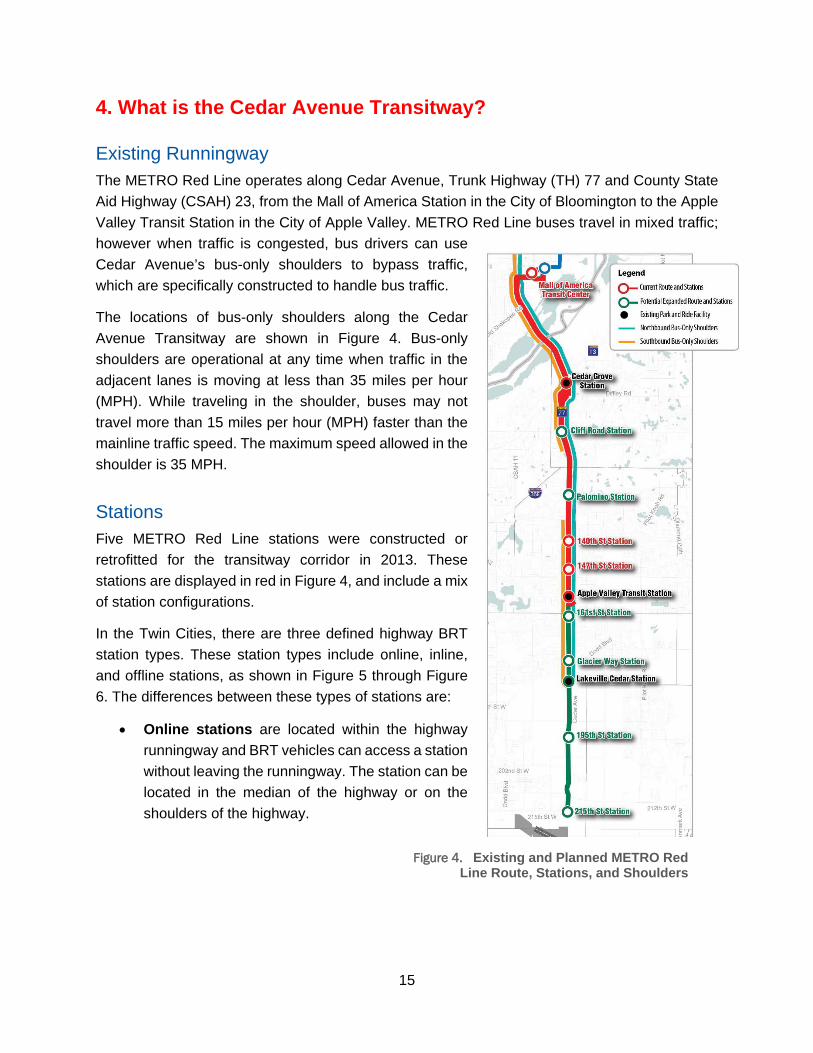
Existing Runningway The METRO Red Line operates along Cedar Avenue, Trunk Highway (TH) 77 and County State Aid Highway (CSAH) 23, from the Mall of America Station in the City of Bloomington to the Apple Valley Transit Station in the City of Apple Valley. METRO Red Line buses travel in mixed traffic; however when traffic is congested, bus drivers can use Cedar Avenue’s bus-only shoulders to bypass traffic, which are specifically constructed to handle bus traffic.
The locations of bus-only shoulders along the Cedar Avenue Transitway are shown in Figure 4. Bus-only shoulders are operational at any time when traffic in the adjacent lanes is moving at less than 35 miles per hour (MPH). While traveling in the shoulder, buses may not travel more than 15 miles per hour (MPH) faster than the mainline traffic speed. The maximum speed allowed in the shoulder is 35 MPH.
Stations Five METRO Red Line stations were constructed or retrofitted for the transitway corridor in 2013. These stations are displayed in red in Figure 4, and include a mix of station configurations.
In the Twin Cities, there are three defined highway BRT station types. These station types include online, inline, and offline stations, as shown in Figure 5 through Figure 6. The differences between these types of stations are:
• Online stations are located within the highway runningway and BRT vehicles can access a station without leaving the runningway. The station can be located in the median of the highway or on the shoulders of the highway.
Figure 4. Existing and Planned METRO Red Line Route, Stations, and Shoulders
15

• Inline stations are located adjacent to the runningway and usually require BRT vehicles to exit the runningway to access a station. Few or no turns are required for inline stations as they are typically located on the access ramps of the highway. Inline stations offer a significant time savings over offline stations and typically will not require the significant cost of online stations.
• Offline stations require BRT vehicles to leave the runningway to access a station. This is often to access a nearby park and ride facility that is not directly adjacent to the runningway or a transit center with many connecting transit routes.
Figure 5. Online Stations, METRO Red Line 147th Street Station and Apple Valley Transit Station in Apple Valley, MN
Figure 6. Inline Station, Louisiana Avenue Transit Center in Saint Louis Park, MN
16

Figure 7. Offline Station, Cedar Grove Park and Ride in Eagan, MN
All existing METRO Red Line stations contain a variety of amenities, including emergency telephones, enclosed shelters, real time NexTrip signage, security cameras, bicycle racks, a sign and speaker for bus times for the visually impaired, and ticket vending machines at the 140th Street, 147th Street, and Apple Valley Transit Station northbound stations, as well as the Cedar Grove Transit Station, and the Mall of America (MOA) Transit Station. All stations have level passenger boarding with the METRO Red Line vehicles.
A full evaluation of station conditions, configurations, operations, and improvement needs is available in Appendix G (Station Conditions Review Memorandum).
Mall of America (MOA) Transit Station – Existing Offline Station The MOA Transit Station is a multimodal transit facility that serves bus, LRT, BRT, bicycle, and pedestrian needs in Bloomington, MN. The MOA Transit Station is located on the MOA site with access from 24th Avenue South. This station is the northern terminus of the METRO Red Line service.
The MOA Transit Station serves as a major transit transfer point and terminus for transit with eight Metro Transit bus routes (5, 54, 415, 515, 542, 539, 540, and 538), one MVTA bus route (444), and the METRO Blue Line, the METRO Red Line, and ADA paratransit service. Additionally, up to four future Arterial BRT lines, identified by the Metropolitan Council, are planned to provide service at the MOA Transit Station between 2015 and 2040.
The current bus operation for the facility has the buses entering the site from 24th Avenue South, where they wait in mixed traffic to pass through a security gate. The mixed traffic consists of Metro
17

Transit and MVTA regular route buses, ADA paratransit buses, MOA employee and contractor vehicles, and delivery trucks. This condition results in a long queue of vehicles backed up on 24th Avenue South (sometimes longer than a block) with the potential for traffic safety issues, as shown in Figure 9. Entry of transit vehicles into the station is unpredictable and creates delays. The current operation of the facility requires buses to have separate alighting, layover, and boarding locations. This type of operation results in buses crossing the METRO Blue Line LRT tracks multiple times. The layout of and operations within the current facility also creates challenges for pedestrians crossing between alighting, boarding, and layover areas.
Figure 8. Photographs of the current temporary METRO Red Line Platform
Figure 9. Traffic Queue on 24th Avenue South Entering the Mall of America Transit Station
18

Cedar Grove Transit Station – Existing Offline Station The Cedar Grove Transit Station is located at the southeast quadrant of TH 77 and TH 13 in Eagan, MN. Cedar Grove is an existing offline station and park and ride facility. The station and park and ride are accessed from Nicols Road. The park and ride has 166 spaces with 29 percent usage, according to the 2013 Annual Regional Park and Ride System Report. An MVTA modal use study found that the station is used primarily for transfers and pedestrian activity. The new Twin Cities Premium Outlets, which opened in August 2014, are located 0.2 miles northeast of this existing offline station and park and ride facility.
The Cedar Grove Transit Station serves MVTA local routes 437, 438, 444, and 445, MVTA express routes 475, 475U, 491, and 492, and METRO Red Line. Cedar Grove Transit Station does not have direct access from TH 77. Transit vehicles exit at Diffley Road and drive north on Nicols Road to the station and reverse the route to return to TH 77. The northbound route adds 1.8 miles and the southbound trip adds about 2.3 miles, which adds over 10 minutes of travel time per round trip. There is one METRO Red Line platform on the south side of the station with MVTA local vehicles stopping on the north side of the station.
Figure 10. Cedar Grove Transit Station
140th Street Station – Existing Online Station 140th Street Station is located approximately 500 feet north of 140th Street in Apple Valley, MN. The station was constructed for METRO Red Line service. There is one METRO Red Line platform on each side of Cedar Avenue just north of 140th Street in Apple Valley, MN. No local bus service is provided at this station. MVTA Local and Express routes 440 and 476 serve bus stops located on 140th Street southwest of the METRO Red Line Station at Pennock Avenue approximately 0.4 miles from the METRO Red Line Station.
19

Figure 11. 140th Street Station
147th Street Station – Existing Online Station The 147th Street Station is located approximately 600 feet north of 147th Street intersection in Apple Valley, MN. The station was constructed for METRO Red Line service. There is one METRO Red Line platform on each side of Cedar Avenue. No local bus service is provided at this station, but MVTA Local Route 440 serves the bus stops located on 147th Street and Pennock Avenue, approximately 0.4 miles southwest of the METRO Red Line Station.
20

The station was designed and constructed with the structural capacity to allow future pedestrian skyway over Cedar Avenue between the north and southbound platforms.
Figure 12. 147th Street Station
Apple Valley Transit Station – Existing Online Station Apple Valley Transit Station is an online station and park and ride facility located in Apple Valley, MN. The northbound station is located on the east side of Cedar Avenue, where it is connected to the park and ride facility. The southbound station is located on the west side of Cedar Avenue. The northbound and southbound stations are connected by a pedestrian skyway across Cedar Avenue. The stations are also climate controlled and include public restrooms and bicycle lockers.
Apple Valley Transit Station serves MVTA Routes (420, 440, 442, 475, 475U, 477, 480) and METRO Red Line. It is currently the southern terminus for METRO Red Line service. 2014 park and ride usage is at approximately 110 percent of capacity of the existing 750 parking spaces (264 surface stalls, 486 structured parking stalls, and 60 stalls in the adjacent Gaslight Drive
21

overflow site immediately south of AVTS). Buses and automobiles access the park and ride structure and adjacent parking lot from Garrett Avenue.
Figure 13. Photographs of Apple Valley Transit Station
Apple Valley Layover Facility The northbound station of the Apple Valley Transit Station is also adjacent to the new Apple Valley layover facility, completed in April 2015. It replaces a layover facility located in the southeast quadrant of Garrett Avenue and Gaslight Drive.
Lakeville Cedar Park and Ride – Existing Offline Station (Express Service Only) Lakeville Cedar Station is located at 181st Street in Lakeville, MN. The facility is a transit station and park and ride with 190 parking stalls. The METRO Red Line does not currently stop at this location. Express service (Route 477V) provides four trips per day to the Lakeville Cedar Park and Ride, funded by CTIB and the Metropolitan Council. There is no layover activity. Metro Transit constructed the facility in 2009, funded in part with federal Urban Partnership Agreement (UPA) funds. Metro Transit currently owns and maintains the facility.
The park and ride was at seven percent of capacity in the 2013 Annual Regional Park and Ride System Report. Some of the park and ride usage is park and pool.
Safety in the Corridor As part of the IPU, a safety assessment was completed for the Cedar Avenue Transitway Corridor. The assessment focused on the improved segments of the corridor which overlap with the existing METRO Red Line service area. These improvements potentially impacting safety and operations included the addition of general purpose travel lanes, bus-only shoulders, trail improvements, and traffic signal system upgrades, and span from 138th Street to 160th Street (CSAH 46). Additional detail is included in Appendix H (2015 IPU Safety Assessment).
22

Historical Crash Assessment During the first year following the Cedar Avenue Transitway improvements, the corridor saw an increase in travel. The overall number of collisions increased in 2014, compared to the previous four years. However, the severity rate and number of injury collisions decreased in 2014 compared to the two years prior to the improvement project. Given the recent project on CSAH 23 which changed the roadway characteristics, a one year comparison would not be reflective of actual safety conditions along CSAH 23.
MVTA Incidents and Concerns MVTA customer contact and incident data from February 2014 to May 2015 was also considered as part of the safety assessment. Eleven reports were created in the study area during this timeframe; eight of these reports involved buses in active service. The incidents reported primarily involved rear-end or sideswipes between a vehicle and the bus. The incident reports and data did not reveal a strong pattern that required action either from an educational or engineering perspective.
Pedestrian and Bicycle Safety The Cedar Avenue Transitway project included trail and signal system upgrades to accommodate non-vehicular traffic. Similar to the difficulties discussed for overall collisions, assessments of pedestrian and bicycle crash data with only one year of information since a major improvement is rather limited in its implications and relevance. There was one reportable bicycle collision in 2014 and no pedestrian crashes. This is a reduction compared to the years prior to construction (2010 and 2011). Based on the collision history, overall the system seems to be operating well from a safety perspective for non-motorized users.
Summary Assessing historical crash data during a time frame when recent construction has occurred makes it difficult to identify safety issues over time, and using one year of data is not reflective of the actual safety conditions. Dakota County transportation staff will continue to monitor safety on CSAH 23, as is done throughout the system. Review will help determine if, over time, there are any specific intersection issues or crash trends along the corridor that need to be evaluated in greater detail.
Span of Service and Frequencies As of August 2015, METRO Red Line weekday service operates generally from 5:00 a.m. to 12:30 a.m. Weekday frequencies are every 15 minutes from start of service to the end of the afternoon peak period and every 30 minutes thereafter. Saturday, Sunday, and holiday service operates at 30 minute frequencies generally from 6:45 a.m. to 12:00 a.m. Beginning on August 22, 2015, additional trips were added to the Minneapolis-St. Paul International Airport to accommodate
23
workforce shifts and improving timing for connections and transfers. Future service schedules will be subject to change over time to adjust to actual ridership patterns and demand. The current Red Line station-to-station scheduled travel time from Apple Valley Transit Station to Mall of America Station, via the 28th Avenue Station, is 27 minutes in the northbound direction. The southbound scheduled travel time from Mall of America Station to Apple Valley Transit Station is 23 minutes during the a.m. peak and midday periods.
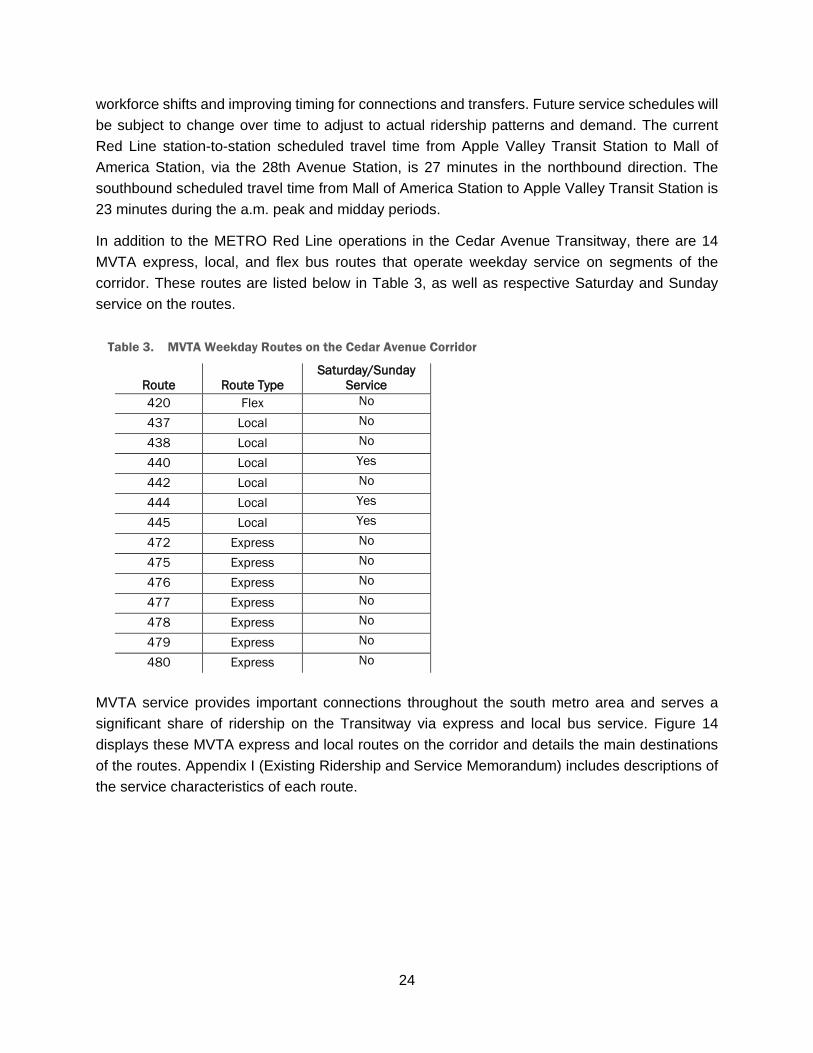
In addition to the METRO Red Line operations in the Cedar Avenue Transitway, there are 14 MVTA express, local, and flex bus routes that operate weekday service on segments of the corridor. These routes are listed below in Table 3, as well as respective Saturday and Sunday service on the routes.
Table 3. MVTA Weekday Routes on the Cedar Avenue Corridor
Route Route Type Saturday/Sunday
Service 420 Flex No
437 Local No
438 Local No
440 Local Yes
442 Local No
444 Local Yes
445 Local Yes
472 Express No
475 Express No
476 Express No
477 Express No
478 Express No
479 Express No
480 Express No
MVTA service provides important connections throughout the south metro area and serves a significant share of ridership on the Transitway via express and local bus service. Figure 14 displays these MVTA express and local routes on the corridor and details the main destinations of the routes. Appendix I (Existing Ridership and Service Memorandum) includes descriptions of the service characteristics of each route.
24

Figure 14. METRO Red Line and MVTA Express and Local Routes in the Cedar Avenue Transitway
25

Fleet The METRO Red Line fleet consists of seven, low-floor 40-foot buses. Each vehicle is equipped with Wi-Fi service. Buses are owned by the Metropolitan Council, operated by MVTA under a contract with the Council, and branded as part of the regional METRO fleet to maintain the METRO brand of high-frequency service and minimize confusion for customers using the METRO Red Line and other METRO branded services in the Twin Cities.
Figure 15. METRO Red Line BRT Vehicle
Operations and Maintenance Facilities The Eagan Bus Garage is the primary facility used for METRO Red Line bus storage and maintenance. The garage was expanded from 80,000 square feet to over 104,000 square feet in 2013 to accommodate the METRO Red Line vehicles, plus MVTA’s expansion needs. The DCRRA granted $2.8 million of CTIB funds to MVTA in May 2013 for the project. Expansion included storage capacity for 40 additional vehicles and three additional maintenance bays.
What is the METRO brand? The METRO system is a regional network of Transitways that offer frequent, all-day service between stations with enhanced amenities, such as heat and real time NexTrip signage. The METRO brand, which includes the METRO Red Line, supersedes the operating brand (e.g., MVTA or Metro Transit).
26

Currently Planned Improvements within the Transitway Mall of America Station Renovation Metro Transit is in the process of redesigning the Mall of America Transit Station, which is currently the busiest transit station in the region and serves over two million passengers per year. The purpose of the project is to improve efficiency of transit operations within the station; existing design requires local, express, and BRT vehicles to cross over LRT tracks, which can cause delay and safety concerns as LRT vehicles are entering and exiting the facility. The planned improvements will also improve the comfort and aesthetic appeal of the station.
The Mall of America Station renovation project is estimated at $25 million. Metro Transit has secured $14 million of funding from internal resources, the City of Bloomington, and 2017 Congestion Mitigation Air Quality (CMAQ) funding. Other funding sources are being pursued for the remaining $11 million need. Preliminary design is scheduled to begin in fall 2015. Construction is scheduled to begin in summer 2016 and be completed by late fall 2017.
Figure 16. Mall of America Transit Station Rendering
27

28th Avenue Station Removal In addition to the five existing METRO Red Line Stations, northbound METRO Red Line trips also currently stop at the corner of 82nd Street and 28th Avenue, as shown in Figure 13. This stop was intended to be a temporary stop until the reconstruction of Lindau Lane was completed. Lindau Lane is now completed and open to the public. However, repeated test runs show that the Lindau Lane routing does not currently provide consistent travel times. Based on 2015 analysis, MVTA and Metro Transit agreed that the 28th Avenue route is more reliable until future improvements are available.
Figure 17. Existing Routing with Temporary 28th Avenue Stop
Cedar Grove Online Station Construction Metro Transit is designing improvements to the Cedar Grove Transit Station. An added online station will be located in the median of TH 77. The new online station design was selected as the preferred concept through a collaborative process between MnDOT, Dakota County, and a wide range of other partners and stakeholders. The design is expected to reduce METRO Red Line round trip travel times by 10 minutes by eliminating approximately 3.5 miles of the existing routing and 10 traffic signals.
The new online station platform in the median of TH 77 will be connected by enclosed skyway to the existing offline Cedar Grove Transit Station/park and ride area on Nicols Road (see Figure 18). Once the new online platform is open, transit riders will use the skyway to get to the median platform and METRO Red Line buses will serve the station without exiting the highway. The station design will not preclude MVTA express buses from future use of the online platform. Local buses will continue to use the offline facility adjacent to Nicols Road.
Funding for the project is secured from CTIB (80 percent), state bonds (10 percent), and DCRRA (10 percent) for the $13 million project. Construction is planned in 2016 and the station is planned to open in 2017.
28

Figure 18. Cedar Grove Online Station Layout
Apple Valley Transit Station Expansion The existing Apple Valley Transit Station (AVTS) park and ride facility is operating at 110 percent capacity. Approximately 50 vehicles per day use the Gaslight Drive overflow parking lot and former MVTA layover site, which is located immediately south of the AVTS site in the southeast quadrant of Garrett Avenue and Gaslight Drive. To expand the current capacity of 768 spaces to meet existing and forecasted demand, MVTA received federal funding and regional transit capital (RTC) funding for a $6.6 million two-level, 330 parking space expansion to the ramp.
29

5. What are the future ridership estimates? To understand the future needs of the Cedar Avenue Transitway and inform planning and design processes, ridership forecasting and sensitivity tests for the METRO Red Line were completed as part of the IPU. In addition to the METRO Red Line, forecasts were also completed for the planned METRO Orange Line to better understand the travel markets and, demand between the two corridors. This section of the IPU presents the results of the METRO Red Line.
The Metropolitan Council’s 2040 Regional Travel Demand Forecasting model was used to develop the forecasts. This model uses assumptions about expected development, redevelopment, and transportation system changes along with data about typical travel behavior to estimate changes in transit ridership due to different transit improvements.
Market Areas and Demographic Changes The study area for the Cedar Avenue Transitway includes much of western Dakota County, as well as southeastern Hennepin County. The suburban portion of the corridor is expected to increase by approximately 118,000 persons and 85,000 jobs between 2010 and the year 2040. These increases are 29 and 38 percent, respectively, over existing numbers.
Within the study area several types of markets exist. First, different access markets reflect the ability of potential Transitway users get to or from the Transitways: walk, bicycle, feeder/connecting transit, and automobile (park and ride or kiss and ride). Second, the markets relate to the time and purpose of travel. These markets influence the overall ability of a transit route to draw riders.
Figure 19 depicts the market area for the METRO Red Line, when extended to a future 215th Street Station, in red. The future METRO Orange Line (Phase 1 to Burnsville) and market area is depicted to the west of METRO Red Line to illustrate the influence each corridor has on the western Dakota County and Hennepin County markets. Note this figure does not include the influences of the corridor express service. The market areas for the Red and Orange lines overlap and usage depends on the destination of corridor transit trips. The METRO Red Line better serves transit trips destined for the south loop area near the Mall of America and the Hiawatha Corridor via the METRO Blue Line, while the METRO Orange Line better serves transit trips destined for downtown Minneapolis and destinations along I-35W. Both corridors provide good connectivity to local bus service expanding the market area to include other parts of Dakota County, the I-494 corridor, Bloomington, and south Minneapolis.
30

Figure 19. Market Areas for the METRO Red Line
Ridership Assumptions The METRO Red Line functions within the regional transitway network of the Twin Cities transit system. Connections provided to the corridor promote access and mobility for trips beyond the METRO Red Line. As part of the 2040 future ridership modeling, the Metropolitan Council’s 2040 Transportation Policy Plan regional improvements are assumed as part of the regional transit network. These improvements include the METRO Orange Line and the Chicago-Fremont Avenue Arterial Bus Rapid Transit (ABRT) line to the Mall of America. Two other ABRT routes, American Boulevard and West 7th Street, are not included because they are not currently funded in regional plans. Although it is under study by Ramsey County and would likely join the METRO Red Line at MOA, the Riverview Corridor is also not currently identified or funded in regional plans and was also excluded from the regional transit network. No funded highway improvements for the METRO Red Line corridor are included in the 2040 TPP; therefore, the existing highway configuration was assumed for both alternatives.
Improvements to the METRO Red Line included in the forecasting model include full service expansion to the Cliff Road and Palomino infill stations at 2015 service levels (i.e., service from
31

5:00 a.m. to 12:30 a.m. with 15-minute frequencies from 5:00 a.m. through the afternoon peak and 30 minutes thereafter) and extension of service to five additional stations south of the existing terminus at Apple Valley Transit Station, terminating at the 215th Street Station. All currently programmed improvements in the corridor are assumed in the modeling, including the Mall of America Transit Station renovation, online platform addition at the Cedar Grove Transit Station, and removal of the 28th Avenue Station. METRO Red Line frequency and span of service are assumed to remain at existing high levels of service.
Increases in frequency and additional east-west connections are assumed for MVTA local and express bus service. These improvements include the addition of local route 422 between Apple Valley Transit Station and Dakota County Technical College, increased AM and PM trips for six express routes, and the addition of two local east-west routes in Dakota County. Numerous MVTA express routes will also serve the Cliff Road, Palomino, Lakeville Cedar, and 215th Street METRO Red Line stations, which will improve accessibility for corridor residents. Final local and express bus service expansion decisions will be made by MVTA and the Metropolitan Council for their respective service areas within the County. Decisions will also be reviewed and confirmed by the Metropolitan Council if funds are requested from the Council and CTIB. All future service expansions will be based upon demand and available funding.
Detailed information on the ridership methodology, assumptions, and results is included in Appendix J (Ridership Assumptions, Methodology, and Results Memorandum). Additional detailed information on the existing ridership characteristics of the METRO Red Line and MVTA local and express bus service can be found in Appendix I (Existing Ridership Characteristics Memorandum). Detailed information on the proposed bus service changes and travel times is included in Appendix K (Service Plans and O&M Cost Methodology Memorandum).
Existing and Forecasted Ridership
Existing Transitway Ridership Table 4 summarizes total ridership on the corridor for METRO Red Line, MVTA express, and MVTA local service. July 2013 was the first full month of service for the METRO Red Line. As such, 2013 METRO Red Line ridership in Table 4 only includes average weekday ridership between July 2013 and December 2013. 2014 ridership totals incorporate data from January through December.
The Regional Transitway Guidelines provide a methodology for comparable reporting of total Transitway boardings, which is included as a sub-total of Table 4, and is the sum of METRO Red Line and MVTA Express Route ridership. Total corridor boardings, which includes total Transitway boardings plus MVTA local service, have remained constant between 2013 and 2014 for weekdays and grew an average of 13.8 percent on weekends.
32

Table 4. Total 2013 and 2014 Ridership in the Cedar Avenue Transitway and Corridor
Weekday Saturday Sunday
Service Type 2013 2014 2013 2014 2013 2014
METRO Red Line 772 815 520* 610 375* 445
Express Routes 3,152 3,215 --- --- --- ---
Total Transitway Boardings
3,924 4,030 520 610 375 445
Local Routes 1,927 1,790 914 1,007 681 772
Total Corridor Boardings 5,851 5,820 1,434 1,617 1,056 1,217
% Change -0.5% 12.8% 15.2%
Forecasted METRO Red Line and Transitway Ridership As displayed in Table 5, METRO Red Line weekday ridership could be expected to grow from an average of 815 riders per day to 4,700 riders per day in 2040, based on the above- mentioned service changes and assumptions. Also included in Table 5 is an additional breakdown of ridership by local and express service operating on the corridor, grouped by the Metropolitan Council definition of routes that operate a majority of service on the Cedar Avenue Transitway (“guideway”). Additional details by route and service provider are provided in Appendix I.
As shown in Figure 20, the forecast ridership would be a product of both service improvements and land development and growth in the corridor and beyond. Facility and service improvements would be directly responsible for generating an additional 1,400 boardings per day on the METRO Red Line. Additional development would increase that by an additional 2,485 daily riders; this development would include growth along the corridor station areas and in the feeder bus and park and ride market areas, including primarily growth in Dakota County and the Bloomington South Loop areas, but also reflecting growth in other parts of the region conveniently accessible to transit connections from the METRO Red Line.
33

Table 5. 2040 Ridership – Average Weekday Boardings
Route Type Existing 2040 No Build
2040 Build
Corridor Local (Non-guideway) 600 2,300 3,100
Express/Local [Guideway Boardings]
4,600 9,200 10,100
Red Line Station-to-Station 815 2,800 4,700
Total Guideway Boardings 5,400 12,000 14,800
Figure 20. METRO Red Line 2040 Ridership – Future Development and Service Improvement Impacts
As shown in Figure 21, the Mall of America station would continue to be the dominant station on the METRO Red Line as the largest attraction served, as well as being the major transfer point to other transit services in the region. Apple Valley Transit Station would continue to be the second most active station. In most cases, the additional stations and services of the build alternative improve all station boardings, though a slight drop can be seen at Cedar Grove resulting from MVTA express bus connections added at Cliff Road.
Forecasted park and ride usage was also assessed as part of the ridership forecasting process. Table 6 shows the existing and forecast usage of park and ride spaces in the corridor. Current usage is estimated at 1,144 spaces of the total 1,442 park and ride spaces available in the corridor. Demand in 2040 is estimated at a total of 2,250 to 2,650 spaces in the corridor, which is primarily
Existing815
Service Improvements
1,400
Future Development
2,485
34

due to the express bus services in the corridor. This express service most directly serves peak commuter market to the downtown areas, where parking is limited and costly. The METRO Red Line park and ride demand, which is 15 to 17 percent of the demand in the corridor, provides service for off-peak and non-downtown markets, which are more limited as park and ride markets. While primarily attributed to express ridership growth, increased demand would necessitate an addition of 800 to 1,400 park and ride spaces by 2040 in the corridor. 330 spaces will be constructed as part of the planned Apple Valley Transit Station expansion.
Figure 21. METRO Red Line Boardings by Station
35

Table 6. Park and Ride Facility Needs
Ridership Forecasting Sensitivity Tests Five sensitivity tests were conducted for the corridor. Sensitivity tests are less comprehensive analysis of assumed changes to alternatives and conducted to address specific questions. In the case of the METRO Red Line sensitivity tests, the questions were:
1. What effect would extending the METRO Orange Line have on METRO Red Line ridership?
2. What would the impact be of the removal of Cliff Road Station and extending the Orange Line?
3. What would the impact be of increased development density near 147th Street Station and Glacier Way Station and extending the Orange Line?
4. What would the impact be of removal of the Palomino Park and Ride and METRO Red Line station and replacing it with a park and ride facility at 140th Street Station and extending the Orange Line?
5. What would the impact be of modifying the METRO Red Line alignment to serve an additional station near the intersection of Old Shakopee Road and Old Cedar Avenue and extending the Orange Line?
Total ridership results of the five sensitivity tests are shown in Figure 22. Test 1, for example, shows an approximate decrease in 200 riders (4,500) relative to the 2040 METRO Red Line Build Scenario (4,700). In general, the majority of the sensitivity tests completed did not result in a significant impact on METRO Red Line ridership except for Test 3, the increased density test.
Park and Ride Station
2013 Usage
2014 Usage
2014 Capacity
2040 Forecast Demand (spaces) Routes Served Express
/Local BRT Total
Cedar Grove 48 66 166 50-100 0-50 50-150 METRO Red Line, 472, 475, 476, 491, 492
Palomino 272 250 318 800-900 200 1,000-1,100
METRO Red Line, 480, 479, 478, 477,476
Apple Valley Transit Station 758 818 768 1,000-
1,100 100 1,100-1,200
METRO Red Line, 480, 477, 440, 442, 475
Lakeville Cedar Station 14 10 190 25-50 25-50 50-100 METRO Red Line,
480, 477 215th Street Station New New New 25-50 25-50 50-100 METRO Red Line,
480, 477
Total 1,092 1,144 1,442 1,900-2,200 350-450 2,250-
2,650
36

Figure 22. Sensitivity Test Results – Average Weekday Corridor Ridership
Test 3 focused on increased development in the 147th Street and Glacier Way Station areas, which were identified in previous studies as highly viable areas on the Cedar Avenue Transitway corridor for infill development at increased densities. Increasing density near 147th Street and Glacier Way shows a significant increase in ridership. This demonstrates the important relationship between density around station areas and the ridership. For purposes of understanding the level of density needed to induce high ridership at each station comparable to the 2040 forecasted ridership for the Apple Valley Transit Station, the test focused on increasing residential development densities to reach a daily boarding threshold of 600 riders per station. To reach this ridership threshold at the 147th Street or Glacier Way Stations, results of the test show a need for 25-32 residential units per acre, whereas existing station area densities are approximately three residential units per acre.
37

6. What improvements are being considered for the Cedar Avenue Transitway? This section describes the future improvements that would be expected for the Cedar Avenue Transitway. The potential runningway, station, fleet, and operations and maintenance facility improvements for the Cedar Avenue Transitway are addressed below.
Runningways Minimal guideway improvements are necessary for the expansion of service on the Cedar Avenue Transitway. Improvements are limited to those required to accommodate new stations along the roadways in the corridor. METRO Red Line buses are expected to travel in mixed traffic in the right travel lanes. However, when traffic is congested, buses will be able to use Cedar Avenue’s bus-only shoulders to bypass traffic as they do currently. To accommodate for bus shoulder operations in congested traffic, the existing travel lanes south of Dodd Boulevard (CSAH 9) will be re-striped to make room for a 10-foot shoulder, without expanding the width of the roadway, to meet the Regional Transitway Guidelines and MnDOT standards for bus-shoulder operations.3 The existing shoulders were constructed to be able to accommodate the wear and tear of buses.
METRO Red Line buses will use the right travel lanes to easily access existing and planned online shoulder stations except at the Cedar Grove Station and north to the Mall of America. The Cedar Grove Station will be an online median station, so METRO Red Line vehicles will move from the right travel lane to the left-most lane prior to reaching the Cedar Grove Station. Once the Cedar Grove Station improvements are completed, traffic conditions will be monitored to determine if any changes in traffic control are warranted.
Future analysis of a TH 77 managed lane concept will be completed as part of a detailed study of Palomino and Cliff Road Stations and operations. This study will include analysis of how to fully maximize safety and operations of the METRO Red Line in conjunction with a potential managed lane on TH 77. Dakota County transportation staff will also continue to monitor safety on CSAH 23, as is done throughout the system. Review will help determine if, over time, there are any specific intersection issues or crash trends along the corridor that need to be evaluated in greater detail.
3 MnDOT requires a minimum bus-shoulder roadway width of 10 feet and minimum bridge shoulder width of 11.5 feet. A 12-foot roadway and bridge shoulder is required for areas of new construction or reconstruction. (http://www.dot.state.mn.us/metro/teamtransit/pdf/geometricdesignstatements.pdf).
38

Stations
Station Platforms New METRO Red Line station platforms will accommodate level-boarding, similar to the existing METRO Red Line stations.
Configurations of the planned station platforms will primarily include online and inline stations. All planned online stations will be located on the far-side of intersections and will not preclude future platform expansion to accommodate additional MVTA bus operations. Future online stations will not include bus pullouts onto the shoulder of Cedar Avenue, unlike the existing METRO Red Line online stations at 140th Street and 147th Street. This design will minimize the need for right-of-way (ROW) acquisition and will subsequently lower overall station costs.
The Lakeville Cedar Station will have a park and ride facility as well as online shoulder platforms. The 215th Street Station will also be configured as an offline station with a park and ride.
Station Amenities The planned stations will include the premium amenities included at existing METRO Red Line stations and other stations in the METRO system, including enclosed waiting areas, security cameras, bicycle racks, bicycle steps, real-time NexTrip vehicle arrival and departure signage, litter receptacles, emergency call boxes, station lighting, and push-button radiant heating. Station shelters are assumed to use the established architectural “wave” roof design and will be sized similarly to the existing shelters at 140th Street, as displayed in Figure 23.
New METRO Red Line stations will also include off-board fare collection. Passengers would purchase a ticket at a ticket vending machine (TVM) on the station platform rather than use the farebox on the bus. This will allow passengers to board through any vehicle door and speeds up the boarding process. The IPU assumes one TVM at each station in each direction. Passengers with Go-To Cards could also pay using an on-board validator affixed inside each vehicle door.
New METRO Red Line stations will be designed to promote a safe, secure, and comfortable environment for patrons. The design process will include consideration of the application of the principles of crime prevention through environmental design; conducting a design review and hazard, threat, and vulnerability analysis; and provision of surveillance and communications equipment for both deterrence and emergency response.
39

Figure 23. Shelter Design (140th Street Station)
All new stations should include pedestrian and bicycle connections and intersection crossing treatments into the planned station areas, as they are critical for users to safely access the stations, will increase the attractiveness of the service, and will help to increase ridership, especially at the walk-up stations. Pedestrian and bicycle facilities should be designed to provide the most direct route, paved, clearly marked, lighted, and buffered to improve bicycle and pedestrian experiences and discourage people from crossing roadways in other than designated areas. Pedestrian and bicycle facilities within a Transitway station should be designed to accommodate snow clearance and removal equipment. This factor should be considered in designing pavement treatments for pedestrian and bicycle paths, in particular, which do not require the pavement strength of driving surfaces.
Station Locations Being Considered Seven new METRO Red Line stations were identified in the previous IPU and continue to be considered for the Cedar Avenue Transitway. The stations include two infill stations on the current guideway and five additional stations south of the existing southern terminus at Apple Valley Transit Station. Detailed station information is listed below and displayed in concept drawings on the following pages.
Cliff Road Station (Inline Station - Infill): The Cliff Road Station is planned as an inline station located on the northbound and southbound Cedar Avenue (TH 77) entrance ramps from Cliff Road, as displayed in Figure 24. The planned station location is between the existing Cedar Grove Transit Station and 140th Street Station. Transit Signal Priority (TSP) should be considered for traffic signals at the intersections of Cliff Road and the Cedar Avenue exit/entrance ramps.
40

During the IPU process, concerns were raised about efficient and safe operations for buses merging from the right lanes/shoulders to serve an inline Cliff Road Station and back to the center lanes to access the median platform extension of the Cedar Grove Transit Station. Weave analyses were completed during the 2014 Highway 77 Managed Lane and Cedar Grove Transit Access Engineering Study between Cliff Road and the Cedar Grove station areas to measure the delay associated with weaving in varying traffic conditions. Under congested conditions with speeds below 35 mph, the weave introduces some minimal delay when compared to a bus traveling within the bus shoulder. Additional weave analysis detail can be found in the aforementioned 2014 Study.
Figure 24. Cliff Road Station Concept
Palomino Station (Online Shoulder Station - Infill): The Palomino Station is planned as an online shoulder station on Cedar Avenue (TH 77) adjacent to the Palomino Drive Bridge. The existing Palomino Hills Park and Ride facility in Apple Valley is located adjacent to the planned station area. The existing facility includes 318 parking stalls with 86 percent usage, according to the 2013 Annual Regional Park and Ride System Report. It is located at the southeast quadrant of Palomino Drive and Pennock Avenue in the parking lot owned by and adjacent to Christus Victor Lutheran Church. Christus Victor has priority use of approximately 66 percent of the parking spaces, which requires many transit users to park at other locations when there are weekday church activities.
Two primary safety concerns with a northbound station at Palomino Drive were identified throughout the IPU. First, to access the station at Palomino Drive, buses would need to weave
41
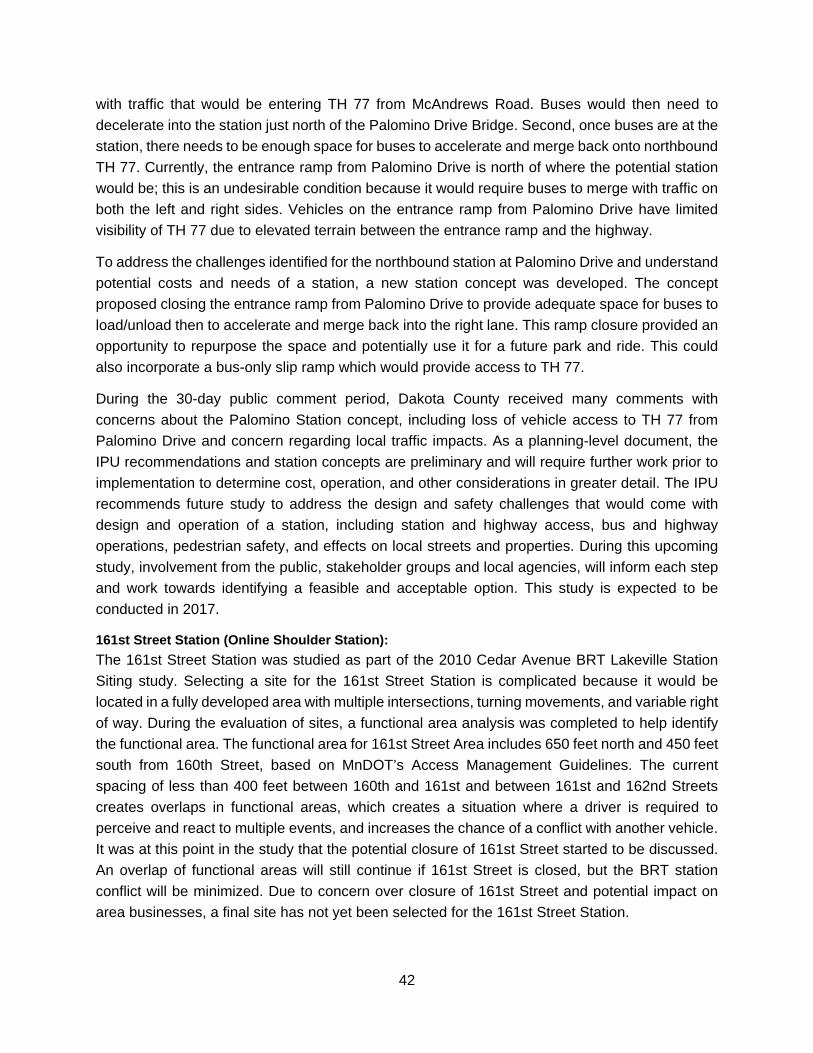
with traffic that would be entering TH 77 from McAndrews Road. Buses would then need to decelerate into the station just north of the Palomino Drive Bridge. Second, once buses are at the station, there needs to be enough space for buses to accelerate and merge back onto northbound TH 77. Currently, the entrance ramp from Palomino Drive is north of where the potential station would be; this is an undesirable condition because it would require buses to merge with traffic on both the left and right sides. Vehicles on the entrance ramp from Palomino Drive have limited visibility of TH 77 due to elevated terrain between the entrance ramp and the highway.
To address the challenges identified for the northbound station at Palomino Drive and understand potential costs and needs of a station, a new station concept was developed. The concept proposed closing the entrance ramp from Palomino Drive to provide adequate space for buses to load/unload then to accelerate and merge back into the right lane. This ramp closure provided an opportunity to repurpose the space and potentially use it for a future park and ride. This could also incorporate a bus-only slip ramp which would provide access to TH 77.
During the 30-day public comment period, Dakota County received many comments with concerns about the Palomino Station concept, including loss of vehicle access to TH 77 from Palomino Drive and concern regarding local traffic impacts. As a planning-level document, the IPU recommendations and station concepts are preliminary and will require further work prior to implementation to determine cost, operation, and other considerations in greater detail. The IPU recommends future study to address the design and safety challenges that would come with design and operation of a station, including station and highway access, bus and highway operations, pedestrian safety, and effects on local streets and properties. During this upcoming study, involvement from the public, stakeholder groups and local agencies, will inform each step and work towards identifying a feasible and acceptable option. This study is expected to be conducted in 2017.
161st Street Station (Online Shoulder Station): The 161st Street Station was studied as part of the 2010 Cedar Avenue BRT Lakeville Station Siting study. Selecting a site for the 161st Street Station is complicated because it would be located in a fully developed area with multiple intersections, turning movements, and variable right of way. During the evaluation of sites, a functional area analysis was completed to help identify the functional area. The functional area for 161st Street Area includes 650 feet north and 450 feet south from 160th Street, based on MnDOT’s Access Management Guidelines. The current spacing of less than 400 feet between 160th and 161st and between 161st and 162nd Streets creates overlaps in functional areas, which creates a situation where a driver is required to perceive and react to multiple events, and increases the chance of a conflict with another vehicle. It was at this point in the study that the potential closure of 161st Street started to be discussed. An overlap of functional areas will still continue if 161st Street is closed, but the BRT station conflict will be minimized. Due to concern over closure of 161st Street and potential impact on area businesses, a final site has not yet been selected for the 161st Street Station.
42

Typical Online Shoulder Stations A station concept was developed to represent a typical online shoulder station for the Glacier Way, Lakeville Cedar (online), and 195th Street Stations. Figure 25 displays a station layout for a typical online shoulder station. The station concept includes standard station platform design and amenities, including a 10 foot multiuse bituminous path adjacent to the station platforms. As displayed in Figure 25 in the green box, the planned platform is also designed for phased implementation of a future local or express bus platform to serve potential future service needs. Additional information about the three applicable planned station locations is included following Figure 25.
Figure 25. Typical Online Shoulder Station Concept
Glacier Way Station (Online Shoulder Station): The Glacier Way Station is planned to be located in the shoulders on the immediate far-sides of the Cedar Avenue (CSAH 23) and Glacier Way intersection. Figure 25 displays a station layout for a typical online shoulder station, which includes the Glacier Way Station. The station concept includes standard station platform design and amenities, including a 10-foot multiuse bituminous path adjacent to the station platforms.
Lakeville Cedar Station (Online Shoulder Station and Offline Park and Ride): The Lakeville Cedar Station is planned to be located at the existing Lakeville Cedar Park and Ride near 181st Street. The facility currently has 190 parking stalls and is served by Express Route 477V. The station may be phased as an offline southern terminus for METRO Red Line service until the implementation of either the 195th Street or 215th Street stations. Concepts developed for
Future phase for Express or Local Service
43

the IPU assume two online shoulder platforms and use of the existing site and park and ride facility.
195th Street Station (Online Shoulder Station): The 195th Street Station is planned to be located on the shoulders on the immediate far-side of the future CSAH 23 /195th Street intersection. Figure 25 displays a station layout for a typical online shoulder station, which includes the 195th Street Station. The station concept includes standard station platform design and amenities, including a 10 foot multiuse bituminous path adjacent to the station platforms.
215th Street Station (Offline Station and Park and Ride): The 215th Street Station and Park and Ride is planned to be located in the existing offline Park and Pool site, as displayed in Figure 26. The existing site, which includes approximately 48
parking stalls, will be expanded to include a 500 sq. ft. breakroom and restroom facility for bus drivers and a bus turnaround facility. The 2010 IPU recommended expanding the existing Park and Pool site to accommodate additional users. The analysis completed for this IPU does not identify a need for an expanded parking facility at the 215th Street Station.
Figure 26. 215th Street Station Concept
Additional detail on station locations, operations, configuration, and a review of the stations relative to the Regional Transitway Guidelines can be found in Appendix G (Station Conditions Review Memorandum). The full conceptual station designs for the Cliff Road, Palomino, Glacier Way, and 215th Street Stations are included in Appendix L (Conceptual Station Layouts).
44

Vehicles The IPU assumes a purchase of two low-floor, 40-foot BRT vehicles to meet the needs of expanded METRO Red Line station-to-station service to the stations. The vehicles will be equipped with an automatic passenger counter device, customer information technology, and a security system.
Operations and Maintenance Needs Feedback from MVTA staff indicates that the existing Eagan Bus Garage is at capacity. Furthermore, the site cannot accommodate any additional expansion to house the two additional METRO Red Line vehicles. MVTA and Metro Transit staff indicated that capacity exists regionally to shift vehicles between existing bus garages to accommodate the vehicle purchase. As such, a per-vehicle cost for expansion of an operations and maintenance facility was assumed as part of the IPU.
To support the potential interim expansion of METRO Red Line station-to-station service to the Lakeville Cedar Station, vehicle turnaround and driver layover facilities will be required. However, it is assumed that under this scenario, the facilities at the existing park and ride will be sufficient to meet this need. At the time of full extension of METRO Red Line service to 215th Street, a dedicated bus turnaround, layover bays, and a 500 sq. ft. driver breakroom and restroom facility will be provided at the 215th Street Station and Park and Ride and are assumed in the IPU.
45

7. What will the planned improvements cost?
Capital Costs Methodology The capital cost estimates developed for the IPU include the planned corridor improvements, stations and technology systems, operations and maintenance facilities, vehicles, and right-of-way acquisition. Also included are “soft costs” for items such as engineering, construction services, insurance, and owner’s costs, as well as contingencies for uncertainty in both the estimating process and the limited scope of this IPU.
At this early study stage, there is not sufficient definition or detail to prepare detailed construction cost estimates for the various planned investments. Therefore, capital cost estimates were developed using representative typical unit costs or allowances on a per-unit basis that is consistent with this level of analysis. If improvements are selected for implementation in the future, the capital cost estimates developed at this stage will need to be refined based upon additional design and engineering work. Detailed methodology and capital cost estimates for the Cedar Avenue Transitway are included in Appendix M (Capital Cost Estimation Methodology Technical Memorandum and 2015 IPU Capital Costs).
Capital Costs Table 7 includes a summary of the capital costs for the planned projects as part of the Cedar Avenue Transitway.
46

Table 7. Cedar Avenue Transitway Estimated Capital Costs
Note: All line-item and total values in Table 7 and the IPU Staging Plan are rounded. See Appendix M for full capital cost detail.
SCC Cost Categories
Cedar Grove Online Station
Apple Valley Transit Station
Expansion
Mall of America Transit Station
Cliff Road Station
Palomino Station
(Includes 700 P&R
Stalls) 161st Street
Station Glacier Way
Station
Lakeville Cedar
Station 195th Street
Station 215th Street
Station
147th Street Pedestrian
Bridge
Northern Apple
Valley/ Eagan Park-
and-Ride Expansion
METRO Red Line Vehicles
Vehicle Storage &
Maint-enance
Technology and
Restriping Total
10 Guideway & Track Elements $0 $0 $4,700,000 $100,000 $1,500,000 $100,000 $100,000 $100,000 $100,000 $600,000 $0 $0 $0 $0 $0 $7,300,000
20 Stations, Stops, Terminals, Intermodal $6,500,000 $6,600,000 $1,000,000 $1,000,000 $15,000,000 $1,000,000 $1,000,000 $1,000,000 $1,000,000 $900,000 $2,400,000 $5,400,000 $0 $0 $0 $42,800,000
30 Support Facilities: Yards, Shops, Admin. Buildings
$0 $0 $0 $0 $0 $0 $0 $0 $0 $0 $0 $0 $0 $500,000 $0 $500,000
40 Sitework & Special Conditions $3,100,000 $0 $400,000 $200,000 $1,900,000 $300,000 $300,000 $300,000 $300,000 $300,000 $200,000 $0 $0 $0 $300,000 $7,600,000
50 Systems $0 $0 $0 $400,000 $400,000 $400,000 $400,000 $400,000 $400,000 $300,000 $0 $0 $0 $0 $3,800,000 $6,500,000 60 ROW, Land, Existing Improvements $0 $0 $0 $0 $0 $0 $0 $0 $0 $0 $0 $0 $0 $0 $0 $0
70 Vehicles $0 $0 $0 $0 $0 $0 $0 $0 $0 $0 $0 $0 $5,200,000 $0 $0 $5,200,000 80 Professional Services $1,800,000 $1,600,000 $200,000 $400,000 $4,600,000 $400,000 $400,000 $400,000 $400,000 $500,000 $200,000 $1,300,000 $100,000 $0 $1,000,000 $13,300,000
90 Unallocated Contingency $1,900,000 $0 $400,000 $500,000 $6,200,000 $600,000 $600,000 $600,000 $600,000 $600,000 $300,000 $1,800,000 $0 $0 $1,300,000 $15,400,000
100 Finance Charges $0 $0 $0 $0 $0 $0 $0 $0 $0 $0 $0 $0 $0 $0 $0 $0 Total Capital Costs $13,300,000 $8,200,000 $6,700,000 $2,600,000 $29,600,000 $2,800,000 $2,800,000 $2,800,000 $2,800,000 $3,200,000 $3,100,000 $8,500,000 $5,300,000 $500,000 $6,400,000 $98,600,000
47

Operating and Maintenance Costs Methodology Methodology used to develop operating and maintenance cost estimates is based on MVTA-provided actual cost data for METRO Red Line service.4 MVTA’s 2012 contract direct and indirect rates were provided and were inflated to 2015 dollars by using a 2.5 percent inflation factor. Full detail on operating and maintenance cost methodology is included in Appendix K (Service Plans and O&M Methodology and Costs).
The Council contracts with MVTA for maintenance of the Lakeville Cedar, 140th, 147th and Cedar Grove facilities, which are owned by the Council. MVTA owns, operates, and maintains the Apple Valley Transit Station and the Apple Valley layover facility.
Direct costs reflect costs that are directly attributable to the facility, such as utilities, heating and cooling, snow removal and trash collection at each station. For purposes of this study, existing corridor transit facilities were grouped as large, medium, and small stations, for application to proposed new stations. The Apple Valley Transit Station was considered representative of a large category station. The Cedar Grove Station was considered representative of a medium category station, and the 140th and 147th Street Stations were considered representative of a small category station (i.e., with no parking and no supporting facilities for use by other routes). Resulting direct unit costs, inflated to 2015 dollars, are listed in Table 8.
Table 8. MVTA-Provided Transit Facility Maintenance Direct Unit Costs
Station Type 2015 Direct Unit Cost
Large Station $211,000 per station
Medium Station $79,100 per station
Small Station $26,700 per station
Layover Facility $43,800 per layover facility
Indirect unit costs are less defined and include percentages of administrative-related costs. MVTA allocates these costs on the basis of number of bus trips at the facility. Annual bus trips were estimated for all Cedar Avenue stations, and divided by the estimated annual indirect costs at these facilities. Indirect station costs average $0.80 per bus trip, while indirect costs for a layover facility averaged $0.16 per bus trip.
Fare collection machines in the Cedar Avenue corridor are maintained by Metro Transit. The 2012 Arterial Transitways Corridor Study used an average annual maintenance cost of $10,800 per
4 The operating and maintenance costs developed for this IPU was based on actual cost data provided by MVTA. These costs and methodology are preliminary and are subject to change.
48

ticket vending machine (2015 dollars). The Arterial Transitways Study also estimated a net savings of on-board bus fare collection mechanisms of $2,000 per fleet bus in 2015 dollars.
Finally, project alternatives may include additional signalized intersections with transit signal prioritization. The 2012 Arterial Transitway Corridors Study estimated an annual maintenance cost of $3,000 per signalized intersection (2015 dollars).
Operating and Maintenance Costs The full extension of METRO Red Line service in 2040 to the 215th Street Station is estimated to cost an additional $1.98 million annually (2015 dollars), relative to existing METRO Red Line service operations cost. This includes both direct and indirect costs for operations and maintenance of facilities, fare collection, and TSP. Expansion of local and express bus service to meet east-west connectivity throughout Dakota County and increased service needs is estimated at an additional cost of $5.95 million annually (2015 dollars). The total estimated operating and maintenance cost for METRO Red Line, local, and express bus expansion is $7.93 million. Operating and maintenance costs developed for this IPU were based on expanded service plan recommendations; however, final METRO Red Line decisions will be made by the Metropolitan Council and final local and express bus service expansion decisions will be made by MVTA and the Metropolitan Council for their respective service areas within Dakota County. Decisions will also be reviewed and confirmed by the Metropolitan Council if funds are requested from the Council and CTIB. New funding sources need to be identified for all future service expansions.
49

8. When will the planned improvements occur? The 2010 IPU identified capital investments in the Cedar Avenue Transitway by stage and an associated year. The current 2015 IPU moves away from identifying project by year, but rather prioritizes investments by their readiness. As part of revising the goals for the Cedar Avenue Transitway, evaluation measures were developed to help measure the readiness of stations towards achieving the Transitway goals.
Some of the evaluation measures are used as indicators to provide a better understanding of the station area conditions and characteristics. Other evaluation measures had thresholds developed to help evaluate the readiness of investments on the Cedar Avenue Transitway. In particular, 2040 METRO Red Line station boardings and cost-effectiveness were used to help prioritize the readiness of investments in the corridor.
Table 9 shows the data for each of the evaluation measures for the planned stations. Station boardings and cost-effectiveness are shown on the left side of the table and are color coded to identify how each station scored relative to the thresholds identified. The threshold for station boardings is that a station must have 200 boardings by 2040 to warrant a transitway station investment. For cost-effectiveness, stations that had a value above the corridor average ($8.68) were scored as low; stations with a value between $4.00 and $8.68 were scored as medium; and stations with a value below $4.00 were scored as high. Table 10 shows the data for each of the evaluation measures for existing stations. Appendix N (IPU Transit Development Thresholds) includes the full development thresholds table, methodology and calculation details, and data on existing METRO Red Line stations for comparison.
50

Table 9. METRO Red Line Station Evaluation Measures and Indicators
Evaluation Measures with Identified Thresholds
Indicators
Proposed Stations
METRO Red Line Daily Station to
Station Boardings
(2040 Build)
Cost Effectiveness
Average Vehicles
Available per HH
Minority Population
(%)
Low Income Households
(185% of Poverty
Threshold)
2040 Station Area Activity
(People, Jobs)
Residential Density (Current Comp Plan Land Uses)
2040 Housing Density (HH per
acre)
Cliff Road 290 $2.19 1.79 19.61% 19.72% 14,343
• Medium Density Residential: 4-12 units per acre
• High Density Residential: 12+ units per acre
• Mixed Use
2.58
Palomino 410 $7.49 2.05 15.86% 18.83% 12,191
• Low Density Residential: 3-6 units per acre
• Medium Density Residential: 6-12 units per acre
• High Density Residential: 12-40 units per acre
• Parks and Open Space
2.36
161st Street 90 $12.83 1.91 22.81% 19.41% 11,627 • Low Density Residential: 1-3
units per acre • Commercial
3.37
Glacier Way 80 $14.43 2.16 14.02% 19.73% 12,127
• Low Density Residential: 1-3 units per acre
• Medium Density Residential: 4-9 units per acre
• Commercial • Public Space
2.05
Lakeville Cedar
270 $4.40 2.16 12.57% 13.98% 10,006
• Medium Density Residential: 4-7 units per acre
• High Density Residential: 9+ units per acre
2.05
195th Street 90 $13.14 1.99 5.80% 19.23% 7,712 • Special Plan Area 1.66
215th Street 200 $6.29 1.93 19.57% 20.76% 5,791 • Industrial • Commercial
0.67
AVERAGE 204 $8.68 1.99 15.74% 18.83% 10,542 2.11
High Medium Low
51

Table 10. METRO Red Line Station Evaluation Measures and Indicators
Existing Stations
METRO Red Line Average Daily Station
to Station Boardings
(2014)
METRO Red Line Daily Station to
Station Boardings
(2040 Build)
Annual Cost per
Rider
Average Vehicles
Available per HH
Minority Population
Low Income Households
(185% of Poverty
Threshold)
2040 Station Area
Activity (People,
Jobs)
Residential Density (Current Comp Plan Land Uses)
2040 Housing
Density (HH per acre)
Mall of America
369 1,610 N/A 1.23 53.33% 39.50% 55,268 • High Density Residential • High Intensity Mixed-Use
1.40
Cedar Grove 146 360 N/A 1.73 20.94% 21.24% 10,882 • Medium Density Residential: 4-12 units per acre
• Mixed use
1.21
140th Street 29 180 N/A 1.87 9.77% 14.25% 10,019 • Low Density Residential: 3-6 units per acre
• Medium Density Residential: 6-12 units per acre
• High Density Residential: 12-40 units per acre
2.55
147th Street 58 220 N/A 1.55 25.06% 22.68% 17,371 • Low Density Residential: 3-6 units per acre
• Medium Density Residential: 6-12 units per acre
• Commercial
2.76
Apple Valley Transit Station
214 740 N/A 1.63 24.11% 20.48% 12,739 • Mixed Use: 12-40 units per acre
• Commercial
3.55
52

Transitway Staging Plan The following table identifies future capital investments for the Cedar Avenue Transitway. The capital investments are grouped into various stages that are a result of currently programmed projects, as well as the outcome of the technical evaluation completed for this IPU. Additional detail is included in Appendix O (IPU Funding Plan).
Estimated Staging Timeframes The current IPU does not identify specific timeframes for when investments will be made. However, estimated timeframes were established to help give a sense of when projects would begin to be planned. These estimated timeframes are contingent on projects meeting the established thresholds.
• Stage 1: 2010-2015 (elements that have already been completed) • Stage 2: 2015-2020 • Stage 3: 2020-2025 • Stage 4: 2025-2040 • Stage 5: 2025-2040
The next IPU is proposed to be done during Stage 3. At that time, investments will be reevaluated and the priority of projects could shift. Investments proposed in Stages 3-5 are dependent on the comprehensive plan updates required by the Metropolitan Council and the results of the next IPU. Improvements that did not meet the threshold established for top priorities are identified as potential future investments beyond the 2040 time horizon. In future IPU plans, the priority of these projects can shift if conditions change, such as ridership increases or density increases.
Table 11. Cedar Avenue Transitway Staging Plan
Capital Investments Stages Cost Estimates 1 2 3 4 5
Stage 1: Existing Cedar Avenue Transitway Elements Mall of America Station X
$110,000,000
Cedar Grove Station X
140th Street Station X
147th Street Station X
Apple Valley Transit Station X
Runningway: Bus Shoulder and Highway Improvements X
53

Capital Investments Stages Cost Estimates 1 2 3 4 5
Vehicle Purchase (7 40-foot, low-floor buses - 2013) X
STAGE 1 TOTAL: $110,000,000
Stage 2: Currently Programmed Improvements (2015 to 2020)
Mall of America Station Improvements X $6,700,0005
Cedar Grove Online Station6 X $13,300,000
Apple Valley Transit Station Expansion X $8,200,000
Bicycle and Pedestrian Improvements X $100,000
Corridor-wide Station Area Planning (11 Stations – All existing and proposed stations, excluding MOA Station)
X $100,000
per station
Study of Palomino and Cliff Road Stations Concepts, TH 77 Managed Lane Concept, and Northern Park and Ride Needs Analysis
X $500,000
STAGE 2 TOTAL: $29,900,000
Stage 3 (2020 to 2025)
Cliff Road Inline Station • Includes METRO Red Line Station X $2,600,000
Palomino Online Station and Park and Ride • Includes METRO Red Line Station
• Includes new park and ride facility with
capacity for 700 vehicles
X $29,600,000
Bicycle and Pedestrian Improvements X $100,000
METRO Red Line Vehicle Replacement (7 vehicles in 2025)
X $4,100,000
Update Cedar Avenue Transitway IPU X $400,000
STAGE 3 TOTAL: $36,800,000
5 METRO Red Line portion of Mall of America Station cost, based on Metro Transit cost allocation methodology used in the 2015 TIGER Grant application. Total project cost is estimated at $24.9 million. 6 Investments are also being made to support and not preclude future MnPASS investment on the Cedar Avenue Transitway.
54

Capital Investments Stages Cost Estimates 1 2 3 4 5
Stage 4 (By 2040)
Lakeville Cedar Station Improvements • Includes interim terminal station and
potential layover facility with offline
station METRO Red Line and
local/express platforms in existing Park and Ride
X $2,800,000
Park and ride capacity expansion in Northern Apple Valley or Eagan • Location to be determined as part of
stage 2: Study of Palomino and Cliff
Road Stations Concepts, TH 77
Managed Lane Concept, and Northern
Park and Ride Needs Analysis
X $8,500,000
Technology and Restriping (TSP, Fiber) [South of AVTS to Lakeville Cedar]
X $2,900,000
Bicycle and Pedestrian Improvements X $100,000
STAGE 4 TOTAL: $14,300,000
Stage 5 (By 2040)
215th Street Station • Includes new terminal station offline
platform, dedicated bus turnaround,
layover bays, and a 500 sq. ft. driver
support facility
• Current park and pool is converted to
park and ride. No expansion of existing parking lot is included.
X $3,200,000
147th Street Station Pedestrian Bridge X $3,100,000
METRO Red Line BRT Vehicle Purchase (2) X $1,200,000
Storage and Maintenance Facility Allowance (METRO Red Line) X $500,000
Technology and Restriping (TSP, Fiber) [Lakeville Cedar to 215th Street]
X $3,500,000
Bicycle and Pedestrian Improvements X $100,000
55
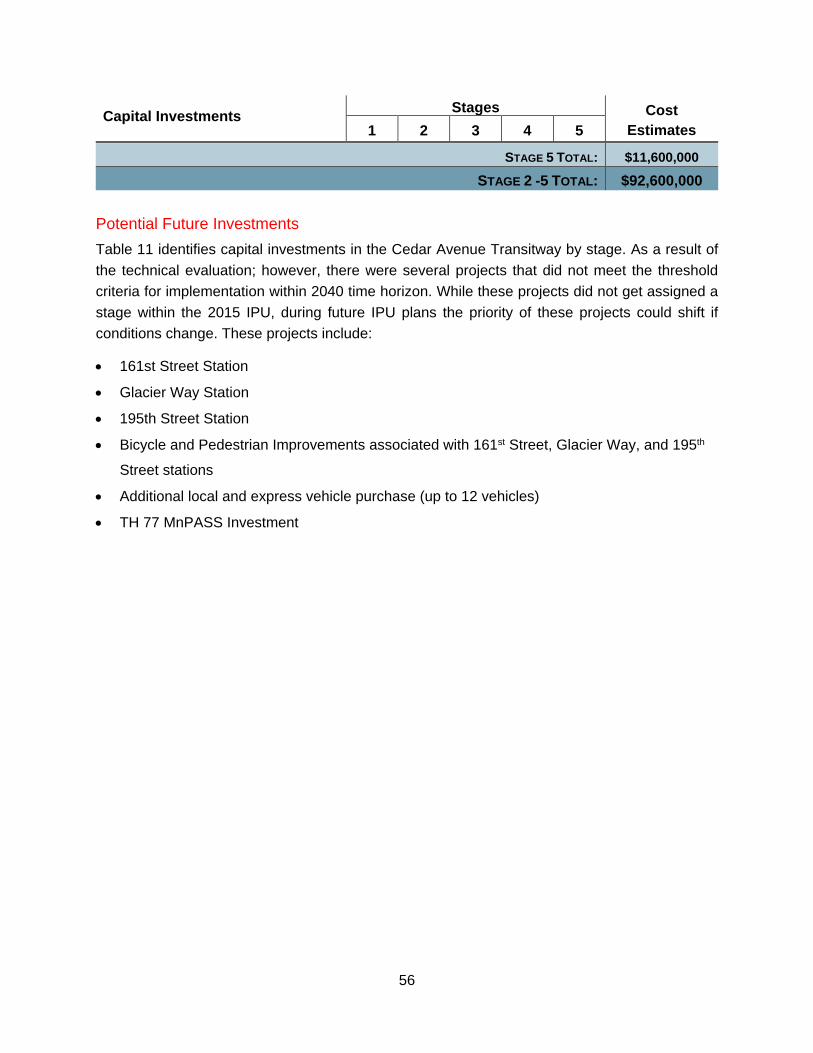
Capital Investments Stages Cost Estimates 1 2 3 4 5
STAGE 5 TOTAL: $11,600,000
STAGE 2 -5 TOTAL: $92,600,000
Potential Future Investments Table 11 identifies capital investments in the Cedar Avenue Transitway by stage. As a result of the technical evaluation; however, there were several projects that did not meet the threshold criteria for implementation within 2040 time horizon. While these projects did not get assigned a stage within the 2015 IPU, during future IPU plans the priority of these projects could shift if conditions change. These projects include:
• 161st Street Station
• Glacier Way Station
• 195th Street Station
• Bicycle and Pedestrian Improvements associated with 161st Street, Glacier Way, and 195th
Street stations
• Additional local and express vehicle purchase (up to 12 vehicles)
• TH 77 MnPASS Investment
56

9. How will the planned improvements be funded? As described in Chapter 8, capital investments in the Cedar Avenue Transitway will be completed in stages as development and ridership increases are achieved. This section describes potential funding sources for each stage and the degree to which specific funding sources have been identified.
Existing Capital Transitway Funding Sources
Stage 1 Capital expenses for Stage 1 of the Cedar Avenue Transitway through 2014 have totaled $109.6 million. Figure 27 and Table 12 show the major categories of expenses and the major categories of funding sources based on tabulations prepared by Dakota County.
Federal funds have provided approximately 39 percent of total Stage 1 funding. Sources have included:
• FTA Section 5309 discretionary grants for early project development and later Section 5309 program grants for improvements at the Apple Valley Transit Station;
• A portion of the region’s Urban Partnership Agreement for park-and-ride facility improvements, real-time customer information systems, and shoulder-running Driver Assist System technology;
• SAFETEA-LU High Priority Projects program grants for right-of-way acquisition and runningway improvements;
• Surface Transportation Program (STP) formula grant funds allocated to runningway improvements administered through the Metropolitan Council; and
• CMAQ formula grant funds allocated to vehicle acquisition and related technology administered through the Metropolitan Council.
State and regional funds have amounted to about 25 percent of total Stage 1 funding. Sources have included:
• General Obligation bond proceeds for selected project elements, including runningway, stations, layover facilities, and local match on federal funds; and
• RTC bond proceeds for vehicles, technology, and local match on the federal UPA grant.
CTIB has funded about 27 percent of total Stage 1 costs. Uses of CTIB funds are restricted to project elements that are associated with the Cedar Avenue Transitway and have included runningway, stations, BRT vehicles, technology, and METRO Red Line branding.
Dakota County funds have amounted to about eight percent of total Stage 1 funding. Sources have included:
57

• The County has allocated a portion of its State Aid Highway Funds to right-of-way, utilities, and construction of the highway improvements and bus shoulders (runningway); and
• The Dakota County Regional Railroad Authority has allocated a portion of its property tax revenue to runningway, the Apple Valley Transit Station, the Lakeville Cedar station, vehicles, technology, match on CTIB funds, and project development and administration activities.
Municipal funds amounted to about two percent of total Stage 1 funding. Local city funds from Apple Valley and Lakeville were used for right-of-way, utilities, and construction of the highway improvements.
58
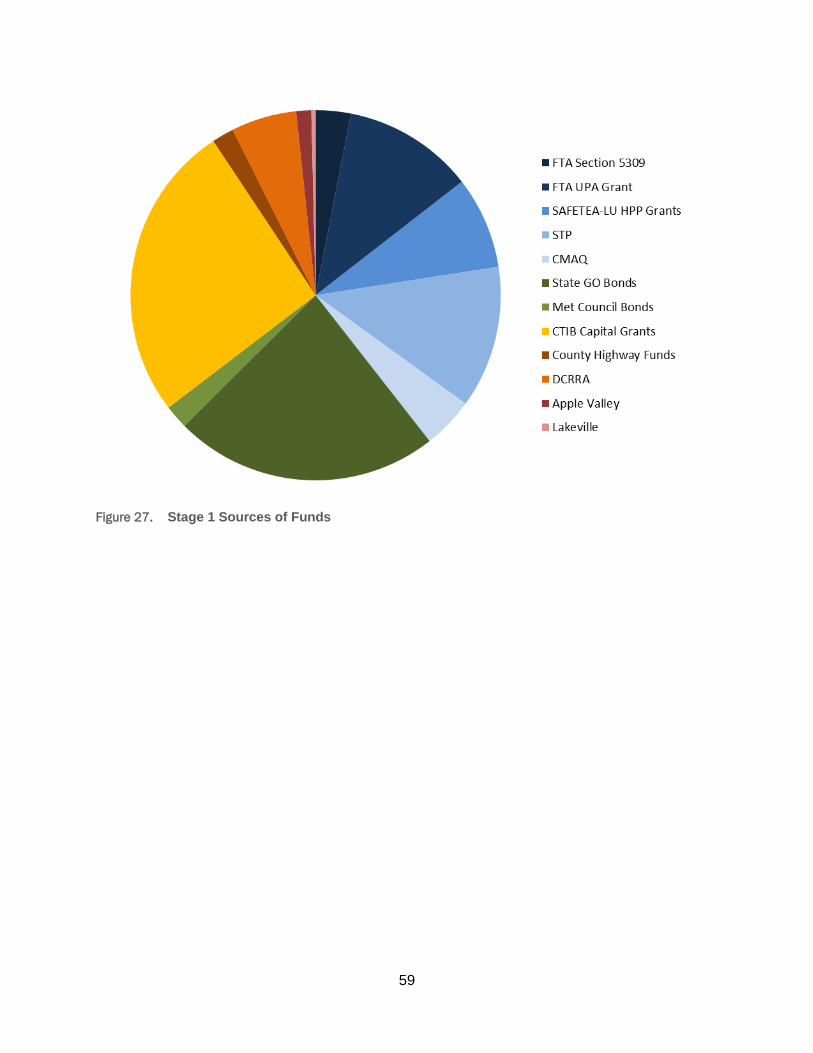
Figure 27. Stage 1 Sources of Funds
59

Table 12. Stage 1 Sources and Uses of Funds
Runningway Stations Vehicles Vehicle Storage and Maintenance
Facility
Technology Project Development
/ Admin-istration
Total
Federal
FTA Section 5309 Discretionary $983,679 $1,492,500 $0 $681,800 $200,000 $0 $3,357,979 FTA Urban Partnership Grant $0 $8,347,984 $0 $0 $4,182,166 $0 $12,530,150 SAFETEA-LU High Priority Projects Grants $8,819,020 $0 $0 $0 $0 $0 $8,819,020 Surface Transportation Program $13,615,000 $0 $0 $0 $0 $0 $13,615,000 Congestion Mitigation and Air Quality $0 $0 $4,066,000 $0 $848,000 $0 $4,914,000 State/Regional General Obligation Bonds $7,456,068 $15,224,494 $0 $813,250 $458,541 $1,369,883 $25,322,236 Regional Transit Capital Bonds $0 $0 $1,016,500 $0 $1,257,542 $0 $2,274,042 Counties Transit Improvement Board Capital Grants $17,155,732 $5,439,574 $760,810 $3,000,598 $1,737,500 $474,549 $28,568,763 Dakota County State Aid Highway Funds $2,118,918 $0 $0 $0 $0 $0 $2,118,918 Regional Railroad Authority $3,870,810 $1,390,000 $253,600 $68,767 $62,500 $602,350 $6,248,027 Municipalities Apple Valley $1,439,278 $0 $0 $0 $0 $0 $1,439,278 Lakeville $410,898 $0 $0 $0 $0 $0 $410,898
Total $55,869,403 $31,894,552 $6,096,910 $4,564,415 $8,746,249 $2,446,782 $109,618,311
60

Planned Capital Transitway Funding Sources Future stages of the Cedar Avenue Transitway are anticipated to be funded by a mix of federal, state, CTIB, Dakota County Regional Railroad Authority, regional, and municipal sources, continuing the general structure of partnership between multiple levels of government from Stage 1. Project sponsors will seek to maintain the split of 30 percent federal, 30 percent state, 30 percent CTIB, and 10 percent county/local funding for future Cedar Avenue Transitway projects. For local/express project costs, a split of 45 percent federal, 45 percent state, and 10 percent county/local funding will be targeted. It should be noted that local and express cost components presented in the Capital Cost Tech Memo (Appendix M) are not included in the IPU Funding Plan (Appendix O).
Federal Funding A mix of federal discretionary grants, allocations of regional formula funds, earmarks, and transfers from highway funding programs was assembled for Stage 1 projects. Project sponsors will continue to monitor policy changes, identify grant opportunities, and coordinate with other regional transit initiatives to maximize federal funding opportunities for projects in Stage 2 and beyond.
Project sponsors recognize that there will be challenges to assembling federal funding for future stages, including:
• Improvements to the existing METRO Red Line will not qualify for discretionary funding under Section 5309 New Starts / Small Starts programs;
• Other projects in the regional transit investment program may be prioritized over investment in the Cedar Avenue corridor when seeking federal discretionary funds, such as from the Transportation Investment Generating Economic Recovery (TIGER) competitive grant program and allocating regional capital and operating funds;
• The Regional Solicitation process used to allocate STP, CMAQ, and other designated federal program funds may favor projects in other areas of the metropolitan area with higher ridership.
State/Regional Funding A mix of state General Obligation bond program proceeds and RTC bond program proceeds was assembled for Stage 1 projects. Project sponsors will continue to monitor policy changes, seek biannual bond program allocations, identify ways to leverage State Aid Highway Program funds, where applicable, and coordinate with other regional transit initiatives to maximize state funding opportunities for projects in Stage 2 and beyond.
Project sponsors recognize that there will be challenges to assembling state funding for future stages, including:
• Uncertainty in the ongoing magnitude of state bond programs; and
61

• Competition with other transportation projects and non-transportation uses for proceeds from state bond programs.
RTC funds are often used to match federal funds at a minimum 20 percent local match share. These funds should continue to be pursued to match federal funds awarded through the Metropolitan Council Regional Solicitation process.
Counties Transit Improvement Board Funding The CTIB Transit Investment Framework articulates a philosophy that Transitway Improvement Projects, which are defined as “improvements to an existing CTIB Transitway that increase ridership, safety, efficiency or capacity of the Transitway”, are eligible uses of CTIB funds.7 For METRO Red Line projects in Stage 2 and beyond, project sponsors will seek to maintain or expand the 30 percent funding share for Cedar Avenue Transitway projects as CTIB develops its investment policy beyond 2020.
As appropriate for individual program elements, project sponsors will explore the applicability to the METRO Red Line of CTIB policies that allow for higher funding shares to accelerate projects or maximize the availability and use of federal funding. At the same time, project sponsors recognize that while CTIB expects that additional Transitway Improvement Projects will be necessary investments in future years, the ability to commit funding depends in part on the availability of future sales tax revenues above current forecasts.
Dakota County Funding A mix of State Aid Highway Funds and Dakota County Regional Railroad Authority property tax revenues was assembled for Stage 1 projects. Project sponsors will continue to apply these revenue sources to capital projects in Stage 2 and beyond with the intention of county contributions amounting to approximately 10 percent of total project costs.
Municipal Funding The Cities of Apple Valley and Lakeville contributed municipal funds to Stage 1 projects. Project sponsors will continue to seek to fund a portion of project costs, including selected right-of-way acquisitions, utility relocations, roadway improvements, and pedestrian connections, with municipal contributions.
7 Counties Transit Improvement Board. Transit Investment Framework, adopted April 16, 2014. Available at http://www.mnrides.org/sites/default/files/downloads/tif_adopted_april_16_2014.pdf
62

Capital Funding Sources by Stage
Stage 2 Committed Transitway Funding Sources In Stage 2, some projects have already advanced through project development to a point at which project sponsors have assembled portions of needed funding. Funding sources are based on current financial plans, including:
• Mall of America –The total project cost is $25 Million. Metro Transit submitted a 2015 TIGER grant application seeking $11,000,000 in funds (44 percent of the total project cost). Committed project funds include $7,000,000 (28 percent) in CMAQ funds and $7,000,000 (28 percent) in local funds.
• Cedar Grove – The $13 million project is funded with $10.4 million (80 percent) from CTIB, $1,300,000 (10 percent) by the DCRRA and $1,300,000 (10 percent) in state General Obligation bond program proceeds.
• Apple Valley – The $6.6 million (2014 dollars$) construction project is funded by a $5.28 million (80 percent) in 2019 federal CMAQ funds awarded to MVTA which will be matched at 20 percent with RTC funds. Funding for the $1,586,400 professional services cost, including engineering, environmental analysis, and construction administration, has not been identified.
Stage 3 - Stage 5 Anticipated Transitway Funding Sources In Stage 3 and beyond, METRO Red Line capital improvements are anticipated to be funded with 30 percent federal funds from various programs, 30 percent state and regional funds from various programs, 30 percent CTIB capital grants, and 10 percent local funds from Dakota County and potentially municipalities. Based on consistency of future improvements with CTIB’s Transit Investment Framework policy, CTIB funds are considered “committed” in the funding plan. All other funds are considered “planned”, with the mix of funds from various programs to be identified by project sponsors over time.
In Stage 3 and beyond, local and express bus capital improvements are anticipated to be funded using a mix of federal, state, regional, Metropolitan Council, and local funds from various programs to be identified by project sponsors over time. The funding plan reflects a split of 45 percent federal funds from various programs, 45 percent state or Metropolitan Council funds from various programs, and potentially 10 percent local funds from Dakota County, depending on the service provided.
Operating Funding Sources On August 20, 2008, CTIB adopted a resolution committing to fund 50 percent of transitway net operating subsidies for five transitways, including new and expanded Cedar Avenue express and station-to-station BRT service. The funding plan considers operations and maintenance costs and
63
limited BRT express service already implemented, excluding fares and other system-generated revenues, to be committed funding from CTIB for Stage 1 and beyond. 46 percent of operations and maintenance costs are paid for through a CMAQ grant awarded to MVTA by the Federal Transit Administration (FTA). The grant covered this share of costs beginning on April 1, 2013 and is planned to continue through June 21, 2016 via a master contract between MVTA and the Metropolitan Council. The remainder of net operations and maintenance expenses for Stage 1, including all local and express expenses, are considered to be committed by the Metropolitan Council and MVTA from each agency’s motor vehicle sales tax and other revenues.
For METRO Red Line and local/express net operating subsidies in Stage 2 and beyond that are not covered by CTIB or MVTA, new funding sources need to be identified.
64

10. What are the next steps for the Cedar Avenue Transitway, and how can other stakeholders play a role in its successful future? In addition to proceeding with additional planning, design, and implementation of the proposed improvements, Dakota County, the Metropolitan Council, MVTA, the corridor cities, and other stakeholders have multiple opportunities to continue to contribute to the future success of and increased ridership on the Cedar Avenue Transitway. This section provides both corridor-wide and station specific recommended next steps.
Corridor-Wide Recommended Next Steps
Land Use and Station Area Planning Land use plays a critical role in determining the success of a transitway. Denser, high-activity land uses are more conducive to transit than low-density uses. Land uses around many of the planned station locations in the Cedar Avenue Transitway corridor are relatively low density with an automobile-oriented pattern of development. Existing housing densities are typically three housing units per acre as shown in the photos below.
Figure 28. Housing Density Examples (3 units/acre)
Communities along the Cedar Avenue Transitway corridor should consider evaluating and changing land use and economic development plans to take advantage of potential transitway station investments and encourage increased development density and more transit-friendly development patterns. This type of change in land use and development patterns will also encourage more people along the corridor to use transit by concentrating people, jobs, and activity closer to potential transit services.
As part of the 2015 IPU ridership modelling, a sensitivity test was completed to better understand the impact that increased density would have on METRO Red Line station boardings. Of all the
65

sensitivity tests completed, the most significant increase to station ridership was increasing density within a half mile of a station. The housing densities that were used in the sensitivity test were between 25 and 30 units per acre.
Figure 29. Housing Density Examples (25-32 units/acre)
It is recommended that station area plans for each planned METRO Red Line station be developed to help local communities prepare for a more sustainable community that integrates transit into future growth and allows for more travel options for residents. Station area planning should also be completed for existing stations, excluding MOA Station, where similar opportunities exist and may be under-recognized in currently adopted long-range plans. Station area plans help provide guidelines on the potential and specific action items needed to adjust land use and infrastructure to better complement transit stations. Good station area planning can result in the following benefits:
• Maximize transit use and options by community residents through appropriate development patterns
• Meaningful community engagement about the future of areas around transit stations • Design or redesign of streets that consider the needs of all users • Creation of life-cycle housing options in a community • Identification of opportunities for great public spaces • Management of parking to effectively support travel options • Maximize the economic development benefits of transit investments • Identification of needed convenient connections to the station and through development
opportunities • Alignment with community goals • Reduction in a community’s impact on the environment • Improvement in a community’s health and active living opportunities • Reduction of short trips in vehicles that contribute to congestion by improving pedestrian
and bicycling accessibility
66

• Keep an aging population living in the same place by allowing transportation options when driving is no longer feasible
Local Service Demonstration MVTA, Dakota County, and Metro Transit should explore providing a demonstration of local bus service to areas that may have potential for extended METRO Red Line service but are in later stages in the staging plan. Through a local service demonstration, agencies will be able to more clearly understand what service type is best suited for these areas south of the existing Red Line southern service terminal at Apple Valley Transit Station. Demonstration service can also help build the demand for future Red Line service. No funding sources have been identified for a future local service demonstration.
Marketing Continual marketing and promotion of METRO Red Line service is essential to increasing the visibility, public understanding, and choice ridership along the corridor. Similar to the grand opening of the Twin Cities Premium Outlets adjacent to the Cedar Grove Transit Station and “Stop and Shop” free ride promotion (see Figure 30), additional opportunities to pair free ridership with events should be pursued and widely advertised. Partnerships with organizations along the corridor, such as the Minnesota Zoo, and special events should be pursued and advertised in print and through MVTA, Metropolitan Council, and Metro Transit social media accounts whenever possible.
As an example of the success of these efforts, Metro Transit reported that in 2014 approximately 80 percent of riders downloading free ride passes said they had never tried transit or had only used it occasionally, and 75 percent said the free rides made them more likely to attend the promoted event.
Figure 30. Shop and Stop Free Ride Event
67

Pedestrian and Bicycle Connections In addition to bicycle and pedestrian connections made to the immediate stations, local and regional pedestrian and bicycle connections to the existing and planned station areas are also critical for users to safely access the stations, and will play a major role in increasing the attractiveness of the service and ridership, especially at the walk-up stations. Similar to immediate station connections, Dakota County and the corridor cities must work to implement pedestrian and bicycle facilities which are designed to provide the most direct route, paved, clearly marked, lighted, and buffered to improve bicycle and pedestrian experiences and discourage people from crossing roadways in other than designated areas. Pedestrian and bicycle facilities within a transitway station area should be designed to accommodate the weight and width of snow removal equipment.
Similar to other station enhancements, bicycle and pedestrian facilities connecting to the stations and on Cedar Avenue should be planned and implemented prior to or as the stations are constructed and the runningway is extended. Opportunities for connections into adjacent neighborhoods and on adjacent local and collector roadways should be continuously evaluated as new developments occur, street improvements are designed, or as opportunities to integrate cul-de-sac trail connections or other facilities present themselves. These last-mile connections are a crucial barrier for potential users and will also provide a more inviting, safe, and user-friendly environment for current users of the Transitway who regularly encounter sidewalk gaps and non-dedicated bicycle facilities in the suburban neighborhoods surrounding the corridor. Recommendations included in the METRO Red Line Market and Development Standards Study (2013) should also be incorporated into local capital improvement programs. Appendix P (METRO Red Line Station Areas and Non-Motorized Facilities) includes maps of the existing and planned bicycle and pedestrian facilities within a half-mile of the existing and planned stations.
Landscaping and Public Art As projects are implemented throughout the Cedar Avenue Transitway, landscaping and/or public art should be integrated into the station areas to create quality public spaces, contribute to each station’s identity, and enhance travel for customers. The components also promote a friendly, inviting atmosphere for these stations, which can act as gateways into the communities they serve. Furthermore, public art installations can increase safety and deter vandalism as they convey care of the stations. All treatments should meet the Regional Transitway Guidelines, which include:
• Providing clear sight lines which do not impede visibility for waiting transit passengers, transit vehicles in the runningway, or other transportation modes intersecting the transit runningway;
• Avoiding creating areas of concealment;
68

• Avoiding interference with pedestrians, bicycle, bus, and auto paths. This should include integrating all public art into functional station elements to avoid creating unanticipated physical obstacles in station areas.
Figure 31. Examples of Transitway Station Public Art
There are a multitude of opportunities for Dakota County to partner with local businesses, organizations, and developers to finance these components into the station design and construction. Multiple non-profits in the Twin Cities can support this effort by recruiting, training, and granting funds to local artists for public art installations, including FORECAST Public Artworks. Public Art St. Paul, a non-profit founded to support the advancement of the public realm in St. Paul, is supported by the city’s public art ordinance and also serves as a model for advancing public art in Dakota County.
Consistent with Federal Highway Administration (FHWA), FTA, and Regional Transitway Guidelines, the cost of landscaping and streetscaping should be no more than five percent of the above-ground construction cost (i.e., the percentage should not be associated with the cost of underground utility relocation). The cost of public art included at stations and in all other areas of a project should be within one-half percent to five percent of the project construction budget, depending on the funding source, with larger percentages typically associated with lower cost projects.
69

Station-Specific Recommended Next Steps The following section provides recommended next steps for stations along the Cedar Avenue Transitway. The recommendations tie back to the staging plan identified as part of the current IPU.
Existing Stations Station area planning and bicycle and pedestrian improvements were identified as priorities for the five existing METRO Red Line stations, which include:
• Mall of America Station (bicycle and pedestrian improvements only) • Cedar Grove Station • 140th Street Station • 147th Street Station • Apple Valley Transit Station
Station area planning efforts for the existing METRO Red Line stations should be focused on identifying opportunity redevelopment sites beyond what is currently forecasted for the area. This is critical in helping increase ridership potential around existing stations.
147th Street Station Pedestrian Bridge As a result of only the technical evaluation, the 147th Street Station Pedestrian Bridge did not meet the threshold criteria for implementation within the 2040 timeframe. The 2030 Dakota County Transportation Plan identifies three intersections in Apple Valley on Cedar Avenue as locations that are likely to have the need for interchanges in the future, based on 2030 projected traffic volumes. The identified intersections are County State Aid Highway (CSAH) 23 and County State Aid Highway 42, 140th Street, and 147th Street. The 2030 Transportation Plan identified projected volumes that may meet thresholds for consideration of interchanges in the future. This allows further consideration for modifications to the existing at-grade pedestrian crossing. Based on the projected traffic volumes Dakota County will continue to monitor safety on CSAH, as is done throughout the system. Review will help determine if, over time, there are any specific intersection issues or crash trends along the corridor that need to be evaluated in greater detail and implement improvements if and when necessary.
The City comprehensive plan updates are due to the Metropolitan Council in 2018, which will allow the City to complete additional land use planning and consider increased density within a half-mile of the station area. Increasing land use and densities near station areas creates a high probability to increase ridership. When the IPU is next updated shortly after adoption of the City Comprehensive Plans, the 147th Street Station Pedestrian Bridge will be assessed and prioritized based on the updated planned land use and densities included in the approved comprehensive plans.
70

Based on only the technical analysis in the IPU, the pedestrian bridge does not meet the evaluation measures to be implemented prior to 2040. However, based on the potential for interchanges on the Cedar Avenue Transitway Corridor, as identified in the 2030 Dakota County Transportation Plan, and to allow updates to land use in the vicinity of the stations, the pedestrian bridge is identified in Stage 5. The timeframe of the pedestrian bridge will be reevaluated after the City of Apple Valley Comprehensive Plan is adopted and as part of the next update of the IPU.
Cliff Road and Palomino Drive Stations The Cliff Road and Palomino Drive Stations were identified as the next priorities for new METRO Red Line stations (Stage 3). During this IPU, general station concepts and costs were developed; however, more detailed analysis is needed to determine the ideal location for the stations. This additional analysis should also consider how stations function with a potential managed lane on TH 77. The study should also include traffic and access impact analysis.
In addition to station concepts, managed lanes, traffic, and access, an analysis of ideal park and ride sites within the corridor is needed. During the current IPU, a comparative analysis was done to determine the preferred park and ride site at either 140th Street or a new facility at Palomino Drive. The analysis concluded that locating a site at 140th Street is not preferred due to site constraints, costs, and land use potential. Based on that finding, a new park and ride facility was preferred at Palomino Drive; however, the IPU Steering Committee recommended that as a follow-up to the IPU, a more detailed assessment of existing and potential park and ride sites should be completed.
As a part of these more detailed studies, improved bicycle and pedestrian connections to stations should be considered. These include:
• Cliff Road Station: Improvements to pedestrian facilities on the Cliff Road Bridge to serve the planned inline Cliff Road stations. These may be able to be accomplished through planned MnDOT improvements to the bridge currently programmed for 2019;
• Palomino Station: Improvements to pedestrian facilities on the Palomino Drive Bridge and to serve the future Palomino Station
Lakeville Cedar and 215th Street Stations Lakeville Cedar and 215th Street Stations were recommended as Stage 4 and Stage 5 investments. Lakeville Cedar would serve as the interim end of the line station until service is expanded south to 215th Street Station. The success of these stations is closely tied to development that happens around the stations. It is important to plan future development and other capital investments to coincide with the future stations. Future development must also be planned to focus on the station area and not become “transit-adjacent” development. To meet or exceed the forecasts developed for this IPU, development patterns would need to be planned and implemented in a more transit-friendly manner than currently exists in Lakeville. The principles of transit-oriented development do exist in areas like downtown Lakeville, but existing plans and regulations likely would not allow similar development patterns in other areas of the city, including
71

planned transit station areas. Bicycle and pedestrian infrastructure is also a key component that should be planned to provide connections to future stations. In particular:
• Lakeville Cedar Station: A grade-separated pedestrian crossing is encouraged to allow pedestrians to cross Cedar Avenue in the area of the Mattamy Homes, also known as the Avonlea Development. Locating a pedestrian crossing would support connection to both sides of Cedar Avenue and eliminate the need for users to walk to the nearest signalized intersection.
• 215th Street Station: Consider addition of bicycle and pedestrian facilities at and surrounding the planned 215th Street Station to serve the existing industrial park to the west of Cedar Avenue (CSAH 23). Ridership analysis shows a high number of reverse-commuters using this station to access jobs.
161st Street, Glacier Way, and 195th Street Stations
As a result of the technical evaluation; the 161st Street, Glacier Way, and 195th Street Stations did not meet the threshold criteria for implementation within 2040 time horizon. This was due to future land uses around the stations not being conducive to transit. It is critical that land uses around the station areas become denser to better support a transitway investment. While these stations did not get recommended for implementation during this IPU, a critical next step is to complete station area plans that have densities that would help grow ridership to a level that could support implementation of the stations. As part of the station area planning, more specific station locations should be considered to complement future land uses.
Future development must also be planned to focus on the station area and not become “transit-adjacent” development. To meet or exceed the forecasts developed for this IPU, development patterns would need to be planned and implemented in a more transit-friendly manner than currently exists in Lakeville. The principles of transit-oriented development do exist in areas like downtown Lakeville, but existing plans and regulations likely would not allow similar development patterns in other areas of the city, including planned transit station areas.
Bicycle and pedestrian infrastructure is also a key component that should be planned to provide connections to future stations. In particular:
• Glacier Way Station: Addition of planned sidewalk or multi-use trail on the east side of Cedar Avenue at the time of station construction; and
• 195th Street Station: Addition of bicycle and pedestrian facilities at and surrounding the planned 195th Street Station and the planned 195th Street
72