ceds table of contents page - nado.org · ceds table of contents page ... as well as the action...
TRANSCRIPT


2
CEDS Table of Contents Page I. Introduction ........................................................................................ 4 II. Organization and Management Introduction........................................................................................5 Board of Directors.............................................................................5 Member Governments.......................................................................6 CEDS Committee Members............................................................. 27 III. Regional Analysis 28 A. Population Demographics..................................................... 28 1. Population Growth............................................................ 2. Age................................................................................... 3. Education......................................................................... 4. Unemployment................................................................ 5. Poverty............................................................................ 6. Workforce Participation Rate......................................... 7. Employment / Wages by Occupation.............................. 8. Per Capita Income........................................................... B. Infrastructure.......................................................................... 40 1. Water.................................................................................. 2. Sewer.................................................................................. 3. Ports................................................................................... 4. Industrial Parks.................................................................. 5. Roads/bridges.................................................................... 6. Broadband telecommunications........................................ 7. Electricity.......................................................................... C. Financial Resources............................................................. 50 1. City / County General Fund Reserves................................ 2. Amount General Obligation Debt Outstanding............................. 3. Amount of Revenue Bond Debt on Govt. Enterprise Operations.... 4. Millage Rates................................................................................... D. External Forces...................................................................................52 1. Natural Environment...................................................................... 2. Political Environment..................................................................... 3. Economic Environment................................................................. 4. Social Environment........................................................................

3
IV. Goals and Objectives 58 V. Public/Private Partnerships 62 VI. Strategic Projects, Program, and Activities 63 A. Suggested Projects List.......................................................................63 B. Vital Projects List...............................................................................63 VII. Action Plan 64 VIII. Performance Measures 66 IX. Annual CEDS Performance Report 67 X. Appendices 69

4
I. INTRODUCTION
North Central Planning and Development District’s Comprehensive Economic Development Strategy (CEDS) is the result of a planning process designed to guide the economic growth of the region. The purpose of the process is to help create jobs, foster a more stable and diversified economy, and improve living conditions. The CEDS provides a mechanism for coordinating the efforts of individuals, organizations, local governments, and private industry concerned with economic development.
It is hoped that the CEDS document will provide a useful resource to enable and enhance local decision-makers’, stakeholders’, and the public’s ability to evaluate and make the best possible choices to protect, enhance, and promote a high quality of life in the region. As an economic development liaison for the seven-county region, the North Central Planning and Development District is pleased to assist its local communities towards making effective and sustainable economic development choices.
The North Central Planning and Development District’s CEDS Committee members represent local governments including the seven counties of the region and municipalities; business and industry; finance; workforce; higher education; professionals; as well as representatives of minorities and those representing other disadvantaged groups. Its member counties are the counties of north central Mississippi: Attala, Carroll, Grenada, Holmes, Leflore, Montgomery, and Yalobusha.
The process through which the CEDS Committee operates includes regularly constituted and structured meetings on a regular basis and on-call for particular business and a full agenda of goals establishment, arrangement of strategy formulation and the development of priority projects for programming goals implementation. Each attending and participating member has an equal (one vote) voice on the issues connected with the planning process. The strengths, weaknesses, opportunities, threats, goals, and objectives, as well as the action plan detailed in this document are based upon the work of the individual committees.

5
II. ORGANIZATION AND MANAGEMENT A. Board of Directors Table North Central PDD Board of Directors
Name Address Representation County Race Term *Norman Cobbins, Jr., President
135 Spencer Rd., Lexington, MS 39095
Private Sector Grenada Black 1 year
*Ron Wood, Vice President
764 Vaiden Kilmichael Rd., Kilmichael, MS 39747
Private Sector Montgomery White 1 year
*Talmadge “Tee” Golding, Secretary-Treasurer
P.O. Box 71, Winona, MS 38967 Elected Official Montgomery White 1 year
*Sam Abraham P.O. Box 250, Greenwood, MS 38935
Elected Official Leflore White 1 year
*Johnny Hayward 59 Green St. Grenada, MS 38901
Elected Official Grenada White 1 year
*Henry Luckett P.O. Box 239, Lexington, MS 39095 Elected Official Holmes Black 1 year *Marvin Coward Rt. 1, Box 224, Coila, MS 38923 Workforce
Development Carroll White 1 year
*Wayne Self P.O. Box 102, Itta Bena, MS 38941 Elected Official Leflore Black 1 year *Larry Hart P.O. Box 704, Water Valley, MS
38965 Private Sector Yalobusha White 1 year
*Jimmy Willis 483 Carver Circle, Grenada MS 38901 Private Sector Grenada Black 1 year *Amos Sims 711 CR 15, Water Valley, MS 38965 Elected Official Yalobusha Black 1 year *Eddie Womble Rt. 4, Box 145, Kosciusko, MS
39090 Elected Official Attala White 1 year
*George Johnson P.O. Box 122, North Carrollton, MS 38947
Private Sector (Retired)
Carroll Black 1 year
*Gerry Taylor 230 W. Washington St., Kosciusko, MS 39090
Elected Official Attala White 1 year
Anjuan Brown Elected Official Leflore Black 1 year Michael Lott Elected Official Grenada White 1 year Charles Fancher 2768 Winter St., McCool, MS 39108 Elected Official Attala White 1 year Darrell Robinson Elected Official Grenada Black 1 year Angela Curry Private Sector Leflore Black 1 year Joseph Guess P.O. Box 249, Pickens, MS 39146 Private Sector Holmes White 1 year Stanley “Sugar” Mullins
P.O. Box 60, Carrollton, MS 38917 Elected Official Carroll White 1 year
Troy Hodges 9317 Attala Rd. 3122, Vaiden, MS 39176
Elected Official Attala White 1 year
James H. Young Elected Official Holmes Black 1 year Keith McGee Terry Herbert Elected Official Carroll White 1 year Larry Davis 729-H Davis Rd., Tchula, MS 39169 Elected Official Holmes Black 1 year Lindsay Roberts, Jr. P.O. Box 270, Winona MS 38967 Private Sector Montgomery Black 1 year Jimmy Cockroft 222 E. Washington St., Kosciusko,
MS 39090 Elected Official Attala White 1 year
Chad Gray 687 Sparta Rd., Holcomb, MS 38940 Elected Official Grenada White 1 year George Suggs 326 Willow St., Oakland MS 38948 Elected Official Yalobusha Black 1 year Earline Townes 910 CR 131, Coffeeville MS 38922 Private Sector Yalobusha Black 1 year Rickie Corley Lee McMinn Charlie Lee 2277 Hwy 82, Kilmichael MS 39747 Private Sector Montgomery Black 1 year Robert Collins Elected Official Leflore Black 1 year
* Executive Committee All NCPDD Board members are appointed for one (1) year terms in February of each year.
6
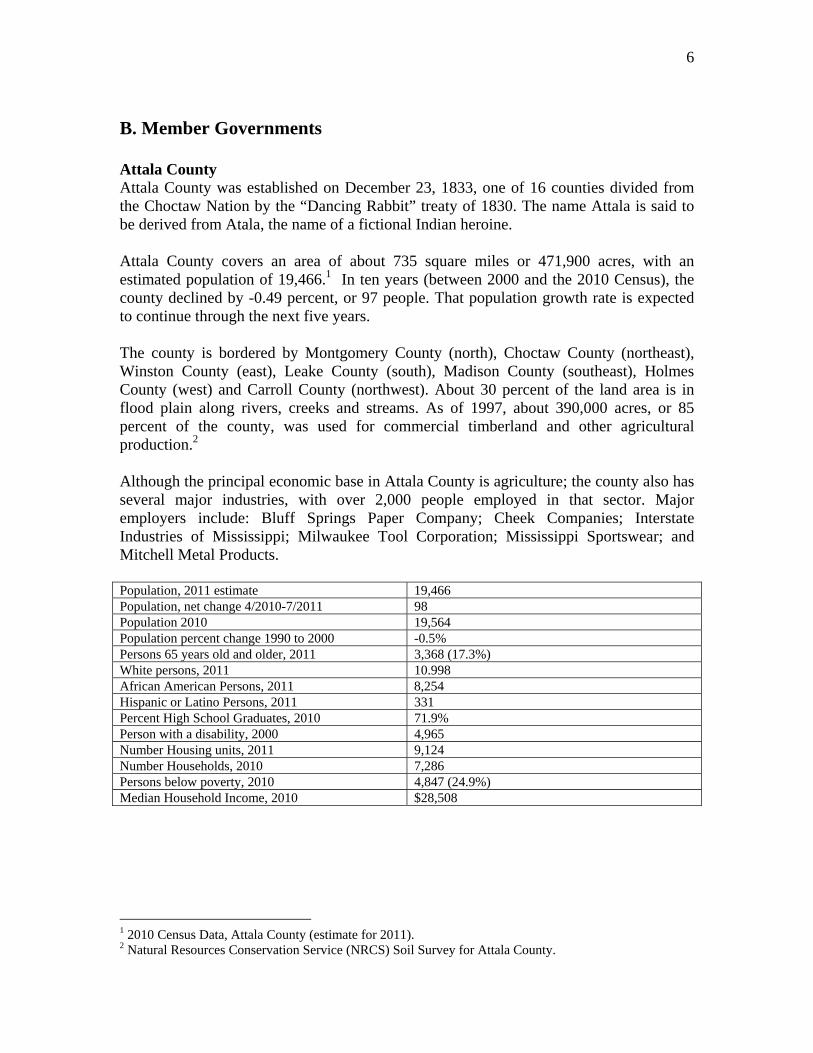
B. Member Governments Attala County Attala County was established on December 23, 1833, one of 16 counties divided from the Choctaw Nation by the “Dancing Rabbit” treaty of 1830. The name Attala is said to be derived from Atala, the name of a fictional Indian heroine. Attala County covers an area of about 735 square miles or 471,900 acres, with an estimated population of 19,466.1 In ten years (between 2000 and the 2010 Census), the county declined by -0.49 percent, or 97 people. That population growth rate is expected to continue through the next five years. The county is bordered by Montgomery County (north), Choctaw County (northeast), Winston County (east), Leake County (south), Madison County (southeast), Holmes County (west) and Carroll County (northwest). About 30 percent of the land area is in flood plain along rivers, creeks and streams. As of 1997, about 390,000 acres, or 85 percent of the county, was used for commercial timberland and other agricultural production.2 Although the principal economic base in Attala County is agriculture; the county also has several major industries, with over 2,000 people employed in that sector. Major employers include: Bluff Springs Paper Company; Cheek Companies; Interstate Industries of Mississippi; Milwaukee Tool Corporation; Mississippi Sportswear; and Mitchell Metal Products. Population, 2011 estimate 19,466 Population, net change 4/2010-7/2011 98 Population 2010 19,564 Population percent change 1990 to 2000 -0.5% Persons 65 years old and older, 2011 3,368 (17.3%) White persons, 2011 10.998 African American Persons, 2011 8,254 Hispanic or Latino Persons, 2011 331 Percent High School Graduates, 2010 71.9% Person with a disability, 2000 4,965 Number Housing units, 2011 9,124 Number Households, 2010 7,286 Persons below poverty, 2010 4,847 (24.9%) Median Household Income, 2010 $28,508
1 2010 Census Data, Attala County (estimate for 2011). 2 Natural Resources Conservation Service (NRCS) Soil Survey for Attala County.

7
Municipalities Town of Ethel
The Town of Ethel is located east of Kosciusko, off Highway 12, about halfway between Kosciusko and the Town of McCool. Just west of Ethel is a lumber mill that is the oldest business in Attala County. Ethel has recently constructed a new City Hall complex. Elementary school children attend classes about a mile away, while High School students travel just a short distance to a new school with about 300 children. Below are listed some demographic facts for the Town of Ethel:3 Table 3: Town of Ethel Demographics Population, 2010 418 Persons over 65 55 (13.2%) White persons 236 (56.5%) African American Persons 176 (42.1%) Persons with Disabilities (21-64 years of age) 107 (48.2%) Individuals below poverty level 79 (18.8%) Median household income $24,531 Number housing units 205
City of Kosciusko
First known as Red Bud Springs, Kosciusko is the county seat in Attala County. The city was named for an early pioneer, William D. Dodd, who was the first representative of Attala County in the State Legislature. He named the town after Tadeusz Kosciusko, a Revolutionary War general from Poland. In the 1830’s, the businesses in Kosciusko consisted of a tavern and a blacksmith shop. These businesses served people who traveled up and down the Natchez Trace Trail.4 Today, Kosciusko is one of central Mississippi’s largest shopping facilities with over 300 retail businesses, and numerous industries that provide employment for citizens in an 11-county area. New development is currently occurring in Kosciusko along Highway 12 West in the Red Bud Estates subdivision and in the Meadow Ridge Subdivision on the east side of Kosciusko. A new National Guard Armory and a new city Fire Station have recently been built on the north side of Kosciusko, along Highway 35 North.5 The city is served by Highways 12, 19, 35, 43, and 14, and the Natchez Trace Parkway. In 2000, Kosciusko had a population of 7,372. Kosciusko grew by 386 people, or 5.5 percent between 1990 and 2000. This growth rate is expected to continue during the next five years. The next table presents demographic information for Kosciusko:6
3 2010 Census Data. 4 Soil Survey for Attala County, USDA, Natural Resources Conservation Service, 1997. 5 Interview with Kosciusko Building Official. 6 2010 Census Data.

8
Table 4: City of Kosciusko Demographics Population, 2010 7402 Persons over 65 1,273 (17.2%) White persons 3,375 (45.6%) African American Persons 3,842 (51.9%) Persons with Disabilities (21-64 years of age) 933 (26.6%) Individuals below poverty level 2,058 (27.8%) Median household income $26,109 Number housing units 3,169
Town of McCool
The Town of McCool is located in the very northeast corner of Attala County, on Highway 12. Below are listed some demographic facts for McCool:7 Table 5: Town of McCool Demographics Population, 2010 135 Persons over 65 34 (18.7%) White persons 114 (84.4%) African American Persons 19 (14%) Persons with Disabilities (21-64 years of age) 17 (20%) Individuals below poverty level 75 (55.2%) Median household income $28,958 Number housing units 88
Town of Sallis
The Town of Sallis is located in the western region of Attala County, off Highway 12. Below are listed some demographic facts for Sallis:8 Table 6: Town of Sallis Demographics Population, 2010 134 Persons over 65 24 (17.9%) White persons 95 (70.9%) African American Persons 39 (29.1%) Persons with Disabilities (21-64 years of age) 35 (53.8%) Individuals below poverty level 29 (24.8%) Median household income $27,500 Number housing units 67
7 2010 Census Data. 8 2010 Census Data.

9
Carroll County Established by legislative act in December, 1833, from Choctaw Indian Territory acquired in the Dancing Rabbit Treaty of 1830, Carroll County was named after Charles G. Carroll, of Carrollton, Maryland, one of the original signers of the Declaration of Independence.9 Carroll County covers an area of about 628 square miles with an estimated population of 10,373.10 At the time it was formed, Carroll County was much larger than its current size (It was 908 square miles). At that time, the county boundaries reached three miles further north; five miles east of the City of Winona (Montgomery County); and was touched by the Tallahatchie and Yazoo Rivers to the west. Two hundred eighty square miles were removed during the 1870’s to become parts of Grenada, Leflore, and Montgomery Counties. The two major manufacturing towns in Carroll County, Greenwood and Winona, were removed with the creation of Leflore and Montgomery Counties (both became county seats of those respective counties). Interstate 55 links Carroll County with Jackson, Mississippi (95 miles to the south) and Memphis, Tennessee (about 115 miles to the north). U.S. Highway 82 and Mississippi State Highways 17, 35, and 304 also serve the area. There are two county seats in Carroll County: Carrollton and Vaiden, and a total county population of 10,597.11 The economy of the area is predominantly agricultural. Cotton, corn, soybeans and hay are the primary crops grown, with cotton being the main source of farm income. There is one major industry in Carroll County, Anel Corporation, which is situated off Highway 51, about 3.6 miles south of the City of Winona (Montgomery County). There are about 105 other non-farm employers in Carroll County. There are approximately 5,052 housing units in Carroll County,12 with about 81 percent of those homes occupied by owners. According to the 2000 Census, the average value of owner-occupied homes was $65,400. In Carroll County, the terrain varies from the low areas in the western section to steep with narrow ridge tops and narrow valleys in the towns of Carrollton and North Carrollton. Table 7: Carroll County Demographics Population, 2011 Estimate 10,373 Population, net change 4/1/2010 to July 1, 2011 -2.1% Population 2010 10,597 Number Households, 2011 5,040 Median Household Income, 2010 $29,290 Persons below Poverty, 2010 2,497
9 Carroll County Origins, Winona Public Library, p. 5. 10 2010 Census Data, Carroll County (estimate for 2011). 11 U.S. Census Bureau. 12 U.S. Census Bureau
10
Municipalities
Town of Carrollton
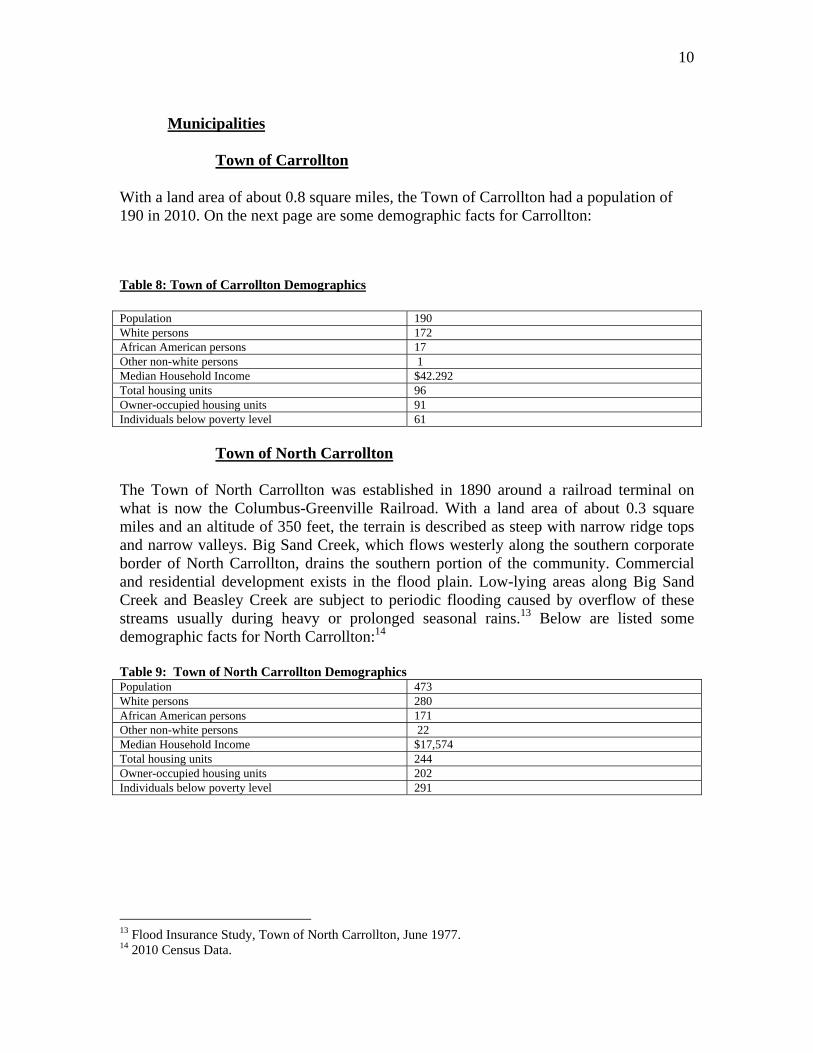
With a land area of about 0.8 square miles, the Town of Carrollton had a population of 190 in 2010. On the next page are some demographic facts for Carrollton:
Table 8: Town of Carrollton Demographics
Population 190 White persons 172 African American persons 17 Other non-white persons 1 Median Household Income $42.292 Total housing units 96 Owner-occupied housing units 91 Individuals below poverty level 61
Town of North Carrollton The Town of North Carrollton was established in 1890 around a railroad terminal on what is now the Columbus-Greenville Railroad. With a land area of about 0.3 square miles and an altitude of 350 feet, the terrain is described as steep with narrow ridge tops and narrow valleys. Big Sand Creek, which flows westerly along the southern corporate border of North Carrollton, drains the southern portion of the community. Commercial and residential development exists in the flood plain. Low-lying areas along Big Sand Creek and Beasley Creek are subject to periodic flooding caused by overflow of these streams usually during heavy or prolonged seasonal rains.13 Below are listed some demographic facts for North Carrollton:14 Table 9: Town of North Carrollton Demographics Population 473 White persons 280 African American persons 171 Other non-white persons 22 Median Household Income $17,574 Total housing units 244 Owner-occupied housing units 202 Individuals below poverty level 291
13 Flood Insurance Study, Town of North Carrollton, June 1977. 14 2010 Census Data.

11
Town of Vaiden The Town of Vaiden is one of two county seats of Carroll County. It is located on U.S. Highway 51, about three miles off Interstate 55. With an approximate land area of 2.0 square miles, Vaiden’s elevation is about 350 feet according to the National Geodetic Vertical Datum of 1929. The terrain is steep with narrow ridge tops and narrow valleys leading out to plains around the Big Black River.15 The next table lists some demographic facts for the Town of Vaiden:16 Table 10: Town of Vaiden Demographics Population 734 White persons 239 African American persons 479 Other non-white persons 16 Median Household Income $22,000 Total housing units 357 Owner-occupied housing units 305 Individuals below poverty level 185
15 Flood Insurance Study, Town of Vaiden, June 1977. 16 2010 Census Data.

12
Grenada County Grenada County covers an area of about 431 square miles with an estimated population of 21,906 according to the 2010 Census. In the ten years between 2000 and 2010, Grenada County decreased by 1,357 people, or -5.83 percent. In a 2011 Census estimate, the population decreased since 2010, with 21,706 (200 fewer people for a -0.9% decrease in one year).17 Geographically, Grenada County is located in north-central Mississippi, adjacent to Yalobusha County to the north; Tallahatchie County to the north and west; Leflore County to the west; Carroll and Montgomery Counties to the south; and Calhoun and Webster Counties to the east. Interstate 55, U.S. Highway 51, and State Highways 7 and 8 serve the county. Land use in Grenada County is predominantly agricultural; however, numerous major industries have made the community a major employment center for surrounding counties. Cotton, corn and soybeans are the major crops; however, 64 percent of the acreage in Grenada County is currently in timber land.18 Elevations in Grenada County vary widely from 125 feet in the Delta area (western region of Grenada County) to 460 feet in the hill section (central region). Table 11: Grenada County Demographics Population, 2011 estimate 21,706 Population, 2010 21,906 Population, 2000 23,263 Persons 65 years and older, 2000 3,364 (15.5%) Number Housing units, 2011 10,108 Number Households, 2010 8,945 Median Household Income, 2010 $32,901 Number persons below poverty, 2010 5,470 (25.2%)
17 U.S. Census Data: and 2011 Census Estimate. 18 Mississippi State University Extension Service (Forestry Facts); and Flood Insurance Study, Grenada County, June 1978.
13
Municipalities
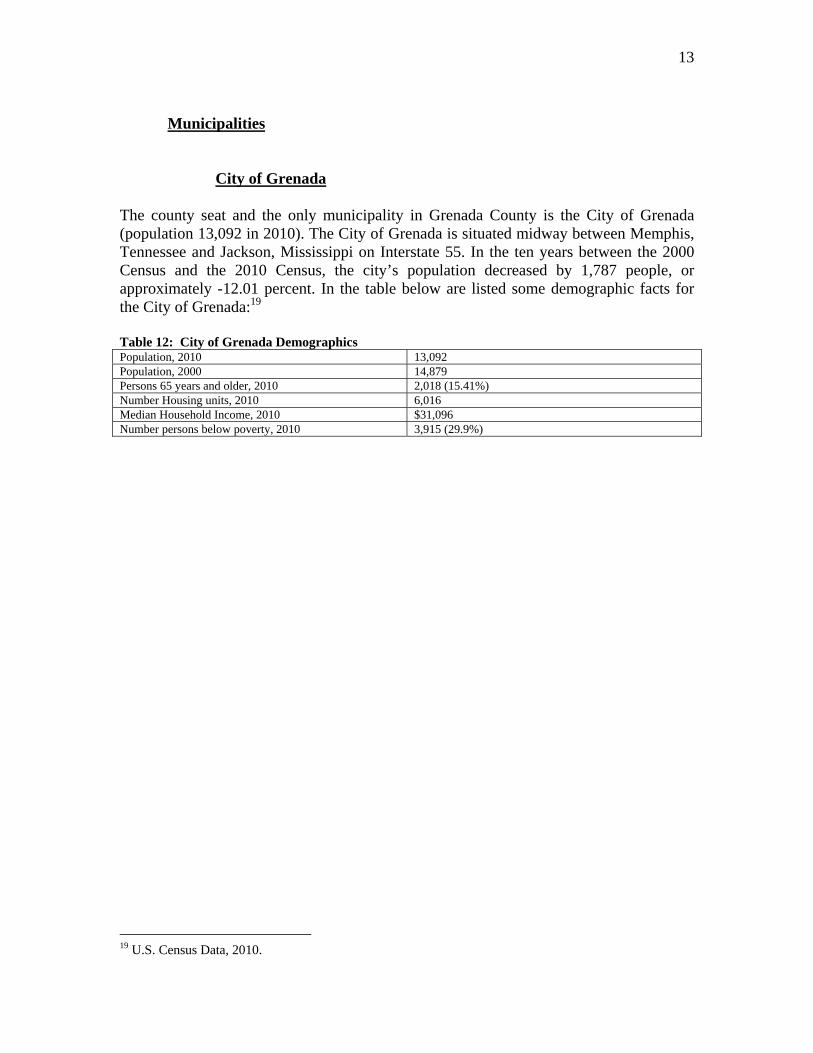
City of Grenada The county seat and the only municipality in Grenada County is the City of Grenada (population 13,092 in 2010). The City of Grenada is situated midway between Memphis, Tennessee and Jackson, Mississippi on Interstate 55. In the ten years between the 2000 Census and the 2010 Census, the city’s population decreased by 1,787 people, or approximately -12.01 percent. In the table below are listed some demographic facts for the City of Grenada:19 Table 12: City of Grenada Demographics Population, 2010 13,092 Population, 2000 14,879 Persons 65 years and older, 2010 2,018 (15.41%) Number Housing units, 2010 6,016 Median Household Income, 2010 $31,096 Number persons below poverty, 2010 3,915 (29.9%)
19 U.S. Census Data, 2010.

14
Holmes County Holmes County, located in central Mississippi, is bordered on the north by Carroll and Leflore Counties, on the east by Attala County, on the south by Yazoo County, and on the west by Humphreys County. The county covers an area of about 756 square miles with an estimated population of 19,198.20 The population has decreased by 2,411 people, or -11.16 percent since 2000. Empowerment Zone status has been helpful in attracting economic development in the county. The principal economic base in Holmes County is still agriculture; however, that make-up is slowly changing as more employers choose to locate in the Empowerment Zone for tax purposes. Two major employers are located in Durant, and a new industrial laundry facility will begin operations in 2004. Other major employers include the University Medical Center, Holmes Community College, the Holmes/Humphreys County Correctional Facility, Flat Rock of Mississippi, and local and state government agencies. Holmes County is in the Bluff Hills region of Mississippi, which is characterized by highly-erodible loess deposits with deeply incised channels.21 Table 13: Holmes County Demographics Population 2010 19,198 White persons, percent, 2010 2,993 African American persons present, 2010 15,925 Other Races present, 2010 280 Persons 65 and older, percent 2010 12.6 Poverty Rate 2010 43.4% Median Household Income 2010 $21,375 High School Graduate Rate 67.3
20 2010 Census Data, Holmes County. 21 Flood Insurance Study, Holmes County, 1999.

15
Municipalities
Town of Cruger
With a population of 449, the Town of Cruger is located in the north east region of Holmes County, north of the Morgan Brake National Wildlife Refuge, and south of Leflore County on Highway 49. In the ten years between 2000 and 2010, the Town of Cruger lost 63 people, or -14% of its population. That trend is predicted to continue at a lower rate of loss, or about 5% over the next five years. Some demographic facts for Cruger are shown below: Table 14: Town of Cruger Demographics Population 2010 386 White persons, percent, 2010 14.2% African American persons present, 2010 84.7% Other Races present, 2010 1.0% Persons 65 and older, percent 2010 12.69% Poverty Rate 2010 56.0% Median Household Income 2010 $11,890
City of Durant
The City of Durant is located on Highway 51 in east central Holmes County, about 2 miles east of Interstate 55. The city is bounded on the east by the Big Black River. In the ten years between 2000 and 2010, the City of Durant lost 259 people, for a -8.8% population decrease. That trend is predicted to continue over the next five years. Some demographic facts for Durant are shown in the next table: Table 15: City of Durant Demographics Population 2010 2673 White persons, percent, 2010 13.80% African American persons present, 2010 85.2% Other Races present, 2010 1.0% Persons 65 and older, percent 2010 13.2% Poverty Rate 2010 40.7% Median Household Income 1999 $23,205

16
Town of Goodman
The Town of Goodman is located on Highway 51, about 3 miles east of Interstate 55. In the ten years between 2000 and 2010, the Town of Goodman gained 134 people, for a 10.7% population increase. That trend is predicted to continue over the next five years. Some demographic facts for Goodman are shown in the next table: Table 16: Town of Goodman Demographics Population 2010 1,386 White persons, percent, 2010 23.7% African American persons present, 2010 74.2% Other Races present, 2010 2.1% Persons 65 and older, percent 2010 6.0%
Poverty Rate 2010 47.7% Median Household Income 2010 $19,063
City of Lexington The City of Lexington is located on Highway 12 in the central section of Holmes County. In the ten years between 2000 and 2010, the City of Lexington lost 294 people, for a -14.52% population decrease. That trend is predicted to slow over the next five years, leveling out to about a 1.2% population decrease. Some demographic facts for Lexington are shown in the next table: Table 17: City of Lexington Demographics Population 2010 1,731 White persons, percent, 2010 26.9% African American persons present, 2010 70.9% Other Races present, 2010 1.1% Persons 65 and older, percent 2010 14.6% Poverty Rate 2010 40.5% Median Household Income 2010 $21,645
17
Town of Pickens
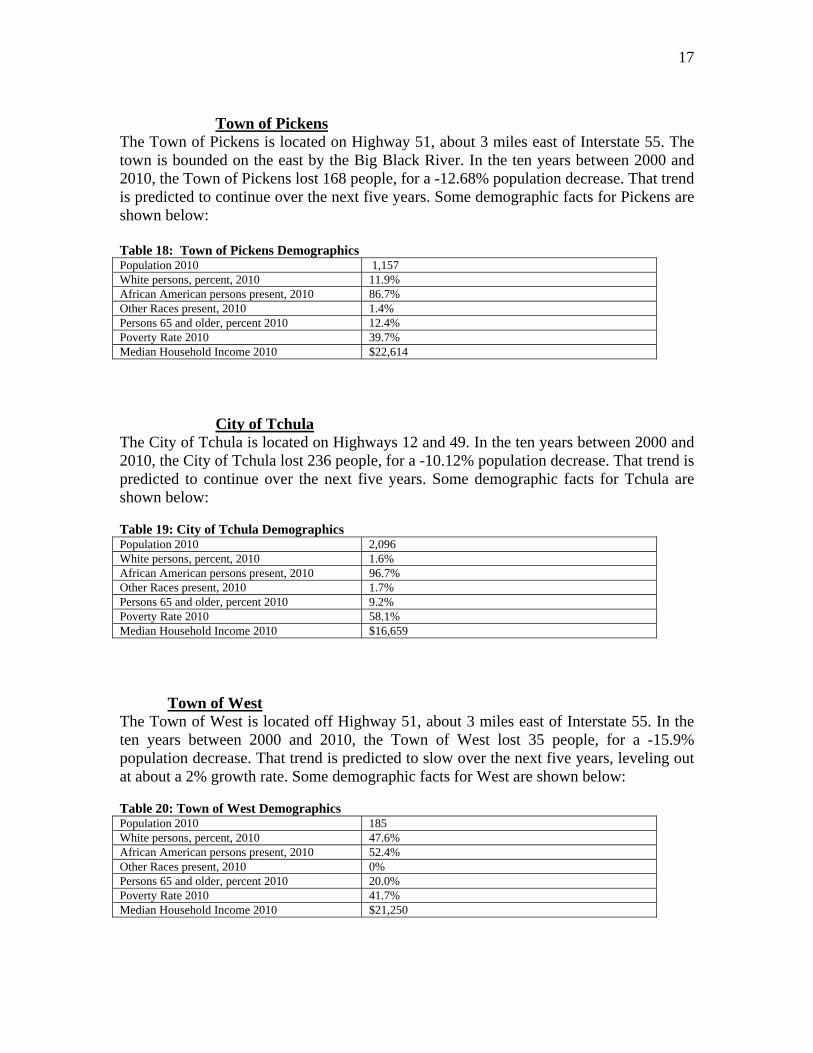
The Town of Pickens is located on Highway 51, about 3 miles east of Interstate 55. The town is bounded on the east by the Big Black River. In the ten years between 2000 and 2010, the Town of Pickens lost 168 people, for a -12.68% population decrease. That trend is predicted to continue over the next five years. Some demographic facts for Pickens are shown below: Table 18: Town of Pickens Demographics Population 2010 1,157 White persons, percent, 2010 11.9% African American persons present, 2010 86.7% Other Races present, 2010 1.4% Persons 65 and older, percent 2010 12.4% Poverty Rate 2010 39.7% Median Household Income 2010 $22,614
City of Tchula
The City of Tchula is located on Highways 12 and 49. In the ten years between 2000 and 2010, the City of Tchula lost 236 people, for a -10.12% population decrease. That trend is predicted to continue over the next five years. Some demographic facts for Tchula are shown below: Table 19: City of Tchula Demographics Population 2010 2,096 White persons, percent, 2010 1.6% African American persons present, 2010 96.7% Other Races present, 2010 1.7% Persons 65 and older, percent 2010 9.2% Poverty Rate 2010 58.1% Median Household Income 2010 $16,659
Town of West The Town of West is located off Highway 51, about 3 miles east of Interstate 55. In the ten years between 2000 and 2010, the Town of West lost 35 people, for a -15.9% population decrease. That trend is predicted to slow over the next five years, leveling out at about a 2% growth rate. Some demographic facts for West are shown below: Table 20: Town of West Demographics Population 2010 185 White persons, percent, 2010 47.6% African American persons present, 2010 52.4% Other Races present, 2010 0% Persons 65 and older, percent 2010 20.0% Poverty Rate 2010 41.7% Median Household Income 2010 $21,250

18
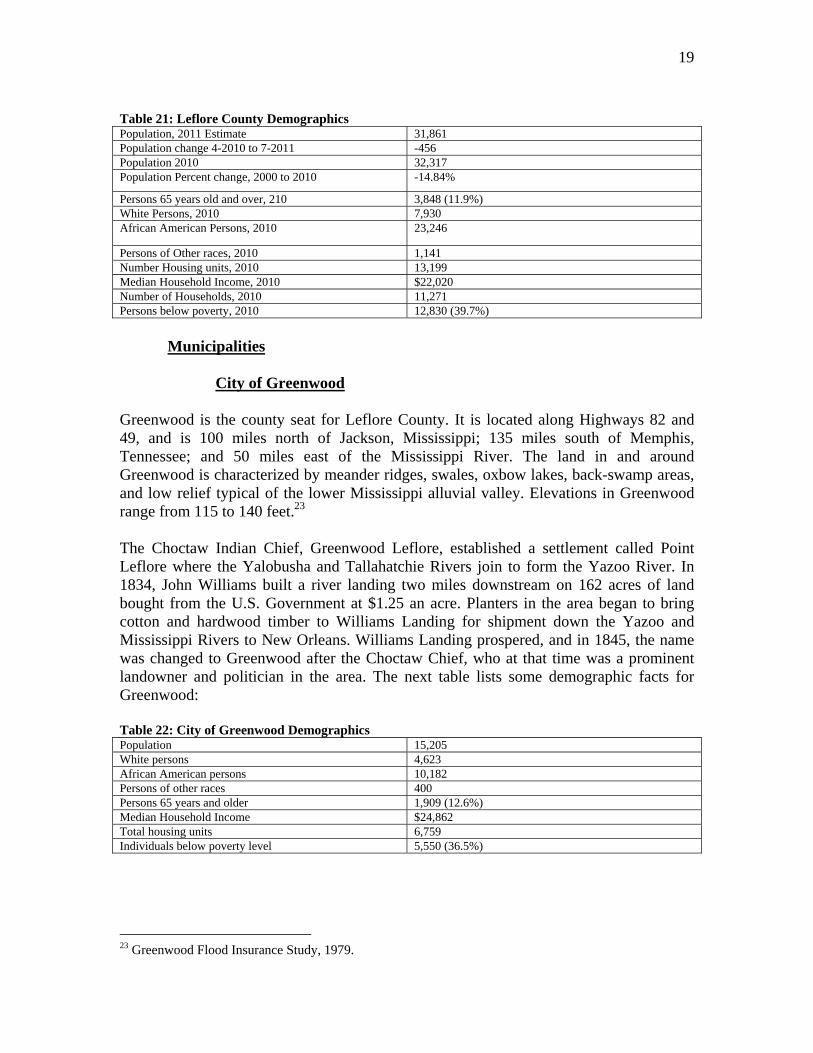
Leflore County Leflore County covers an area of about 592 square miles with an estimated population of 31,861.22 The county seat in Leflore County is the City of Greenwood (population 15,205), which is situated on U.S. Highway 82. A portion of the county is located in the Empowerment Zone, which provides tax incentives and other economic benefits. Leflore County is in the Mississippi River Delta, bordered by Tallahatchie County to the north, by Grenada and Carroll Counties to the east, by Holmes and Humphreys Counties to the south, and by Sunflower County to the west. The county is 100 miles north of Jackson, Mississippi; 135 miles south of Memphis, Tennessee; and 35 miles east of the Mississippi River. The Yazoo River, formed where the Tallahatchie and Yalobusha Rivers join just north of Greenwood, flows south through eastern Leflore County before entering Humphreys County. The geography of Leflore County is characterized by the relief typical of the Lower Mississippi Valley alluvial valley, with meander ridges and swales, oxbow lakes, back-swamp areas, and low relief. Elevations range from 145 feet in the northern portion to 85 feet along the Yazoo River, where it enters Humphreys County in the south. The primary economic base for Leflore County is agriculture, with approximately 80 percent of the land area in crops or pastures. Cotton, Corn, Oats, Sorghum, Soybeans and Wheat are the major field crops. About one (1) percent of the county’s land area is in industrial use; 13 percent of the county is developed with mixed uses; and six (6) percent, or 35.52 square miles of land is unused. Major employers include Viking Range Corporation; Mississippi Valley State University; Greenwood-Leflore Hospital; Heartland Catfish; Milwaukee Electric Tool Corporation; City of Greenwood, and Leflore County. The large industrial/commercial area just southwest of Greenwood was recently annexed into the City of Greenwood, as was a portion of Highway 82. Most new development within the City of Greenwood is currently commercial, and is occurring along the newly annexed portion of Highway 82 and on Highway 7.
22 2010 Census Data, Leflore County (estimate for 2011).
19
Table 21: Leflore County Demographics Population, 2011 Estimate 31,861 Population change 4-2010 to 7-2011 -456 Population 2010 32,317 Population Percent change, 2000 to 2010 -14.84%
Persons 65 years old and over, 210 3,848 (11.9%) White Persons, 2010 7,930 African American Persons, 2010 23,246
Persons of Other races, 2010 1,141 Number Housing units, 2010 13,199 Median Household Income, 2010 $22,020 Number of Households, 2010 11,271 Persons below poverty, 2010 12,830 (39.7%)
Municipalities
City of Greenwood
Greenwood is the county seat for Leflore County. It is located along Highways 82 and 49, and is 100 miles north of Jackson, Mississippi; 135 miles south of Memphis, Tennessee; and 50 miles east of the Mississippi River. The land in and around Greenwood is characterized by meander ridges, swales, oxbow lakes, back-swamp areas, and low relief typical of the lower Mississippi alluvial valley. Elevations in Greenwood range from 115 to 140 feet.23 The Choctaw Indian Chief, Greenwood Leflore, established a settlement called Point Leflore where the Yalobusha and Tallahatchie Rivers join to form the Yazoo River. In 1834, John Williams built a river landing two miles downstream on 162 acres of land bought from the U.S. Government at $1.25 an acre. Planters in the area began to bring cotton and hardwood timber to Williams Landing for shipment down the Yazoo and Mississippi Rivers to New Orleans. Williams Landing prospered, and in 1845, the name was changed to Greenwood after the Choctaw Chief, who at that time was a prominent landowner and politician in the area. The next table lists some demographic facts for Greenwood: Table 22: City of Greenwood Demographics Population 15,205 White persons 4,623 African American persons 10,182 Persons of other races 400 Persons 65 years and older 1,909 (12.6%) Median Household Income $24,862 Total housing units 6,759 Individuals below poverty level 5,550 (36.5%)
23 Greenwood Flood Insurance Study, 1979.

20
City of Itta Bena
The City of Itta Bena is located just south of Highway 82 on Highway 7 in the central region of Leflore County. The city is home to Mississippi Valley State University and a major catfish industry. Below are listed some demographic facts for Itta Bena: Table 23: City of Itta Bena Demographics Population 2,049 White persons 206 African American persons 1,828 Persons of other races 15 Persons 65 years and older 228 (11.1%) Median Household Income $22,002 Total housing units 820 Individuals below poverty level 969 (47.3%)
Town of Morgan City
The Town of Morgan City is located in the southern region of Leflore County on Highway 7, south of the City of Itta Bena. Below are listed some demographic facts for Morgan City: Table 24: Town of Morgan City Demographics Population 255 White persons 48 African American persons 203 Persons of other races 4 Persons 65 years and older 21 (8.2%) Median Household Income $20,789 Total housing units 93 Individuals below poverty level 151 (59.3%)
Town of Schlater
The Town of Schlater is located on Highway 442 in the northern region of Leflore county. Below are listed some demographic facts for Schlater: Table 25: Town of Schlater Demographics Population 310 White persons 90 African American persons 213 Persons of other races 7 Persons 65 years and older 33 (10.65%) Median Household Income $22,708 Total housing units 132 Individuals below poverty level 142 (45.9%)

21
Town of Sidon
The Town of Sidon is located in the southeast region of Leflore County, just west of Highway 49. Below are listed some demographic facts for Sidon: Table 26: Town of Sidon Demographics Population 509 White persons 26 African American persons 477 Persons of other races 6 Persons 65 years and older 18 (3.54%) Median Household Income $15,577 Total housing units 168 Individuals below poverty level 340 (66.7%)

22
Montgomery County Montgomery County covers an area of about 407 square miles with an estimated population of 10,872 according to the 2010 Census. In the ten years between 2000 and 2010, Montgomery County’s population decreased by -1,264 people, or -10.37 percent.24 Geographically, Montgomery County is located in north-central Mississippi, adjacent to Grenada County to the north; Webster and Choctaw Counties to the east; Carroll County to the west; and Attala County to the south. Interstate 55, U.S. Highways 51 and 82, and State Highways 404 and 407 serve the county. Land use in Montgomery County is predominantly agricultural; with a few major industries located in the Winona area. Cotton, corn and soybeans are the major crops in Montgomery County; however, 69 percent of the acreage in Montgomery County is currently in timber land. Table 27: Montgomery County Demographics Population, 2011 estimate 10,872 Population, 2010 12,925 Population, 2000 12,189 Persons 65 years and older, 2010 1,878 (17.2%) Number Housing units, 2010 5,194 Number Housing units, 2011 5,104 Number Households, 2010 4,347 Median Household Income, 2010 $31,488 Number persons below poverty, 2010 2,620 (24.1%)
24 U.S. Census Data: 2010 Census Data; and 2011 Census Estimate.
23
Municipalities
City of Winona
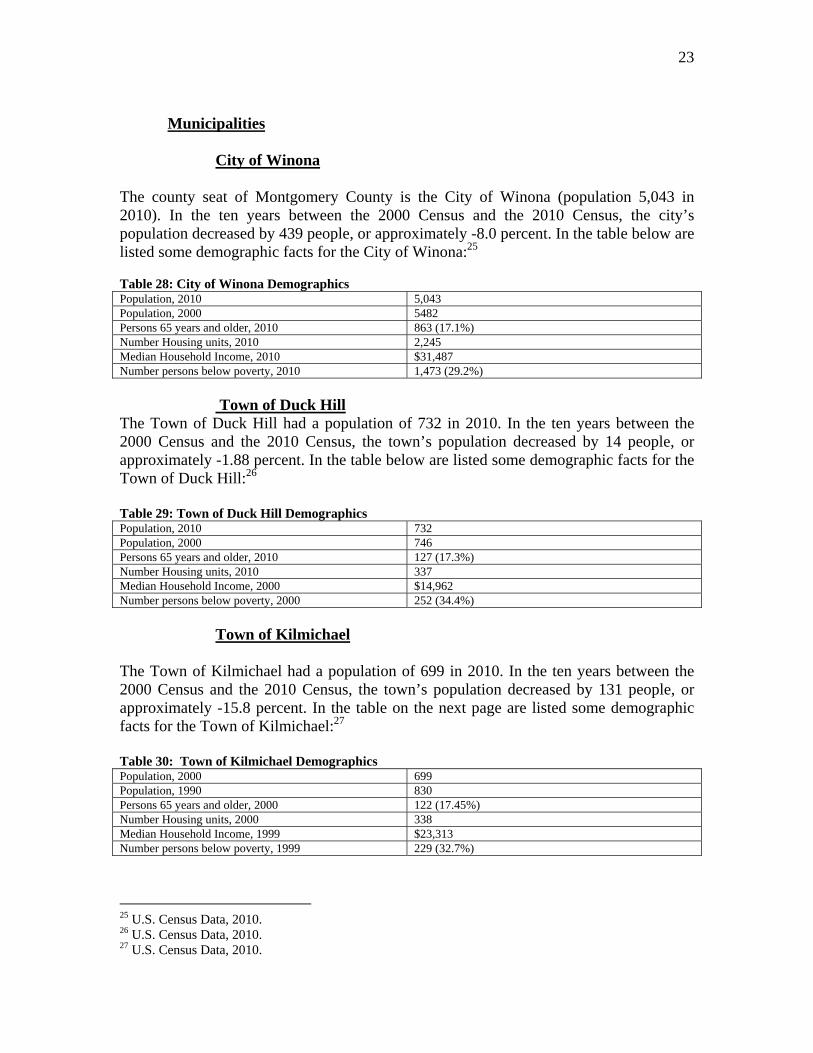
The county seat of Montgomery County is the City of Winona (population 5,043 in 2010). In the ten years between the 2000 Census and the 2010 Census, the city’s population decreased by 439 people, or approximately -8.0 percent. In the table below are listed some demographic facts for the City of Winona:25 Table 28: City of Winona Demographics Population, 2010 5,043 Population, 2000 5482 Persons 65 years and older, 2010 863 (17.1%) Number Housing units, 2010 2,245 Median Household Income, 2010 $31,487 Number persons below poverty, 2010 1,473 (29.2%)
Town of Duck Hill
The Town of Duck Hill had a population of 732 in 2010. In the ten years between the 2000 Census and the 2010 Census, the town’s population decreased by 14 people, or approximately -1.88 percent. In the table below are listed some demographic facts for the Town of Duck Hill:26 Table 29: Town of Duck Hill Demographics Population, 2010 732 Population, 2000 746 Persons 65 years and older, 2010 127 (17.3%) Number Housing units, 2010 337 Median Household Income, 2000 $14,962 Number persons below poverty, 2000 252 (34.4%)
Town of Kilmichael
The Town of Kilmichael had a population of 699 in 2010. In the ten years between the 2000 Census and the 2010 Census, the town’s population decreased by 131 people, or approximately -15.8 percent. In the table on the next page are listed some demographic facts for the Town of Kilmichael:27 Table 30: Town of Kilmichael Demographics Population, 2000 699 Population, 1990 830 Persons 65 years and older, 2000 122 (17.45%) Number Housing units, 2000 338 Median Household Income, 1999 $23,313 Number persons below poverty, 1999 229 (32.7%)
25 U.S. Census Data, 2010. 26 U.S. Census Data, 2010. 27 U.S. Census Data, 2010.

24
Yalobusha County Overall, Yalobusha County lost -373 people, for an -2.86% decrease in population between the years of 2000 and 2010. In the 2011 estimated census data, Yalobusha County lost another 126 people for a decrease of about -1% in one year.
Because of the approximate 30,000 acres of federal and state park lands in Yalobusha County, and the 219,700 acres of timber land, there are only about 49,300 acres available for development in Yalobusha County. As a result, Yalobusha County currently has a small tax base of approximately 10,000 taxpayers.
Table 31: Yalobusha County Demographics
Jurisdiction Population 2010
Population 2000
Population Change
Percent Change
Yalobusha County 12,678 13,051 -373 -2.86% Jurisdiction Elderly Median Income
Households People Living Below Poverty
Number of Housing Units
Yalobusha County 2,098 $29,911 3,322 6,344

25
Municipalities City of Water Valley
Yalobusha County has two county seats: the City of Water Valley and the Town of Coffeeville. Water Valley has the largest population of all Yalobusha County municipalities, and is the location of the Yalobusha General Hospital. Between the years of 2000 and 2010, Water Valley decreased by 7.75%, bringing its population down to 3,392.
New development currently planned for the city includes new office and maintenance buildings for the Water Valley Housing Authority.
In the past 15 years, the City of Water Valley has worked with the U.S. Army Corps of Engineers and the USDA Natural Resources Conservation Service to correct drainage problems in the community. Two flood control dams were constructed north of the city, and flood control structures were installed in problem areas. Currently, the city is replacing a 200-foot section of clay pipe with 12-inch PVC. Sewer officials say this is the first step, but miles of additional pipe replacement will be needed to correct the remaining drainage problems in Water Valley.
Table 32: City of Water Valley Demographics
Jurisdiction Population 2010
Population 2000
Population Change
Percent Change
City of Water Valley 3292 3,677 -285 -7.75%
Jurisdiction Elderly Median Income
Households People Living Below Poverty
Number of Housing Units
City of Water Valley
594 $23,145 1,330 1,577
Town of Coffeeville
The Town of Coffeeville, one of two county seats in Yalobusha County, experienced a 2.69% decrease in population between the years 2000 and 2010. With the largest growth rate in the county, Coffeeville had 905 residents in 2010.
There is very little new residential construction occurring in Coffeeville except for a few single family homes and mobile homes being placed in scattered sites, in and around the town. A new county civic/agricultural center was completed last year on Highway 7 North in Coffeeville. This facility is designated as an emergency shelter for Yalobusha County. Other development includes new cellular towers that have been constructed in Coffeeville.

26
The Town of Coffeeville was awarded a Small Cities grant to repair a bridge and improve drainage in their community. Heavy or prolonged rain causes ditches to overflow, the sewer to back up, and ditch banks to erode.
Last year, the Mississippi Department of Transportation (MDOT) took over Highway 330, which runs through the Town of Coffeeville.
Table 33: Town of Coffeeville Demographics
Jurisdiction Population 2010
Population 2000
Population Change
Percent Change
Town of Coffeeville 905 930 -25 -2.69%
Jurisdiction Elderly Median Income
Households People Living Below Poverty
Number of Housing Units
Town of Coffeeville
154 $32,639 281 457
Town of Oakland
The Town of Oakland has an estimated 527 residents. That total represents a 10.07% decrease in population between the years of 2000 and 2010. Oakland is located in the north west region of Yalobusha County, between two major transportation routes: I-55 and US Highway 51.
There is very little new residential construction occurring in Oakland except for a few single family homes and mobile homes being placed in scattered sites.
Planned for development in the near future is a natural gas line which will be extended from Coffeeville, giving Oakland residents a choice of using natural gas or propane.
Table 34: Town of Oakland Demographics Jurisdiction Population
2010 Population
2000 Population
Change Percent Change
Town of Oakland 527 586 -59 -10.07% Jurisdiction Elderly Median Income
Households People Living Below Poverty
Number of Housing Units
Town of Oakland 65 $25,909 236 261

27
C. CEDS Committee Members
Mission Statement for CEDS Committee The Mission of the North Central PDD CEDS Committee is to guide economic development actions within the North Central Planning and Development District. The methodology of the CEDS Committee is to provide an inclusive and coordinated process that is regional in scope, and to support development activities that leverage the District’s assets for the benefit of the residents and the region.
CEDS Committee 2012-2013
Name Category County Cliff Barnes Business Yalobusha Art Cook Business Attala Angela Curry Economic Development Leflore Larry Davis Public Official Holmes Pablo Diaz Economic Development Grenada Larry Hart Business Yalobusha Charlie Health Business Montgomery George Johnson Private Citizen Carroll Tim Pinkard Public Official Attala Frank Short Workforce Leflore Earline Russell-Smith Higher Education Holmes John Stewart Business Leflore Sue Stidham Economic Development Montgomery Donnie Sultan Business Grenada Randy Watkins Business Montgomery Jimmy Willis Business Grenada Steve Zea Economic Development Attala
28
III. REGIONAL ANALYSIS A. POPULATION DEMOGRAPHICS 1. Population Growth
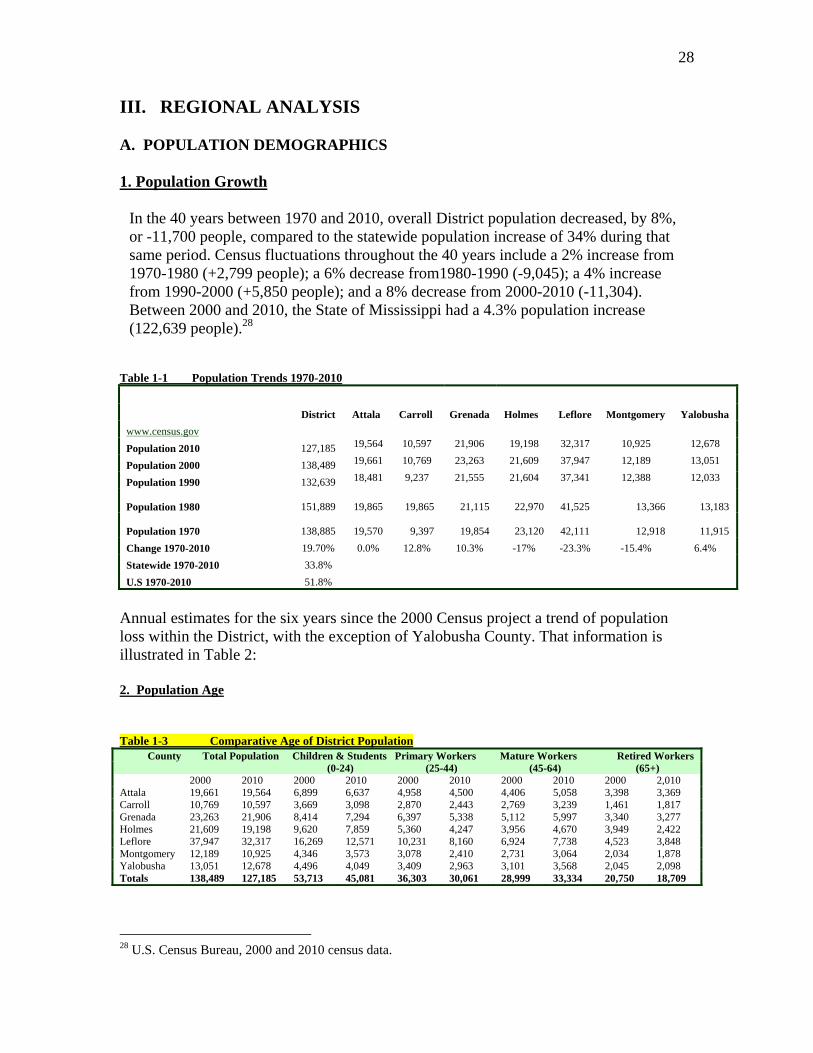
In the 40 years between 1970 and 2010, overall District population decreased, by 8%, or -11,700 people, compared to the statewide population increase of 34% during that same period. Census fluctuations throughout the 40 years include a 2% increase from 1970-1980 (+2,799 people); a 6% decrease from1980-1990 (-9,045); a 4% increase from 1990-2000 (+5,850 people); and a 8% decrease from 2000-2010 (-11,304). Between 2000 and 2010, the State of Mississippi had a 4.3% population increase (122,639 people).28
Table 1-1 Population Trends 1970-2010
District Attala Carroll Grenada Holmes Leflore Montgomery Yalobusha
www.census.gov Population 2010 127,185 19,564 10,597 21,906 19,198 32,317 10,925 12,678
Population 2000 138,489 19,661 10,769 23,263 21,609 37,947 12,189 13,051
Population 1990 132,639 18,481 9,237 21,555 21,604 37,341 12,388 12,033
Population 1980 151,889
19,865 19,865 21,115 22,970
41,525 13,366 13,183
Population 1970 138,885
19,570 9,397 19,854 23,120
42,111 12,918 11,915
Change 1970-2010 19.70% 0.0% 12.8% 10.3% -17% -23.3% -15.4% 6.4%
Statewide 1970-2010 33.8%
U.S 1970-2010 51.8%
Annual estimates for the six years since the 2000 Census project a trend of population loss within the District, with the exception of Yalobusha County. That information is illustrated in Table 2: 2. Population Age Table 1-3 Comparative Age of District Population
County Total Population Children & Students Primary Workers Mature Workers Retired Workers (0-24) (25-44) (45-64) (65+) 2000 2010 2000 2010 2000 2010 2000 2010 2000 2,010 Attala 19,661 19,564 6,899 6,637 4,958 4,500 4,406 5,058 3,398 3,369 Carroll 10,769 10,597 3,669 3,098 2,870 2,443 2,769 3,239 1,461 1,817 Grenada 23,263 21,906 8,414 7,294 6,397 5,338 5,112 5,997 3,340 3,277 Holmes 21,609 19,198 9,620 7,859 5,360 4,247 3,956 4,670 3,949 2,422 Leflore 37,947 32,317 16,269 12,571 10,231 8,160 6,924 7,738 4,523 3,848 Montgomery 12,189 10,925 4,346 3,573 3,078 2,410 2,731 3,064 2,034 1,878 Yalobusha 13,051 12,678 4,496 4,049 3,409 2,963 3,101 3,568 2,045 2,098 Totals 138,489 127,185 53,713 45,081 36,303 30,061 28,999 33,334 20,750 18,709
28 U.S. Census Bureau, 2000 and 2010 census data.
29
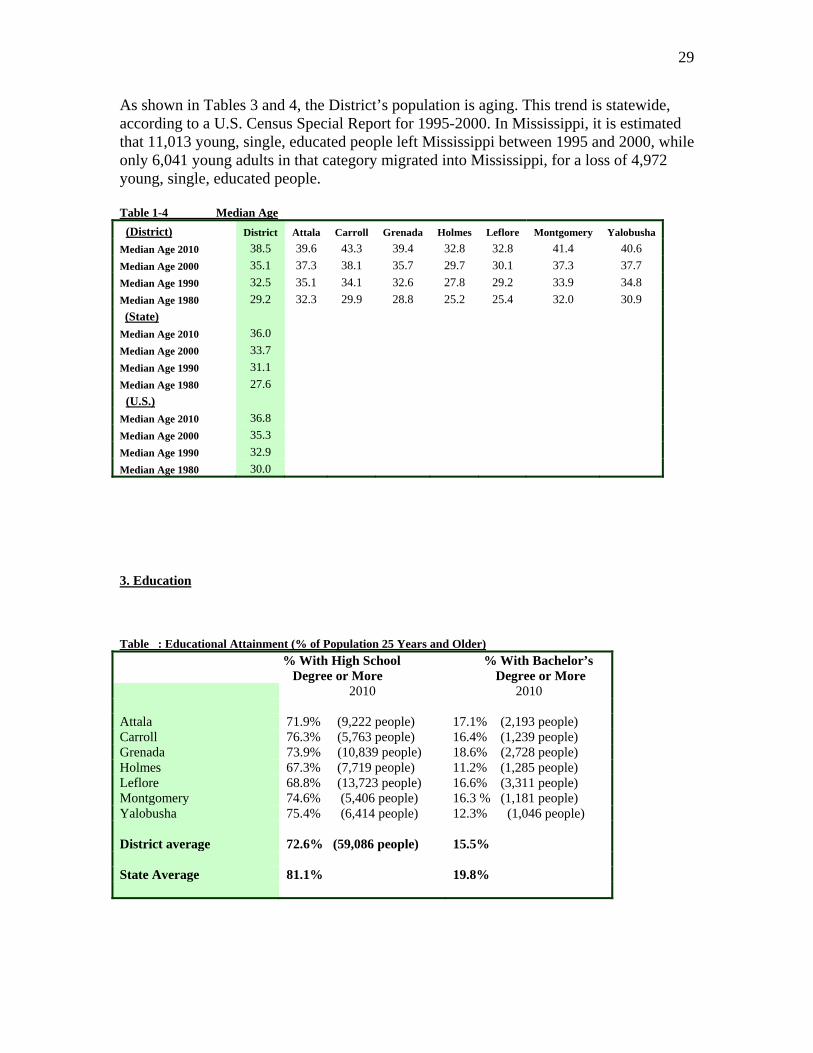
As shown in Tables 3 and 4, the District’s population is aging. This trend is statewide, according to a U.S. Census Special Report for 1995-2000. In Mississippi, it is estimated that 11,013 young, single, educated people left Mississippi between 1995 and 2000, while only 6,041 young adults in that category migrated into Mississippi, for a loss of 4,972 young, single, educated people. Table 1-4 Median Age
(District) District Attala Carroll Grenada Holmes Leflore Montgomery Yalobusha
Median Age 2010 38.5 39.6 43.3 39.4 32.8 32.8 41.4 40.6
Median Age 2000 35.1 37.3 38.1 35.7 29.7 30.1 37.3 37.7
Median Age 1990 32.5 35.1 34.1 32.6 27.8 29.2 33.9 34.8
Median Age 1980 29.2 32.3 29.9 28.8 25.2 25.4 32.0 30.9
(State)
Median Age 2010 36.0
Median Age 2000 33.7
Median Age 1990 31.1
Median Age 1980 27.6
(U.S.)
Median Age 2010 36.8
Median Age 2000 35.3
Median Age 1990 32.9
Median Age 1980 30.0
3. Education Table : Educational Attainment (% of Population 25 Years and Older)
% With High School % With Bachelor’s Degree or More Degree or More 2010 2010
Attala 71.9% (9,222 people) 17.1% (2,193 people) Carroll 76.3% (5,763 people) 16.4% (1,239 people) Grenada 73.9% (10,839 people) 18.6% (2,728 people) Holmes 67.3% (7,719 people) 11.2% (1,285 people) Leflore 68.8% (13,723 people) 16.6% (3,311 people) Montgomery 74.6% (5,406 people) 16.3 % (1,181 people) Yalobusha 75.4% (6,414 people) 12.3% (1,046 people) District average 72.6% (59,086 people) 15.5% State Average 81.1% 19.8%

30
Table : Estimated Drop-Out Rates for NCPDD Public Schools
Estimates of 4-Year Drop-Out Rates in NCPDD Public School Systems29
Drop-Out Rate Attala County School District
25.1%
Kosciusko School District 5.1% Carroll County School District
24.6%
Grenada County School District
25.1%
Holmes County School District
20.2%
Leflore County School District
24.6%
Greenwood School District 39.4% Montgomery County School District
13.4%
Winona School District 19.1% Coffeeville School District 28.3% Water Valley School District
28.1%
District Totals 23% State Average 16.8%
According to the 2009 Mississippi Statewide Accountability System, all NCPDD public school districts are accredited. Not all the schools within the Holmes County School District were having problems, however. The Goodman-Pickens Elementary, Lexington Elementary, and Mileston Elementary performed at the Level 3, or Successful designation within the Holmes County School District.30 Table Colleges in NCPDD Location Type Name of Institution Greenwood 4 – year Mississippi Valley State University Greenwood Center (Off-Campus
Center) Itta Bena (Leflore County)
4 – year Mississippi Valley State University
Kosciusko (Attala County)
4 – year Magnolia Bible College (Private)
Grenada (Grenada County)
2 – year Holmes County Community College (Grenada Center)
Goodman (Holmes County)
2 – year Holmes County Community College
Educational challenges for the North Central Planning and Development District are similar to those Statewide:31
29 Mississippi Dept. of Education, Annual Dropout Report, 2010. 30 Mississippi State Board of Education, Final Results, September 13, 2007. 31 Mississippi Workforce Investment Board, Strategic Plan for Workforce in Mississippi for 2007-2009, Plan, June 2007 (state avg. as of April 2007)

31
Global competition, increasing pace of communications and technology; Workers and job seekers need assistance at every skill level to keep up with the
rapid changes in technology and the job market; Growing shortage of qualified workers; Decreased cultural value of high school education and lifelong learning; and Prison population growing by 8% each year and recidivism rate of 28% within 3
years.
In the NCPDD education and workforce development beginning with K-12 are crucial to attracting industry and economic growth. Workforce development services available to the NCPDD include pre-employment training, upgrade training and retraining.
Delta Workforce Investment Area Mississippi Partnership Workforce Investment Area As of 2010, within the Mississippi Partnership Workforce Investment Area, which includes Attala, Grenada, Montgomery, and Yalobusha counties, the average hourly wage was $15.13 and the average annual wage was $31,451.00. The average hourly wage for the Delta Workforce Investment Area (includes Leflore, Carroll and Holmes counties) was $13.96, and the annual average wage was $28,945.00.32
32 Mdes.ms.gov Quick Reference Sheet
32
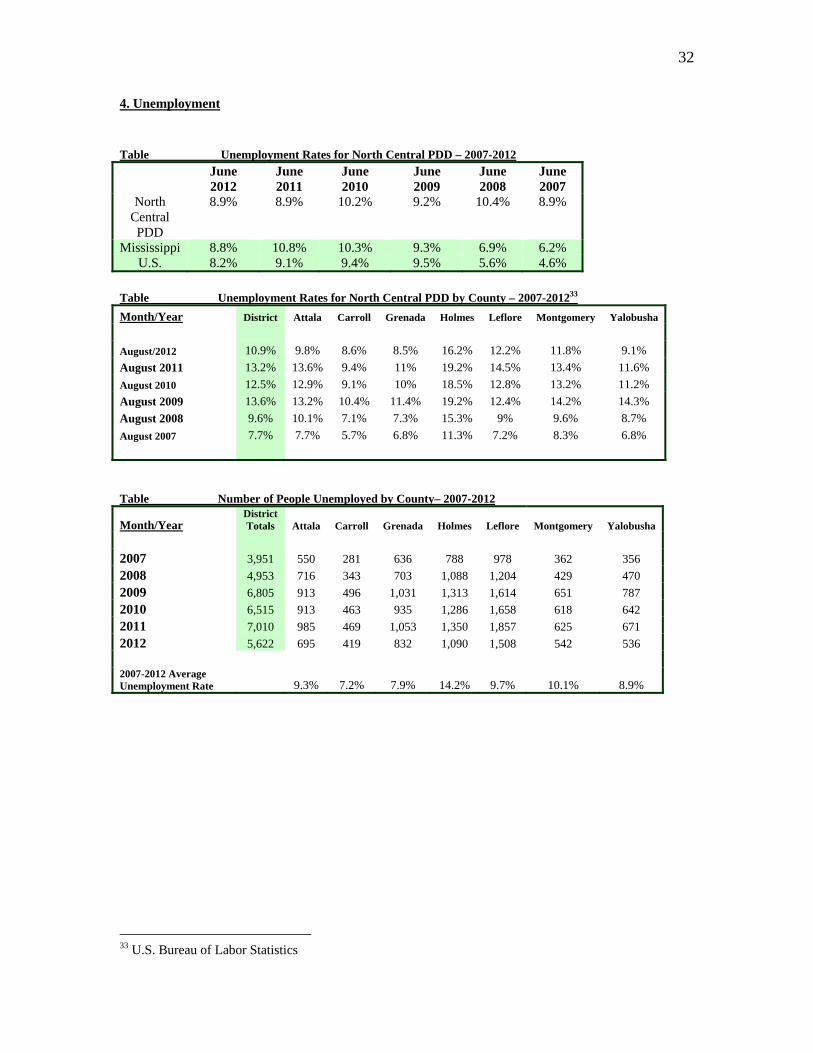
4. Unemployment Table Unemployment Rates for North Central PDD – 2007-2012
June 2012
June 2011
June 2010
June 2009
June 2008
June 2007
North Central PDD
8.9% 8.9% 10.2% 9.2% 10.4% 8.9%
Mississippi 8.8% 10.8% 10.3% 9.3% 6.9% 6.2% U.S. 8.2% 9.1% 9.4% 9.5% 5.6% 4.6%
Table Unemployment Rates for North Central PDD by County – 2007-201233 Month/Year District Attala Carroll Grenada Holmes Leflore Montgomery Yalobusha
August/2012 10.9% 9.8% 8.6% 8.5% 16.2% 12.2% 11.8% 9.1%
August 2011 13.2% 13.6% 9.4% 11% 19.2% 14.5% 13.4% 11.6%
August 2010 12.5% 12.9% 9.1% 10% 18.5% 12.8% 13.2% 11.2%
August 2009 13.6% 13.2% 10.4% 11.4% 19.2% 12.4% 14.2% 14.3%
August 2008 9.6% 10.1% 7.1% 7.3% 15.3% 9% 9.6% 8.7%
August 2007 7.7% 7.7% 5.7% 6.8% 11.3% 7.2% 8.3% 6.8%
Table Number of People Unemployed by County– 2007-2012
Month/Year District Totals Attala Carroll Grenada Holmes Leflore Montgomery Yalobusha
2007 3,951 550 281 636 788 978 362 356
2008 4,953 716 343 703 1,088 1,204 429 470
2009 6,805 913 496 1,031 1,313 1,614 651 787
2010 6,515 913 463 935 1,286 1,658 618 642
2011 7,010 985 469 1,053 1,350 1,857 625 671
2012 5,622 695 419 832 1,090 1,508 542 536
2007-2012 Average Unemployment Rate 9.3% 7.2% 7.9% 14.2% 9.7% 10.1% 8.9%
33 U.S. Bureau of Labor Statistics

33
Loss of Manufacturing Jobs According to data compiled by the Mississippi Manufacturers’ Register,34 manufacturing jobs began a sharp decline throughout Mississippi between 2001 and 2002, with employment dropping by 4.4% statewide. From 2002 and 2003, the loss was even greater, with a 6.5% employment drop, then a 5.5% loss between 2003 and 2004. The data indicates that since 2004, Mississippi has continued to lose manufacturing jobs, but at a slower rate. The total loss statewide for the six years equaled 61,000 jobs or a 23% employment loss. There was a loss of 309 manufacturing plants (8%) in Mississippi during that time. Although complete information was not available in the 2002 Economic Census to make a thorough 1997 / 2002 comparison, the number of manufacturing facilities in the North Central Planning and Development District decreased by ten between 1997 and 2002, with a decrease of approximately35 3,262, or 25% of manufacturing jobs. Table Manufacturing Sector – Comparison 1997 and 2002 Economic Census36 and 2007 MDA Data
District Totals Attala Carroll Grenada Holmes Leflore Montgomery Yalobusha
1997
# Establishments 128 21 * 26 9 39 21 12
# Employees 6,781 972 * 3,022 635 Not
avail. 579 1,573 Value of Shipments ($1,000) 974,421 113,269 * 401,163 57,423
Not avail. 111,955 290,611
Annual Payroll ($1,000) 174,345 21,641 * 76,594 17,273
Not avail. 16,035 42,802
2002
# Establishments 94 23 Not
avail. 24 6 34 Not avail. 7
#Employees 5,114 984
Not
avail. 2,910 622 D Not avail. 598
Value of Shipments ($1,000) 1,259,922 319,485
Not
avail. 732,464 207,973 D Not avail. D Annual Payroll ($1,000) 146,963 27,779
Not avail. 101,708 17,476 h Not avail. D
D: Withheld to avoid disclosing data for individual companies; data are in higher level totals h: 2,500 – 4,999 employees 5. Poverty
34 MNI, 2007, “Mississippi Manufacturing.” 35 http://www.mississippi.org, Manufacturers’ Database, 2007. Information extrapolated to estimate Leflore County’s manufacturing sector. 36 U.S. Census, 1997 and 2002 Economic Census Data.
34
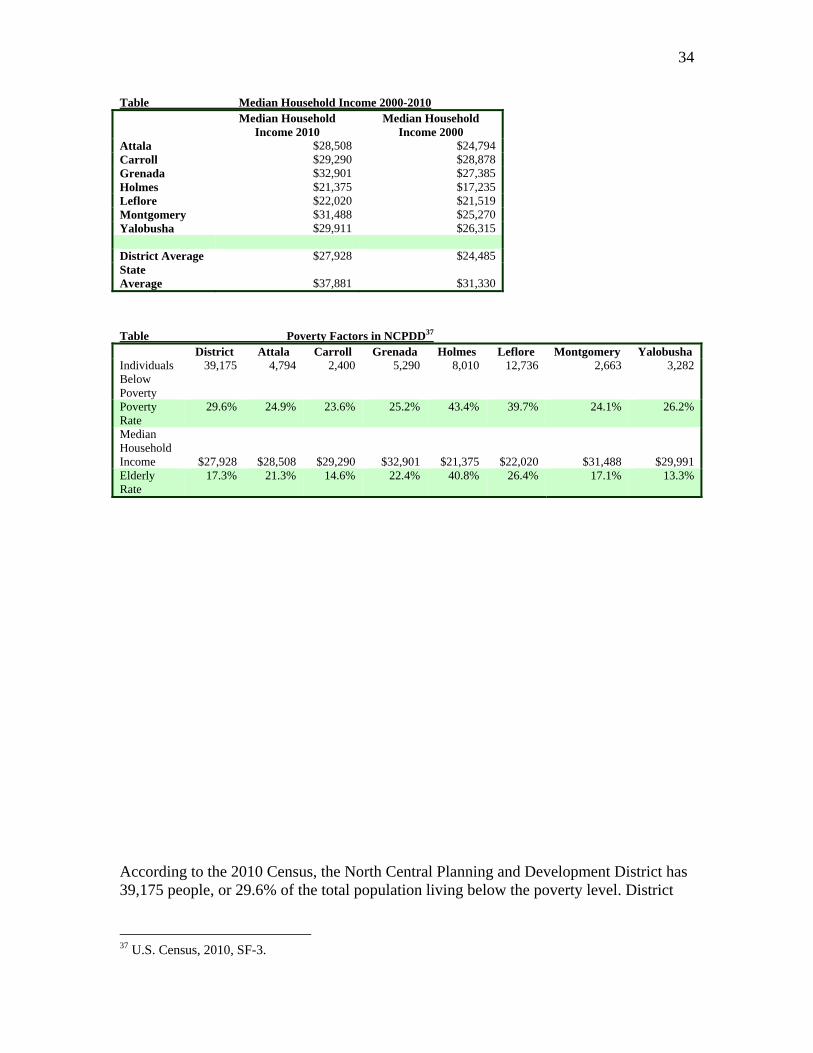
Table Median Household Income 2000-2010
Median Household Income 2010
Median Household Income 2000
Attala $28,508 $24,794 Carroll $29,290 $28,878 Grenada $32,901 $27,385 Holmes $21,375 $17,235 Leflore $22,020 $21,519 Montgomery $31,488 $25,270 Yalobusha $29,911 $26,315 District Average $27,928 $24,485 State Average
$37,881
$31,330
Table Poverty Factors in NCPDD37 District Attala Carroll Grenada Holmes Leflore Montgomery Yalobusha Individuals Below Poverty
39,175 4,794 2,400 5,290 8,010 12,736 2,663 3,282
Poverty Rate
29.6% 24.9% 23.6% 25.2% 43.4% 39.7% 24.1% 26.2%
Median Household Income
$27,928
$28,508
$29,290
$32,901
$21,375
$22,020
$31,488
$29,991 Elderly Rate
17.3% 21.3% 14.6% 22.4% 40.8% 26.4% 17.1% 13.3%
According to the 2010 Census, the North Central Planning and Development District has 39,175 people, or 29.6% of the total population living below the poverty level. District
37 U.S. Census, 2010, SF-3.

35
demographics show that African-Americans experienced a higher poverty rate than white people, with lower Median Household Income (MHI) and Per Capita incomes. Table Race and Poverty in NCPDD38 District
Averages Attala Carroll Grenada Holmes Leflore Montgomery Yalobusha
White 47.81% 56.5% 65.5% 56.8% 16.4% 25.8% 53.0% 60.7% African-American
50.85% 42.2% 33.0% 41.9% 82.6% 72.5% 45.9% 37.9%
Hispanic 1.37%
1.7% 1.3% 1.1% .8% 2.4% 1.0% 1.3%
Poverty Rates By Race
White 13.38% 15.0% 10.9% 12.0% 16.5% 11.4% 11.3% 16.6% African-American
44.57% 38.6% 49.6% 44.1% 48.6% 50.8% 39.0% 41.3%
Hispanic 37.58% 4.8% 44.5% 0% 100.0% 29.8% 41.5% 42.5%
Median Household Income (MHI) by Race
MHI for White
$39,411.57 $40,628 $40,651 $38,750 $40,762 $41,498 $36,443 $37,149
MHI for African-American
$18,942.57
$18,043
$15,436
$23,707
$18,677
$16,597
$19,942
$20,196
MHI for Other Race
$28,036.25
$19,620
N/A
$29,315
N/A
$45,224
N/A
$17,986
Per Capita Income by Race
Per Capita for White
$22,029.14 $22,309 $19,774 $24,284 $21,993 $23,637 $21,465 $20,742
Per Capita for African-American
$10,270.00 $11,808 $7,836 $12,865 $9,215 $9,025 $10,992 $10,149
Per Capita For Other Race39
$5,421.16 $6,257 N/A $11,763 $1,547 $8,545 $4,415 $8,448
38 Ibid. 39 Less than 1%

36
6. Workforce Participation Rate Table Participation Rates 2006
Attala Carroll Grenada Holmes Leflore Montgomery Yalobusha Total District
Civilian Labor Force Male 2000
4,377
2,563
5,281
3,854
7,112
2,507
4,667
30,361
Participation Rate
59.91%
60.55%
65.22%
54.12%
57.06%
61.72%
46.27%
Avg. 57.84%
Civilian Labor Force Female 2000
3,756
2,244
4,690
3,801
6,967
2,449
3,054
26,961
Participation Rate
45.87%
51.69%
49.18%
45.22%
48.70%
49.55%
62.11%
Avg. 50.34%
Table Participation Rates 2010
Attala Carroll Grenada Holmes Leflore Montgomery Yalobusha Total District
Civilian Labor Force Male 2006
4,245
2,618
5,422
3,744
7,280
2,399
3,023
28,731
Participation Rate
59.54%
61.18%
65.78%
53.05%
57.44%
60.04%
61.28%
Avg. 59.76%
Civilian Labor Force Female 2006
3,878
2,286
4,927
4,427
7,307
2,454
2,825
28,104
Participation Rate
47.29%
53.35%
50.93%
53.63%
52.37%
51.58%
49.53%
Avg. 51.24%
7. Employment / by Occupation Table Employment By Occupation in North Central PDD 2007 Economic Census
District Attala Carroll Grenada Holmes Leflore Montgomery Yalobusha
Manufacturing # of est. 94 23 0 24 6 34 ? 7
Wholesale Trade # est. 114 21 3 29 10 39 7 5
Retail Trade # est. 616 95 21 136
81 182 59 42
Information 50 8 0 8 11 14 7 2
Real Estate 107 9 0 26 14 47 4 7
Professional, scientific 148 23 4 33 13 50 14 11
Adm, support, waste mgt 75 8 4 24 3 20 10 6
Education services 9 3 0 1 2 3 0 0
Health/social service 244 24 3 69 33 77 21 17 Arts, entertainment, recreation 26 3 0 6 1 12 2 2
Accom & food services 214 26 5 61 25 62 23 12 Other (except public adm) 160 25 5 40 18 47 16 9
Totals 1857 268 45 457 217 587 163 120

37
Table NPCDD Employment Totals By Occupation 2000 2006 2010 Architecture/Engineering 473 481 626 Arts/Design/Entert/Sports/Medi 461 456 343 Building/Grounds Cleaning/MX 1,751 1,694 1,726 Business Operations Specialist 407 398 885 Community/Social Services 664 646 774 Computer and Mathematics 162 169 334 Construction/Extraction 2,907 2,915 2,128 Education/Training/Library 3,168 3,166 3,058 Farming/Fishing/Forestry 1,075 1,075 778 Financial Specialists 698 703 Food Prep/Serving Related 1,855 1,788 2,249 Healthcare/Practitioner/Tech 2,153 2,151 2,805 Healthcare Support 1,080 1,137 1,554 Installation/Maintenance/Repair 2,225 2,236 2,314 Legal 243 244 177 Life/Physical/Social Science 160 164 214 Mgt., including Farm Mgt. 3,434 3,432 3,483 Office/Admn Support 6,494 6,506 6,165 Personal Care Service 955 960 1,256 Production 8,848 8,896 7,192 Protective Service 1,157 1,161 1,125 Sales/Related 5,091 5,108 4,884 Service and Farm 8,688 Transportation/Material Moving 4,064 4,076 4,514 Totals 49,525 49,562 57,272 Table Catfish Industry NCPDD40 Catfish Acreage in
1972 Catfish Acreage in 2001
Catfish Acreage in 2009
Leflore 319 16,041 17,400 Holmes & Carroll 110 950 N/A District Total 429 acres 16,991 acres 17,400 acres
The MSU Department of Agricultural Economics estimates that approximately 52 hours of labor are required for each acre of pond operation annually, resulting in about 3,000 man-hours of labor used per farm each year.
40 MSU Dept. of Agricultural Economics

38
Table 2010 Harvested Timber Volumes By Product in Thousand Board Feet41 Note: MBM and MBF = Thousand Board Feet
Pine Lum-ber MBM
Hard- wood Lum-ber MBM
Pine Saw- logs MBF
Hard- wood Saw- logs MBF
Pine Pulp- wood cords
Hardwood pulpwood Cords
Pine Poles 100ft³
Stump- wood Tons
Tur- pen- tine Gum Barrels
Cross- ties MBF
Pine Logs Tons
Attala 36,283.78 8,455.10 111,597.23 Carroll 3,335.45 1,825.33 101,411.57 23,444.09 1.10
Grenada 4,261.00 336.00 32,111.33 3,721.73 0.32
Holmes 162.67 2,426.65 4,310.67 59,598.87 24,074.89 .06 Leflore 2,957.33 12.23 12,859.38 Mont-gom- ery
12,089.37 1,158.67 71,989.87 17858.13 22.55 1.33
Yalo-busha
152.95 11,361.64 19,380.33 10,151.29
District 162.67 22,265.42 58,233.42 292,959.30 203,706.74 24.03 1.33 % of State Total
39.74%
2.4%
18.38%
5.78%
4.47%
2.57%
.0003%
Table Manufacturing Facilities / Employment42
Total Employees
Total Facilities
Attala 1,112 23Carroll n/a n/aGrenada 2,910 24Holmes 622 6Leflore h 34Montgomery n/a n/aYalobusha 598 7 District Totals 5,242 87
65.5% of the District’s 43,871 workers included in the 2000 Census were employed in their county of residence, while the other 14,413 people worked out of state or in other counties. Table 2000 Work Flow Data (Worker County of Residence) District Attala Carroll Grenada Holmes Leflore Montgomery Yalobusha Works in County of Residence
28,749 4,415 662 7,193 3,059 9,131 2,149 2,140
Works Out of State
791 211 33 130 164 38 56 159
Works in Other MS County
14,331 2,374 2,945 1,323 2,467 1,271 1,847 2,104
Totals 43,871 7,000 3,640 8,646 5,690 10,440 4,052 4,403
41 MSU Extension Service Report, “Harvest of Forest Products 2006,” 2/2007 42 MDA Manufacturers’ Database, 8/14/2007.
39
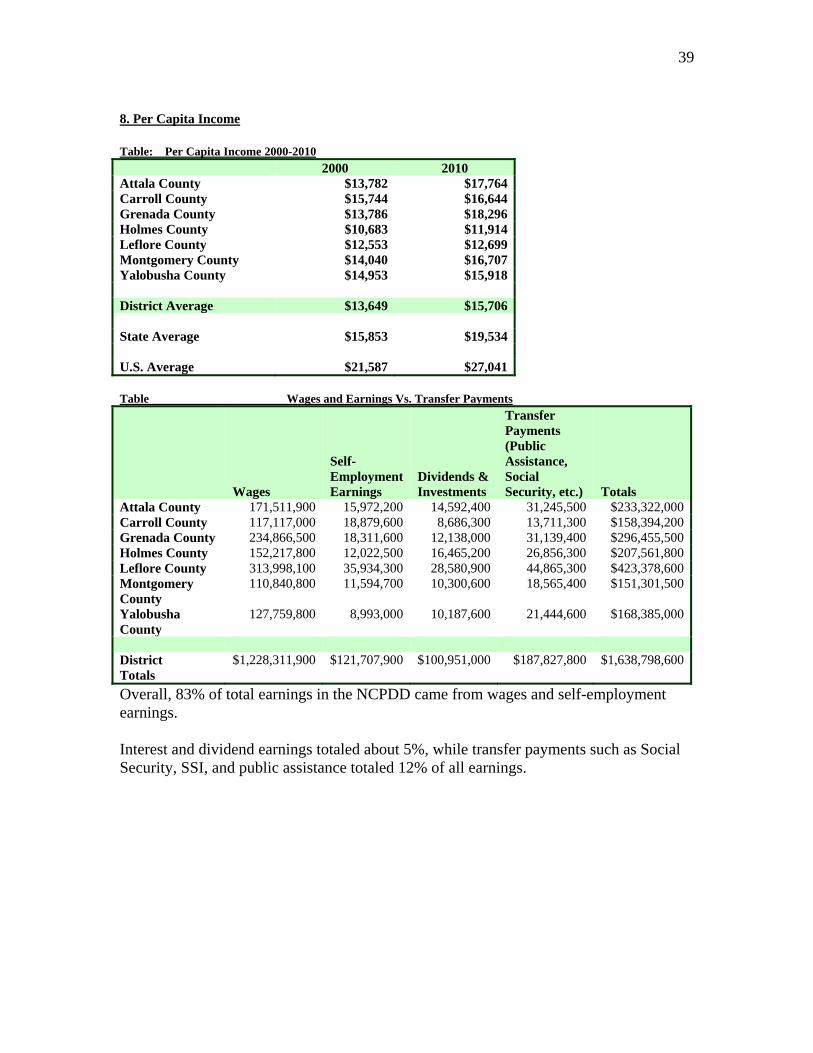
8. Per Capita Income Table: Per Capita Income 2000-2010
2000 2010 Attala County $13,782 $17,764Carroll County $15,744 $16,644Grenada County $13,786 $18,296Holmes County $10,683 $11,914Leflore County $12,553 $12,699Montgomery County $14,040 $16,707Yalobusha County $14,953 $15,918 District Average $13,649 $15,706 State Average $15,853 $19,534 U.S. Average $21,587 $27,041 Table Wages and Earnings Vs. Transfer Payments
Wages
Self-Employment Earnings
Dividends & Investments
Transfer Payments (Public Assistance, Social Security, etc.)
Totals
Attala County 171,511,900 15,972,200 14,592,400 31,245,500 $233,322,000Carroll County 117,117,000 18,879,600 8,686,300 13,711,300 $158,394,200Grenada County 234,866,500 18,311,600 12,138,000 31,139,400 $296,455,500Holmes County 152,217,800 12,022,500 16,465,200 26,856,300 $207,561,800Leflore County 313,998,100 35,934,300 28,580,900 44,865,300 $423,378,600Montgomery County
110,840,800 11,594,700 10,300,600 18,565,400 $151,301,500
Yalobusha County
127,759,800 8,993,000 10,187,600 21,444,600 $168,385,000
District Totals
$1,228,311,900 $121,707,900 $100,951,000 $187,827,800 $1,638,798,600
Overall, 83% of total earnings in the NCPDD came from wages and self-employment earnings. Interest and dividend earnings totaled about 5%, while transfer payments such as Social Security, SSI, and public assistance totaled 12% of all earnings.

40
B. INFRASTRUCTURE 1. WATER SYSTEMS Table Water Systems in North Central PDD Overall Ratings (Maximum 5) 2008 2009 2010 Attala County Conehoma Water Assn. #1 5 5 5 Town of Ethel 4.33 4.33 4 Ethel Rural Water Assn 3.67 4.33 4 City of Kosciusko 4.67 4.67 4.67 McAdams Water Assn. 2.67 3.67 2.67 Town of McCool 3.67 3.67 3.67 Possumneck-Carmack Water Assn. 4.67 5 5 Sugar Creek Water Assn 3.33 4 4.33 Town of Sallis 5 5 5 Zama Water Assn. 3.67 4.33 4.33 Mississippi Water Co. 4 4 4 Springdale Youth Cnt. Hwy. 19-N 4.33 4.67 5 Springdale Youth Cnt. Hwy 12-W 4.33 4.67 5 Conehoma Water Assn. #2 5 5 5 Carroll County Black Hawk Water Assn. 3.67 3.67 4.33 Town of Carrollton 4 4.33 4.33 Pelucia Rural #2 – Gravel Hill 4 4.33 4 Pelucia Rural #3 – Coila 4 3.67 4.33 McCarley Water Assn. 3.67 4 3.67 Town of North Carrollton 3.33 3.67 3.33 Town of Vaiden 4.33 4.67 5 Pelucia Rural #4 – New Zion 4 4.33 4.33 Pelucia Rural #5 4 4.33 4 Black Hawk Water Assn. #2 - - - Grenada County GT&Y Water District Inc. 4.33 4.67 4.67 City of Grenada 4.33 4.33 4.67 Grenada-Bogue Basin/Holcomb 4.67 4.33 4.67 Grenada Co. W/S-Girl Scout 4.67 4.33 4.33 Grenada County W/S-Mond6y Rd/Elliott 4.33 4 3.67 Poor House Water Assn. #1 4.67 4.33 4.67 Poor House Water Assn. #2 4.67 4.33 4.67 Grenada Ind. Park & Airport Water 4.67 4.33 4.33 Grenada-Bogue Basin/Gore Springs 4.67 4.33 4.33 Young’s W/S Dist #1 – Dividing R 4.67 4.67 5 Young’s W/S Dist #2-Young’s Syst 5 4.67 5

41
Table Water Systems in North Central PDD (Cont’d) Overall Ratings (Maximum 5) 2008 2009 2010Holmes County Acona Water Assn. #1 5 5 4.33 Castalian Water Assn. 4.33 4.33 3.67 Centerville Community Water Assn. 4.67 4.67 4.33 Town of Cruger 3.33 4 4.33 City of Durant 4.33 4.33 3.67 Ebenezer Rural Water Assn. 4 4.33 4.33 Town of Goodman 4 4.33 4 Harland Creek Community Water Assn. 3.33 3.67 4 Holmes Jr. College 3 3.5 2 Lebanon Water Assn. – West 4.67 4 4.67 City of Lexington 4 4 4 Town of Pickens 5 4.67 4.33 South Holmes Water Assn. 3 3.33 3.67 Sweet Home Water & Sewer Dist. 5 5 4.67 City of Tchula 2.67 3 3.67 Town of West 3.33 3.67 3 West Hill Water Assn. 4.67 4.67 4.67 Castalian Water Assn. System B 4.33 CON CON South Holmes Water Assn. – B System 3 3.33 3.67 Harland Creek Community Water Assn. B 3.33 3.67 4 West Holmes Water Assn. 3.67 4 4.33 Lebanon Water Assn. East - - - Harland Creek Community Water Assn. C 3.33 3.67 4 Holmes Interstate Utility District 3.67 3.67 2.33 Harland Creek Water Assn. Horseshoe L 4 4.33 4.33 Leflore County City of Greenwood 4.67 5 5 City of Itta Bena 4.67 5 5 MS Valley State University 3.50 4 4 Morgan City Water & Sewer Assn. 3 3.67 3.67 City of Schlater 1.67 2.33 2.33 Town of Sidon 3 2.67 3.33 Chapman S/D North Delta Drilling 2.67 3.33 3.33 Chapman S/D South Delta Drilling 2.67 3.33 3.33 East Leflore Water & Sewer District 3 3.67 4 Fredrick S/D Delta Drilling 2.33 3 3.33 Delta Mobile Home Park & Apt. 2 2 2 City of Schlater (P D Plant) 2 2.67 2.33 Minter City Water & Sewer 5 5 5 Pillow Academy - - - Phillipston Water Assn. 2.67 4 4.33 Blue Lake Water Assn. Inc. 3 3.33 3.33 Heartland Catfish 4.5 4.5 5 America Catch Catfish Plant 5 5 5 Viking Specialty Products 2.5 2 2 Americas Catch – the Farm 5 5 5 Montgomery 51-55 Water Assn. 3.33 3.67 3.33 Town of Duck Hill 3.33 3 3.33 Eskridge-Rose Hill Water Assn. 4.67 4.33 4.67 Hays Creek Water Assn. – Mission Rd. 4.33 4.33 4.67 Town of Kilmichael 4.33 4.33 4.67 North District 1 Water Assn. 4 3.67 4 Poplar Creek Water Assn 3 3.67 3.67

42
South Winona Water Assn. 3.67 4 4
Table Water Systems in North Central PDD (Cont’d) Overall Ratings (Maximum 5) 2008 2009 2010Montgomery County (Cont’d) Stewart Water Assn. 4.33 4.67 4.67 City of Winona 4 4.33 4 Hay’s Creek Water Assn. – Minerva 4.67 4.67 5 Hay’s Creek Water Assn. – New Liberty 4.67 4.33 4.67 Hay’s Creek Water Assn. – Legion Lake Rd. 4.33 4.33 4.67 Hay’s Creek Water Assn. – Lodi 4.33 4.33 4.67 Hay’s Creek Water Assn. – Alva 4.33 4.33 4.67 Poplar Creek Water Assn. #2 - - - Stewart Water Assn. #2 4.33 4.67 4.67 Hay’s Creek Water Assn. – Minerva #2 4.67 4.67 5 Yalobusha County Town of Coffeeville 3.33 3 3.33 Cypress Creek Rural Water Assn. 4.67 4.67 5 East End Water Assn. 2.67 4 4 Jeff Davis Water Assn. Inc. 3.67 4.33 4.67 Town of Oakland 1.33 1 1.67 O’Tuckolofa Water Assn. 1.67 1.67 2.33 Tillatoba Water Assn. 3.33 3.67 3 Tri-Lakes Water Assn-East 2.67 2.67 4.33 City of Water Valley 3.33 4.33 4.67 Tri-Lakes Water Assn-West 3 3 4.33 Billy’s Creek Rural Water Assn. 4.33 4.33 4.67 Enid Lakes Estates 4 4.33 4.33 Yalobusha Water Sewer Dist. #1 3.67 4.33 3.33 Yalobusha Water Sewer Dist. #2 3.67 4.67 3.67 Tri-Lakes Water Assn. Central 2.67 2.67 4.33 Cypress Creek Rural Water Assn. 4.67 4.67 5 Windsor Foods NS 2 2

43
2. Sewer Systems Treatment Plant Permit Number
Attala County Kosciusko NPDES MS0027774 Ethel NPDES MS0024791 Carroll County Carrollton NPDES MS0059242 North Carrollton
NPDES MS0024741
Vaiden NPDES MS0021504 Grenada County Grenada NPDES MS0020397 Holcomb NPDES MS0036242 Holmes County Goodman NPDES MS0026921 Lexington NPDES MS0024601 Tchula NPDES MS0021482 West NPDES MS0032816 Leflore County Cruger NPDES MS0042315 Greenwood NPDES MS0023833 E. Leflore –Chapman NPDES MS0040185 E. Leflore – Rising Sun NPDES MS0022705 Morgan City NPDES MS0024716 Sidon NPDES MS0024724 Schlater NPDES MS0036005 Montgomery County Duck Hill NPDES MS0020133 Kilmichael NPDES MS0020001 Winona NPDES MS0021024 Yalobusha County Coffeeville NPDES MS0020923 Oakland NPDES MSU080024 Water Valley NPDES MS0022331

44
3. Ports a. Water Ports NCPDD is served by the Port of Greenville to the west, and by the Yazoo County Port to the south (serving industries on the Yazoo River). The port of Greenville has two port areas that handle steel coils, propane, scrap metal, potash, cottonseed, com screenings, wheat midds, granular fertilizer, corn and other feeds. The port is currently erecting an overhead gantry crane. The Yazoo County Port handles dry bulk cargos. Highway access to the Port of Greenville from the NCPDD is by Highway 82. U.S. 49 provides NCPDD access to the Yazoo County Port.43
Water Ports Near NCPDD
b. Airports
Within the North Central Planning and Development District, there are six general aviation airports:
Water Valley Municipal Airport, Grenada Municipal Airport, Greenwood-Leflore Airport, Winona-Montgomery County Airport, C.A. Moore Airport (Holmes County), and Kosciusko-Attala County Airport.
These airports provide corporate and agricultural aviation, air cargo activity, flight instruction, military operations, recreational/skydiving, air shows, medical evacuation, organ transplant transportation, forest firefighting, real estate tours, aerial photography, pipeline and environmental patrols, Civil Air Patrol, and search and rescue services. 43 MDOT Multiplan, December, 2009.

45
Commercial service airports most commonly used are Jackson International and Memphis International. Passenger airlines also serve the Golden Triangle Regional Airport (Columbus), Tupelo Regional, and Mid-Delta Regional (Greenville).44
.
44 MDOT Multiplan, December, 2009.

46
4. Industrial Parks Table NCPDD Industrial Parks Distance To Name/Location of Park Acres in
Site Largest Tract Avail.
Pwr Gas Wat. Rail 4- Ln
Rail Wat way
Air prt
Attala County Kosciusko-Attala County Industrial 55 40 Y Y Y N 20 3 108 71 Kosciusko Industrial Park 224 100 Y N Y N 21 1 108 70 Carroll County North Carrollton Industrial Park 25 25 N N N N 2 0 71 10 Vaiden Industrial Park 38 38 N N N N 3 0 88 79 Grenada County Grenada Air Industrial Park 250 150 Y Y Y Y 0 0 70 89 Papermill Rd. Industrial Park 176 176 N N Y N 0.5 1 70 90 I-55 Industrial Park 1,175 1,175 N Y N Y 0 0 70 90 Holmes County Lexington Industrial Park 5 5 N Y Y N 9 10 80 60 Tchula Industrial Park 29 10 N N N N 20 0 70 70 West Industrial Site 15 14 Y N N N 3 0.1 100 75 North Durant Industrial Park 62 45 N N N N 3 0 92 55 Holmes County Industrial Park 320 100 N Y Y N 0 2 76 58 Leflore County Greenwood-Leflore Industrial Air 300 80 N N N N 4 0 71 52 Greenwood-Leflore Industrial Park 1,485 350 Y Y Y Y 1 0 0 52 Rising Sun Waterfront Industrial Site
600 350 N N N Y 0 0 0 52
Itta Bena Industrial Park 360 360 N Y N N 0 1 63 52 Montgomery County Duck Hill Industrial Park 30 30 N N N N 3.5 0 90 85 Kilmichael Industrial Park 96 35 N N N N 10 0 40 79 Crossroad Industrial Park 42 35 N N N N 0 0 80 90 Jeff Davis Industrial Park 12 12 Y Y Y N 18 18 85 75 Yalobusha County Coffeeville Industrial Park 50 50 N N N N 13 0.7 90 87 Water Valley Industrial Park 116 116 N Y Y N 15 15 85 75 District Total 5,465
acres

47
5. Roads / Bridges (supporting business and industrial areas) a. Roads Table Public Road Length in Miles By County - 2010 MDOT
Maintained Other MDOT Maintained Other
County Paved Unpaved Total Attala 193.497 291.468 0.695 627.477 1,113.137
Carroll 127.223 149.879 0 517.140 794.242
Grenada 96.576 396.429 0 131.088 624.093
Holmes 156.937 327.244 0 531.023 1,015.204
Leflore 112.585 380.008 0 413.791 906.384
Montgomery 101.799 172.888 0 330.573 605.260
Yalobusha 129.941 378.008 0 196.774 704.723
District Totals 918.558 2095.924 0.695 2747.866 5,763.043
b. Bridges County Bridges Out of the District’s 851 county bridges, 21% have been classified by the Mississippi Office of State Aid Road Construction as requiring critical maintenance. In Attala County, 53% of all county bridges need critical maintenance. Holmes County has 54, or 34% of its 160 bridges in need of critical maintenance. Table County Bridges Needing Critical Maintenance Location Number County
Bridges Number Requiring Critical Maintenance
Percentage of County Bridges Needing Critical Maintenance
Attala 72 38 53% Carroll 182 29 16% Grenada 102 1 1% Holmes 160 54 34% Leflore 106 20 19% Montgomery 138 13 10% Yalobusha 91 18 20% DISTRICT TOTALS
851
173
21%
c. Railroads
The Canadian National Railroad uses tracks and spurs throughout the North Central Planning and Development District. Several railways have been abandoned in recent years. District officials now feel it is imperative to keep the remaining railways open for industrial and agricultural concerns.

48
As the rail industry tries to find sources of revenue in previously untapped areas, three potential markets are:45
Construction & Demolition Materials Municipal Solid Waste, and Ethanol & Biofuels
Safety is a major concern within the communities that have railroads. There have been several train derailments in Carroll and Holmes counties. Several communities are divided by train tracks in their central business districts (i.e. Cruger and Tchula). Transportation of hazardous materials through communities is also a concern with emergency management officials. Amtrak’s “City of New Orleans” route uses the Canadian National / Illinois Central (CN/IC) tracks to provide passenger rail service at its Greenwood station. The train runs daily though Mississippi on its route between Chicago and New Orleans.46 d. Rural Transit
Two federally funded providers provide transit services to the NCPDD. Mississippi Valley State University Mass Transit covers Carroll, Grenada, Holmes, Humphreys, Leflore, and Montgomery counties. Madison County Human Resource Agency also provides service to Holmes County. According to MDOT statistics as of December 2006, Yalobusha County does not presently have a rural transit provider.47 e. Intercity Bus Services Greyhound and/or its affiliated companies provide primary intercity bus service to the NCPDD. Two basic routes run through NCPDD communities on a daily basis.48 6. Broadband Telecommunications On July 1, 2003, the Mississippi Broadband Technology Development Act went into effect. Senate Bill 2979 provides companies with economic incentives for deploying broadband in sparsely populated areas. At present, broadband is available in each county; however, DSL service does not yet extend into every area of the District (DSL is available in every county; however, the coverage area may not reach all areas of the county). What is available throughout the District are T-1 and Frame Relay services, which are dedicated lines that allow customers to move large amounts of data, adding voice and 45 American Short Line and Regional Railroad Association, July 10, 2007. 46 MDOT Multiplan, December, 2009. 47 Ibid. 48 Ibid.
49
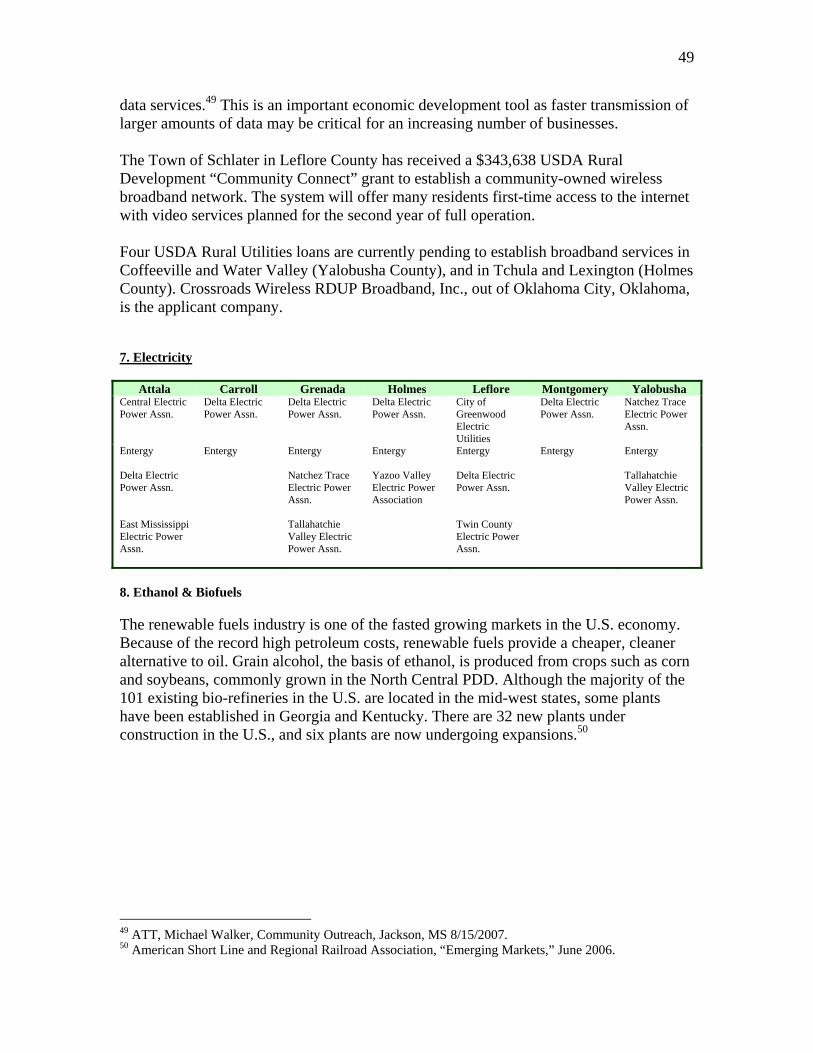
data services.49 This is an important economic development tool as faster transmission of larger amounts of data may be critical for an increasing number of businesses. The Town of Schlater in Leflore County has received a $343,638 USDA Rural Development “Community Connect” grant to establish a community-owned wireless broadband network. The system will offer many residents first-time access to the internet with video services planned for the second year of full operation. Four USDA Rural Utilities loans are currently pending to establish broadband services in Coffeeville and Water Valley (Yalobusha County), and in Tchula and Lexington (Holmes County). Crossroads Wireless RDUP Broadband, Inc., out of Oklahoma City, Oklahoma, is the applicant company. 7. Electricity
Attala Carroll Grenada Holmes Leflore Montgomery Yalobusha
Central Electric Power Assn.
Delta Electric Power Assn.
Delta Electric Power Assn.
Delta Electric Power Assn.
City of Greenwood Electric Utilities
Delta Electric Power Assn.
Natchez Trace Electric Power Assn.
Entergy Entergy Entergy
Entergy Entergy Entergy Entergy
Delta Electric Power Assn.
Natchez Trace Electric Power Assn.
Yazoo Valley Electric Power Association
Delta Electric Power Assn.
Tallahatchie Valley Electric Power Assn.
East Mississippi Electric Power Assn.
Tallahatchie Valley Electric Power Assn.
Twin County Electric Power Assn.
8. Ethanol & Biofuels The renewable fuels industry is one of the fasted growing markets in the U.S. economy. Because of the record high petroleum costs, renewable fuels provide a cheaper, cleaner alternative to oil. Grain alcohol, the basis of ethanol, is produced from crops such as corn and soybeans, commonly grown in the North Central PDD. Although the majority of the 101 existing bio-refineries in the U.S. are located in the mid-west states, some plants have been established in Georgia and Kentucky. There are 32 new plants under construction in the U.S., and six plants are now undergoing expansions.50
49 ATT, Michael Walker, Community Outreach, Jackson, MS 8/15/2007. 50 American Short Line and Regional Railroad Association, “Emerging Markets,” June 2006.

50
C. FINANCIAL RESOURCES 1. City and County General Fund Reserves
Table General Fund Reserves Attala Carroll Grenada Holmes Leflore Montgomery Yalobusha General Fund Reserves
$4,061,353.00
$420,688.00
$3,948,521.00
$2,033,837.00
$4,520,776.00
$498,760.00
$2,847,630.00
Total District Reserves
$18,331,565.00
2. Amount of General Obligation Debt Outstanding This type of debt is typically paid off with tax revenue. Table General Obligation Debt Outstanding
Attala Carroll Grenada Holmes Leflore Montgomery Yalobusha G.O Bonded Debt Outstanding
$1,425,000.00
$335,000.00
$7,590,000.00
$2,766,916.00
$14,905,000.00
$627,000.00
$3,205,000.00 Population 2010
19,564
10,597
21,906
19,198
32,317
10,925
12,678
Outstanding Debt Per Capita
$72.84
$31.61
$346.48
$144.13
$461.21
$57.39
$252.80 Total District G.O. Bonded Outstanding Debt $30,853,916.00 Total District G.O. Bonded Debt Per Capita $242.59
3. Amount of Revenue Bond Debt on Enterprise Operations of the Government These bonds finance capital projects that are paid off from a designated revenue stream generated by the projects they finance.
Table Revenue Bond Debt Attala Carroll Grenada Holmes Leflore Montgomery Yalobusha Revenue Bonded Debt Outstanding
$0.00
$3,290,000.00
$0.00
$4,210,000.00
$0.00
$0.00
$0.00 Total District Revenue Bond Debt $7,500,000.00
The legal debt margin for Mississippi counties is limited by state statute. Total outstanding debt during a year can be no greater than 15% of assessed value of the taxable property within the county according to the last completed assessment for taxation. This limitation is increased to 20% when a county issues bond to repair or replace washed out or collapsed bridges on public roads of the county.

51
4. Millage Rates The millage rate is the property tax rate set by the Board of Supervisors in each county. It is based on “mills.” One mill is equal to $1 per $1,000 of taxable property value.
Table Millage Rates Attala Carroll Grenada Holmes Leflore Montgomery Yalobusha Mill Rate County Wide
99.76
101.42
100.34
139.11
103.93
124.29
127.28
District Average Millage 113.73

52
E. EXTERNAL FORCES 1. Natural Environment
The North Central Planning and Development District (NCPDD) of Mississippi is made up of Attala, Carroll, Grenada, Holmes, Leflore, Montgomery and Yalobusha counties. These counties comprise approximately nine percent (9%) of the land area of the state. The 4,042 square miles of land in the NCPDD comprise two very diverse geographic areas: the flat delta land in the western portion, and the hill land in the eastern portion. The fertile “delta” includes Leflore County and portions of Carroll and Holmes Counties. Table District Land Mass / Watersheds51
Attala
Carroll
Grenada
Holmes
Leflore
Montgomery
Yalobusha
NCPDD
Land Area
735 628 731 756 492 407 467 4,316
Acres in Forest
372,800
280,800
173,000
269,700
63,500
260,400
219,700
1,639,900
Water-sheds
Big Black River Basin
Pearl River Basin
Big Black River Basin
Yazoo River Basin
Yazoo River Basin
Yazoo River Basin
Big Black River Basin
Yazoo River Basin
Big Black River Basin
Yazoo River Basin
Yazoo River Basin
Big Black River
Yazoo River
Pearl River
Table District Ecoregions52
Attala Carroll Grenada Holmes Leflore Montgomery Yalobusha Upper East Gulf Plain Ecoregion
Mississippi Alluvial Plain
51 US EPA, Watershed Database, 8/15/2007. 52 Mississippi Wildlife, Fisheries and Parks, “Mississippi’s Comprehensive Wildlife Conservation Strategy,” 1/16/2006.
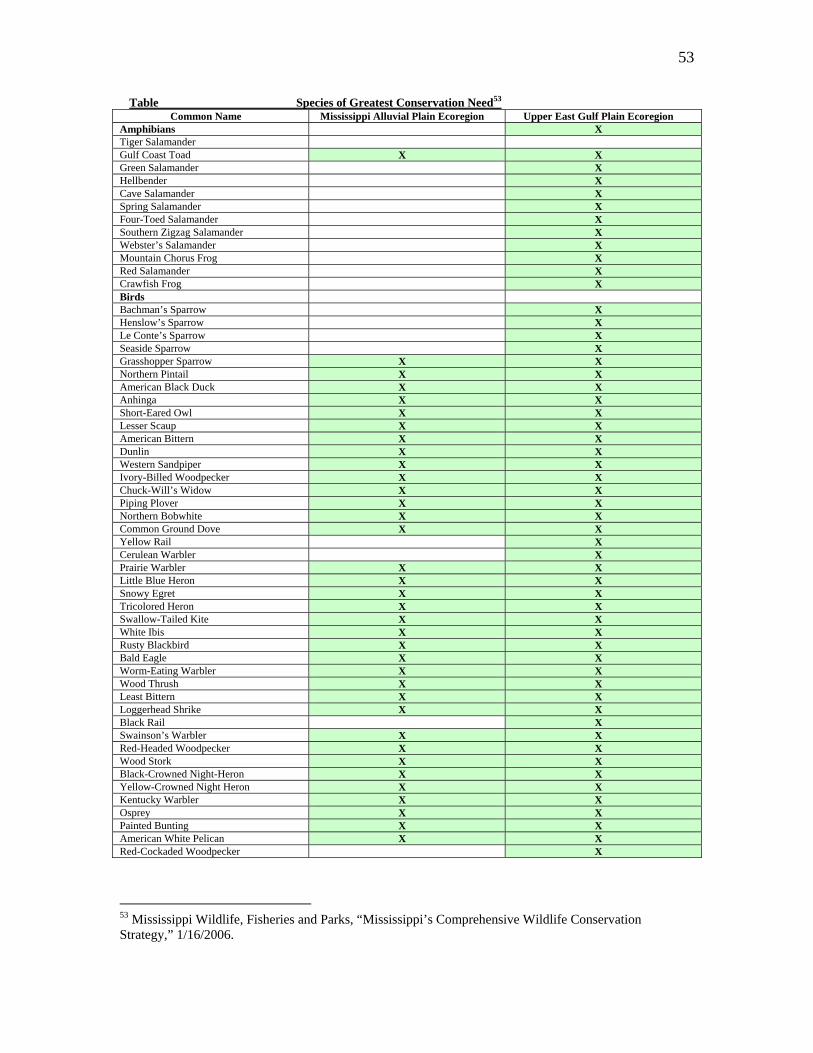
53
Table Species of Greatest Conservation Need53 Common Name Mississippi Alluvial Plain Ecoregion Upper East Gulf Plain Ecoregion
Amphibians X Tiger Salamander Gulf Coast Toad X X Green Salamander X Hellbender X Cave Salamander X Spring Salamander X Four-Toed Salamander X Southern Zigzag Salamander X Webster’s Salamander X Mountain Chorus Frog X Red Salamander X Crawfish Frog X Birds Bachman’s Sparrow X Henslow’s Sparrow X Le Conte’s Sparrow X Seaside Sparrow X Grasshopper Sparrow X X Northern Pintail X X American Black Duck X X Anhinga X X Short-Eared Owl X X Lesser Scaup X X American Bittern X X Dunlin X X Western Sandpiper X X Ivory-Billed Woodpecker X X Chuck-Will’s Widow X X Piping Plover X X Northern Bobwhite X X Common Ground Dove X X Yellow Rail X Cerulean Warbler X Prairie Warbler X X Little Blue Heron X X Snowy Egret X X Tricolored Heron X X Swallow-Tailed Kite X X White Ibis X X Rusty Blackbird X X Bald Eagle X X Worm-Eating Warbler X X Wood Thrush X X Least Bittern X X Loggerhead Shrike X X Black Rail X Swainson’s Warbler X X Red-Headed Woodpecker X X Wood Stork X X Black-Crowned Night-Heron X X Yellow-Crowned Night Heron X X Kentucky Warbler X X Osprey X X Painted Bunting X X American White Pelican X X Red-Cockaded Woodpecker X
53 Mississippi Wildlife, Fisheries and Parks, “Mississippi’s Comprehensive Wildlife Conservation Strategy,” 1/16/2006.
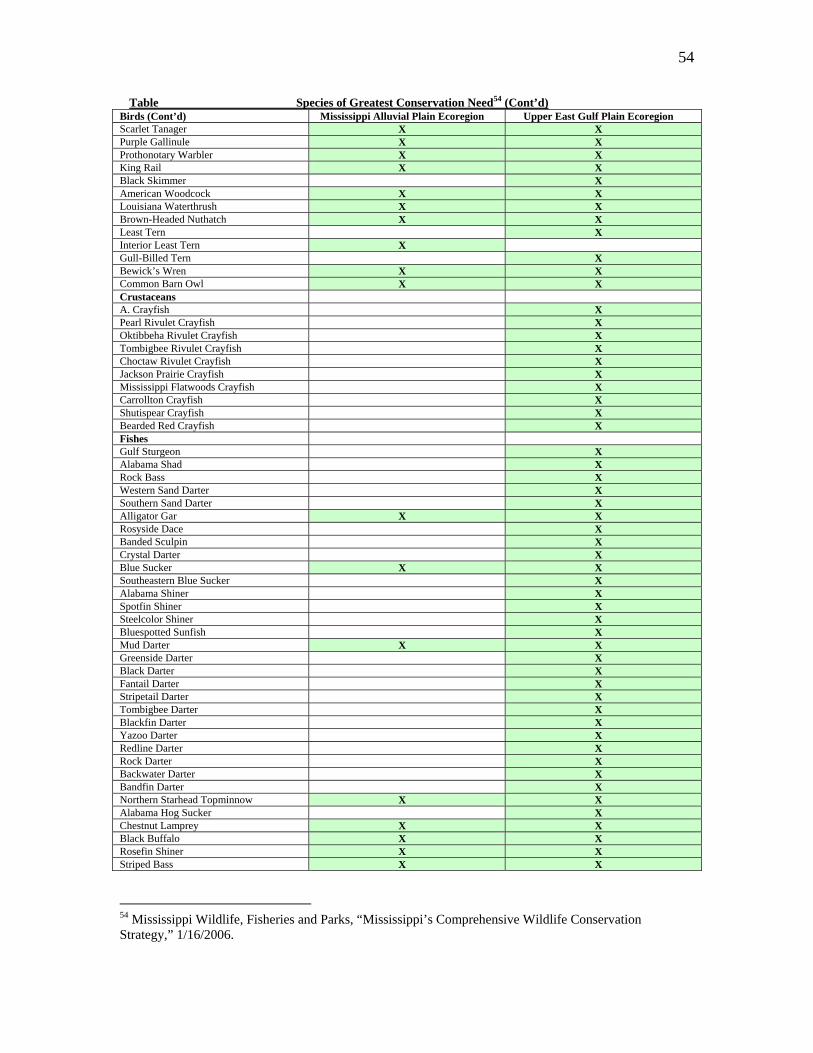
54
Table Species of Greatest Conservation Need54 (Cont’d) Birds (Cont’d) Mississippi Alluvial Plain Ecoregion Upper East Gulf Plain Ecoregion Scarlet Tanager X X Purple Gallinule X X Prothonotary Warbler X X King Rail X X Black Skimmer X American Woodcock X X Louisiana Waterthrush X X Brown-Headed Nuthatch X X Least Tern X Interior Least Tern X Gull-Billed Tern X Bewick’s Wren X X Common Barn Owl X X Crustaceans A. Crayfish X Pearl Rivulet Crayfish X Oktibbeha Rivulet Crayfish X Tombigbee Rivulet Crayfish X Choctaw Rivulet Crayfish X Jackson Prairie Crayfish X Mississippi Flatwoods Crayfish X Carrollton Crayfish X Shutispear Crayfish X Bearded Red Crayfish X Fishes Gulf Sturgeon X Alabama Shad X Rock Bass X Western Sand Darter X Southern Sand Darter X Alligator Gar X X Rosyside Dace X Banded Sculpin X Crystal Darter X Blue Sucker X X Southeastern Blue Sucker X Alabama Shiner X Spotfin Shiner X Steelcolor Shiner X Bluespotted Sunfish X Mud Darter X X Greenside Darter X Black Darter X Fantail Darter X Stripetail Darter X Tombigbee Darter X Blackfin Darter X Yazoo Darter X Redline Darter X Rock Darter X Backwater Darter X Bandfin Darter X Northern Starhead Topminnow X X Alabama Hog Sucker X Chestnut Lamprey X X Black Buffalo X X Rosefin Shiner X X Striped Bass X X
54 Mississippi Wildlife, Fisheries and Parks, “Mississippi’s Comprehensive Wildlife Conservation Strategy,” 1/16/2006.

55
Table Species of Greatest Conservation Need55 (Cont’d) Fishes (Cont’d) Mississippi Alluvial Plain Ecoregion Upper East Gulf Plain Ecoregion Silver Redhorse X River Redhorse X Black Redhorse X Golden Redhorse X Shorthead Redhorse X Pallid Shiner X Bigeye Shiner X Silverside Shiner X Ironcolor Shiner X Fluvial Shiner X Blackmouth Shiner X Rosyface Shiner X Sabine Shiner X Slender Madtom X Stonecat X Frecklebelly Madtom X Piebald Madtom X Pearl Darter X Gilt Darter X Mobile Logperch X Freckled Darter X Slenderhead Darter X Suckermouth Minnow X Southern Redbelly Dace X X Flathead Chub X Paddlefish X X Blacknose Dace X Alabama Sturgeon X Pallid Sturgeon X Sauger X X Southern Walleye X X Walleye X X Mammals Rafinesque’s Big-Eared Bat X X Silver-Haired Bat X Long-Tailed Weasel X Southeastern Myotis X X GrayMyotis X Northern Myotis X Indiana Or Social Myotis X Oldfield Mouse X X Florida Panther X X Eastern Spotted Skunk X Black Bear X Louisiana Black Bear X X Meadow Jumping Mouse X Mussels Mucket X Rock Pocketbook X X Purple Wartyback X Western Fanshell X Butterfly X X Alabama Spike X Delicate Spike X
55 Mississippi Wildlife, Fisheries and Parks, “Mississippi’s Comprehensive Wildlife Conservation Strategy,” 1/16/2006.

56
Table Species of Greatest Conservation Need56 (Cont’d) Mussels (Cont’d) Mississippi Alluvial Plain Ecoregion Upper East Gulf Plain Ecoregion Spike X X Cumberlandian Combshell X Southern Combshell X Snuffbox X Tennessee Pigtoe X Plain Pocketbook X Orange-Nacre Mucket X Fatmucket X Rough Fatmucket X Alabama Heelsplitter X White Heelsplitter X Slabside Pearlymussel X Black Sandshell X Alabama Moccasinshell X Southern Hickorynut X Alabama Hickorynut X Sheepnose X Mississippi Pigtoe X Black Clubshell X Southern Clubshell X Flat Pigtoe X Ovate Clubshell X Pyramid Pigtoe X X Heavy Pigtoe X Pink Heelsplitter X Fat Pocketbook X Inflated Heelsplitter X Kidneyshell X Rabbitsfoot X X Monkeyface X Wartyback X X Ridged Mapleleaf X Stirrupshell X Alabama Creekmussel X Southern Creekmussel X Squawfoot X Deertoe X X Tapered Pondhorn X X Reptiles Western Chicken Turtle X Southern Coal Skink X Rainbow Snake X Gopher Tortoise X
56 Mississippi Wildlife, Fisheries and Parks, “Mississippi’s Comprehensive Wildlife Conservation Strategy,” 1/16/2006.
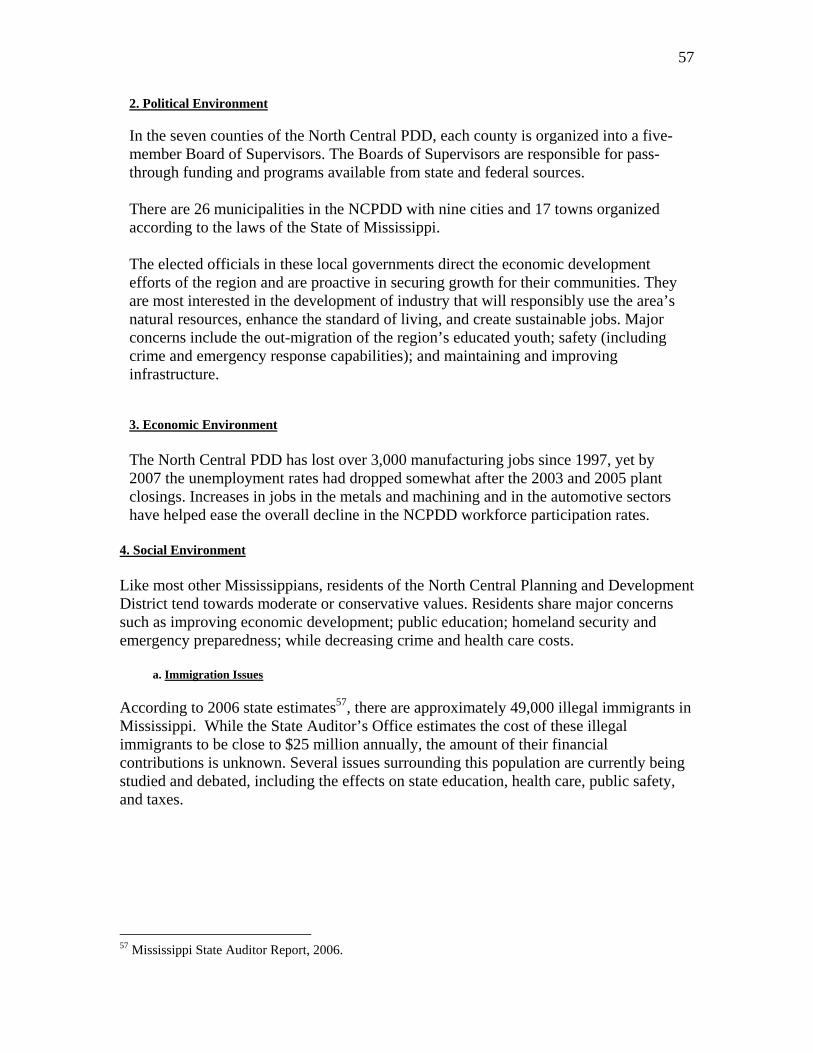
57
2. Political Environment In the seven counties of the North Central PDD, each county is organized into a five-member Board of Supervisors. The Boards of Supervisors are responsible for pass-through funding and programs available from state and federal sources. There are 26 municipalities in the NCPDD with nine cities and 17 towns organized according to the laws of the State of Mississippi. The elected officials in these local governments direct the economic development efforts of the region and are proactive in securing growth for their communities. They are most interested in the development of industry that will responsibly use the area’s natural resources, enhance the standard of living, and create sustainable jobs. Major concerns include the out-migration of the region’s educated youth; safety (including crime and emergency response capabilities); and maintaining and improving infrastructure. 3. Economic Environment The North Central PDD has lost over 3,000 manufacturing jobs since 1997, yet by 2007 the unemployment rates had dropped somewhat after the 2003 and 2005 plant closings. Increases in jobs in the metals and machining and in the automotive sectors have helped ease the overall decline in the NCPDD workforce participation rates.
4. Social Environment Like most other Mississippians, residents of the North Central Planning and Development District tend towards moderate or conservative values. Residents share major concerns such as improving economic development; public education; homeland security and emergency preparedness; while decreasing crime and health care costs. a. Immigration Issues According to 2006 state estimates57, there are approximately 49,000 illegal immigrants in Mississippi. While the State Auditor’s Office estimates the cost of these illegal immigrants to be close to $25 million annually, the amount of their financial contributions is unknown. Several issues surrounding this population are currently being studied and debated, including the effects on state education, health care, public safety, and taxes.
57 Mississippi State Auditor Report, 2006.

58
IV. GOALS AND OBJECTIVES
The objective of regional economic development planning in the North Central Planning and Development District is to improve the growth possibilities of the regional economy. This can be accomplished by improving the region’s competitive edge to export products, or by enhancing the prospects and conditions for intraregional trade. The District’s quality of life and the region’s appeal to employers and residents are at stake. This comprehensive approach must involve housing, childcare, public policy, and resource availability, among other issues, and must be balanced to achieve an economic environment which nurtures sustainable business and supports community values. There are three general ways local government may influence economic development. They are:
1. Infrastructure development (water, sewer, transportation, communications) 2. Development and support of public and private institutions such as regional
planning districts and economic development agencies; and 3. Creation of public sector policies related to land use, taxation, education, and
other topics.

59
There are five basic economic development strategies that are universal. They include:
1. Keeping dollars inside the community or region by supporting the intraregional exchange of goods and services;
2. Supporting existing employers by helping them thrive and expand in the community;
3. Encourage new employment opportunities and entrepreneurship within the region; 4. Recruit outside industries which are consistent with community-wide economic
development goals and increase the median income; and 5. Local and regional planning.
In order to achieve the development strategies stated above, the CEDS Committee will develop projects with specific goals and objectives keeping in mind the region’s assets and constraints. The projects will be presented in priority order.

60
Suggested Goals and Objectives
Protect the District’s environmental and social quality by balancing development with preservation.
OBJECTIVES
1. Support existing agricultural and forest management. 2. Study existing public programs to preserve open space. 3. Develop regional planning for areas of future development. . 4. Examine local taxing policies as they relate to impacting growth in rural
communities. 5. Explore environmentally sound ways to dispose of solid waste. 6. Develop and preserve recreation opportunities including trails,
opportunities for youth, and expansion of tourism. 7. Support strong cultural and social base. 8. Develop and nurture community spirit. 9. Support arts and cultural activities as a critical element of the regional
economy.
Market the seven counties in the North Central PDD as a whole. OBJECTIVES
1. Market North Central PDD’s access to major transportation routes. 2. Identify District’s qualities that are attractive to others and develop
creative vision as marketing tool (i.e. strong schools). 3. Obtain planning grant to market and promote District region. 4. Investigate tourism opportunities. 5. Develop strong image of innovation, conservation, and preservation as
part of marketing theme.
Direct development toward locally designated town and city centers and industrial parks in order to support existing businesses, attract new businesses to the region, and stimulate downtown revitalization and development.
OBJECTIVES
1. Define growth center and gain consensus within District about growth centers.
2. Support the Main Street programs, as well as industrial and commercial parks in accord with local and regional plans.
3. Give priority for water, sewer, and transportation improvements within growth centers.

61
Encourage, support, and strengthen the development of a balanced, diverse, and healthy economy.
1. Study the linkages among industries. 2. Develop a plan to better understand markets for existing businesses. 3. Support business and industry that increases regional income, enhances
regional income multiplication, and improves the comparative advantage of the region’s export products (support key industries).
4. Study the pressures causing the loss of manufacturing jobs and seek to provide a “level playing field” for manufacturing industries.
5. Support worker and employer transitions as regional economy adjusts. 6. Attract and support industries that use existing workforce skills. 7. Concentrate resources on entrepreneurship in emerging industries. 8. Support increased technology transfer in the District. 9. Enhance tourism, particularly eco-tourism. 10. Support technology incubators. 11. Maintain agriculture and forestry as important components of District
economy. 12. Investigate value-added uses for underused agricultural and wood
products. 13. Support cultural and educational industries. 14. Incorporate disaster resiliency principles into economic development
efforts.
Fully maximize use of existing systems and buildings to the greatest extent practical.
1. Maintain and expand knowledge about existing industrial and commercial
sites, including the identification of empty buildings and their availability. 2. Facilitate movement of people and goods through enhancement of existing
road systems. 3. Support existing public transportation providers. 4. Better market existing telecommunications capacity. 5. Support redevelopment of District’s downtowns. 6. Plan for flexible business space to be located near transportation corridors. 7. Support growing elderly population.
Support and maintain the existing business base.
1. Assist in the identification of new markets and technologies for mature industries.
2. Support agriculture and forestry as important elements of the region’s quality of life and working landscape.
3. Help businesses maximize export opportunities. 4. Support innovation. 5. Enhance and expand access to affordable capital. 6. Recruit and retain business in key industry (export-oriented) sectors.
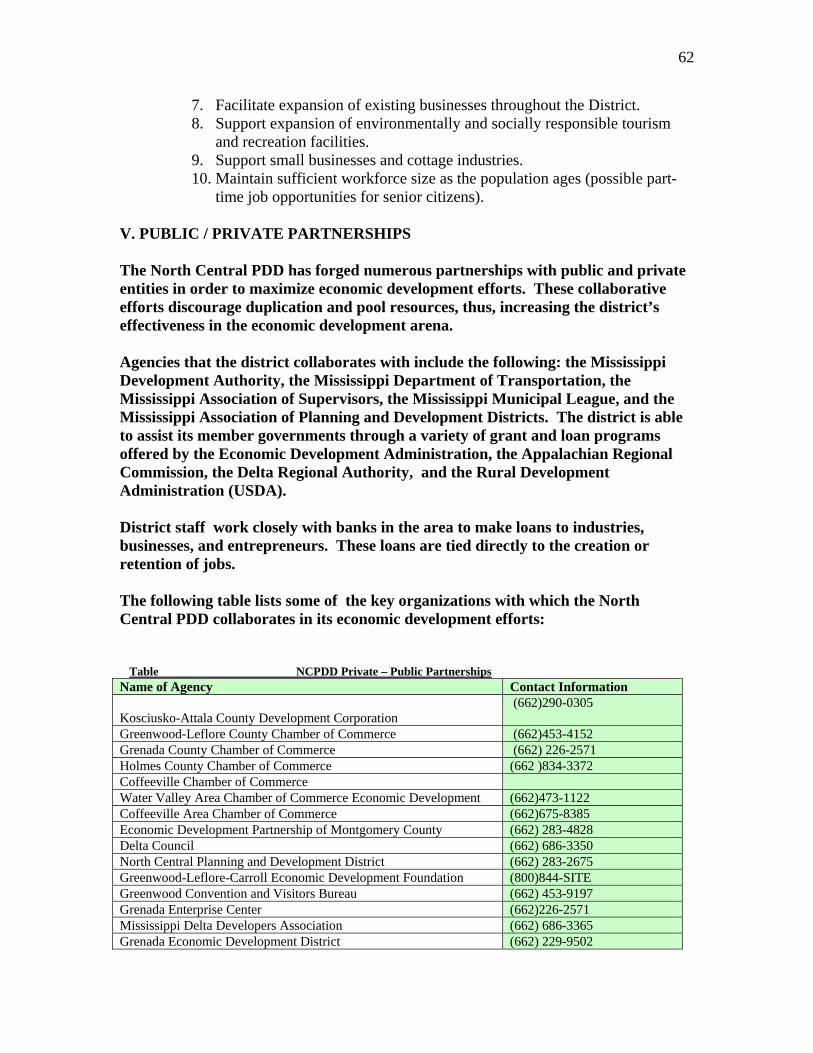
62
7. Facilitate expansion of existing businesses throughout the District. 8. Support expansion of environmentally and socially responsible tourism
and recreation facilities. 9. Support small businesses and cottage industries. 10. Maintain sufficient workforce size as the population ages (possible part-
time job opportunities for senior citizens). V. PUBLIC / PRIVATE PARTNERSHIPS The North Central PDD has forged numerous partnerships with public and private entities in order to maximize economic development efforts. These collaborative efforts discourage duplication and pool resources, thus, increasing the district’s effectiveness in the economic development arena. Agencies that the district collaborates with include the following: the Mississippi Development Authority, the Mississippi Department of Transportation, the Mississippi Association of Supervisors, the Mississippi Municipal League, and the Mississippi Association of Planning and Development Districts. The district is able to assist its member governments through a variety of grant and loan programs offered by the Economic Development Administration, the Appalachian Regional Commission, the Delta Regional Authority, and the Rural Development Administration (USDA). District staff work closely with banks in the area to make loans to industries, businesses, and entrepreneurs. These loans are tied directly to the creation or retention of jobs. The following table lists some of the key organizations with which the North Central PDD collaborates in its economic development efforts:
Table NCPDD Private – Public Partnerships Name of Agency Contact Information Kosciusko-Attala County Development Corporation
(662)290-0305
Greenwood-Leflore County Chamber of Commerce (662)453-4152 Grenada County Chamber of Commerce (662) 226-2571 Holmes County Chamber of Commerce (662 )834-3372 Coffeeville Chamber of Commerce Water Valley Area Chamber of Commerce Economic Development (662)473-1122 Coffeeville Area Chamber of Commerce (662)675-8385 Economic Development Partnership of Montgomery County (662) 283-4828 Delta Council (662) 686-3350 North Central Planning and Development District (662) 283-2675 Greenwood-Leflore-Carroll Economic Development Foundation (800)844-SITE Greenwood Convention and Visitors Bureau (662) 453-9197 Grenada Enterprise Center (662)226-2571 Mississippi Delta Developers Association (662) 686-3365 Grenada Economic Development District (662) 229-9502

63
VI. STRATEGIC PROJECTS, PROGRAMS AND ACTIVITIES A. SUGGESTED PROJECTS LIST
Table Suggested Projects NCPDD Project Strategic Findings Addressed Outcome Regional Health Care Facilities Support and expand existing facilities or build new facility centrally located in District.
Aging population, inadequate health care facilities
Improved health care
Regional Airport Development
Lack of adequate transportation infrastructure
Improved regional transportation infrastructure
Grenada Railroad Keep railroad healthy in District
Lack of adequate transportation infrastructure
Improved regional transportation infrastructure
B. VITAL PROJECTS LIST
Table Vital Projects NCPDD Project Strategic
Findings Addressed
Location Estimated Costs
Funding Sources
Potential Job
Creation
Outcome
Development of Holmes County Industrial Park
Lack of adequate infrastructure to support certain industrial needs
Holmes County
$5.2 M
EDA, State, County
3,200
Improved infrastructure to support industry in industrial park
Resources for alternative fuel
Develop market for renewable resources; address high fuel / transportation costs
Centrally located in District – Montgomery or Carroll County
$6.3 M
EDA, State, Local, Private, U.S. D.O.E.
150
Market for renewable resource, lower fuel / transportation costs
Development of Grenada County Industrial Park
Lack of adequate infrastructure to support certain industrial needs
Grenada County
$4 M
EDA, State, Local
2,500
Improved infrastructure to support industry
Renovation of vacant industrial building for workforce
Need for job training/promotion of entrepreneurship
Attala County
$5 M EDA, County, State, College
150 - 200 Improved infrastructure to support workforce training

64
training center
Renovation of C&G Railroad
Lack of adequate infrastructure to support certain industrial needs
Carroll, Montgomery, and Leflore counties
$100 M EDA, USDOT, State
5000 Improved infrastructure for economic development
Purchase and repair of Grenada Railway
Lack of adequate infrastructure to support certain industrial needs
Yalobusha, Grenada, Carroll, Montgomery, & Holmes counties
$25 M EDA, USDOT, State
300 Improved infrastructure for economic development
Airport improvements
Lack of adequate infrastructure to support certain industrial needs
Districtwide $1 M EDA,DRA,ARC, FAA, HUD, State
100 Improved infrastructure for economic development
Master plans for retail revitalization
Need for downtown improvements
Districtwide $50,000/each EDA, State, ARC, DRA, Main Street
NA Improved retail buildings & landscaping
Provision of natural gas for industry
Lack of adequate infrastructure to support certain industrial needs
Districtwide $10 M EDA, DRA, ARC, HUD, State
200 Improved infrastructure for economic development
Reuse of vacant buildings
Lack of adequate infrastructure to support certain industrial needs
Districtwide $10 M EDA, State, Local
1,000 Improved infrastructure for economic development
Broadband expansion
Lack of adequate infrastructure to support certain industrial needs
Districtwide $5 M EDA, DRA, ARC, State
100 Improved infrastructure for economic development
Health care improvements
Lack of adequate health care
Districtwide $15 M EDA, DRA, ARC, State, Local
300 Improved health care
Training for entrepreneurs
Need for promotion of entrepreneurship
Districtwide $100,000 EDA, DRA, ARC
100
Promotion of entrepreneurs
VII. ACTION PLAN
Goal /Objectives
Task Lead Agency Timeline
1 Protect District’s environmental and social quality by balancing development with preservation.
NCPDD Board of Directors, county officials, city officials
Ongoing
2 Market the seven counties in the NCPDD as a whole
NCPDD Board of Directors
Ongoing
3 Direct development toward locally designated town and city centers, and industrial parks, in order to support existing businesses, attract new businesses to the region, and stimulate downtown revitalization and development
Boards of Supervisors, city officials, NCPDD Board of Directors
Ongoing
4 Encourage, support and strengthen the development of a balanced and diverse economy.
NCPDD Board of Directors
Ongoing

65
5 Fully maximize the use of existing systems and buildings to the greatest extent practical.
Boards of Supervisors & city councils
Ongoing
6 Support and maintain the existing business base Boards of Supervisors, City Councils, Boards of Aldermen, Chambers of Commerce
Ongoing
7 Encourage expansion of small manufacturing businesses
Boards of Supervisors, City Councils, Economic Developers, NCPDD Board of Directors
Ongoing
8 Incorporate disaster resiliency principles into economic development strategies
NCPDD Board of Directors, Economic Developers, Boards of Supervisors, City Councils, Boards of Aldermen
Ongoing
66
VIII. PERFORMANCE MEASURES A. Method of Reviewing, Monitoring and Evaluating Performance To ensure that the North Central Planning and Development District Comprehensive Economic Development Plan remains an active and relevant document, the CEDS Committee developed a method and schedule to review, monitor and evaluate the Plan bi-annually. 1. Method and Schedule of Planning Cycle The North Central Planning and Development District will be responsible for contacting CEDS Committee members and organizing a biannual meeting. The committee members will be responsible for monitoring and evaluating the progress of the mitigation strategies in the plan. In preparation for the biannual review, the North Central Planning and Development District will advertise the meeting date and time, encouraging public participation. CEDS Committee members will be contacted. In addition, the following organizations will be invited to participate in the biannual review:
Kosciusko-Attala County Development Corporation Greenwood-Leflore County Chamber of Commerce Grenada County Chamber of Commerce Holmes County Chamber of Commerce Coffeeville Chamber of Commerce Grenada Economic Development District Water Valley Area Chamber of Commerce Economic Development Coffeeville Area Chamber of Commerce Economic Development Partnership of Montgomery County Delta Council Greenwood-Leflore-Carroll Economic Development Foundation Greenwood Convention and Visitors Bureau Grenada Enterprise Center Mississippi Delta Developers Association North Mississippi Industrial Development Association
The CEDS Committee, with input from the public and others, will review each goal and objective to determine their relevance to changing situations in the region, as well as changes in local, State or Federal policy, and to ensure they are addressing current and expected conditions. The parties responsible for the various implementation actions will report on the status of their projects and will include which implementation processes worked well, any difficulties encountered, how coordination efforts were proceeding, and which strategies should be revised. The CEDS Committee members will use the Evaluation Form to begin the evaluation process. The form will be completed and submitted to the North Central Planning and Development District.

67
North Central Planning and Development District Comprehensive Economic Development Plan
Evaluation and Monitoring Part 1: Regional Development Projects
Comments and Recommendations:
Research Planning Funding Environmental Construction Infrastructure Improvements at Holmes County Industrial Park
X
X X X X
Alternative Fuel Development X X Development of Grenada County Industrial Park
X X
Renovation of Vacant Industrial Building for Workforce Training Center
X X X
Renovation of C&G Railroad X X Purchase & Repair of Grenada Railway
X X
Airport Improvements X X Master Plans for Retail Revitalization
X X
Provision of Natural Gas for Industry
X X
Reuse of Vacant Buildings X X Broadband Expansion X X Health Care Improvements X X Training for Entrepreneurs X X X NA NA

68
North Central Planning and Development District Comprehensive Economic Development Plan
Evaluation and Monitoring Part 2: Conclusions and Recommendations
This is a monitoring tool to analyze the progress the North Central Planning and Development District have made in implementing CEDS strategies. This evaluation will be completed by each CEDS member and will be sent to each local government for use and consideration in their biannual review of CEDS objectives and goals. This evaluation was conducted by _____________________________________ Date ______________________
Summary of Findings:
Recommendations

69
List of Tables
1 North Central PDD Board of Directors 2 Attala County Demographics 3 Town of Ethel Demographics 4 City of Kosciusko Demographics 5 Town of McCool Demographics 6 Town of Sallis Demographics 7 Carroll County Demographics 8 Town of Carrollton Demographics 9 Town of North Carrollton Demographics 10 Town of Vaiden Demographics 11 Grenada County Demographics 12 City of Grenada Demographics 13 Holmes County Demographics 14 Town of Cruger Demographics 15 City of Durant Demographics 16 Town of Goodman Demographics 17 City of Lexington Demographics 18 Town of Pickens Demographics 19 City of Tchula Demographics 20 Town of West Demographics 21 Leflore County Demographics 22 City of Greenwood Demographics 23 City of Itta Bena Demographics 24 Town of Morgan City Demographics 25 Town of Schlater Demographics 26 Town of Sidon Demographics 27 Montgomery County Demographics 28 City of Winona Demographics 29 Town of Duck Hill Demographics 30 Town of Kilmichael Demographics 31 Yalobusha County Demographics 32 City of Water Valley Demographics 33 Town of Coffeeville Demographics 34 Town of Oakland Demographics 35 CEDS Committee 2012 - 2013 36 Population Trends 1970-2010 37 Population Estimates 2006-2010 38 Displaced Coastal Resident Populations 39 Comparative Age of District Population

70
40 Median Age 41 Educational Attainment (% of Population 25 and Years Older) 42 Estimated Drop-Out Rates for NCPDD Public Schools 43 Colleges in NCPDD 44 Unemployment Rates for North Central PDD 45 Unemployment Rates for North Central PDD By County 46 Number of People Unemployed by County 47 Manufacturing Sector – Comparison 1997 and 2002 Economic Census and 2007 MDA Data 48 Median Household Income 2000-2010 49 Poverty Factors in NCPDD 50 Race and Poverty in NCPDD –2010 Census 51 Participation Rates 2000 52 Participation Rates 2006 53 Wages by Occupation in North Central PDD 54 NCPDD Employment Totals By Occupation 55 Catfish Industry NCPDD 56 2006 Harvested Timber Volumes by Product in Thousand Board Feet 57 Manufacturing Facilities / Employment 58 2000 Work Flow Data (Worker County of Residence) 59 Per Capita Income 2000-2010 60 Wages and Earnings Versus Transfer Payments 61 Water Systems in North Central PDD 62 Sewer Systems 63 NCPDD Industrial Parks 64 Public Road Length in Miles By County – 2006 65 County Bridges Needing Critical Maintenance 66 Electrical Suppliers - NCPDD 67 City and County General Fund Reserves 68 General Obligation Debt Outstanding 69 Revenue Bond Debt 70 Millage Rates 71 District Land Mass / Watersheds 72 District Ecoregions 73 Species of Greatest Conservation Need 74 Repetitive Flood Loss Properties 1980-2012 75 Hazard Events 76 NCPDD Private/Public Partnerships 77 Suggested Projects NCPDD 78 Vital Projects NCPDD