cell-cycle analysis using the bd facsarray™ … for staining dna with propidium iodide for...
TRANSCRIPT

BD FACSArray™ Bioanalyzer
Cell-Cycle Analysis Using the BD FACSArray™ Bioanalyzer
IntroductionSomatic cells proliferate to support tissue and organismalgrowth and to replace damaged cells. In the case of adaptiveimmunity, T and B lymphocytes divide and differentiate inresponse to foreign antigenic stimulation, known as clonalexpansion and differentiation. This hallmark responseensures that sufficient numbers of antigen-specific effectorand memory lymphocytes arise to successfully deal with theoffending antigen (eg, pathogenic microbes, viruses). For thisreason, flow cytometric analysis of lymphocyte activationand proliferation (cell-cycle entry and progression) anddifferentiation is featured in many immune function studies.The BD FACSArray™ bioanalyzer is designed to performanalysis of cellular samples that are stained with combinationsof up to four different fluorescent dyes or antibodies specificfor various cellular markers. This application note gives a
concise method of staining cellular DNA with propidiumiodide and phosphorylated histones for a detailed cell-cycleanalysis using the BD FACSArray bioanalyzer.
A P P L I C A T I O N N O T E
This Application Note describes a method for using the BD FACSArray™ bioanalyzer to analyze cells stained for cell-cycleanalysis using propidium iodide and an additional intranuclear stain for multiparameter analysis.

The cell-cycle (aka, cell division cycle) consists of a series ofprocesses involved in the growth, replication, and division ofcells. The cell-cycle can be divided into two major stages,interphase (a phase between mitotic events) and mitosis. Thereare three distinct, successive stages within interphase, called G1,S, and G2 phases. During G1 (first gap), cells monitor theirenvironment and grow (synthesize RNA and proteins). Ifconditions are right, cells commit to DNA synthesis (S phase)and replicate their chromosomal DNA. A G2 phase (secondgap) follows in which cells continue to grow and prepare formitosis (division). The G2 gap allows time for the cell tocomplete its DNA replication before initiating mitosis. Inmitosis, there are four successive phases:
• prophase–marked by chromosomal condensation,dissolution of the nuclear membrane and spindleformation
• metaphase–chromosomal alignment along the metaphase plate
• anaphase–separation of chromosome pairs into oppositepoles of the cell
• telophase–creation of two nuclei, accompanied bycytoplasmic division (cytokinesis) giving rise to twodaughter cells.
Upon completion of the process, each daughter cell contains thesame genetic material as the original cell and roughly half of itsG2 level of cytoplasm.
In addition to these specific stages, the G0 phase has beendescribed for cells that exit from the cell-cycle and enter aquiescent, nondividing state. In response to external stimuli,some cells may undergo reactivation and express early responsegenes. These cells can leave G0 and enter the G1 phase of thecell-cycle (G0–G1 transition) that is marked by cell growth (ie,blast transformation due to measurable increases in RNA andprotein synthesis). Another consequence of cellular activationmay be the induction of programmed cell death (apoptosis).Together, through the counterbalancing processes of cellproliferation and apoptosis, and the establishment of quiescentor nondividing states, appropriate numbers and various typesof somatic cells (including cells of the immune system) aredynamically maintained (homeostasis) throughout the body’slife cycle.
Figure 1. Flow Cytometric Analysis of Cellular DNA Content
Using fluorescent nucleic acid dyes, such as propidium iodode,it is possible to identify the proportions of cells that are in oneof the three interphase stages of the cell-cycle by using flowcytometry to measure their relative DNA content (Figure 1).Cells that are in the G0/G1 phase (before DNA synthesis) havea defined amount (1×) of DNA (ie, a diploid chromosomalDNA content). During S phase (DNA synthesis), cells containbetween 1× and 2× DNA levels. Within the G2 or M phases(G2/M), cells have a 2× amount of DNA (ie, a tetraploidchromosomal DNA content).
Immunofluorescent staining of phosphorylated histones may be used with propidium iodide staining and flow cytometricanalysis to further resolve cells within the G2 or M phases.Cells that express phosphorylated Histone 3 at serine-28 are inthe M phase. Phosphorylated Histone 3 can thus be used as acell-cycle marker for screening for affects to the M phase of thecell-cycle pathway. This experiment will utilize Anti Histone H3(pSer28)-Alexa Fluor® 647 as the Phospho Histone 3 antibodyto investigate the affects of a specific compound upon the Mphase. The ability to simultaneously and rapidly analyzesamples for their cell-cycle status and intracellular signalingmarkers makes this assay ideal for high content screening.
This application note describes a method for staining andanalyzing cells for cell-cycle analysis using the BD FACSArraybioanalyzer. This procedure includes optional steps for how toperform further research of intracellular, intranuclear, or cell-surface proteins along with cell-cycle analysis. Before you beginthis procedure, review the entire Methods and Protocols sectionto familiarize yourself with the steps involved. Review the BD FACSArray™ Bioanalyzer User’s Guide, especially Chapter7, for a detailed explanation of how to set up the instrumentfor cellular applications.
Fluorochromes to Use with the BD FACSArray™
BioanalyzerThe BD FACSArray™ bioanalyzer has a green laser at 532 nmwavelength and a red laser at 635 nm wavelength. Fluorescentemissions from fluorescent dyes or fluorochromes excited bythe green laser are detected with the Yellow and the Far Reddetectors, while fluorescent emissions excited by the red laserare detected by the Red and NIR detectors.
Fluorochromes that can be used with ethanol-fixed cellsstained with propidium iodide (PI)
FLUORESCENT PARAMETER FLUOROCHROME OR DYE LASER
Yellow Propidium Iodide Green
Far Red Propidium Iodide Green
Red APC or RedAlexa Fluor® 647
NIR - Red
Propidium Iodide
Propidium iodide (PI) is the most widely used fluorescent dyefor staining DNA in whole cells (or isolated nuclei). PIintercalates into the DNA helix of fixed and permeabilizedcells. Because PI can stain both double-stranded RNA and DNA,cells must be treated with RNase to ensure that PI staining isDNA specific. PI does not cross the plasma membrane of viablecells. However, it can readily enter dead cells (or cells in latestages of apoptosis) that have damaged plasma membranes andcan stain their cellular DNA.
G0/G1
S G2/M
2 www.bdbiosciences.comUnless otherwise specified, all products are for Research Use Only. Not for use in diagnostic or therapeutic procedures. Not for resale.
All applications are either tested in-house or reported in the literature. See Technical Data Sheets for details.

MaterialsREAGENT CAT. NO
BD Pharmingen Stain Buffer (FBS) 554656
96-well U bottom plate BD Falcon 353910
RNase Sigma R-5500
Propidium Iodide Sigma P-4170
ModFit LT™ Software for PC *349329
Anti Histone H3 (pSer28)-Alexa Fluor® 647 inquire
Nocodazole Sigma M-1404
*BD Biosciences Immunocytometry Systems
Methods and ProtocolsProtocol for Staining DNA with Propidium Iodide for Cell-Cycle Analysis Using the BD FACSArray™ bioanalyzer.
The protocol in this application note includes optional steps onhow to perform intracellular, intranuclear, or cell-surfacestaining for further cell-cycle and cellular analysis. Please reviewthe outline for the appropriate steps for your experiment.
Outline of Sample Preparation Steps
Cell-Cycle Experiment
1. Perform cell surface staining (optional)
2. Fix cells
3. Perform intracellular or intranuclear surface staining(optional)
4. RNase treatment
5. PI stain
6. Acquire and analyze cells on the BD FACSArraybioanalyzer
Depending on the experiment that will be run on the BD FACSArraybioanalyzer, the cells will have to be prepared in a specific patternin the 96-well plate. The following example will demonstrate amethod for performing a two-color experiment, using PI andAlexa Fluor® 647. With this two-color experiment, specificsetup wells need to be prepared to set up and optimize theinstrument. If cell-cycle alone is being run, there is only onecolor being detected and thus no set-up wells are necessary.
The cell-cycle analysis experiment described here used DNA stained with PI for a general cell-cycle analysis and AntiHistone H3 (pSer28)-Alexa Fluor® 647 to distinguish M phasecells in the cell-cycle. For demonstration purposes cells werearrested with 1 µg/mL of Nocodazole for 4 hours prior toharvesting to allow for cells to be arrested in the M phase.
Sample PreparationPrepare the 96-well sample plate as follows:
• Well A1: unstained control sample
• Well A2: PI stained control sample
• Well A3: Alexa Fluor® 647 only control sample
• Well A4: PI and APC or Alexa Fluor® 647 stained cellstogether for the complete cell-cycle analysis
TIP: Additional samples used in the setup wells may be needed forthe first time this assay is performed. Prepare additionalvolumes according to your needs.
Cell-Surface Staining (Optional)Cells may be stained for surface antigens prior to fixation withethanol (EtOH). Because PI emits fluorescence in both theYellow and Far Red channels upon excitation, antibodiesconjugated with the fluorochromes phycoerythrin (PE) or PE-cyanine dye Cy7 (PE-Cy7) should not be used. Fluorescentantibodies conjugated to allophycocyanin (APC) or AlexaFluor® 647 are the recommended conjugates for two-colorstaining with PI when using EtOH-fixed cells.
Note: APC-Cy-7 conjugates are not recommendedfor use with EtOH-fixed cells. Cells may bestained prior to EtOH fixation by adding anappropriate concentration of APC- or AlexaFluor® 647 conjugated antibody to the cells.Each researcher should determine if theexperimental antibody will work withEtOH-fixed cells. EtOH can destroy certainfluorochromes and antigenic epitopes oncells.
Note: If the antibody has been shown to stainEtOH -fixed cells, then staining may be donepost EtOH fixation.
1. Incubate the cells for 15 – 30 minutes on ice at 0 – 4°C then wash using BD Pharmingen™ staining buffer (BD Pharmingen™ Stain Buffer (FBS) or 1× Dulbecco’s PBS, 3% FCS, 0.09% NaN3, pH 7.4).
2. For cells that must be stained prior to EtOH fixation, stainthe cells according to the manufacturer’s protocol.
3. Wash cells in staining buffer before proceeding to thefixation step.
Fixation of CellsCells are fixed using ice-cold 70% EtOH. Cells may be fixed in bulk then transferred to a 96-well U bottom plate or the cells may be fixed in the plate directly. Both procedures aredescribed below.
A. Bulk Cell Fixation
1. Wash cells twice with 1× PBS to remove any residualmedia or buffers that contain FBS or BSA. It is importantso as to avoid aggregates, which can clog the instrumentduring analysis. Add 100 µL of 1× PBS per 1 × 10⁷ cellsand resuspend the cells by vigorous vortexing.
2. Add 5 mL of ice-cold 70% EtOH by dropper while slowlymixing or vortexing. Additional EtOH may be added toadjust cell concentration to 2 × 10⁶ cells/mL. This volumemay be added without vortexing.
3. Incubate the cells with EtOH for at least 1 hour at orbelow 4°C. Cells may be incubated overnight and are stable at –20°C for weeks.
4. Prior to staining, resuspend cell pellets and check foraggregates prior to transferring to the 96-well U bottom plate.
• If any aggregates are present, filter the cell suspensionthrough a 60 µm pore nylon mesh.
5. Transfer the sample to a 96-well U-bottom plate at ≤ 5 × 10⁵ cells per well.
3www.bdbiosciences.comUnless otherwise specified, all products are for Research Use Only. Not for use in diagnostic or therapeutic procedures. Not for resale.All applications are either tested in-house or reported in the literature. See Technical Data Sheets for details.

B. Cell Fixation in Plates with U Bottom Wells
1. Add ≤ 5 × 10⁵ cells per well.
2. Wash the cells twice with 100 µL 1× PBS to remove anyresidual FCS or BSA.
3. Fix cells by adding 10 µL of 1× PBS to each well followedby 100 µL of 70% ice-cold EtOH.
4. Incubate cells for at least 1 hour at or below 4°C.
5. Wash the cells twice with 100 µL 1× PBS. Pellet the cellsby centrifugation at 300 × g for 5 minutes.
Intracellular, Intranuclear, or Surface MarkerStaining (Optional)
1. If they are to be stained for intranuclear markers such asPhospho Histone, treat EtOH-fixed cells with 0.1%Tween-20 in 1× PBS for 20 minutes at room temperature.
2. Wash cells in staining buffer, then stain with the appropriateconcentration of antibody for 20 minutes at roomtemperature.
3. Wash cells in staining buffer.
4. Pellet the cells by centrifugation at 300 × g for 5 minutes,then aspirate supernatants from the wells.
5. If a secondary staining step is needed, stain the cells withthe appropriate amount of secondary step antibodyaccording to the manufacturer’s protocol.
6. Wash the cells in staining buffer, and aspirate thesupernatant from the wells.
7. Do not resuspend the cells. Proceed directly to the RNasetreatment.
RNase TreatmentPropidium iodide (PI) is not a DNA-specific dye. PI stains allnucleic acids including RNA. Therefore, treatment with RNaseis necessary to ensure specific staining of DNA by PI.
1. Add 50 – 100 µg of a working concentration of RNase in 1× PBS to each well. A working concentration of RNasecan be made by diluting the stock of 1 µg/µL in 1× PBSand stored at –80°C.
2. Incubate at 37°C for 30 minutes.
3. Wash the cells in staining buffer and aspirate thesupernatant from the wells.
4. Resuspend wells A1 and A3 in 200 µL staining buffer. Donot resuspend the cells in wells A2 or A4, but proceeddirectly to the DNA staining step.
Staining for DNAThe protocol below specifies volumes needed for staining twowells with PI. Adjust the volumes according to the number ofwells in your experiment.
PI stock is diluted to 1 mg/mL in H2O and stored at 4°C in thedark.
1. Dilute 15 µL of PI stock (1 mg/mL) in 585 µL of stainingbuffer.
2. Add 200 µL of diluted PI solution at 5 µg/sample to eachof the following wells:
• A2: PI setup well
• A4: Investigation well
Cell-Cycle Analysis with the BD FACSArray™
BioanalyzerThe BD FACSArray™ bioanalyzer aspirates cell samples from a 96-well plate during flow cytometric analysis; the maximumsample volume that can be aspirated at one time is limited toapproximately 100 µL per well. Additional volume should beadded to the wells to allow for instrument setup.
It is important to prepare the cell samples according to theabove procedure so that the wells are correctly laid out in theplate for easy acquisition by the BD FACSArray bioanalyzer.
Before setting up the controls and instrument optimization forspillover (compensation), create a new experiment through theExperiment Wizard.
4 www.bdbiosciences.comUnless otherwise specified, all products are for Research Use Only. Not for use in diagnostic or therapeutic procedures. Not for resale.
All applications are either tested in-house or reported in the literature. See Technical Data Sheets for details.

Creating an Experiment using theWizard
The Experiment Wizard allows you tocreate an experiment by answering aseries of questions. Each wizard sessioncan be saved and re-opened for a similarexperimental setup at a later time. Thefollowing information is saved in eachExperiment Wizard session:
• sample and well information
• template used
• fluorophore labels
• custom keywords (if any selected)
1. Click the Experiment Wizard tool
( ) in the application toolbar(Figure 1). The Experiment WizardWelcome dialog appears. The viewremains for approximately 2 secondsand then automatically advances tothe next view (Figure 2).
2. Choose the Default Wizard sessionwhen creating an experiment sessionfor the first time; click Next.
• The Template view appears(Figure 3).
Choosing a Template
The Template view in the wizard session allows you to choose one of the predefined templates provided forcellular applications. The templatescontain default loader and instrumentsettings that serve as a starting point forsample setup and optimization for animmunophenotyping application. Eachpredefined template contains a specificnumber of plots for acquisition andanalysis of data.
1. Choose the 2 Color template fromthe Template drop-down menu;click Next.
• The Instrument Setup and OpticalSpillover view appears (Figure 4).
5www.bdbiosciences.comUnless otherwise specified, all products are for Research Use Only. Not for use in diagnostic or therapeutic procedures. Not for resale.All applications are either tested in-house or reported in the literature. See Technical Data Sheets for details.
Experiment Wizard
Figure 1. Experiment Wizard
Figure 2
Figure 3

Entering Sample Information
For cellular experiments, you must addsetup wells if you want the software toautomatically calculate optical spillover.A setup well will be added for eachcolor of this experiment.
The names used within this experimentare examples. Customize the names foryour own particular experiment.
1. Click the Yes radio button to enablethe color selection checkboxes.
2. Click in each checkbox for thecolors to be used.
Note: Click Yellow for PI and Red forPhospho Histone-Alexa Fluor® 647
Note: When you choose to add setup wellsto your experiment, an unstained wellis also added. The unstained well isrun before the other setup wells. Forthis 2-color experiment, a total ofthree setup wells will be added.
3. Click Next.
The Number of Samples viewappears.
4. Enter the number 1 for the samplein A4 that will be analyzed for thisexperiment; click Next.
• The Sample Identification viewappears.
5. Leave the default the sample name,Sample_001, for each sample in theSample Identification view.
Entering Well Information
1. Click Next.
• The Number of Wells per Sampleview appears.
2. Leave the default 1 well persample; click Next.
• The Well Names View appears(Figure 5).
3. To identify the investigation well,enter the name of the antibodiesthat are in this well.
• In this example, enter Cell-Cycleas the name for Well 1.
• To enter text in the text field:
• Double-click in the white area ofthe text field to highlight theexisting entry.
• Type the new name.
• Press the Enter key on yourcomputer keyboard.
TIP: Click the tab button to easily movebetween text fields.
4. Click Next.
• The Fluorophore Labels viewappears (Figure 6). The labelswill appear as axes labels in theplots displayed in the Templateview.
6 www.bdbiosciences.comUnless otherwise specified, all products are for Research Use Only. Not for use in diagnostic or therapeutic procedures. Not for resale.
All applications are either tested in-house or reported in the literature. See Technical Data Sheets for details.
Figure 4
Figure 5

5. Enter the following names for theYellow and Red parameters:
• Propidium Iodide (for Yellow)
• Phospho Histone (for Red)
Choosing Additional Options
1. Click Next.
• The Custom Keywords viewappears. Do not add keywords inthis Wizard session.
2. Click Next.
• The Adjusting Plate Layout viewappears (Figure 7). In this view,you can choose how to lay outsamples on the plate.
3. For this experiment, chooseContiguous Horizontal from thedrop-down menu, and 0 as thenumber of separators.
Specifying Loader and AcquisitionSettings
1. Click Next.
• The Loader Settings view appears(Figure 8).
2. Change the Sample Flow Rate from 2.0 to 0.5 µL/sec and leavethe remaining settings as default;click Next.
• It is important to use the lowestflow rate when acquiring cell-cycle samples to achieve the mostaccurate measurement.
• The Acquisition Settings viewappears, (Figure 9) where youcan choose how many events perwell to acquire and whether touse a stopping gate.
7www.bdbiosciences.comUnless otherwise specified, all products are for Research Use Only. Not for use in diagnostic or therapeutic procedures. Not for resale.All applications are either tested in-house or reported in the literature. See Technical Data Sheets for details.
Figure 6
Figure 7
Figure 8
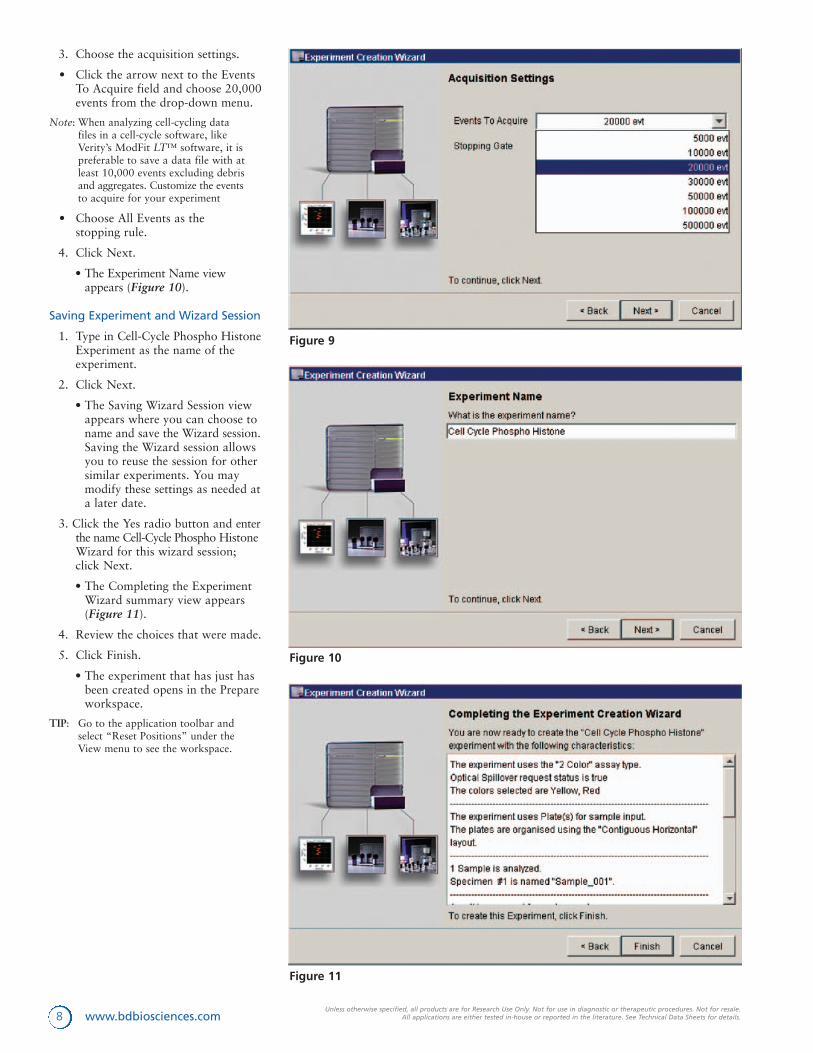
3. Choose the acquisition settings.
• Click the arrow next to the EventsTo Acquire field and choose 20,000events from the drop-down menu.
Note: When analyzing cell-cycling datafiles in a cell-cycle software, likeVerity’s ModFit LT™ software, it ispreferable to save a data file with atleast 10,000 events excluding debrisand aggregates. Customize the eventsto acquire for your experiment
• Choose All Events as the stopping rule.
4. Click Next.
• The Experiment Name viewappears (Figure 10).
Saving Experiment and Wizard Session
1. Type in Cell-Cycle Phospho HistoneExperiment as the name of theexperiment.
2. Click Next.
• The Saving Wizard Session viewappears where you can choose toname and save the Wizard session.Saving the Wizard session allowsyou to reuse the session for othersimilar experiments. You maymodify these settings as needed ata later date.
3. Click the Yes radio button and enterthe name Cell-Cycle Phospho HistoneWizard for this wizard session;click Next.
• The Completing the ExperimentWizard summary view appears(Figure 11).
4. Review the choices that were made.
5. Click Finish.
• The experiment that has just hasbeen created opens in the Prepareworkspace.
TIP: Go to the application toolbar andselect “Reset Positions” under theView menu to see the workspace.
8 www.bdbiosciences.comUnless otherwise specified, all products are for Research Use Only. Not for use in diagnostic or therapeutic procedures. Not for resale.
All applications are either tested in-house or reported in the literature. See Technical Data Sheets for details.
Figure 9
Figure 10
Figure 11

Review the Experiment in thePrepare Workspace
1. In the Prepare workspace (Figure 12),review your plate layout. Click the
Prepare tool ( ) in the tool barto choose the Prepare workspace.
Note: The first three wells in the plateview have been designated as setupwells. These wells will be used tooptimize instrument settings and tocalculate automatic optical spillovercorrection by the software.
2. Click well A1.
3. In the Inspector, choose the Acq.Tab, and then increase the samplevolume from 20 µL to 100 µL (themaximum value) by typing 100;press Enter.
• Increasing the sample volume forthe setup wells allows you toview live events for a longerperiod of time while optimizinginstrument settings.
4. Repeat steps 2 – 3 for the remainingsetup wells (A2 and A3).
5. Click the Save button ( ) tosave the work.
9www.bdbiosciences.comUnless otherwise specified, all products are for Research Use Only. Not for use in diagnostic or therapeutic procedures. Not for resale.All applications are either tested in-house or reported in the literature. See Technical Data Sheets for details.
Preparing for Instrument Optimization
Preparing the Plate
TIP: Use a printout of the plate view as a guide for transferringprepared samples to the 96-well plate.
1. Print the plate view of the experiment by clicking the Printbutton in the upper right corner of the Prepare workspace.
2. Ensure that there is approximately 200 µL of the preparedsamples in each of the following well.
• Unstained sample in well A1
• PI stained sample in well A2
• Phospho Histone-Alexa Fluor® 647 stained sample inwell A3
• Investigation sample in well A4
Loading the Plate
1. Click the Setup tool in the application toolbar to open theSetup workspace.
• The wells you selected for acquisition appear in the plateview, and the setup wells are numbered in the acquisitionorder.
2. Place the plate containing the stained samples on the plate holder.
• Position the plate so that well A1 is over the A1 mark onthe plate holder.
3. Click the Load button in the Plate Control group.
• If no lid is detected on the plate, the plate is completelyretracted into the bioanalyzer.
• The Status box should display the Instrument ReadyPlate Loaded message.
Optimizing Instrument Settings
Next, you will perform the following steps to optimize settingsfor your 2-color cellular sample.
• Adjust Forward Scatter (FCS), Side Scatter (SSC), andthreshold.
• Gate the population of interest.
• Adjust parameter voltages.
• Save data for all the setup wells.
• Calculate optical spillover.
Setup Tool
Figure 12

Optimizing FCS, SSC, and ThresholdSettings
To perform this set of optimization steps,you need to view data only from thefirst well.
1. In the Select Control group, clickNone to deselect the wells, andthen click well A1 (Figure 13).
2. Click the Setup button in theAcquisition Control group.
• Events appear in the plots, butdata is not being saved.
3. Adjust the FSC and SSC voltages toplace the cell population on scaleand above the noise level in theFSC vs SSC plot, if needed.
• Adjust the signal for eventsdisplayed in plots by changingvoltage settings.
1. Click the Parameters tab in theInstrument frame to display theParameters pane. (Figure 14)
2. Click in the Voltage field to editthis setting. Voltages can be adjustedfrom 1 – 1,000 by using the up ordown arrows or the slider bar, orby entering a value in the field.
3. Press Enter on your computerkeyboard to save the changes oncethe appropriate scatter profile isachieved.
4. Adjust the threshold to eliminatedebris at the lower end of theforward scatter (FSC) scale.
• Click the Threshold tab in theInstrument frame to display theThreshold pane (Figure 15).
• Click in the Value field to edit thesettings.
• Events below the threshold valueare excluded.
• Press Enter on your computer tosave the changes.
• Press the Set Up button to stopacquisition of sample from the A1 well.
TIP: If it is difficult to find the populationof interest in the PI histogram, thethreshold parameter can be changedto the Yellow parameter. This willallow for the PI stained sample tobe more easily visible.
10 www.bdbiosciences.comUnless otherwise specified, all products are for Research Use Only. Not for use in diagnostic or therapeutic procedures. Not for resale.
All applications are either tested in-house or reported in the literature. See Technical Data Sheets for details.
Figure 13
Figure 14
Figure 15

Gating the Population of Interest
The next step is to adjust the gate to surround the cells ofinterest, while excluding debris. This ensures that only thecellular population is viewed while optimizing fluorescentsettings. You may need to readjust the gate for each of thesingle-color setup wells.
1. In the Select Control group, click None to deselect thewells, and then click A2.
2. Click the Setup button in the Acquisition Control group.
• Events from well A2 appear in the plots, but data is notbeing saved.
3. If the gate does not surround the cell population, click onthe gate in the FCS vs SSC plot and drag it to the cellpopulation.
Note: The histogram plot displays only gatedevents.
Optimizing Fluorescence Settings
For cell-cycle experiments the goal for optimizing fluorescencesettings for the DNA is different from the goal for optimizingfluorescence settings for intracellular, intranuclear, or cell-surfacestaining. For cell-cycle optimization, the DNA profile must beoptimized to adjust the G0/G1 peak to appear around channel50. Adjusting the G0/G1 population to channel 50 will allowfor the ability to detect varying amounts of DNA that may bepresent in some samples.
For intracellular, intranuclear, or cell-surface staining, the goalis to ensure that the brightest stained cells do not appear off-scale while the dimly fluorescent cells remain on-scale. Foroptimum sensitivity, the brightest and dimmest populationsshould be as well separated as possible while keeping both on scale. For optimum resolution of dim populations, keep the mean channel of dimly stained (not unstained) populationsabove channel 300.
1. In the Parameters tab of the Instrument frame, deselect theLog checkbox for Yellow.
• The Yellow parameter will change to a Linear display.
• DNA measurements must be displayed on linear scale inorder to be able to clearly distinguish between the cell-cycle phases. This will allow for the PI stained cells,measured in the Yellow parameter, to be displayed onlinear scale.
2. While observing the DNA histogram, adjust the Yellowvoltage if necessary to place the G0/G1 population toaround channel 50.
Note: You do not need to adjust the interval gateat this time.
3. Click Setup to stop acquisition.
4. In the Select Control group, click None to deselect the wells,and then click A3 to view the Phospho Histone setup well.
5. Click the Setup button in the Acquisition Control group.
• Events from well A3 appear in the plots, but data is notbeing saved.
6. While observing the Red histogram, perform thefollowing:
• Adjust the Red voltage if necessary to place the brightestpopulation on scale.
• Verify the dim fluorescent cells remain on scale.
Deselect Log
11www.bdbiosciences.comUnless otherwise specified, all products are for Research Use Only. Not for use in diagnostic or therapeutic procedures. Not for resale.All applications are either tested in-house or reported in the literature. See Technical Data Sheets for details.

7. Click Setup to stop acquisition(Figure 16).
8. Click the Save button ( ) tosave your work.
Customizing the Loader Settings forSetup Wells
You have adjusted the instrumentsetting for the cellular experiment.Before acquiring the setup wells, youwill adjust the loader settings for thesample volume to ensure optimal sampleacquisition. Decreasing the samplevolume for the setup wells allows you tospeed up acquisition and ensure that theaspirated sample volume does notexceed the available volume.
12 www.bdbiosciences.comUnless otherwise specified, all products are for Research Use Only. Not for use in diagnostic or therapeutic procedures. Not for resale.
All applications are either tested in-house or reported in the literature. See Technical Data Sheets for details.
1. Click the Prepare tool ( ) in the application toolbar toopen the Prepare workspace.
2. Click well A1; change the sample volume in the inspectorfrom 100 µL to 20 µL; press Enter.
3. Repeat step 2 for the remaining setup wells (A2 and A3).
TIP: Always verify that you have enough volume in the wells priorto acquisition by unloading the plate and visually inspectingthe volume. A minimum volume of 50 µL is recommended forthis experiment.
Acquiring Data to Calculate Optical Spillover
The last step is to save the setup well data so that the softwarecan use the data to automatically calculate and apply opticalspillover correction.
1. Click the Setup tool in the application toolbar to open theSetup workspace.
2. In the plate view, verify setup wells A1 – A3 are selected.
3. Click Acquire.
• Data will be saved for all three wells. After the last setupwell is saved, the software automatically calculates andapplies optical spillover correction.
• If optical spillover correction was successfully calculated,the following message appears.
Ensuring Gates Were Properly Set
1. Click the Analyze tab in the Plate Editor.
2. Click the first well in the plate view and then examine theplots in the Template view.
3. If needed, perform the following:
• Click on the gate (P1) in the FCS vs SSC plot and drag itto the cell population while gating out debris.
• Adjust interval markers in each histogram to enclose thenegative population.
4. Click in each of the remaining setup wells and verify:
• The gate in the FCS vs SSC plot surrounds the cellpopulation.
• Interval gates enclose the positive population in eachfluorescence parameter
Figure 16

• For the PI positive well, adjust the Interval gate toencompass the entire cell-cycle population.
• For the Red positive sample, adjust the Interval to bearound the positive cells.
5. If you adjusted any of the gates in this section, chooseInstrument > Calculate Spillover to recalculate the opticalspillover.
6. Click the Acquire tab in the Plate Editor.
7. Click the Save button ( ) to save your work.
Data Acquisition
1. In the Select Control group, click the Auto button.
• The remaining sample well (A4) will become selectedand will be labeled as number one. The number in eachwell indicates the run order.
2. Click the Acquire tool in the application toolbar to openthe Acquire workspace.
3. Click the Acquire button in the Acquisition Control group.
• After a short pause, the following occurs:
• An orange ring appears in the well selected foracquisition, indicating that sample is being acquired.
• Events appear in the plots.
• Data is saved.
4. Click the Acquisition Status tool ( ) in the applicationworkspace to open the Acquisition Status frame.
5. In the Acquisition Status frame, monitor the event rate toensure that events are being detected and acquired.
6. Once the plate has been acquired, click the Unload buttonin the Plate Control group to eject the plate from the platesampler.
7. Remove the plate from the Plate Holder. This completessample acquisition.
Data Analysis Using BD FACSArray™ SoftwareBD FACSArray™ software can perform cell-cycle analysisestimating the percentage of cells in each cell-cycle compartment.A more accurate cell-cycle analysis should be performed with a cell-cycle modeling software, such as ModFit LT™ software.Cell-cycle software uses algorithms that correctly model thethree cell-cycle compartments and is able to analyze the overlapthat occurs between the G0/G1, S, and G2/M phases. In addition,cell-cycle modeling software provides a more accurate analysisby subtracting out underlying debris and aggregate cells thatmay interfere with the measurement of the cell-cycle compartments,thus determining an accurate percentages of cells in each cell-cycle phase.
Use the analysis features in BD FACSArray software to createan estimate of the percentages in each cell-cycle compartmentas a starting point for your analysis. Perform further analysis ina third-party cell-cycle modeling software for a more completeanalysis.
13www.bdbiosciences.comUnless otherwise specified, all products are for Research Use Only. Not for use in diagnostic or therapeutic procedures. Not for resale.All applications are either tested in-house or reported in the literature. See Technical Data Sheets for details.

Create a Gate
1. Click on the Analyze tool ( ) inthe application toolbar to open theAnalysis workspace (Figure 17).
2. Display data from the sample wellby clicking on well A4.
• In the template, the plots displaythe stored data from the selectedsample well.
3. Click on the Snap-To Auto polygongate in the template toolbar.
4. Click on the cell population in theFCS vs. SSC plot.
• A Snap-To gate will beautomatically created around thepopulation. This gate will be usedto gate out the debris.
Snap-To
14 www.bdbiosciences.comUnless otherwise specified, all products are for Research Use Only. Not for use in diagnostic or therapeutic procedures. Not for resale.
All applications are either tested in-house or reported in the literature. See Technical Data Sheets for details.
TIP: The P1 gate can be adjusted or moved if necessary. To adjustthe position of the gate, click and hold on the gate and drag itto the new position. To adjust the shape of the gate click onthe gate first, then click, hold then drag the vertex point youwant to move.
5. To display only gated data in the fluorescent plots performthe following:
• To select multiple plots, click on the border of the plotswhile holding down the Shift key.
• Right-click on the border of one of the selected plots.
• Choose Show Populations, and then select P1 from themenu that appears.
• Only the cells that are in gate P1 will now appear in thefluorescence plots.
6. Zoom in on the cell-cycle histogram to more easilyidentify the cell-cycle compartment.
• Click on the magnifier glass button ( ) to zoom in onthe cell-cycle population displayed in the Yellowparameter.
• Click and drag across the population in the Yellowparameter to enlarge the view.
7. Create three interval gates on the three cell-cyclecompartments: G0/G1 peak, S-phase, and G2/M peak.
• In the template toolbar, click on the interval gate tool
( ) to select an interval gate.
• Click and drag the gate across the G0/G1 population inthe Yellow parameter.
• Repeat the steps for creating the interval gate (P3) tosurround the S-phase cells.
• Repeat the steps for creating the interval gate (P4) tosurround the G2/M population.
Figure 17

• The statistics for each population will be displayed in the statistics view.
8. Analyze the Phospho Histone positive cells to determinethe percentage of cells in the M-phase of the cell-cycle.
• Click on the rectangle button( ) to select it.
• Click and drag the rectangle around the PhosphoHistone positive population.
• The statistics for P5 will be displayed in the statistics view.
9. Review the statistics to get an estimate of the percentageof cells in each cell-cycle compartment.
• The PI histogram determines the percentage of cells inthe G0/G1, S, and G2/M phases of the cell-cycle.
• The Phospho Histone positive cells determine thepercentage of cells in the M-phase only.
Estimated percentages of the cell-cycle compartments aredetermined by BD FACSArray™ software as follows:
• P2 estimates the G0/G1 percentage
• P3 estimates the S-Phase percentage
• P4 estimates the G2/M percentage
• P5 estimates the phospho histone M-phase percentage
These percentages are only estimate the cell-cycle phases; theyare based on the interval gates that were set in the histogram.Since the cell-cycle phases overlap, using interval gates does notaccurately determine the percentage of cells in each cycle.
Cell-Cycle Analysis Using ModFit LT SoftwareCell-cycle analysis is more accurately performed by a cell-cyclemodeling software by applying specific models to the cell-cyclephases to account for the overlap in the phases. Data files mustbe exported from BD FACSArray software to be analyzed in a third-party cell-cycle analysis software. For more detailedinformation on ModFit LT software, refer to the ModFit LTuser guide.
Exporting Data from BD FACSArray™ Software
1. In the BD FACSArray™ software, click once on your cell-cycle experiment icon in the browser to select theexperiment that contains the data files to be exported. (Do not double-click to open the experiment).
• If you performed the experiment described in thisApplication Note, click on the Cell Cycle PhosphoHistone Experiment icon in the Browser.
2. Go to the File menu and choose Export -> FCS.
3. Choose the FCS files to be exported as FCS 2.0 files.
• The files will be exported to the D:\BDExport\FCS folder
15www.bdbiosciences.comUnless otherwise specified, all products are for Research Use Only. Not for use in diagnostic or therapeutic procedures. Not for resale.All applications are either tested in-house or reported in the literature. See Technical Data Sheets for details.

ModFit LT™ Software
1. Open the ModFit LT™ software application.
2. Log in as a standard user.
3. Open a file by clicking the File button or by using the pull-down menu under File.
4. Navigate to the D:\BDExport\ FCS folder to locate the cell-cycle data file that was exported from the BD FACSArray™software.
5. Click on the FCS data file and click Open.
• The Choose Parameter For Analysis dialog appears.
6. Choose Yellow-Area as the parameter for analysis.
• The Define Gates dialog appears.
7. Leave the gates unselected and click OK.
• Verity recommends allowing ModFit LT software toautomatically detect the debris and aggregates, thuscreating a gate is not necessary.
8. Click on the Choose Model (Mod) button from the toolbar or using the pull down menu under analysis
9. Set the properties for Manual Analysis.
• Go to Edit-> Properties for Manual Analysis
• Change the number of cycles to 1 to create a cell-cycleanalysis for the diploid sample that was run.
• Leave the AutoDebris and AutoAggregates featuresenabled to allow for the software to automatically modeland subtract out the debris and aggregates.
• Click OK.
• The software will automatically place the model rangesover the detected peaks.
• Adjust the ranges for the G1 peak, S-phase, or the G2peak only if needed.
10. Click the Fit Data button (Fit) from the toolbar to performcell-cycle analysis.
• The software will automatically model the peaks underthe model ranges for the G1 peak, S-phase, and the G2peak.
• ModFit LT displays the results of the cell-cycle analysisin a report (Figure 18).
Tip
Extra setup wells:
After an experiment is created with the Experiment Wizard,extra setup or sample wells can be added to the plate layoutusing the following steps:
1. Click to select the Prepare Workspace in the applicationtoolbar.
2. In the Layout for Plates field of the plate editor, click theManual button.
3. Click to select the wells in the plate. Use the Shift key formultiple selections.
4. Click Add Sample or Add Setup.
• Repeat steps 3 – 4 for all the samples that you are adding.
References1. Cell organization, subcellular structure and cell division. 1995. In
Molecular Cell Biology. Third Edition. H.Lodish, D. Baltimore, A. Berk,S. L. Zipursky, P. Matsudaira, and J. Darnell, eds. W.H. Freeman andCompany, New York, pp. 141-188.
2. Noguchi, P. 1991. Use of flow cytometry for DNA analysis. In CurrentProtocols in Immunology. J. Coligan, A. Kruisbeek, D. Margulies, E.Shevach, and W. Strober, eds. Green Publishing Associates andWilesy-Interscience, New York. Section 5.7.1-5.7.4.
3. Darzynkiewicz, Z., F. Traganos, T. Sharpless, and M.R. Melamed. 1976.Lymphocyte stimulation: A rapid multiparameter analysis. Proc. Natl.Acad. Sci. USA 73:2881.
4. Juan,G., F. Traganos,. W. James, J. Ray, M. Roberge, D. Sauve, H.Anderson, and Z. Darzynkiewicz, 1997. Histone H3 Phosphorylationand Expression of Cyclins A and B1 measured in individual cellsduring their progression through G2 and Mitosis. Cytometry 32:71.
5. Goto, H., Y. Yasui, E. Nigg, and M. Inagaki. 2002. Aurora-Bphosphorylates Histone H3 at Serine28 with regard to the mitoticchromosome condensation. Genes to Cells 7:11.
6. Goto,H., Y. Tomono, K. Ajiro, H. Kosako, M. Fujita, M. Sakurai, K.Okawa, A. Iwamatsu, T. Okigaki, T. Takahashi, and M. Inagaki. 1999.Identification of a Novel Phosphorylation Site on Histone H3 Coupledwith Mitotic Chromosome Condensation. J. Biol. Chem. 274: 25543.
ContributorsJeanne Elia, David Ernst, Dennis Sasaki
16 www.bdbiosciences.comUnless otherwise specified, all products are for Research Use Only. Not for use in diagnostic or therapeutic procedures. Not for resale.
All applications are either tested in-house or reported in the literature. See Technical Data Sheets for details.
Figure 18

Notes

Notes

Notes

For Research Use Only. Not for use in diagnostic or therapeutic procedures. Not for resale.All applications are either tested in-house or reported in the literature. See Technical Data Sheets for details.BD flow cytometers are class I (1) laser products.Alexa Fluor® is registered trademarks of Molecular Probes, Inc. Eugene, OR.ModFit LT is a trademark of Verity Software House. BD, BD Logo and all other trademarks are the property of Becton, Dickinson and Company. ©2004 BD
04-7900030-20A1
Argentina/Paraguay/UruguayTel 54.11.4551.7100 x106Fax 54.11.4551.7400
AustriaSCIENTIFIC SUPPORT
Tel 43.1.706.36.60.44Fax [email protected] SERVICE
Tel 43.1.706.36.60Fax [email protected]
Belgium CUSTOMER SERVICE
Tel 32.53.720.550Fax [email protected]
BrazilTel 55.11.5185.9995Fax [email protected]
Central America/CaribbeanTel 506.290.7318Fax 506.290.7331
ChileTel 56.2 460.0380 x16Fax 56.2 460.0306
ChinaTel 8610.6418.1608Fax 8610.6418.1610
ColombiaTel 57.1.572.4060 x244Fax 57.1.244.1363
DenmarkTel 45.43.43.45.66Fax [email protected]
East AfricaTel 254.2.341157Fax [email protected]
Eastern EuropeTel 49.6221.305.161Fax [email protected]
EgyptTel 202.268.0181Fax 202.266.7562
FinlandTel 358.9.88.70.7832Fax [email protected]
FranceTel 33.4.76.68.36.40Fax 33.4.76.68.35.06SCIENTIFIC SUPPORT
Tel 33.4.76.68.34.25Fax 33.4.76.68.55.71bdb_france_scientific_support@europe.bd.comCUSTOMER SERVICE
Tel 33.4.76.68.37.32Fax [email protected]
GermanySCIENTIFIC SUPPORT
Tel 49.6221.305.525Fax [email protected] SERVICE
Tel 49.6221.305.551Fax [email protected]
GreeceTel 30.210.940.77.41Fax 30.210.940.77.40
Hong KongTel 852.2575.8668Fax 852.2803.5320
HungarySzerenaTel 36.1.345.7090Fax 36.1.345.7093
IndiaTel 91.124.238.3566.77Fax 91.124.238.3225
IndonesiaTel 62.21.577.1920Fax 62.21.577.1925
ItalyTel 39.02.48.240.1Fax 39.02.48.20.33.36
JapanFujisawa Pharmaceutical Co., Ltd.(Reagents from ImmunocytometrySystems & Pharmingen)Tel 81.6.6206.7890Fax 81.6.6206.7934
KoreaTel 822.3404.3700Fax 822.557.4048
MalaysiaTel 603.7725.5517Fax 603.7725.4772
MexicoTel 52.55.5999.8296Fax 52.55.5999.8288
Middle EastTel 971.4.337.95.25Fax [email protected]
The Netherlands CUSTOMER SERVICE
Tel 31.20.582.94.20Fax [email protected]
North AfricaTel 33.4.76.68.35.03Fax [email protected]
NorwayLaborel S/ATel 47.23.05.19.30Fax 47.22.63.07.31
Peru/Bolivia/EcuadorTel 51.1.430.0323Fax 51.1.430.1077
PhilippinesTel 632.807.6073Fax 632.850.1998
PolandTel 48.22.651.75.88Fax [email protected]
PortugalEnzifarmaTel 351.21.421.93.30Fax 351.21.421.93.39
Saudi ArabiaTel 966.1.26.00.805/806Fax 966.1.26.00.804
South AfricaTel 27.11.807.15 31Fax 27.11.807.19 [email protected]
SwedenTel 46.8.775.51.10Fax [email protected]
SwitzerlandSCIENTIFIC SUPPORT
Tel 41.61.485.22.91Fax [email protected] SERVICE
Tel 41.61.485.22.22Fax [email protected]
TaiwanTel 8862.2722.5660Fax 8862.2725.1768
ThailandTel 662.643.1374Fax 662.643.1381
TurkeyTel 90.212.222.87.77Fax 90.212.222.87.76
United Kingdom & IrelandTel 44.1865.78.16.88Fax [email protected]
VenezuelaTel 58.212.241.3412 x248Fax 58.212.241.7389
West AfricaSobidisTel 225.20.33.40.32Fax 225.20.33.40.28
Asia PacificBD SingaporeTel 65.6861.0633Fax 65.6860.1590
United StatesBD BiosciencesCustomer/Technical ServiceToll free 877.232.8995ClontechFax 650.354.0775Discovery LabwareFax 978.901.7493Immunocytometry SystemsFax 408.954.2347PharmingenFax 858.812.8888www.bdbiosciences.com
Australia/New ZealandAustraliaTel 61.2.8875.7000Fax [email protected] ZealandTel 64.9.574.2468Fax [email protected]
JapanNippon Becton DickinsonToll free 0120.8555.90Tel 81.24.593.5405Fax 81.24.593.5761Clontech ProductsTel 81.3.5324.9609Fax 81.3.5324.9637Europe
BelgiumTel 32.53.720.211Fax [email protected]
CanadaBD BiosciencesToll free 888.259.0187Tel 905.542.8028Fax [email protected]
Regional Offices
Local Offices and Distributors