cell flow reorients the axis of planar polarity in the
TRANSCRIPT
Cell Flow Reorients the Axisof Planar Polarity in theWing Epithelium of DrosophilaBenoıt Aigouy,1 Reza Farhadifar,2 Douglas B. Staple,2 Andreas Sagner,1 Jens-Christian Roper,1 Frank Julicher,2,*and Suzanne Eaton1,*1Max Planck Institute of Molecular Cell Biology and Genetics, Pfotenhauerstrasse 108, Dresden 01307, Germany2Max Planck Institute for the Physics of Complex Systems, Noethnitzer Strasse 38, Dresden 01187, Germany
*Correspondence: [email protected] (F.J.), [email protected] (S.E.)DOI 10.1016/j.cell.2010.07.042
SUMMARY
Planar cell polarity (PCP) proteins form polarizedcortical domains that govern polarity of externalstructures such as hairs and cilia in both vertebrateand invertebrate epithelia. The mechanisms thatglobally orient planar polarity are not understood,and are investigated here in the Drosophila wingusing a combination of experiment and theory.Planar polarity arises during growth and PCPdomains are initially oriented toward thewell-charac-terized organizer regions that control growth andpatterning. At pupal stages, the wing hinge con-tracts, subjecting wing-blade epithelial cells toanisotropic tension in the proximal-distal axis. Thisresults in precise patterns of oriented cell elongation,cell rearrangement and cell division that elongate theblade proximo-distally and realign planar polaritywith the proximal-distal axis. Mutation of the atypicalCadherin Dachsous perturbs the global polaritypattern by altering epithelial dynamics. This mecha-nism utilizes the cellular movements that sculpttissues to align planar polarity with tissue shape.
INTRODUCTION
The PCPpathway coordinates tissue planar polarity in vertebrate
and invertebrate epithelia (Simons and Mlodzik, 2008; Vladar
et al., 2009). PCP proteins localize to apical junctions and form
intracellularly polarized domains with different compositions.
In the Drosophila wing, these domains link proximal and distal
cell boundaries and orient wing hair outgrowth distally. Distal
complexes containing Flamingo (Fmi), a.k.a. Starry night (Stan),
Frizzled (Fz), Dishevelled (Dsh) and Diego (Dgo) interact across
cell boundaries with proximal complexes containing Fmi, Stra-
bismus (Stbm), a.k.a. Van Gogh (Vang) and Prickle (Pk). In the
absence of any single PCP protein, the others do not polarize
well and hair outgrowth is misoriented (Seifert and Mlodzik,
2007; Strutt and Strutt, 2005; Uemura and Shimada, 2003).
Feedback loops arising from interactions of PCP proteins within
and between cells may be sufficient for the local alignment of
PCP complexes between small groups of cells (Amonlirdviman
et al., 2005; Tree et al., 2002a; Tree et al., 2002b). Proposed
cellular mechanisms underlying local feedback loops include
preferential interactions between Fmi/Fz and Fmi/Stbm com-
plexes across cell boundaries, and the decreased susceptibility
of these complexes to endocytosis (Chen et al., 2008; Strutt
and Strutt, 2008; Wu and Mlodzik, 2008). Also, alignment of
microtubules may bias the delivery of Fz to the distal side of
the cell (Shimada et al., 2006).
While thesemechanisms can polarize PCP domains intracellu-
larly and align them locally, less is understood about mecha-
nisms that specify global alignment of PCP domains with the
proximal-distal (PD) axis of the wing. The atypical Cadherins
Fat (Ft) and Dachsous (Ds), and a regulatory golgi kinase Four-
jointed (Fj) influence global orientation of PCP domains by
a mechanism that is unclear (Adler et al., 1998; Ma et al., 2003;
Matakatsu and Blair, 2004; Strutt and Strutt, 2002; Zeidler
et al., 2000). The Fat ligand Ds is expressed highly in proximal
regions that give rise to the hinge, but at lower levels in the
more distal wing blade, during both larval and pupal stages
(Cho and Irvine, 2004; Clark et al., 1995; Ma et al., 2003; Mata-
katsu and Blair, 2004; Strutt and Strutt, 2002). Fj, which regulates
their activity (Ishikawa et al., 2008) is expressed with an opposite
pattern (Villano and Katz, 1995; Zeidler et al., 2000). These
opposing patterns have been proposed to cause intracellular
asymmetries that directly bias accumulation of core PCP
proteins in wing cells (Ma et al., 2008, 2003; Strutt and Strutt,
2002; Tree et al., 2002a). However this is not the case in the
abdomen where Ft/Ds and PCP proteins act independently to
control trichome polarity (Casal et al., 2006). Even in the wing,
Ft and Ds do not act at the time that PCP domains actually align
with the PD axis, but much earlier (during larval or prepupal
stages), to influence the global PCP pattern (Matakatsu and
Blair, 2004; Strutt and Strutt, 2002). Ft and Ds regulate both
the amount and orientation of proliferation in the larval wing
epithelium (Baena-Lopez et al., 2005; Bryant et al., 1988; Clark
et al., 1995; Garoia et al., 2005, 2000). It is not yet clear whether
this activity is relevant to the PD alignment of PCP proteins
during pupal stages.
Cell 142, 773–786, September 3, 2010 ª2010 Elsevier Inc. 773
A B
C D E
20 µm
F
PCP order elongation16 hAPF 20h50 APF 32h20 APF
30 hAPF15 hAPF50 µm
Tim
e [h
AP
F]
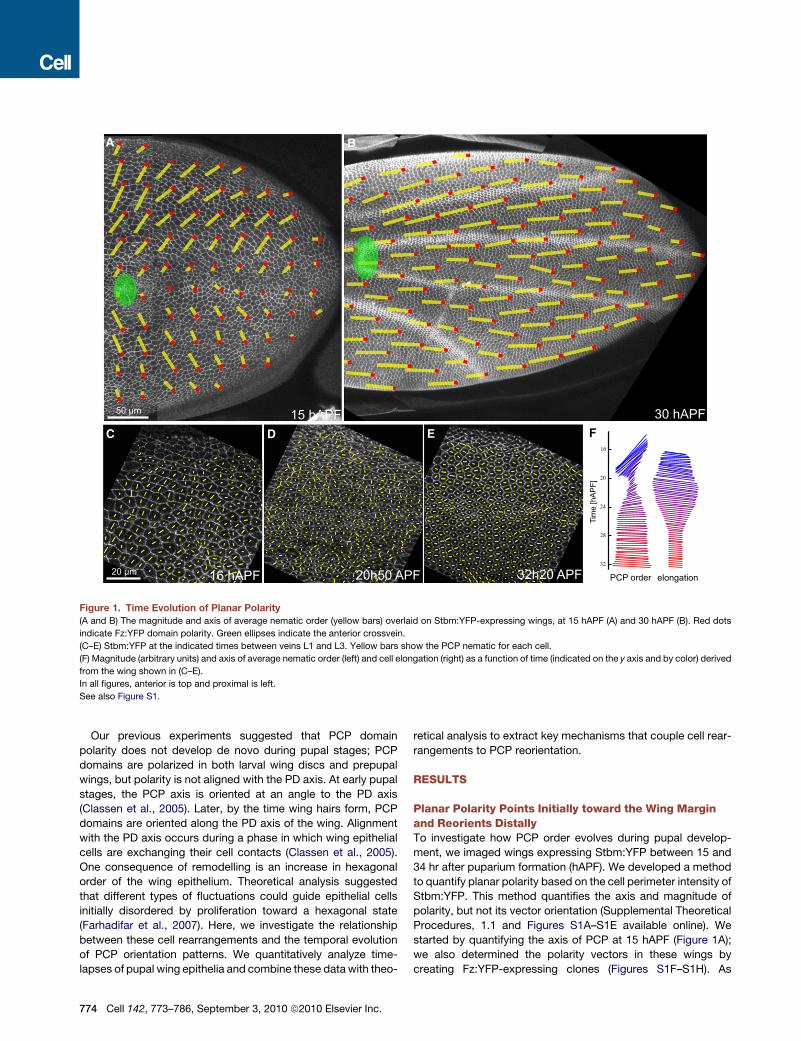
Figure 1. Time Evolution of Planar Polarity
(A and B) The magnitude and axis of average nematic order (yellow bars) overlaid on Stbm:YFP-expressing wings, at 15 hAPF (A) and 30 hAPF (B). Red dots
indicate Fz:YFP domain polarity. Green ellipses indicate the anterior crossvein.
(C–E) Stbm:YFP at the indicated times between veins L1 and L3. Yellow bars show the PCP nematic for each cell.
(F) Magnitude (arbitrary units) and axis of average nematic order (left) and cell elongation (right) as a function of time (indicated on the y axis and by color) derived
from the wing shown in (C–E).
In all figures, anterior is top and proximal is left.
See also Figure S1.
Our previous experiments suggested that PCP domain
polarity does not develop de novo during pupal stages; PCP
domains are polarized in both larval wing discs and prepupal
wings, but polarity is not aligned with the PD axis. At early pupal
stages, the PCP axis is oriented at an angle to the PD axis
(Classen et al., 2005). Later, by the time wing hairs form, PCP
domains are oriented along the PD axis of the wing. Alignment
with the PD axis occurs during a phase in which wing epithelial
cells are exchanging their cell contacts (Classen et al., 2005).
One consequence of remodelling is an increase in hexagonal
order of the wing epithelium. Theoretical analysis suggested
that different types of fluctuations could guide epithelial cells
initially disordered by proliferation toward a hexagonal state
(Farhadifar et al., 2007). Here, we investigate the relationship
between these cell rearrangements and the temporal evolution
of PCP orientation patterns. We quantitatively analyze time-
lapses of pupal wing epithelia and combine these data with theo-
774 Cell 142, 773–786, September 3, 2010 ª2010 Elsevier Inc.
retical analysis to extract key mechanisms that couple cell rear-
rangements to PCP reorientation.
RESULTS
Planar Polarity Points Initially toward the Wing Marginand Reorients DistallyTo investigate how PCP order evolves during pupal develop-
ment, we imaged wings expressing Stbm:YFP between 15 and
34 hr after puparium formation (hAPF). We developed a method
to quantify planar polarity based on the cell perimeter intensity of
Stbm:YFP. This method quantifies the axis and magnitude of
polarity, but not its vector orientation (Supplemental Theoretical
Procedures, 1.1 and Figures S1A–S1E available online). We
started by quantifying the axis of PCP at 15 hAPF (Figure 1A);
we also determined the polarity vectors in these wings by
creating Fz:YFP-expressing clones (Figures S1F–S1H). As

suggested previously (Classen et al., 2005), PCP at early stages
is correlated over long distances (Figure S1M) and is oriented
such that Fz:YFP domains face the wing margin (Figures 1A
and 1C and Figures S1F–S1I). Starting at about 18 hAPF, the
magnitude of the average alignment of groups of cells (local
nematic order, see Supplemental Theoretical Procedures, 1.2)
begins to decrease (Figures 1D and 1F and Figure S1J), and
the average axis of alignment begins to rotate toward the PD
axis (Figure 1F and Figures S1J and S1K). Reduced alignment
reflects both reduced polarity of individual cells and reduced
polarity correlation over distance (Figures S1L and S1M). After
reaching a minimum about 20 hAPF, the magnitude of average
nematic order increases; by 26 hAPF nematic order is again
maximal and aligned parallel to the PD axis (Figures 1B, 1E,
and 1F, Figures S1J and S1K, and Movie S1). Where we have
determined the direction of polarity, we quantify average polar
order by a measure ranging from zero to one (one corresponding
to perfect alignment) (Supplemental Theoretical Procedures,
1.3). At 15 hAPF, polar order averaged over the whole wing blade
is only 0.60, because polarity is oriented differently in anterior
and posterior wing regions (Figure 1A). By 32 hAPF average polar
order reaches 0.98 (Figure 1B). Thus, PCP domains do not
develop polarity de novo during pupal stages, but rather reorient
pre-existing polarity.
Polarity reorientation is reflected in the influence of fz mutant
clones on the polarity of adjacent wild-type tissue. At 15 hAPF,
fz clones perturb polarity of tissue lying between the clone and
the wing margin (Figures S1N and S1O) consistent with the early
polarity pattern. After reorientation, polarity is disturbed in wild-
type tissue lying distal to the clone (Vinson and Adler, 1987).
We noted that reorientation of PCP correlated with a transient
cell shape deformation that elongates cells in the PD axis
(Figure 1F). Quantifying elongation (Supplemental Theoretical
Procedures, 2) reveals that average polarity shrinks inmagnitude
and reorients toward the PD axis as cells elongate. The magni-
tude of average polarity along the PD axis then increases as
cell elongation decreases (Figure 1F). The precise temporal
correlation of these events suggests that they are controlled by
the same underlying mechanisms.
Dramatic Morphogenetic Movements Reshape theWingduring Pupal DevelopmentTo explore global changes occurring in the wing as cells change
shape and PCP reorients, we imaged ECadherin:GFP-express-
ing wings at low magnification from 15 to 32 hAPF. Dramatic
morphogenetic movements reshape the wing during this time
(Figures 2A–2C and Movie S2). At 15–16 hAPF, the hinge and
blade regions are roughly equal in size and the shape of the hinge
is not yet recognizable (Figure 2A). Between 15 and 24 hAPF, the
hinge undergoes patterned contractions that halve its area
and shape the allula and costa (Figures 2A–2C, Movie S2, and
Movie S3A). While wing-blade area remains constant during
this time, wing shape changes – elongating in the PD axis and
narrowing in the AP axis (Figures 2A–2C and Movie S2).
To quantify tissue movements underlying this shape change,
we tracked different regions and calculated local velocity vectors
(Supplemental Theoretical Procedures, 3). As the hinge con-
tracts, wing-blade cells flow proximally toward the hinge at
different velocities (Figures 2D–2F, Movie S3B). Between 15
and 18 hAPF, velocities have both inward and proximal compo-
nents (Figure 2D). Later, flow is proximally oriented and fastest in
the middle of the wing blade (Figure 2E). These inhomogeneous
velocities define local compression, shear and rotation as cells
move with respect to each other (Supplemental Theoretical
Procedures, 4). The shear axis in a particular region can be
thought of as the local axis of tissue deformation. In the
wing, local shear axes are oriented in a fan-like pattern that is
roughly symmetric about the third wing vein (Figures 2G–2I,
Figures S2J and S2K, and Movie S3C). Although the wing as
a whole does not rotate, local rotation does occur and is mainly
clockwise anterior to the third wing vein and anti-clockwise
posterior to it (Figures 2J–2L, Figure S2L, andMovie S3D). These
patterns of shear and rotation lengthen the wing blade in the
PD axis and narrow it in the anterior-posterior (AP) axis. Strik-
ingly, the observed antisymmetric rotation pattern would shift
early margin-oriented polarity toward the distal direction.
To investigate whether the tissue flows that reshape the wing
blade were driven by hinge contraction, we completely severed
the hinge from the blade before contraction occurred (Figure 3A).
After severing, wing-blade tissue flows distally rather than prox-
imally (Figure 3C andMovie S4A). Shear is reduced and is mainly
perpendicular to the PD axis (Figure 3D and Movie S4B), rather
than forming a fan-like pattern. Rotation is also reduced, and
its orientation is reversed compared to unperturbed wings
(compare Figure 3E with Figure 2K, and Movie S4C with Movie
S3D). As a result, the wing blade undergoes opposite shape
changes to those that normally occur. Nevertheless, wing hairs
(not shown) and longitudinal veins (Figure 3B) form normally.
These data suggest that hinge contraction exerts mechanical
stresses that contribute to the observed cell flow patterns that
change the shape of the wing blade.
Cell Boundary Tension Is Elevated along the PD Axisduring Hinge ContractionTo ask how cell boundary tension changes during hinge contrac-
tion, we used a pulsed UV laser to sever cell boundaries lying at
different angles to the PD axis, and monitored the movements
of adjacent vertices. The initial velocity with which vertices move
apart is ameasure of cell boundary tension.Before hinge contrac-
tion, tension is similar on all cell boundaries. When the hinge
contracts, tension increases specifically on those cell boundaries
lying at angles close to that of the PD axis (Figures S3A and S3B).
This suggests that hinge contraction exerts forces on the blade
that direct cellular flows via an anisotropic stress profile.
Tissue Flow in the Wing Blade Results from OrientedCell Divisions, Cell Elongation, and Neighbor ExchangesTo investigate the cellular events underlying tissue flow,
shear, and rotation, we tracked groups of cells between veins 3
and 4, starting 15 hAPF. This revealed that local tissue shape
change occurs in two distinct phases. The first is dominated by
oriented cell division and PD cell elongation, and the second by
oriented cell rearrangements (Figure 4 and Movie S5A).
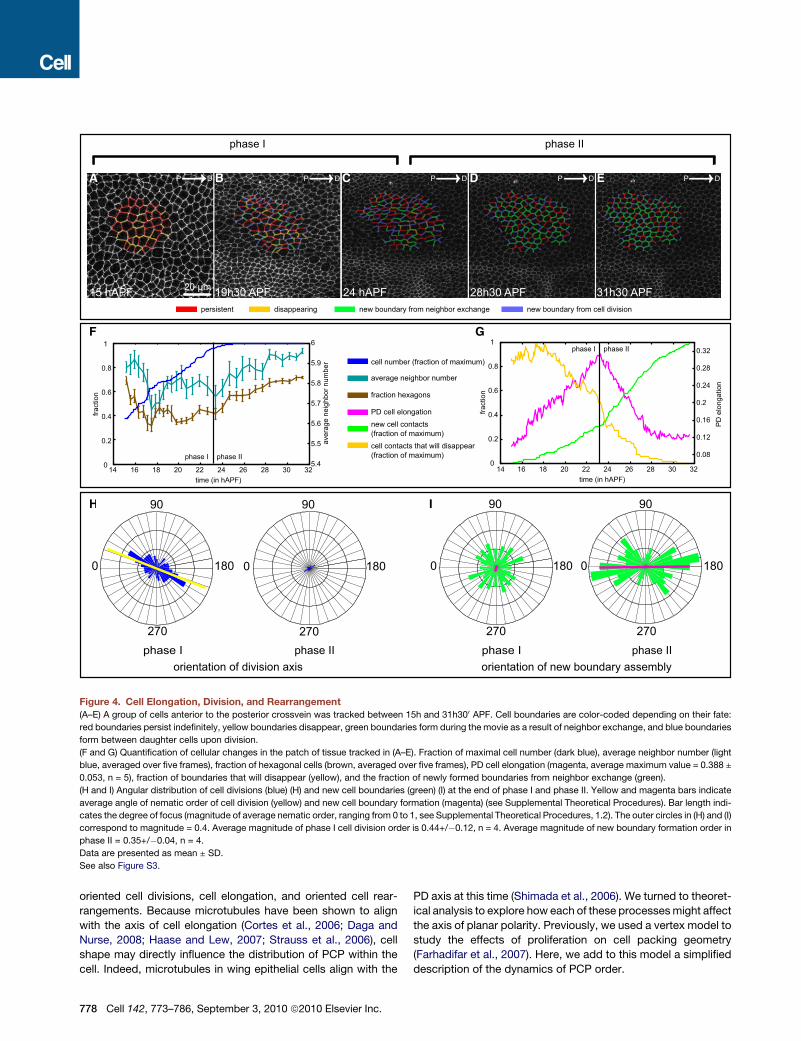
During phase I (about 15–24 hAPF), cell elongation increases
in the PD axis (Figures 4A–4C and 4G). Cell boundary loss
exceeds new boundary formation (Figure 4G), as confirmed by
Cell 142, 773–786, September 3, 2010 ª2010 Elsevier Inc. 775
24h00' 33h30'
24h00' 31h40'
A B C
D E F
G H I
*
80 µm
80 µm
50 µm/h
0.3 h-1
J K L 0.1 h 0.05 h 0.01 h
clockwiseanti-clockwise
-1 -1 -1
*
ubi-Ecad:GFP
ubi-Ecad:GFP
L3L3L3
15h30'
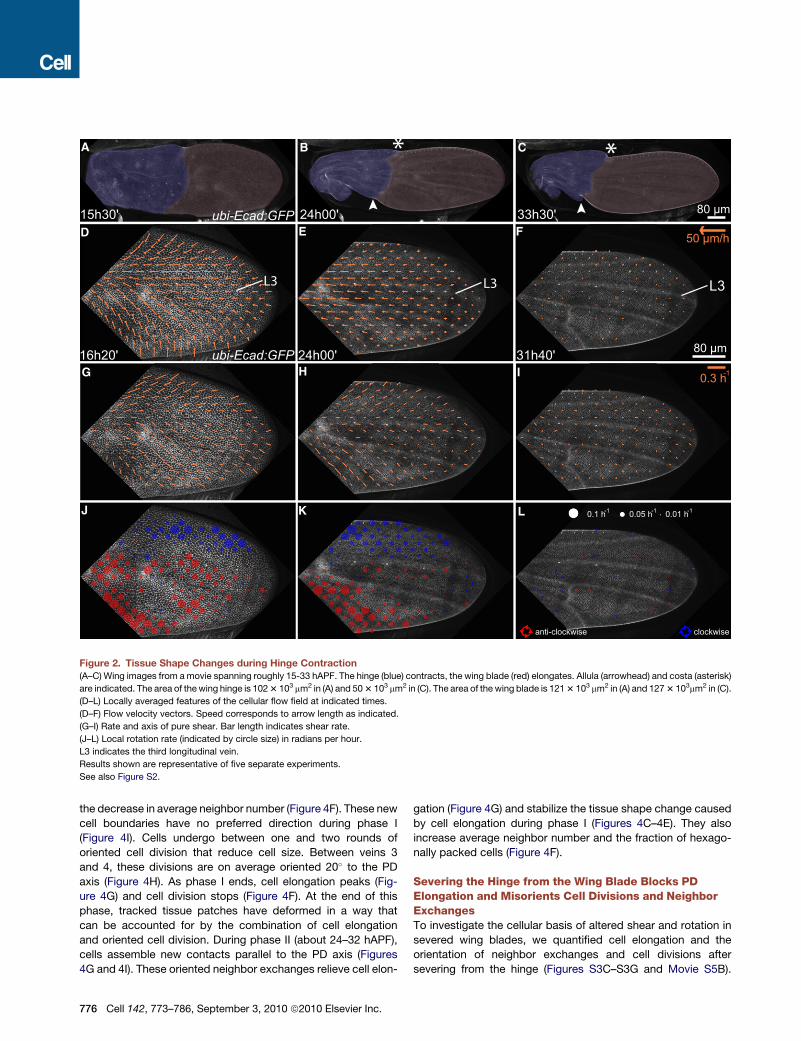
Figure 2. Tissue Shape Changes during Hinge Contraction(A–C) Wing images from amovie spanning roughly 15-33 hAPF. The hinge (blue) contracts, the wing blade (red) elongates. Allula (arrowhead) and costa (asterisk)
are indicated. The area of thewing hinge is 1023 103 mm2 in (A) and 503 103 mm2 in (C). The area of the wing blade is 1213 103 mm2 in (A) and 1273 103mm2 in (C).
(D–L) Locally averaged features of the cellular flow field at indicated times.
(D–F) Flow velocity vectors. Speed corresponds to arrow length as indicated.
(G–I) Rate and axis of pure shear. Bar length indicates shear rate.
(J–L) Local rotation rate (indicated by circle size) in radians per hour.
L3 indicates the third longitudinal vein.
Results shown are representative of five separate experiments.
See also Figure S2.
the decrease in average neighbor number (Figure 4F). These new
cell boundaries have no preferred direction during phase I
(Figure 4I). Cells undergo between one and two rounds of
oriented cell division that reduce cell size. Between veins 3
and 4, these divisions are on average oriented 20� to the PD
axis (Figure 4H). As phase I ends, cell elongation peaks (Fig-
ure 4G) and cell division stops (Figure 4F). At the end of this
phase, tracked tissue patches have deformed in a way that
can be accounted for by the combination of cell elongation
and oriented cell division. During phase II (about 24–32 hAPF),
cells assemble new contacts parallel to the PD axis (Figures
4G and 4I). These oriented neighbor exchanges relieve cell elon-
776 Cell 142, 773–786, September 3, 2010 ª2010 Elsevier Inc.
gation (Figure 4G) and stabilize the tissue shape change caused
by cell elongation during phase I (Figures 4C–4E). They also
increase average neighbor number and the fraction of hexago-
nally packed cells (Figure 4F).
Severing the Hinge from the Wing Blade Blocks PDElongation and Misorients Cell Divisions and NeighborExchangesTo investigate the cellular basis of altered shear and rotation in
severed wing blades, we quantified cell elongation and the
orientation of neighbor exchanges and cell divisions after
severing from the hinge (Figures S3C–S3G and Movie S5B).
15h30' 32h00'
22h30'
A B
D
80 µm
80 µm
50 µm/h 0.3 h
K0.1 h 0.05 h 0.01 h
clockwiseanti-clockwise
-1 -1 -1
Stbm:YFP
E
C -1
L3
F
Stbm:YFP32h00'
22h30'
22h30'
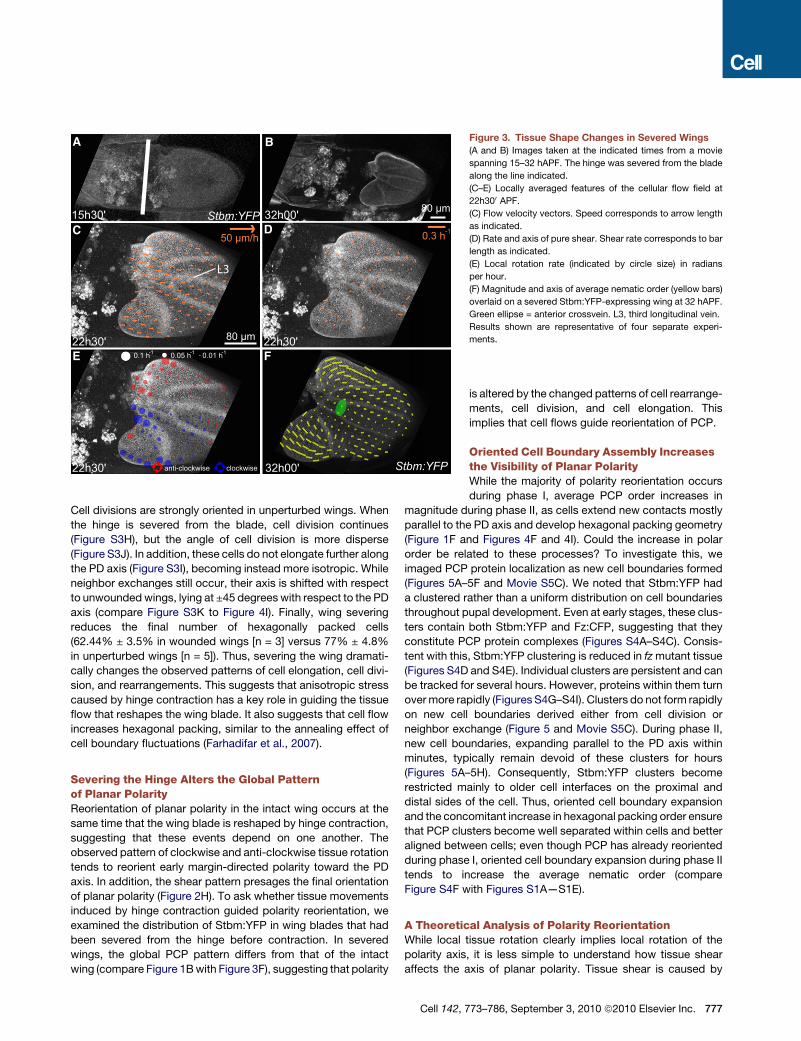
Figure 3. Tissue Shape Changes in Severed Wings
(A and B) Images taken at the indicated times from a movie
spanning 15–32 hAPF. The hinge was severed from the blade
along the line indicated.
(C–E) Locally averaged features of the cellular flow field at
22h300 APF.(C) Flow velocity vectors. Speed corresponds to arrow length
as indicated.
(D) Rate and axis of pure shear. Shear rate corresponds to bar
length as indicated.
(E) Local rotation rate (indicated by circle size) in radians
per hour.
(F) Magnitude and axis of average nematic order (yellow bars)
overlaid on a severed Stbm:YFP-expressing wing at 32 hAPF.
Green ellipse = anterior crossvein. L3, third longitudinal vein.
Results shown are representative of four separate experi-
ments.
Cell divisions are strongly oriented in unperturbed wings. When
the hinge is severed from the blade, cell division continues
(Figure S3H), but the angle of cell division is more disperse
(Figure S3J). In addition, these cells do not elongate further along
the PD axis (Figure S3I), becoming instead more isotropic. While
neighbor exchanges still occur, their axis is shifted with respect
to unwoundedwings, lying at ±45 degrees with respect to the PD
axis (compare Figure S3K to Figure 4I). Finally, wing severing
reduces the final number of hexagonally packed cells
(62.44% ± 3.5% in wounded wings [n = 3] versus 77% ± 4.8%
in unperturbed wings [n = 5]). Thus, severing the wing dramati-
cally changes the observed patterns of cell elongation, cell divi-
sion, and rearrangements. This suggests that anisotropic stress
caused by hinge contraction has a key role in guiding the tissue
flow that reshapes the wing blade. It also suggests that cell flow
increases hexagonal packing, similar to the annealing effect of
cell boundary fluctuations (Farhadifar et al., 2007).
Severing the Hinge Alters the Global Patternof Planar PolarityReorientation of planar polarity in the intact wing occurs at the
same time that the wing blade is reshaped by hinge contraction,
suggesting that these events depend on one another. The
observed pattern of clockwise and anti-clockwise tissue rotation
tends to reorient early margin-directed polarity toward the PD
axis. In addition, the shear pattern presages the final orientation
of planar polarity (Figure 2H). To ask whether tissue movements
induced by hinge contraction guided polarity reorientation, we
examined the distribution of Stbm:YFP in wing blades that had
been severed from the hinge before contraction. In severed
wings, the global PCP pattern differs from that of the intact
wing (compare Figure 1Bwith Figure 3F), suggesting that polarity
Cell 142, 7
is altered by the changed patterns of cell rearrange-
ments, cell division, and cell elongation. This
implies that cell flows guide reorientation of PCP.
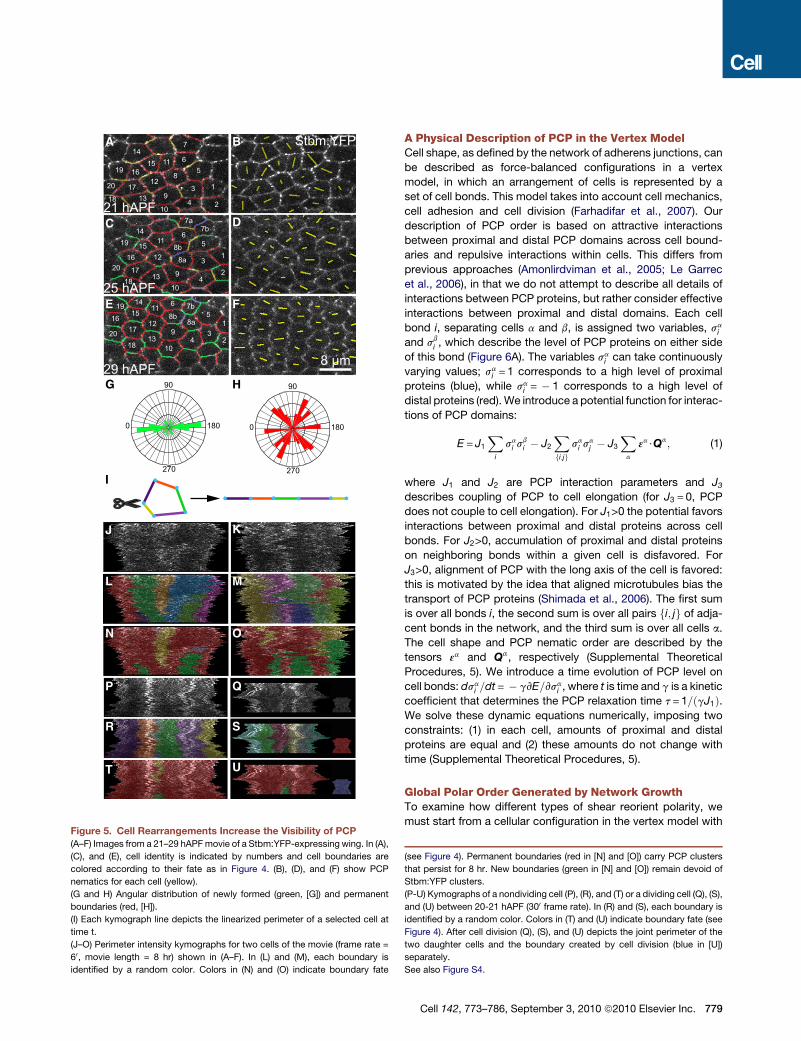
Oriented Cell Boundary Assembly Increasesthe Visibility of Planar PolarityWhile the majority of polarity reorientation occurs
during phase I, average PCP order increases in
magnitude during phase II, as cells extend new contacts mostly
parallel to the PD axis and develop hexagonal packing geometry
(Figure 1F and Figures 4F and 4I). Could the increase in polar
order be related to these processes? To investigate this, we
imaged PCP protein localization as new cell boundaries formed
(Figures 5A–5F and Movie S5C). We noted that Stbm:YFP had
a clustered rather than a uniform distribution on cell boundaries
throughout pupal development. Even at early stages, these clus-
ters contain both Stbm:YFP and Fz:CFP, suggesting that they
constitute PCP protein complexes (Figures S4A–S4C). Consis-
tent with this, Stbm:YFP clustering is reduced in fzmutant tissue
(Figures S4D and S4E). Individual clusters are persistent and can
be tracked for several hours. However, proteins within them turn
overmore rapidly (Figures S4G–S4I). Clusters do not form rapidly
on new cell boundaries derived either from cell division or
neighbor exchange (Figure 5 and Movie S5C). During phase II,
new cell boundaries, expanding parallel to the PD axis within
minutes, typically remain devoid of these clusters for hours
(Figures 5A–5H). Consequently, Stbm:YFP clusters become
restricted mainly to older cell interfaces on the proximal and
distal sides of the cell. Thus, oriented cell boundary expansion
and the concomitant increase in hexagonal packing order ensure
that PCP clusters become well separated within cells and better
aligned between cells; even though PCP has already reoriented
during phase I, oriented cell boundary expansion during phase II
tends to increase the average nematic order (compare
Figure S4F with Figures S1A—S1E).
A Theoretical Analysis of Polarity ReorientationWhile local tissue rotation clearly implies local rotation of the
polarity axis, it is less simple to understand how tissue shear
affects the axis of planar polarity. Tissue shear is caused by
73–786, September 3, 2010 ª2010 Elsevier Inc. 777
B
19h30 APF
C
24 hAPF
A
15 hAPF 20 µm
phase I phase II
28h30 APF
D
F G
0
90
180
270
0
90
180
270
E
31h30 APF
cell number (fraction of maximum)
average neighbor number
fraction hexagons
PD cell elongationnew cell contacts (fraction of maximum)cell contacts that will disappear (fraction of maximum)
H
orientation of division axisphase I phase II
orientation of new boundary assemblyphase I phase II
I
P DP DP DP DP D
0
90
180
270
0
90
180
270
0
0.2
0.4
0.6
0.8
1
14 16 18 20 22 24 26 28 30 32
0.08
0.12
0.16
0.2
0.24
0.28
0.32
fract
ion
PD
elo
ngat
ion
time (in hAPF)
0
0.2
0.4
0.6
0.8
1
14 16 18 20 22 24 26 28 30 325.4
5.5
5.6
5.7
5.8
5.9
6
fract
ion
aver
age
neig
hbor
num
ber
time (in hAPF)
phase IIphase I
phase IIphase I
persistent disappearing new boundary from neighbor exchange new boundary from cell division
Figure 4. Cell Elongation, Division, and Rearrangement
(A–E) A group of cells anterior to the posterior crossvein was tracked between 15h and 31h300 APF. Cell boundaries are color-coded depending on their fate:
red boundaries persist indefinitely, yellow boundaries disappear, green boundaries form during the movie as a result of neighbor exchange, and blue boundaries
form between daughter cells upon division.
(F and G) Quantification of cellular changes in the patch of tissue tracked in (A–E). Fraction of maximal cell number (dark blue), average neighbor number (light
blue, averaged over five frames), fraction of hexagonal cells (brown, averaged over five frames), PD cell elongation (magenta, average maximum value = 0.388 ±
0.053, n = 5), fraction of boundaries that will disappear (yellow), and the fraction of newly formed boundaries from neighbor exchange (green).
(H and I) Angular distribution of cell divisions (blue) (H) and new cell boundaries (green) (I) at the end of phase I and phase II. Yellow and magenta bars indicate
average angle of nematic order of cell division (yellow) and new cell boundary formation (magenta) (see Supplemental Theoretical Procedures). Bar length indi-
cates the degree of focus (magnitude of average nematic order, ranging from 0 to 1, see Supplemental Theoretical Procedures, 1.2). The outer circles in (H) and (I)
correspond to magnitude = 0.4. Average magnitude of phase I cell division order is 0.44+/�0.12, n = 4. Average magnitude of new boundary formation order in
phase II = 0.35+/�0.04, n = 4.
Data are presented as mean ± SD.
See also Figure S3.
oriented cell divisions, cell elongation, and oriented cell rear-
rangements. Because microtubules have been shown to align
with the axis of cell elongation (Cortes et al., 2006; Daga and
Nurse, 2008; Haase and Lew, 2007; Strauss et al., 2006), cell
shape may directly influence the distribution of PCP within the
cell. Indeed, microtubules in wing epithelial cells align with the
778 Cell 142, 773–786, September 3, 2010 ª2010 Elsevier Inc.
PD axis at this time (Shimada et al., 2006). We turned to theoret-
ical analysis to explore how each of these processesmight affect
the axis of planar polarity. Previously, we used a vertex model to
study the effects of proliferation on cell packing geometry
(Farhadifar et al., 2007). Here, we add to this model a simplified
description of the dynamics of PCP order.
21 hAPF
25 hAPF
29 hAPF
Stbm:YFP
8 µ
0
90
180
270
B
D
A
C
E F
J K
L M
N O
I
P Q
R S
T U
G H90
270
0 180
1
1
1
2
2
2
3
3
3
4
4
4
5
5
5
8
7
6
6
6
7b7a
7b
8b
8a
8a8b
9
9
9
10
10
10
11
11
11
12
12
12
13
13
13
14
14
14
15
15
15
16
16
16
17
17
17
18
18
18
19
19
19
20
20
20
m
Figure 5. Cell Rearrangements Increase the Visibility of PCP
(A–F) Images from a 21–29 hAPFmovie of a Stbm:YFP-expressing wing. In (A),
(C), and (E), cell identity is indicated by numbers and cell boundaries are
colored according to their fate as in Figure 4. (B), (D), and (F) show PCP
nematics for each cell (yellow).
(G and H) Angular distribution of newly formed (green, [G]) and permanent
boundaries (red, [H]).
(I) Each kymograph line depicts the linearized perimeter of a selected cell at
time t.
(J–O) Perimeter intensity kymographs for two cells of the movie (frame rate =
60, movie length = 8 hr) shown in (A–F). In (L) and (M), each boundary is
identified by a random color. Colors in (N) and (O) indicate boundary fate
A Physical Description of PCP in the Vertex ModelCell shape, as defined by the network of adherens junctions, can
be described as force-balanced configurations in a vertex
model, in which an arrangement of cells is represented by a
set of cell bonds. This model takes into account cell mechanics,
cell adhesion and cell division (Farhadifar et al., 2007). Our
description of PCP order is based on attractive interactions
between proximal and distal PCP domains across cell bound-
aries and repulsive interactions within cells. This differs from
previous approaches (Amonlirdviman et al., 2005; Le Garrec
et al., 2006), in that we do not attempt to describe all details of
interactions between PCP proteins, but rather consider effective
interactions between proximal and distal domains. Each cell
bond i, separating cells a and b, is assigned two variables, saiand s
bi , which describe the level of PCP proteins on either side
of this bond (Figure 6A). The variables sai can take continuously
varying values; sai = 1 corresponds to a high level of proximal
proteins (blue), while sai = � 1 corresponds to a high level of
distal proteins (red).We introduce a potential function for interac-
tions of PCP domains:
E = J1X
i
sai s
bi � J2
X
fi;jgsai s
aj � J3
X
a
3a$Qa; (1)
where J1 and J2 are PCP interaction parameters and J3describes coupling of PCP to cell elongation (for J3 = 0, PCP
does not couple to cell elongation). For J1>0 the potential favors
interactions between proximal and distal proteins across cell
bonds. For J2>0, accumulation of proximal and distal proteins
on neighboring bonds within a given cell is disfavored. For
J3>0, alignment of PCP with the long axis of the cell is favored:
this is motivated by the idea that aligned microtubules bias the
transport of PCP proteins (Shimada et al., 2006). The first sum
is over all bonds i, the second sum is over all pairs i; jgf of adja-
cent bonds in the network, and the third sum is over all cells a.
The cell shape and PCP nematic order are described by the
tensors 3a and Qa, respectively (Supplemental Theoretical
Procedures, 5). We introduce a time evolution of PCP level on
cell bonds: dsai =dt = � gvE=vsai , where t is time and g is a kinetic
coefficient that determines the PCP relaxation time t = 1=ðgJ1Þ.We solve these dynamic equations numerically, imposing two
constraints: (1) in each cell, amounts of proximal and distal
proteins are equal and (2) these amounts do not change with
time (Supplemental Theoretical Procedures, 5).
Global Polar Order Generated by Network GrowthTo examine how different types of shear reorient polarity, we
must start from a cellular configuration in the vertex model with
(see Figure 4). Permanent boundaries (red in [N] and [O]) carry PCP clusters
that persist for 8 hr. New boundaries (green in [N] and [O]) remain devoid of
Stbm:YFP clusters.
(P-U) Kymographs of a nondividing cell (P), (R), and (T) or a dividing cell (Q), (S),
and (U) between 20-21 hAPF (300 frame rate). In (R) and (S), each boundary is
identified by a random color. Colors in (T) and (U) indicate boundary fate (see
Figure 4). After cell division (Q), (S), and (U) depicts the joint perimeter of the
two daughter cells and the boundary created by cell division (blue in [U])
separately.
See also Figure S4.
Cell 142, 773–786, September 3, 2010 ª2010 Elsevier Inc. 779

α
β
σi
α
σi
β
A
E
C
G
B
F
D
H
Figure 6. Theoretical Analysis of Shear and
Rotation on the Reorientation of Planar
Polarity
(A) Schematic representation of PCP in the vertex
model. The variables, sai and sbi , represent the level
and type of PCP domains on bond i shared by cells
a and b.
(B) Cell packing with PCP order generated by
simulated proliferation in the vertex model with
PCP dynamics, starting from 36 randomly polar-
ized cells with kdt = 0.01, J2/J1 = 0.5 and J3 = 0.
Arrows in (B)–(D) show the direction of polarity.
(C and D) Reorientation of polar order by shear due
to external forces (C) or oriented cell division (D).
Starting from the network (B), and simulating shear
along the horizontal axis, leads to the networks
shown. Parameter values for (C) are kdt = 0.01
and J3/J1 = 0.05. For (D), kdt = 0.01, J3 = 0 and
�3 rounds of cell division were simulated. The
shear generated corresponds to an aspect ratio
of 4 in (C) and 1.5 in (D).
(E and F) Calculations of polarity reorientation
based on Equation 2 and measured patterns of
shear and rotation. Starting with the observed
early polarity (E), the time evolution described by
Equation 2 with n= � 3 generates a final PD
pattern (F). The wing is the same as that shown
in Figures 2D–2L.
(G andH) same procedure as in (E and F) applied to
the wounded wing shown in Figure 3 with n= 2. We
start with an initial pattern mimicking the early
polarity (G).
See also Figure S5.
globally aligned PCP variables. To generate such a configuration
without an external bias is nontrivial (Burak and Shraiman, 2009).
Surprisingly, a simple and general way to generate large
networks with long-range polarity is to start from a small group
of cells with an initially random PCP configuration (random
values of sai , Supplemental Theoretical Procedures, 6). This
network is then expanded by simulating stochastic cell divisions
at a rate kd. Simultaneously, the dynamic equations for the PCP
variables are solved. Interactions of PCP variables generate
local order, which aligns over the whole network when it is
still small. Order is maintained during growth and leads to glob-
ally aligned polarity in the resulting large networks if the PCP
relaxation time t is sufficiently fast (kdt<1, Figures 6B, Fig-
780 Cell 142, 773–786, September 3, 2010 ª2010 Elsevier Inc.
ure S5A, and Movie S6A). This is consis-
tent with the observation of global PCP
patterns in the growing wing disc
(Classen et al., 2005), and suggests that
these patterns arise early during
development.
Shear Reorients the Polarity Axis inthe Vertex ModelStarting with a globally polarized
network, we used the vertex model to
examine how different types of shear
could influence the average polarity
orientation of groups of cells. We first studied the effects of
shear caused by cell elongation and oriented cell rearrange-
ments. In our simulations, we induced pure shear at a rate ksby forcing the network to elongate along one axis at constant
total area (Supplemental Theoretical Procedures, 6). We
oriented the initial axis of average polarity at an angle of 45
degrees to this shear axis (Figure 6B). As the network is
deformed, cells elongate and undergo T1 transitions that are
oriented along the stretch axis. We find that shear reorients
polarity either parallel or perpendicular to the shear axis, de-
pending on the value of kst and on the strength J3 of the
coupling of cell shape to PCP distribution (Figures 6C, Figures
S5B–S5D, and Movies S6B—S6C). Reorientation occurs during
a characteristic time 1=j2nksj, where n is a dimensionless coef-
ficient. We define n to be negative if polarity aligns with the
shear axis, and positive if it aligns perpendicular to this axis.
Positive values of J3 promote the alignment of the polarity
vector with the shear axis, as do faster relaxation times t of
PCP (Figures S5B–S5D). Network configurations generated by
this process are irregular and cells are stretched. We relaxed
these networks by introducing fluctuations of cell bond tension
(Supplemental Theoretical Procedures, 6). This reduced cell
stretch and increased both the fraction of hexagons and the
magnitude of average polar order, similar to what is observed
during phase II in vivo (Figures 4F and 4G, and Figure S5E).
We next studiedwhether shear generated by oriented cell divi-
sions reorients polarity. We imposed cell divisions in the vertex
model at rate kd oriented at an angle of about 45 degrees to
the initial polarity axis (Supplemental Theoretical Procedures,
6). Oriented cell division generates shear parallel to the cell divi-
sion axis (defined as the line connecting the centers of the two
daughter cells) at a rate ks =mkd, where m depends on network
mechanics. We find again that polarity is reoriented either
parallel or perpendicular to the shear axis and that the dynamics
of reorientation can be characterized by the coefficient n defined
above (Figure 6D, Figure S5F, and Movie S6D). Again, faster
relaxation times t of PCP promote alignment of the polarity
vector with the shear axis (Figure S5F).
An Effective Description of Large-Scale PolarityReorientation by FlowThe reorientation of average polarity by shear flow that we
observe in the vertex model is well known in complex fluids
such as liquid crystals. In these systems, polarity reorientation
is determined by local rotation and shear rates of the flow field
and can be described by the following equation (de Gennes
and Prost, 1993; Joanny et al., 2007)
vq
vt= nkssin2q+u: (2)
Here, u is the local rotation rate, and ks is the rate of pure shear
(Supplemental Theoretical Procedures, 7). The orientation of
polarity is described by the angle q, relative to the axis of pure
shear. The coefficient n describes how pure shear influences
reorientation of polarity. In the absence of rotation, u= 0, pure
shear aligns polarity either with the shear axis ðq= 0Þ or perpen-dicular to it ðq=p=2Þ depending on the sign of n. In liquid crystals,
the value of n depends on molecular geometries and intermolec-
ular interactions (de Gennes and Prost, 1993). In the absence of
pure shear, ks = 0, local tissue rotations reorient polarity as
vq=vt =u.
Equation 2 for u= 0 describes the main features of polarity
reorientation by pure shear in the vertex model described above.
The coefficient n that characterizes how shear affects reorienta-
tion in the vertex model is the same as the parameter n in Equa-
tion 2. We can thus use Equation 2 to determine quantitatively
how the observed patterns of rotation and shear reorient the
global pattern of planar polarity in the wing.
Starting with the observed polarity pattern at 15 hAPF, we
locally applied Equation 2, with n being the only free parameter,
to calculate the corresponding time-dependent reorientation of
polar order. Local rates of rotation and shear were obtained
from the experimentally determined flow field between 15 and
32 hAPF. To ask to what extent local rotation alone could repro-
duce the observed polarity reorientation, we first considered
n= 0, i.e., shear does not influence reorientation. In this case
polarity realigns toward the PD axis, however, the final average
polar order achieved is only 0.76 (77% of the experimental value
at 32 hAPF). Thus, local rotation can account for only part of the
observed reorientation of the polarity axis.
If n is nonzero, shear also influences reorientation. Repeating
this calculation for different values of n shows that the final
average polar order is largest for nz� 3, reaching a value of
0.90 (92% of the experimental value, Figures S5G–S5J). For n
within the range �10<n<� 1 the polarity field reorients robustly
to reach an average polar order of at least 0.85 (Figure S5K,
6E,F and Movie S6E), tolerating small deviations from the exper-
imentally determined pattern of initial conditions (Figure S5K).
Note that the effects of local shear on polarity orientation depend
on PCP domain interactions and dynamics, as captured in the
vertex model. In the calculations using Equation 2, these effects
are represented via the value of the parameter n. However, in
writing Equation 2 we choose to neglect interactions of average
polar order between neighboring patches of tissue to highlight
the role of shear and rotation. We expect such additional interac-
tions could account for the remaining deviation between the
solution to Equation 2 and the observed final polarity. Note
also that positive values of n produce a final polarity pattern
with lower polar order than rotation alone (n= 0) (Figure S5K).
This analysis suggests that shear caused by the combination
of oriented cell divisions, cell elongation and cell rearrangement
plays an important role in aligning polarity parallel to the shear
axis by a process that is characterized by a negative value of n.
The close agreement between the polarity pattern generated
by Equation 2 (Figure 6F) and experimental observations
(Figure 1B) provides strong evidence that tissue remodelling is
responsible for reorienting the axis of planar polarity.
To ask whether Equation 2 could describe the polarity defects
observed when the hinge and wing blade are severed, we used it
to calculate polarity reorientation given the shear and rotation
patterns measured for these wings. For wounded wings, we
find that Equation 2 describes the main features of polarity reor-
ientation provided that n is positive (Figures 6G and 6H, Figures
S5L and S5N, and Movie S6F). This implies that, in wounded
wings, shear tends to align polarity perpendicular to the shear
axis, rather than parallel to it, as it does in unperturbed wings.
Why should shear affect polarity differently in wounded wings?
In simulations of the vertexmodel, we observed that shear gener-
ated by oriented cell divisions and by external stresses reorients
polaritywith different characteristics (FiguresS5B–S5DandS5F).
The value of n thus depends on the types of cell shape changes
and rearrangements occurring during shear. In wounded wings,
where mechanical boundary conditions are perturbed, the re-
modeling processes that dominate shear differ from those in
unperturbed wings (compare Figures S3C–S3K with Figure 4).
In early pupal wings, fz clones nonautonomously reorient
polarity of adjacent wild-type tissue lying between the clone
and the wingmargin (Figure S1N and S1O). But after remodeling,
Cell 142, 773–786, September 3, 2010 ª2010 Elsevier Inc. 781
the location of affected wild-type tissue is distal to the fz clone
(Vinson and Adler, 1987). We wondered whether the shear and
rotation observed during remodeling could account for reposi-
tioning of affected wild-type tissue. To investigate this, we first
simulated growth in the vertex model mimicking the situation
of a fzmutant clone. Starting with a network of 36 cells, we chose
a single cell and set sai = 1 on all its bonds (corresponding to loss
of Fz domains). We then simulated growth of the network while
simultaneously solving the dynamic equation of the PCP network
(Supplemental Theoretical Procedures, 5), keeping sai = 1 in the
simulated clone (indicated in blue). In these simulations, the
polarity pattern becomes distorted on one side of the clone as
domains with sai <0 (red) are positioned to face the clone
(compare Figure S5O with S5Q). These simulations generate
PCP patterns that mimic domineering nonautonomy observed
in vivo for fz and stbm mutant clones. Such patterns suggest
the interesting possibility that domineering nonautonomy may
arise during growth of the wing and may explain why the polarity
of wild-type tissue is already reoriented by fz clones at 15 hAPF.
We use these patterns as initial conditions to study reorientation
during shear.
To investigate the effects of shear and rotation on the per-
turbed PCP polarity patterns, we solve Equation 2 with n= � 3
for both networks with and without simulated clones, and an
initial average polarity axis lying 45� to the horizontal (mimicking
margin-oriented polarity). We impose shear and rotation at
constant rate, with the shear axis oriented horizontally (corre-
sponding to the PD axis of the wing) (Supplemental Theoretical
Procedures, 8). This reorients the global polarity of both net-
works and shifts the perturbed region toward the ‘‘distal’’ side
of the clone (compare Figure S5P and R) consistent with exper-
iments (Vinson and Adler, 1987).
Ds Guides Global Planar Cell Polarity by InfluencingEpithelial DynamicsPerturbing the Ft/Ds pathway misaligns PCP domains, but the
underlying mechanism is controversial (Axelrod, 2009; Casal
et al., 2006; Lawrence et al., 2007; Ma et al., 2003; Tree et al.,
2002a). These mutations also cause shorter, broader wings –
at least in part by perturbing oriented cell divisions in larval discs
(Baena-Lopez et al., 2005). To investigate whether Ds also influ-
enced pupal epithelial remodelling, we analyzed time-lapses of
ds pupal wings expressing ECadherin:GFP. At 15 hAPF, ds
wings are already misproportioned; the hinge is overgrown and
the wing blade is short and broad (Figure 7A), consistent with
altered larval growth. Nevertheless, the hinge contracts as it
does in wild-type, reducing its area about twofold (Figures 7A
and 7B). Thus, Ds is not required for hinge contraction. Calcu-
lating shear and rotation over the whole blade is difficult in ds
mutants because the epithelium folds; in regions that can be
quantified, rotation rates are smaller than in wild-type (Figures
S2G–S2I0 and S2L and Movie S7A). However, differences in
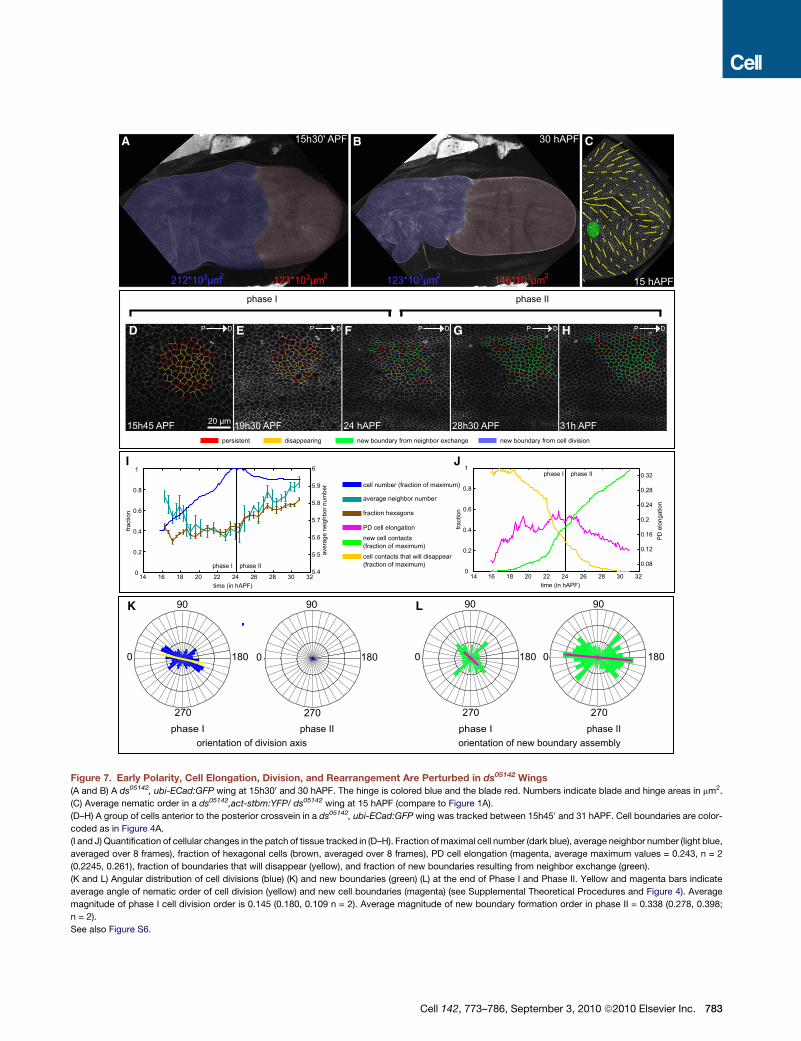
the shear patterns could not be resolved (Figures S2D–S2F0).A clearer picture emerged from analyzing ds mutants at the
cellular level (Figures 7D–7H and Movie S5D). PD cell elongation
is reduced in ds wings (compare Figure 4G and Figure 7J), and
the axis of cell division is less focused than in wild-type (compare
Figures 4H and 7K). Thus Ds is required to tightly focus cell divi-
782 Cell 142, 773–786, September 3, 2010 ª2010 Elsevier Inc.
sion orientation in both larval and pupal wings. Simulations
suggest that both cell elongation and oriented cell divisions
can reorient polarity (Figures 6C and 6D). Interestingly, both
are perturbed in ds mutants.
Ds influences both larval and pupal epithelial dynamics—so
which is most important for development of PD polarity? To
investigate this, we altered Ds levels in the posterior compart-
ment of the wing either throughout development or only during
larval growth or after pupariation. Overexpressing Ds throughout
wing development causes strong polarity defects in both poste-
rior and anterior compartments (Figure S6A). Overexpressing Ds
during larval or pupal development alone causes much milder
polarity defects (Figures S6A–S6C). We obtain complementary
results by lowering Ds levels. Inducing RNAi against Ds in the
posterior compartment throughout development perturbs
polarity strongly in both anterior and posterior compartments
(Figure S6D). Ds knock-down during larval or pupal development
alone causes milder polarity defects (Figures S6E and S6F).
These data suggest that Ds is needed both during growth and
subsequent epithelial remodelling to ensure proper alignment
of PCP with the PD axis. Ds loss or overexpression throughout
development causes cumulative defects stronger than those
caused by stage-specific perturbation.
Loss of Ds during pupal stages may perturb PD polarity by
reducing cell elongation or misorienting cell divisions during
remodelling. How could loss of Ds during larval growth affect
evolution of PD polarity? One possibility is that Ds-dependent
oriented cell divisions in the wing disc guide development of
early margin-oriented polarity; complex global PCP patterns
are as already seen in the third instar, and prepupal wings
show a pattern consistent with margin-oriented polarity (Classen
et al., 2005). To test this, we quantified the Stbm:YFP pattern in
ds wings at 15 hAPF. The pattern of average nematic order in ds
wings deviates from that of wild-type over large regions,
although PCP domains are well aligned locally, (compare
Figure 7C and Figure 1A). These observations together with
simulations suggest that the larval pattern of oriented cell divi-
sions contributes to development of margin directed polarity.
Loss of Ds may perturb the early polarity pattern indirectly by
misaligning larval cell divisions.
To ask whether abnormal early polarity in combination with the
altered flow pattern could in principle produce normal PD
polarity, we started with the altered polarity observed in early
ds wings and applied the mutant velocity field using Equation
2. For all values of n, polarity fails to orient as it does in wild-
type (average polar order < 0.67, compare Figure S5M with
S5K). Taken together, these studies indicate that development
of PD polarity depends both on correct initial polarity and on
tissue rotation and shear produced during hinge contraction.
Although Ds is expressed at high levels in the hinge and at low
levels in thewing blade, this discontinuity along the PD axis is not
required to direct PD orientation of PCP domains. Uniform Ds
expression rescues polarity in a ds mutant background (Mata-
katsu and Blair, 2004 and Figure S6G-I). Furthermore, lowering
Ds levels in the wing blade perturbs polarity more than knock-
down in the hinge (Figure S6K,L). In contrast, discontinuities in
Ds levels along the AP axis do perturb polarity at a distance;
overexpression or loss of Ds in the posterior compartment
E
19h30 APF
F
24 hAPF
D
15h45 APF 20 µm
phase I phase II
28h30 APF
G H
31h APF
P DP DP DP DP D
0
90
180
270
0
90
180
270
K
orientation of division axisphase I phase II
orientation of new boundary assemblyphase I phase II
L
0
90
180
270
0
90
180
270
I J
cell number (fraction of maximum)
average neighbor number
fraction hexagons
PD cell elongationnew cell contacts (fraction of maximum)cell contacts that will disappear (fraction of maximum)
0
0.2
0.4
0.6
0.8
1
14 16 18 20 22 24 26 28 30 32
0.08
0.12
0.16
0.2
0.24
0.28
0.32
fract
ion
PD
elo
ngat
ion
time (in hAPF)
0
0.2
0.4
0.6
0.8
1
14 16 18 20 22 24 26 28 30 325.4
5.5
5.6
5.7
5.8
5.9
6
fract
ion
aver
age
neig
hbor
num
ber
time (in hAPF)
phase IIphase I
phase IIphase I
15 hAPF
A B15h30' APF 30 hAPF
212*103µm2 123*103µm2123*103µm2 146*103µm2
C
persistent disappearing new boundary from neighbor exchange new boundary from cell division
Figure 7. Early Polarity, Cell Elongation, Division, and Rearrangement Are Perturbed in ds05142 Wings
(A and B) A ds05142, ubi-ECad:GFP wing at 15h300 and 30 hAPF. The hinge is colored blue and the blade red. Numbers indicate blade and hinge areas in mm2.
(C) Average nematic order in a ds05142,act-stbm:YFP/ ds05142 wing at 15 hAPF (compare to Figure 1A).
(D–H) A group of cells anterior to the posterior crossvein in a ds05142, ubi-ECad:GFP wing was tracked between 15h450 and 31 hAPF. Cell boundaries are color-
coded as in Figure 4A.
(I and J) Quantification of cellular changes in the patch of tissue tracked in (D–H). Fraction ofmaximal cell number (dark blue), average neighbor number (light blue,
averaged over 8 frames), fraction of hexagonal cells (brown, averaged over 8 frames), PD cell elongation (magenta, average maximum values = 0.243, n = 2
(0.2245, 0.261), fraction of boundaries that will disappear (yellow), and fraction of new boundaries resulting from neighbor exchange (green).
(K and L) Angular distribution of cell divisions (blue) (K) and new boundaries (green) (L) at the end of Phase I and Phase II. Yellow and magenta bars indicate
average angle of nematic order of cell division (yellow) and new cell boundaries (magenta) (see Supplemental Theoretical Procedures and Figure 4). Average
magnitude of phase I cell division order is 0.145 (0.180, 0.109 n = 2). Average magnitude of new boundary formation order in phase II = 0.338 (0.278, 0.398;
n = 2).
See also Figure S6.
Cell 142, 773–786, September 3, 2010 ª2010 Elsevier Inc. 783
nonautonomously perturbs polarity anteriorly (Figures S6A–
S6F). Altering Ds levels changes the response of wing epithelial
cells to hinge-dependent pulling forces (Figure 7). We therefore
considered the possibility that local changes in cell rearrange-
ment and elongation could alter large-scale cellular flows and
thus the patterns of shear and rotation in wild-type regions.
Indeed, Ds overexpression in the posterior compartment nonau-
tonomously reverses local tissue rotation in anterior cells near
the compartment boundary (compare Figures S6M–S6O, Fig-
ures 2J–2L, and Movie S7B). These observations suggest that,
to generate normal flow patterns in response to hinge contrac-
tion, cells in the anterior and posterior compartments must react
similarly to mechanical stress.
DISCUSSION
The mechanisms that couple tissue shape to the planar polarity
of constituent cells are not well understood. Here, we describe
a novel morphogenetic event that both shapes the wing of
Drosophila, and orients global planar polarity of wing cells. We
show that the hinge region contracts shortly after the prepupal
to pupal transition. This contraction not only shapes the wing
hinge, but also exerts anisotropic tension on the adjacent
wing-blade region, causing it to elongate and narrow. Reshaping
of the wing blade occurs as constituent cells flow proximally with
different velocities, generating reproducible patterns of flow,
shear and rotation. These patterns result from a combination of
oriented cell division, cell elongation and neighbor exchanges
that are guided by the anisotropic stresses.
This scenario, where externally generated forces have an
important role in epithelial remodeling differs from other con-
vergent-extension events where autonomous cell move-
ments actively drive tissue shape changes (Bertet et al., 2004;
Blankenship et al., 2006; Keller et al., 2008; Rauzi et al., 2008;
Zallen and Wieschaus, 2004). Externally induced epithelial
stretching has been proposed to provoke stress-relieving rear-
rangements during Drosophila germband extension (Butler
et al., 2009), and in the amphibian ectoderm (Keller et al.,
1992, 2008). But in these cases movements of the underlying
mesoderm, rather than contraction of adjacent epithelial cells,
provides the external force. The Drosophila pupal wing will
be a powerful system for uncovering molecular mechanisms
underlying stress-induced epithelial remodelling.
The mechanisms specifying global PCP domain alignment
have been elusive and controversial (Axelrod, 2009; Casal
et al., 2006; Lawrence et al., 2007; Ma et al., 2003; Tree et al.,
2002a). It had been thought that PCP proteins in the Drosophila
wing are initially randomly distributed, but become intracellularly
polarized along the PD axis starting approximately 10 hr before
hair formation (Strutt and Strutt, 2005; Vladar et al., 2009; Wu
and Mlodzik, 2009; Zallen, 2007). This led to the search for
a global polarizing signal that operated at this time. Here, we
show that PD orientation of PCP complexes does not arise
from a random distribution; rather it evolves from a different
global polarity pattern present at the prepupal-pupal transition.
At this stage, PCP domains are organized such that Fz-contain-
ing domains face the wing margin rather than distally. Our
previous work identified a similar global polarity pattern in
784 Cell 142, 773–786, September 3, 2010 ª2010 Elsevier Inc.
prepupal wings, and showed that even larval wing discs show
a global pattern of PCP (Classen et al., 2005). Thus PCP domains
are always polarized, but their global orientation evolves dynam-
ically during development.
What causes global reorientation of PCP during phase I, and
the subsequent increase in the magnitude of polar order during
phase II of wing-blade remodeling? During phase I, margin-
orientedpolarity is reorientedby specific patterns of local rotation
and shear due to cell flows caused by hinge contraction. Local
tissue rotation and shear reorient PCP domains by simple phys-
ical rules (see Equation [2] and Figure S7) similar to those that re-
orient molecular order in liquid crystal hydrodynamics. A signifi-
cant fraction of PCP reorientation is produced by local tissue
rotation alone. However, tissue shear also helps rotate polarity
toward the shear axis. Simulations suggest that shear caused
byorientedcell divisions, cell rearrangements andPDcell elonga-
tion can all contribute to polarity reorientation. One mechanism
that may underlie the effect of cell elongation on PCP is the
tendency of microtubules to align with the long axis of the cell.
Indeedmicrotubulesarealignedwith thePDaxisofwingepithelial
cells and are essential for delivery of PCP proteins to the cortex
(Shimada et al., 2006). Significantly, under conditions where
normal PD polarity does not develop (e.g., in ds mutant wings
or in severed wings), oriented cell division, cell rearrangements
and cell elongation are disturbed. During phase II, oriented cell
boundary rearrangements increase hexagonal packing geometry
and improve PCP order. Simulations suggest this may occur via
an annealing process that relaxes irregular cell packing to a
more ordered hexagonal lattice with improved PCP order.
The atypical Cadherins Ft and Ds are needed to evolve the
global PD polarity pattern. Exactly how they influence the global
pattern has been controversial (Axelrod, 2009; Lawrence et al.,
2007). It was proposed that this pathway provides a PD polarity
cue that depends on higher relative levels of Ds expression in the
hinge. This inhomogeneity was thought to generate intracellular
asymmetry of Ft/Ds heterodimers throughout the wing, directly
generating a small bias in Fz activity within each cell that could
then be amplified to produce strong and stable alignment of
PCP domains with the PD axis (Ma et al., 2003; Tree et al.,
2002a). But the fact that uniform Ds expression suffices to
rescue polarity in ds wings argues against this view (Matakatsu
and Blair, 2004) (Figures S6G–S6I). Furthermore, Ft and Ds do
not appear to act directly on core PCP proteins in the Drosophila
abdomen (Casal et al., 2006). We propose that the Ft/Ds
pathway influences the global PCP pattern, not by generating
intracellular asymmetries that directly regulate PCP signaling,
but indirectly through its effects on epithelial dynamics during
both larval and pupal stages. Time-controlled loss of Ds shows
that it is required throughout development for evolution of PD
polarity (Figures S6D–S6F) (see also (Matakatsu and Blair,
2004)). During larval stages, Ds may guide the development of
early margin-oriented polarity through its influence on oriented
growth; our simulations suggest that oriented cell division
strongly influences the global axis of planar polarity. Later, during
hinge contraction and wing-blade remodeling, Ds is required
for the oriented cell division and cell elongation that occur in
response to anisotropic stresses. Both processes influence the
polarity axis in vertex model simulations.
In future, it will be interesting to examine the roles of aniso-
tropic growth and local morphogen signaling in establishing
the global PCP pattern as wing discs grow. Our theoretical anal-
ysis shows that large scale planar polarity can be stably main-
tained during growth even in the absence of global polarizing
signals. This is possible because polarity easily aligns over
a few cell diameters without orientation defects, and subsequent
cell rearrangements due to cell division do not destroy this order
during growth. Thus, polarity that was initially established when
the tissue was small can be expanded during growth, and any
anterior-posterior or dorsal-ventral boundary-derived signal
would not need to act directly over long distances.
The coupling of planar polarity to epithelial dynamics is
a robust and flexible mechanism for coordinating tissue shape
with planar polarity of constituent cells and may generalize to
other systems. Indeed, mutations in the Wnt pathway perturb
both convergent extension and the planar orientation of sensory
hair cells in the mouse cochlea (Wang et al., 2005). Furthermore,
the planar polarity of sensory hair cells in the lateral line organ of
zebrafish is oriented by the direction of cell migration rather than
long-range secreted cues (Lopez-Schier et al., 2004). Our theo-
retical analysis suggests that shear caused by stretch-induced
rearrangements or by oriented cell divisions can reorient polarity
either perpendicular or parallel to the shear axis, depending on
the relative rates of shear and PCP turnover. Thus, this process
is also highly versatile, and could be a fundamental principle of
tissue organization.
EXPERIMENTAL PROCEDURES
Imaging
Pupae were prepared for imaging as described (Classen et al., 2008). Images
were acquired with a Leica TCS-SP2 or an Olympus FV-1000 microscope.
203 and 403 oil immersion objectives were used to follow cell flows and
global morphological changes occurring in the wing. A 633 oil immersion
objective was used to image pupal wings with cellular resolution. Imaging
was performed at 25� ± 2�C, or at 29�C using a Bachhoffer chamber.
Wing Wounding
Wings were wounded by gently scratching the pupal cuticule in the hinge
region of the wing using forceps just before imaging (at around 15 hAPF).
Image Analysis and Figures
Z projections were created with ImageJ. For image analysis, we developed
‘‘packing analyzer v2.0’’, which measures cell areas, perimeter, packing, elon-
gation, polarity, cell divisions and tracks the cells and their boundaries. Briefly,
images are segmented using the watershed algorithm (Vincent and Soille,
1991). Each watershed catchment’s basin is defined as a cell. Vertices are
defined as pixels shared between three or more cells. Cell boundaries are
identified as pixels shared by exactly two cells. Cell boundaries smaller than
three pixels are reclassified as vertices. The polygon class is determined by
counting cell vertices. Cell area is defined as the number of pixels in each
cell. Cell perimeter is defined as the sum of the distance between all the pixels
surrounding a cell. To track cells, we assign a unique identity to each in the first
movie frame. Cells are then re-identified in the next images based on their
positions and neighborhoods. Boundaries are defined by the two cells that
share them. Division orientation is defined by a line connecting the centers
of the two daughter cells, and the angle it makes with the PD axis (which is
plotted as horizontal).
Movies created using our software were compressed using FFmpeg or
Quicktime Pro. Graphs were created using Microsoft Excel, Gnuplot and
Grace. Images were vectorized using Batik. Figures were composed with
Adobe Illustrator.
SUPPLEMENTAL INFORMATION
Supplemental Information includes Extended Experimental Procedures,
Supplemental Theoretical Procedures, seven figures, and seven movies and
can be found with this article online at doi:10.1016/j.cell.2010.07.042.
ACKNOWLEDGMENTS
This work represents a truly collaborative effort. Each author has contributed
significantly to the findings and regular group discussions guided the develop-
ment of the ideas presented here. The manuscript was written jointly by all
authors. S.E., A.S., J.R., R.F., and F.J. were supported by the Max Planck
Gesellschaft. B.A. was funded by the Fondation pour la Recherche Medicale.
D.S. acknowledges the Natural Sciences and Engineering Research Council of
Canada and the German Academic Exchange Service. J.R. was supported by
a predoctoral fellowship from the Boehringer Ingelheim Fonds. We thank Tony
Hyman and Stephan Grill for use of the laser cuttingmicroscope. We are grate-
ful to Stephan Grill, Ewa Paluch, Elisabeth Knust, and Carl-Philipp Heisenberg
for critical comments on the manuscript. We thank David Strutt, Seth S.Blair,
VDRC and the Bloomington Stock Center for providing fly stocks, Barry Dick-
son for DNA constructs, Julia Gabel for help with cloning, Sven Ssykor for
transgenic injections.
Received: August 28, 2009
Revised: May 11, 2010
Accepted: July 23, 2010
Published: September 2, 2010
REFERENCES
Adler, P.N., Charlton, J., and Liu, J. (1998). Mutations in the cadherin super-
family member gene dachsous cause a tissue polarity phenotype by altering
frizzled signaling. Development 125, 959–968.
Amonlirdviman, K., Khare, N.A., Tree, D.N., Chen, W., Axelrod, J., and Tomlin,
C.J. (2005). Mathematical modeling of planar cell polarity to understand domi-
neering non-autonomy. Science 307, 423–426.
Axelrod, J.D. (2009). Progress and challenges in understanding planar cell
polarity signaling. Semin. Cell Dev. Biol. 20, 964–971.
Baena-Lopez, L.A., Baonza, A., and Garcia-Bellido, A. (2005). The orientation
of cell divisions determines the shape of Drosophila organs. Curr. Biol. 15,
1640–1644.
Bertet, C., Sulak, L., and Lecuit, T. (2004). Myosin-dependent junction remod-
elling controls planar cell intercalation and axis elongation. Nature 429,
667–671.
Blankenship, J.T., Backovic, S.T., Sanny, J.S., Weitz, O., and Zallen, J.A.
(2006). Multicellular rosette formation links planar cell polarity to tissue
morphogenesis. Dev. Cell 11, 459–470.
Bryant, P.J., Huettner, B., Held, L.I., Jr., Ryerse, J., and Szidonya, J. (1988).
Mutations at the fat locus interfere with cell proliferation control and epithelial
morphogenesis in Drosophila. Dev. Biol. 129, 541–554.
Burak, Y., and Shraiman, B.I. (2009). Order and stochastic dynamics in
Drosophila planar cell polarity. PLoS Comput. Biol. 5, e1000628.
Butler, L.C., Blanchard, G.B., Kabla, A.J., Lawrence, N.J., Welchman, D.P.,
Mahadevan, L., Adams, R.J., and Sanson, B. (2009). Cell shape changes indi-
cate a role for extrinsic tensile forces in Drosophila germ-band extension. Nat.
Cell Biol. 11, 859–864.
Casal, J., Lawrence, P.A., and Struhl, G. (2006). Two separate molecular
systems, Dachsous/Fat and Starry night/Frizzled, act independently to confer
planar cell polarity. Development 133, 4561–4572.
Chen, W.S., Antic, D., Matis, M., Logan, C.Y., Povelones, M., Anderson, G.A.,
Nusse, R., and Axelrod, J.D. (2008). Asymmetric homotypic interactions of the
Cell 142, 773–786, September 3, 2010 ª2010 Elsevier Inc. 785
atypical cadherin flamingo mediate intercellular polarity signaling. Cell 133,
1093–1105.
Cho, E., and Irvine, K.D. (2004). Action of fat, four-jointed, dachsous and dachs
in distal-to-proximal wing signaling. Development 131, 4489–4500.
Clark, H.F., Brentrup, D., Schneitz, K., Bieber, A., Goodman, C., and Noll, M.
(1995). Dachsous encodes amember of the cadherin superfamily that controls
imaginal disc morphogenesis in Drosophila. Genes Dev. 9, 1530–1542.
Classen, A., Anderson, K., Marois, E., and Eaton, S. (2005). Hexagonal Packing
of Drosophila Wing Epithelial Cells by the Planar Cell Polarity Pathway. Dev.
Cell 9, 805–817.
Classen, A.K., Aigouy, B., Giangrande, A., and Eaton, S. (2008). Imaging
Drosophila pupal wing morphogenesis. Methods Mol. Biol. 420, 265–275.
Cortes, S., Glade, N., Chartier, I., and Tabony, J. (2006). Microtubule self-orga-
nisation by reaction-diffusion processes in miniature cell-sized containers and
phospholipid vesicles. Biophys. Chem. 120, 168–177.
Daga, R.R., and Nurse, P. (2008). Interphase microtubule bundles use global
cell shape to guide spindle alignment in fission yeast. J. Cell Sci. 121, 1973–
1980.
de Gennes, P.G., and Prost, J. (1993). The Physics of Liquid Crystals, Second
Edition (Gloucestershire, UK: Clarendon Press).
Farhadifar, R., Roper, J.C., Aigouy, B., Eaton, S., and Julicher, F. (2007). The
Influence of Cell Mechanics, Cell-Cell Interactions, and Proliferation on Epithe-
lial Packing. Curr. Biol. 17, 2095–2104.
Garoia, F., Grifoni, D., Trotta, V., Guerra, D., Pezzoli, M.C., and Cavicchi, S.
(2005). The tumor suppressor gene fat modulates the EGFR-mediated prolifer-
ation control in the imaginal tissues of Drosophila melanogaster. Mech. Dev.
122, 175–187.
Garoia, F., Guerra, D., Pezzoli, M.C., Lopez-Varea, A., Cavicchi, S., and Gar-
cia-Bellido, A. (2000). Cell behaviour of Drosophila fat cadherin mutations in
wing development. Mech. Dev. 94, 95–109.
Haase, S.B., and Lew, D.J. (2007). Microtubule organization: cell shape is
destiny. Curr. Biol. 17, R249–R251.
Ishikawa, H.O., Takeuchi, H., Haltiwanger, R.S., and Irvine, K.D. (2008). Four-
jointed is a Golgi kinase that phosphorylates a subset of cadherin domains.
Science 321, 401–404.
Joanny, J.F., Julicher, F., Kruse, K., and Prost, J. (2007). Hydrodynamic theory
for multi-component active polar gels. N. J. Phys. 9, 422.
Keller, R., Shih, J., and Sater, A. (1992). The cellular basis of the convergence
and extension of the Xenopus neural plate. Dev. Dyn. 193, 199–217.
Keller, R., Shook, D., and Skoglund, P. (2008). The forces that shape embryos:
physical aspects of convergent extension by cell intercalation. Phys. Biol. 5,
15007.
Lawrence, P.A., Struhl, G., and Casal, J. (2007). Planar cell polarity: one or two
pathways? Nat. Rev. Genet. 8, 555–563.
Le Garrec, J.F., Lopez, P., and Kerszberg, M. (2006). Establishment and main-
tenance of planar epithelial cell polarity by asymmetric cadherin bridges:
a computer model. Dev. Dyn. 235, 235–246.
Lopez-Schier, H., Starr, C.J., Kappler, J.A., Kollmar, R., and Hudspeth, A.J.
(2004). Directional cell migration establishes the axes of planar polarity in the
posterior lateral-line organ of the zebrafish. Dev. Cell 7, 401–412.
Ma, D., Amonlirdviman, K., Raffard, R.L., Abate, A., Tomlin, C.J., and Axelrod,
J.D. (2008). Cell packing influences planar cell polarity signaling. Proc. Natl.
Acad. Sci. USA 105, 18800–18805.
Ma, D., Yang, C.H., McNeill, H., Simon, M.A., and Axelrod, J.D. (2003). Fidelity
in planar cell polarity signalling. Nature 421, 543–547.
786 Cell 142, 773–786, September 3, 2010 ª2010 Elsevier Inc.
Matakatsu, H., and Blair, S.S. (2004). Interactions between Fat and Dachsous
and the regulation of planar cell polarity in the Drosophila wing. Development
131, 3785–3794.
Rauzi, M., Verant, P., Lecuit, T., and Lenne, P.F. (2008). Nature and anisotropy
of cortical forces orienting Drosophila tissuemorphogenesis. Nat. Cell Biol. 10,
1401–1410.
Seifert, J.R., and Mlodzik, M. (2007). Frizzled/PCP signalling: a conserved
mechanism regulating cell polarity and directed motility. Nat. Rev. Genet. 8,
126–138.
Shimada, Y., Yonemura, S., Ohkura, H., Strutt, D., and Uemura, T. (2006).
Polarized transport of Frizzled along the planar microtubule arrays in
Drosophila wing epithelium. Dev. Cell 10, 209–222.
Simons, M., and Mlodzik, M. (2008). Planar cell polarity signaling: from fly
development to human disease. Annu. Rev. Genet. 42, 517–540.
Strauss, B., Adams, R.J., and Papalopulu, N. (2006). A default mechanism of
spindle orientation based on cell shape is sufficient to generate cell fate diver-
sity in polarised Xenopus blastomeres. Development 133, 3883–3893.
Strutt, H., and Strutt, D. (2002). Nonautonomous planar polarity patterning
in Drosophila: dishevelled-independent functions of frizzled. Dev. Cell 3,
851–863.
Strutt, H., and Strutt, D. (2005). Long-range coordination of planar polarity in
Drosophila. Bioessays 27, 1218–1227.
Strutt, H., and Strutt, D. (2008). Differential stability of flamingo protein
complexes underlies the establishment of planar polarity. Curr. Biol. 18,
1555–1564.
Tree, D.R., Ma, D., and Axelrod, J.D. (2002a). A three-tiered mechanism for
regulation of planar cell polarity. Semin. Cell Dev. Biol. 13, 217–224.
Tree, D.R., Shulman, J.M., Rousset, R., Scott, M.P., Gubb, D., and Axelrod,
J.D. (2002b). Prickle mediates feedback amplification to generate asymmetric
planar cell polarity signaling. Cell 109, 371–381.
Uemura, T., and Shimada, Y. (2003). Breaking cellular symmetry along planar
axes in Drosophila and vertebrates. J. Biochem. 134, 625–630.
Villano, J.L., and Katz, F.N. (1995). four-jointed is required for intermediate
growth in the proximal-distal axis in Drosophila. Development 121, 2767–
2777.
Vincent, L., and Soille, P. (1991). Watersheds in digital spaces: an efficient
algorithm based on immersion simulations. IEEE 13, 583–598.
Vinson, C., and Adler, P.N. (1987). Directional non-cell autonomy and the
transmission of polarity information by the frizzled gene of Drosophila. Nature
329, 549–551.
Vladar, E.K., Antic, D., and Axelrod, J.D. (2009). Planar cell polarity signaling:
The developing cell’s compass. Cold Spring Harb. Perspect. Biol. 1, a002964.
Wang, J., Mark, S., Zhang, X., Qian, D., Yoo, S.J., Radde-Gallwitz, K., Zhang,
Y., Lin, X., Collazo, A., Wynshaw-Boris, A., et al. (2005). Regulation of polarized
extension and planar cell polarity in the cochlea by the vertebrate PCP
pathway. Nat. Genet. 37, 980–985.
Wu, J., and Mlodzik, M. (2008). The frizzled extracellular domain is a ligand for
VanGogh/Stbm during nonautonomous planar cell polarity signaling. Dev. Cell
15, 462–469.
Wu, J., and Mlodzik, M. (2009). A quest for the mechanism regulating global
planar cell polarity of tissues. Trends Cell Biol. 19, 295–305.
Zallen, J.A. (2007). Planar polarity and tissue morphogenesis. Cell 129, 1051–
1063.
Zallen, J.A., and Wieschaus, E. (2004). Patterned gene expression directs
bipolar planar polarity in Drosophila. Dev. Cell 6, 343–355.
Zeidler, M.P., Perrimon, N., and Strutt, D.I. (2000). Multiple roles for four-
jointed in planar polarity and limb patterning. Dev. Biol. 228, 181–196.