cell phone tower proximity impacts on house prices… · pacific rim property research journal, vol...
TRANSCRIPT
Pacific Rim Property Research Journal Vol 13 No 1 63
CELL PHONE TOWER PROXIMITY IMPACTS ON HOUSE PRICES A NEW ZEALAND CASE STUDY
SANDY BOND
Curtin University ABSTRACT The siting of cellular phone towers (CPBSs) is of particular public concern due to fears of potential health hazards from the electromagnetic fields (EMFs) that these devices emit The unsightliness of these structures and fear of lowered property values are other regularly voiced concerns about the siting of CPBs This paper outlines the results of further research to show the effect that distance to a CPBS has on residential property prices in New Zealand (NZ) The results of this research will be of interest to valuers when valuing properties in close proximity to CPBSs and for determining compensation if any to affected property owners Keywords Cellular phone base stations GIS market perceptions multiple regression analysis property values INTRODUCTION There have been persisting concerns about the possible impact of cellular phones and cellular phone base stations on health due to the electromagnetic fields (EMFs) they emit This was appreciated by the UK government which in 1999 took the early initiative of setting up the Independent Expert Group on Mobile Phones (IEGMP) to review the situation Its report Mobile Phones and Health (the Stewart Report) published in May 2000 concluded that
ldquohellipit is not possible at present to say that exposure to RF radiation even at levels below national guidelines is totally without potential adverse health effects and that the gaps in knowledge are sufficient to justify a precautionary approachrdquo
The Stewart report concluded a precautionary approach to the use of mobile phone technologies be adopted until much more detailed and scientifically robust information on any health effects becomes available
Controversy remains about whether or not exposure of humans to electromagnetic fields can cause cancer Some studies show an association between certain types of cancers and residential exposure to electromagnetic fields generated by radio cellular phone and television transmitters (see for example Hardell Mild amp
64 Pacific Rim Property Research Journal Vol 13 No 1
Carlberg 2003 AGNIR 2003 Chen et al 2000 Michelozzi et al 2002) However a review of the evidence on cellular phones cell phones base stations and brain cancer by Moulder et al (2005) concludes that a weight-of-evidence evaluation shows that the current evidence for a causal association between cancer and exposure to RF energy is weak and unconvincing Due to the abovementioned controversy there appears to be ongoing concern about the siting of cellular phone base stations (CPBSs) due to fears of health risks from exposure to EMFs changes in neighborhood aesthetics and loss in property values However the extent to which such attitudes are reflected in lower property values affected by CPBSs is not well understood This paper outlines the results of research conducted in 2004 that follows an earlier study carried out in Christchurch NZ in 2003 to show the effect that proximity to cellular phone base stations (CPBSs) has on residential property values This current study looks specifically at the impact of distance to a CPBS on residential house prices It involved the same case study areas in Christchurch city in the South Island of New Zealand as the previous study for comparison purposes A summary of the results from the previous study are outlined in the literature review
LITERATURE REVIEW Property value effects from CPBSs Few studies have been conducted to ascertain the adverse health and visual effects of cell phone towers on property values Further as there have been very few cell site cases proceeding to the Environment Court in NZ only limited evidence of property value effects has been provided by the courts Thus the extent to which opposition from property owners affected by the siting of cell phone towers are reflected in lower property values is not widely known in NZ Bond and Beamish (2005) review the two studies commissioned by Telecom in Auckland Whangarei and Hamilton (199899) as well as Christchurch (2001) The results of both studies showed that property prices are not statistically significantly affected by the presence of cell phone towers However both studies involved only limited sales data analysis Further Bond and Beamish suggest that as the sponsoring party to the research was a telecommunication company it is questionable whether the results are completely free from bias Two parallel studies were carried out in Christchurch NZ by Bond and Beamish (2005) and Bond and Wang (2005) to show the effect that proximity to cellular phone base stations (CPBSs) has on residential property values The City of Christchurch was selected as the case study area due to the large amount of media attention this area had received in recent years relating to the siting of CPBSs Two
Pacific Rim Property Research Journal Vol 13 No 1 65
prominent court cases over the siting of CPBSs were the main cause for this attention (McIntyre and others vs Christchurch City Council [1996] NZRMA 289 and Shirley Primary School vs Telecom Mobile Communications Ltd [1999] NZRMA 66) In summary the Environmental Court ruled in each case that there is no established adverse health effects arising from the emission of radio waves from CPBSs as there is no epidemiological evidence to show this However in the courtrsquos decisions they did concede that while there are no proven health affects that there is evidence of property values being affected by both of the above allegations These court cases were only the start of the negative publicity surrounding CPBSs in Christchurch Dr Neil Cherry a prominent and vocal local professor served only to fuel the negative attention to CPBSs by regularly publishing the health hazards relating to these structures (see Cherry 2000) This media attention had an impact on the results of the studies outlined next The first study by Bond and Beamish (2005) comprised a postal survey to investigate the perceptions of residents towards living near CPBSs and how this proximity might affect property values The survey included residents in ten suburbs five case study areas (within 100 feet of a cell phone tower) and five control areas (over 06 of a mile from a cell phone tower) Eighty questionnaires
were distributed to each of the ten suburbs in Christchurch (ie 800 surveys were delivered in total) An overall response rate of 46 was achieved The results were mixed with responses from residents ranging from having no concerns to being very concerned about proximity to a tower In both the case study and control areas the impact of proximity to towers on future property values is the issue of greatest concern for respondents If purchasing or renting a property near a tower over a third (38) of the control group respondents would reduce price of their property by more than 20 The perceptions of the case study respondents were less negative with a third of them saying they would reduce price by only 1-9 and 24 would reduce price by between 10 and 19 The second study by Bond and Wang (2005) used the standard hedonic methodology to quantify the effect of a CPBS on sale prices of homes located near these The study included 4283 property sales in four suburbs that occurred between 1986 and 2002 (approximately 1000 sales per suburb) The sales data that occurred before a tower was built were compared to sales data after a tower was built to determine any variance in price after accounting for all the relevant independent variables Interestingly the effect of a tower on price (a decrease of between 207 and 21) was very similar in the two suburbs where the towers were built in the year 2000 after the negative media publicity given to towers following the two legal cases outlined above The other two suburbs that indicated a tower was either
66 Pacific Rim Property Research Journal Vol 13 No 1
insignificant or increased prices by around 12 had towers built in them in 1994 prior to the media publicity The main limitation affecting this study was that there was no accurate proximity measure included in the model such as GIS coordinates for each property Instead street name was included as an independent variable to help to control for the proximity effects The current study uses GIS analysis to determine the impact that actual distance to a CPBS has on residential property prices Property value effects from high voltage overhead transmission lines CPBSs are very similar structures to high voltage overhead transmission lines (HVOTLs) and their supporting structure the pylons Therefore despite the limited research relating to value effects from CPBS the body of literature on the property values effects from HVOTLs and pylons was reviewed by Bond and Wang (2005) Their review showed that proximity and views of pylons are more of a concern and affect price to a greater extent than do HVOTLs The price effect of the pylon does seem to be consistent between studies (ie negative and significant) ranging from between 12-27 depending on the distance to these The closer the home is to a pylon the greater the diminution in price The effect diminishes to a negligible amount after 250 meters on average The impact of HVOTL-proximity on price is less certain with this ranging from having no impact on price (the NZ study) to having a negative impact of up to 18 (the UK study) The effects of media attention on price Other studies confirm that media attention can have a significant impact on ldquostigmardquo and consequently prices of affected property in close proximity to environmental hazards Slovic (1992) studied peoplesrsquo perceptions toward risks and benefits and their preferences for various kinds of riskbenefit tradeoffs In his discussion of stigma Slovic associates this word with risk perception From the results of his study he also suggests that aesthetics (ugly or upsetting) visibility dangerous and disruptive are factors in stigmatization He found that mechanisms of social amplification such as heavy media coverage and attention drawn to problems by special interest groups can increase the stigma According to Flynn et al (2004) the most powerful source of risk and stigma information is the news media A study by McCluskey and Rausser (2000) specifically addressed the existence magnitude and duration of stigma relating to a lead smelter as changes in the relative risk occurred (before during and after cleanup) and the causal effect on property values of media coverage over time They found that media coverage of the environmental damage caused by the smelter had a significant negative effect on property values in close proximity to the site
Pacific Rim Property Research Journal Vol 13 No 1 67
A book review by Siemens (2003) discusses the results of the authorsrsquo (van de Griendt and Wolleswinkel) Dutch-based contaminated land case In 1980 the first scandal of a polluted residential district in the Netherlands became news when the media zoomed in on Lekkerkerk In their research van de Griendt and Wolleswinkel examined movements in the value of homes in two similar toxic residential districts in Maassluis Steendijkpolder and Noord Nieuwlandspolder Zuid In one of the districts that received a considerable amount of negative publicity prices collapsed dramatically and took years to recover In the other district where there was little media attention to the contamination issues there was hardly any fall in prices Even more surprising is the fact that the price dip in the second district lasted briefly Prices quickly returned to the old level and moved in line with price fluctuations elsewhere in the South Holland province The research revealed that negative publicity could cause a sharp fall in the value of the property The researchersrsquo noted a number of factors that play an important role in the fall of housing prices in polluted districts with the two principal factors being psychology and stigmatization The media hype hurt housing prices in Steendijkpolder and left a smear on homes in that district On the other hand there was relatively little media attention of the situation in Noord Nieuwlandspolder Zuid so the homes there escaped the pollution label Kinnard et al (1995) studied sales of homes near a remediated smelter site that received increased publicity over the remediation (nature and extent) due to highly publicized legal actions to recover damages They compared sales of houses in the affected area to those outside and also looked at proximity affects (by grouping sales into varying distance zones from the smelter) using regression analysis in a hedonic framework The results show that declines in sales volume and prices in affected area seems to be closely linked to major publicity They conclude that when publicity is intense and on-going value impacts persist over time Alternatively when publicity diminishes or ceases negative value impacts diminish or go away within a relatively short time Despite the varying results reported in the literature on property value effects from HVOTLs pylons and cell phone towers each study adds to the growing body of evidence and knowledge on this (and similar) valuation issue(s) The study reported here is one such study Methodologies advocated to study property value effects The literature dealing specifically with the measurement of the impact of environmental hazards on residential sale prices (including proximity to transmission lines landfill sites and ground water contamination) indicates the popularity of hedonic pricing models as introduced by Court (1939) and later Griliches (1971) and further developed by Freeman (1979) and Rosen (1974)
68 Pacific Rim Property Research Journal Vol 13 No 1
The more recent hedonic studies including those by Colwell et al (2003) Simons Winson-Geideman Mikelbank (2001) and Hite et al (2001) focus on proximity to an environmental hazard and demonstrate that this reduces residential house prices by varying amounts depending on distance from the hazard Thus the method selected for the current study was a hedonic house price approach GIS was also adopted to aid the analysis of distance to the CPBSs The results from this study together with the results from the previous parallel studies will help test the hypothesis that proximity to a CPBS has a negative impact on property value and reveal the extent to which the market reacts to CPBSs
METHODOLOGY The method selected for this study was a hedonic house price approach GIS was also adopted to aid the analysis of distance to the towers The null hypothesis states that being located near a CPBS does not affect property sales prices Data Sales were required both before and after the tower was built to study the effect of the existence the tower had on the surrounding propertyrsquos sale prices Residential properties that sold between 1986 and 2002 the years during which the towers were constructed and were closest to the towers were selected For comparison purposes the data set included the same data as for the previous hedonic study but included a further six suburbs to give a total of ten suburbs five suburbs with CPBSs located in them and five control suburbs without CPBSs A total of 9514 property sales were obtained from Headways Systems Ltd (approximately 1000 sales per suburb) The dataset was cleaned to address missing values and inconsistent coding for some variables The observations in each suburb are listed below in Table 1 As there were no sales data available after the CPBS was built in the Upper Riccarton suburb it was not included in the analysis of the individual suburbs
Table 1 Property data
Suburbs with a CPBS
Observations before CPBS
built
Observations after CPBS
built
Suburbs without a
CPBS Observations
St Albans 205 864 Avonhead 923 Beckenham 963 209 Bromley 951 Bishopdale 921 38 Linwood 921 Papanui 1000 79 Ilam 558 Up Riccarton 913 0 Spreydon 969
Pacific Rim Property Research Journal Vol 13 No 1 69
The other part of the data was a SAS dataset which contained 130082 observation properties including the land parcels where the CPBSs were located The data for each observation property consisted of the property address and the geographical x y coordinates that relate to the propertyrsquos absolute location There were some record errors in the suburbs of Beckenham and Spreydon as indicated by coordinates for some properties being vastly different to coordinates of other properties in the same suburb These outlier coordinates represented locations at some distance from the suburb they were supposed to relate to so they were removed from the data The two datasets containing 9514 and 130082 observations respectively were combined to provide 9514 geo-coded house sale observations The Cartesian latitudinal and longitudinal coordinates relating to the absolute location of the CPBSs are listed in Table 2
Table 2 Geographical coordinates of the CPBSs
Location X Y
St Albans(Telecom) 21-25 St Albans 2479608 5743830 Beckenham (Telecom) 148A Colombo Street 2480672 5738843 Bishopdale (Vodafone) 333 Harewood Rd 2476538 5746604 Papanui (Telecom) 48 Langdons Road 2478088 5745987 Upper Riccarton (Telecom) 57 Peer Street 2475330 5742286
Variable selection As each CPBS was built at a different date the sales from each suburb were separately analysed as well as together as a group The uniformity of locational and neighbourhood characteristics in each of these suburbs allows the analysis to be simplified and focused on the propertiesrsquo physical attributes The relative homogeneity of housing locational and neighbourhood attributes was verified through field inspections The study investigates the potential impact of proximity to a tower on the price of residential property as indicated by the dependant variable SLNETX The independent variables used in the previous hedonic study were adopted for this study but the distance proxy variable street name SISTX and time variable TIMESOLDQ were replaced with new more accurate distance and time variables Further the AGE variable used in the previous study was calculated in a different manner for the current study and renamed NEWAGE The variable descriptions are listed in Table 3
70 Pacific Rim Property Research Journal Vol 13 No 1
Table 3 Variable descriptions Variable Definition DSLNETX1 CPI-deflated sales price of the house (NZ$) TOWER An indicator variable 0 if before the tower was built or 1
after the tower was built Invdist The inverse of the square root distance to a CPBS on the non-
zero distances to measure the effect of distance on property price
DIST Distance rings comprising four levels defined around the CPBS from level ldquo0rdquo which denotes there was no CPBS built when the properties were sold to level ldquo3rdquo which denotes the distance between sold properties and the CPBS is greater than 600 meters
CATGYX2 Category of dwelling D E etc CATGYX4 Quality of the structure A B C SLDATX Actual date when the property sold NEWAGE The year the house was built LANDAX Land area (ha) MATFAX Total floor area (m2) WALLCNX Wall construction W B C etc ROOFCNX Roof construction W B C etc
1 Sales price is the dependent variable Time adjusting property sales price Due to the effect of time on property sales prices time must be allowed for in the model to permit a price comparison from one period to another One way to account for this is to deflate the sales price by the corresponding consumer price index (CPI) Preferably this would be the house component of the CPI in the relevant study area In this research the sales data came from Christchurch city so the Christchurch house component of CPI should be used to deflate the sales prices of the properties However since only a national house CPI is available from Statistics New Zealand this was used to deflate the sales prices in the data set As a precaution time was included as an explanatory variable (SLDATX) in all the regression models This variable represents the actual sales date As SLDATX was generally significant it would appear that using the CPI-deflated house price DSLNETX does not completely diminish the time effect on the sales price
Distance to the CPBS The hypothesis and main focus for this study is that we expect that property price will be lower the closer the property is to a CPBS To measure the effect of distance on property price two methods were used One method was to treat the distance numerically in the model Where a property was sold before the CPBS
Pacific Rim Property Research Journal Vol 13 No 1 71
was built the distance is recorded as zero The non-zero distance measurements indicate the distance between the CPBS and properties The distribution plot of distance against property price indicated that there was not a strong relationship between the two variables so the distance variable was transformed to better capture the relationship between the distance and property price The inverse of the square root distance on the non-zero distances provided a much better distribution pattern The new variable called invdist shows that as the distance increases invdist decreases if the distance decreases invdist increases The second method used to measure the effect of distance involved making a new categorical variable First the distance was determined from the X and Y coordinates of each property and the CPBSs The categorical variable DIST was then established containing four levels The four levels comprised circular rings that were defined around the CPBS based on distances to it The first level ldquo0rdquo denotes there was no CPBS built when the properties were sold The second level ldquo1rdquo denotes that the distance between sold properties and the CPBS is between 0 to 300 meters the third level ldquo2rdquo denotes that the distance between sold properties and the CPBS is between 301 to 600 meters and the fourth level ldquo3rdquo denotes the distance between sold properties and the CPBS is greater than 600 meters These distance rings are within the range of distances used in other similar proximity studies of the effects of high voltage overhead transmission lines hazardous waste and railway tracks on property values (see for example Hamilton and Schwann (1995) they used 100m and 200m distances as did Strand and Vagnes (2001) Reichert (1997) used four 2250ft (658m) concentric zones Colwell (1990) used 50ft (15m) 200ft (60m) and greater than 200ft (60m) distances Bond and Hopkins (2000) and Des Rosiers (2002) both used 50m (165ft) concentric zones) House age For the age of homes a different variable was adopted to that used in the previous hedonic study The new variable called NEWAGE was calculated by subtracting the sales date of the property from the time the property was built This was used to calculate the actual age of the property at the date the property was sold rather than when the market study was conducted as in the previous study It is expected that house age will have a negative effect on property price (except for homes of an historic nature that commonly have a positive impact on price) Property categories The variable CATGYX comprises four characters indicating the type age and quality of residential property The first character indicates the zoning of the property As this was the same for every property (ie ldquoRrdquo indicating residential) it was not included in the analysis Also the third character that records the decade
72 Pacific Rim Property Research Journal Vol 13 No 1
during which the structure was built was excluded from the analysis as building age is taken into account in the NEWAGE variable The second character describes the type of residence (for example single family home home ownership units etc) The last character records the quality of the structure Wall and roof materials The variables WALLCNX and ROOFCNX indicate the types of wall and roofing materials of the home While both variables supposedly have 13 levels representing the different materials most of the roofing materials are recorded as iron tile or concrete Thus for the analysis of ROOFCNX only these three materials were used but with an additional material denoted by ldquoOrdquo which included all other types of roofing material Before presenting the final multiple regression results the section following outlines the results of an initial exploratory data analysis EXPLORATORY DATA ANALYSIS In order to better understand the data an exploratory analysis was undertaken to compare sales prices between the suburbs with a CPBS and those suburbs without a CPBS and to compare sale prices over time
Housing characteristics Property prices between suburbs Figure 1 shows there is considerable difference in property prices between the different suburbs Property prices in St Albans Ilam Avonhead and Upper Riccarton are much higher than prices in the other suburbs This confirms the demographic statistics obtained for each suburb (as presented in Bond and Beamish 2005) Residents from these four suburbs had the highest levels of household and family incomes as well as the highest levels of education Due to these differences a separate analysis was undertaken for each suburb together with a combined analysis for all suburbs
Pacific Rim Property Research Journal Vol 13 No 1 73
Figure 1 Property Prices between Suburbs
74 Pacific Rim Property Research Journal Vol 13 No 1
Figure 2 Property Price versus Time
Pacific Rim Property Research Journal Vol 13 No 1 75
Property price versus time Figure 2 shows that property prices both before and after CPI-adjustment generally increase and then level out in the last period However after deflating the sales prices the increase is much less Regardless this indicates that time has a significant effect on property price as would be expected The next section outlines the results from the multiple regression analyses A comparison of these results to the results from the earlier study is covered in Section 5
EMPIRICAL RESULTS This section presents the results from the various multiple regression models used to quantify the relationship between the response variable property sales price and the explanatory variables The model of choice is one that best represents the relationships between the variables and has a small variance and unbiased parameters Various models were tested and the results are described in the next section The following statistics were used to help select the most appropriate model the adjusted coefficient of determination (adjusted R2) the standard error of the regression equation the Akaike Information Criterion (AIC) and Bayesian Information Criterion (BIC) statistics t-test of significance of the coefficients and F-statistic
Significance of the variables and the equation with ldquoTOWERrdquo included As hedonic price estimates can vary significantly across different functional forms various commonly used functional forms were examined to determine the model specification that best describes the relationship between price and the independent variables It was found that the best result was obtained from using the log of DSLNETX the log of both LANDAX and MATFAX and the linear form of all the dummy variables In the semi-logarithmic equation the interpretation of the dummy variable coefficients involves the use of the formula 100(ebn -1) where bn is the dummy variable coefficient (Halvorsen amp Palmquist 1980) A multiple regression model was fitted to the data that included the variable ldquoTOWERrdquo This was done using the statistical software ldquoRrdquo to check whether or not the presence of a CPBS has an affect on property sales prices The resulting model included all the available variables as follows
76 Pacific Rim Property Research Journal Vol 13 No 1
Log (DSLNETX) = α + β1 CATGYX2 + β2 CATGYX4 + β3 NEWAGE + β4 log(LANDAX) + β5 log(MATFAX) + β6 SLDATX1 + β7 WALLCNX + β8 ROOFCNX + β9 SUBURB Tower The regression output in Appendix I shows that most of the coefficients are significant except the majority of wall materials (WALLCNX) and purpose-built rental flats (CATGYX2) Only the wall material of iron (WALLCNXI) was significant in the model The coefficient of determination (R2) indicates that approximately 835 of the variation in sale price is explained by the variation in the independent variable set Further the p-value of the F-statistic is approximately 0 indicating the good fit of the data The TOWER coefficient is ndash 00229 and the p-value is 00088 which indicates a negative relationship between the presence of a CPBS and price Quantitatively the presence of a CPBS decreases price by 23 (1- e-00229) when other explanatory variables are held constant Although this percentage is small a CPBS does have a significant negative influence on price The most significant variables were log (MATFAX) (log of total floor area) and NEWAGE The positive log of total floor area shows that prices increase with increasing size while the negative age coefficient shows that prices decrease the greater the age of a home is The regression coefficient on log MATFAX is 0632 which indicates that on average a 10 increase in floor area (m2) will generate a 632 increase in price The negative coefficient for NEWAGE indicates that when all the other variables are held constant for each additional year of age the price would decrease by e000422 asymp 100422 (042) Another strongly significant variable was SLDATX Though very small the positive coefficient indicates an appreciation of sale price over time even after the CPI adjustment
General model including the variable ldquoDistancerdquo A multiple regression model was fitted to the data that included the variable invdist to determine whether or not distance to a CPBS has an affect on price The model is as follows Log (DSLNETX) = α + β1 CATGYX2 + β2 CATGYX4 + β3 NEWAGE + β4 log(LANDAX) + β5 log(MATFAX) + β6 SLDATX1 + β7 WALLCNX + β8 ROOFCNX + β9 SUBURB + β10 invdist This model also fitted the data very well explaining 832 of the variability in sales price All explanatory variables have significant coefficients except for wall materials (WALLCNX) (see Appendix II for the regression output)
Pacific Rim Property Research Journal Vol 13 No 1 77
The variable invdist which measures the effect of distance on price has a negative coefficient of -0368 with a significant p-value of 00082 indicating there is strong evidence that distance has a significant effect on the logged sales price Thus logged sales price decreases as the inverse of the squared root distance between a CPBS and a property increases In other words price decreases as the distance between a CPBS and a property decreases when all other explanatory variables are held constant For example when the distance between a CPBS and a property is
50 meters the price of the property will drop by 507 (1- 5013680 timesminus
e ) Distance has a larger negative effect on price than does the mere presence of a CPBS as indicated in the previous model Table 4 gives the magnitude of the decrease in property prices for the different distances between the CPBS and the properties
Table 4 Decreases in property prices with increasing distance
Distance (meters) Decrease in price () Increase in distance 10 1099 -
50 507 40
100 361 50
200 257 100
500 163 300
From Table 4 it appears that the effect on property price is negligible after 300 meters from a CPBS This is similar to the findings of other proximity studies (see for example Hamilton and Schwann (1995) and Strand and Vagnes (2001)) As in the previous model the most significant variables were log (MATFAX) (log of total floor area) and NEWAGE Further the variable coefficients are very similar to the previous model The regression coefficient on log MATFAX is 0624 which indicates that on average a 10 increase in floor area (m2) will generate a 624 increase in price The negative coefficient for NEWAGE indicates that when all the other variables are held constant for each additional year of age the price would decrease by e000419 asymp 10042 (042) A multiple regression model was fitted that includes the variable DIST a categorical distance variable taking values 0 1 2 3 Each number represents a predetermined circular distance ring around the CPBS The model is the same as previously used but includes DIST instead of invdist or TOWER The output of this model is shown in Appendix III
78 Pacific Rim Property Research Journal Vol 13 No 1
Similar to the results from the model that included the variable ldquoTOWERrdquo the output for this model shows that most of the coefficients are significant except wall materials (WALLCNX) and purpose-built rental flats (CATGYX2R) The coefficient of determination (R2) indicates that approximately 835 of the variation in sale price is explained by the variation in the independent variable set The first two categories of the distance variable are strongly significant in the model However category 3 which represents a distance greater than 600 meters from a property to a CPBS is insignificant in the model Prices of properties located between 0 and 300 meters from a CPBS decrease by 274 (1- e-00278) while those located between 300 and 600 meters from a CPBS will decrease by 287 (1- e-00291) relative to properties that sold prior to the CPBS being built when holding other explanatory variables constant Thus a CPBS has a significant albeit minimal effect on prices of property located within 600 meters of a CPBS As with the previous two models the most significant variables were log (MATFAX) (log of total floor area) and NEWAGE The regression coefficients of each variable are also very similar to those obtained in the previous models CASE MODEL ndash ST ALBANS The discussion above relates to the results from analysis of the whole dataset These indicate that CPBSs have a significant but minimal effect on the prices of proximate properties However differences might exist in the effect that CPBSs have on property prices between suburbs since the distribution of the property sales prices is quite different in each Accordingly this section focuses on investigating whether or not the presence of a CPBS has an impact on property prices within each of the suburbs In St Albans 1069 properties sold and a large number of these (864) sold after the CPBS was built Three separate multiple regression models were fitted to the data one with each variable TOWER invdist and DIST included respectively As the regression coefficients of each variable are very similar to those obtained in the previous models only the coefficients of the variables of interest TOWER invdist and DIST are shown below in Table 5
Table 5 Coefficients of TOWER invdist and DIST for St Albans
Variable TOWER Invdist DIST1 DIST 2 DIST 3
Coefficients 148e-01 899e-01 145e-01 153e-01 144e-01
P-value 00000 00000 00000 00000 00000
Pacific Rim Property Research Journal Vol 13 No 1 79
The variables TOWER invdist and DIST are significant in the respective models However surprisingly the coefficients of each variable are positive indicating that a CPBS in St Albans has a positive effect on the property prices All things being equal with the variable TOWER included in the model the presence of the CPBS will increase property values by 16 (e0148) This was a similar result to that obtained in the earlier study that did not include a distance variable In that study sales prices increased by 12 An explanation given for this was that the TOWER was built in 1994 before the negative media attention to the adverse health affects from CPBSs Alternatively there is a collinearity problem in the current St Albans model The variable SLDATX1 which measures the time effect on the property prices was not significant in the model and possibly the variable TOWER may include some of these time effects When the variable invdist is included in the model the results indicate that as the invdist increases the logged property price in St Albans also increases when holding other explanatory variables constant That is to say as the distance between the CPBS and the property decreases then the property values increase when holding the other variables constant For example at 50 meters distance the
property prices increase by 1356 ( 5018990 times
e - 1) and by 941 at 100 meters When the variable DIST is included in the model all levels of the variable have significant and positive coefficients Prices will increase by 156 (e0145) when the property is located in the range of zero to 300 meters from the CPBS and by 165 (e0153) and 155 (e0144) when the property is located between 300 and 600 meters and more than 600 meters from a CPBS respectively Since DIST1 DIST2 DIST3 have similar coefficients this is very like the model that included the variable TOWER St Albans is an up-market Christchurch suburb with higher property prices due to being located near public transportation good educational facilities parks etc and it has better socio-economic characteristics than other suburbs Thus the variable ldquodistancerdquo might include some of these influences in addition to the effect of distance to a CPBS Alternatively it is possible that as it is a more affluent suburb more homeowners may own and use cell-phones than homeowners in other suburbs and hence they may prefer the better cell phone coverage that they would get by being near a CPBS CASE MODEL ndash BECKENHAM The same functional form used in the previous models was applied to Beckenham to test the effect that the various variables TOWER invdist and DIST have on sales price In Beckenham 1172 properties sold and 209 of these sold after the CPBS
80 Pacific Rim Property Research Journal Vol 13 No 1
was built Three separate multiple regression models were fitted to the data one with each variable TOWER invdist and DIST included respectively As the regression coefficients of each variable are very similar to those obtained in the previous models only the coefficients of the variables of interest TOWER invdist and DIST are shown in Table 6 below
Table 6 Coefficients of TOWER invdist and DIST for Beckenham
Variable TOWER Invdist DIST1 DIST 2 DIST 3
Coefficients -181e-01 -285e+00 -174e-01 -174e-01 -203e-01
P-value 00000 00000 00000 00000 00000
In Beckenham TOWER invdist and DIST are significant in the respective models All of them have a negative relationship with the logged sales price With the variable TOWER included in the model the presence of the CPBS will decrease property price by 1656 (1 - e-0181) when holding other explanatory variables constant When the variable invdist is included in the model the results indicate that as the invdist increases one unit the logged property price will decrease 285 units For example in Beckenham the minimum distance of a home to a CPBS is about 97 meters the property prices corresponding to this distance will decrease by 2513
(1 - 971852 timesminus
e ) when holding other variables constant This is a surprisingly large decrease in price The output of the model with variable DIST included shows that where the distance of the property from the CPBS is between 0 and 300 meters or 300 and 600 meters the price will decrease by 159 (1- e -0174 ) relative to properties that sold before the CPBS was built If the distance is greater than 600 meters the price will decrease by 1837 (1- e -0203) relative to properties that sold before the CPBS was built Thus there is a greater negative impact on price when the distance between the property and the CPBS is greater This result appears to be inconsistent with expectation and the results from the previous models It is possible that the variable invdist not only measures the effect of CPBSs on sales price but also reflects the effect of other influences not included in the model CASE MODEL ndash BISHOPDALE In Bishopdale 959 properties sold and only 38 of these sold after the CPBS was built Despite this data discrepancy before and after the CPBS was built three
Pacific Rim Property Research Journal Vol 13 No 1 81
separate multiple regression models were fitted to the data one with each variable TOWER invdist and DIST included respectively The results from the separate models indicate that in Bishopdale the TOWER and two separate distance variables are significant in the models and all have a negative relationship with the logged sales price The coefficients of the variables of interest TOWER invdist and DIST are shown below in Table 7
Table 7 Coefficients of TOWER invdist and DIST for Bishopdale
TOWER Invdist DIST1 DIST 2
Coefficients -986e-02 -162e+00 -134e-01 -918e-02
P-value 00000 00000 00000 00000
The presence of the CPBS will decrease the sales price by 939 (1- e-00986) when holding other factors constant As invdist is increased by one unit the logged property price will decrease by 162 units when holding other variables constant For example property prices at 50 meters distance from the CPBS will decrease by
2048 (1 - 501621 timesminus
e ) and by 15 at 100 meters The coefficients from the model incorporating the categorical distance variable look reasonable However no properties sold that were located further than 600 meters from the CPBS so there were only two levels for the categorical distance variable When holding other explanatory variables constant property prices will decrease by 1254 (1- e -0134) when a property is located between 0 and 300 meters of a CPBS Prices will decrease by 896 (1- e -00939) when a home is located between 300 and 600 meters of a CPBS CASE MODEL ndash PAPANUI In Papanui 1079 properties sold and 79 of these sold after the CPBS was built The results from the three separate models indicate that all variables are significant The coefficients are listed in Table 8
Table 8 Coefficients of TOWER invdist and DIST for Papanui TOWER Invdist DIST1 DIST 2 DIST 3
Coefficients -817e-02 -224e+00 -702e-03 -155e-01 -670e-02
P-value 000142 00000 093766 000147 001888
82 Pacific Rim Property Research Journal Vol 13 No 1
In Papanui when TOWER is included in the model the presence of the CPBS will decrease sales prices by 785 (1- e-00817) when holding other variables constant Property sales prices will decrease as the variable invdist increases or in other words sales prices will decrease as the distance between the CPBS and the property decreases For example in Papanui the minimum distance between the CPBS and the property is about 177 meters so prices will decrease by a factor of
1550 (1 - 1771242 timesminus
e ) However in the model that includes the categorical distance properties located between 0 and 300 meters do not sell for significantly different prices when compared to the properties that sold before the CPBS was built which is at odds to the previous result from the model including invdist The reason for this is due to there being only 3 property sales located within 0 to 300 meters of a CPBS so there are insufficient observations in this category for a valid statistical comparison In the other two distance categories the property sales prices decrease by 1436 (1- e -0155) and 648 (1- e -0067) respectively These sizes of the decrease in the property values due to the effect by the CPBS seem reasonable DISCUSSION AND COMPARISON WITH THE PREVIOUS STUDY The analysis showed that the most significant variables and their effect on price were similar between the four suburbs St Albans Beckenham Papanui and Bishopdale This indicates the relative stability of the coefficients between each model The overall results indicate that the presence of a CPBS has a significant and negative effect on property prices This effect is not very strong when the variable TOWER is included in the model fitted to the entire dataset However the effect in each suburb is quite pronounced Table 9 summarizes the results and includes the results from the previous study (shown in brackets and italics) for comparison
Pacific Rim Property Research Journal Vol 13 No 1 83
Table 9 Coefficients of TOWER invdist and DIST
Model TOWER (Previous)
Invdist DIST1 DIST 2 DIST 3
All Suburbs Coefficients -229e-02 -368e-01 -278e-02 -291e-02 -398e-03
Value Effects -23 50m -507
100m -361
-27 -287 Insignif
1 St Albans 1994 Coefficients 148e-01 899e-01 145e-01 153e-01 144e-01
Value Effects +16 (+12) 50m +136
100m +94
+156 +165 +155
4Beckenham 2000 Coefficients -181e-01 -285e+00 -174e-01 -174e-01 -203e-01
Value Effects -1656 (-207)
97m -2513 -159 -159 -1837
3Bishopdale 1994 Coefficients -986e-02 -162e+00 -134e-01 -918e-02
Value Effects -939 (insignif)
50m -204
100m -15
-1254 -896
2 Papanui 2000 Coefficients -817e-02 -224e+00 -702e-03 -155e-01 -670e-02 Value Effects -785
(-21) 177m -155 Insignif -1436 -648
In terms of the effect that proximity to a CPBS has on price the overall results indicate that this is significant and negative Generally the closer to the CPBS a property is the greater the decrease in price However there are differences in the results between suburbs St Albans actually shows the reverse effect with prices increasing closer to the CPBS Some explanations for this are offered next In the previous study it was suggested that the difference in results between suburbs was due to the date that the towers were constructed The effect of TOWER on price was similar in the two suburbs where the towers were built in the year 2000 (Papanui and Beckenham) It was suggested that this may be due to the much greater media publicity given to CPBSs after the two legal cases in Christchurch in 1996 and 1999 respectively The other two suburbs that indicated a tower was either insignificant (Bishopdale) or increased prices by around 12 (St Albans) had towers built in them in 1994 prior to the media attention However in the current study the results for Bishopdale were similar to the other two suburbs that showed a negative effect on price even though the CPBS in Bishopdale was built in 1994 prior to the adverse publicity This result brings into question the validity of the above hypothesis Yet the explanation may still hold when considering the number of sales before and after the CPBS was built in each suburb For example in Bishopdale only 38 properties (38 of total sales for the suburb) sold after the CPBS was built compared to 68 in Papanui 1515 in Beckenham and 4468 in St Albans This low number of sales may mean that the results are not fully representative of all properties that sold in Bishopdale after the CPBS was built Another explanation for the difference in results between suburbs relates to the differences in the social structure of each neighbourhood St Albans has the highest
84 Pacific Rim Property Research Journal Vol 13 No 1
socio-economic characteristics followed by Papanui and Bishopdale Beckenham has the lowest socio-economic characteristics This pattern follows the order of value effect on sales price of the presence of a CPBS The better suburbs are less affected (+16 in St Albans and -785 in Papanui) compared to the lower socio-economic areas which have the greatest negative impact on prices from proximity to a CPBS (-939 in Bishopdale and -207 in Beckenham) As suggested earlier the better suburbs may want to be closer to the CPBS for the better cell phone coverage this affords (assuming a higher percentage of the more affluent population will use a cell phone) and so do not perceive these so negatively particularly prior to the media attention to CPBSs Conversely the CPBSs in the more affluent suburbs may be better concealed from view The expectation was that the negative effect on price of proximity to a CPBS would be greater the closer a property was to a CPBS reducing with distance from it While this was the case for two suburbs (Bishopdale and Papanui) the results were mixed and may be explained by the differences in how visible the CPBS is from each property This will be affected by topographical differences objects such as trees and buildings that may conceal it and the height and design of the CPBS itself Thus the distance variables are an imperfect measure of the effect of living near a CPBS LIMITATIONS AND AREAS FOR FURTHER STUDY The main limitation affecting this survey was in finding case study areas where CPBSs were highly visible from the majority of homes This deficit was very difficult to control for Thus caution must be used in making generalizations from the study or applying the results directly to other similar studies or valuation assignments Factors that could affect results are the style and appearance of the CPBS how visible it is to residents and the socio-economic make-up of the resident population It must be kept in mind that these results are the product of only one case study carried out in a specific area (Christchurch) at a specific time (20032004) The above results indicate that value-effects from CPBSs can vary over time as market participantrsquos perceptions change due to increased public awareness regarding the potential averse health and other effects of living near a CPBS To confirm this many similar studies of similar design to allow comparison between them need to be conducted over time and the results made public With the sharing of results from similar studies a global database could be developed to assist valuers in determining the perceived level of risk associated with CPBSs and other similar structures from geographically and socio-economically diverse areas This would aid in the valuation of property affected by these structures anywhere in the world
Pacific Rim Property Research Journal Vol 13 No 1 85
SUMMARY AND CONCLUSION This research was a refinement of a previous study that looked at the effect that the presence of a CPBS has on residential property prices (see Bond and Wang 1995) The current study looked more specifically at distance impacts by investigating how proximity to a CPBS affects the price of such properties It did this by focusing on four case study neighbourhoods in Christchurch NZ and analyzing property sales prices both before and after a CPBS was built in each suburb using multiple regression analysis within a hedonic pricing framework The results indicate that property prices decrease by around 15 after a CPBS is built This effect generally reduces with distance from the CPBS and is almost negligible after about 300 meters However this result varied between neighbourhoods with a positive impact on price being recorded in one neighbourhood possibly due to the CPBS being built before there was any negative media publicity towards CPBSs and that the CPBS is better concealed than in the other neighbourhoods REFERENCES
AGNIR (2003) Health effects from radiofrequency electromagnetic fields Report of an Advisory Group on Non-ionising Radiation Doc NRPB 14(2) 1-177 Bond SG and Wang K (2005) The Impact of Cell Phone Towers on House Prices in Residential Neighbourhoods The Appraisal Journal Volume LXXIII No3 pp256-277 Bond SG Beamish K (2005) ldquoCellular Phone Towers Perceived Impact on Residents and Property Valuesrdquo Pacific Rim Property Research Journal Vol 11 no 2 pp 158-177 Bond SG amp Hopkins J (2000)The Impact of Transmission Lines on Residential Property Values Results of a Case Study in a Suburb of Wellington New Zealand Pacific Rim Property Research Journal Vol6 No 2 pp52-60 Chen G Upham BL Wei Sun Chang C Rothwell EJ Chen K Yamasaki H and Trosko JE (2000) ldquoEffect of Electromagnetic Field Exposure on Chemically Induced Differentiation of Friend Erythroleukemia Cellsrdquo Environ Health Perspect Vol108967-972 Cherry N (2000) ldquoHealth Effects Associated with Mobil Base Stations in Communities The Need for Health Studiesrdquo Environmental Management and Design Division Lincoln University June 8 Available from httppagesbritishlibrarynetorangecherryonbasestationshtm
86 Pacific Rim Property Research Journal Vol 13 No 1
Christchurch City Council website Available from wwwcccgovtnzindexasp Colwell P (1990) ldquoPower Lines and Land Valuerdquo Journal of Real Estate Research Vol 5 No 1 Spring Colwell P Bradford C Watkins C and Leishman C (2003) ldquoEstimating the Impact of Environmental Contamination on Condo prices A hybrid repeat-salehedonic approachrdquo June European Real Estate Society Conference Helsinki Finland Court AT (1939) Hedonic Price Indexes with Automotive Examples in The Dynamics of Automobile Demand General Motors New York Des Rosiers F (2002) ldquoPower Lines Visual Encumbrance and House Values A Microspatial Approach to Impact Measurementrdquo Journal of Real Estate Research Vol23 No3 pp 275 ndash 301
Flynn J MacGregor DG Hunsperger W Mertz CK Johnson SM (2004) ldquoSurvey Approach for Demonstrating Stigma Effects in Property Value Litigationrdquo The Appraisal Journal 72 (1) 35-45 Freeman A M I (1979) The Benefits of Environmental Improvement John Hopkins Press Baltimore MD Griliches Z (ed) (1971) Price Indexes and Quality Change Harvard University Press Cambridge Mass Hamilton S and Schwann G (1995) ldquoDo High Voltage Electric Transmission Lines Affect Property Valuerdquo Land Economics Vol71 No 4 pp 436-444 Halvorsen R and Palmquist R (1980) ldquoThe Interpretation of Dummy Variables in Semi-logarithmic Equationsrdquo American Economic Review Vol 70 No 3 pp 474-475 Hardell L Mild KH Carlberg M (2003) ldquoFurther Aspects On Cellular and Cordless Telephones and Brain Tumorsrdquo International Journal of Oncology Vol22(2) pp399-407 Hite D Chern WS Hitzhusen F Randall A (2001) ldquoProperty Value Impacts of an Environmental Dis-amenityrdquo Journal of Real Estate Finance and Economics Vol2223 pp185-202 Kinnard W N Geckler M B amp Dickey S A (1994) Fear (as a measure of damages) strikes out two case studies comparisons of actual market behaviour
Pacific Rim Property Research Journal Vol 13 No 1 87
with opinion survey research Paper presented at The Tenth Annual American Real Estate Society Conference April Santa Barbara California KinnardJrWN DeLoittie JW Geckler MB Noble BH (1995) rdquoThe Impact of Widespread Long-term Soil Contamination on Residential Property Values A Case Studyrdquo Paper presented at the American Real Estate Society Conference Hilton Head South Carolina Michelozzi P Capon A Kirchmayer U Forastiere F Biggeri A Barca A amp Perucci CA (2002) ldquoAdult and Childhood Leukemia near a High-Power Radio Station in Rome Italyrdquo American Journal of Epidemiology Vol155 pp1096-1103 McCluskey JJ amp Rausser G C (2000) ldquoStigmatized Asset Values Is it Temporary or Permanentrdquo Research paper Department of Agricultural Economics Washington State University WA Moulder JE Foster KE Erdreich LS amp McNamee JP (2005) ldquoMobile Phones Mobile Phone Base Stations and Cancer A Reviewrdquo International Journal of Radiation Biology Vol 81 pp189-203 Reichert AJ (1997)rdquo Impact of a Toxic Waste Superfund Site on Property Valuesrdquo The Appraisal Journal Vol 65 pp 381-392 Rosen S (1974) ldquoHedonic Prices and Implicit Markets Product Differentiation in Pure Competitionrdquo Journal of Political Economy Vol 82 pp 34-55
Siemens H (2003) ldquoStigma of Contaminated Land Difficult to Tacklerdquo The Appraisal Journal Vol 71 pp121-127 Simons RA Winson-Geideman K and Mikelbank B (2001) ldquoThe Effects of an Oil Pipeline Rupture on Single-Family House Prices Along the Patuxent River in Marylandrdquo Paper presented at The American Real Estate Society conference April Coeur dAlene Idaho Slovic P (1992) ldquoPerceptions of risk Reflections on the psychometric paradigmrdquo in Social Theories of Risk eds S Krimsky amp D Golding Praeger Westport Connecticut pp 117-152 Strand J and Vagnes M (2001) ldquoThe Relationship Between Property Values and Railroad Proximity A Study Based on Hedonic Prices and Real Estate Brokersrsquo Appraisalsrdquo Transportation Vol 28 pp 137
88 Pacific Rim Property Research Journal Vol 13 No 1
Szmigielski S and Sobiczewska E (2000) ldquoCellular Phone Systems and Human Health ndash Problems with Risk Perception and Communicationrdquo Environmental Management and Health Vol 11 pp 352-368
Pacific Rim Property Research Journal Vol 13 No 1 89
Appendix Indash Regression Model with ldquoTOWERrdquo
Variable Estimate Std Error t value Pr(gt|t|) (Intercept) 860e+00 140e-01 6124 00000
CATGYX2D 666e-02 254e-02 262 000882 CATGYX2F -701e-02 265e-02 -264 000826 CATGYX2R 795e-02 415e-02 192 005546
CATGYX4B -141e-01 741e-03 -1907 00000
CATGYX4C -188e-01 186e-02 -1009 00000 NEWAGE -422e-03 111e-04 -3795 00000
log(LANDAX) 101e-01 642e-03 1573 00000 log(MATFAX) 632e-01 850e-03 7438 00000
SLDATX1 242e-05 174e-06 1388 00000
WALLCNXB 504e-02 286e-02 176 007768 WALLCNXC 205e-02 286e-02 072 047301
WALLCNXF -354e-02 318e-02 -111 026636
WALLCNXG 175e-01 126e-01 139 016527 WALLCNXI 247e-01 827e-02 299 000280 WALLCNXO 470e-02 832e-02 056 057268 WALLCNXP -194e-02 372e-02 -052 060233 WALLCNXR 251e-02 288e-02 087 038365 WALLCNXS 503e-02 339e-02 149 013752 WALLCNXW 460e-02 285e-02 161 010658 WALLCNXX 778e-03 300e-02 026 079553 ROOFCNXI 463e-01 124e-01 374 00000
ROOFCNXO 368e-01 124e-01 296 000311
ROOFCNXT 426e-01 124e-01 344 00000 SUBURBAvonhe -261e-01 107e-02 -2426 00000
SUBURBBromle -594e-01 113e-02 -5232 00000 SUBURBBeckenham -405e-01 909e-03 -4456 00000
SUBURBBishop -366e-01 107e-02 -3432 00000 SUBURBIlam -165e-01 118e-02 -1394 00000
SUBURBPapanui -437e-01 994e-03 -4401 00000
SUBURBLinwoo -605e-01 108e-02 -5580 00000
SUBURBUpRic -209e-01 107e-02 -1952 00000
SUBURBSpreyd -454e-01 105e-02 -4305 00000
TOWER -229e-02 872e-03 -262 000880
Signif codes 0 ` 0001 ` 001 ` 005 ` 01 ` 1 Residual standard error 0173 on 8659 degrees of freedom Multiple R-Squared 0835 Adjusted R-squared 0834 F-statistic 133e+03 on 33 and 8659 DF p-value lt2e-16
90 Pacific Rim Property Research Journal Vol 13 No 1
Appendix II ndash Regression Model with ldquoinvdistrdquo
Variable Estimate Std Error t value Pr(gt|t|) (Intercept) 865e+00 142e-01 6106 00000
CATGYX2D 640e-02 257e-02 249 001268 CATGYX2F -749e-02 268e-02 -280 000517 CATGYX2R 832e-02 419e-02 199 004687 CATGYX4B -145e-01 746e-03 -1946 00000
CATGYX4C -202e-01 187e-02 -1079 00000 NEWAGE -419e-03 112e-04 -3738 00000
log(LANDAX) 101e-01 646e-03 1560 00000
log(MATFAX) 624e-01 852e-03 7323 00000 SLDATX1 241e-05 170e-06 1417 00000
WALLCNXB 519e-02 288e-02 180 007216 WALLCNXC 219e-02 288e-02 076 044817 WALLCNXF -339e-02 321e-02 -106 029112 WALLCNXG 178e-01 128e-01 140 016180 WALLCNXI 113e-02 772e-02 015 088380 WALLCNXO 483e-02 840e-02 058 056530 WALLCNXP -105e-02 376e-02 -028 078084 WALLCNXR 246e-02 291e-02 084 039849 WALLCNXS 520e-02 342e-02 152 012774 WALLCNXW 468e-02 288e-02 163 010371 WALLCNXX 103e-02 303e-02 034 073478 ROOFCNXI 454e-01 125e-01 364 00000 ROOFCNXO 359e-01 126e-01 286 000425 ROOFCNXT 418e-01 125e-01 334 00000
SUBURBAvonhe -258e-01 104e-02 -2485 00000 SUBURBBromle -591e-01 110e-02 -5387 00000
SUBURBBeckenham -404e-01 884e-03 -4568 00000
SUBURBBishop -364e-01 103e-02 -3521 00000 SUBURBIlam -161e-01 115e-02 -1401 00000
SUBURBPapanui -436e-01 968e-03 -4498 00000 SUBURBLinwoo -605e-01 105e-02 -5774 00000 SUBURBUpRic -205e-01 103e-02 -1988 00000 SUBURBSpreyd -451e-01 101e-02 -4446 00000
invdist -368e-01 139e-01 -264 000821 Signif codes 0 ` 0001 ` 001 ` 005 ` 01 ` 1 Residual standard error 0175 on 8662 degrees of freedom Multiple R-Squared 0832 Adjusted R-squared 0832 F-statistic 13e+03 on 33 and 8662 DF p-value lt2e-16
Pacific Rim Property Research Journal Vol 13 No 1 91
Appendix III ndash Regression Model with ldquoDISTrdquo
Variable Estimate Std Error t values Pr(gt|t|) (Intercept) 861e+00 140e-01 6129 00000
CATGYX2D 668e-02 254e-02 263 000865 CATGYX2F -695e-02 265e-02 -262 000882 CATGYX2R 767e-02 415e-02 185 006470 CATGYX4B -141e-01 741e-03 -1905 00000 CATGYX4C -188e-01 186e-02 -1010 00000
NEWAGE -423e-03 111e-04 -3805 00000 log(LANDAX) 100e-01 642e-03 1561 00000 log(MATFAX) 632e-01 849e-03 7436 00000
SLDATX1 240e-05 174e-06 1377 00000 WALLCNXB 466e-02 286e-02 163 010266 WALLCNXC 167e-02 286e-02 058 056016 WALLCNXF -398e-02 318e-02 -125 021109 WALLCNXG 173e-01 126e-01 137 017016 WALLCNXI 252e-01 827e-02 305 000233 WALLCNXO 488e-02 832e-02 059 055760 WALLCNXP -186e-02 375e-02 -050 062047 WALLCNXR 210e-02 288e-02 073 046684 WALLCNXS 448e-02 339e-02 132 018606 WALLCNXW 432e-02 285e-02 152 012979 WALLCNXX 534e-03 300e-02 018 085876 ROOFCNXI 462e-01 124e-01 373 00000 ROOFCNXO 367e-01 124e-01 295 000323 ROOFCNXT 425e-01 124e-01 344 00000
SUBURBAvonhe -259e-01 108e-02 -2412 00000
SUBURBBromle -593e-01 114e-02 -5221 00000 SUBURBBeckenham -402e-01 912e-03 -4411 00000
SUBURBBishop -363e-01 107e-02 -3398 00000 SUBURBIlam -164e-01 118e-02 -1384 00000
SUBURBPapanui -437e-01 995e-03 -4390 00000 SUBURBLinwoo -604e-01 109e-02 -5565 00000 SUBURBUpRic -208e-01 107e-02 -1942 00000 SUBURBSpreyd -452e-01 105e-02 -4288 00000
DIST1 -278e-02 120e-02 -232 002030 DIST2 -291e-02 106e-02 -273 000630 DIST3 -398e-03 115e-02 -035 073008
Signif codes 0 ` 0001 ` 001 ` 005 ` 01 ` 1 Residual standard error 0173 on 8657 degrees of freedom Multiple R-Squared 0835 Adjusted R-squared 0835 F-statistic 125e+03 on 35 and 8657 DF p-values lt2e-16
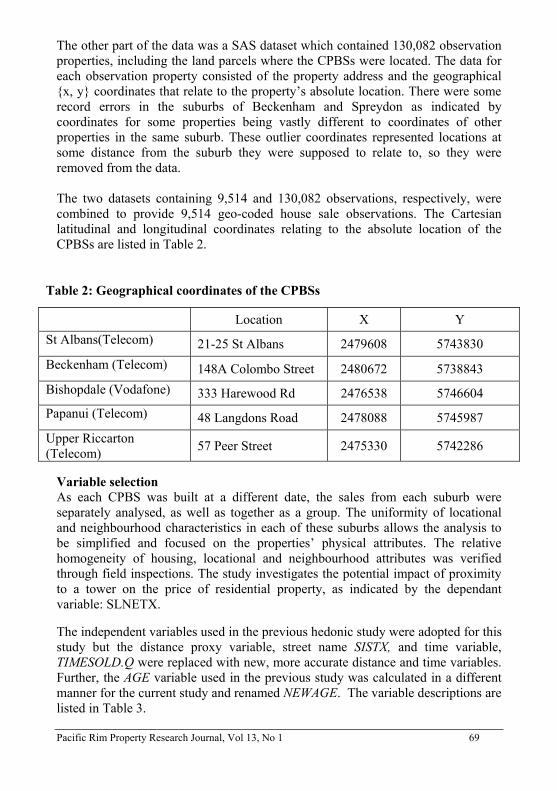
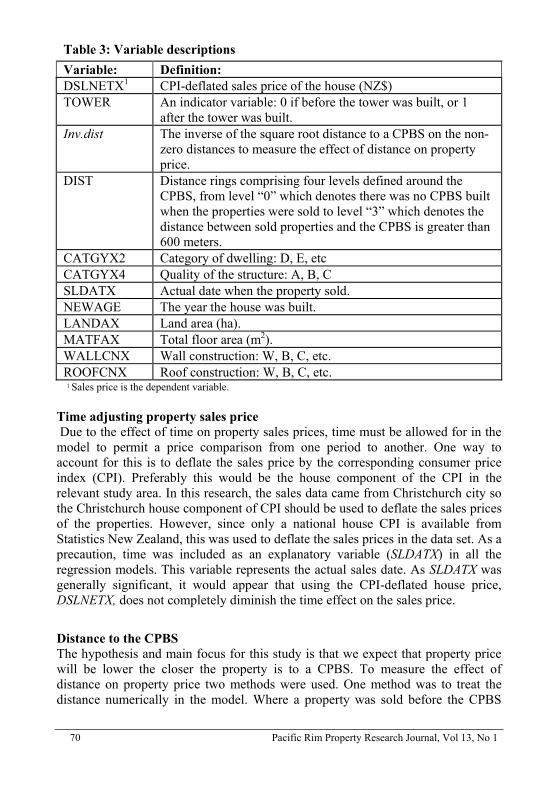
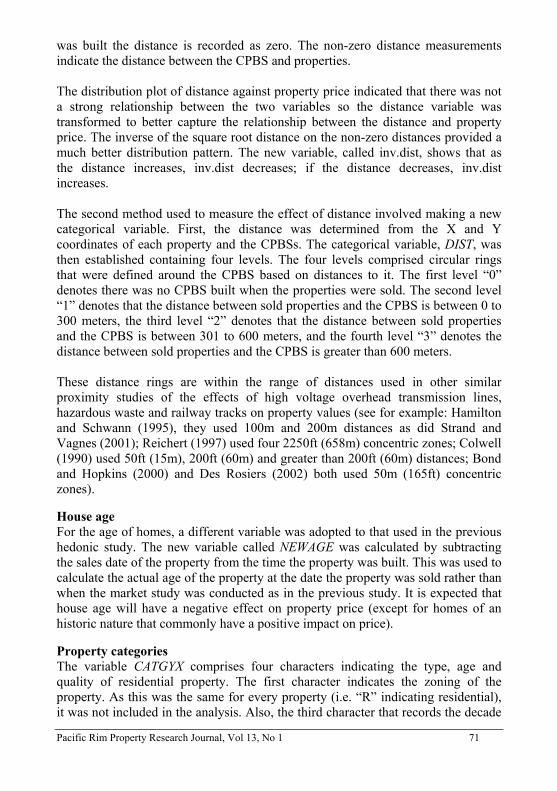
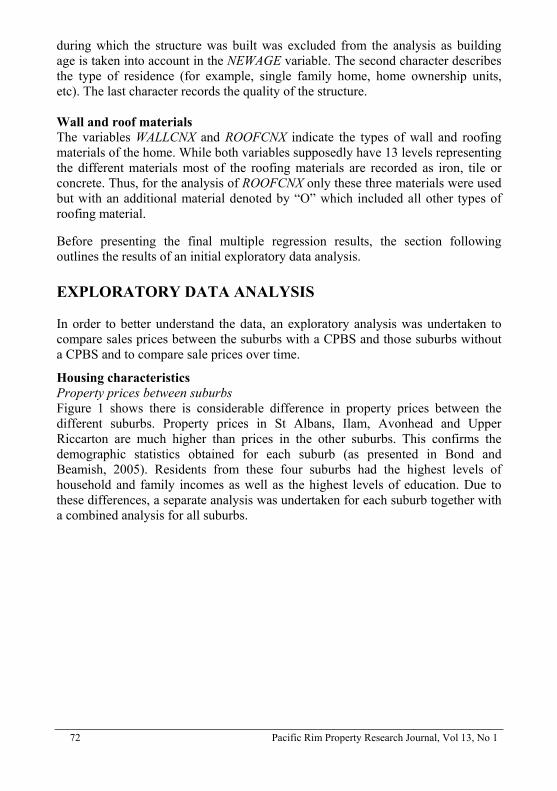
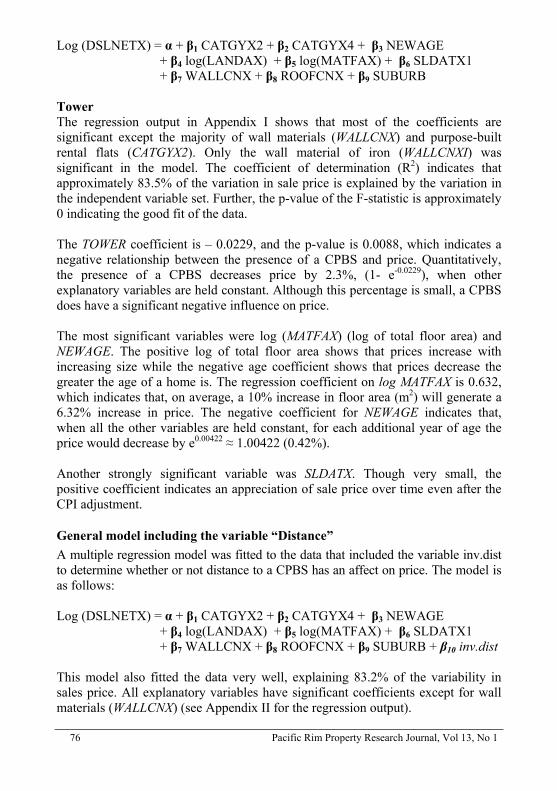
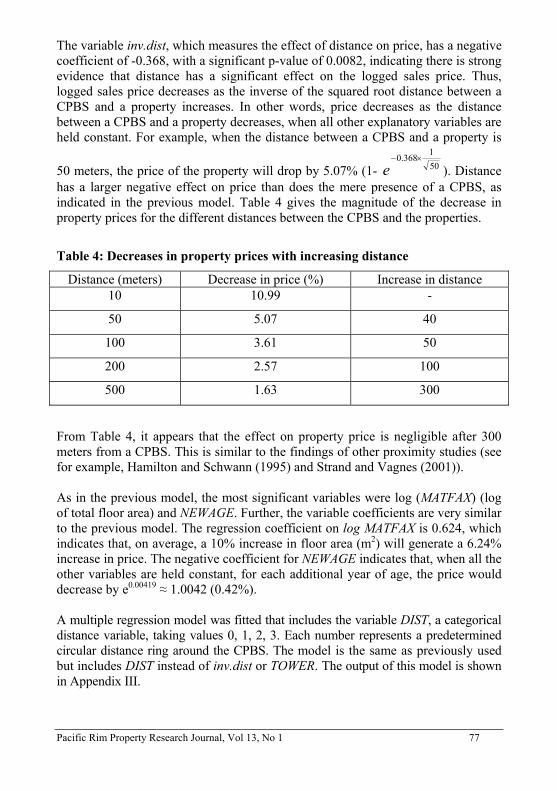
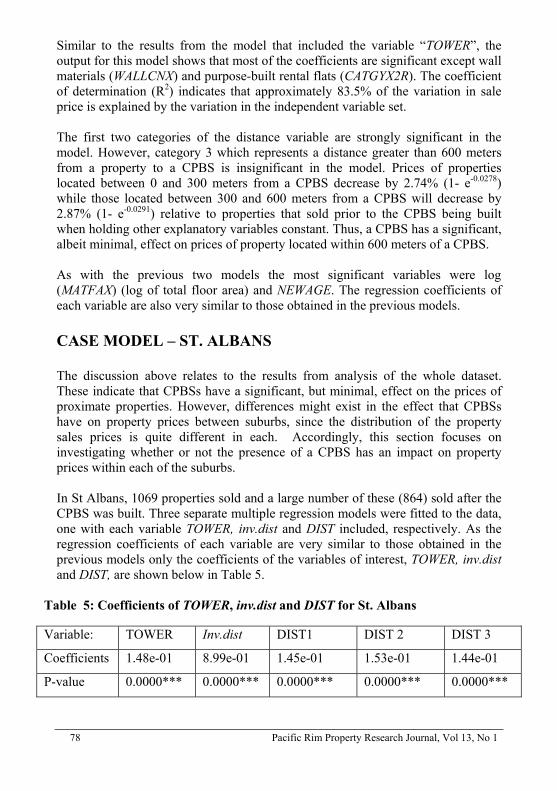
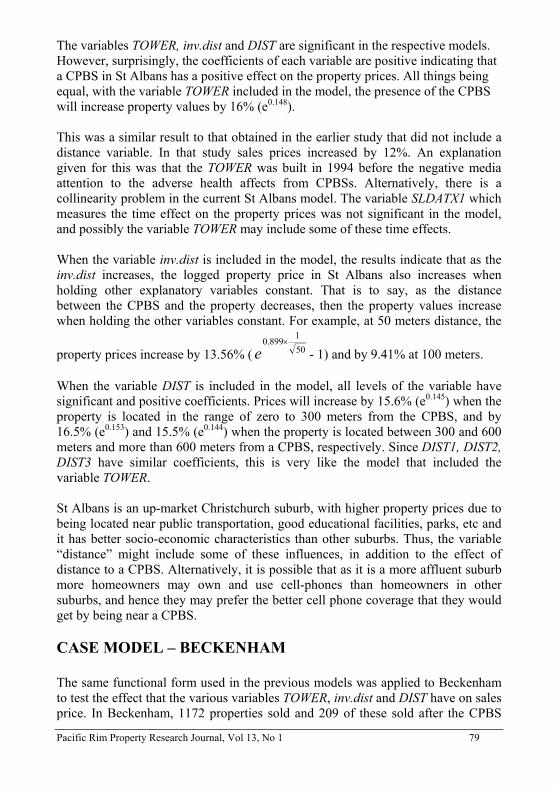
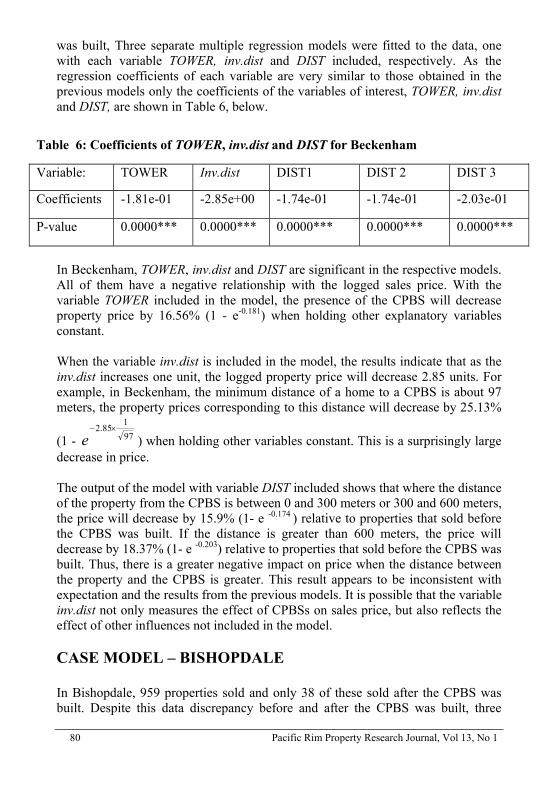
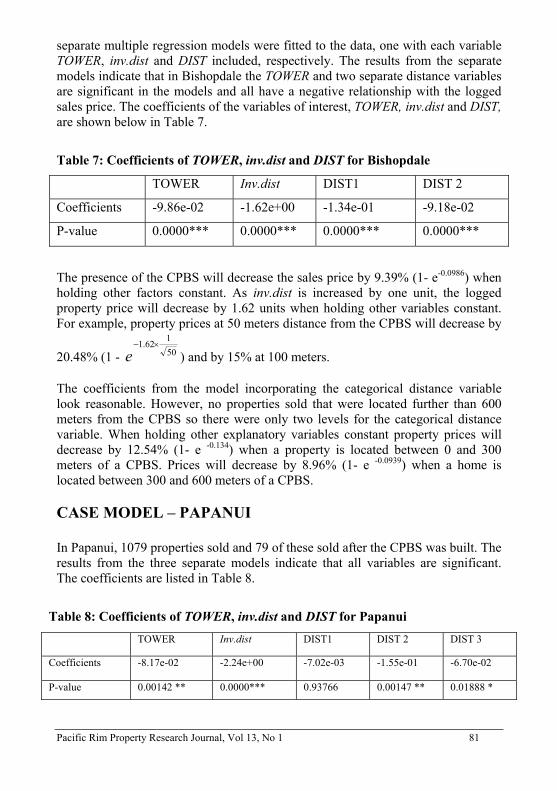
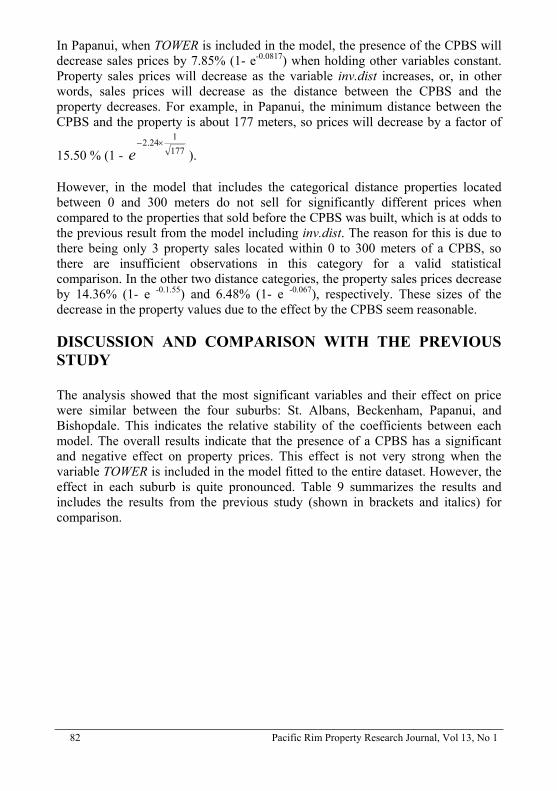
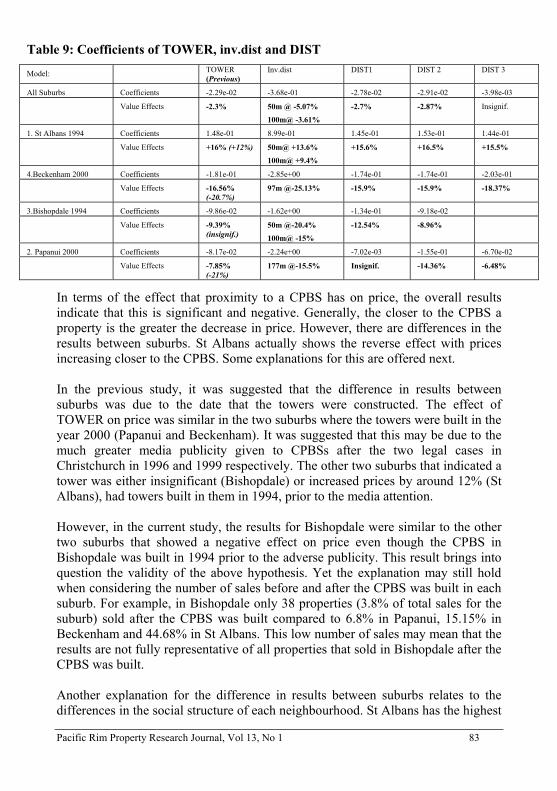
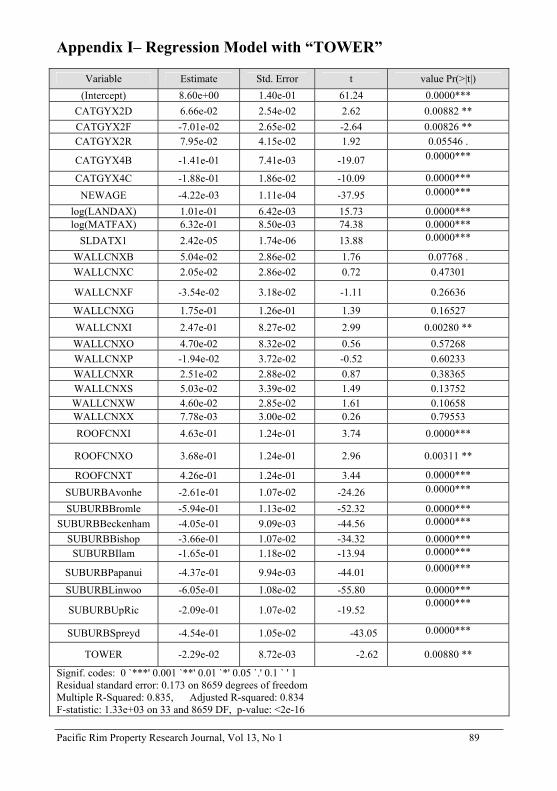
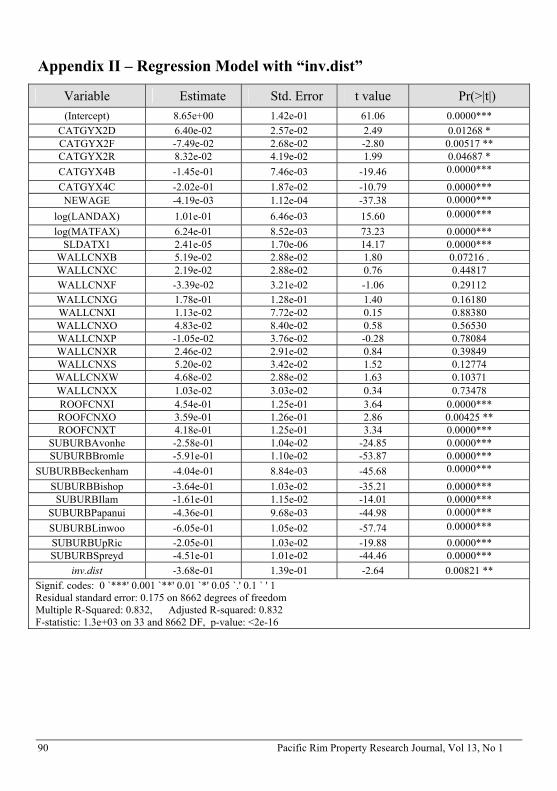
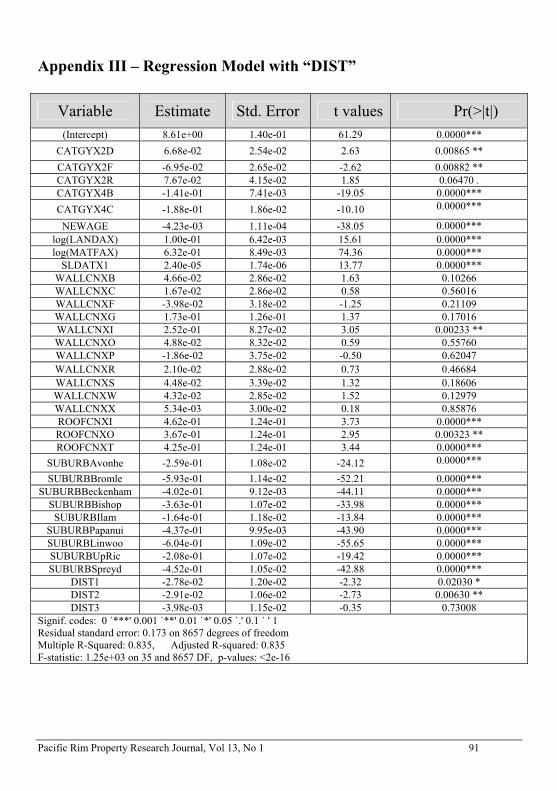