cell phone use nc 2002
TRANSCRIPT
Cell Phone Use While Driving in North Carolina:2002 Update Report
Final Project Report to theNorth Carolina Governor’s Highway Safety Program
Prepared by
Jane C. StuttsHerman F. Huang
William W. Hunter
The University of North CarolinaHighway Safety Research Center
Chapel Hill, NC
December 2002
ii
Acknowledgements
The authors wish to express their appreciation to Brad Martin and Steve Wakefield withJohnston, Zabor, McManus, Inc. for their expert guidance and management of the telephonesurvey, and to Mike Goodman and Paul Tremont at NHTSA for their helpful suggestionsregarding the questionnaire. Thanks also are due Eric Rodgman at HSRC, who assisted with theidentification and linkage of cell phone crashes to police crash reports and subsequent dataanalysis.
This study was supported by the North Carolina Governor’s Highway Safety Program(GHSP), to whom the authors are much indebted. The opinions, findings, and recommendationscontained herein are those of the authors, and do not necessarily represent those of the GHSP.

iii
TECHNICAL SUMMARY
As a follow-on to an earlier study funded by the North Carolina Governor’s Highway SafetyProgram, the current study was carried out to further understanding regarding the safetyimplications of cellular telephone use while driving. The study involved three separate tasks: (1)a statewide telephone survey to gather information on cell phone use and user characteristics,along with drivers’ opinions regarding the safety and potential regulation of cell phone use whiledriving; (2) an analysis of the characteristics of cell phone-related crashes, based on 452 cellphone crashes identified from an earlier computerized narrative search of N.C. crash data; and(3) a supplementary data collection activity by the North Carolina State Highway Patrol toidentify and report cell phone-related crashes occurring statewide over a two-month period.
The statewide telephone survey was conducted during the early summer of 2002 andtargeted 500 users and 150 non-users of cell phones. All participants were licensed NorthCarolina drivers ages 18 and older. Key findings from the survey include the following:
- An estimated 58.8 percent of the state’s licensed drivers have used a cell phone whiledriving.
- Cell phone use levels were highest among drivers in the 25-39 and 40-54 year agecategories. Other demographic characteristics, including driver gender, race, and vehicletype, did not differ significantly for users versus non-users, although a higher proportion ofusers than non-users drove sport utility vehicles.
- The average reported time per day spent talking on a cell phone while driving was 14.5minutes; while the median reported time was much lower at 5.0 minutes. Talk timedecreased with increasing age, and was higher for males than for females.
- One in four users reported having a hands-free device, although they did not always use thedevice when talking on their cell phones.
- Users generally perceived talking on cell phones while driving to be less distracting andless of a safety concern than did non-users. Users were also less likely than non-users tosupport legislation that would prohibit anything other than hand-held phone use, and wereless likely to support stricter penalties for cell phone users involved in crashes.
To examine the characteristics of cell phone-related crashes, a computerized narrativesearch of all reported crashes occurring in the state from January 1, 1996 through August 31,2000 resulted in the identification of 452 cell phone-related crashes. The characteristics of thesecrashes were compared with the nearly 1.1 million non-cell phone crashes occurring in the stateduring the same time period. Results showed that:
- Cell phone crashes were less likely than non-cell phone crashes to result in serious or fatalinjury. They were nearly twice as likely to involve rear-end collisions (45.1% versus
iv
25.6%), but involved approximately equal proportions of ran-off-road and angle collisions.
- Cell phone crashes were somewhat more likely to occur during the mid-day or afternoonhours. They were also more likely to occur in urban areas, on local streets, and at roadwaylocations with “no special feature.” They were not found to be overrepresented atintersection locations.
- Compared to non-users, drivers who were using their cell phone at the time of their crashwere more likely to be male, under the age of 55, and driving a sport utility vehicle. Thevast majority were at least partially responsible for their crash, based on information notedunder the “driver violation” variable of the crash report form.
- The most commonly identified driver violations for cell phone users involved in crasheswere failure to reduce speed (23.5%), traffic signal violation (9.6%), speeding (4.9%),following too closely (3.5%), and failure to yield (3.5%).
Finally, results of the special two-month data collection activity by the North Carolina StateHighway Patrol revealed the following:
- Of the 29 identified cases, all but one involved a hand-held cell phone.
- The largest number of reported crashes involved simply talking or listening on the cellphone. Smaller numbers involving reaching for the phone, dialing or preparing to dial thephone, and answering the phone. However, a range of other activities was also identified,including retrieving a phone, picking up a dropped phone, looking down at the phone,hanging up the phone, and checking messages.
- Based on the reported cases, it was estimated that cellular telephones are involved in atleast 0.16 percent of crashes occurring in non-metropolitan areas of the state, or about onein 623 reported crashes. This is almost identical to the estimate generated from the pilotdata collection activity carried out the previous year, and reported in Reinfurt et al., 2001.
For the special two-month data collection activity, the total of 29 reported cell phonecrashes projects to 174 crashes annually. From the analysis of cell phone-related crashesreported in Chapter 3, it was shown that 90.6 percent of the crashes occurred within municipalboundaries. The vast majority of these crashes would have been reported by municipal police,rather than State Highway Patrol troopers. In fact, only an estimated 11.8 percent of the crashesidentified from the 1996-2000 narrative search were reported by the Highway Patrol. Thus, thetotal number of cell phone-related crashes projected for the state would be 174 ÷ .118, or 1,475crashes annually.
v
TABLE OF CONTENTS
TECHNICAL SUMMARY . . . . . . . . . . . . . . . . . . . . . . . . . . . . . . . . . . . . . . . . . . . . . . . . . . . . . iii
LIST OF TABLES . . . . . . . . . . . . . . . . . . . . . . . . . . . . . . . . . . . . . . . . . . . . . . . . . . . . . . . . . . . vii
LIST OF FIGURES . . . . . . . . . . . . . . . . . . . . . . . . . . . . . . . . . . . . . . . . . . . . . . . . . . . . . . . . . . viii
CHAPTER 1. INTRODUCTION . . . . . . . . . . . . . . . . . . . . . . . . . . . . . . . . . . . . . . . . . . . . . . . . . 1
CHAPTER 2. CELL PHONE USE WHILE DRIVING: RESULTS OF A STATEWIDE SURVEY . . . . . . . . . . . . . . . . . . . . . . . . . . . . . 3
Background . . . . . . . . . . . . . . . . . . . . . . . . . . . . . . . . . . . . . . . . . . . . . . . . . . . . . . . . . . . . . . . 3Methods . . . . . . . . . . . . . . . . . . . . . . . . . . . . . . . . . . . . . . . . . . . . . . . . . . . . . . . . . . . . . . . . . . 5Results . . . . . . . . . . . . . . . . . . . . . . . . . . . . . . . . . . . . . . . . . . . . . . . . . . . . . . . . . . . . . . . . . . . 6
Screener Results . . . . . . . . . . . . . . . . . . . . . . . . . . . . . . . . . . . . . . . . . . . . . . . . . . . . . . . . . 6Characteristics of Cell Phone Users and Non-users . . . . . . . . . . . . . . . . . . . . . . . . . . . . . 7Cell Phone Use Patters . . . . . . . . . . . . . . . . . . . . . . . . . . . . . . . . . . . . . . . . . . . . . . . . . . . . 7Opinions on Cell Phone Safety and Regulation . . . . . . . . . . . . . . . . . . . . . . . . . . . . . . . . 12
Discussion . . . . . . . . . . . . . . . . . . . . . . . . . . . . . . . . . . . . . . . . . . . . . . . . . . . . . . . . . . . . . . . 15References . . . . . . . . . . . . . . . . . . . . . . . . . . . . . . . . . . . . . . . . . . . . . . . . . . . . . . . . . . . . . . . 17
CHAPTER 3. THE CHARACTERISTICS OF CELL PHONE-RELATED MOTOR VEHICLE CRASHES IN NORTH CAROLINA . . . . . . . . . . . . . . . . 21
Background . . . . . . . . . . . . . . . . . . . . . . . . . . . . . . . . . . . . . . . . . . . . . . . . . . . . . . . . . . . . . . 21Methods . . . . . . . . . . . . . . . . . . . . . . . . . . . . . . . . . . . . . . . . . . . . . . . . . . . . . . . . . . . . . . . . . 22
Data Collection . . . . . . . . . . . . . . . . . . . . . . . . . . . . . . . . . . . . . . . . . . . . . . . . . . . . . . . . 22Data Analysis . . . . . . . . . . . . . . . . . . . . . . . . . . . . . . . . . . . . . . . . . . . . . . . . . . . . . . . . . . 24
Results . . . . . . . . . . . . . . . . . . . . . . . . . . . . . . . . . . . . . . . . . . . . . . . . . . . . . . . . . . . . . . . . . . 24Crash Severity . . . . . . . . . . . . . . . . . . . . . . . . . . . . . . . . . . . . . . . . . . . . . . . . . . . . . . . . . 25Crash Type . . . . . . . . . . . . . . . . . . . . . . . . . . . . . . . . . . . . . . . . . . . . . . . . . . . . . . . . . . . . 26Time of Day . . . . . . . . . . . . . . . . . . . . . . . . . . . . . . . . . . . . . . . . . . . . . . . . . . . . . . . . . . . 27Urban and Rural . . . . . . . . . . . . . . . . . . . . . . . . . . . . . . . . . . . . . . . . . . . . . . . . . . . . . . . . 27Road Class . . . . . . . . . . . . . . . . . . . . . . . . . . . . . . . . . . . . . . . . . . . . . . . . . . . . . . . . . . . . 28Road Feature . . . . . . . . . . . . . . . . . . . . . . . . . . . . . . . . . . . . . . . . . . . . . . . . . . . . . . . . . . 28Driver Gender . . . . . . . . . . . . . . . . . . . . . . . . . . . . . . . . . . . . . . . . . . . . . . . . . . . . . . . . . 29Driver Age . . . . . . . . . . . . . . . . . . . . . . . . . . . . . . . . . . . . . . . . . . . . . . . . . . . . . . . . . . . . 30Driver Violation . . . . . . . . . . . . . . . . . . . . . . . . . . . . . . . . . . . . . . . . . . . . . . . . . . . . . . . . 30Vehicle Type . . . . . . . . . . . . . . . . . . . . . . . . . . . . . . . . . . . . . . . . . . . . . . . . . . . . . . . . . . 31Vehicle Maneuver . . . . . . . . . . . . . . . . . . . . . . . . . . . . . . . . . . . . . . . . . . . . . . . . . . . . . . 32
Discussion . . . . . . . . . . . . . . . . . . . . . . . . . . . . . . . . . . . . . . . . . . . . . . . . . . . . . . . . . . . . . . . 32
vi
References . . . . . . . . . . . . . . . . . . . . . . . . . . . . . . . . . . . . . . . . . . . . . . . . . . . . . . . . . . . . . . . 35
CHAPTER 4. CELL PHONE USE REPORTED BY THE NORTH CAROLINA STATE HIGHWAY PATROL . . . . . . . . . . . . . . . . . . . . . . . . . . . . . . . . . . . . . . 37
Background and Methods . . . . . . . . . . . . . . . . . . . . . . . . . . . . . . . . . . . . . . . . . . . . . . . . . . . 37Results and Discussion . . . . . . . . . . . . . . . . . . . . . . . . . . . . . . . . . . . . . . . . . . . . . . . . . . . . . 39
Type of Phone . . . . . . . . . . . . . . . . . . . . . . . . . . . . . . . . . . . . . . . . . . . . . . . . . . . . . . . . . 39Driver Action . . . . . . . . . . . . . . . . . . . . . . . . . . . . . . . . . . . . . . . . . . . . . . . . . . . . . . . . . . 39Significance of Cell Phone in Causing Crash . . . . . . . . . . . . . . . . . . . . . . . . . . . . . . . . . 44Information Sources . . . . . . . . . . . . . . . . . . . . . . . . . . . . . . . . . . . . . . . . . . . . . . . . . . . . . 44Driver Contributing Factor . . . . . . . . . . . . . . . . . . . . . . . . . . . . . . . . . . . . . . . . . . . . . . . 44Crash Type . . . . . . . . . . . . . . . . . . . . . . . . . . . . . . . . . . . . . . . . . . . . . . . . . . . . . . . . . . . . 44Mention of Cell Phone in Narrative . . . . . . . . . . . . . . . . . . . . . . . . . . . . . . . . . . . . . . . . . 45
CHAPTER 5. SUMMARY AND CONCLUSIONS . . . . . . . . . . . . . . . . . . . . . . . . . . . . . . . . . 47
APPENDIX. Telephone Survey on Cell Phone Use and Driving . . . . . . . . . . . . . . . . . . . . . . . 50
vii
LIST OF TABLES
Table 2.1. Age distribution of cell phone users and non-users completing the survey screener and comparison to all N.C. licensed drivers . . . . . . . . . . . . . . . . . . . . . . . . . 6
Table 2.2. Characteristics of cell phone users and non-users participating in the telephone survey . . . . . . . . . . . . . . . . . . . . . . . . . . . . . . . . . . . . . . . . . . . . . . . . 8
Table 2.3. Cell phone use characteristics (n=500 cell phone users) . . . . . . . . . . . . . . . . . . . . . . . 9
Table 2.4. Opinions on level of distraction of various activities while driving . . . . . . . . . . . . . 13
Table 2.5. Extent agree with statements regarding cell phone safety while driving . . . . . . . . . 14
Table 2.6. Support for possible legislation with regard to cell phone use while driving . . . . . . 15
Table 3.1. Narrative-indicated cell phone crashes in North Carolina by year and by driver action . . . . . . . . . . . . . . . . . . . . . . . . . . . . . . . . . . . . . . . . . . . . . . . . . . 23
Table 4.1 Cell phone crashes and total crashes reported by the NC State Highway Patrol, May 15 - July 14, 2002 . . . . . . . . . . . . . . . . . . . . . . . . . . . . . . . . . 39
Table 4.2. Summary of crashes reported by North Carolina State Highway Patrol . . . . . . . . . . 40
viii
LIST OF FIGURES
Figure 2.1. Percent of respondents to screener reporting using a cell phone while driving . . . . . 7
Figure 3.1. Crash severity by cell phone use . . . . . . . . . . . . . . . . . . . . . . . . . . . . . . . . . . . . . . . 25
Figure 3.2. Crash type by cell phone use . . . . . . . . . . . . . . . . . . . . . . . . . . . . . . . . . . . . . . . . . . 26
Figure 3.3. Time of day by cell phone use . . . . . . . . . . . . . . . . . . . . . . . . . . . . . . . . . . . . . . . . . 27
Figure 3.4. Road class by cell phone use . . . . . . . . . . . . . . . . . . . . . . . . . . . . . . . . . . . . . . . . . . 28
Figure 3.5. Road feature by cell phone use . . . . . . . . . . . . . . . . . . . . . . . . . . . . . . . . . . . . . . . . . 29
Figure 3.6. Driver age by cell phone use . . . . . . . . . . . . . . . . . . . . . . . . . . . . . . . . . . . . . . . . . . 30
Figure 3.7. Driver violation by cell phone use . . . . . . . . . . . . . . . . . . . . . . . . . . . . . . . . . . . . . . 31
Figure 3.8. Vehicle type by cell phone use . . . . . . . . . . . . . . . . . . . . . . . . . . . . . . . . . . . . . . . . . 32
Figure 3.9. Vehicle maneuver by cell phone use . . . . . . . . . . . . . . . . . . . . . . . . . . . . . . . . . . . . 33
Figure 4.1. North Carolina State Highway Patrol Troops . . . . . . . . . . . . . . . . . . . . . . . . . . . . . 37
Figure 4.2. Supplemental data collection form used by NC State Highway Patrol . . . . . . . . . . 38
1 Reinfurt, D. W., Huang, H. F., Feaganes, J. R. and Hunter, W. W. Cell Phone UseWhile Driving in North Carolina. Highway Safety Research Center, University of NorthCarolina - Chapel Hill, November 2001. Available on the web at: http://www.hsrc.unc.edu/pdf/2001/cellphone.pdf .
1
Chapter 1. Introduction
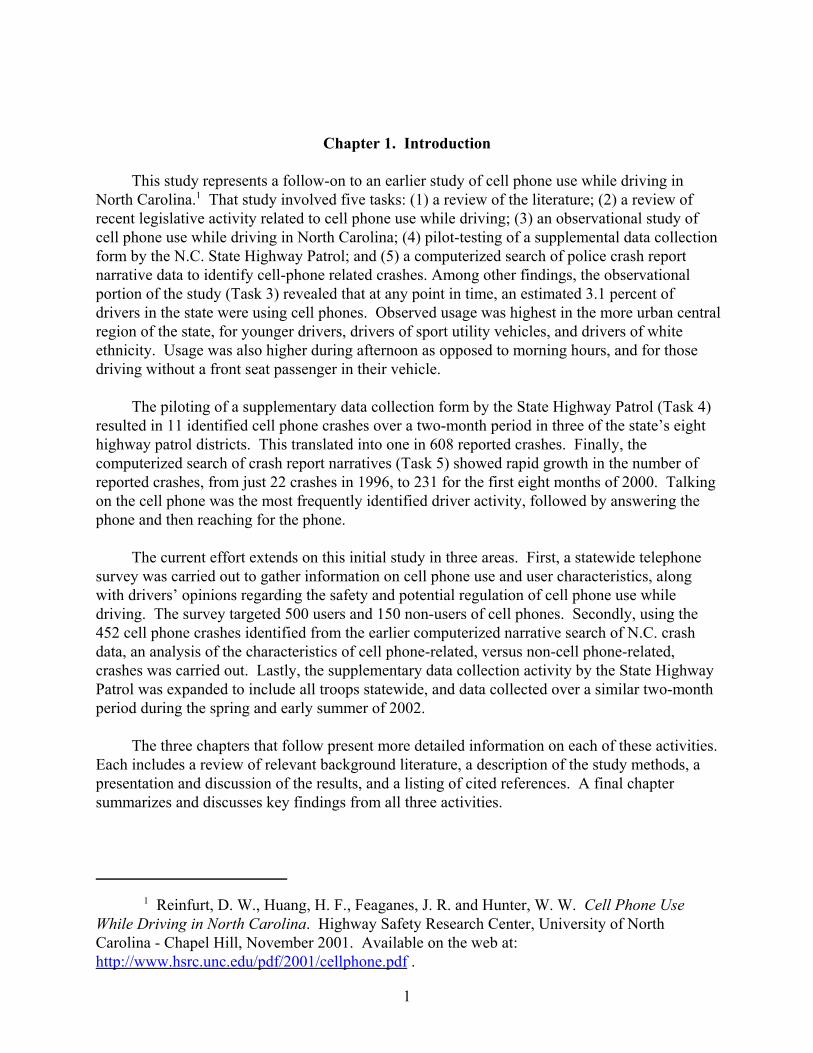
This study represents a follow-on to an earlier study of cell phone use while driving inNorth Carolina.1 That study involved five tasks: (1) a review of the literature; (2) a review ofrecent legislative activity related to cell phone use while driving; (3) an observational study ofcell phone use while driving in North Carolina; (4) pilot-testing of a supplemental data collectionform by the N.C. State Highway Patrol; and (5) a computerized search of police crash reportnarrative data to identify cell-phone related crashes. Among other findings, the observationalportion of the study (Task 3) revealed that at any point in time, an estimated 3.1 percent ofdrivers in the state were using cell phones. Observed usage was highest in the more urban centralregion of the state, for younger drivers, drivers of sport utility vehicles, and drivers of whiteethnicity. Usage was also higher during afternoon as opposed to morning hours, and for thosedriving without a front seat passenger in their vehicle.
The piloting of a supplementary data collection form by the State Highway Patrol (Task 4)resulted in 11 identified cell phone crashes over a two-month period in three of the state’s eighthighway patrol districts. This translated into one in 608 reported crashes. Finally, thecomputerized search of crash report narratives (Task 5) showed rapid growth in the number ofreported crashes, from just 22 crashes in 1996, to 231 for the first eight months of 2000. Talkingon the cell phone was the most frequently identified driver activity, followed by answering thephone and then reaching for the phone.
The current effort extends on this initial study in three areas. First, a statewide telephonesurvey was carried out to gather information on cell phone use and user characteristics, alongwith drivers’ opinions regarding the safety and potential regulation of cell phone use whiledriving. The survey targeted 500 users and 150 non-users of cell phones. Secondly, using the452 cell phone crashes identified from the earlier computerized narrative search of N.C. crashdata, an analysis of the characteristics of cell phone-related, versus non-cell phone-related,crashes was carried out. Lastly, the supplementary data collection activity by the State HighwayPatrol was expanded to include all troops statewide, and data collected over a similar two-monthperiod during the spring and early summer of 2002.
The three chapters that follow present more detailed information on each of these activities. Each includes a review of relevant background literature, a description of the study methods, apresentation and discussion of the results, and a listing of cited references. A final chaptersummarizes and discusses key findings from all three activities.

2
3
Chapter 2. Cell Phone Use While Driving: Results of a Statewide Survey
(Adapted from a paper prepared for presentation at the Annual Meeting of theTransportation Research Board, Washington, D.C., January 2003)
Background
The number of cell or mobile phone users in the United States has grown from fewer than100,000 in January, 1985 to an estimated 137 million in July, 2002 (1). With the explosion inownership has come increased use of cell phones while driving. Data collected by the NationalHighway Traffic Safety Administration (NHTSA) as part of its Fall 2000 National OccupantProtection Use Survey revealed that an estimated 3.9% of passenger car drivers are using cellphones at any time while driving (2).
Use of cell phones while driving raises safety concerns. A varied and growing body ofliterature provides convincing evidence that cell phone use while driving leads to poorer drivingperformance and increased risk of crash involvement (3-7). Studies have been conducted usingdriving simulators (8-11), instrumented vehicles on the road (12), case-control and otherepidemiological study designs (13-15), and analyses of national and state motor vehicle crashdata (7). Even though there is general consensus that talking on cell phones while driving posessafety risks, there is no consensus on the magnitude of these risks and on the best approaches forlowering them. Some favor strict regulation at the state or local level, even including a total banon cell phone use while driving; others argue that more consumer education, focused not only oncell phone use but on all activities shown to distract drivers, is sufficient to allay safety concerns.
All parties agree on the need for more and better data to clarify the risks associated withuse of cell phones while driving and the specific parameters influencing this risk. One topic thathas drawn considerable attention is the extent to which “hands-free” cellular phone systemsafford safety benefits over “hand-held” models. While the newer systems may well be easierand less distracting to use, whether this translates into fewer crashes is still a topic for debate. Despite a Japanese study showing that the greatest proportion of cell phone crashes occur whilereceiving or placing calls (7), U.S. studies have generally shown most crashes to occur whiletalking on phones, and suggest that hands-free versus hand-held systems have little impact onthe cognitive distraction associated with carrying on a conversation while driving (8, 13).
Although legislation being considered in five states this year would prohibit use of cellphones while driving except in emergencies, and legislation in 24 states would ban the use ofhand-held systems, only New York State currently has a law in place prohibiting use of a hand-held cell phone while driving (16). In addition, nine local jurisdictions have enacted bans onhand-held phone use while driving (16). A project was recently undertaken by the NationalConference of State Legislatures in response to ever increasing requests for information aboutcell phones and other in-vehicle technologies from state and local lawmakers and the generalpublic. The project brought state legislators and staff together with representatives from industryand the highway safety community to “identify important issues, review current information, andcreate a forum where stakeholders could work toward finding common ground” (3). Consensus

4
was reached in 14 important areas, including the need for better data and increased publiceducation. However, the group failed to reach consensus on whether legislation was needed tolower the potential risk of crashes due to cell phones and other wireless technologies, or onwhether cell phones should be singled out from other common driver distractions in state datacollection efforts.
The current telephone survey of cell phone users and non-users in North Carolina wascarried out as part of two larger projects funded by the state’s Governor’s Highway SafetyProgram exploring cell phone use and driving safety. Three tasks were carried out as part of theinitial project. These included (1) a statewide observational survey of cell phone use whiledriving, similar to the NHTSA survey reported on earlier; (2) a pilot test of a supplemental dataform for use by the N.C. State Highway Patrol to identify crashes involving cell phones; and (3)an analysis of narrative data on N.C.’s computerized crash files to identify potential cell phone-related crashes. Results from these efforts have been summarized in a final project report (17).
In a second follow-on project, we have continued to work with the N.C. Highway Patrol tocollect supplementary data on cell phone-related crashes, and have linked the narrative crash datato the complete state motor vehicle crash files for further analysis. In place of the statewideobservational survey (which yielded a use rate of 3.1% for hand-held phones), it was decided toconduct a telephone survey to provide an updated snapshot of cell phone use while driving inNorth Carolina, and to learn drivers’ opinions regarding the safety of cell phones and attitudesregarding regulation.
With the exception of industry marketing surveys, which are limited in scope, only a fewsurveys have been carried out to gather information on cell phone use while driving, and much ofthis information is quickly outdated as more phones are sold and new technologies areintroduced. Industry surveys have generally shown a trend of increasing cell phone use byyounger and older drivers and by individuals with lower incomes. Surveys have also shown adecrease in the proportion of business or work-related calls compared to personal calls (7, 3). Surveys conducted by Prevention Magazine in 1994 and 1995 reported that 15% of cell phoneowners never use their phones while driving; 5% have had a “near miss” crash while driving andtalking, and 2% have been involved in a crash where someone else was talking (7, 3). Anongoing Internet-based survey being conducted by Nationwide Insurance reports that 15.2percent of respondents “always” or “frequently” talk on cell phones while driving, while anadditional 28.7 percent “occasionally” use cell phones (18).
Drawing from data collected as part of its Motor Vehicle Occupant Safety Surveyconducted November 1996 - January 1997, NHTSA found that 30% of respondents reportedhaving a phone or carrying one with them when they drove. Phone use was highest amongpersons ages 45-54 (39%), and those ages 35-44 (36%), and among college graduates. Nine often cell phone owners reported using their phones while driving, with males reporting using themon a higher proportion of their trips than females (7). NHTSA recently estimated that 55% ofdrivers routinely carry phones in vehicles, and half of these leave the phones on during their trip. It further estimated that 73% of the phones used in cars are hand-held models (3).
5
Having up-to-date information on who is using cell phones while driving, how the phonesare being used, and the perceived safety of their use can provide a useful complement to availabledata on cell phone-related crashes, and help guide lawmakers and the highway safety communityin identifying the best approaches for promoting safety without unnecessarily curtailing the manybenefits that cell phones and other new in-vehicle technologies can offer.
Methods
A North Carolina statewide telephone survey was conducted over a one-month period frommid-June until mid-July, 2002. The survey questionnaire was developed by researchers at theUNC Highway Safety Research Center, working with a marketing and survey research firmbased in the area. The questionnaire was developed over a period of several months with inputfrom NHTSA staff and others. It was pilot tested on an informal basis during the developmentprocess, and then formally pilot tested in the field before actual data collection was begun. Cellphone users were asked the full questionnaire, while non-users were asked an abbreviatedversion that omitted questions pertaining to cell phone use but which otherwise containedidentical questions.
The survey was a random digit dial household telephone survey. Invalid, disconnected, ornot-in-service numbers were screened out, as were businesses. Households were also screenedout of the survey if (1) there was no adult over age 18 in the household; (2) there was no adultwith NC residency in the household, and/or (3) there was no adult with a valid driver’s license inthe household. In addition to these screening criteria, potential participants were screened on thebasis of age and their use or non-use of cell phones. A quota of at least 50 survey participants ineach of five age groups (18-24, 25-39, 40-54, 55-69, 70+) was set. In addition, we targeted 500interviews to be completed with cell phone users and 150 with cell phone non-users, for a total of650 completed interviews. Cell phone users were oversampled to allow for more in depthanalyses within this subpopulation of interest.
A copy of the questionnaire is included as an Appendix to this report. Cell phone usersaveraged just over nine minutes to complete the survey, while non-users completed the shorterversion in six-and-a-half minutes. The survey was conducted using a Computer AidedTelephone Interviewing (CATI) system, which allowed for automatic quota allocations, skips,and validity checks on data entries. The completed database was further edited for completenessand accuracy and converted to a SAS dataset for analysis using Statistical Analysis Systemsoftware, Version 8. The data were analyzed descriptively using single variable and two- andthree-way crosstabulations of the data. Statistical testing was carried out using chi-square tests ofassociation on categorical variables and t-tests or Pearson correlation coefficients for continuousdata. Standard regression models were used in some limited multivariate analyses of the data.
6
Results
Screener ResultsA total of 1,006 individuals completed the survey screener. An additional 106 individuals
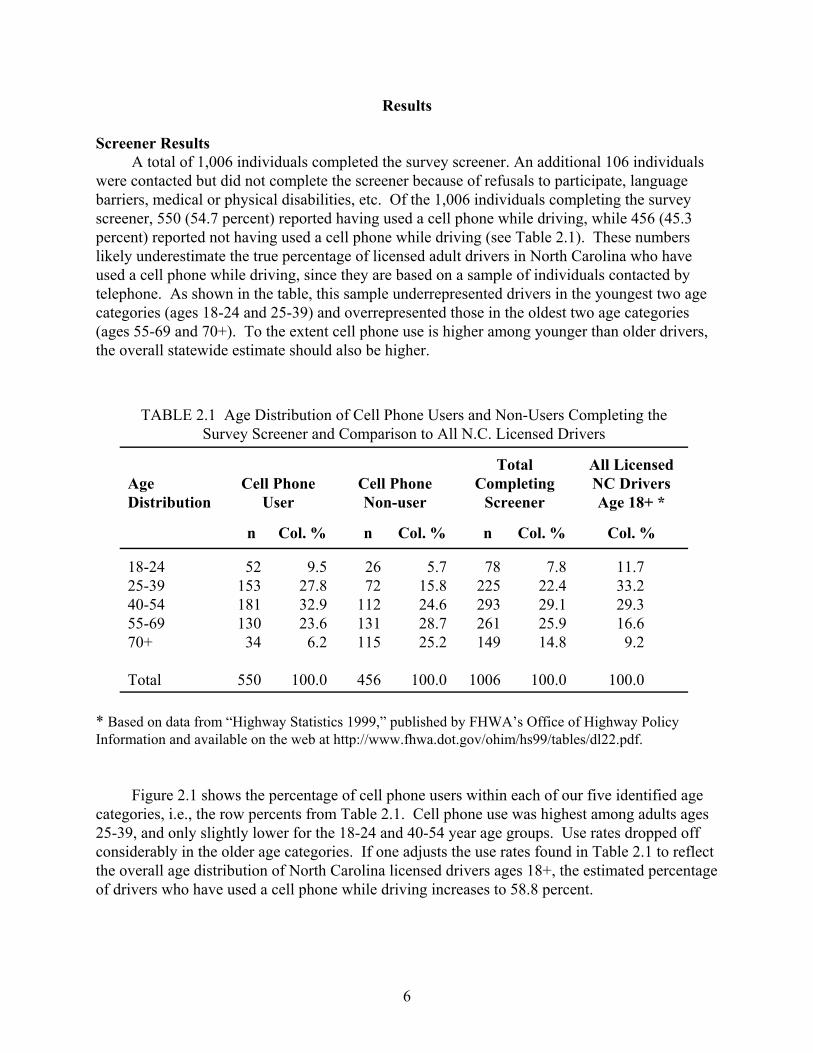
were contacted but did not complete the screener because of refusals to participate, languagebarriers, medical or physical disabilities, etc. Of the 1,006 individuals completing the surveyscreener, 550 (54.7 percent) reported having used a cell phone while driving, while 456 (45.3percent) reported not having used a cell phone while driving (see Table 2.1). These numberslikely underestimate the true percentage of licensed adult drivers in North Carolina who haveused a cell phone while driving, since they are based on a sample of individuals contacted bytelephone. As shown in the table, this sample underrepresented drivers in the youngest two agecategories (ages 18-24 and 25-39) and overrepresented those in the oldest two age categories(ages 55-69 and 70+). To the extent cell phone use is higher among younger than older drivers,the overall statewide estimate should also be higher.
TABLE 2.1 Age Distribution of Cell Phone Users and Non-Users Completing theSurvey Screener and Comparison to All N.C. Licensed Drivers
AgeDistribution
Cell PhoneUser
Cell PhoneNon-user
TotalCompleting
Screener
All LicensedNC DriversAge 18+ *
n Col. % n Col. % n Col. % Col. %
18-2425-3940-5455-6970+
Total
5215318113034
550
9.527.832.923.66.2
100.0
2672
112131115
456
5.715.824.628.725.2
100.0
78225293261149
1006
7.822.429.125.914.8
100.0
11.733.229.316.69.2
100.0
* Based on data from “Highway Statistics 1999,” published by FHWA’s Office of Highway PolicyInformation and available on the web at http://www.fhwa.dot.gov/ohim/hs99/tables/dl22.pdf.
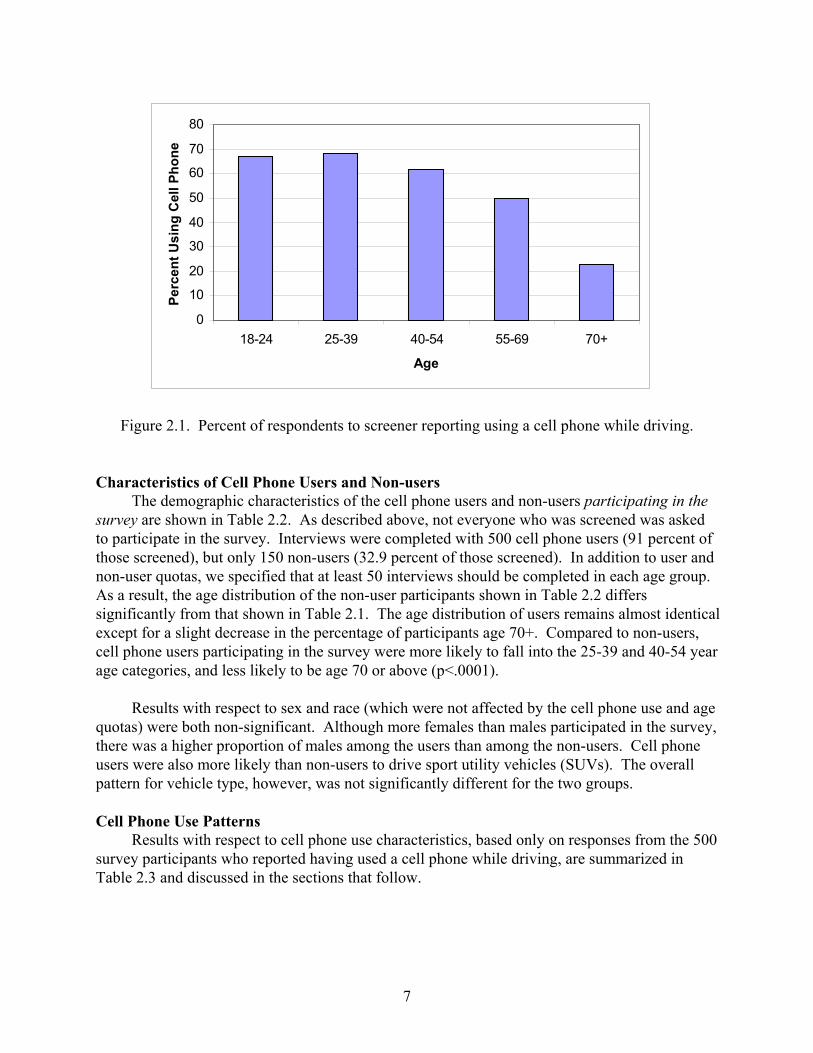
Figure 2.1 shows the percentage of cell phone users within each of our five identified agecategories, i.e., the row percents from Table 2.1. Cell phone use was highest among adults ages25-39, and only slightly lower for the 18-24 and 40-54 year age groups. Use rates dropped offconsiderably in the older age categories. If one adjusts the use rates found in Table 2.1 to reflectthe overall age distribution of North Carolina licensed drivers ages 18+, the estimated percentageof drivers who have used a cell phone while driving increases to 58.8 percent.
7
0
10
20
30
40
50
60
70
80
18-24 25-39 40-54 55-69 70+
Age
Perc
ent U
sing
Cel
l Pho
ne
Figure 2.1. Percent of respondents to screener reporting using a cell phone while driving.
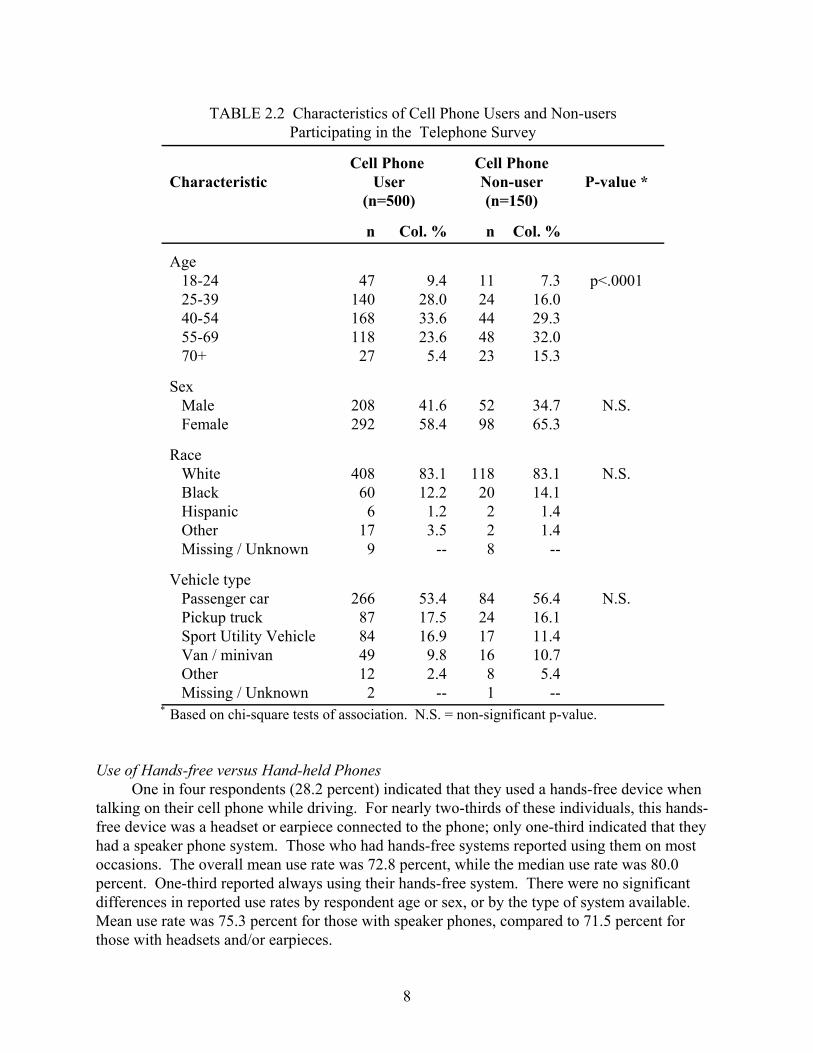
Characteristics of Cell Phone Users and Non-usersThe demographic characteristics of the cell phone users and non-users participating in the
survey are shown in Table 2.2. As described above, not everyone who was screened was askedto participate in the survey. Interviews were completed with 500 cell phone users (91 percent ofthose screened), but only 150 non-users (32.9 percent of those screened). In addition to user andnon-user quotas, we specified that at least 50 interviews should be completed in each age group. As a result, the age distribution of the non-user participants shown in Table 2.2 differssignificantly from that shown in Table 2.1. The age distribution of users remains almost identicalexcept for a slight decrease in the percentage of participants age 70+. Compared to non-users,cell phone users participating in the survey were more likely to fall into the 25-39 and 40-54 yearage categories, and less likely to be age 70 or above (p<.0001).
Results with respect to sex and race (which were not affected by the cell phone use and agequotas) were both non-significant. Although more females than males participated in the survey,there was a higher proportion of males among the users than among the non-users. Cell phoneusers were also more likely than non-users to drive sport utility vehicles (SUVs). The overallpattern for vehicle type, however, was not significantly different for the two groups.
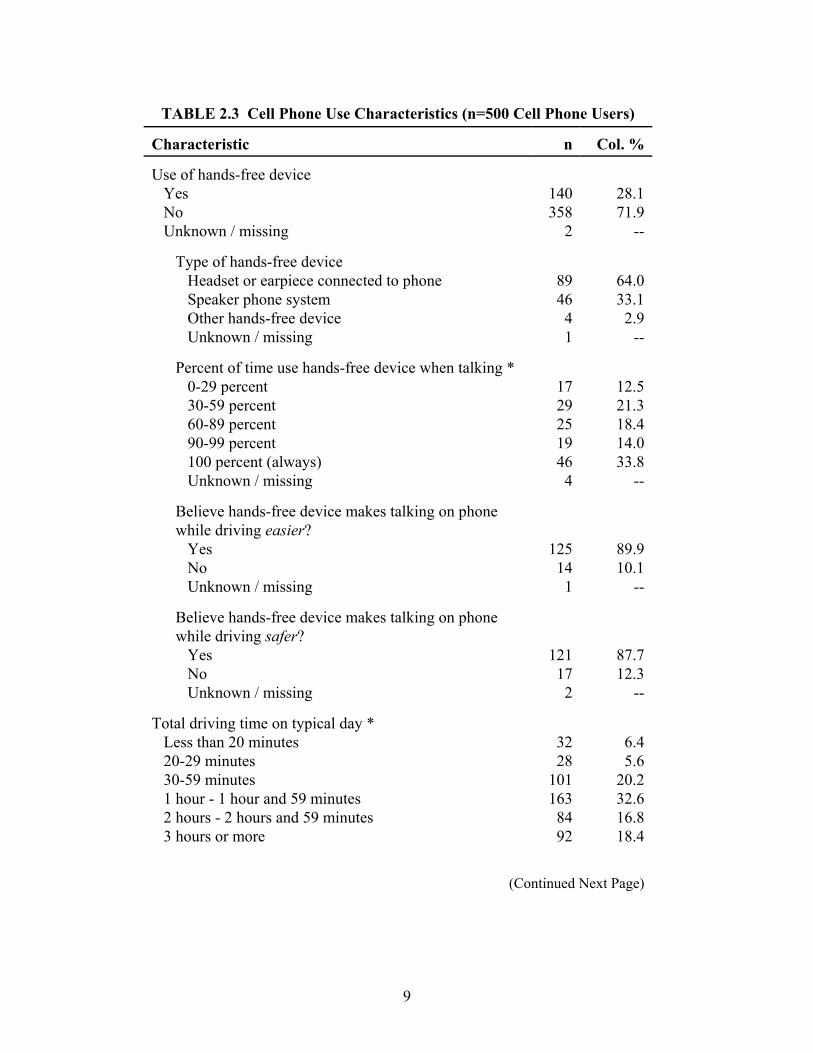
Cell Phone Use PatternsResults with respect to cell phone use characteristics, based only on responses from the 500
survey participants who reported having used a cell phone while driving, are summarized inTable 2.3 and discussed in the sections that follow.
8
TABLE 2.2 Characteristics of Cell Phone Users and Non-usersParticipating in the Telephone Survey
CharacteristicCell Phone
User(n=500)
Cell PhoneNon-user(n=150)
P-value *
n Col. % n Col. %
Age 18-24 25-39 40-54 55-69 70+
4714016811827
9.428.033.623.65.4
1124444823
7.316.029.332.015.3
p<.0001
Sex Male Female
208292
41.658.4
5298
34.765.3
N.S.
Race White Black Hispanic Other Missing / Unknown
408606
179
83.112.21.23.5
--
11820228
83.114.11.41.4
--
N.S.
Vehicle type Passenger car Pickup truck Sport Utility Vehicle Van / minivan Other Missing / Unknown
266878449122
53.417.516.99.82.4
--
8424171681
56.416.111.410.75.4
--
N.S.
* Based on chi-square tests of association. N.S. = non-significant p-value.
Use of Hands-free versus Hand-held PhonesOne in four respondents (28.2 percent) indicated that they used a hands-free device when
talking on their cell phone while driving. For nearly two-thirds of these individuals, this hands-free device was a headset or earpiece connected to the phone; only one-third indicated that theyhad a speaker phone system. Those who had hands-free systems reported using them on mostoccasions. The overall mean use rate was 72.8 percent, while the median use rate was 80.0percent. One-third reported always using their hands-free system. There were no significantdifferences in reported use rates by respondent age or sex, or by the type of system available. Mean use rate was 75.3 percent for those with speaker phones, compared to 71.5 percent forthose with headsets and/or earpieces.
9
TABLE 2.3 Cell Phone Use Characteristics (n=500 Cell Phone Users)
Characteristic n Col. %
Use of hands-free device Yes No Unknown / missing
140358
2
28.171.9
--
Type of hands-free device Headset or earpiece connected to phone Speaker phone system Other hands-free device Unknown / missing
894641
64.033.12.9
--
Percent of time use hands-free device when talking * 0-29 percent 30-59 percent 60-89 percent 90-99 percent 100 percent (always) Unknown / missing
17292519464
12.521.318.414.033.8
--
Believe hands-free device makes talking on phonewhile driving easier? Yes No Unknown / missing
125141
89.910.1
--
Believe hands-free device makes talking on phonewhile driving safer? Yes No Unknown / missing
121172
87.712.3
--
Total driving time on typical day * Less than 20 minutes 20-29 minutes 30-59 minutes 1 hour - 1 hour and 59 minutes 2 hours - 2 hours and 59 minutes 3 hours or more
3228
1011638492
6.45.6
20.232.616.818.4
(Continued Next Page)

TABLE 2.3 Cell Phone Use Characteristics (n=500 Cell Phone Users)
Characteristic n Col. %
10
Total time using cell phone while driving on typical day * Less than one minute 1-4 minutes 5-9 minutes 10-19 minutes 20-29 minutes 30-59 minutes 1 hour Two hours or more
921481007928191618
18.429.620.015.85.63.83.23.6
Percentage of calls that are work-related * None 1-24 percent 25-49 percent 50-74 percent 75-99 percent 100 percent Unknown / missing
260461767673112
53.39.43.5
13.713.76.4
--
Typical number outgoing calls made while driving None or almost none Less than 1 per day 1-2 calls per day 3-5 calls per day 6-10 calls per day More than 10 calls per day Unknown / missing
1221131477622182
24.522.729.515.34.43.6
--
Typical number incoming calls answered None or almost none Less than 1 per day 1-2 calls per day 3-5 calls per day 6-10 calls per day More than 10 calls per day Unknown / missing
17481
1346924162
34.916.326.913.94.83.2
--
How often pull off the road to use cell phone? Never Rarely Sometimes Usually Always Unknown / missing
17295
11657546
34.819.223.511.510.9
-- * Responses grouped for presentation.

11
Those who had hands-free systems overwhelmingly (89.9 percent) felt that the system madeit easier for them to talk on the phone while driving. Almost as many (87.7 percent) felt that itmade it safer for them to talk on the phone while driving. These results did not vary significantlyby type of hands-free system.
Typical Daily UseParticipants in the survey spent on average 106 minutes per day driving. Driving time,
however, was positively skewed, so that the median time spent driving was 60 minutes, as wasthe mode. Average time spent talking on a cell phone per day while driving was similarlyskewed, with a mean of 14.5 minutes and median and mode of 5.0 minutes. Average timetalking was significantly associated with both age and gender: usage decreased with increasingage, and was higher for males than for females (p<.001 for both age and gender, based on linearregression). Using mean reported times, the proportion of time survey participants spent usingtheir cell phone while driving can be estimated at 14.5 minutes (talking) / 106 minutes (driving),or .14. A comparison of median reported talking and driving times yields a somewhat reducedratio of .08 (i.e., 5.0 minutes talking / 60 minutes driving).
Participants were also asked what percentage of the calls they made each day were work-related calls, and what percentage were personal calls. Responses were required to total 100percent. Just over half of the respondents (53.3 percent) reported that they made no work-relatedcalls, while at the other extreme, 6.4 percent responded that all of their calls were work-related. The average reported percentage was 27.3 percent. There was a significant positive correlationbetween percent work-related calls per day and total time spent talking on phone per day(Pearson R2 = 0.227, p<.0001).
Over three-fourths (76.7 percent) of cell phone users reported placing two or fewer calls perday. Only a few (8.0 percent) reported placing more than five calls per day. Results were similarwith respect to receiving incoming calls. Both the number of outgoing calls and the number ofincoming calls were significantly associated with respondent age and sex: generally, thepercentages of respondents making 3-5 or 6 or more calls per day decreased with respondent age,and was higher for males than for females (p<.001 for both age and sex crosstabulations).
A final question pertaining to cell phone use was how often the respondents pulled their caroff the road to use their cell phone. Over a third of the respondents (34.8 percent) said that theynever pulled their car off the road, whereas 22.4 percent said that they usually or always pulledoff. Results were strongly associated with age (p<.0001), with older drivers much more likely torespond that they always or usually pulled over (60.0 percent for drivers age 70+, decreasing toonly 4.3% for drivers age 18-24). Responses did not vary by sex, and were not associated withthe various measures of cell phone use (total time talking per day, average number incoming andoutgoing calls per day) once age was incorporated into the regression model.
Driving Safety and Use of Cell PhoneThose who reported using a cell phone while driving were asked if they had ever “had to
make a sudden evasive maneuver to avoid being in an accident” while driving and talking ontheir phone. A “sudden evasive maneuver” was described as slamming on the brakes or jerkingthe steering wheel. Nearly one in eight (11.8 percent) respondents said that they had. Although

12
the likelihood of a positive response was highest for drivers ages 18-24 and lowest for those ages55-69, the results were only marginally associated with driver age (p=.068), and were not at allassociated with use of a hands-free versus a hand-held phone system. Results were, however,significantly associated with likelihood of pulling off the road to use a phone: those who reportedusually or always pulling over to use their cell phone were less likely than those who never orrarely pulled over to have made an evasive maneuver while on the phone. These results heldeven after adjusting for driver age (p=.018), as well as total driving time and total talking time(p=.044).
Use of Other Electronic ServicesCell phone users were also asked about other electronic services they might access while
driving. These included voice mail, e-mail, or the Internet; vehicle navigation systems such asOn-Star; PDAs or “personal digital assistants” like Palm Pilot or Handspring; and reading text orinstant messages. Accessing voice mail received the highest positive response, with 19.4 percentof cell phone users indicating that they also accessed voice mail while driving. Results werestrongly associated with age, ranging from a high of 42.6 percent for respondents ages 18-24 toonly 3.7 percent for respondents ages 70 and older (p<.001).
Results with respect to the other services generally hovered in the one to two percent range:accessing e-mail 1.4 percent; accessing the Internet 0.8 percent; use of a vehicle navigationsystem 1.8 percent; and use of a PDA 2.2 percent. None of these findings was significantlyassociated with respondent age. A somewhat higher percentage of cell phone users said that theyread text or instant messages while driving. These results were especially high among the 18-24year-old respondents, with 14.9 percent indicating that they read text or instant messages whiledriving (p=.0013).
Cell phone non-users were only questioned about their use of in-vehicle navigationalequipment while driving. Only one of the 150 non-user respondents indicated using such asystem.
Opinions on Cell Phone Safety and RegulationBoth cell phone users and non-users were asked to rate how distracting they thought
various activities were to driving. The specific instructions were, “Please rate how distractingyou think the following activities are to a driver. Use a scale of 0 to 10, where 0 means ‘not at alldistracting’ and 10 means ‘extremely distracting.’” A total of ten activities was presented inrandom order, except that “talking on a cell phone with a hands-free device” and “talking on acell phone without a hands-free device” were always asked consecutively. Results aresummarized in Table 2.4, roughly ordered from least distracting to most distracting based onratings assigned by the non-cell phone users.
All of the activities except for finding a location using a road map were significantlyassociated with cell phone user status, with non-users rating the activities more distracting thanusers. In the case of finding a location using a road map, cell phone users rated this the mostdistracting of the ten activities, while non-users rated it somewhat less distracting than eithertalking on a cell phone without a hands-free device or dialing a cell phone. Talking with otherpassengers in the vehicle received the lowest overall distraction rating from both groups.

13
TABLE 2.4 Opinions on Level of Distraction of Various Activities While Driving
Driving Activity
Average Rating on Scale of 0 to 10where 0=Not at all distracting and
10=Extremely distracting P-value forCell Phone
Use Status *Cell Phone
Users(n=500)
Cell Phone Non-Users
(n=150)
Talking with passengers 3.68 4.30 p=.029
Changing the station on the radio 3.75 4.99 p<.001
Talking on a cell phone with a hands-free device
3.36 6.03 p<.001
Drinking a cup of coffee 4.45 6.36 p<.001
Eating a sandwich 5.46 6.70 p<.001
Answering an incoming call on a cellphone
5.62 8.29 p<.001
Reading driving directions 7.62 8.51 p=.001
Finding a location using a road map 8.23 8.51 N.S.
Talking on a cell phone without ahands-free device
6.53 8.74 p<.001
Dialing a cell phone 7.28 9.25 p<.001 * For cell phone use status, based on regression models incorporating age and gender. N.S.=Non-significant
Also, both groups rated talking on a cell phone with a hands-free device much less distractingthan talking on a cell phone without a hands-free device. Still, for the non-users especially, cellphone use and in particular dialing a cell phone were considered extremely distracting activities.
Ratings for the various potential distractions were also significantly associated withrespondent age and gender: females gave higher distraction ratings than males, and ratingsincreased with age.
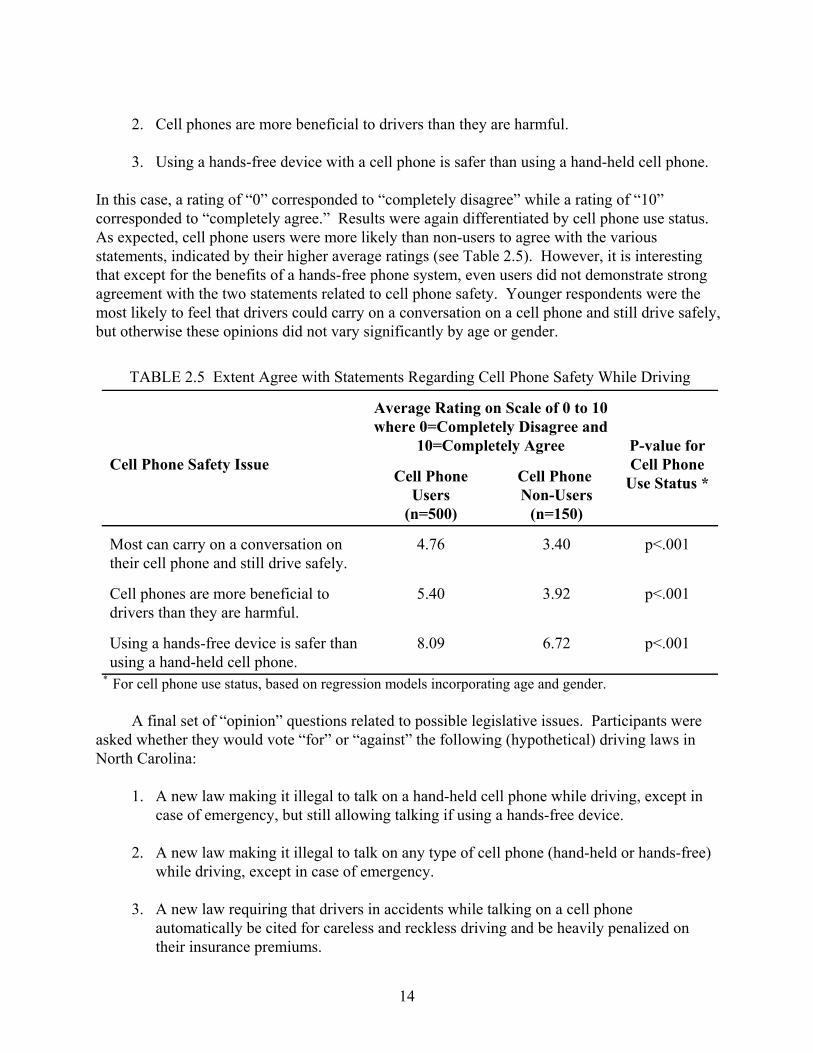
In addition to rating how distracting they thought various activities, including cell phoneuse, were to driving, respondents were asked to use the same 0-10 scale to indicate the extent towhich they agreed or disagreed with the following three statements:
1. Most people can carry on a conversation on their cell phone and still drive safely.
14
2. Cell phones are more beneficial to drivers than they are harmful.
3. Using a hands-free device with a cell phone is safer than using a hand-held cell phone.
In this case, a rating of “0” corresponded to “completely disagree” while a rating of “10”corresponded to “completely agree.” Results were again differentiated by cell phone use status. As expected, cell phone users were more likely than non-users to agree with the variousstatements, indicated by their higher average ratings (see Table 2.5). However, it is interestingthat except for the benefits of a hands-free phone system, even users did not demonstrate strongagreement with the two statements related to cell phone safety. Younger respondents were themost likely to feel that drivers could carry on a conversation on a cell phone and still drive safely,but otherwise these opinions did not vary significantly by age or gender.
TABLE 2.5 Extent Agree with Statements Regarding Cell Phone Safety While Driving
Cell Phone Safety Issue
Average Rating on Scale of 0 to 10where 0=Completely Disagree and
10=Completely Agree P-value forCell Phone
Use Status *Cell PhoneUsers
(n=500)
Cell Phone Non-Users
(n=150)
Most can carry on a conversation ontheir cell phone and still drive safely.
4.76 3.40 p<.001
Cell phones are more beneficial todrivers than they are harmful.
5.40 3.92 p<.001
Using a hands-free device is safer thanusing a hand-held cell phone.
8.09 6.72 p<.001
* For cell phone use status, based on regression models incorporating age and gender.
A final set of “opinion” questions related to possible legislative issues. Participants wereasked whether they would vote “for” or “against” the following (hypothetical) driving laws inNorth Carolina:
1. A new law making it illegal to talk on a hand-held cell phone while driving, except incase of emergency, but still allowing talking if using a hands-free device.
2. A new law making it illegal to talk on any type of cell phone (hand-held or hands-free)while driving, except in case of emergency.
3. A new law requiring that drivers in accidents while talking on a cell phoneautomatically be cited for careless and reckless driving and be heavily penalized ontheir insurance premiums.

15
Results are summarized in Table 2.6. Cell phone users as well as non-users generallysupported legislation that would make it illegal to use a hand-held phone while driving, but stillallow use of a hands-free system (70.6 percent of users, 76.7 percent of non-users). Olderrespondents were especially likely to support such legislation (p=.003), while there were nosignificant gender differences. In contrast, cell phone users and non-users held sharply differentopinions about legislation that would make all cell phone use illegal: whereas 63.3 percent ofnon-users said they would vote for such legislation, only 26.8 percent of users would vote for it. Older respondents were again more likely to support such legislation (p<.001), as were females(p=.043). Users and non-users also gave different responses with regard to stricter penalties forpersons involved in crashes while talking on a phone, with just over half (53.8%) of userssupporting such legislation, compared to three-fourths (78.0 percent) of non-users. The same ageand sex distinctions also held (p=.014 for age, p=.003 for gender).
TABLE 2.6 Support for Possible Legislation Regarding Self Phone Use While Driving
Cell Phone LegislationCell
PhoneUsers
(n=500)
CellPhone
Non-Users(n=150)
P-value *
Illegal to talk on hand-held phoneexcept in emergency, talking usinghands-free device O.K.
% For% Against% Unknown
70.625.83.6
76.720.72.7
N.S.
Illegal to talk on any type cell phone(hand-held or hands-free) except incase of emergency.
% For% Against% Unknown
26.869.83.4
63.332.74.0
p<.001
Drivers in accidents while talking onphone automatically cited for carelessand reckless driving and heavilypenalized on insurance premiums.
% For% Against% Unknown
53.839.86.4
78.015.36.7
p<.001
* For cell phone use status, based on regression models incorporating age and gender. N.S.=Non-signif.
Discussion
This chapter has reported on the results of a statewide survey to gather information on thecharacteristics of adults ages 18 and older who report using a cell phone while driving and thenature of their reported cell phone use. Additionally, information was gathered on opinions ofusers and non-users regarding the safety of using a phone while driving and support forlegislation regulating cell phone use. While carried out in North Carolina to help guide its ownhighway safety efforts, the survey should have relevance to safety professionals and policymakers beyond the state seeking to better understand the risks associated with cell phone use andways these risks might be reduced.

16
Nearly six out of ten North Carolina drivers were estimated to have used a cell phone whiledriving. Reported cell phone use was highest in the younger age groups, dropping significantlywith age. Still, more than one in five “senior” drivers ages 70+ reported having used a cell phonewhile driving. Although a few users reported high levels of “talk time” on their phones, mostreported much more modest times of less than 10 minutes per day. Three-fourths reportedplacing or receiving two or fewer calls per day. Use levels were highest in the youngest agegroups, and were higher for males than for females.
Two of the more interesting survey topics from an educational and/or policy perspectivepertain to the use of hand-held versus hands-free phone systems, and the likelihood of pulling offthe roadway to use a phone rather than trying to place a call or carry on a conversation whiledriving. One in four of our cell phone users reported having a hands-free device, although theydid not always use it when talking on their phone. Despite the inconsistent use, the vast majorityof those with hands-free devices felt that the devices made it both easier and safer to talk on aphone while driving. One concern is that, by passing legislation that prohibits the use of hand-held phones but allows the use of hands-free systems, lawmakers may be sending the messagethat the hands-free systems are, in effect, “risk-free.” This might not only encourage moreindividuals to use cell phones while driving, but also encourage longer and more frequentconversations. Research has shown, however, that conversing on either a hand-held or a hands-free phone leads to significant decrements in simulated driving performance, a result of “thediversion of attention from driving to the phone conversation itself” (8). Among the participantsin our survey, use of a hands-free phone system was not associated with lower reportedincidences of “sudden evasive maneuvers” while driving and talking on a cell phone. Users ofthe hands-free systems also did not report significantly higher use levels in terms of either totaltalk time or numbers of outgoing and incoming calls. Further research is needed to clarify therisks and benefits associated with use of hands-free versus hand-held phone systems.
One in five respondents said that they usually or always pulled off the road to use their cellphone, while a third said that they never did so. Older respondents were much more likely thanyounger respondents to report always or usually pulling over. Safety advocates differ on whetherto advise people to pull off the road while using their cell phone, recognizing that both pullingoff the road and merging back into traffic can pose hazards, as can being parked along a roadside. Most safety literature simply advises cell phone users to try to place their calls before beginning atrip, or when stopped in traffic. Among our survey participants, however, pulling off the roadwas associated with a lower likelihood of having made a sudden evasive maneuver while talkingon a cell phone. It could be that participants are pulling off to relatively “safe” locations such asparking lots or service stations. It is also possible that people who elect to pull over are generallymore safety conscious than those who do not. Regardless, this option should be communicatedto cell phone users as one way of potentially reducing their risk of crashing.
In-vehicle use of wireless equipment other than cell phones remains low, at least in oursample of North Carolina drivers. However, this situation may change in the near future if therapid proliferation of cell phones is any indication. One area of special concern is the relativelyhigh percentage of young drivers in our survey who reported using text or instant messaging. Given the generally high crash risks already faced by young drivers, one can hardly envisionincreasing this risk by condoning the use of potentially distracting technologies while driving.
17
Some states are already considering enacting legislation prohibiting novice drivers withprovisional licenses from talking on a cell phone while driving. This legislation might well beextended to cover other wireless communication technologies. In its consensus report dealingwith driver focus and in-vehicle wireless technologies, the National Conference of StateLegislatures acknowledged that, “Because teenage and novice drivers lack driving experience,they are more susceptible to the distractions caused by communications, entertainment andinformation technology in motor vehicles,” but stops short of recommending any legislation thatwould restrict their use of such equipment (3). Our survey made no attempt to interview minorsunder the age of 18, but this is clearly an area where further research is warranted.
Finally, the results of this survey generally confirm a willingness by the driving public toaccept some restrictions on their use of cell phones while driving. However, there were cleardifferences among users and non-users in their perceptions of risk associated with cell phone use,and in their support for legislation that might restrict cell phone use. As cell phone ownershipand use becomes more “mainstream,” one can expect less support for any legislation that wouldplace a total ban on cell phone use while driving, or that would bring automatic penalties to cellphone users in crashes. Instead, the public is much more likely to continue its support forrestrictions on hand-held phone use, believing the hands-free systems to confer some level ofsafety. Again, public education is needed regarding the potential distracting nature of cell phoneconversations regardless of the type of phone being used.
The growth of cell phones and other wireless communications technologies in vehiclesappears inevitable. Although research has demonstrated that use of these technologies canimpair driving performance and increase risk of crash involvement, the magnitude of this riskremains unknown. More data are needed both with regard to the safety implications of cellphone (and other technology) use while driving, and levels of exposure to these technologies. This statewide survey of cell phone users and non-users represents a step in this direction.
References
1. Cellular Telecommunications & Internet Association (CTIA). U.S. Wireless Subscribers.http://www.wow-com.com/. Accessed July 22, 2002.
2. Utter, D. Passenger Vehicle Driver Cell Phone Use: Results from the Fall 2000 NationalOccupant Protection Use Survey. Research Note DOT HS 809 293. NHTSA, U.S.Department of Transportation, 2001.
3. Sundeen, M. Along for the Ride: Reducing Driver Distractions. Final Report of the DriverFocus and Technology Forum. National Conference of State Legislatures, Denver, CO,March 2002.
4. Llaneras, R. E. NHTSA Driver Distraction Internet Forum: Summary and Proceedings.Westat, Rockville, MD, November 2000.
18
5. Lissy, K. S., Cohen, J. T., Park, M. Y. and Graham, J. D. Cellular Phone Use WhileDriving: Risks and Benefits. Phase I Report. Harvard Center for Risk Analysis, HarvardSchool of Public Health, Boston, MA, 2000.
6. Cain, A. and Burris, M. Investigation of the Use of Mobile Phones While Driving. Centerfor Urban Transportation Research, College of Engineering, University of South Florida,1999.
7. Goodman, M., Bents, F. D., Tijerina, L., Wierwille, W., Lerner, N. and Benel, D. AnInvestigation of the Safety Implications of Wireless Communications in Vehicles. ReportNo. DOT HS 808-635. NHTSA, U.S. Department of Transportation, 1997.
8. Strayer, D. L. and Johnston, W. A. Driven to Distraction: Dual-Task Studies of SimulatedDriving and Conversing on a Cellular Telephone. Psychological Science, Vol. 12, No. 6,November 2001, pp. 462-466.
9. Parkes, A. and Hooijmeijer, V. The Influence of the Use of Mobile Phones on DriverSituation Awareness. Paper submitted to the NHTSA Driver Distraction Internet Forum,July 5 - August 11, 2000.http://www-nrd.nhtsa.dot.gov/departments/nrd-13/driver-distraction/Topics023060002.htm#A2 , accessed July 22, 2002.
10. Alm, H. and Nilsson, L. The Effects of a Mobile Telephone Task on Driver Behavior in aCar Following Situation. Accident Analysis and Prevention, Vol. 27, No. 5, 1995, pp. 707-715.
11. McKnight, A. J. and McKnight, A. S. The Effect of Cellular Phone Use Upon DriverAttention. Accident Analysis and Prevention, Vol. 25, No. 3, 1993, pp.259-265.
12. Lamble, D., Kauranen, R., Laakso, M. and Summala, H. Cognitive Load and DetectionThresholds in Car Following Situations: Safety Implications for Using Mobile (Cellular)Telephones While Driving. Accident Analysis and Prevention, Vol. 31, No. 6, 1999, pp.617-623.
13. Redelmeier, D. A. and Tibshirani, R. J. Association Between Cellular-Telephone Calls andMotor Vehicle Collisions. The New England Journal of Medicine, Vol. 336, No. 7, 1997,pp. 453-458.
14. Laberge-Nadeau, C., Maag, U., Bellavance, R., Desjardins, D., Messier, S. and Saïdi,Abdelnasser. Wireless Telephones and the Risk of Road Accidents. Publication CRT-2001-16. Université de Montréal, Montreal, Quebec Canada, 2001.
15. Violanti, J. M. Cellular Phones and Fatal Traffic Collisions. Accident Analysis andPrevention, Vol. 30, No. 4, 1998, pp. 519-524.
19
16. Sundeen, M. Mobile Telecommunications Technology and Driver Distraction LegislativeActivity. Presentation at the Lifesavers 2002 National Conference on Highway SafetyPriorities, Lake Buena Vista, FL, June 2002.
17. Reinfurt, D. W., Huang, H. F., Feaganes, J. R. and Hunter, W. W. Cell Phone Use WhileDriving in North Carolina. Highway Safety Research Center, University of North Carolina- Chapel Hill, November 2001. http://www.hsrc.unc.edu/pdf/2001/cellphone.pdf .
18. Nationwide. Safe Choices Survey Quiz: National. http://www.nationwide.com:80/nisurvey/quizzes/national/ques1.htm, last accessed Nov. 15,2002.

20
21
Chapter 3. The Characteristics of Cell Phone-Related Motor Vehicle Crashes in North Carolina
(Adapted from a paper prepared for presentation at the Annual Meeting of theTransportation Research Board, Washington, D.C., January 2003)
Background
The number of cell (or mobile) phone users in the United States skyrocketed from 500,000in 1985 to 137,000,000 in November 2002 (1). This explosion in cell phone ownership has beenaccompanied by an increase in the use of cell phones while driving. According to three recentstudies, about 3 to 5 percent of drivers were observed to be using a hand-held cell phone whiledriving (2, 3, 4). Each percentage should be interpreted as a snapshot (at a given time) of cellphone use while driving. It is not the percentage of drivers who used a cell phone on a given trip,nor the percentage who ever use a cell phone while driving.
The increased use of cell phones while driving has heightened interest in the safety aspectsof using a cell phone while driving. Motorists who are busy dialing or talking on cell phonesmay not be paying attention to the road or keeping both hands on the steering wheel. They maynot notice a red light, veer into another lane, etc., possibly resulting in a crash. Many statelegislatures in the U.S. are considering restrictions on the use of cell phones while driving. Questions of interest to researchers include how much cell phone use occurs while driving, howdriver performance is affected, and how many crashes result.
This chapter compares the characteristics of cell phone and non-cell phone police-reportedmotor vehicle crashes that occurred in North Carolina. A cell phone crash is defined as a crash inwhich at least one of the drivers involved was using a cell phone at the time of the crash. Cellphone crashes were identified through a narrative search of police crash report narratives. A non-cell phone crash is defined as a crash in which none of the drivers was using a cell phone at thetime of the crash.
The growing number of research studies provides convincing evidence that cell phone usewhile driving impairs driver performance and increases the risk of a crash. Driver performancestudies B using either driving simulators or on-road vehicles B concur that using a cell phone doesslow reaction times and degrades tracking abilities (5-7). Epidemiological studies agree that therisk of a crash rises when a driver is engaged in a cell phone conversation, but the magnitude ofthat increased risk is uncertain (8-10). Whether hands-free is safer than hand-held is debatable(3, 7, 11, 12).
Goodman et al. did a computerized search of almost 900,000 crash narratives from NorthCarolina (9). The narratives covered the years 1989, 1992 through 1994, and the first part of1995. The search retrieved 3,892 narratives, of which 87 were determined to be cell phone-related crashes. The number of cell phone-related crashes per year was adjusted according to thetotal number of crashes in each year. Regression analysis was carried out using the number ofcell phones in use in the U.S. as the independent variable and the adjusted number of cell phone-

22
related crashes as the dependent variable. The results showed that the number of cell phone-related crashes is increasing as cell phones become more common.
The Fatality Analysis Reporting System (FARS) is a census of all fatal motor vehiclecrashes in the U.S. It contains data on about 40,000 annual fatalities. FARS relies on policecrash reports from each state for information on fatal crashes. Thus, FARS data are only ascomplete and accurate as the original state data. Oklahoma and Minnesota were the first states tospecify cell phone use on their police crash reports. At least 15 additional states now track cellphone crashes. In the FARS data, there were 36 crashes in 1994 and 40 crashes in 1995 thatincluded cell phone use as a Apossible distraction inside the vehicle.@ (9)
The National Automotive Sampling System (NASS) contains data on a stratified randomsample of about 5,000 police-reported crashes in the U.S. per year. The NASS data files for1995 contained eight cell phone-related crashes. It is estimated that these cases represented3,837 similar cases nationally (9).
Goodman et al. also analyzed 28 cell phone-related crashes (9). Data for 11 crashes wereincluded in FARS or NASS, and data for the remaining 17 crashes were obtained from othersources. The cell phone user was considered to be at fault in all 28 crashes. With regard to crashcircumstances, 15 crashes occurred when drivers strayed out of their lanes, 8 crashes occurredwith stopped vehicles in the same lane, and 5 crashes occurred when drivers failed to stop for redlights.
Reinfurt et al. conducted a two-month pilot study with the North Carolina State HighwayPatrol, where investigating troopers filled out a supplemental data form for crashes where therewas any indication of cell phone involvement (2). For 11 crashes out of 6,686 (or 0.16 percent),the trooper indicated that a cell phone was being used at the time of the crash. The data on thesupplemental forms were interpreted to determine the driver action, driver contributing factor,crash type, and vehicle maneuver. The most common driver actions were answering phone (3crashes) and talking on phone (2 crashes). Driver contributing factors included the driver takinghis/her eyes off the road and/or losing control because both hands were not on the steering wheel(5 crashes) and driver inattention (2 crashes). Ran-off-road was the most common (5 crashes)crash type, followed by rear-end (3 crashes). With respect to vehicle maneuver, the driver wasgoing straight in 10 crashes and turning left in one crash.
Methods
Data CollectionSince 1971, information from North Carolina police crash reports, including the officers=
narratives, have been entered into a computerized data base. To identify cell phone crashes foranalysis, crash narratives for a study period from January 1, 1996 through August 31, 2000 weresearched. Four search words from Goodman et al. (9) were used: (1) answer, (2) carphone, (3)cell, and (4) dial. The Ahits@ (narratives containing one or more search words) were printed andread to determine their relevance. Some crashes turned out to be not cell phone-related. Forexample, the search word Aanswer@ retrieved several narratives containing expressions such as

23
Aanswering machine@ and Adid not answer [officer=s] questions.@ The narrative search identified atotal of 452 cell phone crashes that occurred during the study period (Table 3.1).
TABLE 3.1 Narrative-indicated Cell Phone Crashes in North Carolinaby Year and by Driver Action
Driver ActionGoodman et al. (9) Current Study Total
1989 1992 1993 1994 1995 1996 1997 1998 1999 2000* N %
Dialing phone 1 0 3 3 0 4 5 4 13 11 44 8.2
Answering phone 2 3 3 1 1 3 6 11 18 31 79 14.7
Talking on phone 6 7 5 12 7 12 15 19 44 120 247 45.8
Hanging up phone 2 1 3 0 1 0 4 3 3 9 26 4.8
Reaching for phone 1 2 4 0 4 1 1 8 12 20 53 9.8
Dropping phone 0 0 0 0 0 1 0 1 2 0 4 0.7
Picking up droppedphone
0 1 2 3 4 1 1 2 5 15 34 6.3
Looking at or forphone
0 0 2 0 1 0 2 4 11 19 39 7.2
Startled by ringingphone
0 0 0 0 0 0 0 1 3 4 8 1.5
Pulled over to usephone
0 0 0 1 1 0 1 0 0 2 5 0.9
TOTAL CASES 12 14 22 20 19 22 35 53 111 231 539 100.0
* January 1 through August 31, 2000.
After the narratives were read, a driver action (such as Atalking on phone@ or Areaching forphone@) was assigned to each crash. Table 3.1 lists the number of cell phone crashes by year anddriver action. The data and assigned driver actions for 1989 through 1995 are from Goodman etal. (9), and the data for 1996 through August 31, 2000 are from the current study. The number ofcell phone crashes was roughly 20 per year from 1993 through 1996, and then increaseddramatically after 1996. In fact, the number more than doubled from 1998 to 1999, and againfrom 1999 to 2000. Over the 10-year period, the most common driver action was Atalking on thephone,@ which accounted for 46 percent of cell phone crashes. In another 15 percent, the driverwas Aanswering the phone.@ AReaching for the phone@ (10 percent) was the third most commonaction.
24
The actual number of cell phone crashes is undoubtedly higher than the 452 that wereidentified. Many drivers may not admit that they were using a cell phone when they crashed. Inaddition, the investigating officer may not think to record cell phone use in the narrative or mayuse words other than Aanswer,@ Acarphone,@ Acell,@ or Adial@ to indicate that a cell phone wassomehow involved. The extent of underreporting and the number of cell phone crashes that werenot identified by the narrative search are not known. Because of these difficulties in identifyingcell phone crashes, it is likely that some were erroneously classified as non-cell phone crashes.
Data AnalysisDuring the study period, there were 452 cell phone crashes (identified through the narrative
search) and about 1,080,000 non-cell phone crashes, involving about 1,900,000 vehicles. Thus,the identified cell phone crashes were 0.04 percent of all crashes. As would be expected from theincrease in cell phone ownership, the proportion of cell phone crashes increased year-by-year. In1996, there were 22 out of about 228,000, or 0.01 percent. In the first 8 months of 2000, therewere 231 out of about 151,000, or 0.15 percent.
Cross-tabulations were constructed to compare cell phone and non-cell phone crashes foreach of several crash, roadway, driver, and vehicle variables. The findings are discussed below. Each figure shows the sample sizes of crashes or vehicles that were used in the analysis for thatvariable. The sample sizes vary because some crashes had missing data. The chi-square statisticwas computed to determine whether the differences were statistically significant. The reader isadvised that with large sample sizes, a small percentage difference may be statisticallysignificant. It is up to the reader to decide whether the differences are meaningful or of practicalsignificance.
A revised crash report form was implemented in North Carolina on January 1, 2000. Forsome variables, the categories remained the same both before and after the revision. Oneexample is Aroad class.@ The number of crashes for each road class (Interstate, US route, etc.) in1996-1999 was added to the corresponding number of crashes in 2000 to obtain the 1996-2000numbers for use in the analysis described below. For other variables, categories were changedand new ones were added. One example is Amost harmful event.@ In 1996-1999, there were 23categories, including one for fixed object. In 2000, there were 64 categories, as 32 fixed objects(tree, utility pole, etc.) were now specified. To maintain consistency in the analyses, somecategories were combined so that they could be matched. The 32 categories of fixed objects in2000 were combined into one. Then the numbers of fixed-object crashes in 1996-1999 and in2000 were added to obtain the 1996-2000 number for use in the analysis.
Results
The results described in this section pertain to crashes occurring from January 1, 1996through August 31, 2000. Crash variables are presented first, followed by roadway, driver, andvehicle variables. The term Acell phone crash@ refers to a crash in which a driver was using a cellphone at the time of the crash. A Acell phone driver@ is one who was using a cell phone at thetime of the crash. A Acell phone vehicle@ is one whose driver was using a cell phone at the timeof the crash.

25
54.8%58.4%
36.2% 27.3%
6.4%10.6%
0.5% 0.6%2.1% 3.1%
0%
10%
20%
30%
40%
50%
60%
70%
80%
90%
100%
Yes (N=425) No (N=1,080,212)
Cell Phone Use
Perc
ent o
f Cra
shes
K
A
B
C
O
Crash SeverityInjury severity is determined using the KABCO injury scale. For each person involved in
the crash, the investigating officer determines the level of injury. In descending order of severity,they are as follows:
K FatalA Incapacitating injuryB Non-incapacitating injuryC Possible injuryO No injury
Crash severity is defined as the most severe injury that any driver, passenger, or non-occupant involved in the crash received. Cell phone crashes were more likely to result in a C-level injury (36.2 percent), compared to non-cell phone crashes (27.3 percent) (Figure 3.1). Cellphone crashes were less likely to result in a more severe injury (9.0 percent vs. 14.3 percent). Only two cell phone crashes (0.5 percent) were fatal. This finding can be understood byexamining the types of cell phone and non-cell phone crashes that occur. Most notably, cellphone crashes are more likely to be rear-end than non-cell phone crashes, and rear-end crashesare generally less severe than some other crash types. The difference by crash severity wassignificant (P2
4df = 21.9068, p = 0.0002).
Figure 3.1. Crash severity by cell phone use.
26
18.5
%
0.5%
4.6%
0.0%
0.0%
45.1
%
3.9%
1.6%
0.2%
5.0%
18.3
%
0.9% 1.4%
20.5
%
0.9%
3.4%
0.5%
5.1%
25.6
%
13.8
%
2.6%
1.0%
5.1%
14.6
%
5.2%
1.7%
0%
5%
10%
15%
20%
25%
30%
35%
40%
45%
50%
Ran O
ff Roa
d
Pedes
trian
Parke
d Veh
icle
Bicycle
Animal
Rear E
nd
Left
Turn
Right T
urn
Head
On
Sidesw
ipe
Angle
Backin
gOth
er
Crash Type
Perc
ent o
f Cra
shes
Yes (N=437) No (N=1,091,837)
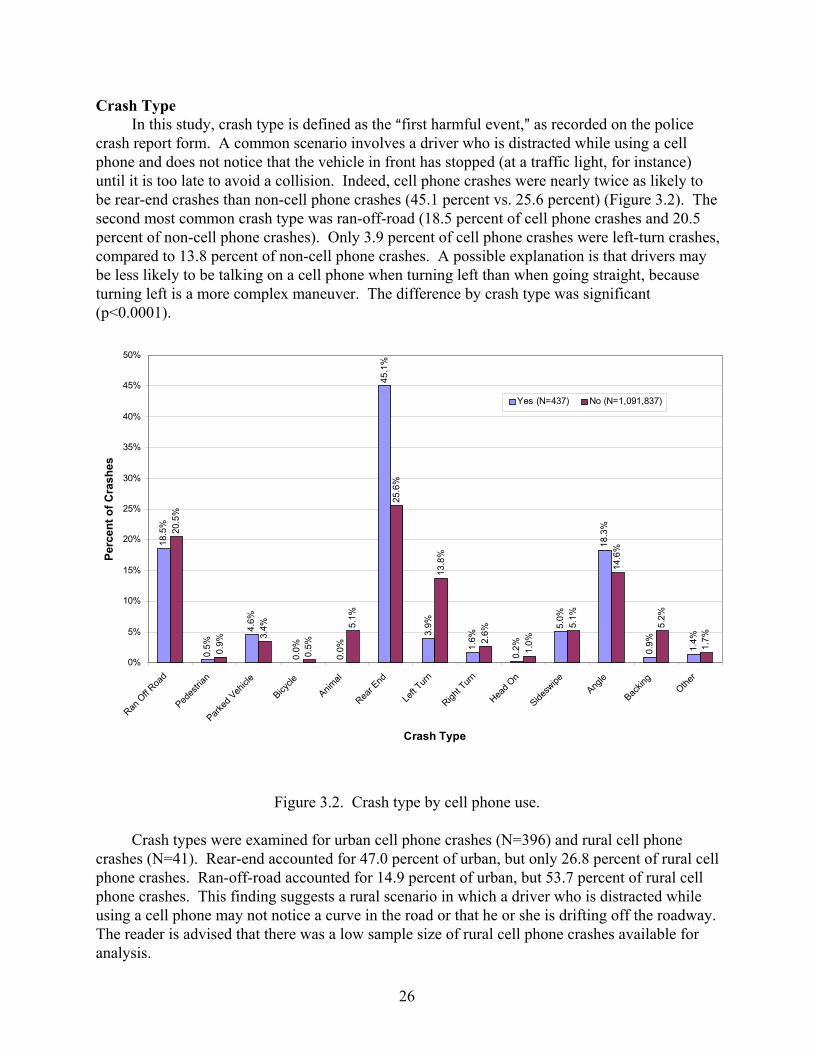
Crash TypeIn this study, crash type is defined as the Afirst harmful event,@ as recorded on the police
crash report form. A common scenario involves a driver who is distracted while using a cellphone and does not notice that the vehicle in front has stopped (at a traffic light, for instance)until it is too late to avoid a collision. Indeed, cell phone crashes were nearly twice as likely tobe rear-end crashes than non-cell phone crashes (45.1 percent vs. 25.6 percent) (Figure 3.2). Thesecond most common crash type was ran-off-road (18.5 percent of cell phone crashes and 20.5percent of non-cell phone crashes). Only 3.9 percent of cell phone crashes were left-turn crashes,compared to 13.8 percent of non-cell phone crashes. A possible explanation is that drivers maybe less likely to be talking on a cell phone when turning left than when going straight, becauseturning left is a more complex maneuver. The difference by crash type was significant(p<0.0001).
Figure 3.2. Crash type by cell phone use.
Crash types were examined for urban cell phone crashes (N=396) and rural cell phonecrashes (N=41). Rear-end accounted for 47.0 percent of urban, but only 26.8 percent of rural cellphone crashes. Ran-off-road accounted for 14.9 percent of urban, but 53.7 percent of rural cellphone crashes. This finding suggests a rural scenario in which a driver who is distracted whileusing a cell phone may not notice a curve in the road or that he or she is drifting off the roadway.The reader is advised that there was a low sample size of rural cell phone crashes available foranalysis.
27
8.2%
1.9%
12.4%
26.7%
33.5%
17.3%
7.8%
4.3%
16.8%
21.6%
32.0%
17.4%
0%
5%
10%
15%
20%
25%
30%
35%
40%
10 PM - 1:59 AM 2 AM - 5:59 AM 6 AM - 9:59 AM 10 AM - 1:59 PM 2 PM - 5:59 PM 6 PM - 9:59 PM
Hour
Perc
ent o
f Cra
shes
Yes (N=427) No (N=1,079,612)
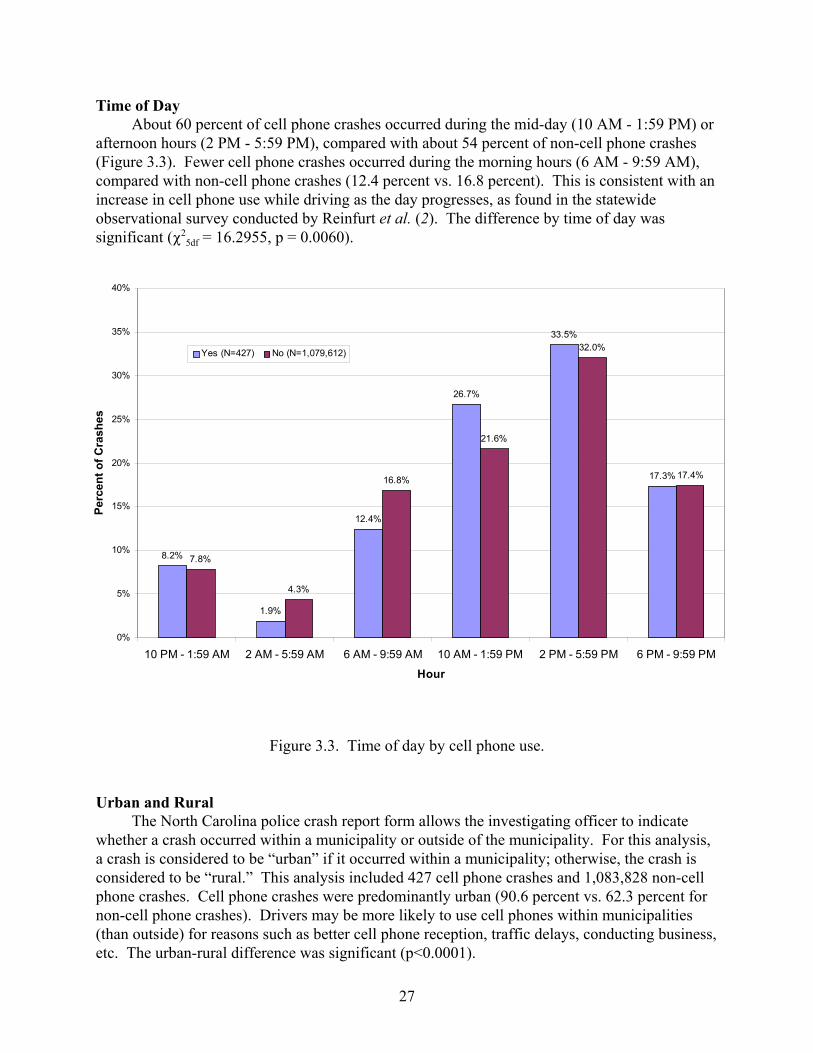
Time of DayAbout 60 percent of cell phone crashes occurred during the mid-day (10 AM - 1:59 PM) or
afternoon hours (2 PM - 5:59 PM), compared with about 54 percent of non-cell phone crashes(Figure 3.3). Fewer cell phone crashes occurred during the morning hours (6 AM - 9:59 AM),compared with non-cell phone crashes (12.4 percent vs. 16.8 percent). This is consistent with anincrease in cell phone use while driving as the day progresses, as found in the statewideobservational survey conducted by Reinfurt et al. (2). The difference by time of day wassignificant (P2
5df = 16.2955, p = 0.0060).
Figure 3.3. Time of day by cell phone use.
Urban and RuralThe North Carolina police crash report form allows the investigating officer to indicate
whether a crash occurred within a municipality or outside of the municipality. For this analysis,a crash is considered to be “urban” if it occurred within a municipality; otherwise, the crash isconsidered to be “rural.” This analysis included 427 cell phone crashes and 1,083,828 non-cellphone crashes. Cell phone crashes were predominantly urban (90.6 percent vs. 62.3 percent fornon-cell phone crashes). Drivers may be more likely to use cell phones within municipalities(than outside) for reasons such as better cell phone reception, traffic delays, conducting business,etc. The urban-rural difference was significant (p<0.0001).
28
2.6%
12.4
%
8.0%
6.3%
69.8
%
0.7%
0.2%
5.4%
14.4
%
13.4
%
20.6
%
37.9
%
7.5%
0.8%
0%
10%
20%
30%
40%
50%
60%
70%
80%
Interstate US Route NC Route SecondaryRoute
Local Street Other PublicRoad
PrivateRoad, Prop,
Driveway
Road Class
Perc
ent o
f Cra
shes
Yes (N=427)
No (N=1,080,787)
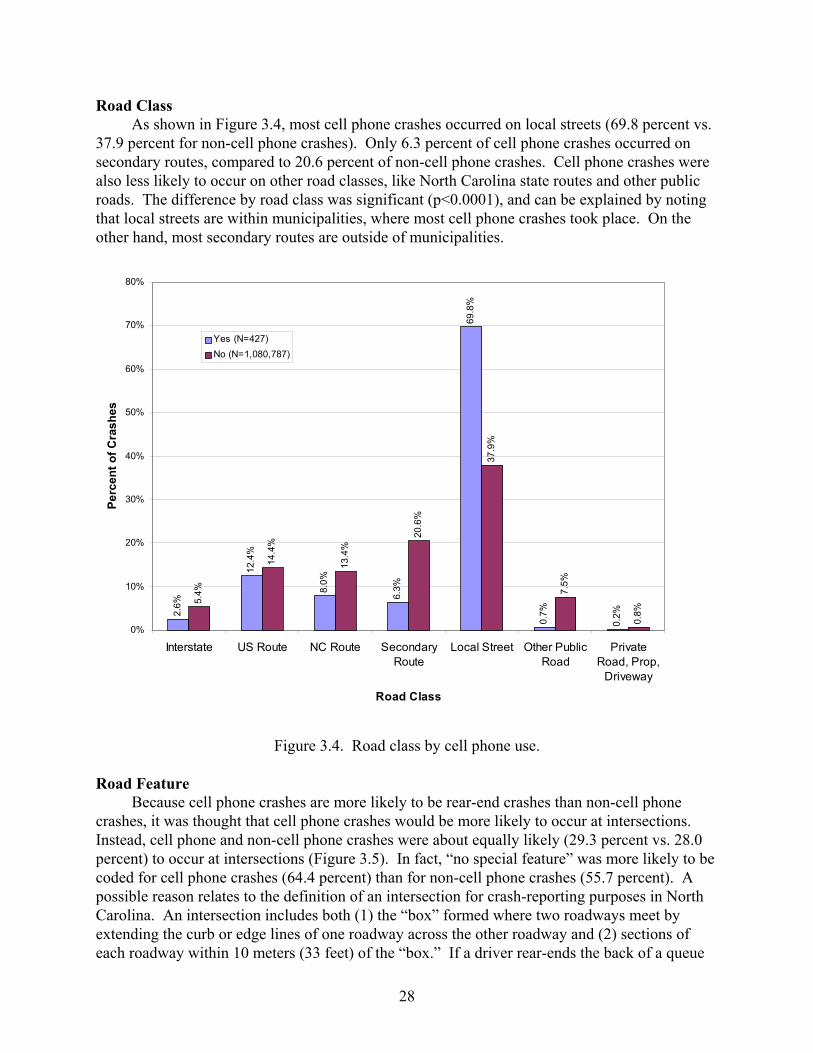
Road ClassAs shown in Figure 3.4, most cell phone crashes occurred on local streets (69.8 percent vs.
37.9 percent for non-cell phone crashes). Only 6.3 percent of cell phone crashes occurred onsecondary routes, compared to 20.6 percent of non-cell phone crashes. Cell phone crashes werealso less likely to occur on other road classes, like North Carolina state routes and other publicroads. The difference by road class was significant (p<0.0001), and can be explained by notingthat local streets are within municipalities, where most cell phone crashes took place. On theother hand, most secondary routes are outside of municipalities.
Figure 3.4. Road class by cell phone use.
Road FeatureBecause cell phone crashes are more likely to be rear-end crashes than non-cell phone
crashes, it was thought that cell phone crashes would be more likely to occur at intersections. Instead, cell phone and non-cell phone crashes were about equally likely (29.3 percent vs. 28.0percent) to occur at intersections (Figure 3.5). In fact, “no special feature” was more likely to becoded for cell phone crashes (64.4 percent) than for non-cell phone crashes (55.7 percent). Apossible reason relates to the definition of an intersection for crash-reporting purposes in NorthCarolina. An intersection includes both (1) the “box” formed where two roadways meet byextending the curb or edge lines of one roadway across the other roadway and (2) sections ofeach roadway within 10 meters (33 feet) of the “box.” If a driver rear-ends the back of a queue
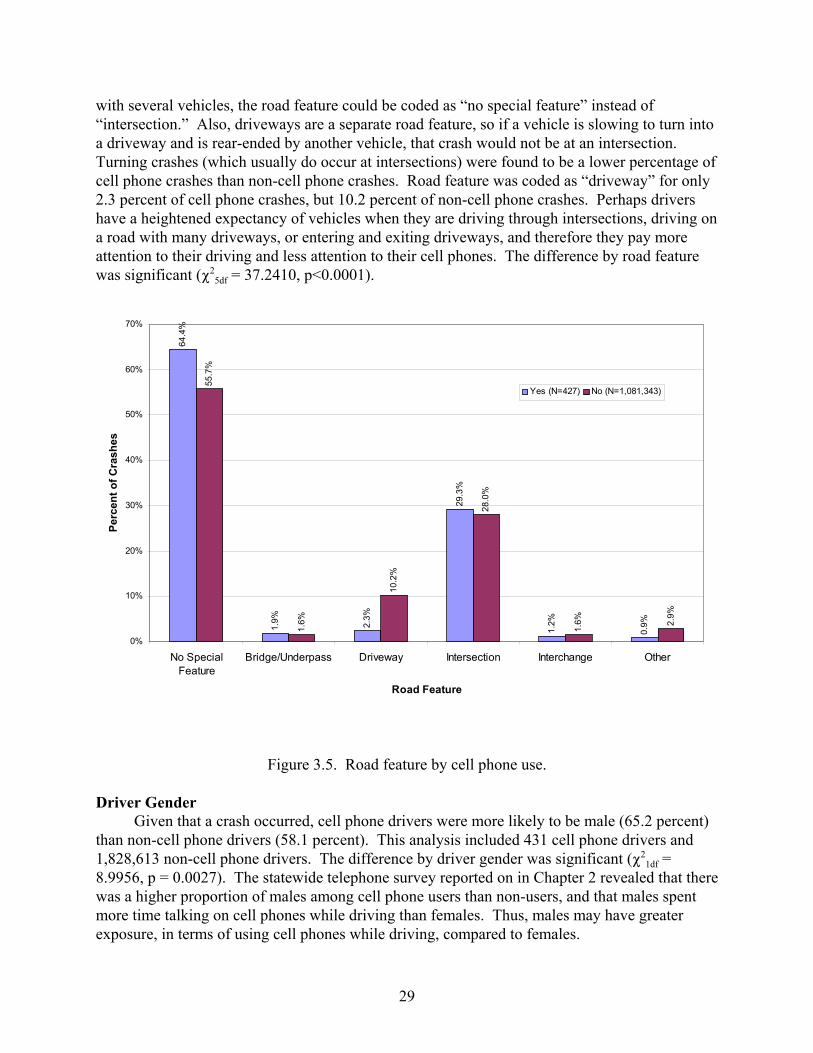
29
64
.4%
1.9% 2.3%
29
.3%
1.2%
0.9%
55
.7%
1.6%
10
.2%
28
.0%
1.6% 2.
9%
0%
10%
20%
30%
40%
50%
60%
70%
No SpecialFeature
Bridge/Underpass Driveway Intersection Interchange Other
Road Feature
Perc
ent o
f Cra
shes
Yes (N=427) No (N=1,081,343)
with several vehicles, the road feature could be coded as “no special feature” instead of“intersection.” Also, driveways are a separate road feature, so if a vehicle is slowing to turn intoa driveway and is rear-ended by another vehicle, that crash would not be at an intersection. Turning crashes (which usually do occur at intersections) were found to be a lower percentage ofcell phone crashes than non-cell phone crashes. Road feature was coded as “driveway” for only2.3 percent of cell phone crashes, but 10.2 percent of non-cell phone crashes. Perhaps drivershave a heightened expectancy of vehicles when they are driving through intersections, driving ona road with many driveways, or entering and exiting driveways, and therefore they pay moreattention to their driving and less attention to their cell phones. The difference by road featurewas significant (P2
5df = 37.2410, p<0.0001).
Figure 3.5. Road feature by cell phone use.
Driver GenderGiven that a crash occurred, cell phone drivers were more likely to be male (65.2 percent)
than non-cell phone drivers (58.1 percent). This analysis included 431 cell phone drivers and1,828,613 non-cell phone drivers. The difference by driver gender was significant (P2
1df = 8.9956, p = 0.0027). The statewide telephone survey reported on in Chapter 2 revealed that therewas a higher proportion of males among cell phone users than non-users, and that males spentmore time talking on cell phones while driving than females. Thus, males may have greaterexposure, in terms of using cell phones while driving, compared to females.
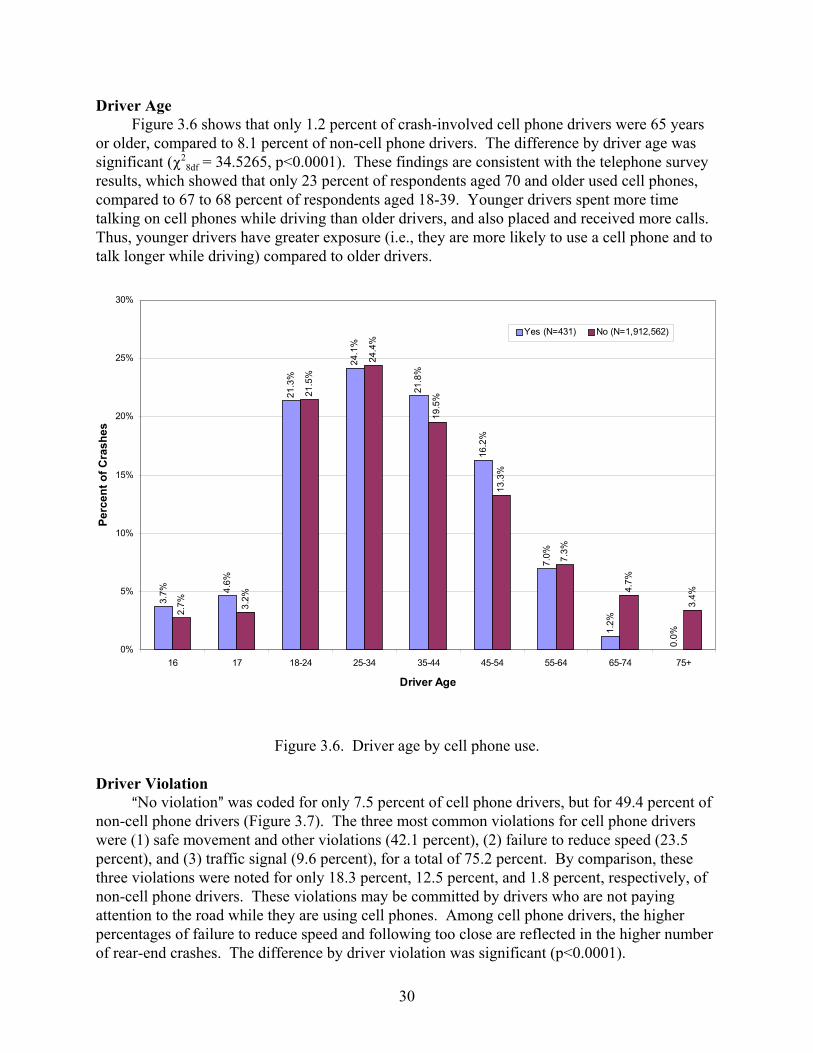
30
3.7% 4.
6%
21.3
%
24.1
%
21.8
%
16.2
%
7.0%
1.2%
0.0%
2.7% 3.
2%
21.5
%
24.4
%
19.5
%
13.3
%
7.3%
4.7%
3.4%
0%
5%
10%
15%
20%
25%
30%
16 17 18-24 25-34 35-44 45-54 55-64 65-74 75+
Driver Age
Perc
ent o
f Cra
shes
Yes (N=431) No (N=1,912,562)
Driver AgeFigure 3.6 shows that only 1.2 percent of crash-involved cell phone drivers were 65 years
or older, compared to 8.1 percent of non-cell phone drivers. The difference by driver age wassignificant (P2
8df = 34.5265, p<0.0001). These findings are consistent with the telephone surveyresults, which showed that only 23 percent of respondents aged 70 and older used cell phones,compared to 67 to 68 percent of respondents aged 18-39. Younger drivers spent more timetalking on cell phones while driving than older drivers, and also placed and received more calls. Thus, younger drivers have greater exposure (i.e., they are more likely to use a cell phone and totalk longer while driving) compared to older drivers.
Figure 3.6. Driver age by cell phone use.
Driver ViolationANo violation@ was coded for only 7.5 percent of cell phone drivers, but for 49.4 percent of
non-cell phone drivers (Figure 3.7). The three most common violations for cell phone driverswere (1) safe movement and other violations (42.1 percent), (2) failure to reduce speed (23.5percent), and (3) traffic signal (9.6 percent), for a total of 75.2 percent. By comparison, thesethree violations were noted for only 18.3 percent, 12.5 percent, and 1.8 percent, respectively, ofnon-cell phone drivers. These violations may be committed by drivers who are not payingattention to the road while they are using cell phones. Among cell phone drivers, the higherpercentages of failure to reduce speed and following too close are reflected in the higher numberof rear-end crashes. The difference by driver violation was significant (p<0.0001).

31
7.5%
3.5%
3.5%
1.9%
9.6%
4.7%
23.5
%
3.5%
42.1
%
49.4
%
2.5%
6.1%
1.0% 1.8%
6.9%
12.5
%
1.3%
18.3
%
0%
10%
20%
30%
40%
50%
60%
No Violation DWI Yield Stop Sign Traffic Signal Speeding Failure toReduce Speed
Following TooClose
Other
Driver Violation
Perc
ent o
f Cra
shes
Yes (N=425) No (N=1,851,483)
Figure 3.7. Driver violation by cell phone use.
Driver violations were examined for urban (N=386) and rural cell phone crashes (N=39).Cell phone drivers were cited for speeding in 2.8 percent of urban and 23.1 percent of rural cellphone crashes. On the other hand, failure to reduce speed was more common in urban than inrural cell phone crashes (24.6 percent vs. 12.8 percent). Traffic signal violations were also morecommon in urban crashes (10.1 percent vs. 5.1 percent). Perhaps speeding is associated withopen stretches of rural road, whereas failure to reduce speed and traffic signal violations areassociated with urban intersections. The reader is advised that there was a low sample size ofrural cell phone crashes available for analysis.
Vehicle TypeAs shown in Figure 3.8, cell phone drivers were less likely to be driving passenger cars
than non-cell phone drivers (62.6 percent vs. 70.5 percent), and more likely to be driving sportutility vehicles (8.4 percent vs. 3.1 percent). The difference by vehicle type was significant(p<0.0001). This finding is consistent with the observational survey, which found that more cellphone users were driving a sport utility vehicle (21 percent) than non-users (12 percent) (2). It isalso consistent with the telephone survey, which found that more cell phone users drove sportutility vehicles (16.9 percent) than non-users (11.4 percent).
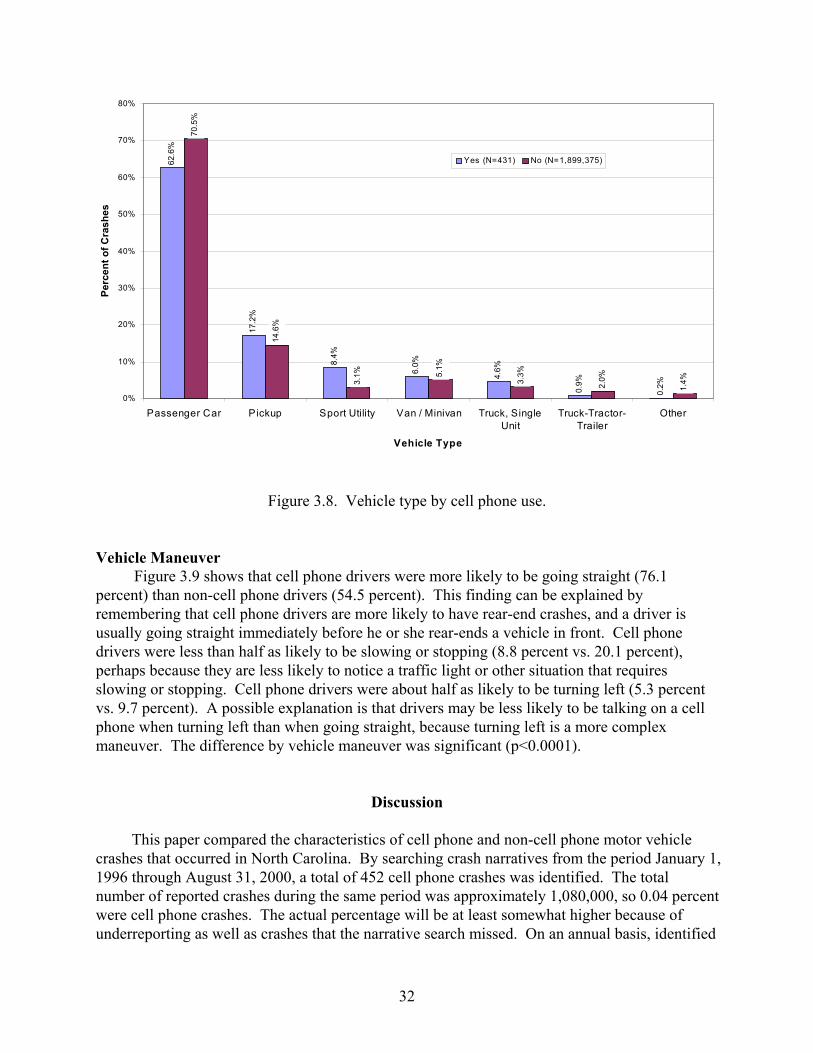
32
62.6
%
17.2
%
8.4%
6.0%
4.6%
0.9%
0.2%
70.5
%
14.6
%
3.1% 5.
1%
3.3%
2.0%
1.4%
0%
10%
20%
30%
40%
50%
60%
70%
80%
Passenger Car Pickup Sport Utility Van / Minivan Truck, SingleUnit
Truck-Tractor-Trailer
Other
Vehicle Type
Perc
ent o
f Cra
shes
Yes (N=431) No (N=1,899,375)
Figure 3.8. Vehicle type by cell phone use.
Vehicle ManeuverFigure 3.9 shows that cell phone drivers were more likely to be going straight (76.1
percent) than non-cell phone drivers (54.5 percent). This finding can be explained byremembering that cell phone drivers are more likely to have rear-end crashes, and a driver isusually going straight immediately before he or she rear-ends a vehicle in front. Cell phonedrivers were less than half as likely to be slowing or stopping (8.8 percent vs. 20.1 percent),perhaps because they are less likely to notice a traffic light or other situation that requiresslowing or stopping. Cell phone drivers were about half as likely to be turning left (5.3 percentvs. 9.7 percent). A possible explanation is that drivers may be less likely to be talking on a cellphone when turning left than when going straight, because turning left is a more complexmaneuver. The difference by vehicle maneuver was significant (p<0.0001).
Discussion
This paper compared the characteristics of cell phone and non-cell phone motor vehiclecrashes that occurred in North Carolina. By searching crash narratives from the period January 1,1996 through August 31, 2000, a total of 452 cell phone crashes was identified. The totalnumber of reported crashes during the same period was approximately 1,080,000, so 0.04 percentwere cell phone crashes. The actual percentage will be at least somewhat higher because ofunderreporting as well as crashes that the narrative search missed. On an annual basis, identified
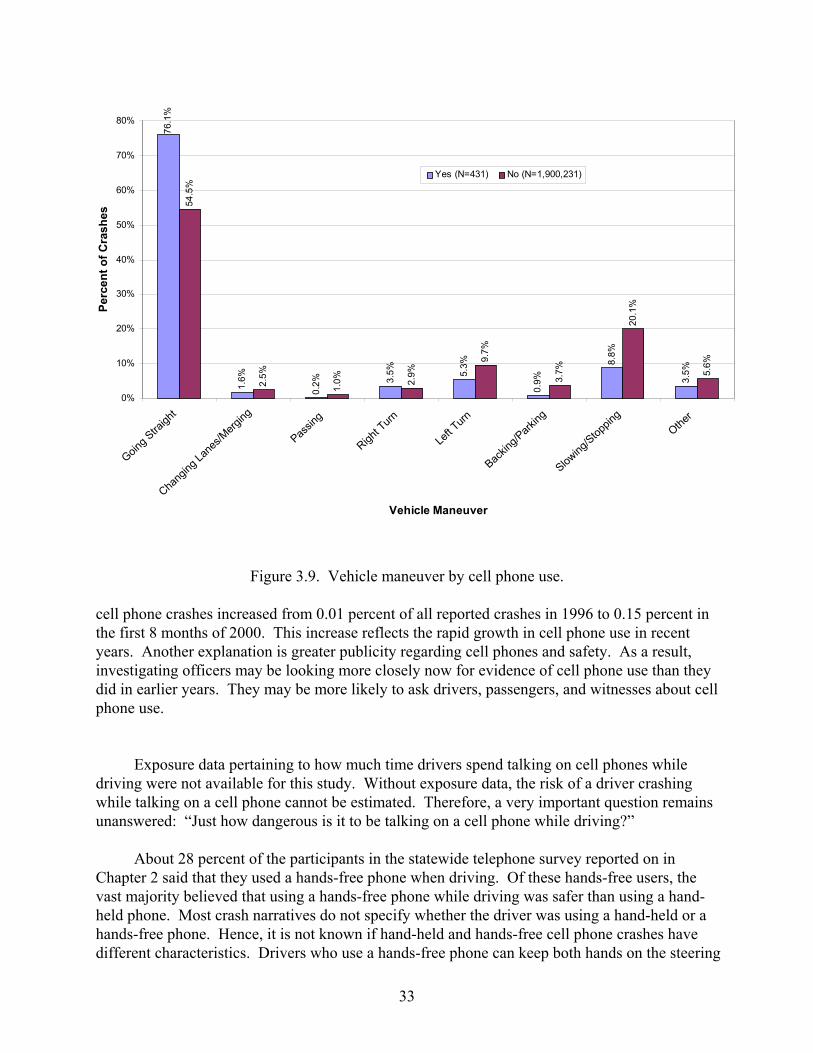
33
76
.1%
1.6
%
0.2
% 3.5
%
5.3
%
0.9
%
8.8
%
3.5
%
54
.5%
2.5
%
1.0
%
2.9
%
9.7
%
3.7
%
20
.1%
5.6
%
0%
10%
20%
30%
40%
50%
60%
70%
80%
Going
Straigh
t
Chang
ing L
anes
/Mer
ging
Passin
g
Right T
urn
Left
Turn
Backin
g/Par
king
Slowing
/Sto
pping
Other
Vehicle Maneuver
Perc
ent o
f Cra
shes
Yes (N=431) No (N=1,900,231)
Figure 3.9. Vehicle maneuver by cell phone use.
cell phone crashes increased from 0.01 percent of all reported crashes in 1996 to 0.15 percent inthe first 8 months of 2000. This increase reflects the rapid growth in cell phone use in recentyears. Another explanation is greater publicity regarding cell phones and safety. As a result,investigating officers may be looking more closely now for evidence of cell phone use than theydid in earlier years. They may be more likely to ask drivers, passengers, and witnesses about cellphone use.
Exposure data pertaining to how much time drivers spend talking on cell phones whiledriving were not available for this study. Without exposure data, the risk of a driver crashingwhile talking on a cell phone cannot be estimated. Therefore, a very important question remainsunanswered: “Just how dangerous is it to be talking on a cell phone while driving?”
About 28 percent of the participants in the statewide telephone survey reported on inChapter 2 said that they used a hands-free phone when driving. Of these hands-free users, thevast majority believed that using a hands-free phone while driving was safer than using a hand-held phone. Most crash narratives do not specify whether the driver was using a hand-held or ahands-free phone. Hence, it is not known if hand-held and hands-free cell phone crashes havedifferent characteristics. Drivers who use a hands-free phone can keep both hands on the steering
34
wheel and maintain better control of their vehicles. An increase in the use of hands-free phonescan potentially reduce the number of crashes that are the result of drivers not maintaining controlof their vehicles. Regardless of whether hands-free or hand-held phones are used, phoneconversations impose cognitive demands upon drivers, distracting their attention from the drivingtask. An increase in the use of hands-free phones is not expected to reduce the number of crashesthat are the result of drivers not paying attention to their driving.
As cell phones continue to proliferate in the U.S., it is expected that the prevalence of cellphone use while driving at any given time will rise above the current 3 to 5 percent level (2-4). The number of cell phone crashes is also likely to increase. It is not known if the number of cellphone crashes will stabilize at some number in the future.
Several approaches could be taken to reduce the occurrence of cell phone crashes. Forexample, drivers could be encouraged to limit their cell phone use while driving, and to placecalls only when their vehicle is stopped or pulled over out of traffic. Automobile insurancecompanies could raise premiums for drivers who use cell phones while driving, or lowerpremiums for drivers who do not own cell phones. Drivers would then have a monetaryincentive to not use cell phones while driving.
Laws could be enacted to restrict cell phone use while driving. Although many states haveconsidered legislation to prohibit the use of cell phones while driving, only New York Statecurrently has a law in place. That law bans the use of a hand-held phone while driving, except inemergency situations. This year (as of November 14, 2002), 102 cell phone-related bills in 31states have been under consideration (13). For example, New Jersey prohibited holders oflearner=s permits Afrom using any interactive wireless device while operating a motor vehicle,@with emergency exceptions. Both Illinois and Rhode Island prohibited school bus drivers fromusing a cell phone while operating a school bus, with emergency exceptions.
It remains to be seen if, and by how much, the level of cell phone use while driving will
decline in response to restrictions. It also remains to be seen if the number of cell phone crasheswill decrease, and by how much. Because relatively few crashes appear to be cell phone crashes,any effect of restrictions on the total number of crashes will be very small. Nevertheless, anydecrease in the number of cell phone crashes will translate into lower health care and lostproductivity costs to society.
Two points are worth keeping in mind when considering how to reduce cell phone crashes. First, cell phones can provide benefits to drivers. For instance, drivers can report disabledvehicles and crashes in a more timely manner. The time spent driving is an opportunity fordrivers to conduct business or socialize. More benefits are identified in Lissy et al. (12). Thequestion is whether the increased crash risk outweighs the benefits. Second, using a cell phone isonly one of many potentially distracting activities in which drivers may engage. They may useother devices such as vehicle navigation systems or personal data assistants, or they may talkwith passengers, eat, reach into the back seat, etc. Therefore, educational and legislative effortsshould not focus solely on cell phones, but also include other devices and distractions. Thechallenge facing lawmakers, researchers, and the cell phone industry is to come up with

35
approaches that not only minimize the risks associated with using cell phones while driving, butalso allow drivers to continue enjoying the benefits of cell phones.
References
1. Cellular Telecommunications & Internet Association. CTIA=s World of WirelessCommunications. http://www.wow-com.com. Accessed July 31, 2002.
2. Reinfurt, D.W., Huang, H.F., Feaganes, J.R. and Hunter, W.W. Cell Phone Use WhileDriving in North Carolina. Highway Safety Research Center, University of North Carolina- Chapel Hill, November 2001. http://www.hsrc.unc.edu/pdf/2001/cellphone.pdf .
3. Crawford, J.A., M.P. Manser, J.M. Jenkins, C.M. Court, and E.D. Sepúlveda. Extent andEffects of Handheld Cellular Telephone Use While Driving. Report No. 167706-1. TexasTransportation Institute, College Station, TX, 2001.
4. Utter, D., 2001. Passenger Vehicle Driver Cell Phone Use: Results from the Fall 2000National Occupant Protection Use Survey. Research Note DOT HS 809 293. NationalHighway Traffic Safety Administration, Washington, DC.
5. McKnight, A.J. and A.S. Mcknight. The Effect of Cellular Phone Use upon DriverAttention. Accident Analysis and Prevention 25(3): 259-265, 1993.
6. Lamble, D., T. Kauranen, M. Laakso, and H. Summala. Cognitive Load and DetectionThresholds in Car Following Situations: Safety Implications for Using Mobile (Cellular)Telephones While Driving. Accident Analysis and Prevention 31(6): 617-623, 1999.
7. Strayer, D.L. and W.A. Johnston. Driven to Distraction: Dual-Task Studies of SimulatedDriving and Conversing on a Cellular Phone. Psychological Science 12(6): 462-466, 2001.
8. Violanti, J.M. and J.R. Marshall. Cellular Phones and Traffic Accidents: AnEpidemiological Approach. Accident Analysis and Prevention 28(2): 265-270, 1996.
9. Goodman, M., F.D. Bents, L. Tijerina, W. Wierwille, N. Lerner, and D. Benel. AnInvestigation of the Safety Implications of Wireless Communications in Vehicles. ReportNo. DOT HS 808-635. National Highway Traffic Safety Administration, Washington, DC,1997.
10. Redelmeier, D.A. and R.J. Tibshirani. Association Between Cellular-Telephone Calls andMotor Vehicle Collisions. The New England Journal of Medicine 336(7): 453-458, 1997.
11. Cain, A., and M. Burris. Investigation of the Use of Mobile Phones While Driving. Centerfor Urban Transportation Research, College of Engineering, University of South Florida,Tampa, FL, 1999.

36
12. Lissy, K.S., J.T. Cohen, M.Y. Park, and J.D. Graham. Cellular Phone Use While Driving:Risks and Benefits. Phase I Report. Harvard Center for Risk Analysis, Harvard School ofPublic Health, Boston, MA, 2000.
13. National Conference of State Legislatures Legislative Tracking Database.http://www.nhtsa.dot.gov/ncsl/Index.cfm. Accessed July 8, 2002.
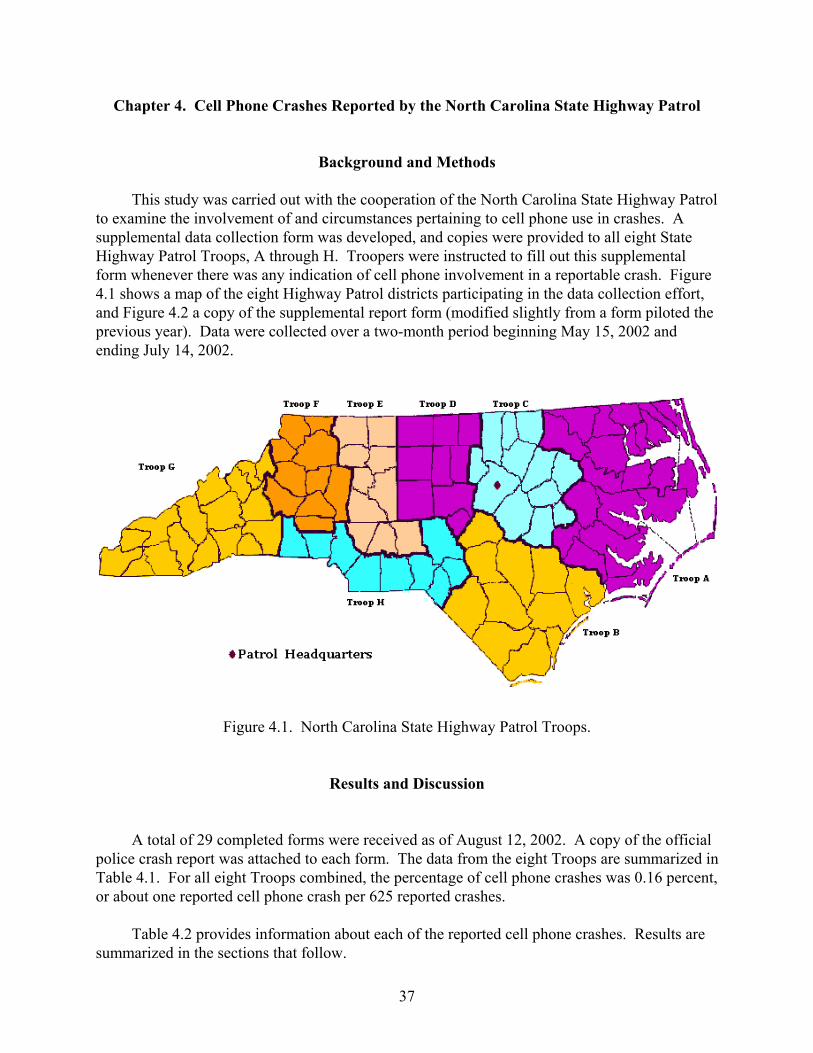
37
Chapter 4. Cell Phone Crashes Reported by the North Carolina State Highway Patrol
Background and Methods
This study was carried out with the cooperation of the North Carolina State Highway Patrolto examine the involvement of and circumstances pertaining to cell phone use in crashes. Asupplemental data collection form was developed, and copies were provided to all eight StateHighway Patrol Troops, A through H. Troopers were instructed to fill out this supplementalform whenever there was any indication of cell phone involvement in a reportable crash. Figure4.1 shows a map of the eight Highway Patrol districts participating in the data collection effort,and Figure 4.2 a copy of the supplemental report form (modified slightly from a form piloted theprevious year). Data were collected over a two-month period beginning May 15, 2002 andending July 14, 2002.
Figure 4.1. North Carolina State Highway Patrol Troops.
Results and Discussion
A total of 29 completed forms were received as of August 12, 2002. A copy of the officialpolice crash report was attached to each form. The data from the eight Troops are summarized inTable 4.1. For all eight Troops combined, the percentage of cell phone crashes was 0.16 percent,or about one reported cell phone crash per 625 reported crashes.
Table 4.2 provides information about each of the reported cell phone crashes. Results aresummarized in the sections that follow.
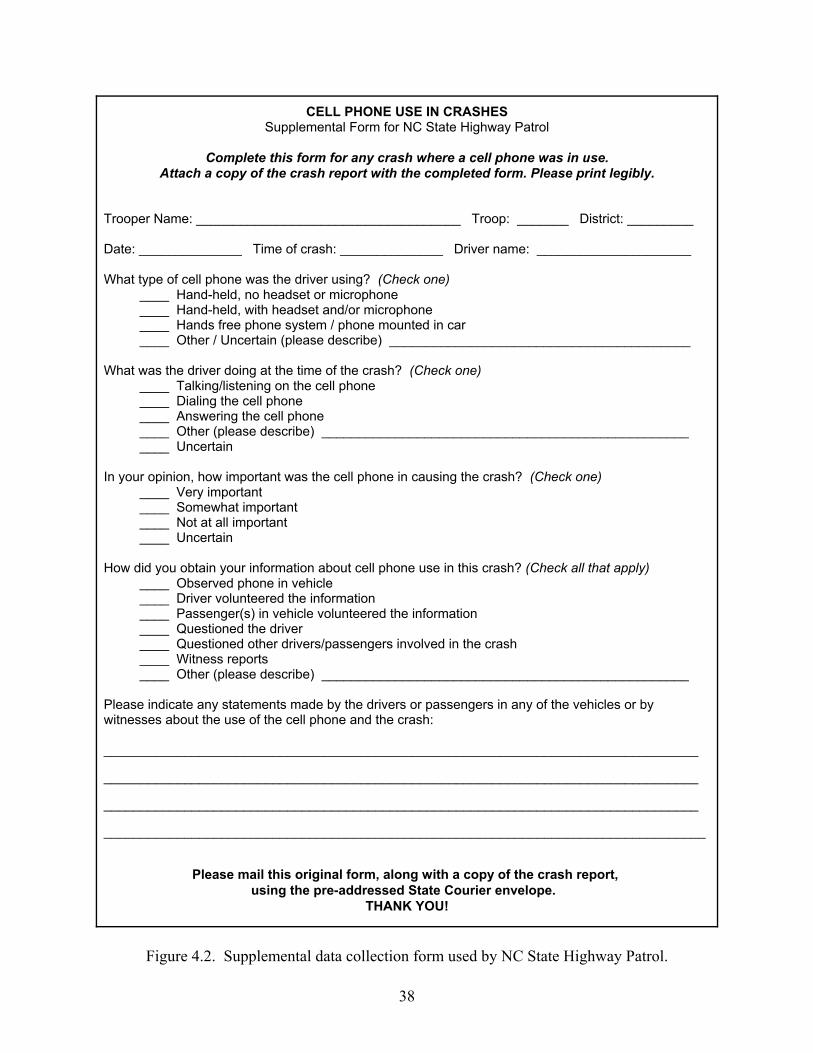
38
CELL PHONE USE IN CRASHESSupplemental Form for NC State Highway Patrol
Complete this form for any crash where a cell phone was in use.Attach a copy of the crash report with the completed form. Please print legibly.
Trooper Name: ____________________________________ Troop: _______ District: _________
Date: ______________ Time of crash: ______________ Driver name: _____________________
What type of cell phone was the driver using? (Check one) ____ Hand-held, no headset or microphone
____ Hand-held, with headset and/or microphone____ Hands free phone system / phone mounted in car____ Other / Uncertain (please describe) _________________________________________
What was the driver doing at the time of the crash? (Check one)____ Talking/listening on the cell phone____ Dialing the cell phone____ Answering the cell phone____ Other (please describe) ______________________________________________________ Uncertain
In your opinion, how important was the cell phone in causing the crash? (Check one) ____ Very important
____ Somewhat important____ Not at all important____ Uncertain
How did you obtain your information about cell phone use in this crash? (Check all that apply)____ Observed phone in vehicle____ Driver volunteered the information____ Passenger(s) in vehicle volunteered the information____ Questioned the driver____ Questioned other drivers/passengers involved in the crash____ Witness reports____ Other (please describe) __________________________________________________
Please indicate any statements made by the drivers or passengers in any of the vehicles or bywitnesses about the use of the cell phone and the crash:
_________________________________________________________________________________
_________________________________________________________________________________
_________________________________________________________________________________
__________________________________________________________________________________
Please mail this original form, along with a copy of the crash report, using the pre-addressed State Courier envelope.
THANK YOU!
Figure 4.2. Supplemental data collection form used by NC State Highway Patrol.
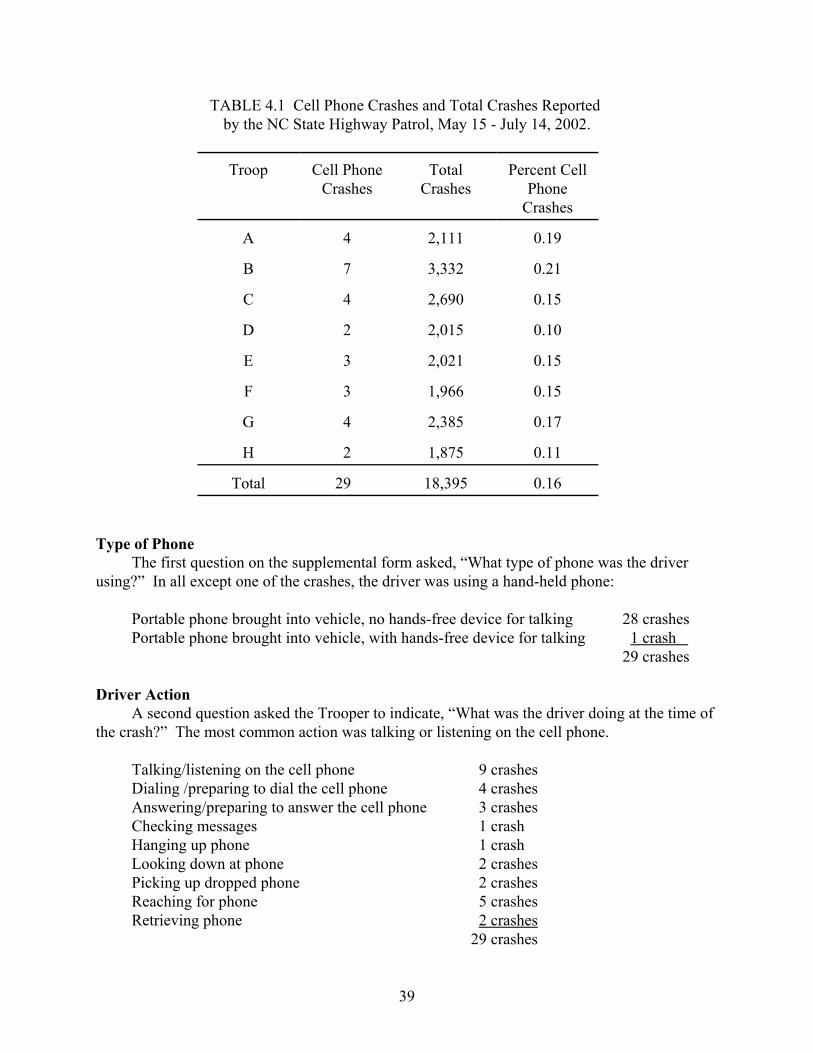
39
TABLE 4.1 Cell Phone Crashes and Total Crashes Reported by the NC State Highway Patrol, May 15 - July 14, 2002.
Troop Cell PhoneCrashes
TotalCrashes
Percent CellPhone
Crashes
A 4 2,111 0.19
B 7 3,332 0.21
C 4 2,690 0.15
D 2 2,015 0.10
E 3 2,021 0.15
F 3 1,966 0.15
G 4 2,385 0.17
H 2 1,875 0.11
Total 29 18,395 0.16
Type of PhoneThe first question on the supplemental form asked, “What type of phone was the driver
using?” In all except one of the crashes, the driver was using a hand-held phone:
Portable phone brought into vehicle, no hands-free device for talking 28 crashesPortable phone brought into vehicle, with hands-free device for talking 1 crash
29 crashes
Driver ActionA second question asked the Trooper to indicate, “What was the driver doing at the time of
the crash?” The most common action was talking or listening on the cell phone.
Talking/listening on the cell phone 9 crashesDialing /preparing to dial the cell phone 4 crashesAnswering/preparing to answer the cell phone 3 crashesChecking messages 1 crashHanging up phone 1 crashLooking down at phone 2 crashesPicking up dropped phone 2 crashesReaching for phone 5 crashesRetrieving phone 2 crashes
29 crashes
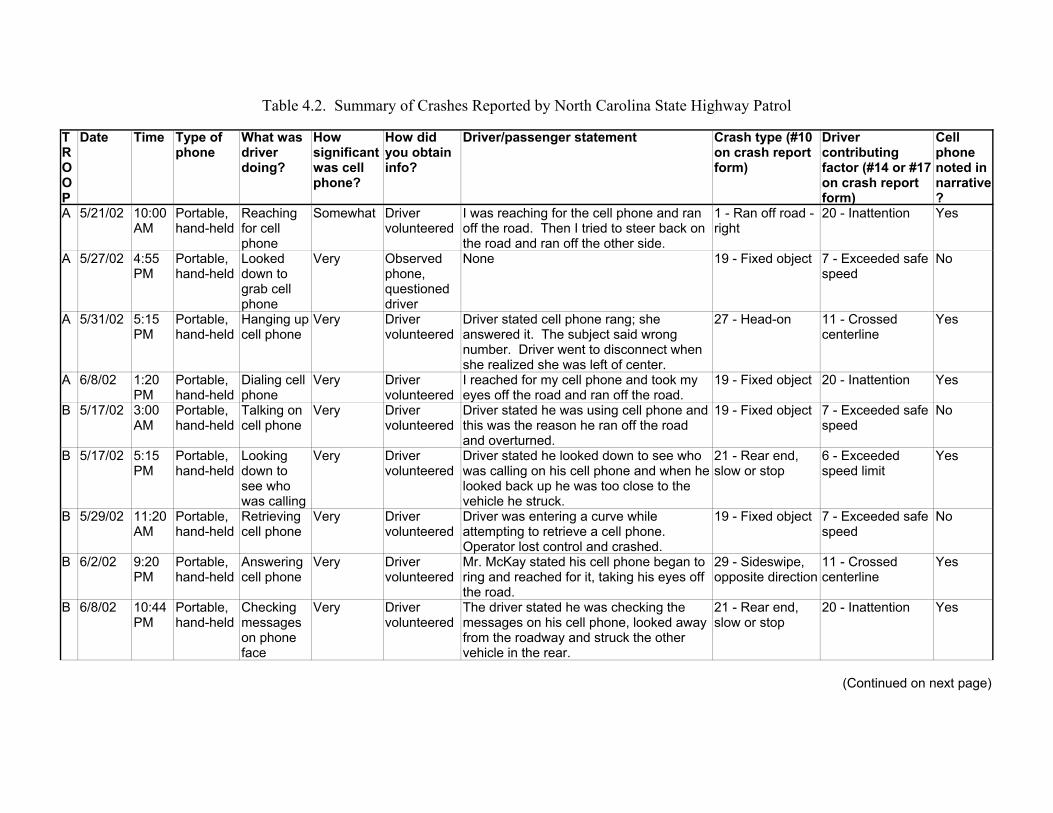
Table 4.2. Summary of Crashes Reported by North Carolina State Highway Patrol
TROOP
Date Time Type ofphone
What wasdriverdoing?
Howsignificantwas cellphone?
How didyou obtaininfo?
Driver/passenger statement Crash type (#10on crash reportform)
Drivercontributingfactor (#14 or #17on crash reportform)
Cellphonenoted innarrative?
A 5/21/02 10:00AM
Portable,hand-held
Reachingfor cellphone
Somewhat Drivervolunteered
I was reaching for the cell phone and ranoff the road. Then I tried to steer back onthe road and ran off the other side.
1 - Ran off road -right
20 - Inattention Yes
A 5/27/02 4:55PM
Portable,hand-held
Lookeddown tograb cellphone
Very Observedphone,questioneddriver
None 19 - Fixed object 7 - Exceeded safespeed
No
A 5/31/02 5:15PM
Portable,hand-held
Hanging upcell phone
Very Drivervolunteered
Driver stated cell phone rang; sheanswered it. The subject said wrongnumber. Driver went to disconnect whenshe realized she was left of center.
27 - Head-on 11 - Crossedcenterline
Yes
A 6/8/02 1:20PM
Portable,hand-held
Dialing cellphone
Very Drivervolunteered
I reached for my cell phone and took myeyes off the road and ran off the road.
19 - Fixed object 20 - Inattention Yes
B 5/17/02 3:00AM
Portable,hand-held
Talking oncell phone
Very Drivervolunteered
Driver stated he was using cell phone andthis was the reason he ran off the roadand overturned.
19 - Fixed object 7 - Exceeded safespeed
No
B 5/17/02 5:15PM
Portable,hand-held
Lookingdown tosee whowas calling
Very Drivervolunteered
Driver stated he looked down to see whowas calling on his cell phone and when helooked back up he was too close to thevehicle he struck.
21 - Rear end,slow or stop
6 - Exceededspeed limit
Yes
B 5/29/02 11:20AM
Portable,hand-held
Retrievingcell phone
Very Drivervolunteered
Driver was entering a curve whileattempting to retrieve a cell phone. Operator lost control and crashed.
19 - Fixed object 7 - Exceeded safespeed
No
B 6/2/02 9:20PM
Portable,hand-held
Answeringcell phone
Very Drivervolunteered
Mr. McKay stated his cell phone began toring and reached for it, taking his eyes offthe road.
29 - Sideswipe,opposite direction
11 - Crossedcenterline
Yes
B 6/8/02 10:44PM
Portable,hand-held
Checkingmessageson phoneface
Very Drivervolunteered
The driver stated he was checking themessages on his cell phone, looked awayfrom the roadway and struck the othervehicle in the rear.
21 - Rear end,slow or stop
20 - Inattention Yes
(Continued on next page)
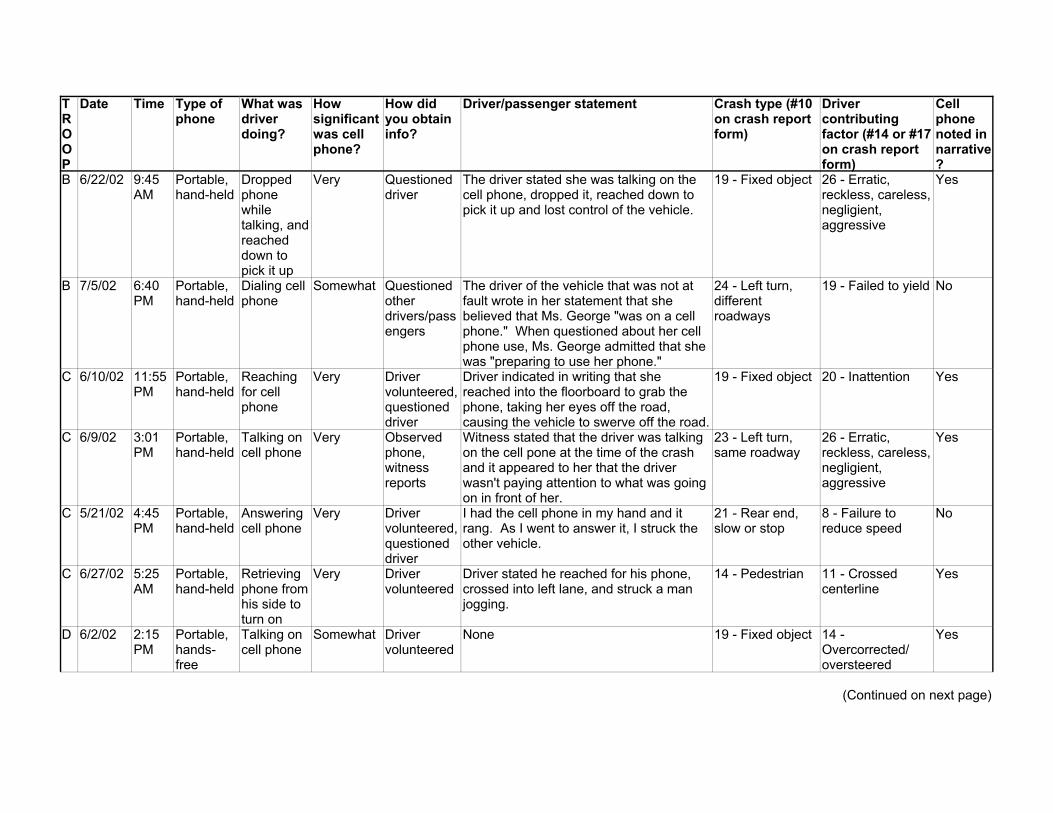
TROOP
Date Time Type ofphone
What wasdriverdoing?
Howsignificantwas cellphone?
How didyou obtaininfo?
Driver/passenger statement Crash type (#10on crash reportform)
Drivercontributingfactor (#14 or #17on crash reportform)
Cellphonenoted innarrative?
B 6/22/02 9:45AM
Portable,hand-held
Droppedphonewhiletalking, andreacheddown topick it up
Very Questioneddriver
The driver stated she was talking on thecell phone, dropped it, reached down topick it up and lost control of the vehicle.
19 - Fixed object 26 - Erratic,reckless, careless,negligient,aggressive
Yes
B 7/5/02 6:40PM
Portable,hand-held
Dialing cellphone
Somewhat Questionedotherdrivers/passengers
The driver of the vehicle that was not atfault wrote in her statement that shebelieved that Ms. George "was on a cellphone." When questioned about her cellphone use, Ms. George admitted that shewas "preparing to use her phone."
24 - Left turn,differentroadways
19 - Failed to yield No
C 6/10/02 11:55PM
Portable,hand-held
Reachingfor cellphone
Very Drivervolunteered,questioneddriver
Driver indicated in writing that shereached into the floorboard to grab thephone, taking her eyes off the road,causing the vehicle to swerve off the road.
19 - Fixed object 20 - Inattention Yes
C 6/9/02 3:01PM
Portable,hand-held
Talking oncell phone
Very Observedphone,witnessreports
Witness stated that the driver was talkingon the cell pone at the time of the crashand it appeared to her that the driverwasn't paying attention to what was goingon in front of her.
23 - Left turn,same roadway
26 - Erratic,reckless, careless,negligient,aggressive
Yes
C 5/21/02 4:45PM
Portable,hand-held
Answeringcell phone
Very Drivervolunteered,questioneddriver
I had the cell phone in my hand and itrang. As I went to answer it, I struck theother vehicle.
21 - Rear end,slow or stop
8 - Failure toreduce speed
No
C 6/27/02 5:25AM
Portable,hand-held
Retrievingphone fromhis side toturn on
Very Drivervolunteered
Driver stated he reached for his phone,crossed into left lane, and struck a manjogging.
14 - Pedestrian 11 - Crossedcenterline
Yes
D 6/2/02 2:15PM
Portable,hands-free
Talking oncell phone
Somewhat Drivervolunteered
None 19 - Fixed object 14 -Overcorrected/oversteered
Yes
(Continued on next page)
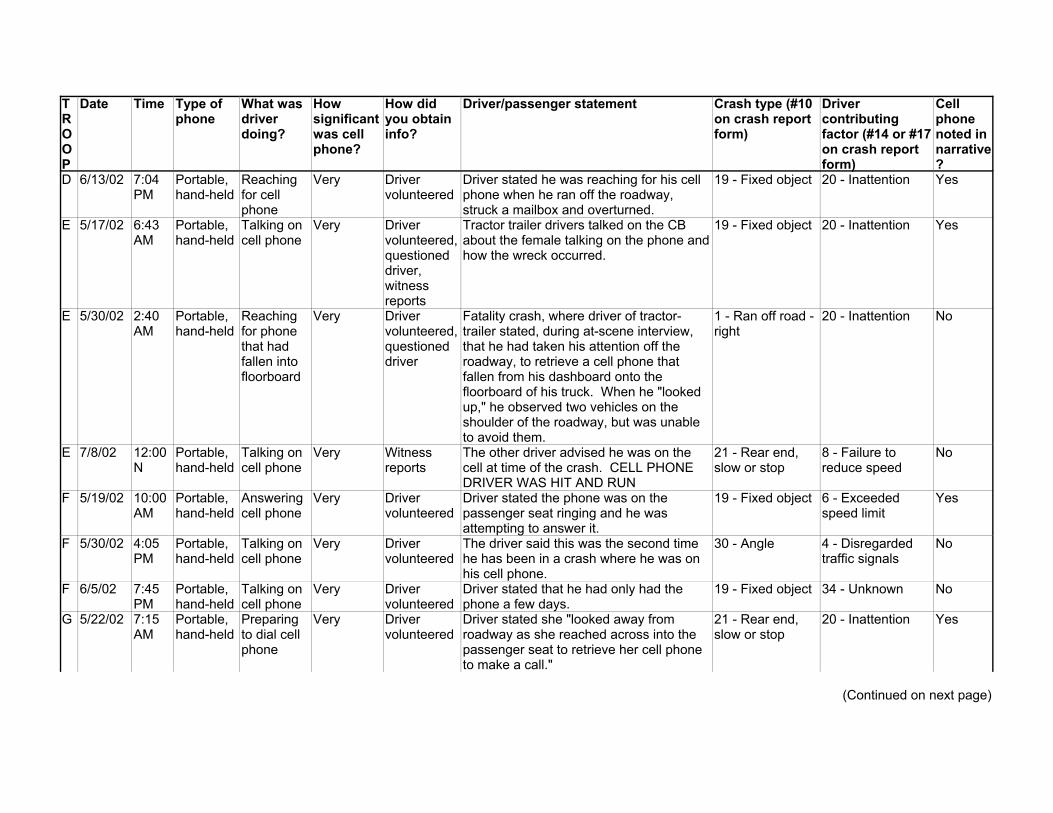
TROOP
Date Time Type ofphone
What wasdriverdoing?
Howsignificantwas cellphone?
How didyou obtaininfo?
Driver/passenger statement Crash type (#10on crash reportform)
Drivercontributingfactor (#14 or #17on crash reportform)
Cellphonenoted innarrative?
D 6/13/02 7:04PM
Portable,hand-held
Reachingfor cellphone
Very Drivervolunteered
Driver stated he was reaching for his cellphone when he ran off the roadway,struck a mailbox and overturned.
19 - Fixed object 20 - Inattention Yes
E 5/17/02 6:43AM
Portable,hand-held
Talking oncell phone
Very Drivervolunteered,questioneddriver,witnessreports
Tractor trailer drivers talked on the CBabout the female talking on the phone andhow the wreck occurred.
19 - Fixed object 20 - Inattention Yes
E 5/30/02 2:40AM
Portable,hand-held
Reachingfor phonethat hadfallen intofloorboard
Very Drivervolunteered,questioneddriver
Fatality crash, where driver of tractor-trailer stated, during at-scene interview,that he had taken his attention off theroadway, to retrieve a cell phone thatfallen from his dashboard onto thefloorboard of his truck. When he "lookedup," he observed two vehicles on theshoulder of the roadway, but was unableto avoid them.
1 - Ran off road -right
20 - Inattention No
E 7/8/02 12:00N
Portable,hand-held
Talking oncell phone
Very Witnessreports
The other driver advised he was on thecell at time of the crash. CELL PHONEDRIVER WAS HIT AND RUN
21 - Rear end,slow or stop
8 - Failure toreduce speed
No
F 5/19/02 10:00AM
Portable,hand-held
Answeringcell phone
Very Drivervolunteered
Driver stated the phone was on thepassenger seat ringing and he wasattempting to answer it.
19 - Fixed object 6 - Exceededspeed limit
Yes
F 5/30/02 4:05PM
Portable,hand-held
Talking oncell phone
Very Drivervolunteered
The driver said this was the second timehe has been in a crash where he was onhis cell phone.
30 - Angle 4 - Disregardedtraffic signals
No
F 6/5/02 7:45PM
Portable,hand-held
Talking oncell phone
Very Drivervolunteered
Driver stated that he had only had thephone a few days.
19 - Fixed object 34 - Unknown No
G 5/22/02 7:15AM
Portable,hand-held
Preparingto dial cellphone
Very Drivervolunteered
Driver stated she "looked away fromroadway as she reached across into thepassenger seat to retrieve her cell phoneto make a call."
21 - Rear end,slow or stop
20 - Inattention Yes
(Continued on next page)

TROOP
Date Time Type ofphone
What wasdriverdoing?
Howsignificantwas cellphone?
How didyou obtaininfo?
Driver/passenger statement Crash type (#10on crash reportform)
Drivercontributingfactor (#14 or #17on crash reportform)
Cellphonenoted innarrative?
G 5/22/02 4:10PM
Portable,hand-held
Reachingfor cellphone
Very Drivervolunteered
Stated she was reaching for the cellphone as she was pulling out onto theroadway, and did not see the approachingvehicle.
24 - Left turn,differentroadways
19 - Failed to yield N
G 7/8/02 8:15AM
Portable,hand-held
Dialing cellphone
Very Observedphone,drivervolunteered
Drove upon another crash and wasattempting to dial 911 for help when shestruck a vehicle in the back.
21 - Rear end,slow or stop
8 - Failure toreduce speed
Y
G 7/12/02 7:20PM
Portable,hand-held
Talking oncell phone
Very Other(sounds likewitness)
None 5 - Overturn/rollover
6 - Exceededspeed limit
N
H 5/23/02 11:45AM
Portable,hand-held
Talking oncell phone
Very Drivervolunteered
Driver of Vehicle 2 stated that he sawdriver of Vehicle 1 on a cell phone. Driverof Vehicle 1 also stated that he was usinghis cell phone at the time of the crash.
21 - Rear end,slow or stop
20 - Inattention N
H 7/2/02 6:00AM
Portable,hand-held
Reachingfor cellphone
Somewhat Questioneddriver
Driver was DWI. 5 - Overturn/rollover
30 - Alcohol use Y

44
Significance of Cell Phone in Causing CrashThe third question on the supplemental form asked the Trooper to give his or her opinion as
to the significance of the cell phone in causing the crash. The cell phone was considered to be“very significant” in 25 crashes (86.2%) and “somewhat significant” in four crashes (13.8%).
Information SourcesThe fourth question asked the Trooper, “How did you obtain your information about cell
phone use in this crash?” In most cases, the driver volunteered the information to the Trooper.
Observed phone in vehicle 3 crashesDriver volunteered the information 22 crashesQuestioned the driver 7 crashesQuestioned other drivers / passengers involved in the crash 1 crashWitness reports 4 crashes
The total adds to more than 29 crashes because two or more information sources were indicatedfor some crashes.
Driver Contributing FactorThe hard-copy police crash reports were examined to determine the driver contributing
factor. When two or more drivers were involved in a crash, the contributing factor pertains to thedriver who was reported to be using a cell phone. The most common contributing factor notedby the Troopers was driver inattention.
Disregarded traffic signals 1 crashExceeded speed limit, exceeded safe speed 6 crashesFailure to reduce speed 3 crashesCrossed centerline 3 crashesOvercorrected 1 crashFailed to yield 2 crashesInattention 9 crashesErratic, reckless, careless, negligent, or aggressive 2 crashesAlcohol 1 crashUnknown 1 crash
29 crashes
Crash TypeThe crash type was determined from the hard-copy police crash reports. Over half of the
crashes involved the cell phone driver’s vehicle running off the road, and another seven casesinvolved the cell phone driver’s vehicle rear-ending the car ahead.
Ran off road 15 crashesPedestrian 1 crashRear end 7 crashesTurning 3 crashesHead-on 1 crash

45
Sideswipe 1 crashAngle 1 crash
29 crashes
Mention of Cell Phone in Narrative“Cell phone” was mentioned in the officer’s narrative for 17 of the 29 crashes. “Cell
phone” was not mentioned in the narratives for the remaining 12 crashes. It is not known if “cellphone” would have been mentioned in any of those 12 narratives, had there not been asupplemental form for the Troopers to fill out. However, it is thought that through the use of thesupplemental form, some cell phone crashes were identified that would have been missed byrelying exclusively on the officer’s narrative. In other words, using the supplemental form maysomewhat reduce underreporting of cell phone crashes.

46
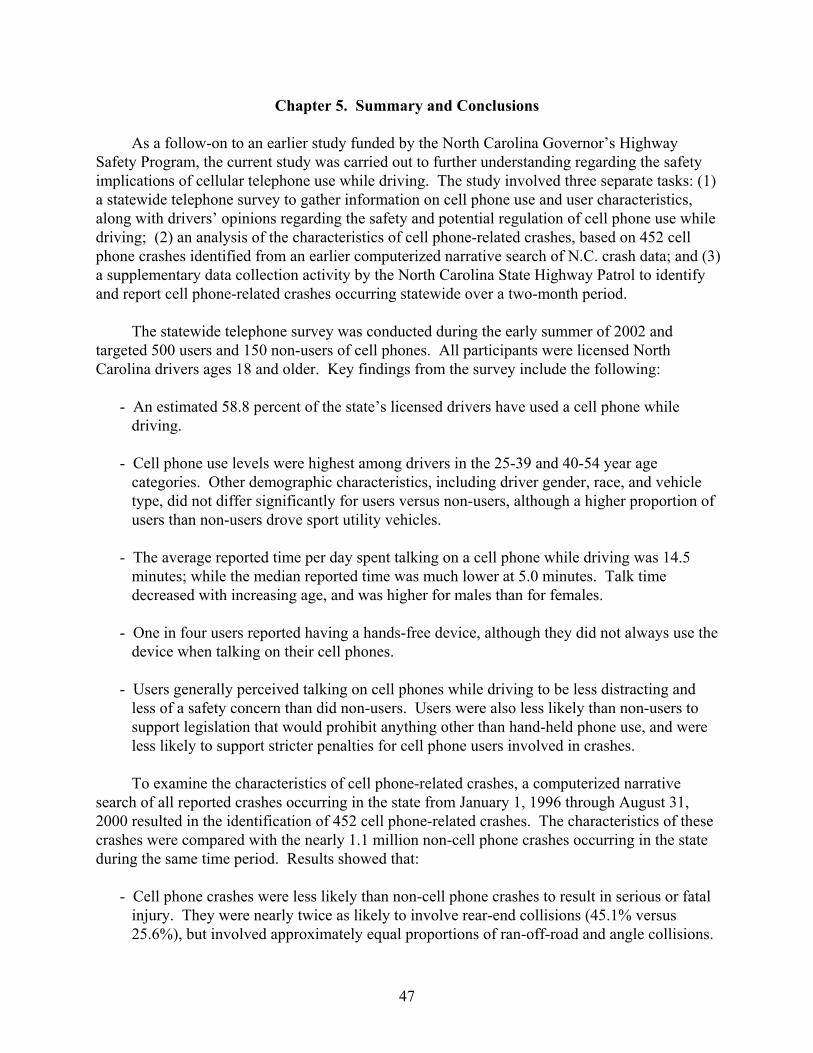
47
Chapter 5. Summary and Conclusions
As a follow-on to an earlier study funded by the North Carolina Governor’s HighwaySafety Program, the current study was carried out to further understanding regarding the safetyimplications of cellular telephone use while driving. The study involved three separate tasks: (1)a statewide telephone survey to gather information on cell phone use and user characteristics,along with drivers’ opinions regarding the safety and potential regulation of cell phone use whiledriving; (2) an analysis of the characteristics of cell phone-related crashes, based on 452 cellphone crashes identified from an earlier computerized narrative search of N.C. crash data; and (3)a supplementary data collection activity by the North Carolina State Highway Patrol to identifyand report cell phone-related crashes occurring statewide over a two-month period.
The statewide telephone survey was conducted during the early summer of 2002 andtargeted 500 users and 150 non-users of cell phones. All participants were licensed NorthCarolina drivers ages 18 and older. Key findings from the survey include the following:
- An estimated 58.8 percent of the state’s licensed drivers have used a cell phone whiledriving.
- Cell phone use levels were highest among drivers in the 25-39 and 40-54 year agecategories. Other demographic characteristics, including driver gender, race, and vehicletype, did not differ significantly for users versus non-users, although a higher proportion ofusers than non-users drove sport utility vehicles.
- The average reported time per day spent talking on a cell phone while driving was 14.5minutes; while the median reported time was much lower at 5.0 minutes. Talk timedecreased with increasing age, and was higher for males than for females.
- One in four users reported having a hands-free device, although they did not always use thedevice when talking on their cell phones.
- Users generally perceived talking on cell phones while driving to be less distracting andless of a safety concern than did non-users. Users were also less likely than non-users tosupport legislation that would prohibit anything other than hand-held phone use, and wereless likely to support stricter penalties for cell phone users involved in crashes.
To examine the characteristics of cell phone-related crashes, a computerized narrativesearch of all reported crashes occurring in the state from January 1, 1996 through August 31,2000 resulted in the identification of 452 cell phone-related crashes. The characteristics of thesecrashes were compared with the nearly 1.1 million non-cell phone crashes occurring in the stateduring the same time period. Results showed that:
- Cell phone crashes were less likely than non-cell phone crashes to result in serious or fatalinjury. They were nearly twice as likely to involve rear-end collisions (45.1% versus25.6%), but involved approximately equal proportions of ran-off-road and angle collisions.
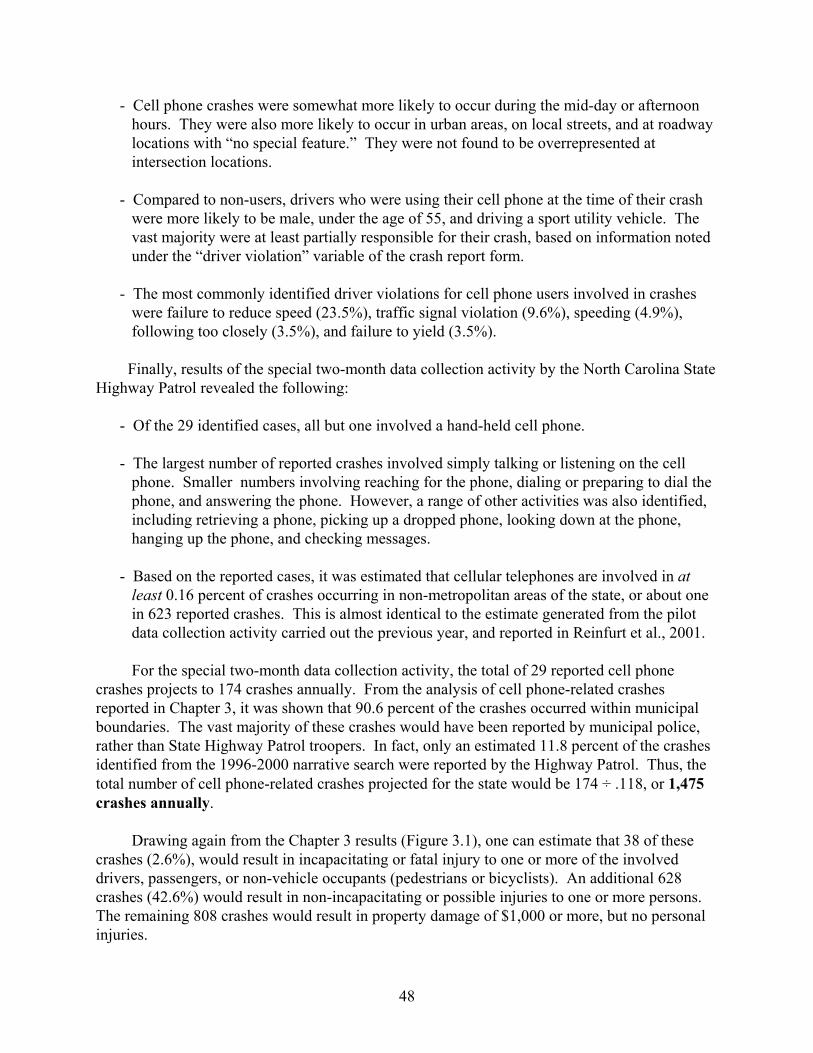
48
- Cell phone crashes were somewhat more likely to occur during the mid-day or afternoonhours. They were also more likely to occur in urban areas, on local streets, and at roadwaylocations with “no special feature.” They were not found to be overrepresented atintersection locations.
- Compared to non-users, drivers who were using their cell phone at the time of their crashwere more likely to be male, under the age of 55, and driving a sport utility vehicle. Thevast majority were at least partially responsible for their crash, based on information notedunder the “driver violation” variable of the crash report form.
- The most commonly identified driver violations for cell phone users involved in crasheswere failure to reduce speed (23.5%), traffic signal violation (9.6%), speeding (4.9%),following too closely (3.5%), and failure to yield (3.5%).
Finally, results of the special two-month data collection activity by the North Carolina StateHighway Patrol revealed the following:
- Of the 29 identified cases, all but one involved a hand-held cell phone.
- The largest number of reported crashes involved simply talking or listening on the cellphone. Smaller numbers involving reaching for the phone, dialing or preparing to dial thephone, and answering the phone. However, a range of other activities was also identified,including retrieving a phone, picking up a dropped phone, looking down at the phone,hanging up the phone, and checking messages.
- Based on the reported cases, it was estimated that cellular telephones are involved in atleast 0.16 percent of crashes occurring in non-metropolitan areas of the state, or about onein 623 reported crashes. This is almost identical to the estimate generated from the pilotdata collection activity carried out the previous year, and reported in Reinfurt et al., 2001.
For the special two-month data collection activity, the total of 29 reported cell phonecrashes projects to 174 crashes annually. From the analysis of cell phone-related crashesreported in Chapter 3, it was shown that 90.6 percent of the crashes occurred within municipalboundaries. The vast majority of these crashes would have been reported by municipal police,rather than State Highway Patrol troopers. In fact, only an estimated 11.8 percent of the crashesidentified from the 1996-2000 narrative search were reported by the Highway Patrol. Thus, thetotal number of cell phone-related crashes projected for the state would be 174 ÷ .118, or 1,475crashes annually.
Drawing again from the Chapter 3 results (Figure 3.1), one can estimate that 38 of thesecrashes (2.6%), would result in incapacitating or fatal injury to one or more of the involveddrivers, passengers, or non-vehicle occupants (pedestrians or bicyclists). An additional 628crashes (42.6%) would result in non-incapacitating or possible injuries to one or more persons. The remaining 808 crashes would result in property damage of $1,000 or more, but no personalinjuries.
2 Sundeen, M. Cell Phones and Highway Safety. 2002 Legislative Update. Denver, CO:National Conference of State Legislatures, August 2001. Available on the web athttp://www.ncsl.org/programs/esnr/2002statelegupdate.pdf.
49
These numbers, although representing less than one percent of the crashes occurring in thestate, nevertheless reflect significant personal and societal losses. Due to difficulties in lawenforcement identification of cell-phone related crashes, they also are likely to underestimate themagnitude of the problem. While there are clearly benefits to having cell phones available inpersonal vehicles, the results of this research reinforce the very real risks associated with using acell phone while driving. They also suggest that the problem may worsen in the coming years, ascell phones and other wireless technologies continue to proliferate in people’s cars.
According to recent data, at least 25 countries have passed laws restricting cell phone usewhile driving, including four (Israel, Japan, Portugal, and Singapore) that prohibit all use ofphones while driving. In the United Kingdom and Germany, drivers can lose their insurancecoverage if involved in a crash while using their cell phone.2 In the U.S., only New York Stateand some local jurisdictions have passed laws requiring the use of hands-free phone systems. Itis still too early to ascertain what effects, if any, such legislation has on driving safety. Evenwithout special legislation, existing “careless and reckless” driving laws in most states can beused to reinforce the need for drivers not to allow their cell phones to distract them from theirprimary task of driving.
Currently 17 states collect data on cell phone involvement in traffic crashes (up from justtwo states four years ago).2 Research is needed to evaluate the completeness and accuracy ofthese data, as well as to explore other approaches to gathering such information. In NorthCarolina, computerized searches of crash narratives remain the only way of routinely identifyingcell phone-related crashes. However, given the high level of cooperation by the North CarolinaState Highway Patrol, consideration might be given to extending the supplemental data collectionefforts used in the current study to one or more urban police departments, especially since thevast majority of cell phone crashes were found to occur in urban areas.
Cell phones are not the only thing distracting drivers and contributing to crashes. Interacting with other passengers in the vehicle, changing CDs, eating and drinking, smoking,looking at road maps, reaching or searching for something in the vehicle ! all are potentialdriving distractions. However, cell phones represent the “tip of the iceberg” in terms of newwireless technologies and communication and entertainment devices that are rapidly becomingavailable in today’s vehicles. It is therefore critical that the highway safety community work toeducate drivers about the importance of maintaining focus while driving. Only if properly usedcan the benefits of these new technologies be reaped without increased risk to ourselves andothers.

50
APPENDIX
Telephone Survey on Cell Phone Use and Driving

Johnston, Zabor, McManus, Inc. FinalStudy #7551 June 5, 2002
SCREENER
QUOTA: 650 NC drivers to include at least 500 cell users, soft quota onage by users and non-users separately
LENGTH: 10 minutesHONORARIUM: NoneTOPIC: Effect of cell phone usage while driving
(DO NOT ALLOW DK, NULL, OR REF FOR ANY SCREENER QUESTIONS)
IntroductionHello. My name is _______. I’m calling on behalf of the North Carolina Governor’sHighway Safety Program. We are conducting an important survey about driving safetyin our state, and we are very interested in your opinions.
The survey should take 10 minutes or less. Your responses to our questions will becombined with the responses of others and presented in summary form – we will not beasking for your name or any information that would identify you as a participant.
(Ask for participation)
A. Just to verify, do you currently live in North Carolina?
1. Yes………..SKIP TO QC2. No
B. Is there an adult in your household whom I can speak with that currently lives inNorth Carolina?
1. Yes……..ASK TO SPEAK WITH THAT PERSON AND RETURN TOINTRO
2. No………THANK AND TERMINATE IMMEDIATELY
C. Which of the following categories describes your age? (READ LIST)
1. Less than 18 years old2. 18-24 years old……………SKIP TO QE, CHECK QUOTA3. 25-39 years old……………SKIP TO QE, CHECK QUOTA4. 40-54 years old……………SKIP TO QE, CHECK QUOTA5. 55-69 years old……………SKIP TO QE, CHECK QUOTA6. 70 years old or older………SKIP TO QE, CHECK QUOTA
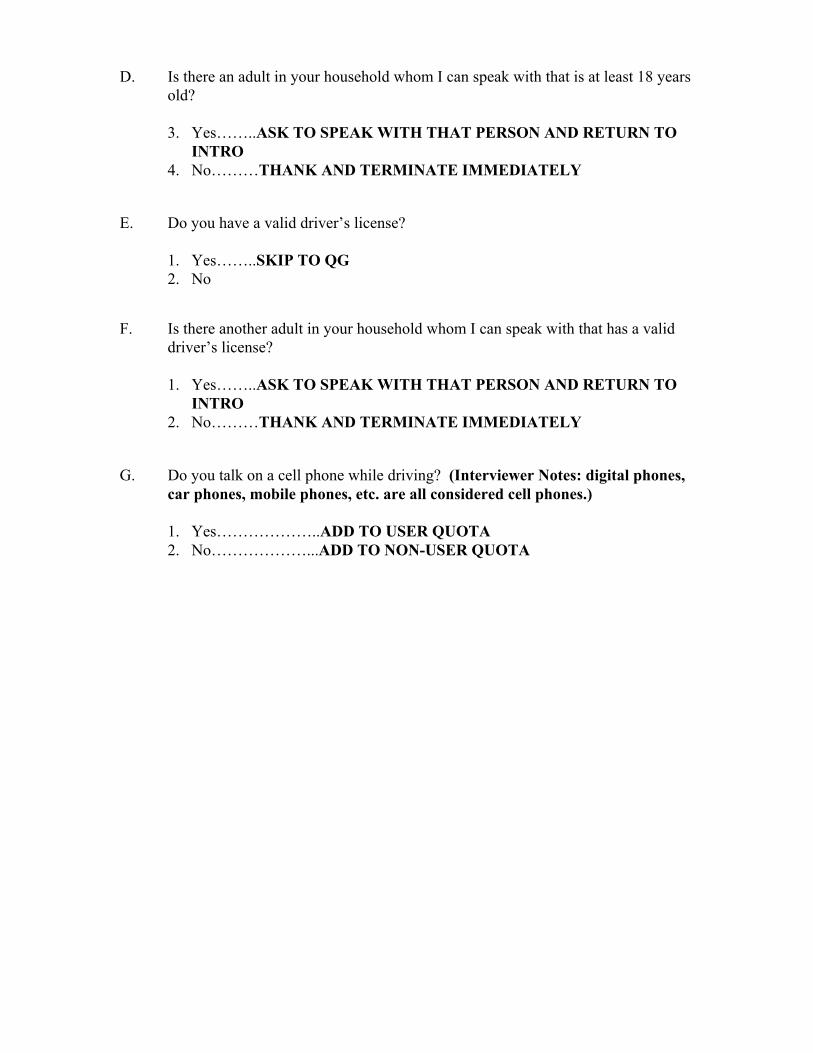
D. Is there an adult in your household whom I can speak with that is at least 18 yearsold?
3. Yes……..ASK TO SPEAK WITH THAT PERSON AND RETURN TOINTRO
4. No………THANK AND TERMINATE IMMEDIATELY
E. Do you have a valid driver’s license?
1. Yes……..SKIP TO QG2. No
F. Is there another adult in your household whom I can speak with that has a validdriver’s license?
1. Yes……..ASK TO SPEAK WITH THAT PERSON AND RETURN TOINTRO
2. No………THANK AND TERMINATE IMMEDIATELY
G. Do you talk on a cell phone while driving? (Interviewer Notes: digital phones,car phones, mobile phones, etc. are all considered cell phones.)
1. Yes………………..ADD TO USER QUOTA2. No………………...ADD TO NON-USER QUOTA

Page 1
Johnston, Zabor, McManus, Inc. FinalStudy #7551 June 5, 2002
Questionnaire
(NOTE: Allow “Don’t Know” except where specified otherwise)
(IF NON-USER IN SCREENER QE, SKIP TO Q14b)
Cell Phone Usage
1. A hands-free device is one that allows you to talk without holding the phone.Examples include a speaker phone or a headset. Do you use a hands-free devicewhen talking on your cell phone while driving?
1. Yes2. No
(IF Q1 = 2 OR DK, THEN SKIP TO INTRO BEFORE Q6)
2. What percentage of the time do you use your hands-free device when you aretalking on your cell phone while driving, and what percentage of the time do youhold the phone to talk and listen? Your total must equal 100%.
Hands-free _________% (MUST BE > 0)Hold phone _________%
TOTAL = 100%
3. Which type of hands-free device do you use when driving? Do you use:(Interviewer Note: If respondent uses more than one, ask to select the deviceused most often)(READ LIST. SELECT ONLY ONE.)
1. a headset or earpiece that you connect to the cell phone2. a speaker phone3. some other hands-free device
4. Do you feel that the hands-free device you use makes it easier for you to talk onyour phone while driving?
1. Yes2. No
5. Do you feel that it makes it safer for you to talk on your phone while driving?1. Yes2. No
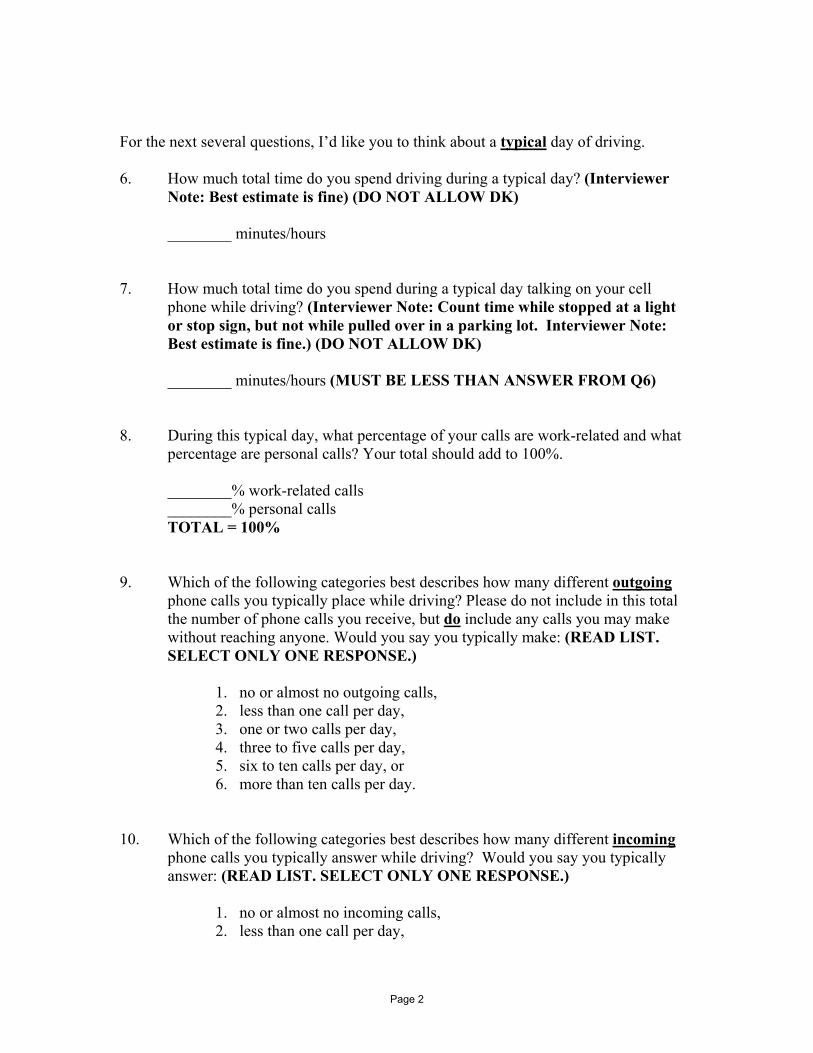
Page 2
For the next several questions, I’d like you to think about a typical day of driving.
6. How much total time do you spend driving during a typical day? (InterviewerNote: Best estimate is fine) (DO NOT ALLOW DK)
________ minutes/hours
7. How much total time do you spend during a typical day talking on your cellphone while driving? (Interviewer Note: Count time while stopped at a lightor stop sign, but not while pulled over in a parking lot. Interviewer Note:Best estimate is fine.) (DO NOT ALLOW DK)
________ minutes/hours (MUST BE LESS THAN ANSWER FROM Q6)
8. During this typical day, what percentage of your calls are work-related and whatpercentage are personal calls? Your total should add to 100%.
________% work-related calls________% personal callsTOTAL = 100%
9. Which of the following categories best describes how many different outgoingphone calls you typically place while driving? Please do not include in this totalthe number of phone calls you receive, but do include any calls you may makewithout reaching anyone. Would you say you typically make: (READ LIST.SELECT ONLY ONE RESPONSE.)
1. no or almost no outgoing calls,2. less than one call per day,3. one or two calls per day,4. three to five calls per day,5. six to ten calls per day, or6. more than ten calls per day.
10. Which of the following categories best describes how many different incomingphone calls you typically answer while driving? Would you say you typicallyanswer: (READ LIST. SELECT ONLY ONE RESPONSE.)
1. no or almost no incoming calls,2. less than one call per day,
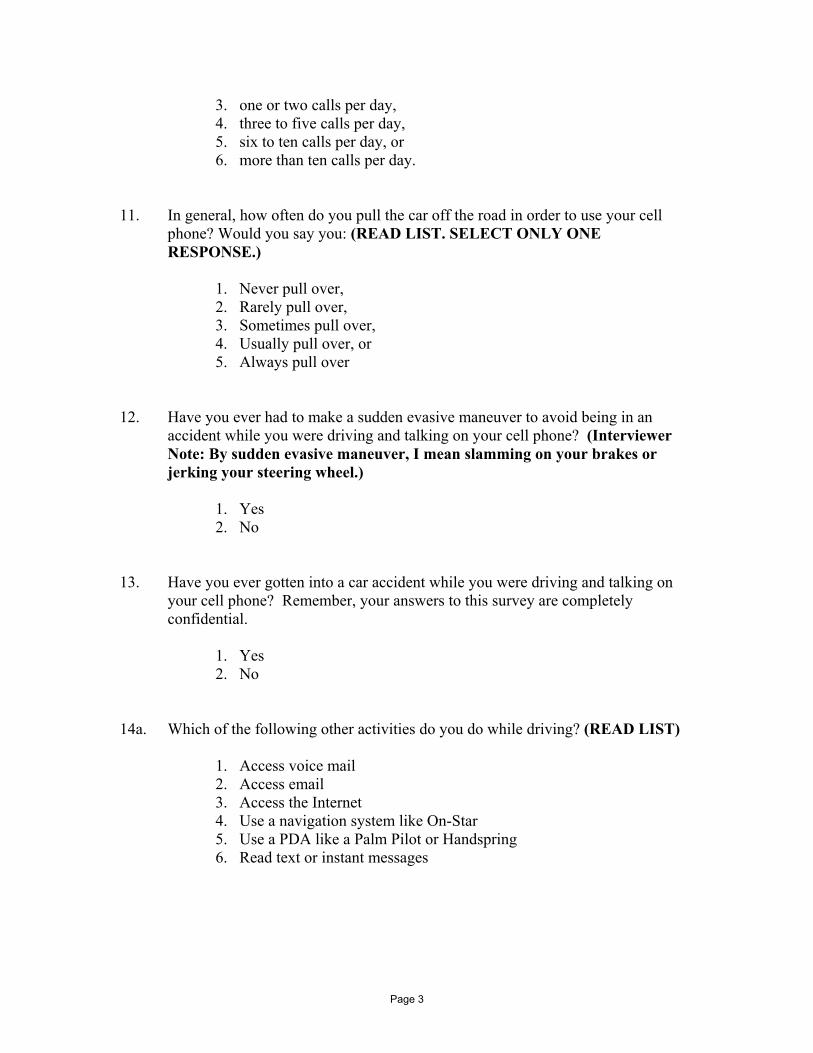
Page 3
3. one or two calls per day,4. three to five calls per day,5. six to ten calls per day, or6. more than ten calls per day.
11. In general, how often do you pull the car off the road in order to use your cellphone? Would you say you: (READ LIST. SELECT ONLY ONERESPONSE.)
1. Never pull over,2. Rarely pull over,3. Sometimes pull over,4. Usually pull over, or5. Always pull over
12. Have you ever had to make a sudden evasive maneuver to avoid being in anaccident while you were driving and talking on your cell phone? (InterviewerNote: By sudden evasive maneuver, I mean slamming on your brakes orjerking your steering wheel.)
1. Yes2. No
13. Have you ever gotten into a car accident while you were driving and talking onyour cell phone? Remember, your answers to this survey are completelyconfidential.
1. Yes2. No
14a. Which of the following other activities do you do while driving? (READ LIST)
1. Access voice mail2. Access email3. Access the Internet4. Use a navigation system like On-Star5. Use a PDA like a Palm Pilot or Handspring6. Read text or instant messages

Page 4
(USERS SKIP TO Q15. ASK Q14B FOR NON-USERS ONLY)14b. Do you use a navigation system like On-Star while driving?
1. Yes2. No
Distraction
15. Drivers sometimes perform activities that could potentially distract their attentionfrom the road. Please rate how distracting you think the following activities are toa driver. Use a scale of 0 to 10, where 0 means “Not at all distracting” and 10means “Extremely distracting.” (READ STATEMENTS)
(RANDOMIZE ALL STATEMENTS, BUT 1 AND 2 SHOULD BE ASKEDCONSECUTIVELY)
1. Talking on a cell phone with a hands-free device (INTERVIEWERNOTE FOR NON-USERS - A hands-free device is one that allowsyou to talk without holding the phone. Examples include a speakerphone or a headset.)
2. Talking on a cell phone without a hands-free device3. Dialing a number on a cell phone4. Answering an incoming call on a cell phone5. Drinking a cup of coffee6. Eating a sandwich7. Reading driving directions8. Talking with passengers9. Changing the station on the radio10. Finding a location using a road map
Opinions
16. I would now like to read you some statements and have you tell me how muchyou agree or disagree with each one. Please use a scale of 0 to 10, where 0 means“completely disagree” and 10 means “completely agree.” (READ LIST)(RANDOMIZE) (REPEAT THE “0 TO 10” SCALE FOR THE FIRSTCATEGORY ASKED)
1. Most people can carry on a conversation on their cell phone and stilldrive safely.
2. Cell phones are more beneficial to drivers than they are harmful.3. Using a hands-free device with a cell phone is safer than using a hand-
held cell phone.
Page 5
17. Now, let’s assume you were voting on a new driving law in North Carolina. Thenew law would make it illegal to talk on a hand-held cell phone while driving,except in case of emergency. It would be okay to talk on a cell phone while usinga hands-free device. Would you vote for or against this new law? (InterviewerNote: If they don’t vote, ask what they would say if they did vote)
1. For2. Against
18. What if the law made it illegal to talk on any type of cell phone (hand-held orhands-free) while driving, except in case of emergency. Would you vote for oragainst this new law? (Interviewer Note: If they don’t vote, ask what theywould say if they did vote)
1. For2. Against
19. Now, what if there was a new law that made it so drivers who get into an accidentwhile talking on a cell phone would automatically be cited for careless andreckless driving and would be heavily penalized on their insurance premiums?Would you vote for or against this new law? (Interviewer Note: If they don’tvote, ask what they would say if they did vote)
1. For2. Against
Demographics
Now I would like to ask some information about you. Please remember this informationis completely confidential and will never be associated with your name.
20. How would you describe your race or ethnicity? (DO NOT READ LIST)
1. Caucasian / White2. African-American / Black3. Hispanic / Latino4. Asian / Pacific Islander5. American Indian / Alaska Native6. Middle Eastern7. Other

Page 6
21. What is your county of residence? (Interviewer Note: Only one responseallowed) (DO NOT READ LIST)
[closed end list of 100 counties]
22. Which of the following best describes the type of vehicle you drive the most?(READ LIST)
1. Passenger Car2. Pick-up Truck3. Sport Utility Vehicle4. Van or Minivan5. Other
ConclusionThat’s all the questions I have. Thanks very much for your time. Do you have anyadditional comments you’d like me to write down for the researchers?
GENDER. INTERVIEWER DENOTE GENDER OF RESPONDENT:
1. Male2. Female3. Not sure