cell reports supplemental information inhibition of … reports supplemental information inhibition...
TRANSCRIPT

Cell Reports
Supplemental Information
Inhibition of Lapatinib-Induced Kinome
Reprogramming in ERBB2-Positive Breast Cancer
by Targeting BET Family Bromodomains
Timothy J. Stuhlmiller, Samantha M. Miller, Jon S. Zawistowski, Kazuhiro Nakamura,
Adriana S. Beltran, James S. Duncan, Steven P. Angus, Kyla A.L. Collins, Deborah A.
Granger, Rachel A. Reuther, Lee M. Graves, Shawn M. Gomez, Pei-Fen Kuan, Joel S.
Parker, Xin Chen, Noah Sciaky, Lisa A. Carey, H. Shelton Earp, Jian Jin, and Gary L.
Johnson


SUPPLEMENTAL FIGURE LEGENDS
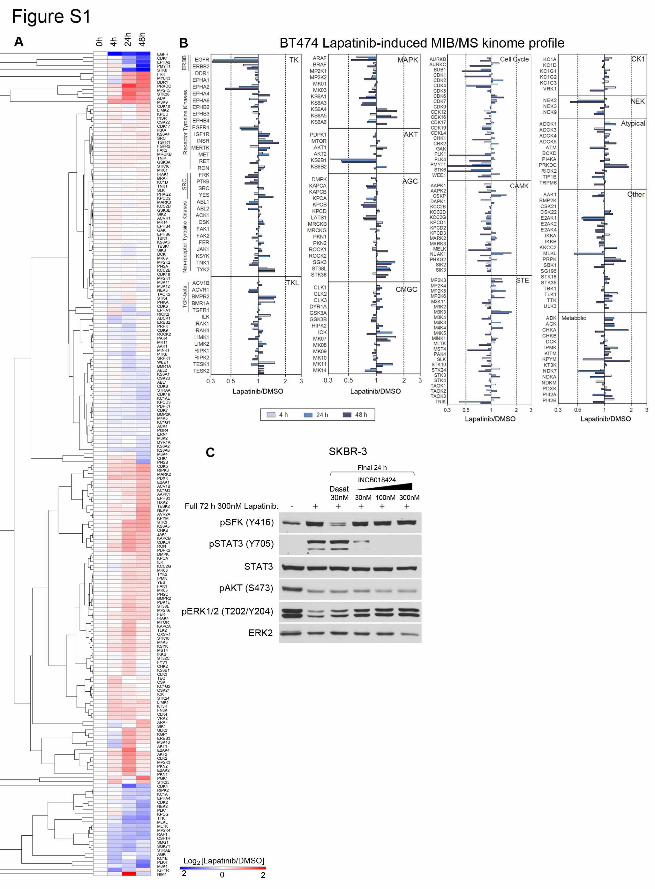
Figure S1, related to Figure 1. Lapatinib-induced MIB-binding in BT474
(A) Expansion of hierarchical clustering of Lapatinib-induced MIB-binding dynamics in
SKBR-3 from Figure 1D.
(B) Lapatinib-induced MIB/MS kinome profile in BT474. Data presented is mean of four
biological replicate MIB/MS experiments. 300nM Lapatinib.
(C) JAK signaling regulates STAT3 phosphorylation in SKBR-3 cells. SKBR-3 cells were
treated for 72 hours with 300nM Lapatinib, with addition of dasatinib or increasing doses
of INCB018424 (JAK inhibitor) for the final 24 hours. Lapatinib induces SFK
phosphorylation and STAT3 Y705 activating phosphorylation. Dasatinib inhibits SFK
phosphorylation but does not affect STAT3 phosphorylation. INCB018424 completely
inhibits STAT3 phosphorylation at 100nM in the presence of lapatinib. Neither inhibitor
has an effect on AKT phosphorylation.
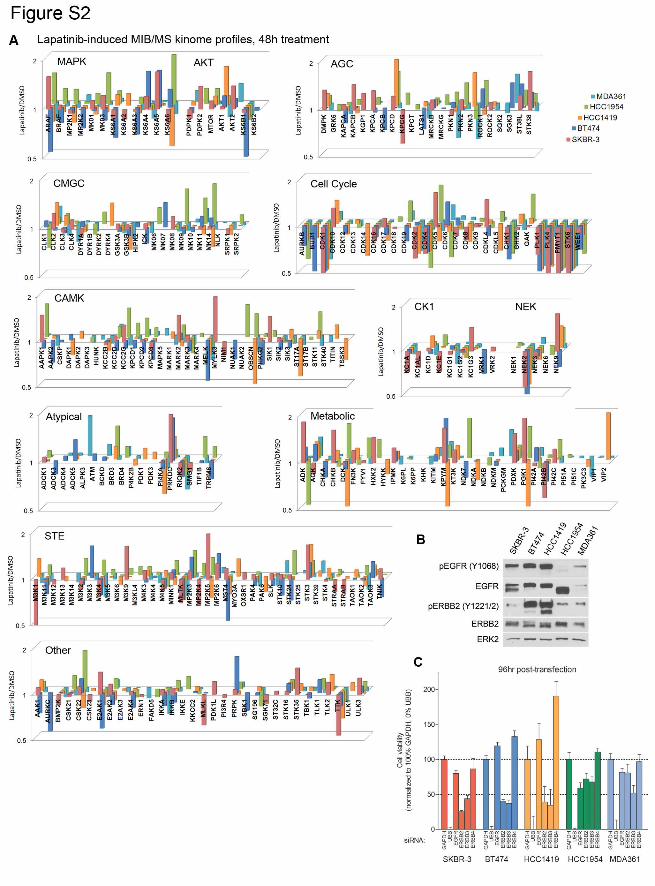
Figure S2, related to Figure 2. MIB/MS unveils heterogeneity in the kinome response to
lapatinib.
(A) MIB-binding changes in five ERBB2+ cell lines after 48h treatment with 300nM lapatinib.
Values > 1, activation; values < 1, inhibition relative to untreated. Also see Figure 2B for
tyrosine kinase bar graphs. Data presented is mean of four biological replicates per cell
line.
(B) Western blots demonstrate expression and phosphorylation state of lapatinib targets
EGFR and ERBB2 across five cell lines.
(C) siRNA-mediated knockdown demonstrates differential dependence on different ERBB
family members across cell lines. Viability normalized to GAPDH knockdown (100%) and
UBB knockdown (0%). Data presented is mean of six technical replicates ± SD.
Figure S3, related to Figure 2. Statistical analysis of MIB/MS identifies clusters of kinase
behavior.
(A) 3x3 Self-organizing map (SOM) clustering of 48 h MIB/MS data across five cell lines
establishes clusters of kinases with common induction or inhibition.
(B) Hierarchical clustering of SOM cluster 1 identifies common induced kinases among cell
lines.
(C) Hierarchical clustering of SOM cluster 7 constitutes kinases uniquely induced in
HCC1954 cells.
(D) Hierarchical clustering of SOM cluster 9 includes common suppressed kinases across
cell lines and includes primarily cell cycle-regulating kinases.
(E) Hierarchical clustering of lapatinib-induced MIB-binding changes after 48h treatment in
the five cell lines. Only kinases represented in all five cell lines are shown.
(F) IGF1R/INSR inhibition has no major effects on downstream ERBB phosphorylation or
FAK, SFK, AKT, or ERK signaling in HCC1419 and HCC1954 cells.
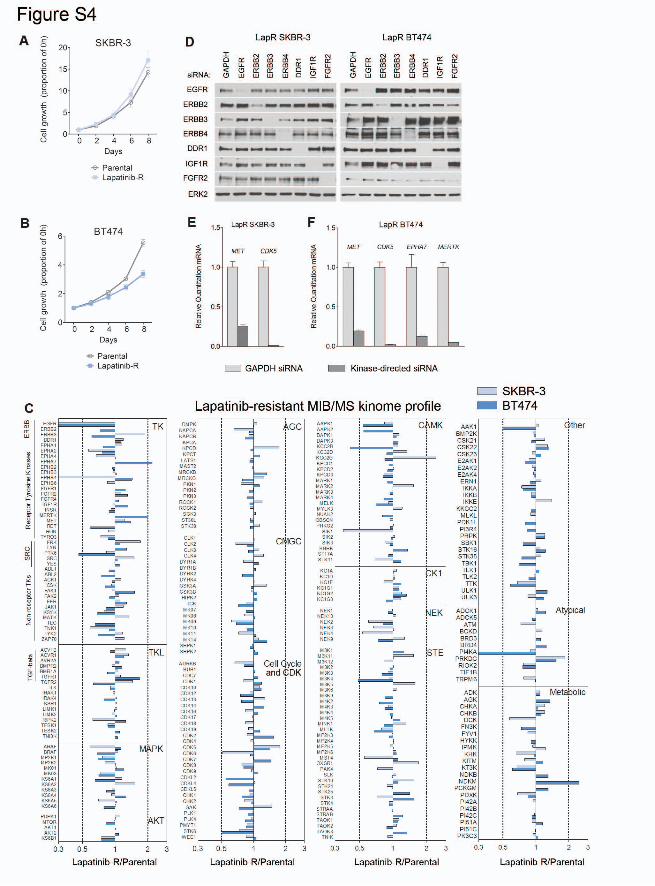
Figure S4, related to Figure 4. Lapatinib-resistant SKBR-3 and BT474 cells display broad
kinome reorganization when compared to parental cells.
(A) Lapatinib-resistant SKBR-3 cells proliferate at roughly the same rate as parental cells. 8-
day growth curves are mean ± SD of six technical replicates.
(B) Lapatinib-resistant BT474 cells proliferate more slowly than parental cells. 8-day growth
curves are mean ± SD of six technical replicates.
(C) MIB/MS profile of lapatinib-resistant SKBR-3 and BT474 cells relative to parental
untreated. Data presented is mean of two biological replicates.
(D) Western blots indicate efficient knockdown of RTKs targeted by siRNAs used in Figure
4A and 4E without significant off-target effects. Proteins detected 48h post-transfection.
(E) qRT-PCR demonstrates sufficient knockdown of MET and CDK5 in lapatinib-resistant
SKBR-3 cells. Data presented is mean ± SD of three technical replicates, normalized to
GAPDH siRNA. RNA harvested 48h post-transfection.
(F) qRT-PCR demonstrates sufficient knockdown of MET, CDK5, EPHA7, and MERTK in
lapatinib-resistant BT474 cells. Data presented is mean ± SD of three technical
replicates, normalized to GAPDH siRNA. RNA harvested 48h post-transfection.
Figure S5, related to Figure 5. BET family bromodomain inhibition suppresses lapatinib
response in ERBB2+ cells.
(A) Most kinases with statistically significant changes in MIB-binding in SKBR-3 cells display
similar changes in transcription as measured by RNAseq.
(B) 5-day dose response curve to JQ1 and I-BET762, BET family bromodomain inhibitors. I-
BET762 is a half- to full-log fold less active than JQ1 in cell culture. Data presented is
mean ± SD of six technical replicates.
(C) JQ1 inhibits expression of kinases involved in growth in HCC1954 and MDA361 cells.
Western blots after 48h treatment with 300nM lapatinib and 300nM JQ1, demonstrate
maximal suppression of ERBB3, FGFR1, FGFR2, and IGF1R expression and FAK and
SFK phosphorylation in combination treatments. Combination treatment inhibits
reactivation of AKT in MDA361 cells.
(D) Western blots after 48h treatment of SKBR-3 cells indicates I-BET151 inhibits kinome
reprogramming at a dose of 1µM.
(E) qRT-PCR after 24h treatments indicates JQ1 suppresses lapatinib-induced
transcriptional induction of ERBB2, ERBB3, IGF1R, DDR1, and FGFR2. Data presented
is mean ± SD of six technical replicates.
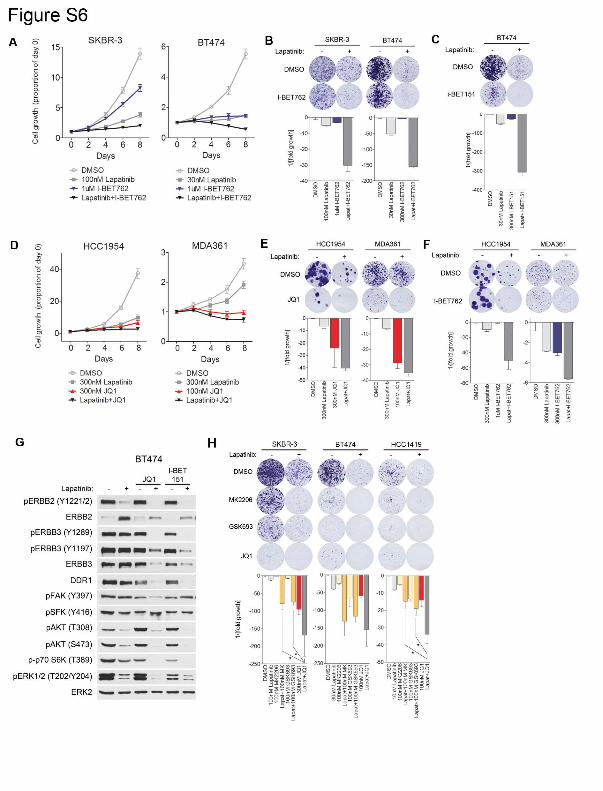
Figure S6, related to Figure 5. BET bromodomain inhibitors suppress growth of ERBB2+
cells in combination with lapatinib.
(A) 8-day growth curves indicate similar activity of I-BET762 when used at a half-log higher
concentration than JQ1 (1µM vs 300nM). Combination with lapatinib suppresses the
growth of SKBR-3 and BT474 cells. Data presented is mean ± SD of six technical
replicates.
(B) I-BET762 suppresses colony formation in SKBR-3 and BT474 cells in combination with
lapatinib. Data presented is mean ± SD of three technical replicates.
(C) Combination treatment of Lapatinib and I-BET151 suppresses colony formation in 4-
week growth assays in BT474 cells.
(D) JQ1 in combination with lapatinib arrests cell growth (HCC1954) and leads to loss of cell
number (MDA361) in 8-day growth assays. Data presented is mean ± SD of six technical
replicates.
(E) Combination treatment of lapatinib and JQ1 suppresses colony formation in 5-week
growth assays in HCC1954 and MDA361 cells.
(F) I-BET762 suppresses colony formation in HCC1954 and MDA361 cells in combination
with lapatinib.
(G) BET bromodomain inhibitors alone are unable to completely inhibit RTK expression and
do not affect AKT/ERK signaling. JQ1 or I-BET151 in combination with lapatinib
suppresses expression and phosphorylation of ERBB2/3 and inhibits AKT/ERK
reactivation. 8-day treatments of BT474 cells. 30nM lapatinib, 300nM JQ1, and 1µM I-
BET151.
(H) Lapatinib in combination with AKT inhibitors (MK2206, GSK693) inhibits growth of
ERBB2+ cells but resistant colonies form in SKBR-3 and HCC1419 cells. Lapatinib +
JQ1 suppresses colony formation across cell lines and inhibits growth significantly more
than lapatinib + AKT inhibitor combinations.
Data presented in A and D is mean ± SD of six technical replicates and data presented in B,
C, E, F, and H is mean ± SD of six technical replicates.
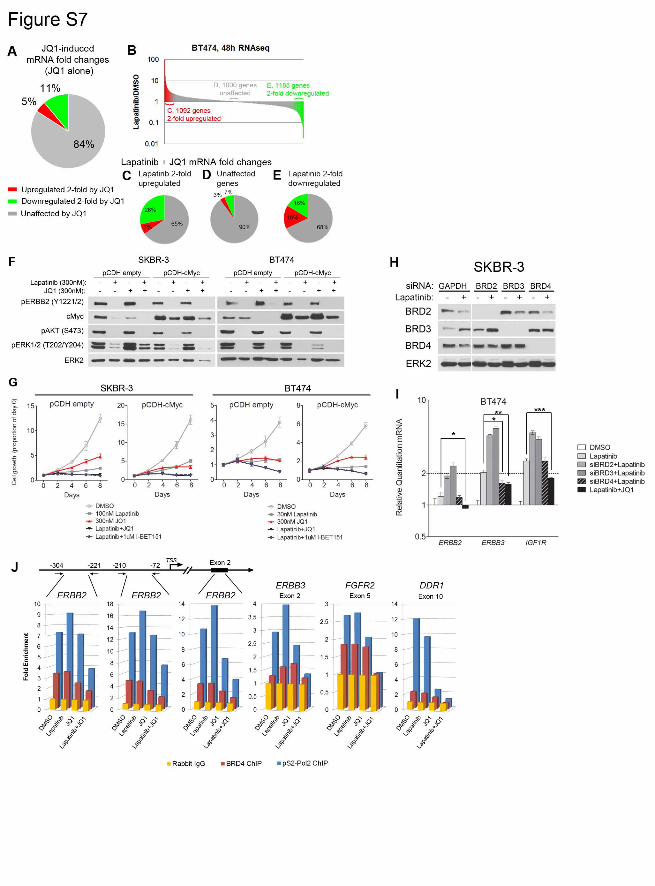
Figure S7, related to Figure 6. JQ1 modulates lapatinib-induced transcription and inhibits
epigenetic regulation of signature kinase genes
(A) RNAseq indicates JQ1 affects 16% of expressed genes 2-fold or more in BT474 cells
after 48 h treatment.
(B) Figures S6C-E refer to JQ1 effect on lapatinib-regulated genes as indicated.
(C) JQ1 downregulates 28% of the 1092 lapatinib-induced genes by at least 2-fold from the
lapatinib-induced mRNA level.
(D) 1000 genes not affected by lapatinib treatment show less fold-changes in the
lapatinib+JQ1 combination compared to JQ1 alone.
(E) 1185 genes at least 2-fold downregulated by lapatinib are more regulated by JQ1 as
compared to JQ1 effects on the transcriptome as a whole or genes unaffected by
lapatinib.
(F) Cells stably overexpressing cMyc display similar inhibition of ERBB2, AKT, and ERK in
the combination of lapatinib+JQ1, but cMyc levels are rescued relative to empty vector-
infected cells.
(G) BT474 cells overexpressing cMyc are slightly less sensitive to JQ1 as a single agent, but
lapatinib+JQ1 or lapatinib+I-BET151 combinations still arrest growth of SKBR-3 and
cause cell regression in BT474 cells. Data presented is mean ± SD of six technical
replicates.
(H) Western blots indicate sufficient knockdown of BRD family members by siRNAs without
off-target effects. 24h knockdown, then 24h 300nM lapatinib treatment in SKBR-3 cells.
(I) qRT-PCR demonstrates siRNA-mediated knockdown of BRD2 and BRD3 enhances
transcription of ERBB2, ERBB3, and IGF1R. Knockdown of BRD4 suppresses ERBB3
transcription, but JQ1 is necessary to suppress transcription of ERBB2 and IGF1R. 24h
siRNA knockdown, then 24h drug treatment. 300nM lapatinib; 300nM JQ1. Data
presented is mean ± SD of three technical replicates.

(J) ChIP-PCR indicates JQ1 inhibits BRD4 promoter occupation of ERBB2 in the presence
and absence of Lapatinib. Primers that amplify regions of the gene body indicate a
complete (ERBB3, FGFR2, DDR1), or near-complete (ERBB2) loss of elongating RNA
polymerase II (pS2-Pol2) binding from Lapatinib/JQ1 combination treatment. 4-hour
treatments with 300nM Lapatinib and 300nM JQ1 in SKBR-3 cells. Data presented is
mean of three biological replicate experiments.
Table S1, related to Figures 1, 2, 3, 4, 7, S1, S2, S3, and S4: Raw MIB/MS Ratios (excel
spreadsheet). Tabs:
SKBR3 and BT474: Quadruplicate MIB/MS runs with 4, 24, 48h 300nM lapatinib
treatment from Figures 1 and S1.
HCC1419; HCC1954; MDA361: Quadruplicate MIB/MS runs with 48h 300nM lapatinib
treatment from Figures 2 and S2.
48h AVERAGE: Average MIB-binding ratios across 5 cell lines from Figures 2 and S2.
3x3 SOM clusters: Kinases and MIB-binding ratios from SOM analysis (Figure S3)
Lapatinib+Dasatinib: SKBR-3 and BT474 MIB-binding ratios from Figure 3D.
Lapatinib+BGJ398: SKBR-3 MIB-binding ratios from Figure 3H.
Lapatinib-R SKBR-3 + BT474: Lapatinib-resistant versus parental MIB-binding ratios
from Figure 4 and S4.
Lapatinib-R SKBR-3+JQ1+IBET151: Lapatinib resistant SKBR-3 treated with 8 days
bromodomain inhibitors from Figure 7C.
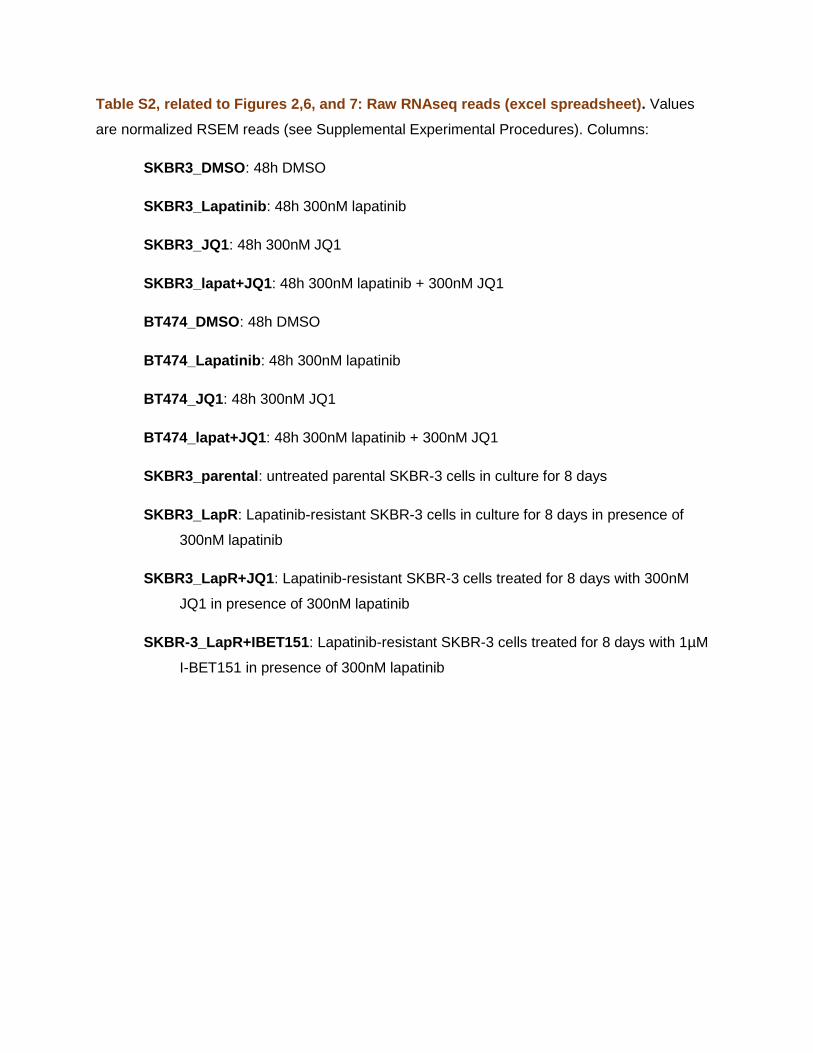
Table S2, related to Figures 2,6, and 7: Raw RNAseq reads (excel spreadsheet). Values
are normalized RSEM reads (see Supplemental Experimental Procedures). Columns:
SKBR3_DMSO: 48h DMSO
SKBR3_Lapatinib: 48h 300nM lapatinib
SKBR3_JQ1: 48h 300nM JQ1
SKBR3_lapat+JQ1: 48h 300nM lapatinib + 300nM JQ1
BT474_DMSO: 48h DMSO
BT474_Lapatinib: 48h 300nM lapatinib
BT474_JQ1: 48h 300nM JQ1
BT474_lapat+JQ1: 48h 300nM lapatinib + 300nM JQ1
SKBR3_parental: untreated parental SKBR-3 cells in culture for 8 days
SKBR3_LapR: Lapatinib-resistant SKBR-3 cells in culture for 8 days in presence of
300nM lapatinib
SKBR3_LapR+JQ1: Lapatinib-resistant SKBR-3 cells treated for 8 days with 300nM
JQ1 in presence of 300nM lapatinib
SKBR-3_LapR+IBET151: Lapatinib-resistant SKBR-3 cells treated for 8 days with 1µM
I-BET151 in presence of 300nM lapatinib
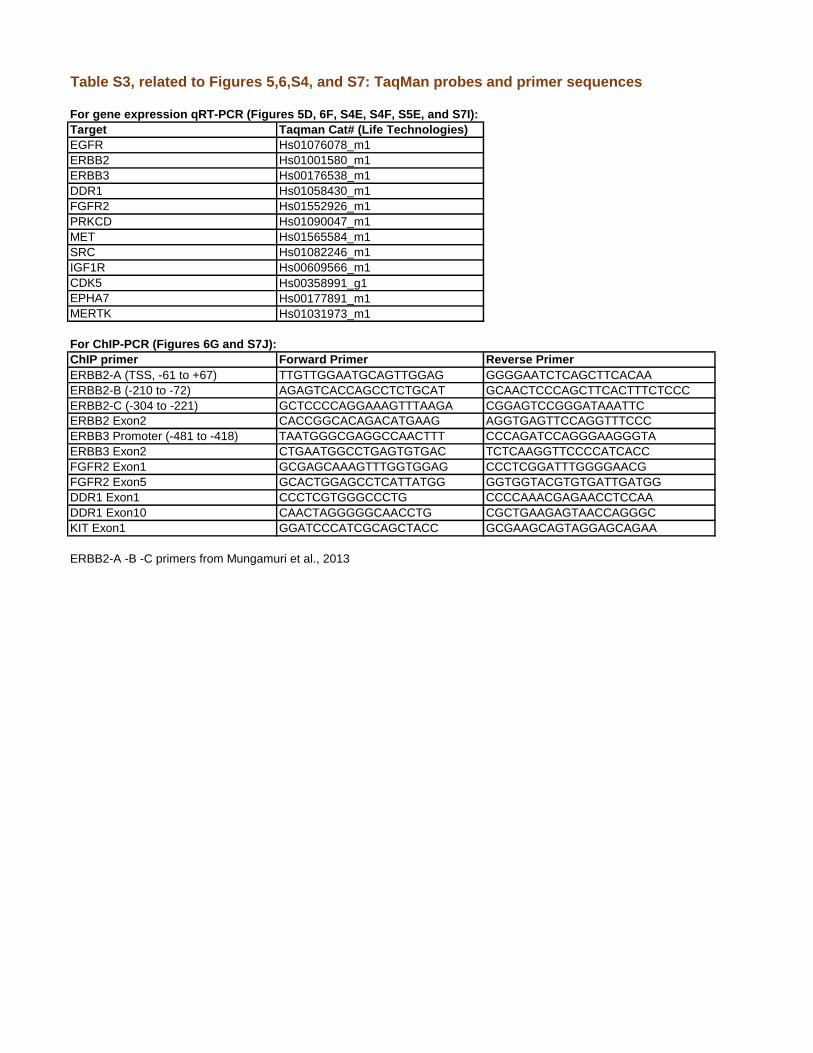
Table S3, related to Figures 5,6,S4, and S7: TaqMan probes and primer sequences
For gene expression qRT-PCR (Figures 5D, 6F, S4E, S4F, S5E, and S7I):
Target Taqman Cat# (Life Technologies)
EGFR Hs01076078_m1
ERBB2 Hs01001580_m1
ERBB3 Hs00176538_m1
DDR1 Hs01058430_m1
FGFR2 Hs01552926_m1
PRKCD Hs01090047_m1
MET Hs01565584_m1
SRC Hs01082246_m1
IGF1R Hs00609566_m1
CDK5 Hs00358991_g1
EPHA7 Hs00177891_m1
MERTK Hs01031973_m1
For ChIP-PCR (Figures 6G and S7J):
ChIP primer Forward Primer Reverse Primer
ERBB2-A (TSS, -61 to +67) TTGTTGGAATGCAGTTGGAG GGGGAATCTCAGCTTCACAA
ERBB2-B (-210 to -72) AGAGTCACCAGCCTCTGCAT GCAACTCCCAGCTTCACTTTCTCCC
ERBB2-C (-304 to -221) GCTCCCCAGGAAAGTTTAAGA CGGAGTCCGGGATAAATTC
ERBB2 Exon2 CACCGGCACAGACATGAAG AGGTGAGTTCCAGGTTTCCC
ERBB3 Promoter (-481 to -418) TAATGGGCGAGGCCAACTTT CCCAGATCCAGGGAAGGGTA
ERBB3 Exon2 CTGAATGGCCTGAGTGTGAC TCTCAAGGTTCCCCATCACC
FGFR2 Exon1 GCGAGCAAAGTTTGGTGGAG CCCTCGGATTTGGGGAACG
FGFR2 Exon5 GCACTGGAGCCTCATTATGG GGTGGTACGTGTGATTGATGG
DDR1 Exon1 CCCTCGTGGGCCCTG CCCCAAACGAGAACCTCCAA
DDR1 Exon10 CAACTAGGGGGCAACCTG CGCTGAAGAGTAACCAGGGC
KIT Exon1 GGATCCCATCGCAGCTACC GCGAAGCAGTAGGAGCAGAA
ERBB2-A -B -C primers from Mungamuri et al., 2013
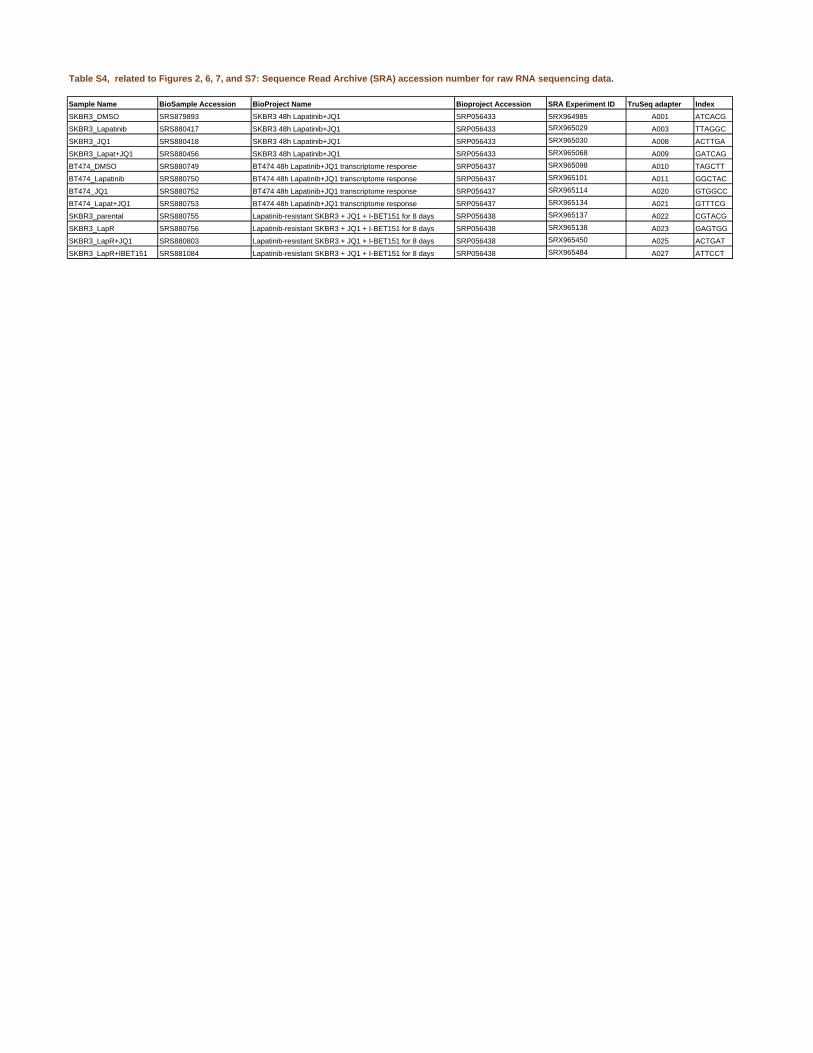
Table S4, related to Figures 2, 6, 7, and S7: Sequence Read Archive (SRA) accession number for raw RNA sequencing data.
Sample Name BioSample Accession BioProject Name Bioproject Accession SRA Experiment ID TruSeq adapter Index
SKBR3_DMSO SRS879893 SKBR3 48h Lapatinib+JQ1 SRP056433 SRX964985 A001 ATCACG
SKBR3_Lapatinib SRS880417 SKBR3 48h Lapatinib+JQ1 SRP056433 SRX965029 A003 TTAGGC
SKBR3_JQ1 SRS880418 SKBR3 48h Lapatinib+JQ1 SRP056433 SRX965030 A008 ACTTGA
SKBR3_Lapat+JQ1 SRS880456 SKBR3 48h Lapatinib+JQ1 SRP056433 SRX965068 A009 GATCAG
BT474_DMSO SRS880749 BT474 48h Lapatinib+JQ1 transcriptome response SRP056437 SRX965098 A010 TAGCTT
BT474_Lapatinib SRS880750 BT474 48h Lapatinib+JQ1 transcriptome response SRP056437 SRX965101 A011 GGCTAC
BT474_JQ1 SRS880752 BT474 48h Lapatinib+JQ1 transcriptome response SRP056437 SRX965114 A020 GTGGCC
BT474_Lapat+JQ1 SRS880753 BT474 48h Lapatinib+JQ1 transcriptome response SRP056437 SRX965134 A021 GTTTCG
SKBR3_parental SRS880755 Lapatinib-resistant SKBR3 + JQ1 + I-BET151 for 8 days SRP056438 SRX965137 A022 CGTACG
SKBR3_LapR SRS880756 Lapatinib-resistant SKBR3 + JQ1 + I-BET151 for 8 days SRP056438 SRX965138 A023 GAGTGG
SKBR3_LapR+JQ1 SRS880803 Lapatinib-resistant SKBR3 + JQ1 + I-BET151 for 8 days SRP056438 SRX965450 A025 ACTGAT
SKBR3_LapR+IBET151 SRS881084 Lapatinib-resistant SKBR3 + JQ1 + I-BET151 for 8 days SRP056438 SRX965484 A027 ATTCCT

SUPPLEMENTAL EXPERIMENTAL PROCEDURES
Cell culture
All cell lines were grown in RPMI 1640 supplemented with 10% FBS, 1,000 Units/mL Penicillin,
and 1mg/mL Streptomycin. Lapatinib-resistant SKBR-3 were derived by continuous treatment
with 300nM lapatinib for 4+ months. Lapatinib-resistant BT474 were derived by progressively
increasing doses of Lapatinib every 3-4 weeks to 300nM. Resistant lines were kept as a pool of
all clones that grew out. Inhibitors used in cell culture were obtained from Selleck
(selleckchem.com).
Kinase inhibitors and MIB preparation
Kinase inhibitors (Bisindoylmaleimide-X, Lapatinib, Dasatinib, PP58, VI16832, CTx-0294885)
were synthesized with hydrocarbon linkers having reactive amino groups. Inhibitor beads were
prepared via carbodiimide coupling of kinase inhibitors to ECH Sepharose 4B (Lapatinib,
Bisindoylmaleimide-X,SB203580, Dasatinib, PP58, VI16832, and CTx-0294885) or EAH
Sepharose 4B (Purvalanol B) (GE Healthcare). ECH-Sepharose and EAH-Sepharose beads
were washed with 50% DMF/Ethanol followed by incubation with kinase inhibitors in 50%
DMF/Ethanol and 0.1M N-ethyl-N0-(3-dimethylaminopropyl) carbodiimide hydrochloride (EDC,
Sigma) at pH 5-6 overnight at 4°C in the dark. Following coupling, excess remaining groups
were blocked with 0.1 M EDC in 50% DMF/Ethanol, 1 M ethanolamine (ECH-Sepharose) or 20
mM HAc in 50% DMF/Ethanol (EAH-Sepharose). Beads were washed with 50% DMF/Ethanol
and alternating washes of 0.1 M Tris-HCl (pH 8.3) and 0.1 M acetate (pH 4.0) buffers, each
containing 0.5 M NaCl. Inhibitor beads were stored in 20% ethanol at 4°C in the dark.
Lysis and MIB Chromatography
For MIB/MS and western blotting, cells were washed 1X with cold PBS, lysed in 50 mM HEPES,
150 mM NaCl, 0.5% Triton X-100, 1 mM EDTA, 1 mM EGTA, at pH 7.5 containing 10 mM NaF,
2.5 mM NaVO4, cOmplete protease Inhibitor Cocktail (Roche), and 1% Phosphatase Inhibitor
Cocktails 2 and 3 (Sigma). Lysate was sonicated (3x10s) on ice and centrifuged (10min, 13,000
rpm) at 4°C and the supernatant syringe-filtered through a 0.2 mM SFCA membrane. Lysate
was equalized at 5-20mg total protein per experiment to 1M NaCl and flowed over kinase
inhibitor bead resin (Bisindoylmaleimide-X, Lapatinib, Dasatinib, PP58, Purvalanol B, VI16832,
CTx-0294885), followed by 30 volumes of washes with high salt (1M NaCl) and low salt (150mM
NaCl) buffer (50 mM HEPES, 0.5% Triton X-100, 1 mM EDTA, 1 mM EGTA, at pH 7.5). Bound
kinases were eluted by boiling with 0.5% SDS and 1% β-mercaptoethanol in 100mM Tris-HCl,
pH 6.8, 2X 15 minutes, treated with DTT (5mM, 25min at 60°C) and Iodoacetamide (20mM,
30min in the dark at RT), and spin-concentrated to 100μL (Amicon Millipore Amicon Ultra-4, 10K
cutoff) before Methanol/Chloroform precipitation. Proteins were trypsinized overnight at 37°C
and iTRAQ-labeled (ABSciex 4-plex) according to manufacturer instructions, and then dried
down in a speed-vac. Peptides were cleaned with C-18 spin columns (Pierce).
Mass Spectrometry and Spectra Analysis
ABSciex 5800 MALDI TOF/TOF and Thermo Q-Exactive ESI mass spectrometers were used.
For both MALDI and ESI, 5% of each sample was first run on a short (60 min) LC gradient to
determine relative total peptide amounts within each experimental condition. Samples were
equalized and combined to run full (288-300min) gradients. For MALDI, peptides were
resuspended in 2% ACN, 0.1% TFA and 50-90% of final peptide suspension spotted on an LC-
Tempo on a 288 minute gradient (5-45% ACN) through a Chromolith CapRod 150-0.2mm C-18
column (Millipore). MS/MS spectra were searched against the Uniprot/Swiss-Prot database with
ProteinPilot software version 3.0 (ABSciex) (Paragon algorithm 3.0.0.0, 113442) for peptide and
protein identifications. Only peptides with >90% confidence were used for quantitation. Relative
quantitation of kinases was determined using auto bias-correction and background correction.
For Q-Exactive ESI, peptides were resuspended in 2% ACN and 0.1% Formic Acid. 10-20% of
final peptide suspension was run on an Easy nLC-1000 through a Thermo Easy-Spray 75µm x
25cm C-18 column on a 300min gradient (5-40% ACN). ESI parameters: 3e6 AGC MS1, 80ms
MS1 max inject time, 1e5 AGC MS2, 100ms MS2 max inject time, 20 loop count, 1.8 m/z
isolation window, 45s dynamic exclusion. Spectra were searched against the Uniprot/Swiss-Prot
database with Sequest HT on Proteome Discoverer software. Only peptides with medium or
greater confidence were considered for quantitation, and peptides with greater than 25%
coisolation interference were discounted. For quadruplicate Lapatinib-induced MIB/MS
signatures (Figure 1, 2, S1, S2), three MALDI runs and one ESI run were analyzed as below.
Single Lapatinib/Dasatinib combination MIB/MS runs (Figure 3D) were acquired by MALDI.
Single lapatinib/BGJ398 MIB/MS run (Figure 3H) was acquired by ESI. MIB/MS profiles of
Lapatinib-resistant lines (Figures 4B, 4C, S4) are the mean from two independent MIB/MS
experiments (one MALDI, one ESI). Lapatinib-resistant SKBR-3 + JQ1 or I-BET151 (Figure 7C)
was a single MIB/MS run on ESI. See Table S1 for raw MIB/MS binding ratios.
Statistical Analysis of MIB/MS

For Lapatinib-induced signatures, we performed four independent MIB/MS experiments: three
on MALDI TOF/TOF and one on a Thermo Q-Exactive. MALDI data was analyzed as follows:
for a total of p unique kinases, we computed the pooled protein ratio and p-value across the
three replicates. Let yij denote the Log2 protein ratio for kinase i, i = 1,…,p in replicate j, j =
1,2,3; and let wij denote the number of peptides used for calculation of the protein ratio for
kinase i in replicate j. The pooled protein ratio for kinase i is defined as 2yi, where
𝑦𝑖 = (∑ 𝑤𝑖𝑗 ×3𝑗=1 𝑦𝑖𝑗)/(∑ 𝑤𝑖𝑗)
3𝑗=1 . To avoid directional conflict, we convert the two-sided p-values
reported in ProteinPilot™ to one-sided p-values and denote it as pij. We applied Stouffer’s Z-
score method to combine the p-values. Let zij = Φ−1(1-pij), where Φ is the standard Gaussian
cumulative distribution function. Define the combined Z-score as 𝑧𝑖 = (∑ √𝑤𝑖𝑗 ×3𝑗=1 𝑦𝑖𝑗)/
√∑ 𝑤𝑖𝑗3𝑗=1 . The combined two-sided p-value for kinase i is given as pi = 2(1-Φ(|Zi|)). For each
replicate, we identified kinases that exhibit statistically significant changes in expression based
on Benjamini-Hochberg adjusted p-values at FDR of 0.05 to account for multiple comparisons.
Thermo Proteome Discoverer for Q-Exactive analysis does not provide p-Values, so to include
this data in analysis, we took the mean of fold-changes for a given kinase from all four
independent experiments, and considered significant changes to be within the standard
deviation. Only kinases that were captured in three out of four independent experiments were
considered for statistical analysis, and resulting statistically significant kinases were combined
with significant kinases from MALDI triplicate analysis to generate signatures in Figure 2A.
3x3 Self-organizing map (SOM) clustering was performed using Partek software, and heat maps
were generated with GENE-E and Euclidian hierarchical clustering. Principal Components
Analysis (PCA) is a dimension reduction method that uses covariance to transform data into a
smaller set of variables and aids in identifying those that are most responsible for variation
within the data (Slack et al., 2008). 48 h lapatinib-induced MIB/MS binding ratios were log2
transformed and filtered such that each kinase was present in at least three out of the four runs
for each cell line analyzed (SKBR-3, BT474, HCC1419, HCC1954, MDA-MB-361), yielding a
total of 67 kinases for analysis.
Western Blotting
Proteins were separated by SDS-PAGE, transferred to nitrocellulose membranes, and probed
with the following primary antibodies. pAKT (S473), pAKT (T308), DDR1, pEGFR (Y1068),

EGFR, pERBB2 (Y1221/2), ERBB2, pERBB3 (Y1197), pERBB3 (Y1289), ERBB3, pERK1/2
(T202/Y204), FAK, pIGF1R/IR (Y1135/6), IGF1R, INSR, pP70 S6K (T389), PARP, pPKC delta
(T505), PKC delta, pSFK (Y416), pSTAT3 (Y705), STAT3, were obtained from Cell Signaling
Technology. Antibodies for ERK2, FGFR2 (BEK), FRK (RAK), were obtained from Santa Cruz
Biotechnology. The antibody recognizing pFAK (Y397) was obtained from Biosource.
Secondary HRP-anti-rabbit was from Jackson Immunoresearch Laboratories and HRP-anti-
mouse was from GE Healthcare. Western blots were visualized by incubation with SuperSignal
West Pico Chemiluminescent Substrate (Thermo Scientific).
Growth Assays
96 h and 8-day growth assays were performed in 96-well plates. Cells were plated one day prior
to first treatment. Media containing fresh drug was changed every 24 h unless otherwise noted.
Live cells were stained with Hoescht in PBS for 20 min at 37°C and imaged/counted with a Thermo
Cellomics ArrayScan VTI at 25 frames per well. Crystal violet (CV) colony formation assays were
performed in 6-well plates, with three technical replicates per condition. Cells were plated 24-48h
before addition of first drug-containing media and media was changed every 3-4 days for 4 or 5
weeks. Cells were rinsed with PBS, fixed in methanol (10min, -20°C), and stained with 0.5%
crystal violet for 20min. Plates were washed with tap water and dried before imaging. CV was
solubilized with 30% acetic acid and quantified by absorbance at 600nm. Cell densities (per well):
SKBR-3: 96h, 4,000; 8d and CV, 2,000, BT474: 96h, 6,000; 8d, 3,000; CV, 2,000, HCC1419: CV,
4,000, HCC1954: 8d and CV, 1,000, MDA361: 8d, 3,000; CV, 4,000.
siRNA transfection
Dharmafect SmartPool siRNAs were reverse-transfected at final concentration of 25nM with
RNAiMax (Life Technologies). siRNAs were mixed with 1/1000 final volume RNAiMax in serum-
and antibiotic-free IMDM and incubated at RT for 20-30 min before plating trypsinized cells in
RPMI160 media with 10% FBS and antibiotics. For drug-treatment, cells were incubated in siRNA
for 24 h to allow knockdown before removal of media and replacement with drug-containing
media.
qRT-PCR and RNAseq analysis
Total RNA was purified using the RNeasy Plus Mini kit (Qiagen). For qRT-PCR (Figures 5D, 6F,
S5E, and S7I), 2 μg total RNA was reverse-transcribed to cDNA using High Capacity cDNA RT
kit (Applied Biosystems), and amplified in TaqMan assays on a 7500 Fast Real-time PCR
System (Applied Biosystems). ERK2 mRNA was used to normalize treatments. mRNA-Seq
libraries were constructed using 4 μg total RNA with the Stranded mRNA-Seq Kit (KAPA
Biosystems). 12 samples were run on a single flow cell: SKBR-3 and BT474 parental lines each
treated with DMSO, 300nM lapatinib, 300nM JQ1, and the combination for 48 h, and lapatinib-
resistant SKBR-3 treated for 8 days with 300nM lapatinib, lapatinib+300nM JQ1, or
lapatinib+1µM I-BET151, in addition to parental SKBR-3 cells. 75-cycle single-end sequencing
runs were generated with an Illumina NextSeq-500. QC-passed reads were aligned to the
human reference genome (hg19) using MapSplice (Wang et al., 2010). The alignment profile
was determined by Picard Tools v1.64. Aligned reads were sorted and indexed using SAMtools
and translated to transcriptome coordinates and filtered for indels, large inserts, and zero
mapping quality using UBU v1.0. Transcript abundance estimates for each sample were
performed using an Expectation-Maximization algorithm (Li and Dewey, 2011). Raw RSEM read
counts for all RNAseq samples are provided in Table S2. Raw FASTQ files of RNAseq runs
were uploaded to the Sequence Read Archive (http://www.ncbi.nlm.nih.gov/sra). Accession
numbers are listed in Table S4.
ChIP-PCR
Cells were rinsed with PBS and crosslinked with 1% formaldehyde for 10 min and neutralized with
a final concentration of 125 mM glycine. Cell pellets were lysed with 5mM PIPES pH 8, 85mM
KCl, 0.5% NP-40 with 20mM sodium butyrate and protease/phosphatases inhibitors (2mM PMSF,
20mM NaF, 1X Aprotinin, 0.1mg/mL Leupeptin, 2mM Na3VO4). Chromatin was sonicated
12x30sec in 0.5% sodium deoxycholate, 1% NP-40, 0.1% SDS with 20mM sodium butyrate and
inhibitors, and 5mg of protein was immunoprecipitated with 4ug of antibody overnight (BRD4 and
control rabbit IgG, Bethyl; pS2Pol2, Abcam). Immunocomplexes were coupled to Protein A
sepharose beads for 2 h, and washed 1X with lysis buffer, 4X with 100mM Tris pH 8, 500mM LiCl,
1% NP-40, 1% sodium deoxycholate with inhibitors, and 1X with 10mM Tris pH 8, 10mM EDTA
before elution and protein digestion with 1% SDS, 100mM NaHCO3, and 0.5 mg/mL Proteinase
K. DNA was purified using Qiagen MinElute kit, and 5% of the elution used for each PCR reaction
using Blue qPCR SYBR low ROX reagents (Thermo). Fold changes were calculated using the
ΔΔCt method, normalized to % input and presented as fold enrichment over control rabbit IgG.
Generation of stable cMyc-overexpressing lines
293T cells were transfected with lentiviral packaging and coat vectors (psPAX2, MD2.G, gifts
from Didier Trono, Addgene plasmids #12260 and #12259) and either pCDH-puro empty vector
or pCDH-puro-cMYC, a gift from Jialiang Wang (Addgene plasmid # 46970). 48h post-
transfection, supernatant containing lentivirus was used at a 1:4 dilution to infect SKBR-3 and
BT474. 48h post-infection, SKBR-3 and BT474 were selected using 2.5µg/mL and 5µg/mL
puromycin, respectively. Infected cells were kept as a pool, and experiments were initiated ~1
month after selection.
For TaqMan probes and qRT-PCR primers, see Table S3.
SUPPLEMENTAL REFERENCES
Li, B., and Dewey, C.N. (2011). RSEM: accurate transcript quantification from RNA-Seq data
with or without a reference genome. BMC Bioinformatics. 12:323
Mungamuri, S.K., Murk, W., Grumolato, L., Bernstein, E., and Aaronson, S.A. (2013). Chromatin
modifications sequentially enhance ErbB2 expression in ErbB2-positive breast cancers. Cell
Rep. 5(2):302-313.
Slack, M.D., Martinez, E.D., Wu, L.F., and Altschuler, S.J. (2008). Characterizing
heterogeneous cellular responses to perturbations. PNAS. 105(49):19306–19311
Wang, K., Singh, D., Zeng, Z., Coleman, S.J., Huang, Y., Savich, G.L., He, X., Mieczkowski, P.,
Grimm, S.A., Perou, C.M., MacLeod, J.N., Chiang, D.Y., Prins, J.F., Liu, J. (2010). MapSplice:
accurate mapping of RNA-seq reads for splice junction discovery. Nuclei Acid Res. 38(18):e178.