cell-scaffold interactions: scaffold degradation cell
TRANSCRIPT
!Cell-Scaffold Interactions:!
!Scaffold Degradation!
Cell Attachment!Cell Morphology!Cell Contractility!
Cell Migration!Cell Differentiation"
1
Cell scaffold interactions
• Scaffolds also being used to characterize cell-scaffold interactions, e.g. how cell behavior (attachment,migration, contraction, differentiation) is affected by substrate
Scaffold degradation
• Native ECM — enzymes produced by cells resorb ECM over time;cells also synthesize new ECM to replace it
e.g. bone — rates of resorption and synthesis depend on loading
• Cells also degrade tissue engineering scaffolds
• Length of time scaffold remains insoluble called “residence time”
• Require scaffold degradation to occur in a manner that does not interfere with new ECM synthesis
• Scaffold residence time must be approximately equal to the time required to synthesize new ECM
2
• Degradation rate for scaffold depends on its chemical composition and cross-linking, and on relativedensity of scaffold
• Synthetic polymers — can vary molecular weight of polymers and ratio of co-polymers; e.g. PLGAhigher GA:LA ratio polymers degrade quicker
• Collagen-based scaffolds — can control degree of cross-linking
Physical methods: — dehydrothermal (DHT) treatment (105◦C vacuum 24 hours) — removes water, forms interchain bonds through condensation — UV treatment
Chemical methods: — glutaraldehyde; carbodiimide treatments
3
Cell adhesion
• Cells attach to ECM at focal adhesion
• At focal adhesion:
◦ cell has integrins — trans membrane proteins that bind to ligands on ECM; other end ofintegrin connects to sub-membrane plaque that then connects to cell’s cytoskeleton (e.g. toactin filaments)
• Cell behaviors such as attachment, migration, proliferation, contraction affected by interactions between focal adhesions and integrins
• Biological activity of scaffolds depends on density of ligands available for integrins to bind to
• Ligand density depends on composition of scaffold and surface area/volume of scaffold
• Biological polymers, that are constituents of native ECM (e.g. collagen) have a range of nativebinding sites
• Synthetic polymers don’t have binding sites and need to be functionalized with adhesive proteinssuch as fibronectin and laminin
4
• Specific surface area (SA/vol) of scaffold depends on pore side d and relative density:
• For a tetrakaidecahedral unit cell:ρ∗ 1/2 ρ∗ 1/2 1SA 1 SA 2πrln r r 1 ∝ = ∝ ∝ ∝
v d ρs v l3 l2 l l ρs d
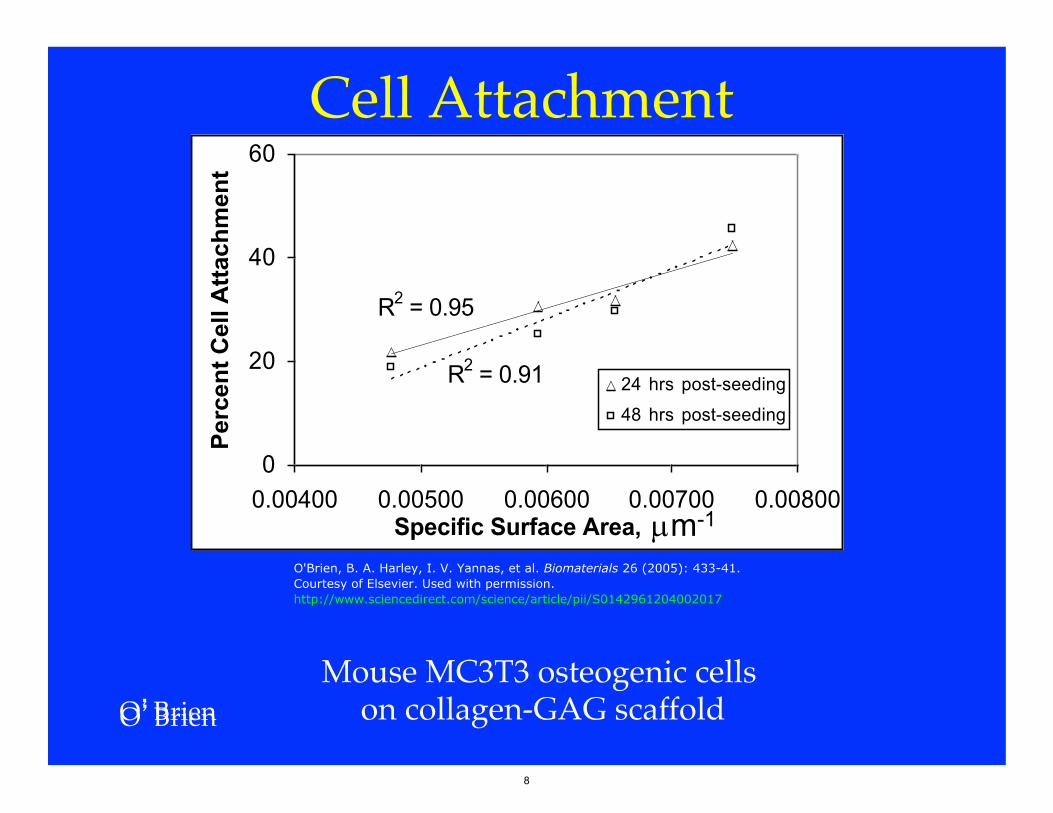
• Dependance of cell attachment on specific surface area was measured by seeding cells (MC3T3-E1mouse osteogenic) onto collagen-GAG scaffolds of constant relative density (ρ∗/ρs = 0.006) and varying pore size)
d = 96, 110, 121, 151µm
• Number of cells attached measured at 24, 48 hours
• Fraction of cells attached increased linearly with specific surface area
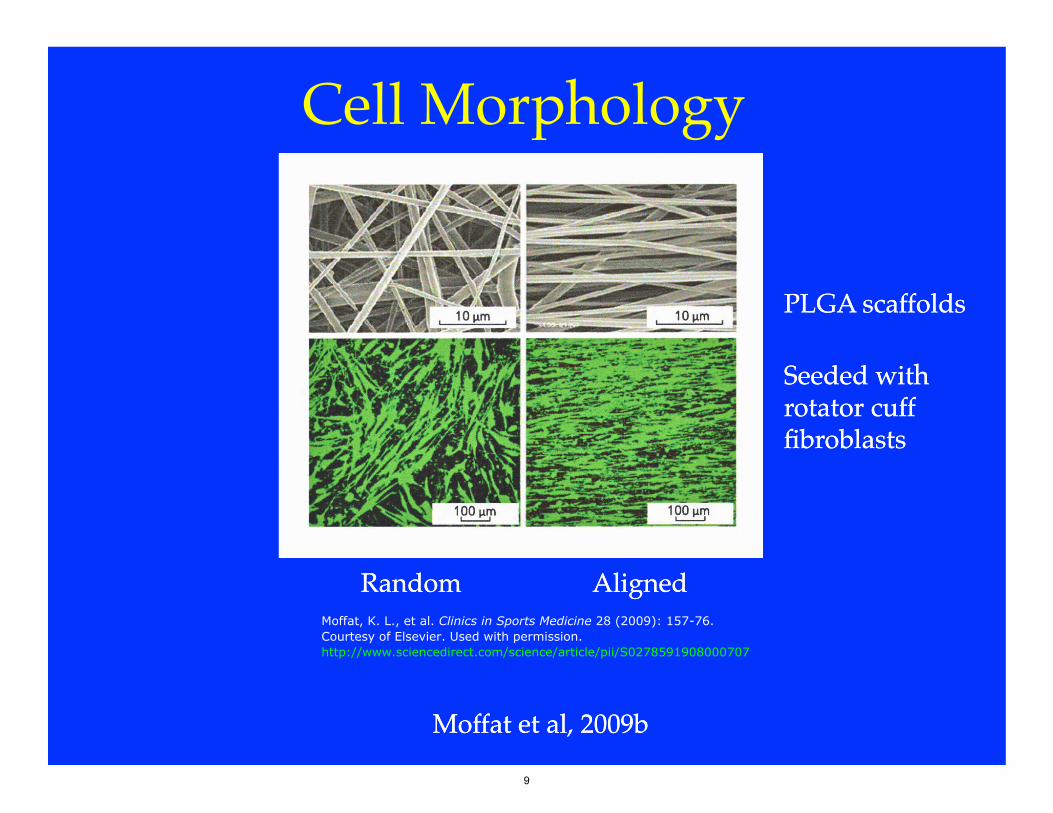
Cell morphology
• Cell orientation follows scaffold pore orientation
• Cell morphology can depend on a substrate stiffness
Cell contraction see slides
Cell migration
5
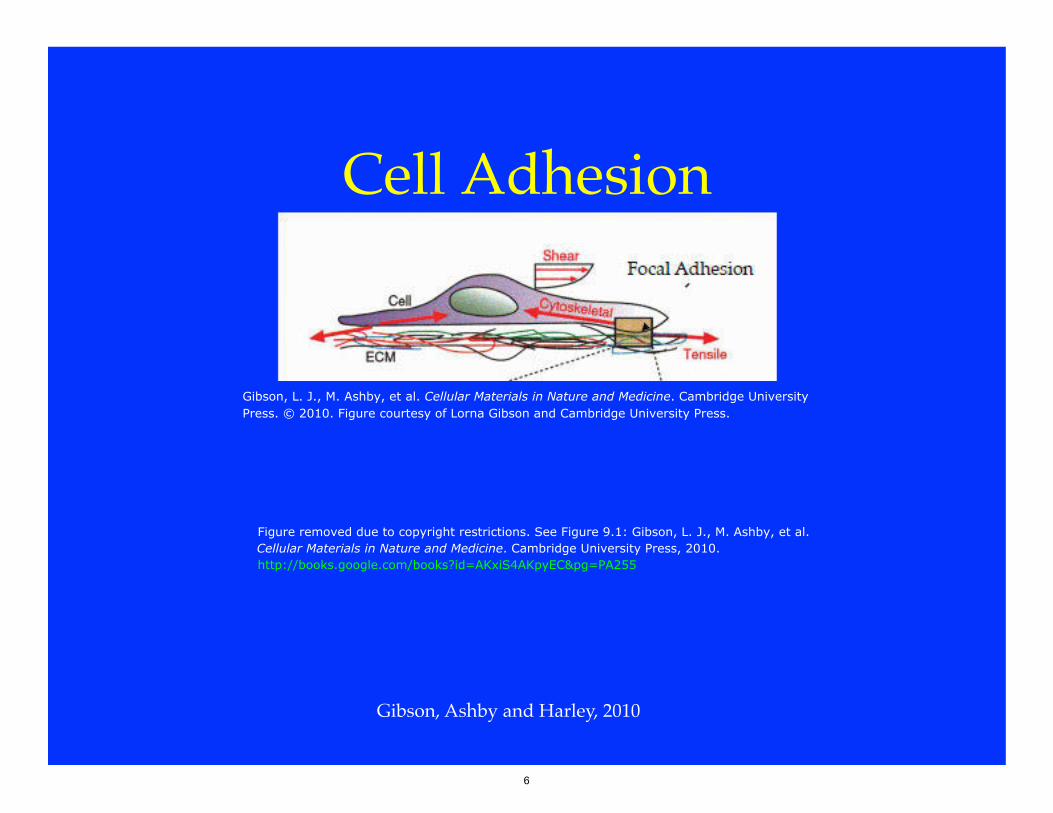
Cell Adhesion"
Gibson, Ashby and Harley, 2010"
Gibson, L. J., M. Ashby, et al. Cellular Materials in Nature and Medicine. Cambridge UniversityPress. © 2010. Figure courtesy of Lorna Gibson and Cambridge University Press.
Figure removed due to copyright restrictions. See Figure 9.1: Gibson, L. J., M. Ashby, et al.Cellular Materials in Nature and Medicine. Cambridge University Press, 2010.http://books.google.com/books?id=AKxiS4AKpyEC&pg=PA255
6
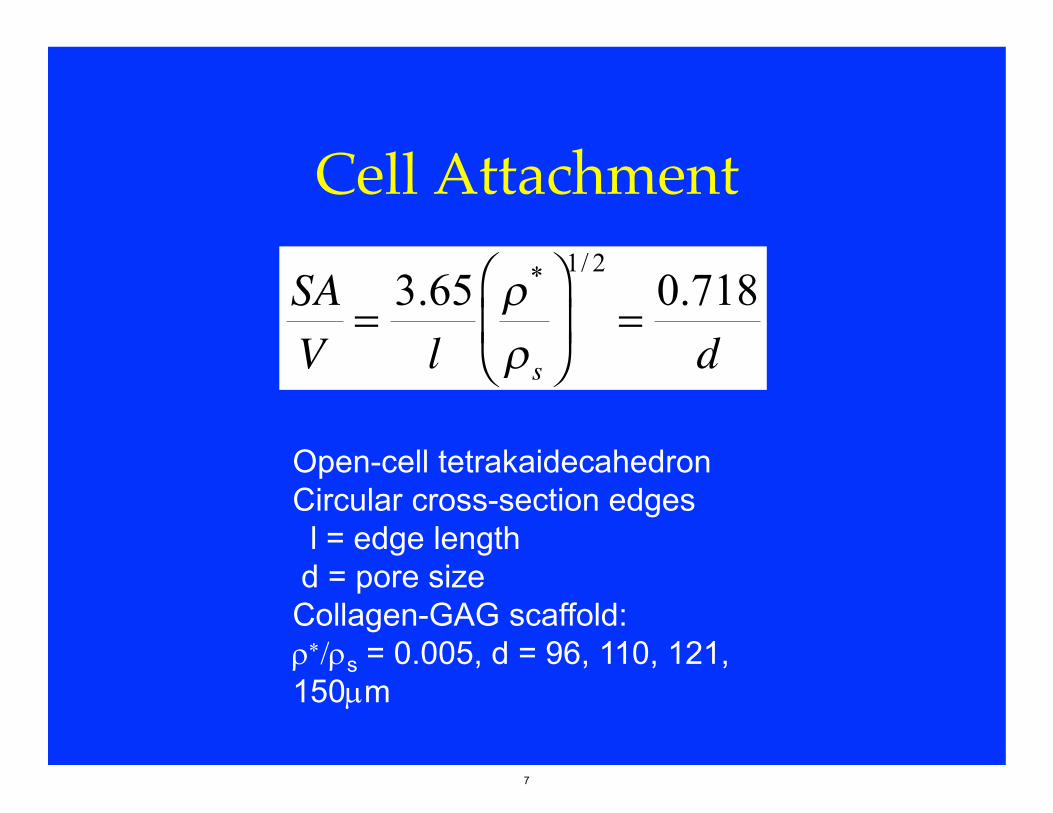
Cell Attachment"
�
SAV
=3.65l
ρ*
ρs
⎛
⎝ ⎜
⎞
⎠ ⎟
1/ 2
=0.718d
Open-cell tetrakaidecahedron Circular cross-section edges l = edge length
d = pore size Collagen-GAG scaffold: s = 0.005, d = 96, 110, 121, 150m
7
-
Cell Attachment"
R2 = 0.95
R2 = 0.91
0
20
40
60
0.00400 0.00500 0.00600 0.00700 0.00800Specific Surface Area, ?m-1
Perc
ent C
ell A
ttach
men
t
24 hrs post-seeding
48 hrs post-seeding
Mouse MC3T3 osteogenic cells on collagen-GAG scaffold"O’Brien"
O'Brien, B. A. Harley, I. V. Yannas, et al. Biomaterials 26 (2005): 433-41.Courtesy of Elsevier. Used with permission.http://www.sciencedirect.com/science/article/pii/S0142961204002017
m-1
O’Brien
8
Cell Morphology"
Moffat et al, 2009b"
PLGA scaffolds"
Seeded with rotator cuff fibroblasts"
Random" Aligned"-
PLGA scaffolds
Seeded with rotator cuff fibroblasts
Random Aligned -Moffat, K. L., et al. Clinics in Sports Medicine 28 (2009): 157 76.
Courtesy of Elsevier. Used with permission.http://www.sciencedirect.com/science/article/pii/S0278591908000707
Moffat et al, 2009b
9
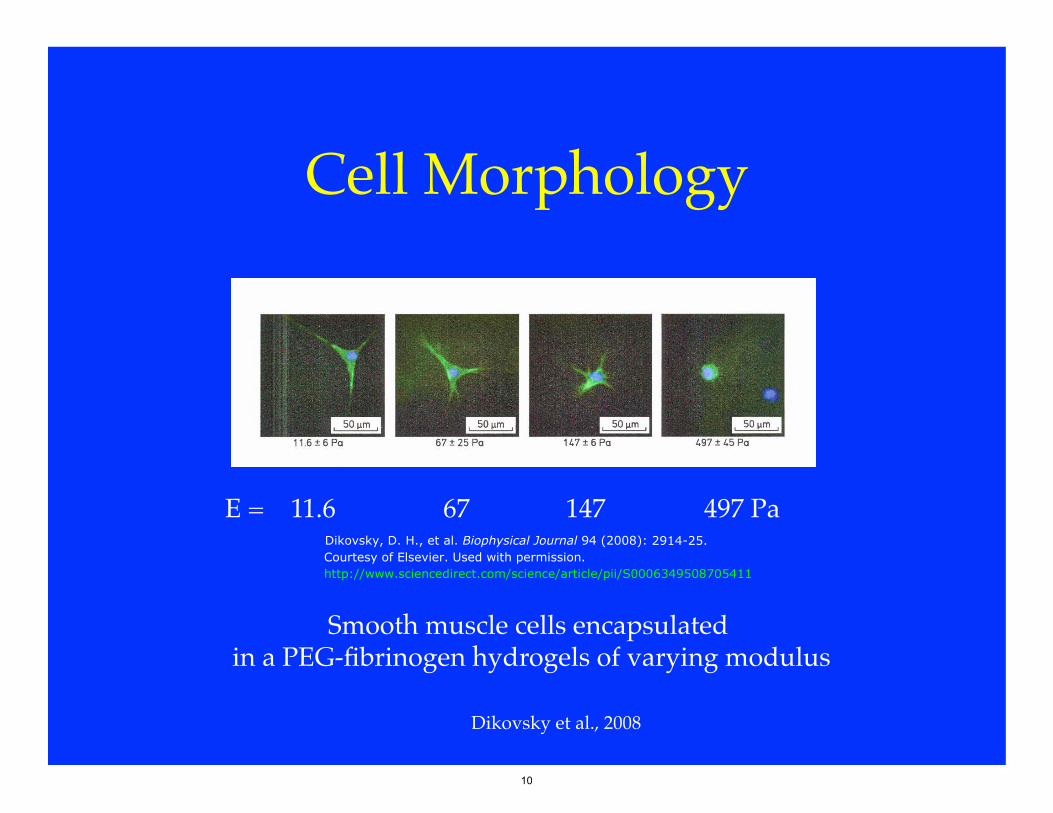
Cell Morphology"
Smooth muscle cells encapsulated "in a PEG-fibrinogen hydrogels of varying modulus"
E = 11.6 " 67 " 147" "497 Pa"
Dikovsky et al., 2008
"
Dikovsky, D. H., et al. Biophysical Journal 94 (2008): 2914-25.Courtesy of Elsevier. Used with permission.http://www.sciencedirect.com/science/article/pii/S0006349508705411
10
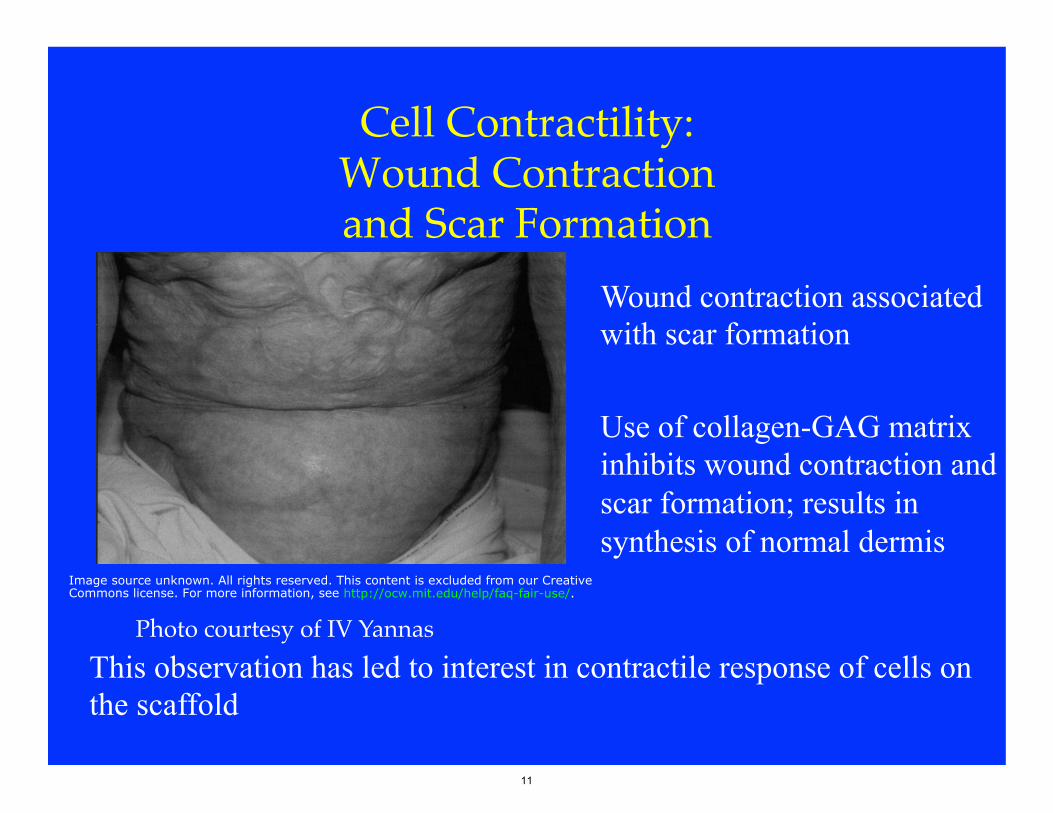
Cell Contractility:!Wound Contraction !and Scar Formation"
Wound contraction associated with scar formation
Use of collagen-GAG matrix inhibits wound contraction and scar formation; results in synthesis of normal dermis
This observation has led to interest in contractile response of cells on the scaffold
Photo courtesy of IV Yannas"
Image source unknown. All rights reserved. This content is excluded from our CreativeCommons license. For more information, see http://ocw.mit.edu/help/faq-fair-use/.
11
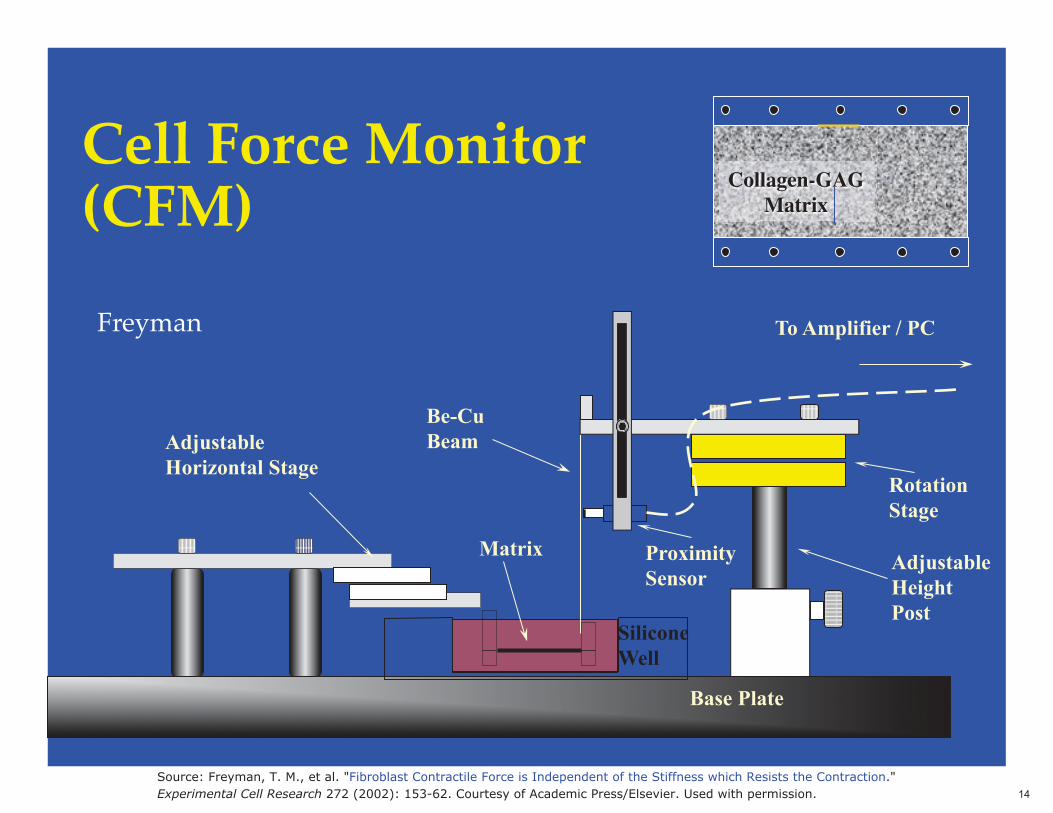
Contractility of Cells"
• Biological cells can contract a scaffold"• Free-floating tests"
– Measure diameter change"• Developed cell force monitor (CFM) to
measure forces"
12
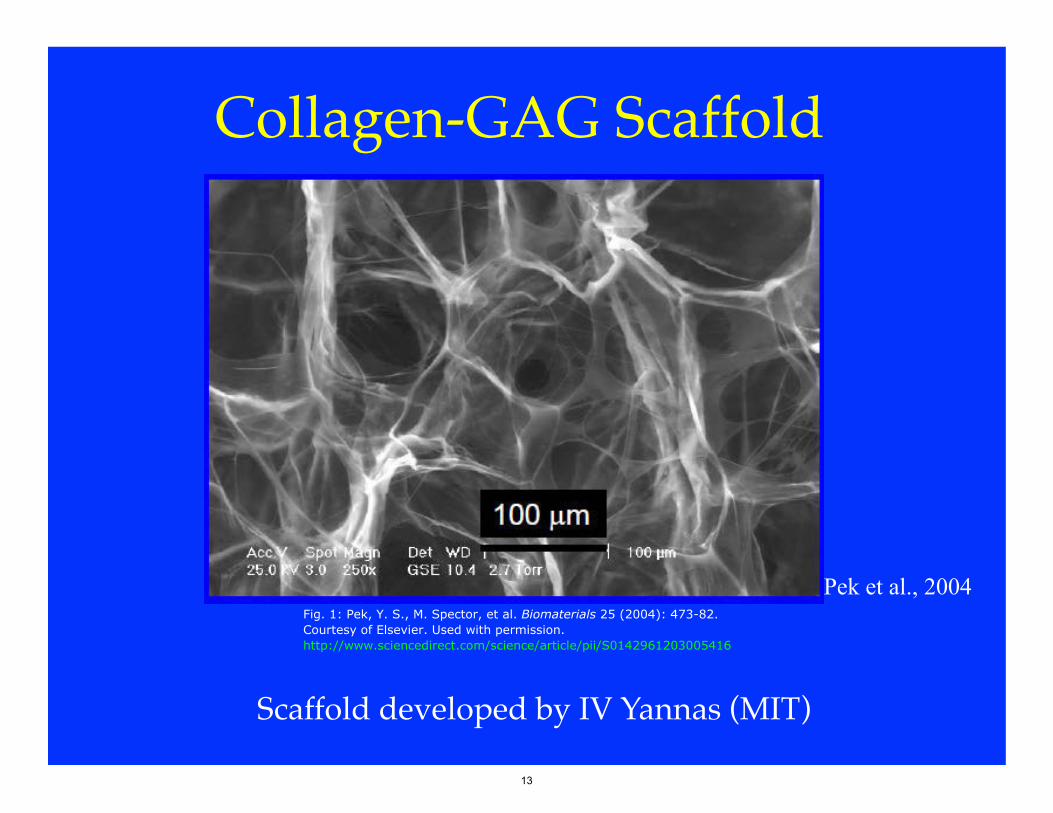
Collagen-GAG Scaffold
Pek et al., 2004
Scaffold developed by IV Yannas (MIT)
-
Fig. 1: Pek, Y. S., M. Spector, et al. Biomaterials 25 (2004): 473-82.Courtesy of Elsevier. Used with permission.http://www.sciencedirect.com/science/article/pii/S0142961203005416
13
10
Cell Force Monitor (CFM)
Adjustable Height Post
Rotation Stage
Be-Cu Beam
10 Base Plate
Adjustable Horizontal Stage
Silicone Well
To Amplifier / PC
Proximity Sensor
Matrix
Collagen-GAGMatrix
Freyman
14Source:
Academic Press/
-5
0
5
10
15
0 6 12 18 24
Time [Hours]
Forc
e [m
N]
10 Million Attached Fibroblasts at 22h
7.26.0
4.4
2.3
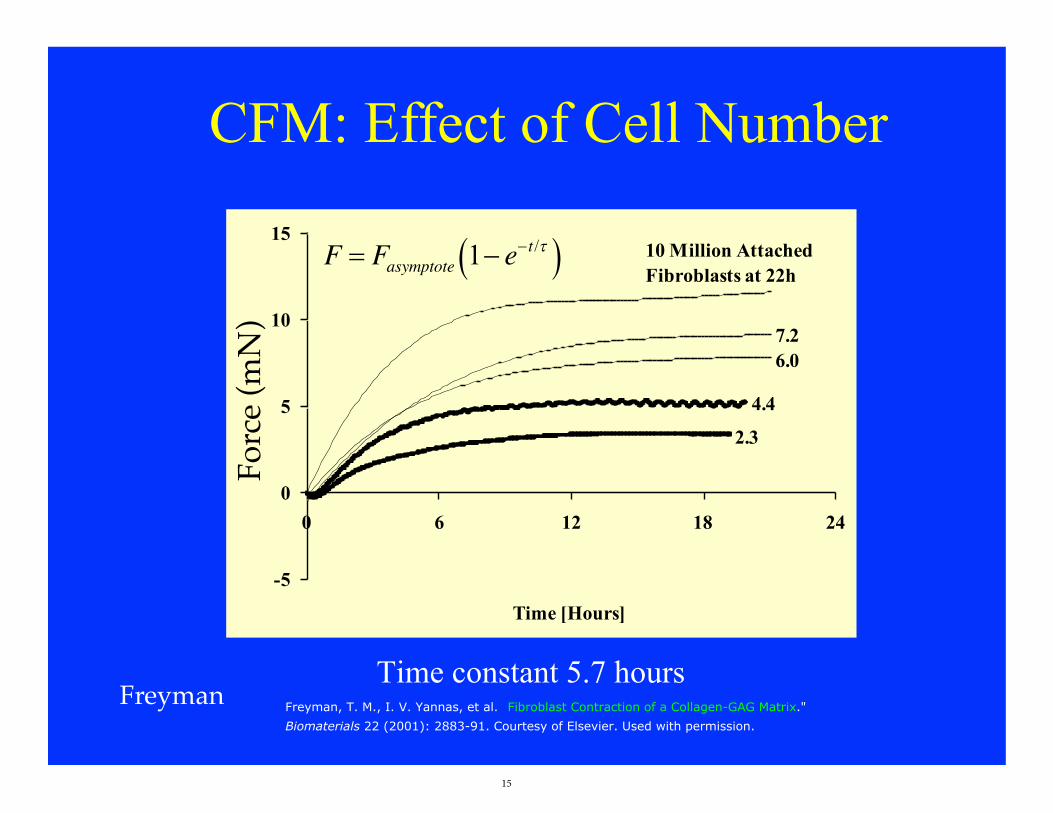
CFM: Effect of Cell Number
Freyman"
Forc
e (m
N)"
F = Fasymptote 1− e−t/τ( )
"
Time constant 5.7 hours Freyman, T. M., I. V. Yannas, et al. Fibroblast Contraction of a Collagen-GAG Matrix." Biomaterials 22 (2001): 2883-91. Courtesy of Elsevier. Used with permission.
15
0
5
10
15
0 4 8 12
Asy
mpt
otic
For
ce [m
N]
(n=4)
(2)
(3)(3)
(4)
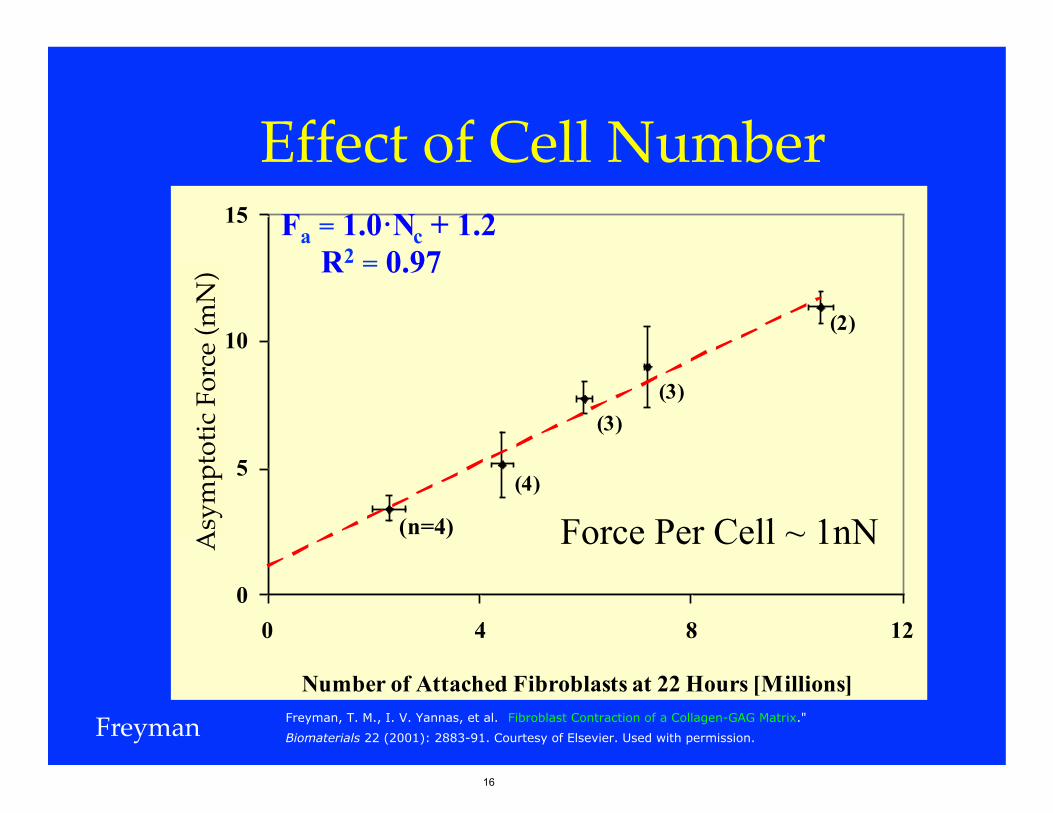
Fa = 1.0·Nc + 1.2 R2 = 0.97
Force Per Cell ~ 1nN
Freyman"
Effect of Cell Number"A
sym
ptot
ic F
orce
(mN
)"
"
Number of Attached Fibroblasts at 22 Hours [Millions] Freyman, T. M., I. V. Yannas, et al. Fibroblast Contraction of a Collagen-GAG Matrix."Biomaterials 22 (2001): 2883-91. Courtesy of Elsevier. Used with permission.
16
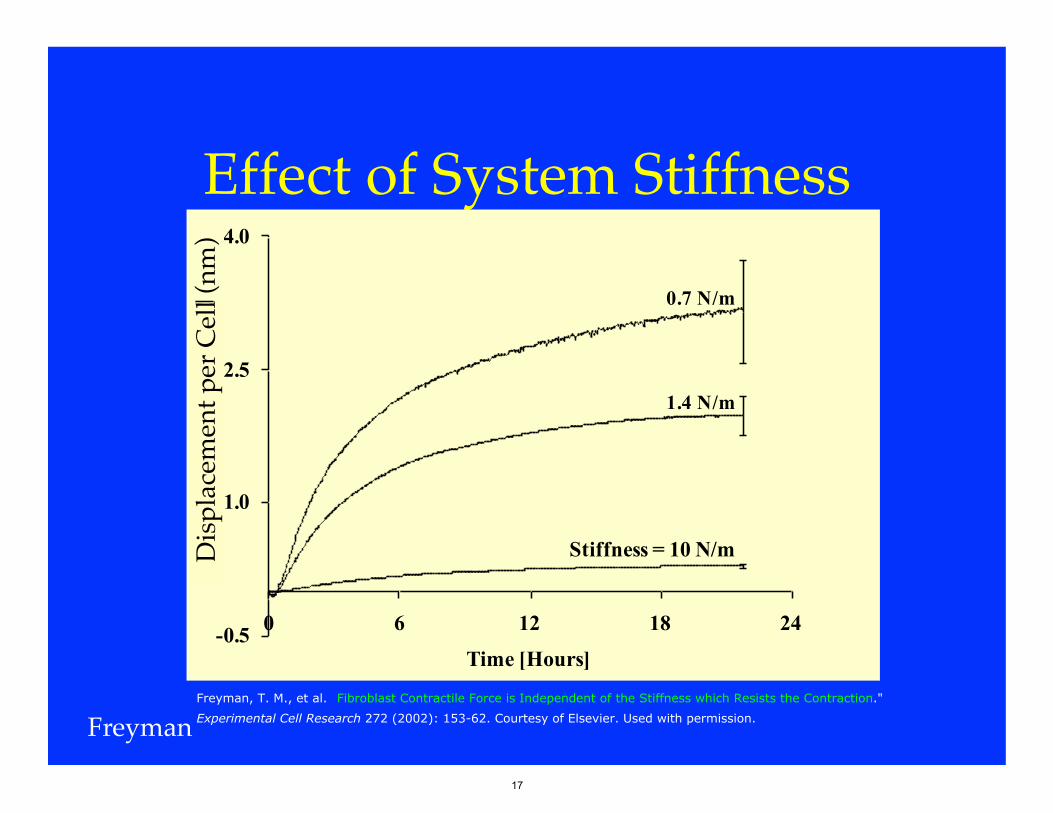
Effect of System Stiffness"
-0.5
1.0
2.5
4.0
0 6 12 18 24
Dis
plac
emen
t per
Cel
l [nm
]
Stiffness = 10 N/m
1.4 N/m
0.7 N/m
Freyman"
Dis
plac
emen
t per
Cel
l (nm
)"
" -
Time [Hours]
Freyman, T. M., et al. Fibroblast Contractile Force is Independent of the Stiffness which Resists the Contraction."Experimental Cell Research 272 (2002): 153-62. Courtesy of Elsevier. Used with permission.
17
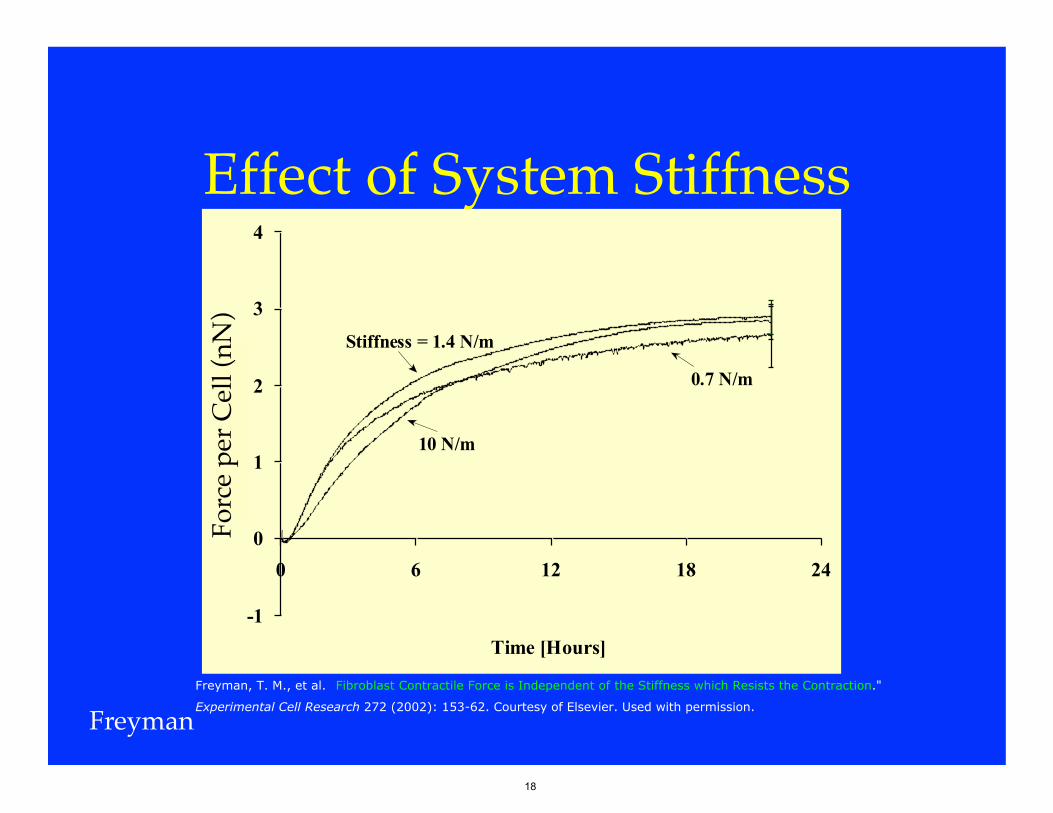
Effect of System Stiffness"
-1
0
1
2
3
4
0 6 12 18 24
Forc
e pe
r C
ell [
nN]
10 N/m
0.7 N/m
Stiffness = 1.4 N/m
Freyman"
Forc
e pe
r Cel
l (nN
)"
" -
Time [Hours]
Freyman, T. M., et al. Fibroblast Contractile Force is Independent of the Stiffness which Resists the Contraction."
Experimental Cell Research 272 (2002): 153-62. Courtesy of Elsevier. Used with permission.
18
Methods: Cell Elongation!
Average aspect ratio of cells"– Time points 0, 4, 8, 15, 22, and 48 h (n=3)"– Hematoxylin & eosin (H&E) stained
glycomethacrylate (GMA) sections (5mm)"– Digital image analysis (~200 cells per sample)!
19
" " -
Fibroblast Morphology
Figure removed due to copyright restrictions. See Figure 3: Freyman, T. M., et al. Micromechanics of Fibroblast Contraction of a Collagen–GAG Matrix. Experimental Cell Research 269 (2001): 140-53.
Freyman
20
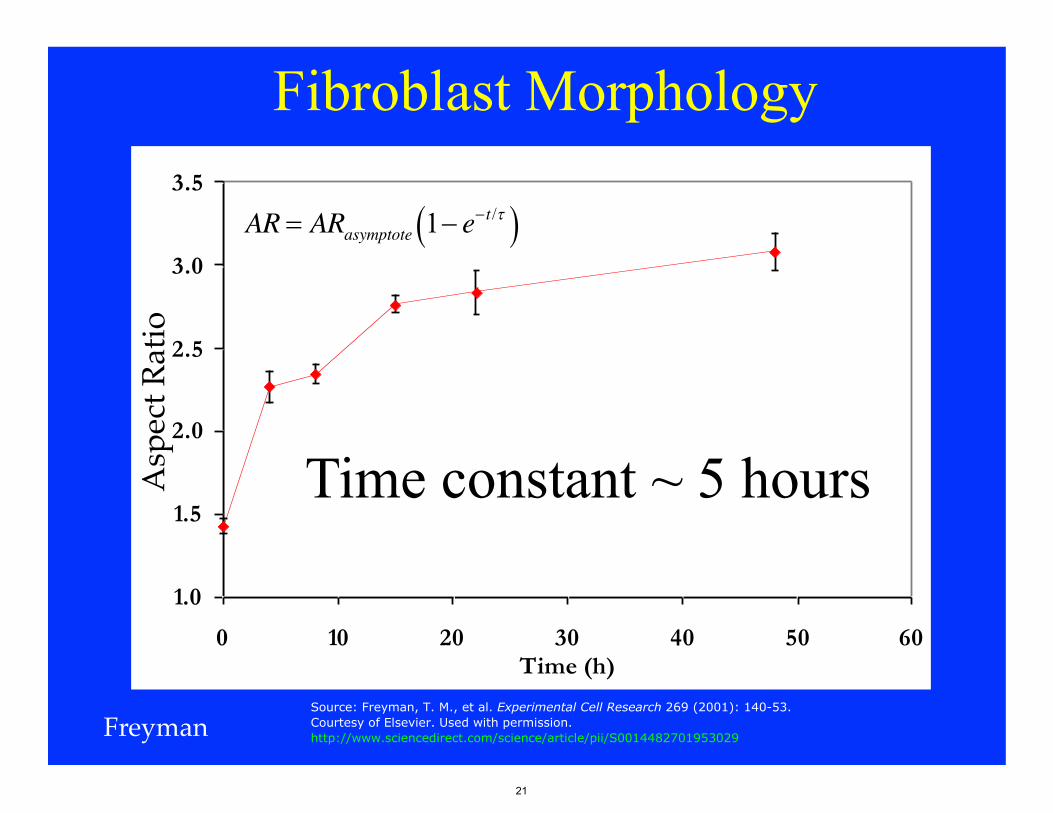
1.0
1.5
2.0
2.5
3.0
3.5
0 10 20 30 40 50 60Time (h)
Asp
ect
Rat
io
Time constant ~ 5 hours
Fibroblast Morphology
Freyman"
Asp
ect R
atio"
AR = ARasymptote 1− e−t/τ( )
Source: Freyman, T. M., et al. Experimental Cell Research 269 (2001): 140-53.Courtesy of Elsevier. Used with permission.http://www.sciencedirect.com/science/article/pii/S0014482701953029
21
Time Constants"
• Time constant for contraction ~ 5.7hours"
• Time constant for elongation ~ 5 hours"• Suggests a link between the average "
elongation of the cell population and the macroscopic contraction of the population"
22
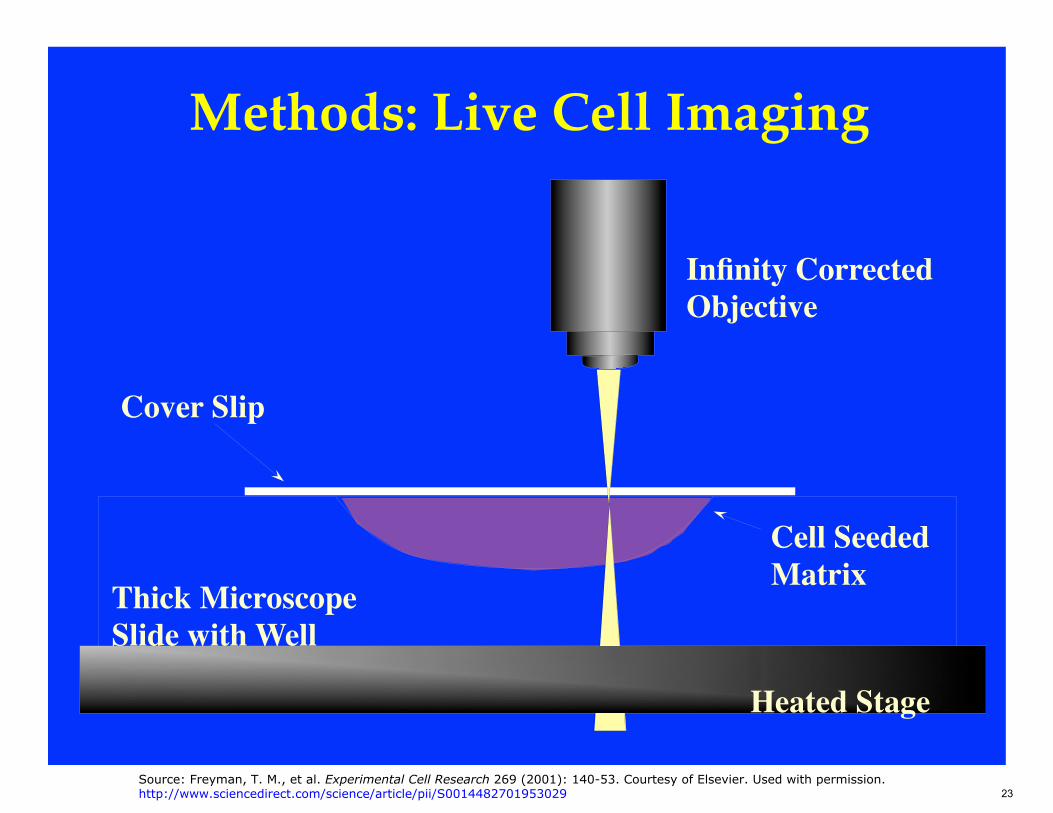
Methods: Live Cell Imaging"
Thick Microscope Slide with Well
Cell Seeded Matrix
Cover Slip
Heated Stage
Infinity Corrected Objective
Source: Freyman, T. M., et al. Experimental Cell Research 269 (2001): 140-53. Courtesy of Elsevier. Used with permission.http://www.sciencedirect.com/science/article/pii/S0014482701953029 23
20
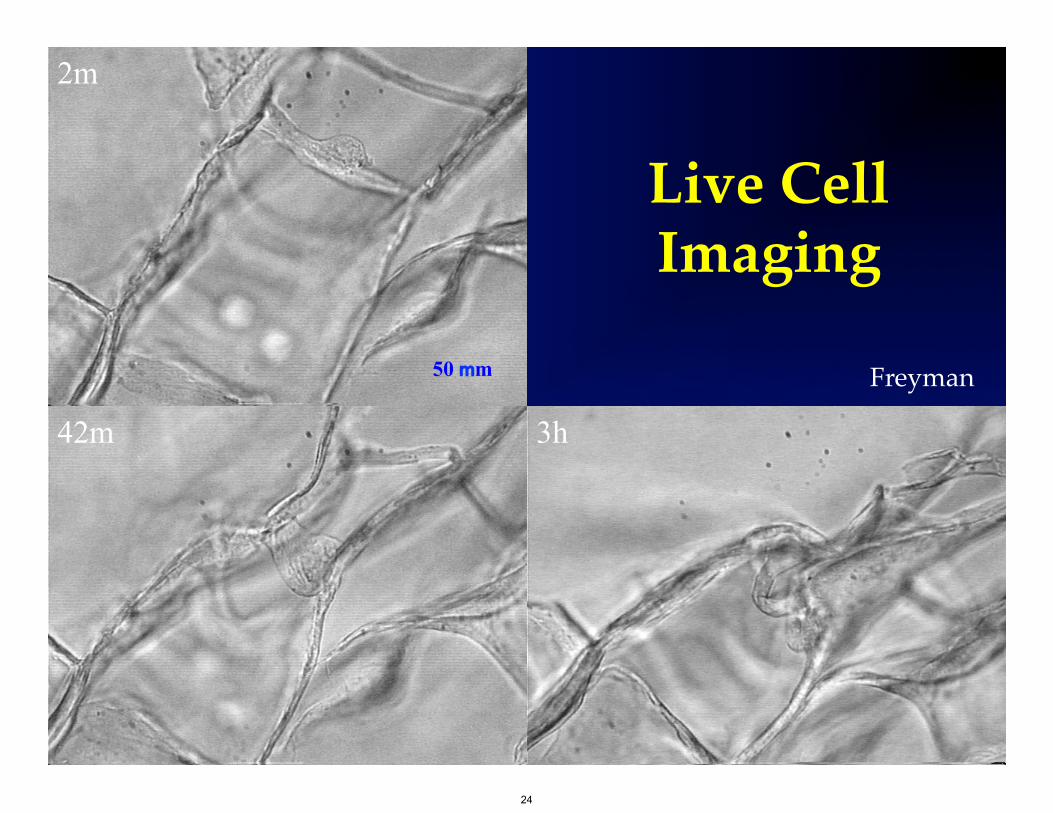
Live Cell "Imaging!
2m
50 mm
19m 23m 25m 26m 28m 33m 38m 42m 3h
Freyman"
24
Live Cell Imaging
Freyman"
Live Cell Imaging
Figure removed due to copyright restrictions. See Figure 7: Freyman, T. M., et al. "Micromechanicsof Fibroblast Contraction of a Collagen–GAG Matrix." Experimental Cell Research 269 (2001): 140-53.
Freyman
25
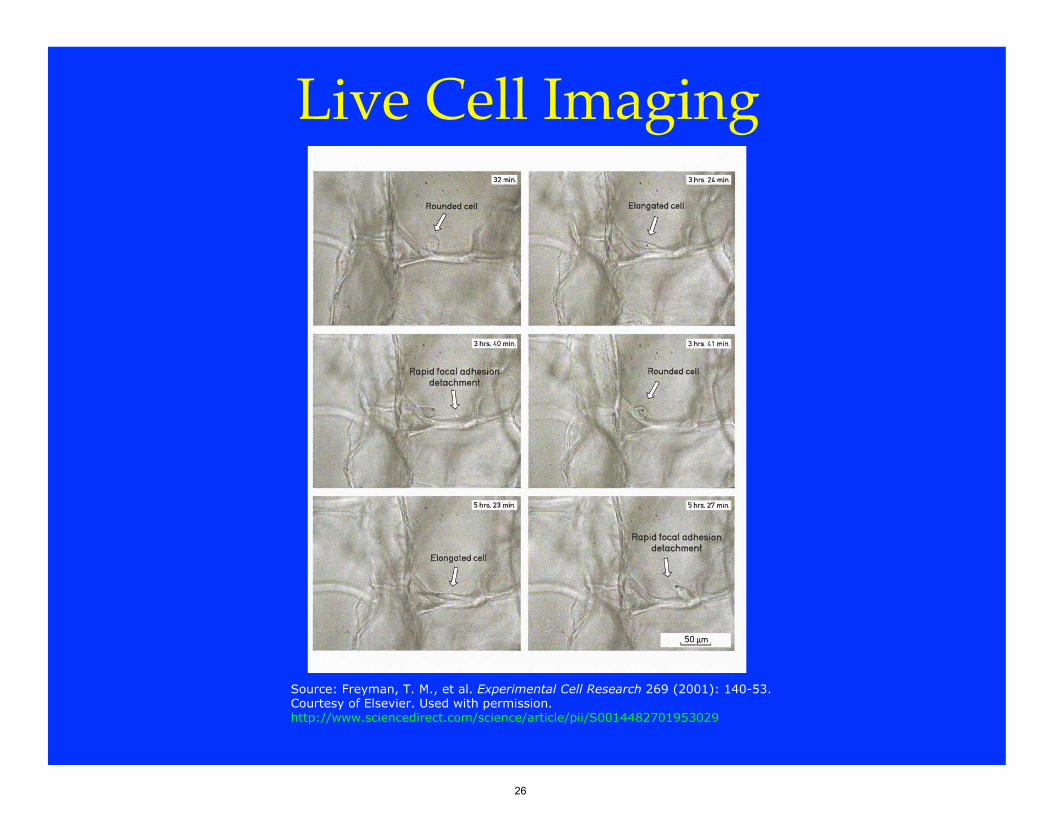
Live Cell Imaging"
Source: Freyman, T. M., et al. Experimental Cell Research 269 (2001): 140-53. Courtesy of Elsevier. Used with permission.http://www.sciencedirect.com/science/article/pii/S0014482701953029
26
Schematic of cell elongation and matrix contraction
Freyman"
Figure removed due to copyright restrictions. See Figure 7a-d: Freyman, T. M., et al."Micromechanics of Fibroblast Contraction of a Collagen–GAG Matrix.Experimental Cell Research 269 (2001): 140-53.
27
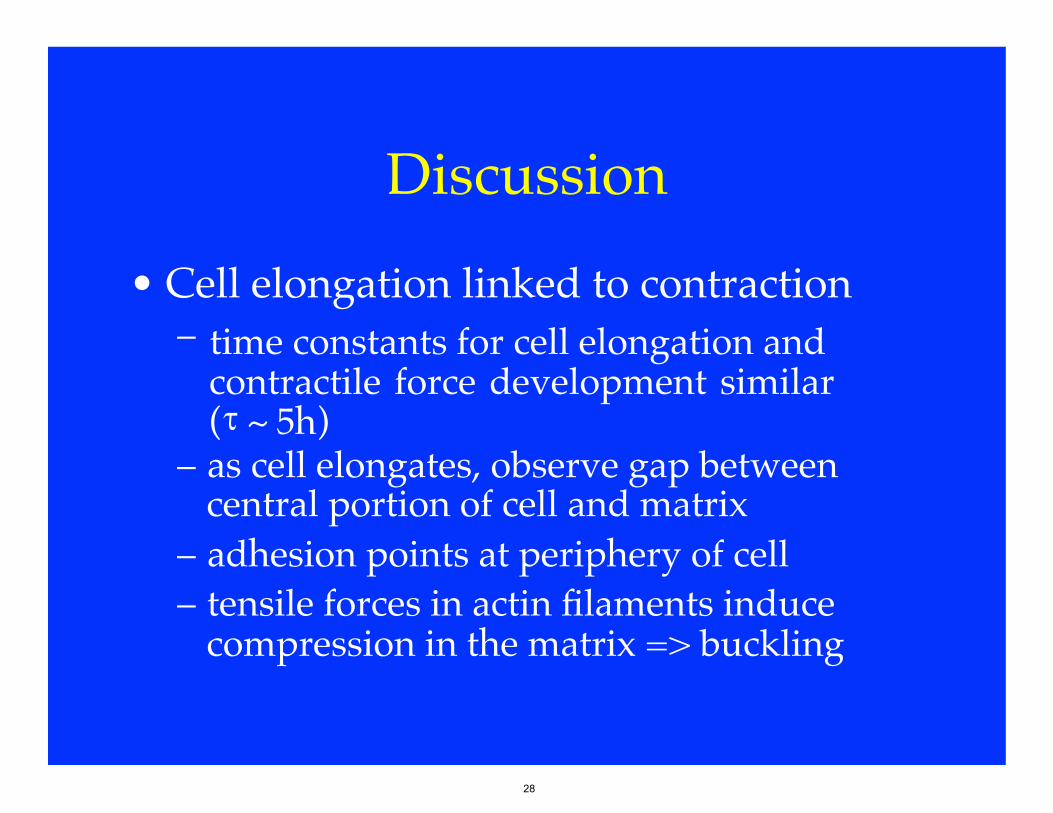
Discussion"• Cell elongation linked to contraction"
–
– as cell elongates, observe gap betweencentral portion of cell and matrix"
– adhesion points at periphery of cell"– tensile forces in actin filaments induce
compression in the matrix => buckling "
time constants for cell elongation and contractile force development similar ( ~ 5h) "
28
Single Cell Contractile Force"
• Contraction: cell buckling"• Measure Es from AFM bending test"• Allows calculation of contractile force of
single fibroblast"
29
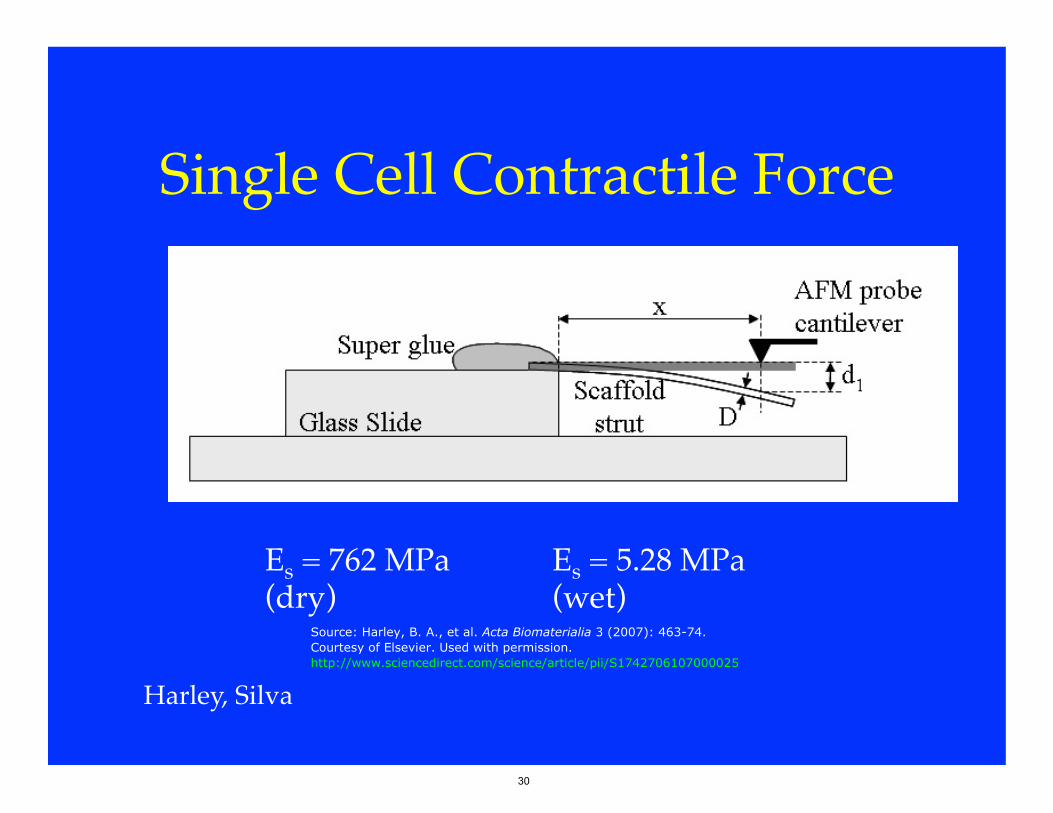
Single Cell Contractile Force"
Es = 762 MPa" "Es = 5.28 MPa"(dry) " " "(wet)"
Harley, Silva"
-
Source: Harley, B. A., et al. Acta Biomaterialia 3 (2007): 463-74.Courtesy of Elsevier. Used with permission.http://www.sciencedirect.com/science/article/pii/S1742706107000025
30
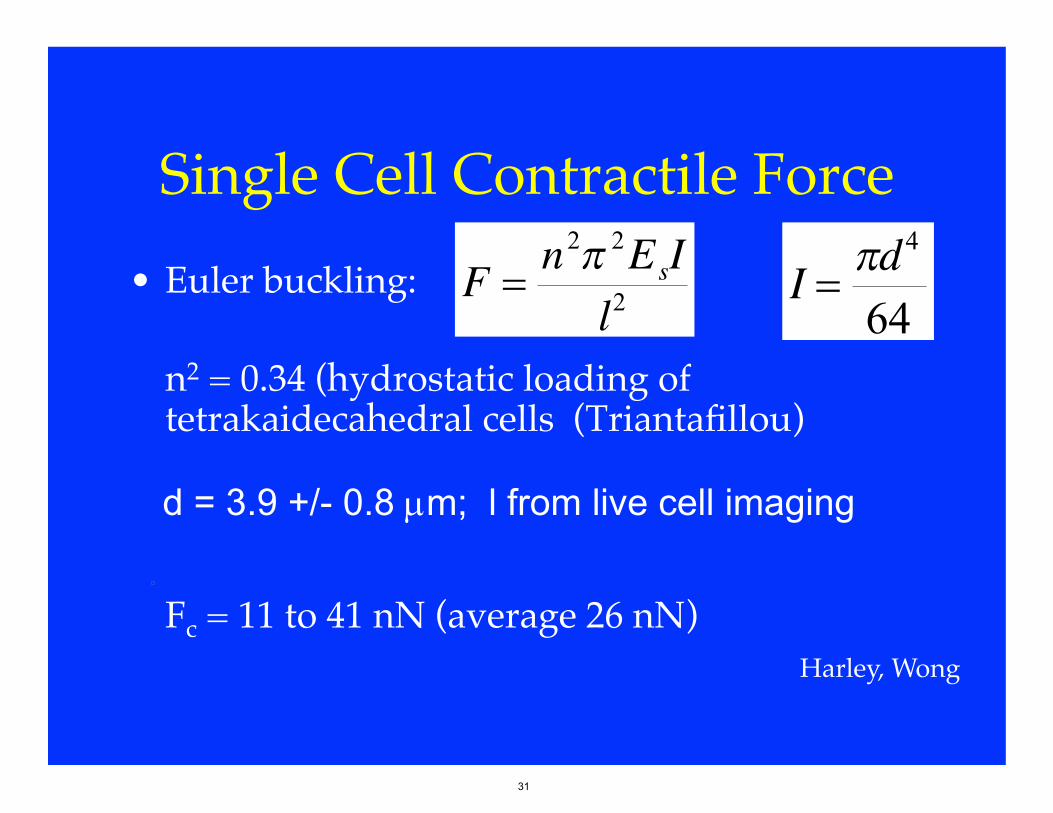
Single Cell Contractile Force"• Euler buckling:"
"n2 = 0.34 (hydrostatic loading of tetrakaidecahedral cells (Triantafillou)"
""Fc = 11 to 41 nN (average 26 nN)""
�
F =n2π 2EsI
l2
�
I =πd4
64
Harley, Wong"
d = 3.9 +/- 0.8 m; l from live cell imaging
31
-
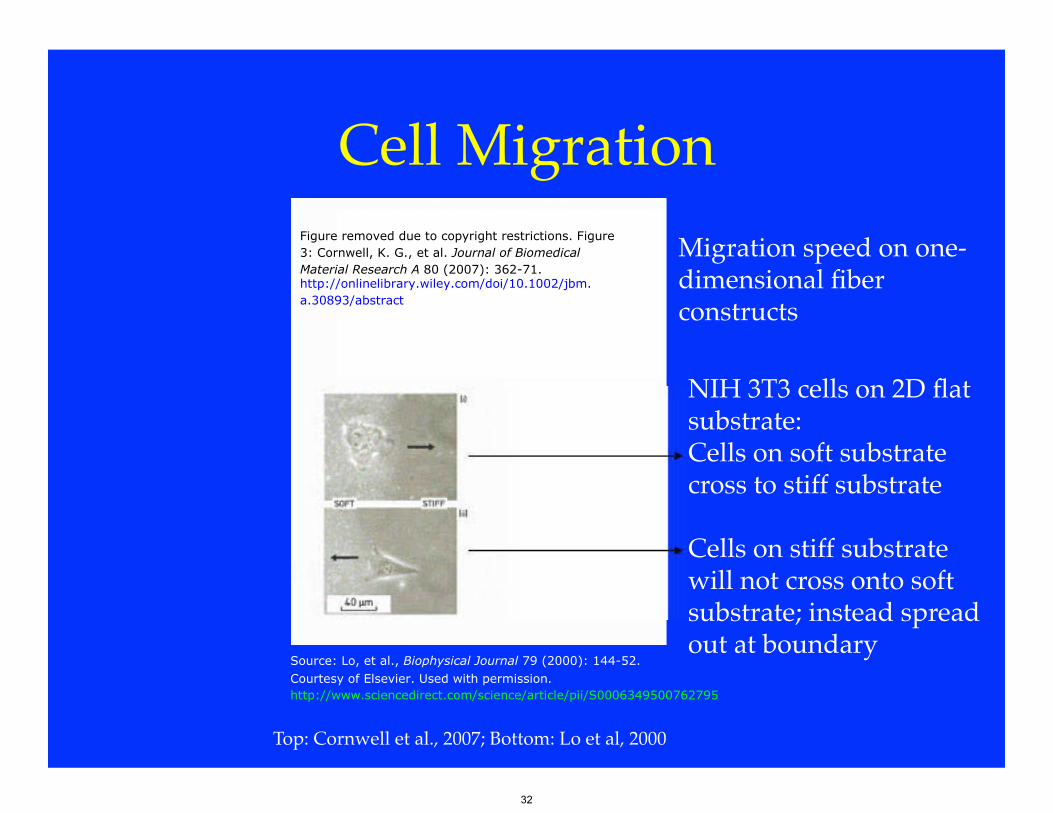
Cell Migration Figure removed due to copyright restrictions. Figure3: Cornwell, K. G., et al. Journal of Biomedical
Material Research A 80 (2007): 362-71.http://onlinelibrary.wiley.com/doi/10.1002/jbm.a.30893/abstract
Migration speed on one-dimensional fiber constructs
NIH 3T3 cells on 2D flat substrate: Cells on soft substrate cross to stiff substrate
Cells on stiff substrate will not cross onto soft substrate; instead spread out at boundary
Source: Lo, et al., Biophysical Journal 79 (2000): 144-52.Courtesy of Elsevier. Used with permission.http://www.sciencedirect.com/science/article/pii/S0006349500762795
Top: Cornwell et al., 2007; Bottom: Lo et al, 2000
32
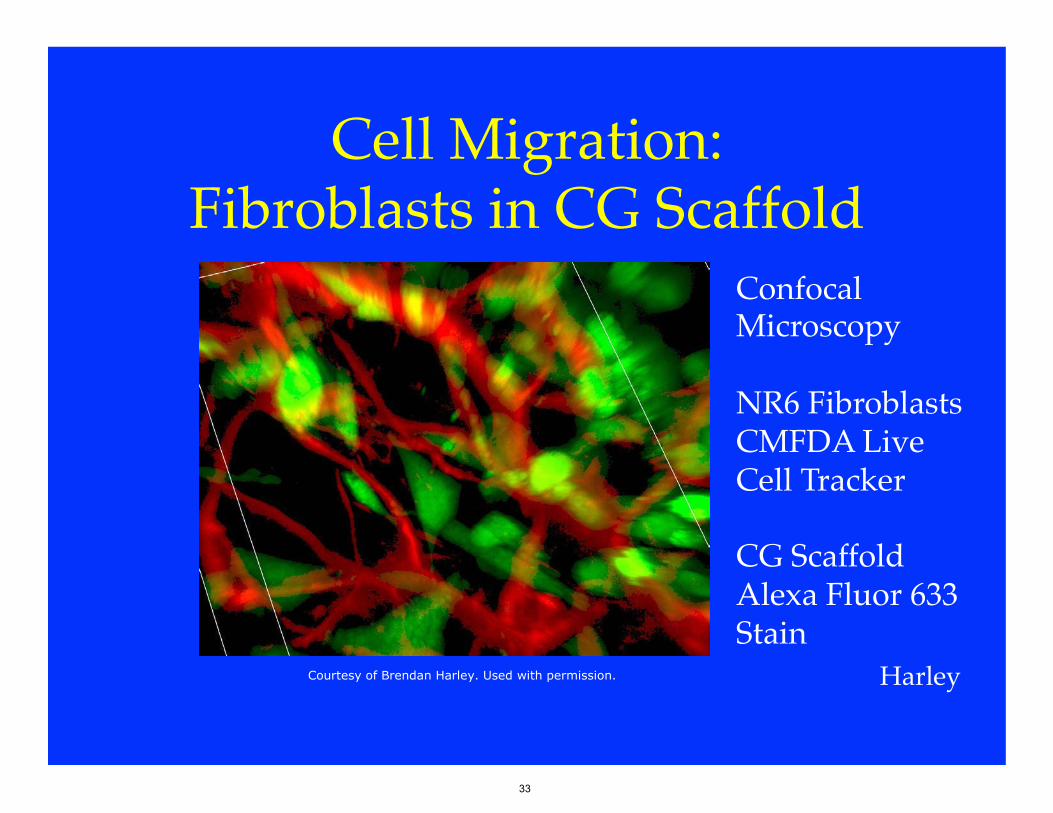
Cell Migration:!Fibroblasts in CG Scaffold"
Confocal "Microscopy""NR6 Fibroblasts"CMFDA Live"Cell Tracker""CG Scaffold"Alexa Fluor 633"Stain"
Harley"Courtesy of Brendan Harley. Used with permission.
33
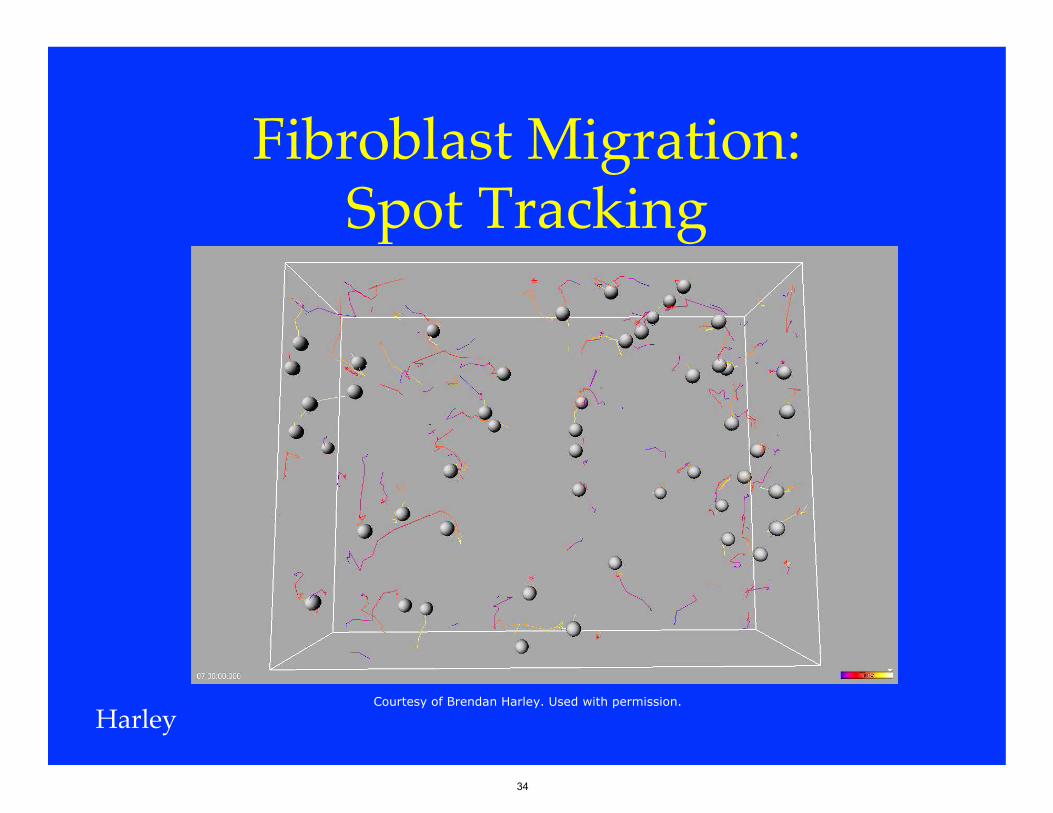
Fibroblast Migration: !Spot Tracking"
Harley" Courtesy of Brendan Harley. Used with permission.
34
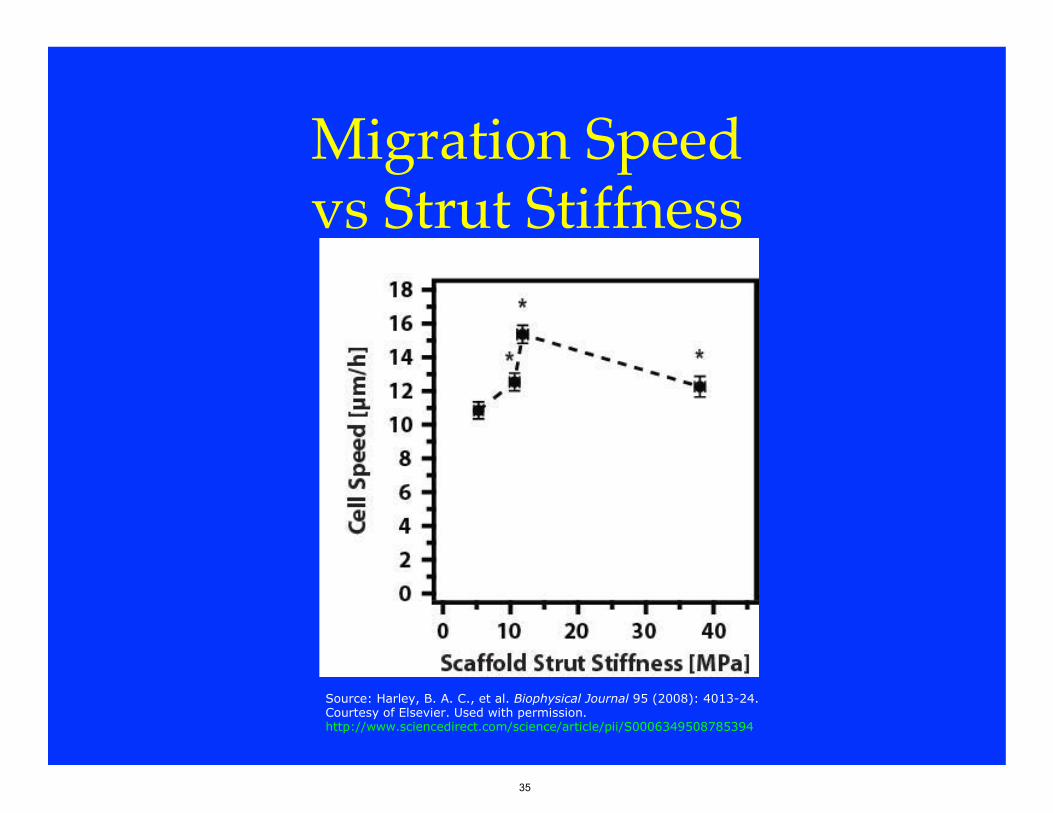
Migration Speed !vs Strut Stiffness"
Source: Harley, B. A. C., et al. Biophysical Journal 95 (2008): 4013-24.Courtesy of Elsevier. Used with permission.http://www.sciencedirect.com/science/article/pii/S0006349508785394
35
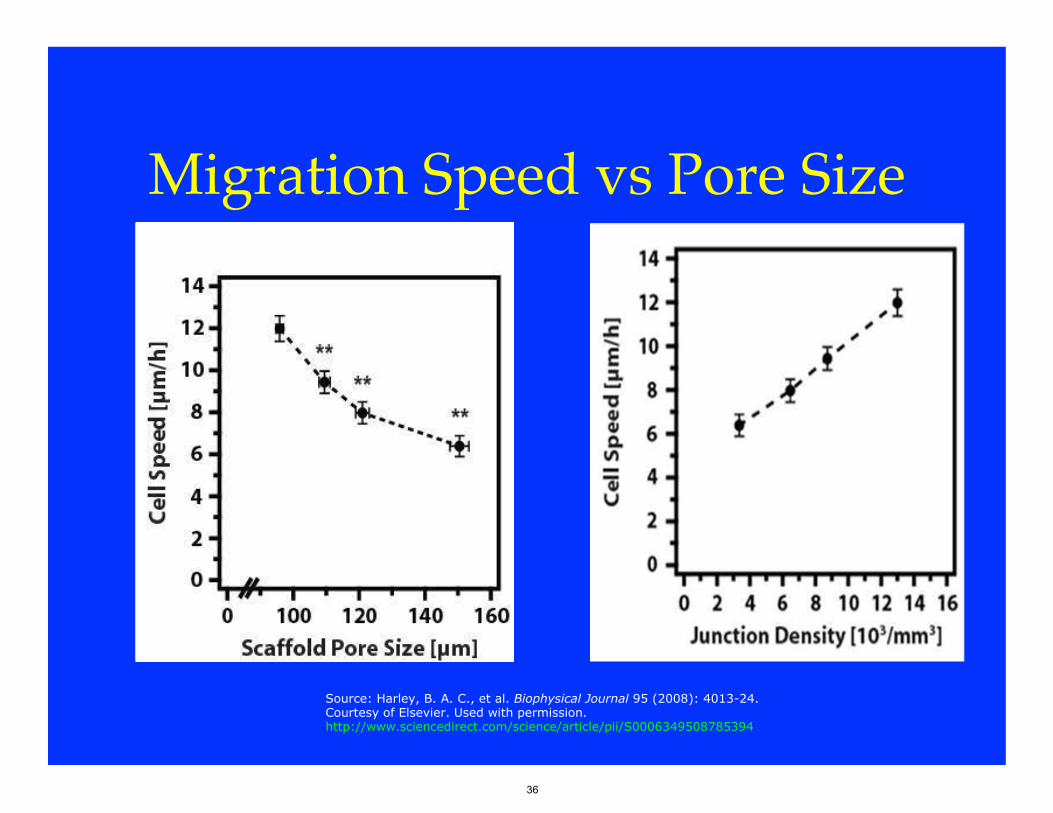
Migration Speed vs Pore Size"
Source: Harley, B. A. C., et al. Biophysical Journal 95 (2008): 4013-24.Courtesy of Elsevier. Used with permission.http://www.sciencedirect.com/science/article/pii/S0006349508785394
36
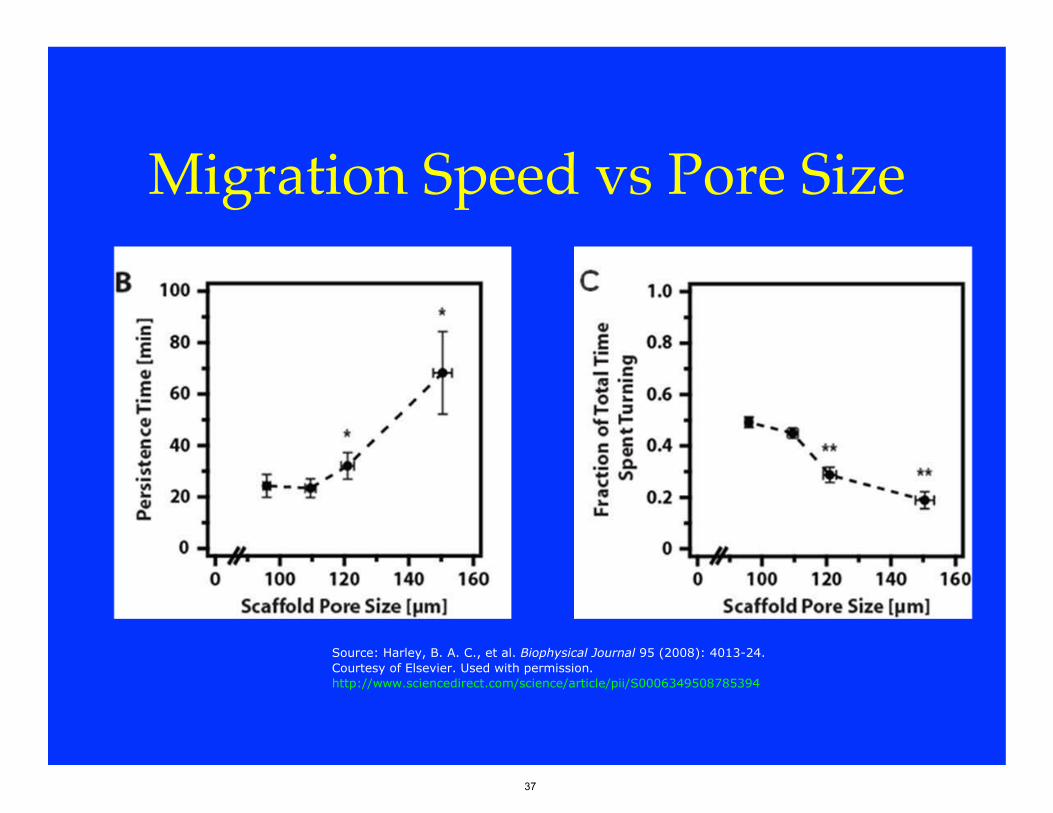
Migration Speed vs Pore Size"
Source: Harley, B. A. C., et al. Biophysical Journal 95 (2008): 4013-24.Courtesy of Elsevier. Used with permission.http://www.sciencedirect.com/science/article/pii/S0006349508785394
37
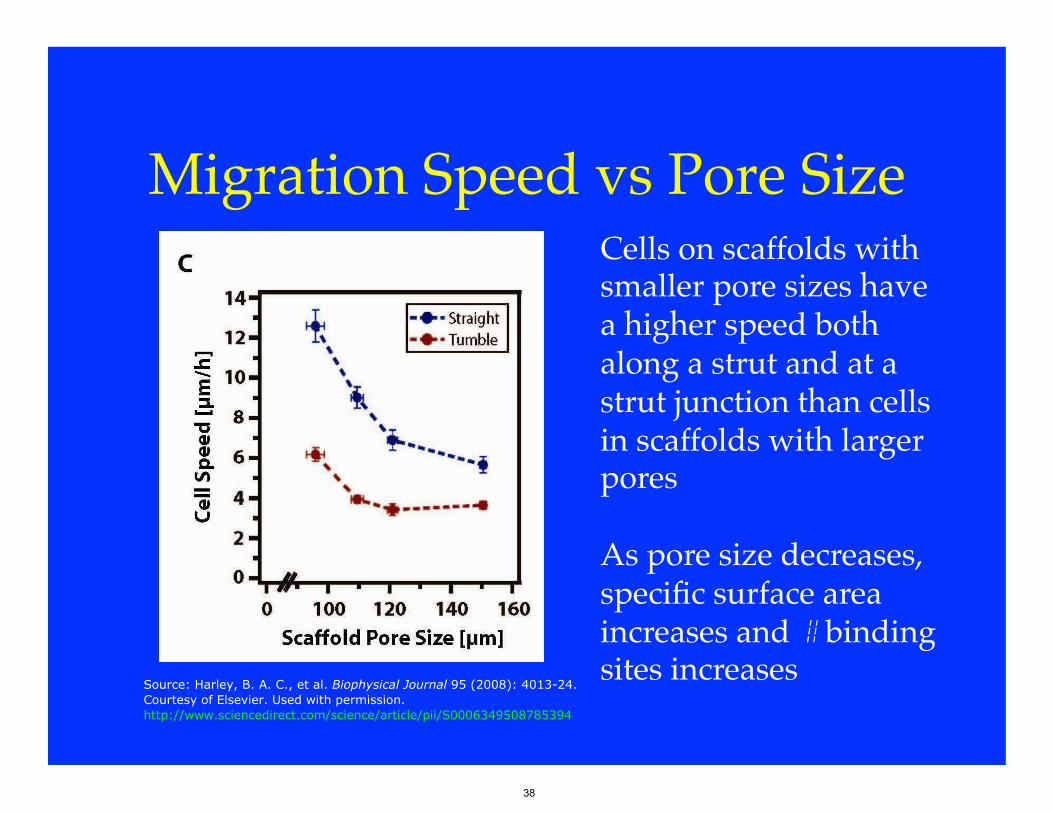
Migration Speed vs Pore Size"Cells on scaffolds with "smaller pore sizes have a higher speed both along a strut and at a strut junction than cells in scaffolds with larger pores""As pore size decreases, specific surface area increases and # binding sites increases"
Source: Harley, B. A. C., et al. Biophysical Journal 95 (2008): 4013-24.Courtesy of Elsevier. Used with permission.http://www.sciencedirect.com/science/article/pii/S0006349508785394
38
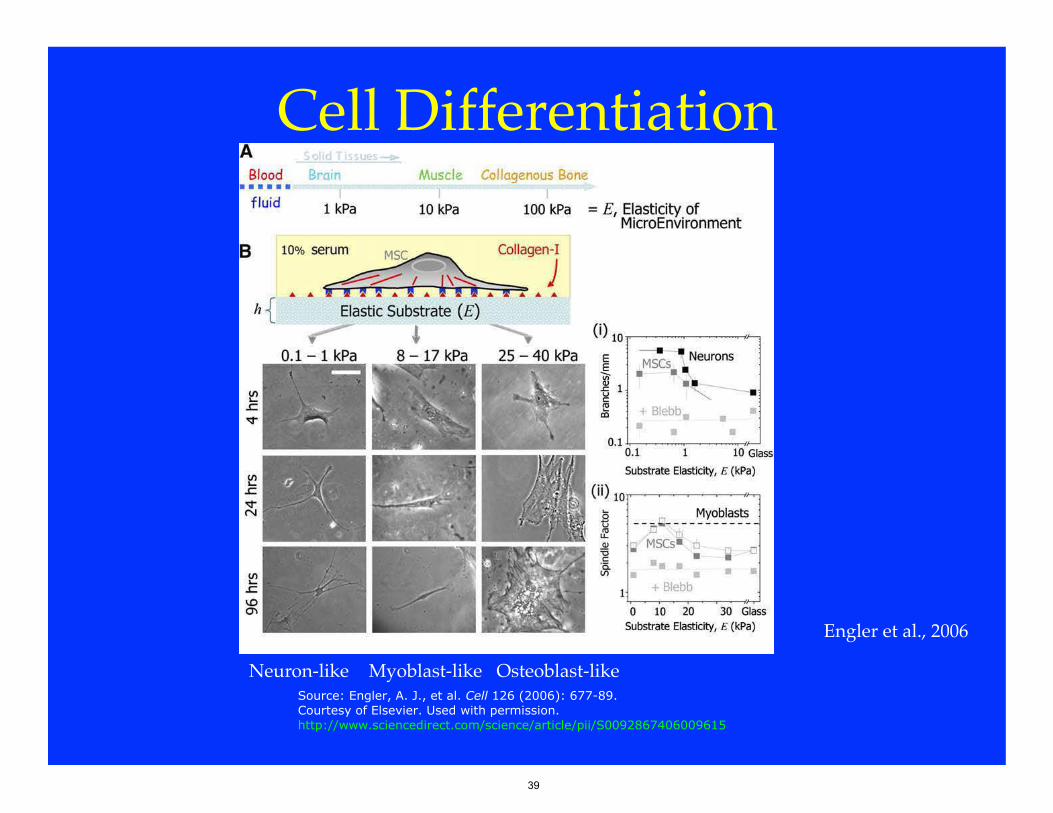
Cell Differentiation"
Engler et al., 2006"
Neuron-like" Myoblast-like" Osteoblast-like"Source: Engler, A. J., et al. Cell 126 (2006): 677-89.Courtesy of Elsevier. Used with permission.http://www.sciencedirect.com/science/article/pii/S0092867406009615
39
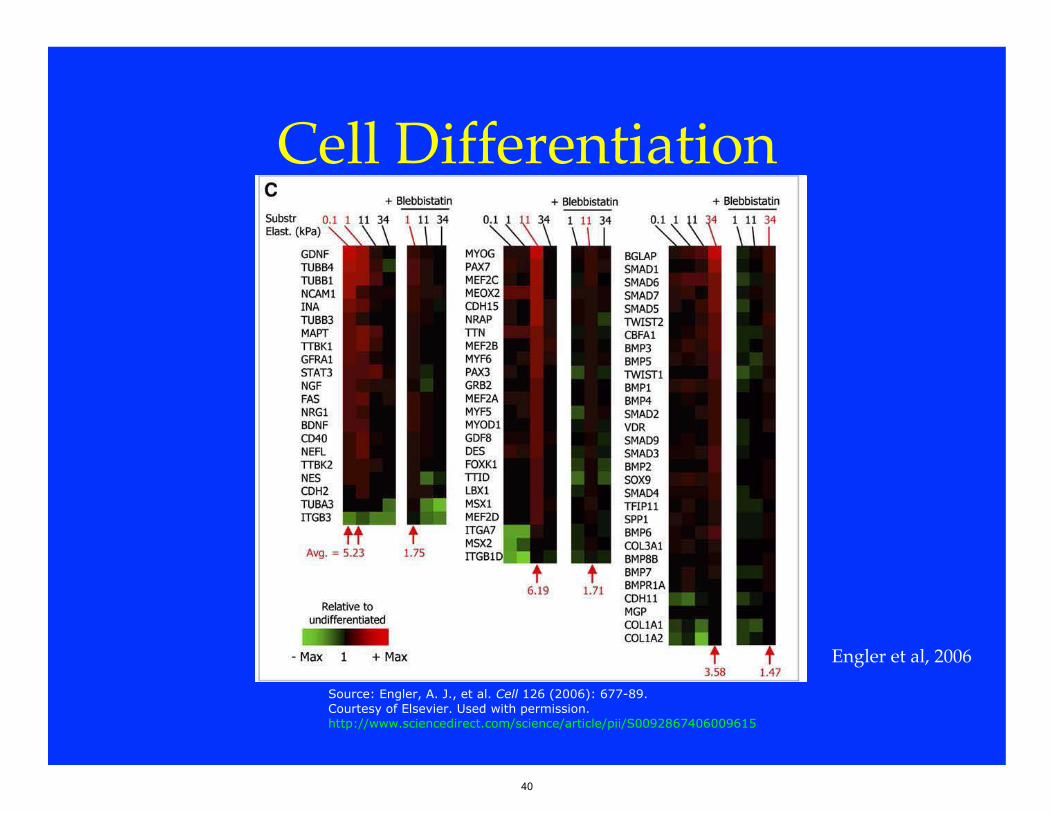
Cell Differentiation"
Engler et al, 2006"
Source: Engler, A. J., et al. Cell 126 (2006): 677-89.Courtesy of Elsevier. Used with permission.http://www.sciencedirect.com/science/article/pii/S0092867406009615
40
Summary"
• Cell attachment increases linearly withspecific surface area (binding sites)"
• Cell morphology depends onorientation of pores in scaffold and onthe stiffness of the scaffold"
"
41
Summary"• Cell contractile behaviour:"
– Cells bind at periphery of cells"– As they spread and elongate, unsupported length
increases"– Compressive force in strut reaches buckling load"– For a population of cells in the cell force monitor,
force per cell ~ 1nN "– Contractile force calculated from buckling of a
strut by a single cell ~ 11-41 nN"
42
Summary"• Cell migration speed increases with stiffness
of 1D fibers"• Cells will not migrate from a stiff 2D
substrate to a soft one""• In collagen-GAG scaffolds:"
– Cell migration speed increases at low scaffoldstiffness and then decreases at higher scaffoldstiffnesses"
– Cell migration speed increases at smaller poresizes"
43
Summary"
• Cell differentiation"– Mesenchymal stem cells differentiate to different
morphologies, resembling different cell lineages(neuron, myoblast, osteoblast), depending onsubstrate stiffness"
– Differentiated cells on substrates of differentstiffness have cell markers associated with thedifferent cell lineages (neurons, myoblasts,osteoblasts) "
44
Acknowledgements!
• Drs. TM Freyman, BA Harley, FJ O’Brien, M Zaman"• JH Leung, R Yokoo, Y-S Pek, MQ Wong, ECCM Silva,
HD Kim, K Corin"• Profs. IV Yannas, D Lauffenburger, KJ Van Vliet"• Drs. Spector and Germaine"• NIH Training Grant, NIH grant (DE 13053), Matoula
S. Salapatas Professorship, Cambridge-MIT Institute"
45

MIT OpenCourseWarehttp://ocw.mit.edu
3.054 / 3.36 Cellular Solids: Structure, Properties and ApplicationsSpring 2015
For information about citing these materials or our Terms of Use, visit: http://ocw.mit.edu/terms.