cell therapy insights
TRANSCRIPT
www.insights.bio 161
CELL & GENE THERAPY INSIGHTS
INNOVATOR INSIGHT
Multiple-parameter profiling of density gradient ultracentrifugation for characterization of empty and full capsid distribution in AAV preparationsSebastijan Peljhan, Maja Štokelj, Sara Drmota Prebil, Pete Gagnon & Aleš Štrancar
Ultracentrifugation (UC) is a well-known technique for fractionating adeno-associated virus (AAV) capsids according to their density, which is mainly a function of their encapsidated DNA mass. Empty capsids represent the lowest density subpopulation. Full capsids repre-sent the highest density subpopulation, sometimes accompanied by partially full capsids of intermediate density. Fractions can be collected after sedimentation for analysis but the practice is laborious and discourages application of multiple monitoring techniques that might provide deeper insights into sample composition. Anion exchange chromatography (AEC) also achieves fractionation of empty and full capsids for many AAV serotypes. The degree of separation varies among serotypes and does not correlate strictly with UC. This is not surprising since separation by AEC is highly influenced by capsid surface charge, which is independent of the amount of DNA packaged within the capsids. Chromatography methods however present a significant analytical advantage in the ease of monitoring the column effluent, including with multiple detectors. UV absorbance at 260 nm and 280 nm permits estimation of empty and full capsid proportions in any given peak. Intrinsic fluorescence enables estimation of relative areas of empty capsid peaks and full capsid peaks. Light scat-tering does the same and permits the further determination of capsid size and mass. In this report, we merge UC with an HPLC monitoring array to simultaneously analyze dual wavelength UV, intrinsic fluorescence, and light scattering through cesium chloride density gradient strata. Limitations of each monitoring method are discussed. UC results are com-pared with chromatography profiles to highlight distinction between separation methods.
CELL & GENE THERAPY INSIGHTS
162 DOI: 10.18609/cgti.2021.039
INTRODUCTIONDensity gradient ultracentrifugation (DGUC) is a well-known technique for frac-tionating adeno-associated virus (AAV) cap-sids according to the amount of encapsidated DNA they contain [1]. Empty capsids repre-sent the lowest density subpopulation. Full capsids represent the highest density subpop-ulation, sometimes accompanied by partial-ly full capsids of intermediate density. Frac-tions can be collected after sedimentation for analysis [2] but the practice is laborious and discourages application of multiple monitor-ing techniques that might provide deeper in-sights into sample composition. The concept of flowing density gradient-separated bac-teriophage fractions through a UV monitor was demonstrated in 1978 and offers further potential for AAV [3]. The method known as Analytical Ultra-Centrifugation (AUC) per-tains to a different technique that is also ap-plied to AAV [4]. AUC does not exploit den-sity gradients but relies instead on differences in the inherent sedimentation coefficients among sample components.
Anion exchange chromatography (AEX) also achieves fractionation of empty and full capsids for many AAV serotypes [4–15]. The degree of separation varies among serotypes and does not correlate strictly with DGUC. This is not surprising since separation by AEX is highly influenced by capsid surface charge, which is independent of the amount of DNA packaged within the capsids. Chromatogra-phy methods however present a significant analytical advantage in the ease of monitoring the column effluent, including with multiple detectors. Calculating the ratio of UV absor-bance at 260 nm to absorbance at 280 nm
permits estimation of empty and full capsid proportions in any given peak [4,5,15]. Intrin-sic fluorescence enables estimation of relative areas of empty capsid peaks versus full cap-sid peaks [4,14,15]. Light scattering does the same and permits the further determination of capsid size and mass [14–16].
In this report, we present an expanded DGUC method for characterization of emp-ty and full AAV capsid content in cell cul-ture harvests, lysates, and chromatography fractions. The contents of post-DGUC tubes are pumped through an HPLC monitoring array to measure UV absorbance, intrinsic fluorescence, and light scattering across ce-sium chloride density strata. Conductivity is measured as a surrogate indicator of cesium chloride density. Signal integration produces a multi-parameter DGUC ‘centrifugram’ that corresponds in many respects to the chro-matograms produced by chromatography methods. DGUC results are compared with chromatography profiles to highlight distinc-tions between separation methods. Practical application of results for final product charac-terization is considered, along with potential to support development of better purification processes.
MATERIALS & METHODS AAV8 lysates produced from Sf9/BEV cells were obtained from the University of Nantes, INSERM UMR 1089, Nantes, France. AAV8 was chosen because AEX is document-ed to separate empty and full AAV8 capsids [9,12,14,15] and thereby facilitate comparison of empty/full separation by AEC and DGUC. Initial AAV purification was performed by
Practical application of results for final product characterization is considered, along with potential to support development of better purification processes.
Cell & Gene Therapy Insights 2021; 7(2), 161–169
DOI: 10.18609/cgti.2021.039
INNOVATOR INSIGHT
163Cell & Gene Therapy Insights - ISSN: 2059-7800
cation exchange chromatography (CEX) on a 1 mL CIMmultus® SO3 monolith (BIA Sep-arations). CEX columns were equilibrated to 50 mM formic acid, 200 mM sodium chlo-ride, 1% sucrose, 0.1% Poloxamer 188, pH 3.5, eluted with a linear gradient to 50 mM formic acid, 2 M sodium chloride, pH 3.5, then cleaned with 2 M sodium chloride plus 1 M sodium hydroxide. Volumetric flow rate on 1 mL monoliths was 5 mL/min (5 column volumes [CV]/min). AEX fractionation of CEX-purified AAV was performed on a CIM-multus® QA monolith (BIA Separations). The column was equilibrated with 50 mM bis-tris-propane, 2 mM magnesium chloride, pH 9.0; eluted with a linear salt gradient to 50 mM bis-tris-propane, 2 mM magnesium chloride, 200 mM sodium chloride, pH 9.0; then cleaned with 2 M sodium chloride plus 1 M sodium hydroxide.
Density gradient fractionation was per-formed on a Sorvall™ WX 90+ ultracen-trifuge (Thermo Scientific) using 11.5 mL polyethylene UltraCrimp® centrifuge tubes (Thermo Scientific) in a T890 fixed-angle rotor. Samples containing about 1E+11 vec-tor genomes (vg) according to ddPCR as de-scribed in [17] were mixed with concentrated
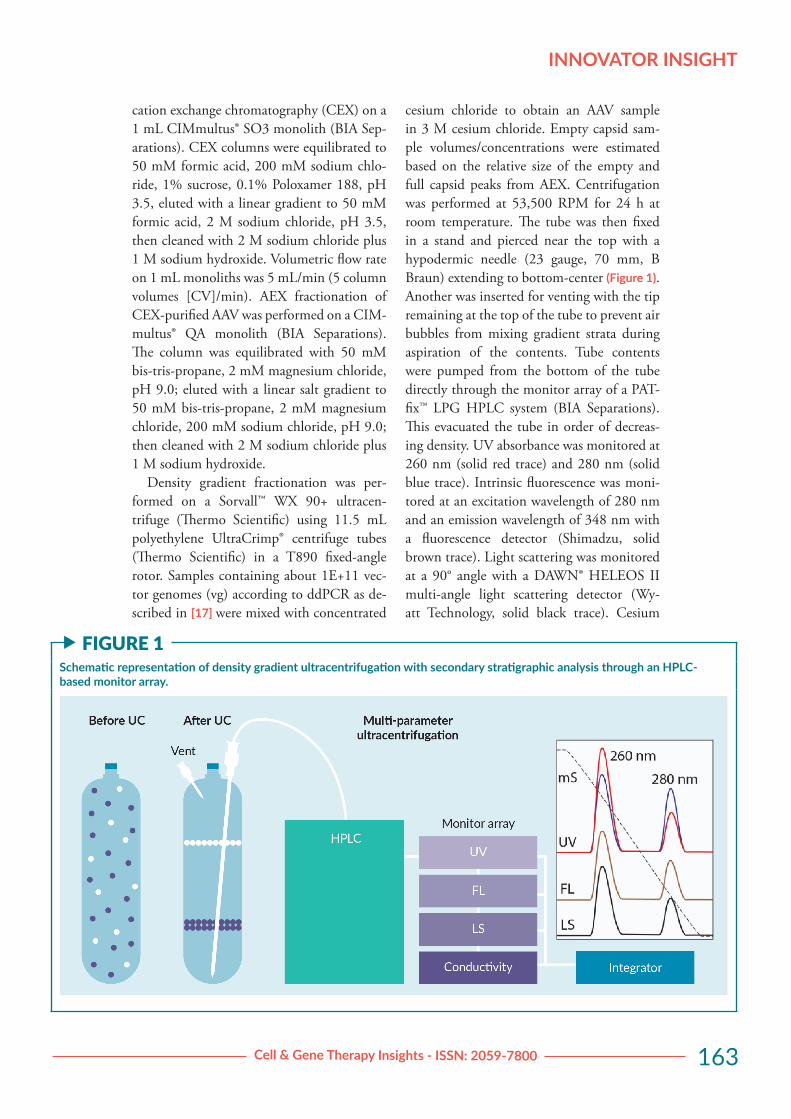
cesium chloride to obtain an AAV sample in 3 M cesium chloride. Empty capsid sam-ple volumes/concentrations were estimated based on the relative size of the empty and full capsid peaks from AEX. Centrifugation was performed at 53,500 RPM for 24 h at room temperature. The tube was then fixed in a stand and pierced near the top with a hypodermic needle (23 gauge, 70 mm, B Braun) extending to bottom-center (Figure 1). Another was inserted for venting with the tip remaining at the top of the tube to prevent air bubbles from mixing gradient strata during aspiration of the contents. Tube contents were pumped from the bottom of the tube directly through the monitor array of a PAT-fix™ LPG HPLC system (BIA Separations). This evacuated the tube in order of decreas-ing density. UV absorbance was monitored at 260 nm (solid red trace) and 280 nm (solid blue trace). Intrinsic fluorescence was moni-tored at an excitation wavelength of 280 nm and an emission wavelength of 348 nm with a fluorescence detector (Shimadzu, solid brown trace). Light scattering was monitored at a 90° angle with a DAWN® HELEOS II multi-angle light scattering detector (Wy-att Technology, solid black trace). Cesium
f FIGURE 1Schematic representation of density gradient ultracentrifugation with secondary stratigraphic analysis through an HPLC-based monitor array.
CELL & GENE THERAPY INSIGHTS
164 DOI: 10.18609/cgti.2021.039
chloride density is represented by the conduc-tivity profile (dashed black trace). The higher the conductivity, the higher the density of the cesium chloride.
The system was washed with water be-tween samples. The discontinuity of refractive index between the water in the HPLC tub-ing and cesium chloride in the next sample created heavy signal noise at the beginning of the method. To properly zero the baseline, 1 mL of fluid was passed through the system to equilibrate the monitors to cesium chlo-ride before the system was zeroed and data collection begun.
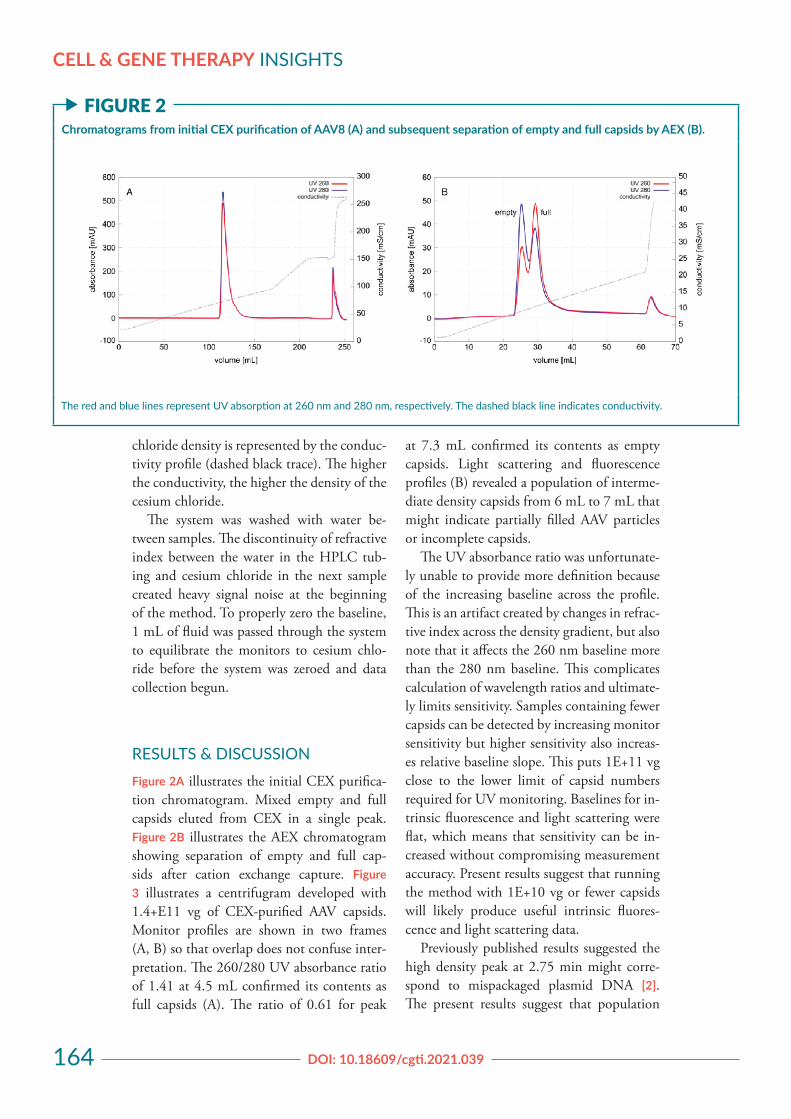
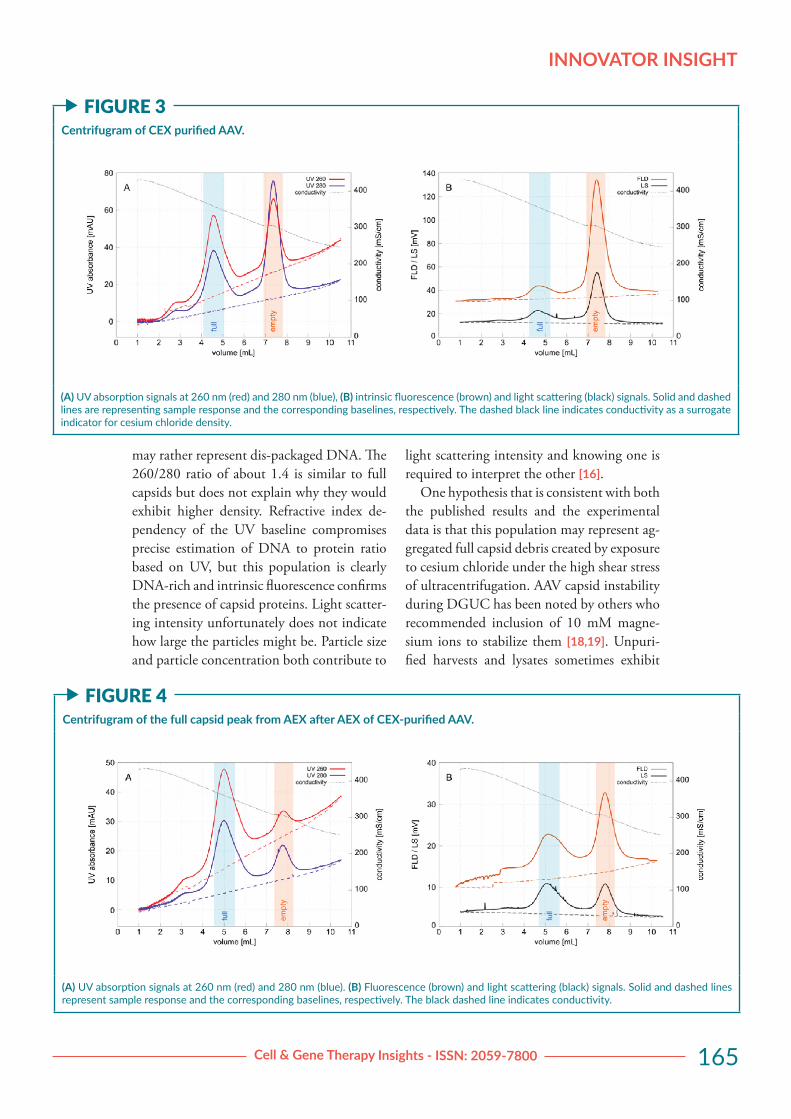
RESULTS & DISCUSSIONFigure 2A illustrates the initial CEX purifica-tion chromatogram. Mixed empty and full capsids eluted from CEX in a single peak. Figure 2B illustrates the AEX chromatogram showing separation of empty and full cap-sids after cation exchange capture. Figure 3 illustrates a centrifugram developed with 1.4+E11 vg of CEX-purified AAV capsids. Monitor profiles are shown in two frames (A, B) so that overlap does not confuse inter-pretation. The 260/280 UV absorbance ratio of 1.41 at 4.5 mL confirmed its contents as full capsids (A). The ratio of 0.61 for peak
at 7.3 mL confirmed its contents as empty capsids. Light scattering and fluorescence profiles (B) revealed a population of interme-diate density capsids from 6 mL to 7 mL that might indicate partially filled AAV particles or incomplete capsids.
The UV absorbance ratio was unfortunate-ly unable to provide more definition because of the increasing baseline across the profile. This is an artifact created by changes in refrac-tive index across the density gradient, but also note that it affects the 260 nm baseline more than the 280 nm baseline. This complicates calculation of wavelength ratios and ultimate-ly limits sensitivity. Samples containing fewer capsids can be detected by increasing monitor sensitivity but higher sensitivity also increas-es relative baseline slope. This puts 1E+11 vg close to the lower limit of capsid numbers required for UV monitoring. Baselines for in-trinsic fluorescence and light scattering were flat, which means that sensitivity can be in-creased without compromising measurement accuracy. Present results suggest that running the method with 1E+10 vg or fewer capsids will likely produce useful intrinsic fluores-cence and light scattering data.
Previously published results suggested the high density peak at 2.75 min might corre-spond to mispackaged plasmid DNA [2]. The present results suggest that population
f FIGURE 2Chromatograms from initial CEX purification of AAV8 (A) and subsequent separation of empty and full capsids by AEX (B).
The red and blue lines represent UV absorption at 260 nm and 280 nm, respectively. The dashed black line indicates conductivity.
INNOVATOR INSIGHT
165Cell & Gene Therapy Insights - ISSN: 2059-7800
may rather represent dis-packaged DNA. The 260/280 ratio of about 1.4 is similar to full capsids but does not explain why they would exhibit higher density. Refractive index de-pendency of the UV baseline compromises precise estimation of DNA to protein ratio based on UV, but this population is clearly DNA-rich and intrinsic fluorescence confirms the presence of capsid proteins. Light scatter-ing intensity unfortunately does not indicate how large the particles might be. Particle size and particle concentration both contribute to
light scattering intensity and knowing one is required to interpret the other [16].
One hypothesis that is consistent with both the published results and the experimental data is that this population may represent ag-gregated full capsid debris created by exposure to cesium chloride under the high shear stress of ultracentrifugation. AAV capsid instability during DGUC has been noted by others who recommended inclusion of 10 mM magne-sium ions to stabilize them [18,19]. Unpuri-fied harvests and lysates sometimes exhibit
f FIGURE 3Centrifugram of CEX purified AAV.
(A) UV absorption signals at 260 nm (red) and 280 nm (blue), (B) intrinsic fluorescence (brown) and light scattering (black) signals. Solid and dashed lines are representing sample response and the corresponding baselines, respectively. The dashed black line indicates conductivity as a surrogate indicator for cesium chloride density.
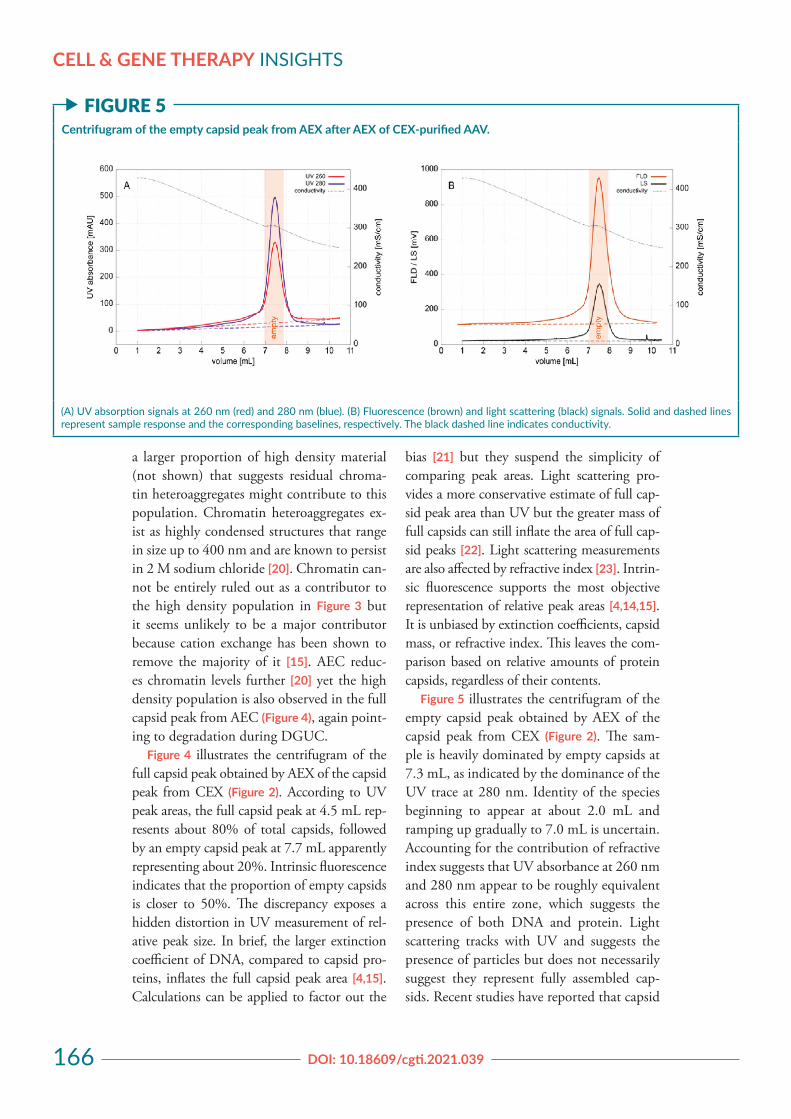
f FIGURE 4Centrifugram of the full capsid peak from AEX after AEX of CEX-purified AAV.
(A) UV absorption signals at 260 nm (red) and 280 nm (blue). (B) Fluorescence (brown) and light scattering (black) signals. Solid and dashed lines represent sample response and the corresponding baselines, respectively. The black dashed line indicates conductivity.
CELL & GENE THERAPY INSIGHTS
166 DOI: 10.18609/cgti.2021.039
a larger proportion of high density material (not shown) that suggests residual chroma-tin heteroaggregates might contribute to this population. Chromatin heteroaggregates ex-ist as highly condensed structures that range in size up to 400 nm and are known to persist in 2 M sodium chloride [20]. Chromatin can-not be entirely ruled out as a contributor to the high density population in Figure 3 but it seems unlikely to be a major contributor because cation exchange has been shown to remove the majority of it [15]. AEC reduc-es chromatin levels further [20] yet the high density population is also observed in the full capsid peak from AEC (Figure 4), again point-ing to degradation during DGUC.
Figure 4 illustrates the centrifugram of the full capsid peak obtained by AEX of the capsid peak from CEX (Figure 2). According to UV peak areas, the full capsid peak at 4.5 mL rep-resents about 80% of total capsids, followed by an empty capsid peak at 7.7 mL apparently representing about 20%. Intrinsic fluorescence indicates that the proportion of empty capsids is closer to 50%. The discrepancy exposes a hidden distortion in UV measurement of rel-ative peak size. In brief, the larger extinction coefficient of DNA, compared to capsid pro-teins, inflates the full capsid peak area [4,15]. Calculations can be applied to factor out the
bias [21] but they suspend the simplicity of comparing peak areas. Light scattering pro-vides a more conservative estimate of full cap-sid peak area than UV but the greater mass of full capsids can still inflate the area of full cap-sid peaks [22]. Light scattering measurements are also affected by refractive index [23]. Intrin-sic fluorescence supports the most objective representation of relative peak areas [4,14,15]. It is unbiased by extinction coefficients, capsid mass, or refractive index. This leaves the com-parison based on relative amounts of protein capsids, regardless of their contents.
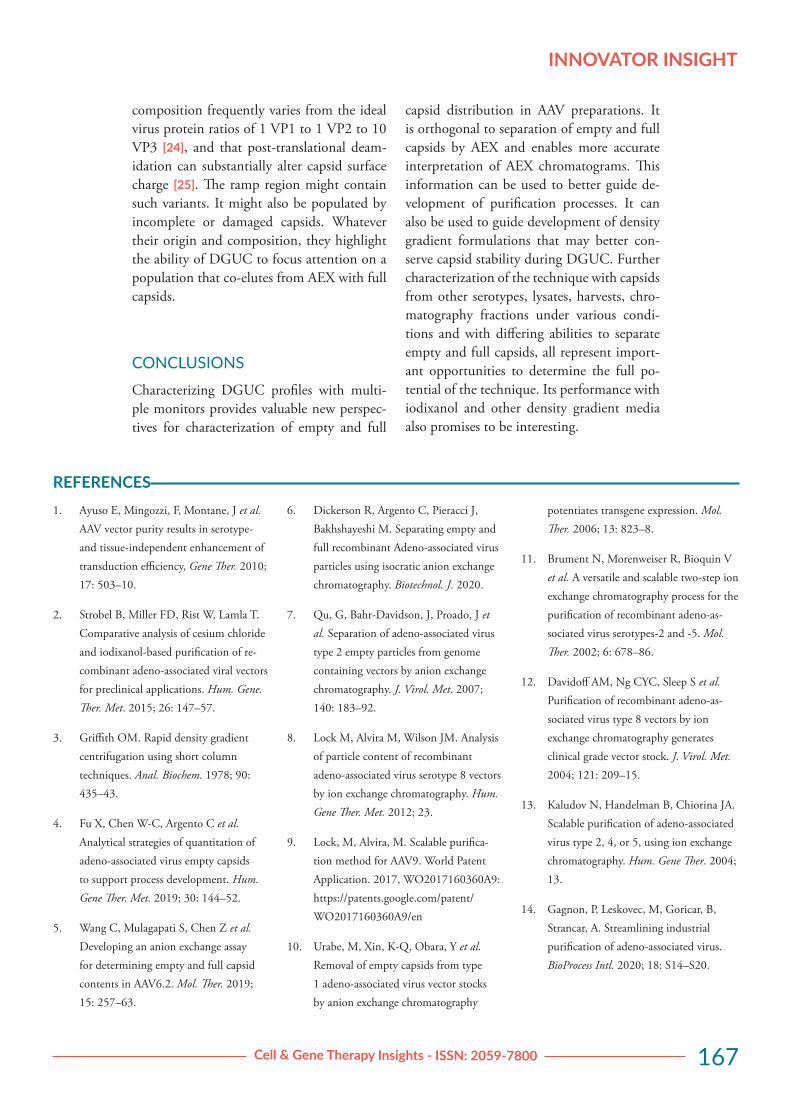
Figure 5 illustrates the centrifugram of the empty capsid peak obtained by AEX of the capsid peak from CEX (Figure 2). The sam-ple is heavily dominated by empty capsids at 7.3 mL, as indicated by the dominance of the UV trace at 280 nm. Identity of the species beginning to appear at about 2.0 mL and ramping up gradually to 7.0 mL is uncertain. Accounting for the contribution of refractive index suggests that UV absorbance at 260 nm and 280 nm appear to be roughly equivalent across this entire zone, which suggests the presence of both DNA and protein. Light scattering tracks with UV and suggests the presence of particles but does not necessarily suggest they represent fully assembled cap-sids. Recent studies have reported that capsid
f FIGURE 5Centrifugram of the empty capsid peak from AEX after AEX of CEX-purified AAV.
(A) UV absorption signals at 260 nm (red) and 280 nm (blue). (B) Fluorescence (brown) and light scattering (black) signals. Solid and dashed lines represent sample response and the corresponding baselines, respectively. The black dashed line indicates conductivity.
INNOVATOR INSIGHT
167Cell & Gene Therapy Insights - ISSN: 2059-7800
composition frequently varies from the ideal virus protein ratios of 1 VP1 to 1 VP2 to 10 VP3 [24], and that post-translational deam-idation can substantially alter capsid surface charge [25]. The ramp region might contain such variants. It might also be populated by incomplete or damaged capsids. Whatever their origin and composition, they highlight the ability of DGUC to focus attention on a population that co-elutes from AEX with full capsids.
CONCLUSIONSCharacterizing DGUC profiles with multi-ple monitors provides valuable new perspec-tives for characterization of empty and full
capsid distribution in AAV preparations. It is orthogonal to separation of empty and full capsids by AEX and enables more accurate interpretation of AEX chromatograms. This information can be used to better guide de-velopment of purification processes. It can also be used to guide development of density gradient formulations that may better con-serve capsid stability during DGUC. Further characterization of the technique with capsids from other serotypes, lysates, harvests, chro-matography fractions under various condi-tions and with differing abilities to separate empty and full capsids, all represent import-ant opportunities to determine the full po-tential of the technique. Its performance with iodixanol and other density gradient media also promises to be interesting.
REFERENCES1. Ayuso E, Mingozzi, F, Montane, J et al.
AAV vector purity results in serotype- and tissue-independent enhancement of transduction efficiency, Gene Ther. 2010; 17: 503–10.
2. Strobel B, Miller FD, Rist W, Lamla T. Comparative analysis of cesium chloride and iodixanol-based purification of re-combinant adeno-associated viral vectors for preclinical applications. Hum. Gene. Ther. Met. 2015; 26: 147–57.
3. Griffith OM. Rapid density gradient centrifugation using short column techniques. Anal. Biochem. 1978; 90: 435–43.
4. Fu X, Chen W-C, Argento C et al. Analytical strategies of quantitation of adeno-associated virus empty capsids to support process development. Hum. Gene Ther. Met. 2019; 30: 144–52.
5. Wang C, Mulagapati S, Chen Z et al. Developing an anion exchange assay for determining empty and full capsid contents in AAV6.2. Mol. Ther. 2019; 15: 257–63.
6. Dickerson R, Argento C, Pieracci J, Bakhshayeshi M. Separating empty and full recombinant Adeno-associated virus particles using isocratic anion exchange chromatography. Biotechnol. J. 2020.
7. Qu, G, Bahr-Davidson, J, Proado, J et al. Separation of adeno-associated virus type 2 empty particles from genome containing vectors by anion exchange chromatography. J. Virol. Met. 2007; 140: 183–92.
8. Lock M, Alvira M, Wilson JM. Analysis of particle content of recombinant adeno-associated virus serotype 8 vectors by ion exchange chromatography. Hum. Gene Ther. Met. 2012; 23.
9. Lock, M, Alvira, M. Scalable purifica-tion method for AAV9. World Patent Application. 2017, WO2017160360A9: https://patents.google.com/patent/WO2017160360A9/en
10. Urabe, M, Xin, K-Q, Obara, Y et al. Removal of empty capsids from type 1 adeno-associated virus vector stocks by anion exchange chromatography
potentiates transgene expression. Mol. Ther. 2006; 13: 823–8.
11. Brument N, Morenweiser R, Bioquin V et al. A versatile and scalable two-step ion exchange chromatography process for the purification of recombinant adeno-as-sociated virus serotypes-2 and -5. Mol. Ther. 2002; 6: 678–86.
12. Davidoff AM, Ng CYC, Sleep S et al. Purification of recombinant adeno-as-sociated virus type 8 vectors by ion exchange chromatography generates clinical grade vector stock. J. Virol. Met. 2004; 121: 209–15.
13. Kaludov N, Handelman B, Chiorina JA. Scalable purification of adeno-associated virus type 2, 4, or 5, using ion exchange chromatography. Hum. Gene Ther. 2004; 13.
14. Gagnon, P, Leskovec, M, Goricar, B, Strancar, A. Streamlining industrial purification of adeno-associated virus. BioProcess Intl. 2020; 18: S14–S20.
CELL & GENE THERAPY INSIGHTS
168 DOI: 10.18609/cgti.2021.039
15. Gagnon P, Goricar B, Mencin N et al. Multiple-monitor HPLC assays for rapid process development, in-process monitoring, and validation of AAV pro-duction and purification. Pharmaceutics 2021; 17: 113.
16. McIntosh NL, Berguig GY, Karim OA et al. Comprehensive characterization and quantification of adeno associated vectors by size exclusion chromatography and multi angle light scattering. Sci. Rep. 2021; 11: 3012.
17. Dobnik D, Kogovsek P, Jakomin T et al. Accurate quantification and characteri-zation of adeno-associated viral vectors. Front. Microbiol. 2019; 10: 1570.
18. Wright JF, Le T, Prado J et al. Identi-fication of factors that contribute to recombinant AAV2 particle aggregation and methods to prevent its occurrence during vector purification and formula-tion. Mol. Ther. 2005; 12: 171–8.
19. Wright JF, Qu G. Compositions and methods to prevent AAV vector aggregation, United States Patent US20110076744A1, March 3, 2011: https://patents.google.com/patent/US20110076744A1/en
20. Gagnon P, Nian R, Tan L et al. Chro-matin-mediated depression of fraction-ation performance on electronegative multimodal chromatography media, its prevention, and ramifications for puri-fication of IgG, J. Chromatogr. A 2014; 1374: 145–55.
21. Sommer JM, Smith PH, Parthasarathy S et al. Quantification of adeno-associated virus particles and empty capsids by optical density measurement. Mol. Ther. 2003; 7: 122–8.
22. Pierson E, Keifer DZ, Asokan A, Jarrold M. Resolving adeno-associated viral particle diversity with charge detection mass spectrometry. Anal. Chem. 2016; 88: 6718–25.
23. Han Y, Li D, Chen W, Mu S, Chen Y, Chai J. Impact of refractive index incre-ment on the determination of molecular weight of hyaluronic acid by multi-angle laser light scattering technique. Sci. Rep. 2020; 10: 1858.
24. Wörner TP, Bennet A, Habka S et al. Adeno-associated virus capsid assembly is divergent and stochastic. bioRxiv 2020.
25. Bertin M, Maurya S, Arumugam S, Ku-mar V, Jayadharan GR. Post-translational
modifications in capsid proteins of re-combinant Adeno-associated virus (AAV) 1-rh19 serotypes. FEBS J. 2019; 286: 4964–81.
AFFILIATIONS
Sebastijan Peljhan BIA Separations d.o.o. (part of Sartorius), Mirce 21, 5270 Ajdovscina, Slovenia
Maja Štokelj BIA Separations d.o.o. (part of Sartorius), Mirce 21, 5270 Ajdovscina, Slovenia
Sara Drmota Prebil BIA Separations d.o.o. (part of Sartorius), Mirce 21, 5270 Ajdovscina, Slovenia
Pete Gagnon BIA Separations d.o.o. (part of Sartorius), Mirce 21, 5270 Ajdovscina, Slovenia
Aleš Štrancar BIA Separations d.o.o. (part of Sartorius), Mirce 21, 5270 Ajdovscina, Slovenia
INNOVATOR INSIGHT
169Cell & Gene Therapy Insights - ISSN: 2059-7800
AUTHORSHIP & CONFLICT OF INTEREST
Contributions: All named authors take responsibility for the integrity of the work as a whole, and have given their approval for this version to be published.
Acknowledgements: None.
Disclosure and potential conflicts of interest: The authors are employees of BIA Separations d.o.o. They have no other conflicts of interest.
Funding declaration: The authors received no financial support for the research, authorship and/or publication of this article.
ARTICLE & COPYRIGHT INFORMATION
Copyright: Published by Cell and Gene Therapy Insights under Creative Commons License Deed CC BY NC ND 4.0 which allows anyone to copy, distribute, and transmit the article provided it is properly attributed in the manner specified below. No commercial use without permission.
Attribution: Copyright © 2021 BIA Separations d.o.o. Published by Cell and Gene Therapy Insights under Creative Commons License Deed CC BY NC ND 4.0.
Article source: Invited; externally peer reviewed.
Submitted for peer review: Jan 14 2021; Revised in: Publication date: Mar 16 2021.