cells preferentially grow on rough substrates - iit kanpurhome.iitk.ac.in/~skishore/tissue/cells...
TRANSCRIPT
lable at ScienceDirect
Biomaterials 31 (2010) 7205e7212
Contents lists avai
Biomaterials
journal homepage: www.elsevier .com/locate/biomater ia ls
Leading Opinion
Cells preferentially grow on rough substratesq
Francesco Gentile a,b, Luca Tirinato b, Edmondo Battista c,d, Filippo Causa c,d, Carlo Liberale a,Enzo M. di Fabrizio a,b, Paolo Decuzzi b,e,*aNanobiotech Department, Italian Institute of Technology, Via Morego 30, 16163 Genova, ItalybBioNEM – Center for Bio-/Nanotechnology and -/Engineering fro Medicine, University of Magna Graecia, Viale Europa - Loc. Germaneto, 88100 Catanzaro, ItalycCenter for Advanced Biomaterials for Healthcare, Italian Institute of Technology, Piazzale Tecchio 80, 80125 Naples, Italyd Interdisciplinary Research Center on Biomaterials (CRIB), University Federico II, Piazzale Tecchio 80, 80125 Naples, ItalyeDepartment of Nanomedicine and Biomedical Engineering, The University of Texas Health Science Center at Houston, 1825 Pressler St., 77030 Houston (TX), USA
a r t i c l e i n f o
Article history:Received 4 May 2010Accepted 4 June 2010Available online 16 July 2010
Keywords:NanotopographyCell adhesionCell proliferationFractal surfacesRational design
q Editor’s Note: This paper is one of a newly institutthat provide evidence-based scientific opinions on tobiomaterials science. They have some features of an inon scientific facts, and some features of a review papcomprehensive. These papers have been commissionreviewed for factual, scientific content by referees.* Corresponding author. Dept. of Nanomedicine a
University of Texas Health Science Center at Housto3363.
E-mail address: [email protected] (P. De
0142-9612/$ e see front matter � 2010 Elsevier Ltd.doi:10.1016/j.biomaterials.2010.06.016
a b s t r a c t
Substrate nanotopography affects cell adhesion and proliferation and is fundamental to the rationaldesign of bio-adhesives, to tissue engineering and to the development of assays for in-vitro screening.Cell behavior on rough substrates is still elusive, and the results presented in the open literature remaincontroversial. Here, the proliferation of cells on electrochemically etched silicon substrates with differentroughness and nearly similar surface energy was studied over three days with confocal and atomic forcemicroscopy. The surface profile of the substrates is a self-affine fractal with a roughness Ra growing withthe etching time from w2 to 100 nm and a fractal dimension D ranging between about 2 (nominally flatsurface) and 2.6. For four cell types, the number of adhering cells and their proliferation rates exhibiteda maximum on moderately rough (Ra w 10e45 nm) nearly Brownian (D w2.5) substrates. The observedcell behavior was satisfactorily interpreted within the theory of adhesion to randomly rough solids. Thesefindings demonstrated the importance of nanogeometry in cell stable adhesion and growth, suggestingthat moderately rough substrates with large fractal dimension could selectively boost cell proliferation.
� 2010 Elsevier Ltd. All rights reserved.
1. Introduction
It is becoming clear that nano/micro-topography stimulatesbehavioral changes in cells and plays a critical role in modifyingproliferation and vitality, as well as the strength of adhesion tosubstrates. Nano/micro-topography has been recognized asfundamental in the design of bio-inspiredmaterials with controlledadhesion [1e4]; in the development of high-throughput micro-fluidic bio-assays for rapid in-vitro screening [5e7]; in tissueengineering and fabrication of implants [8e10]; in eliciting specificcell responses and controlling the fate of undifferentiated stem cells[11,12].
ed series of scientific articlespical and important issues invited editorial but are baseder, without attempting to beed by the Editor-in-Chief and
nd Biomedical Engineering,n, TX, USA. Tel.: þ1 713 500
cuzzi).
All rights reserved.
A variety of techniques have been reported for creatingsubstrates with a controlled topography exhibiting short and longrange order on different materials. These include lithographic-based methods, as well as electrochemical etching, polymer dem-ixing, electrospinning, and the use of block-copolymers [13]. Thishas fostered the analysis of cell proliferation, adhesion, migrationand differentiation on ordered, structured surfaces over multiplescales. Stemming from the pioneering work of Curtis and his group[14], it has been extensively documented [15] how cells tend torespond to micro features and how such a response is affected bythe geometry, material properties, surface functionalization andcell type. For instance, it has been consistently demonstrated thatseveral cell types tend to align, elongate and more avidly adhereover line-grated substrates; whereas reduced adhesion has beenobserved over pillars and posts. More recently, new insights on themechanisms regulating the early interaction of cells membraneswith nanometer features have been proposed by the group ofBongrand [16] and Spatz [17].
Still, the results presented in the literature for cell adhesion onun-structured randomly rough surfaces, which constitute themajority of natural surfaces, remain controversial, and currentlythere is no available framework to interpret or even summarizesuch results. Some studies have documented a decrease in
F. Gentile et al. / Biomaterials 31 (2010) 7205e72127206
proliferation and adhesion with an increase in surface roughness[10], whereas others have shown precisely the opposite [18,19]. Afew papers have demonstrated aminor influence of roughness [20],and more interestingly, some studies have observed an ‘optimal’roughness for maximum proliferation [9,21].
In this work, four different cell lines from two different species,namely A549 human lung carcinoma, human HeLa, humanumbilical vein endothelial cells (HUVECs) and mouse 3T3 fibro-blasts, were cultured over electrochemically etched siliconsubstrates with a surface roughness varying from Ra w2 to 100 nm.The rate of proliferation and surface density of cells were moni-tored through confocal and atomic force microscopy, over threedays. The surface roughness of the silicon substrates was analyzedwithin the realm of fractal theory, and the average roughness Ra,the root mean square roughness Rrms and the surface roughnesspower spectrum were measured.
2. Materials and methods
2.1. Preparation of the rough silicon substrates
(111)-oriented Si wafers were used as substrates. The superficial layer of SiO2
was removed by immersion in HF:H2 ¼ 1:5 v/v solution for 30 s. A fresh siliconsurface was exposed, and the samples were then wet etched in KOH solution (KOH:H2O¼ 1:4 v/v) at different times and at the constant temperature T¼ 70 �C to obtainsurfaces with different roughness. The average surface roughness Ra and the rootmean square roughness Rrms were readily calculated following the definitions Ra ¼RljzðrÞjdr=l and Rrms ¼
ffiffiffiffiffiffiffiffiffiffiffiffiffiffiffiffiffiffiffiffiffiffiffiRlzðrÞ2dr=l
r, where l is the sampling length and z(r) is the
profile of the surface along the r direction, measured using an atomic forcemicroscopy probe operated in tapping mode [22]. Ra and Rrms were assessed overmultiple regions of the substrates.
2.2. Atomic force microscopy characterization of the rough silicon substrates
Atomic Force Microscopy (diCaliber, Veeco Instruments) was used for derivingthe surface roughness profile and for imaging adhering cells. All the measurementswere performed in a dry environment at room temperature in tapping mode(oscillating frequency w270 kHz) over a sampling area of 50 � 50 and 90 � 90 mm2
for the rough substrates and the cells, respectively. An anisotropic pyramidal tipwith a radius of about 15 nmwas used as a probe (TESP, NanoWorld Ldt. Co.). The tipwas made of Silicon and was mounted onto a rectangular shaped cantilever witha typical spring constant between 20 and 80 N/m. Multiple measurements weremade in different scan directions. At least four images in height mode (trace andretrace) were recorded per sample. The images had a resolution of 256 � 256 pixelsand were acquired at a scanning rate of about 1 Hz. The images obtained wereprocessed with the diSPMLab software (Veeco).
2.3. Surface contact angle measurement
Surface hydrophilicity of the samples was determined by measuring the watercontact angle with one drop (5 ml) of deionized water using an automatic contactangle meter (KSV CAM 101, KSV INSTRUMENTS LTD, Helsinki, Finland) at roomtemperature. Four measurements were performed on each substrate to evaluate theaverage contact angle q, at 5 s. Following the YoungeDupre equation, the energy ofadhesion g per unit area at the silicon/water interface was defined asg ¼ gLGð1þ cosqÞ, where gLG is the air/water surface tension (w 72.8 mJ/m2 at20 �C).
2.4. Fourier analysis and fractal dimension of the substrate
The profiles of the substrates, obtained by the procedures described above, wereprocessed to obtain the corresponding power spectrum density functions C(q),defined over the surface (x, y) as [23]
C2DðqÞ ¼ 1
ð2pÞ2�Z
hzðxÞzðoÞie�iqxdx2�
(1)
where x ¼ (x, y) is the planar coordinate; z(x) is the surface profile measuredfrom the average surface plane, defined as hzi ¼ 0; and q is thewavenumber, relatedto the characteristic wavelength l as q ¼ 2p=l. The symbol h.i stands for ensembleaveraging over a collection of different surfaces with identical statistical properties.Since the 2D power spectrum density introduced in Eq. (1) is impractical forcomparison purposes, a 1D power spectrum density was conveniently extractedusing the FACA (Fractal Analysis by Circular Averaging) approach [24]. Considering
the polar variables q and j ðq ¼ffiffiffiffiffiffiffiffiffiffiffiffiffiffiffiffiq2x þ q2y
qand j ¼ arctanðqy=qxÞÞ in the plane
(x, y) of interest, the power spectrum C(q) is derived as an average taken over everycircumference G of radius q and origin (qx ¼ 0, qy ¼ 0), that is to say
CðqÞ ¼ 1G
IG
C2D�qx; qy
�dg ¼ 1
2p
Z2p
0
C2Dðqcos j; qsin jÞdj (2)
The resulting function C(q) can be plotted as in Fig. 4 (and Fig. S5).In the case of self-affine surfaces, for which a rescale in the planar coordinates
x / bx and y / by is accompanied by a rescaling in the normal direction z(bx) / bHz(x), the power spectrum C(q) takes the form [23]
CðqÞ ¼ H2p
�hoqo
�2� qqo
��2ðHþ1Þfor q > qoðl < loÞ (3)
where qo is the lower cut-off wavenumber corresponding to an upper cut-offwavelength lo ¼ 2p=qo; and ho is related to the rms roughness amplitude asho ¼
ffiffiffi2
pRrms. From Eq. (3), a self-affine fractal surface can be univocally identified
by specifying the surface roughness (Rrms), the cut-off wavenumber qo and thecoefficient H, known as the Hurst coefficient. In a logelog plot, the power spectrumdensity of Eq. (3) appears as a line with a slope b for q > qo. The slope b is related tothe Hurst parameters as b ¼ 2ðH þ 1Þ. The fractal dimension D of the surface can bederived from b or H as D ¼ ð8� bÞ=2 or D ¼ 3� H. The fractal dimension D fora surface ranges from 2 (H ¼ 1), representing a perfectly flat surface (Euclideandimension of a surface), to 3 (H ¼ 0), representing an extremely rough surface. ForD ¼ 2.5 (H ¼ 0.5), the so-called Brownian surfaces are identified which have totallyrandom and uncorrelated profiles.
2.5. Cell culture
Four different cell lines were used: a primary human endothelial cell line(HUVEC-C), two human epithelial cancer cell lines (A549 and HeLa cells), and onemousemesenchymal normal cell line (NIH-3T3). All the cells were obtained from theAmerican Type Culture Collection. The A549 cells were cultured in RPMI (Invitrogen)with 10% FCS (Invitrogen), L-glutamine 200 mM (Invitrogen) and antibiotics (100 U/ml penicillin, 100 mg/ml streptomycin and 0.5 g/ml, Invitrogen). The human HeLacells were cultured in DMEM supplemented with 10% FBS, penicillin G (100 U/ml,Invitrogen) and streptomycin (100 mg/ml, Invitrogen). The human umbilical vein ECs(HUVECs) were cultured in M199medium containing 20% newborn calf serum (NCS,GIBCO-BRL), 5% human serum (Gemini Bio-Products, Inc), 50 mg/mL ascorbic acid,1.6 mmol/L L-glutamine, 5 mg/mL bovine brain extract (Clonetec Corp), 7.5 mg/mLendothelial growth supplement (Sigma), 100 U/mL penicillin, 100 mg/mL strepto-mycin, and 10 U/mL heparin. HUVECs of the third to fifth passage were used for allexperiments. The 3T3 cells were kept in DMEM (Invitrogen) supplementedwith 10%FBS (Invitrogen), penicillin G (100 U/ml, Invitrogen), streptomycin (100 mg/mL,Invitrogen), L-Glutamine 2 mM (Invitrogen), Sodium Pyruvate 1 mM (Invitrogen). Allthe cells were cultured at 37 �C in a humidified 5% CO2 atmosphere; were detachedby trypsinization, collected by centrifugation and resuspended in culture medium.Sterilized rough Si wafer specimens (15&15 mm approximately) were individuallyplaced into single wells of a 6-well plate (Corning Incorporated) and the nominallyflat silicon surface was placed in a 30 mm petri dish (Corning Incorporated) (controlexperiment). Thereafter, the wafer specimens were washed with phosphate-buff-ered saline solution (PBS, Invitrogen). The cells were finally seeded in complete cellculture medium and incubated for 24, 36, 48 and 60 h at 37 �C in a humidified 5%CO2 air atmosphere. After incubation the cell culture mediumwas removed and thecells were washed twice in PBS and fixed with BD Cytofix (BD Biosciences). 100 ml ofCytofix were put on each sample and were in dark incubated for 30 min at 4 �C. Thecells were washed twice with Cytoperm (a permeabilization solution, BD Biosci-ences). All the cells fixed upon the Si substrates were stained with 100 ml DAPI (40 , 6-Diamidino-2-phenylindole, SigmaeAldrich) solution for 5 min at 4 �C. Finally, theDAPI solution was removed and each sample was washed with PBS. The totalnumber of cells initially deposited in each well for incubation was ntot w 60000,28751, 18,0000 and 20,000 for the mouse 3T3 fibroblasts, human HeLa, human lungcarcinoma cells and HUVECs experiments, respectively. The cells were sub-confluentthroughout the duration of the experiment.
After 48 h the cells were fixed according to the protocol above and stained with100 ml of mouse anti clathrin (AbD Serotec) solution and incubated for 30 min. Thesamples were washed twice with Cytoperm and a secondary antibody (Alexa Fluor488 chicken anti-mouse from Invitrogen) was added. After 45 min of incubation thecells were washed twice with PBS and incubated with Alexa Fluor 546 phalloidin(Invitrogen) to stain F-Actin (a fibrous actin polymerized in the form of a doublehelix). Finally the samples were washed twice with PBS.
2.6. Counting the number of adhering cells
An inverted Leica TCS-SP2� laser scanning confocal microscopy systemwas usedto image cells adhering on the substrates. All the measurements were performedusing a ArUv laser. The pinhole (w80 mm, or equivalently w1.5 Airy units) and laserpower (80% power) were maintained throughout each experiment. Confocal images
F. Gentile et al. / Biomaterials 31 (2010) 7205e7212 7207
of blue (DAPI) fluorescence were collected using a 405 nm excitation line anda 10� dry objective, so that cells with a characteristic size of a few microns could beclearly observed. For each substrate a large number of images (>40) was taken forstatistical analysis. Each image was acquired over a region of interest of882�882 mm2 (pixel size ¼ 1.72 mm) and averaged over 4 lines and 10 frames toimprove quality and reduce noise. The images were digitazed into 512 � 512 pixeland stored on a computer. The fluorescent confocal images of the cells wereexported into MatLAB� and Mathematica� for deconvolution using in-housedeveloped software. The number of cells adhering to the substrate within the regionof interest at different roughness and time steps was measured. The cells wereanalyzed over time after 24, 36, 48 and 60 h from incubation. The number ofadhering cells was normalized with respect to the total number of cells initiallydeposited in eachwell for incubation and divided by thewell area nd ¼ n=ðntot � AÞ;where A w 707 mm2 and ntot as reported above.
The fluorescence distribution of Actin and Clathrin in mouse 3T3 fibroblast cellswas analyzed on unetched and rough (Ra ¼ 37.87 nm; Rrms ¼ 53.78 nm) substrates,using an inverted Nikon TE2000-C1 confocal microscope. All the images wereacquired using a 60�/1.49 N A. TIRF oil immersion objective. The pinhole (30 mm, orequivalently 1.0 Airy units) was maintained throughout each experiment, thusyielding themaximum confocality for the system. Sample fluorophores were excitedusing a 488 nm Ar Laser (for clathrin) and a 543 nm HeeNe laser (for actin). Eachimagewas acquired over a region of interest of 68 � 68 mm2 and 83� 83 mm2 for theflat and rough substrate, respectively, and averaged over 4 frames to improve qualityand reduce noise. The images were digitized into 512 � 512 pixels and conveyed toa computer for storage.
2.7. Statistical analysis
In terms of cell count and surface characterization (Ra, Rrms, q), all data wereexpressed as mean � standard deviation, and analyzed statistically by the pairedStudent’s t test method. Significant difference was determined at P values smallerthan 0.05.
3. Results
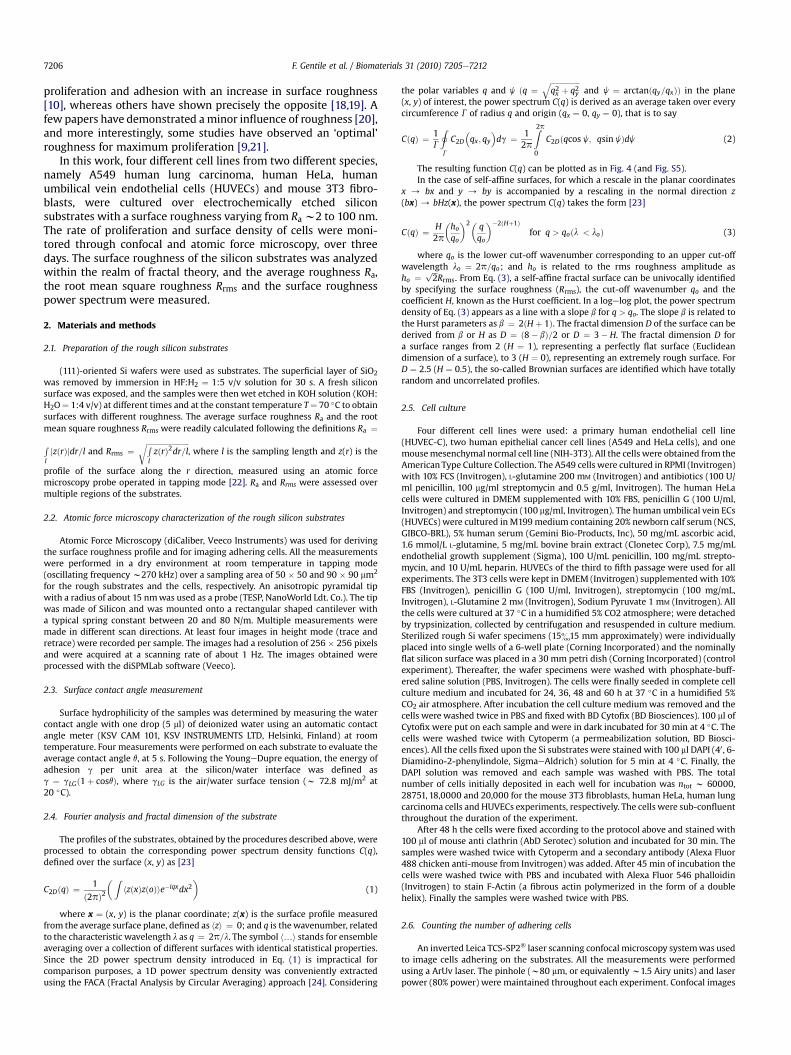
(111)-oriented silicon wafers were etched in diluted KOH solu-tions at 70 �C. The surface roughness of the wafer was observed toincreasewith the etching time s (Fig.1a). Six different etching times
Fig. 1. The variation of the average and root mean square surface roughness (Ra, Rrms) as a fmicroscopy for three sample substrates, namely Ra ¼ 2.33 nm (b); Ra ¼ 18.93 nm (c) and R
were used ranging from 2 to 60 min leading to surfaces with anaverage roughness varying from Ra w 10 to 100 nm. The unetchedsilicon wafer showed a Ra ¼ 2.33 nm. The corresponding values ofthe root mean square roughness Rrms were provided in Table 1.Representative images of the etched silicon substrates takenthrough atomic force microscopy are shown in Fig. 1, forRa¼ 2.33 nm (unetchedwafer), 37.87 and 101.47 nm. Topographicalimages for all the substrates are given in the Supplementary data(Fig. S1). From Fig. 1, different geometrical features of the siliconsubstrates are depicted: the unetched silicon substrate appeared asalmost uniformly flat with short peaks in the few nanometer range;at the other extreme, the highly etched silicon substrate(Ra w 100 nm) appeared as a set of regular flat ridges a fewmicronsapart; whereas the moderately etched silicon substrate(Ra w 10e45 nm) was evenly ‘corrugated’ with individual highpeaks. Notice that the individual spikes visible on the unetchedsilicon substrate in Fig. 1b are experimental noise. The hydrophi-licity of the silicon substrates was also characterized by measuringthe contact angle q. For the unetched wafer, q was about 50�
whereas for the rough substrates it varied between 8�
(Ra ¼ 18.93 nm) and 18� (Ra ¼ 101.47 nm). Therefore, using theYoungeDupre’ relation, the average surface energy for the roughsubstrates was gw 0.144 J/m2, with a variation smaller than 2%. Thesurface energy for the nominally flat substrate was measured to bew0.120 J/m2. The etching time s, the characteristic surface rough-ness parameters (Ra and Rrms) and the contact angle q are listed inTable 1 for all seven analyzed substrates.
The proliferation rate on the silicon substrates was analyzedby incubating the cells with fragments of silicon wafers (w 15 �15 mm) placed into the wells of a 6-well plate. At each timepoint, the silicon substrates were first washed to remove looselyadhering cells; then the cells were fixed and stained with DAPI.Fig. S2, in the Supplementary Data, shows representative images
unction of the etching time s (a) and the surface profiles detected through atomic forcea ¼ 101.47 nm (d).
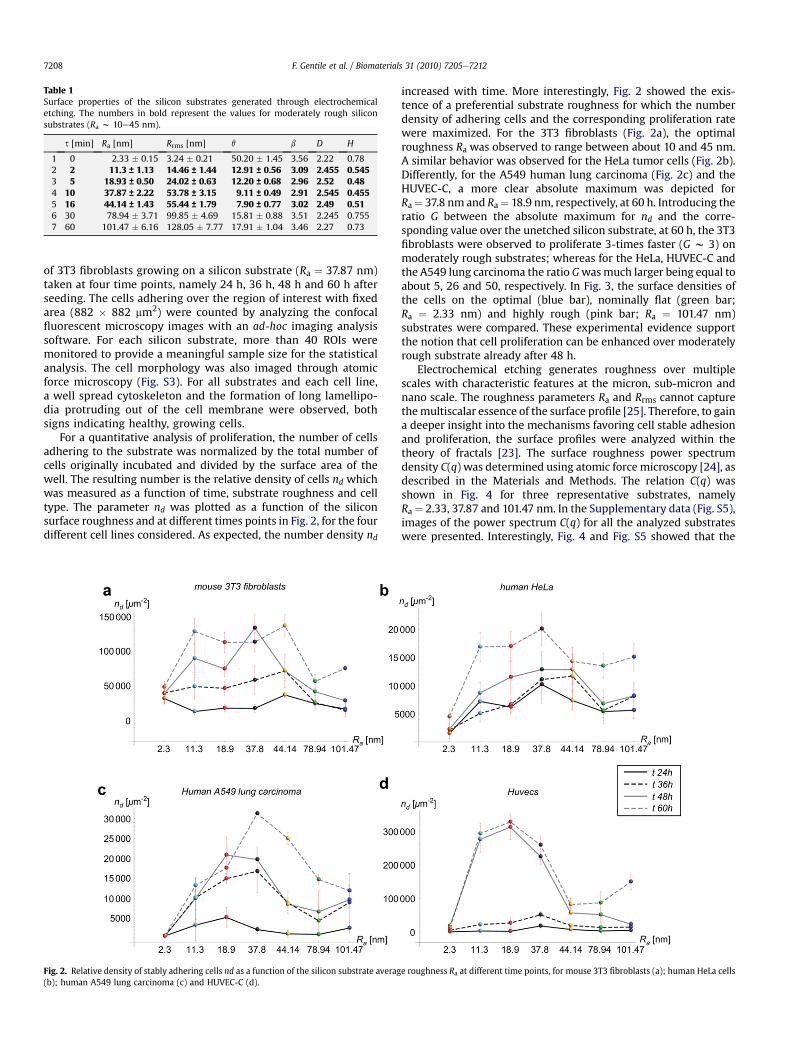
Table 1Surface properties of the silicon substrates generated through electrochemicaletching. The numbers in bold represent the values for moderately rough siliconsubstrates (Ra w 10e45 nm).
s [min] Ra [nm] Rrms [nm] q b D H
1 0 2.33 � 0.15 3.24 � 0.21 50.20 � 1.45 3.56 2.22 0.782 2 11.3 ± 1.13 14.46 ± 1.44 12.91 ± 0.56 3.09 2.455 0.5453 5 18.93 ± 0.50 24.02 ± 0.63 12.20 ± 0.68 2.96 2.52 0.484 10 37.87 ± 2.22 53.78 ± 3.15 9.11 ± 0.49 2.91 2.545 0.4555 16 44.14 ± 1.43 55.44 ± 1.79 7.90 ± 0.77 3.02 2.49 0.516 30 78.94 � 3.71 99.85 � 4.69 15.81 � 0.88 3.51 2.245 0.7557 60 101.47 � 6.16 128.05 � 7.77 17.91 � 1.04 3.46 2.27 0.73
F. Gentile et al. / Biomaterials 31 (2010) 7205e72127208
of 3T3 fibroblasts growing on a silicon substrate (Ra ¼ 37.87 nm)taken at four time points, namely 24 h, 36 h, 48 h and 60 h afterseeding. The cells adhering over the region of interest with fixedarea (882 � 882 mm2) were counted by analyzing the confocalfluorescent microscopy images with an ad-hoc imaging analysissoftware. For each silicon substrate, more than 40 ROIs weremonitored to provide a meaningful sample size for the statisticalanalysis. The cell morphology was also imaged through atomicforce microscopy (Fig. S3). For all substrates and each cell line,a well spread cytoskeleton and the formation of long lamellipo-dia protruding out of the cell membrane were observed, bothsigns indicating healthy, growing cells.
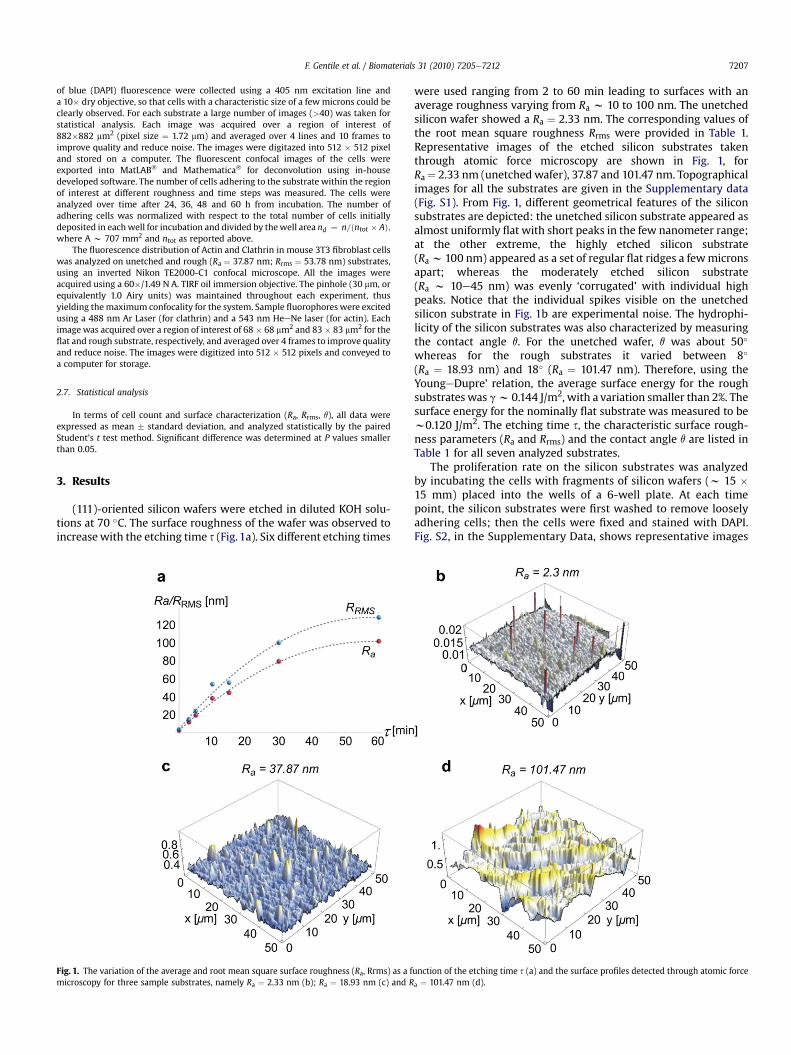
For a quantitative analysis of proliferation, the number of cellsadhering to the substrate was normalized by the total number ofcells originally incubated and divided by the surface area of thewell. The resulting number is the relative density of cells nd whichwas measured as a function of time, substrate roughness and celltype. The parameter nd was plotted as a function of the siliconsurface roughness and at different times points in Fig. 2, for the fourdifferent cell lines considered. As expected, the number density nd
Fig. 2. Relative density of stably adhering cells nd as a function of the silicon substrate averag(b); human A549 lung carcinoma (c) and HUVEC-C (d).
increased with time. More interestingly, Fig. 2 showed the exis-tence of a preferential substrate roughness for which the numberdensity of adhering cells and the corresponding proliferation ratewere maximized. For the 3T3 fibroblasts (Fig. 2a), the optimalroughness Ra was observed to range between about 10 and 45 nm.A similar behavior was observed for the HeLa tumor cells (Fig. 2b).Differently, for the A549 human lung carcinoma (Fig. 2c) and theHUVEC-C, a more clear absolute maximum was depicted forRa¼ 37.8 nm and Ra¼ 18.9 nm, respectively, at 60 h. Introducing theratio G between the absolute maximum for nd and the corre-sponding value over the unetched silicon substrate, at 60 h, the 3T3fibroblasts were observed to proliferate 3-times faster (G w 3) onmoderately rough substrates; whereas for the HeLa, HUVEC-C andthe A549 lung carcinoma the ratio Gwasmuch larger being equal toabout 5, 26 and 50, respectively. In Fig. 3, the surface densities ofthe cells on the optimal (blue bar), nominally flat (green bar;Ra ¼ 2.33 nm) and highly rough (pink bar; Ra ¼ 101.47 nm)substrates were compared. These experimental evidence supportthe notion that cell proliferation can be enhanced over moderatelyrough substrate already after 48 h.
Electrochemical etching generates roughness over multiplescales with characteristic features at the micron, sub-micron andnano scale. The roughness parameters Ra and Rrms cannot capturethemultiscalar essence of the surface profile [25]. Therefore, to gaina deeper insight into the mechanisms favoring cell stable adhesionand proliferation, the surface profiles were analyzed within thetheory of fractals [23]. The surface roughness power spectrumdensity C(q) was determined using atomic force microscopy [24], asdescribed in the Materials and Methods. The relation C(q) wasshown in Fig. 4 for three representative substrates, namelyRa ¼ 2.33, 37.87 and 101.47 nm. In the Supplementary data (Fig. S5),images of the power spectrum C(q) for all the analyzed substrateswere presented. Interestingly, Fig. 4 and Fig. S5 showed that the
e roughness Ra at different time points, for mouse 3T3 fibroblasts (a); human HeLa cells
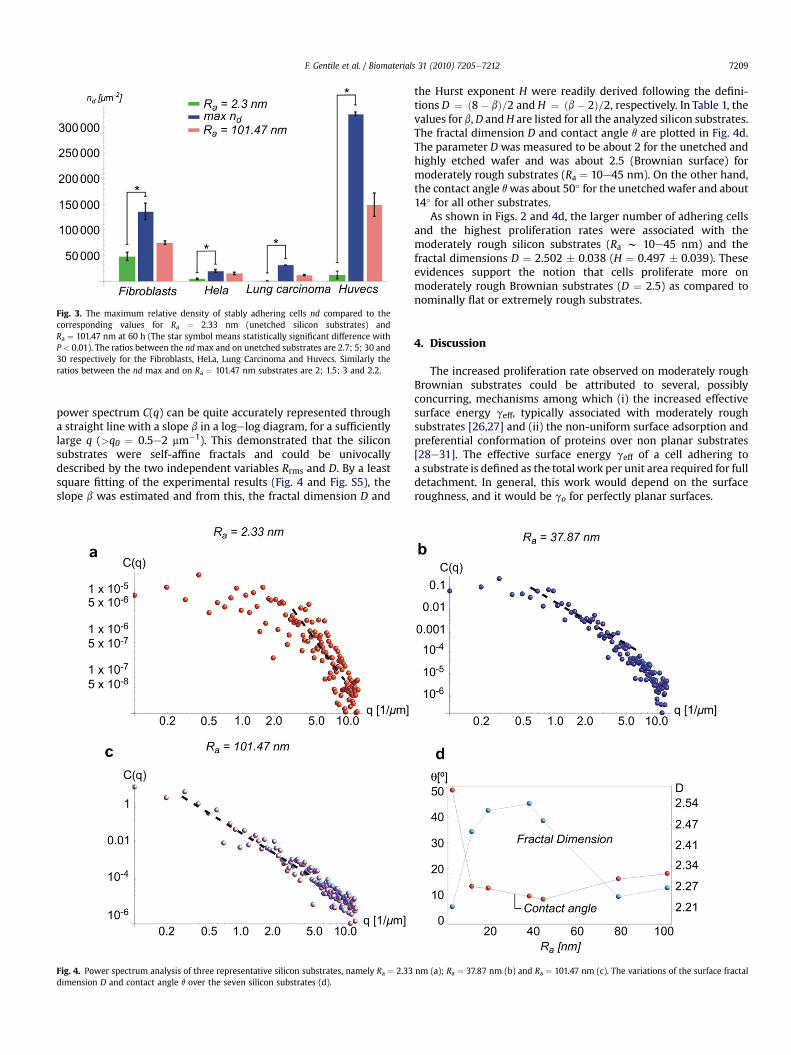
Fig. 3. The maximum relative density of stably adhering cells nd compared to thecorresponding values for Ra ¼ 2.33 nm (unetched silicon substrates) andRa ¼ 101.47 nm at 60 h (The star symbol means statistically significant difference withP < 0.01). The ratios between the ndmax and on unetched substrates are 2.7; 5; 30 and30 respectively for the Fibroblasts, HeLa, Lung Carcinoma and Huvecs. Similarly theratios between the nd max and on Ra ¼ 101.47 nm substrates are 2; 1.5; 3 and 2.2.
F. Gentile et al. / Biomaterials 31 (2010) 7205e7212 7209
power spectrum C(q) can be quite accurately represented througha straight line with a slope b in a logelog diagram, for a sufficientlylarge q (>q0 ¼ 0.5e2 mm�1). This demonstrated that the siliconsubstrates were self-affine fractals and could be univocallydescribed by the two independent variables Rrms and D. By a leastsquare fitting of the experimental results (Fig. 4 and Fig. S5), theslope b was estimated and from this, the fractal dimension D and
Fig. 4. Power spectrum analysis of three representative silicon substrates, namely Ra ¼ 2.33dimension D and contact angle q over the seven silicon substrates (d).
the Hurst exponent H were readily derived following the defini-tions D ¼ ð8� bÞ=2 and H ¼ ðb� 2Þ=2, respectively. In Table 1, thevalues for b,D andH are listed for all the analyzed silicon substrates.The fractal dimension D and contact angle q are plotted in Fig. 4d.The parameter D was measured to be about 2 for the unetched andhighly etched wafer and was about 2.5 (Brownian surface) formoderately rough substrates (Ra ¼ 10e45 nm). On the other hand,the contact angle qwas about 50� for the unetched wafer and about14� for all other substrates.
As shown in Figs. 2 and 4d, the larger number of adhering cellsand the highest proliferation rates were associated with themoderately rough silicon substrates (Ra w 10e45 nm) and thefractal dimensions D ¼ 2.502 � 0.038 (H ¼ 0.497 � 0.039). Theseevidences support the notion that cells proliferate more onmoderately rough Brownian substrates (D ¼ 2.5) as compared tonominally flat or extremely rough substrates.
4. Discussion
The increased proliferation rate observed on moderately roughBrownian substrates could be attributed to several, possiblyconcurring, mechanisms among which (i) the increased effectivesurface energy geff, typically associated with moderately roughsubstrates [26,27] and (ii) the non-uniform surface adsorption andpreferential conformation of proteins over non planar substrates[28e31]. The effective surface energy geff of a cell adhering toa substrate is defined as the total work per unit area required for fulldetachment. In general, this work would depend on the surfaceroughness, and it would be go for perfectly planar surfaces.
nm (a); Ra ¼ 37.87 nm (b) and Ra ¼ 101.47 nm (c). The variations of the surface fractal
F. Gentile et al. / Biomaterials 31 (2010) 7205e72127210
Cell adhesion is mediated by the formation of discreteligandereceptor bonds (specific interactions) and short rangedinterfacial forces as van der Waals, double layer electrostatic andsteric (non-specific interactions), which together contribute to thesurface energy of specific and non-specific adhesion gadh [26]. Thisgrows with the density of the ligands adsorbing on the siliconsubstrate, the density of the receptors expressed on the cellmembrane and the affinity of the ligandereceptor bonds.
Under the simplistic assumption that cells can be represented asthin elastic layers of modulus E sitting over a rigid wavy surfacewith a fixedwavenumber q and an amplitude h; the ratio geff/go hasbeen shown [26] to be larger than unity for h smaller than hcr. Inother words, cell stable adhesion and, consequently, proliferationwould be energetically favorable on rough surfaces as long ash < hcr, which would then identify the subset of moderately roughsubstrates for a given q. Also, geff/go and hcr have been predicted togrow with the normalized parameter qgadh/E [26].
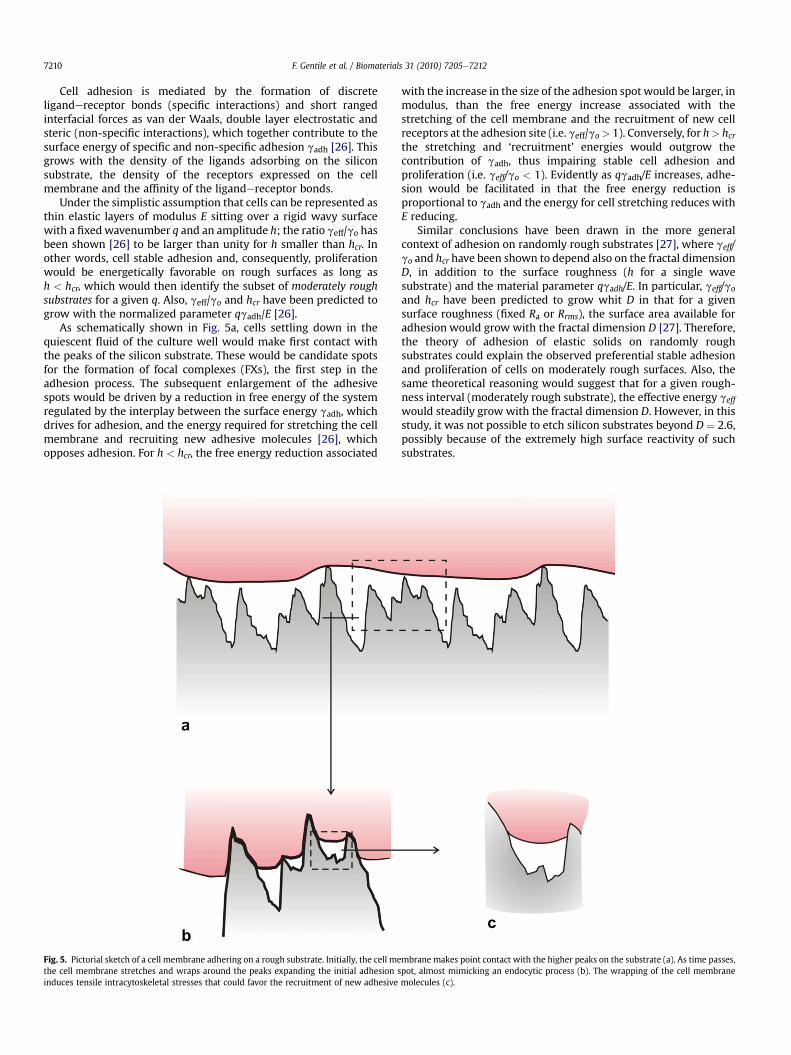
As schematically shown in Fig. 5a, cells settling down in thequiescent fluid of the culture well would make first contact withthe peaks of the silicon substrate. These would be candidate spotsfor the formation of focal complexes (FXs), the first step in theadhesion process. The subsequent enlargement of the adhesivespots would be driven by a reduction in free energy of the systemregulated by the interplay between the surface energy gadh, whichdrives for adhesion, and the energy required for stretching the cellmembrane and recruiting new adhesive molecules [26], whichopposes adhesion. For h < hcr, the free energy reduction associated
Fig. 5. Pictorial sketch of a cell membrane adhering on a rough substrate. Initially, the cell methe cell membrane stretches and wraps around the peaks expanding the initial adhesion sinduces tensile intracytoskeletal stresses that could favor the recruitment of new adhesive
with the increase in the size of the adhesion spot would be larger, inmodulus, than the free energy increase associated with thestretching of the cell membrane and the recruitment of new cellreceptors at the adhesion site (i.e. geff/go> 1). Conversely, for h> hcrthe stretching and ‘recruitment’ energies would outgrow thecontribution of gadh, thus impairing stable cell adhesion andproliferation (i.e. geff/go < 1). Evidently as qgadh/E increases, adhe-sion would be facilitated in that the free energy reduction isproportional to gadh and the energy for cell stretching reduces withE reducing.
Similar conclusions have been drawn in the more generalcontext of adhesion on randomly rough substrates [27], where geff/go and hcr have been shown to depend also on the fractal dimensionD, in addition to the surface roughness (h for a single wavesubstrate) and the material parameter qgadh/E. In particular, geff/go
and hcr have been predicted to grow whit D in that for a givensurface roughness (fixed Ra or Rrms), the surface area available foradhesion would grow with the fractal dimension D [27]. Therefore,the theory of adhesion of elastic solids on randomly roughsubstrates could explain the observed preferential stable adhesionand proliferation of cells on moderately rough surfaces. Also, thesame theoretical reasoning would suggest that for a given rough-ness interval (moderately rough substrate), the effective energy geffwould steadily grow with the fractal dimension D. However, in thisstudy, it was not possible to etch silicon substrates beyond D ¼ 2.6,possibly because of the extremely high surface reactivity of suchsubstrates.
mbrane makes point contact with the higher peaks on the substrate (a). As time passes,pot, almost mimicking an endocytic process (b). The wrapping of the cell membranemolecules (c).
F. Gentile et al. / Biomaterials 31 (2010) 7205e7212 7211
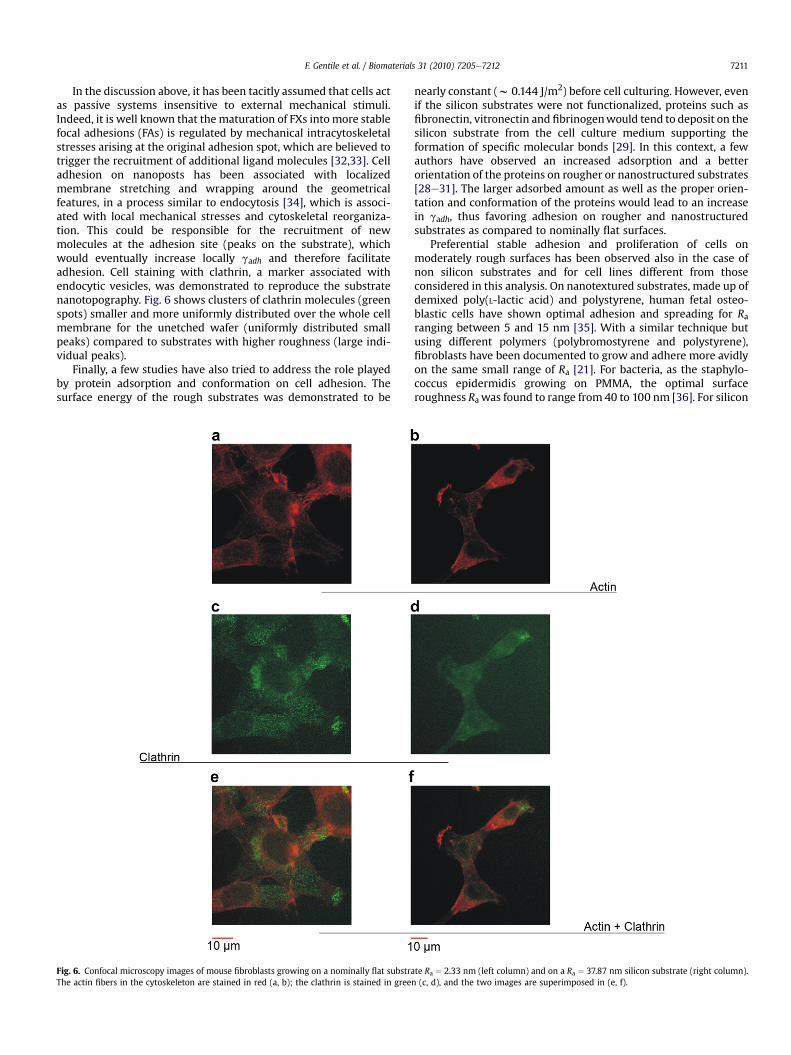
In the discussion above, it has been tacitly assumed that cells actas passive systems insensitive to external mechanical stimuli.Indeed, it is well known that the maturation of FXs intomore stablefocal adhesions (FAs) is regulated by mechanical intracytoskeletalstresses arising at the original adhesion spot, which are believed totrigger the recruitment of additional ligand molecules [32,33]. Celladhesion on nanoposts has been associated with localizedmembrane stretching and wrapping around the geometricalfeatures, in a process similar to endocytosis [34], which is associ-ated with local mechanical stresses and cytoskeletal reorganiza-tion. This could be responsible for the recruitment of newmolecules at the adhesion site (peaks on the substrate), whichwould eventually increase locally gadh and therefore facilitateadhesion. Cell staining with clathrin, a marker associated withendocytic vesicles, was demonstrated to reproduce the substratenanotopography. Fig. 6 shows clusters of clathrin molecules (greenspots) smaller and more uniformly distributed over the whole cellmembrane for the unetched wafer (uniformly distributed smallpeaks) compared to substrates with higher roughness (large indi-vidual peaks).
Finally, a few studies have also tried to address the role playedby protein adsorption and conformation on cell adhesion. Thesurface energy of the rough substrates was demonstrated to be
Fig. 6. Confocal microscopy images of mouse fibroblasts growing on a nominally flat substraThe actin fibers in the cytoskeleton are stained in red (a, b); the clathrin is stained in gree
nearly constant (w 0.144 J/m2) before cell culturing. However, evenif the silicon substrates were not functionalized, proteins such asfibronectin, vitronectin and fibrinogenwould tend to deposit on thesilicon substrate from the cell culture medium supporting theformation of specific molecular bonds [29]. In this context, a fewauthors have observed an increased adsorption and a betterorientation of the proteins on rougher or nanostructured substrates[28e31]. The larger adsorbed amount as well as the proper orien-tation and conformation of the proteins would lead to an increasein gadh, thus favoring adhesion on rougher and nanostructuredsubstrates as compared to nominally flat surfaces.
Preferential stable adhesion and proliferation of cells onmoderately rough surfaces has been observed also in the case ofnon silicon substrates and for cell lines different from thoseconsidered in this analysis. On nanotextured substrates, made up ofdemixed poly(L-lactic acid) and polystyrene, human fetal osteo-blastic cells have shown optimal adhesion and spreading for Raranging between 5 and 15 nm [35]. With a similar technique butusing different polymers (polybromostyrene and polystyrene),fibroblasts have been documented to grow and adhere more avidlyon the same small range of Ra [21]. For bacteria, as the staphylo-coccus epidermidis growing on PMMA, the optimal surfaceroughness Ra was found to range from 40 to 100 nm [36]. For silicon
te Ra ¼ 2.33 nm (left column) and on a Ra ¼ 37.87 nm silicon substrate (right column).n (c, d), and the two images are superimposed in (e, f).
F. Gentile et al. / Biomaterials 31 (2010) 7205e72127212
etched substrates, again, neurons have been shown to adhere morestrongly for Ra w25 nm [9]. Macrophages have been traditionallyconsidered as rugophobic cells adhering more easily on planarrather than rough surfaces [37]. However, recent studies seem tosupport again the notion that moderate roughness (from a fewnanometers to a few tens of nanometers) could help macrophagesto adhere even on cytotoxic surfaces made by zinc oxides [38].
5. Conclusions
We show that stable cell adhesion and proliferation can bemaximized on moderately rough substrates. Although this wasobserved for four different cell lines, belonging to two differentspecies, growing over seven electrochemically etched siliconsubstrates with different surface roughness for three days, addi-tional studies are needed to assess the generality of the results. Thepresent study emphasized also the importance of (i) fully charac-terizing the substrate topography, by measuring the power spec-trum density rather than just the average or root mean squareroughness; and (ii) developing effective micro/nano fabricationprotocols for generating substrates where roughness and fractaldimension could be controlled independently.
The use of silicon in biomedical applications is becoming moreand more important with successful examples in the developmentof brainemachine interfaces [39], retinal implants [40] and in thedesign of microfluidic chips for high-throughput screening [41].This study would suggest that designing silicon substrates withmoderate roughness could enhance the proliferation rate of specificcells and, thus boost the performances of implantable devices.
Acknowledgments
This research activity has been supported by the EuropeanScience Foundation EUROCORES Programme FANAS, through fundsby the Consiglio Nazionale delle Ricerche and the EC Sixth Frame-work Programme under contract N. ERAS-CT-2003-980409FANAS.This work was partially funded under the European Project SMDFP7-NMP 2800-SMALL-2 proposal no. CP-FP 229375-2. The authorswould like to thank the reviewers for their useful comments andsuggestions. PD would like to thank Dr. Giuseppe Carbone at thePolitecnico di Bari (IT) for helpful discussions on the fractal analysisof randomly rough substrates.
Appendix. Supplementary data
Supplementary data associated with this article can be found, inthe online version, at doi:10.1016/j.biomaterials.2010.06.016.
References
[1] Mahdavi A, Ferreira L, Sundback C, Nichol J-W, Chan E-P, Carter D-J, et al. Abiodegradable and biocompatible gecko-inspired tissue adhesive. Proc NatlAcad Sci U S A 2008;105:2307e12.
[2] Ge L, Sethi S, Ci L, Ajayan P-M, Dhinojwala A. Carbon nanotube-basedsynthetic gecko tapes. Proc Natl Acad Sci U S A 2007;104:10792e5.
[3] Arzt E, Gorb S, Spolenak R. From micro to nano contacts in biologicalattachment devices. Proc Natl Acad Sci U S A 2003;100:10603e6.
[4] Fischer K-E, Alemán B-J, Tao S-L, Hugh Daniels R, Li E-M, Bünger M-D, et al.Biomimetic nanowire coatings for next generation adhesive drug deliverysystems. Nano Lett 2009;9:716e20.
[5] Cortese B, Piliego C, Viola I, D’Amone S, Cingolani R, Gigli G. Engineeringtransfer of micro- and nanometer-scale features by surface energy modifica-tion. Langmuir 2009;25:7025e31.
[6] Goto M, Tsukahara T, Sato K, Kitamori T. Micro- and nanometer-scalepatterned surface in a microchannel for cell culture in microfluidic devices.Anal Bioanal Chem 2008;390:817e23.
[7] Falconnet D, Csucs G, Grandin H-M, Textor M. Surface engineering approachesto micropattern surfaces for cell-based assays. Biomaterials 2006;27:3044e63.
[8] Dalby M-J, McCloy D, Robertson M, Agheli H, Sutherland D, Affrossman S, et al.Osteoprogenitor response to semi-ordered and random nanotopographies.Biomaterials 2006;27(15):2980e7.
[9] Fan Y-W, Cui F-Z, Hou S-P, Xu Q-Y, Chen L-N, Lee I-S. Culture of neural cells onsilicon wafers with nano-scale surface topograph. J Neurosci Methods2002;120:17e23.
[10] Kunzler T-P, Huwiler C, Drobek T, Voros J, Spencer N-D. Systematic study ofosteoblast response to nanotopography by means of nanoparticle-densitygradients. Biomaterials 2007;28:5000e6.
[11] Dalby M-J, Gadegaard N, Tare R, Andar A, Riehle M-O, Herzyk P, et al. Thecontrol of human mesenchymal cell differentiation using nanoscale symmetryand disorder. Nat Mater 2007;6:997e1003.
[12] Oh S, Brammer K-S, Li Y-S, Teng D, Engler A-J, Chien S, et al. Stem cell fatedictated solely by altered nanotube dimension. Proc Natl Acad Sci U S A2009;106:2130e5.
[13] Norman J, Desai T. Methods for fabrication of nanoscale topography for tissueengineering scaffolds. Ann Biomed Eng 2006;34:89e101.
[14] Curtis A-S, Varde M. Control of cell behavior-topological factors. J Natl CancerInst 1964;33:15e26.
[15] Bettinger C-J, Langer R, Borenstein J-T. Engineering substrate topography atthe micro- and nanoscale to control cell function. Angew Chem Int Ed Engl2009;48:5406e15.
[16] Pierres A, Monnet-Corti V, Benoliel A-M, Bongrand P. Do membrane undula-tions help cells probe the world? Trends Cell Biol 2009;19:428e33.
[17] Cavalcanti-Adam EA, Volberg T, Micoulet A, Kessler H, Geiger B, Spatz JP. Cellspreading and focal adhesion dynamics are regulated by spacing of integrinligands. Biophys J 2007;92(8):2964e74.
[18] Li B, Logan B-E. Bacterial adhesion to glass and metal-oxide surfaces. ColloidsSurf B Biointerfaces 2004;36:81e90.
[19] Webster T-J, Ejiofor J-U. Increased osteoblast adhesion on nanophase metals:Ti, Ti6Al4V, and CoCrMo. Biomaterials 2004;25:4731e9.
[20] de Oliveira P-T, Zalzal S-F, Beloti M-M, Rosa A-L, Nanci A. Enhancement of invitro osteogenesis on titanium by chemically produced nanotopography. JBiomed Mater Res A 2007;80:554e64.
[21] Dalby M-J, Riehle M-O, Johnstone H-J-H, Affrossman S, Curtis A-S-G. Polymer-demixed nanotopography: control of fibroblast spreading and proliferation.Tissue Eng 2002;8:1099e108.
[22] Bhushan B. Handbook of micro/nanobiology. Boca Raton, FL: CRC Press; 1999.p. 259e261.
[23] Feder J. Fractals. New York: Plenum Press; 1988.[24] Aguilar M, Anaguiano E, Pancorbo M. Fractal characterization by frequent-
analysis: 2 A new method. J Microscopy-Oxford 1993;172:233e8.[25] Majumdar A, Bhushan B. Role of fractal geometry in roughness character-
ization and contact mechanics of surfaces. J Tribology 1990;112:205e16.[26] Decuzzi P, Ferrari M. Modulating cellular adhesion through nanotopography.
Biomaterials 2010;11:173e9.[27] Persson B-N. Adhesion between an elastic body and a randomly rough hard
surface. Eur Phys J E Soft Matter 2008;8:385e401.[28] Williams D-F. Tissue-biomaterial interactions. J Mater Sci 1987;22:3421e45.[29] González-García C, Sousa SR, Moratal D, Rico P, Salmerón-Sánchez M. Effect of
nanoscale topography on fibronectin adsorption, focal adhesion size andmatrix organisation. Colloids Surf B Biointerfaces 2010;77:181e90.
[30] Yap FL, Zhang Y. Protein and cell micropatterning and its integration withmicro/nanoparticles assembly. Biosens Bioelectron 2007;22:775e88.
[31] Denis FA, Hanarp P, Sutherland DS, Gold J, Mustin C, Rouxhet PG, et al. Proteinadsorption on model surfaces with controlled nanotopography and chemistry.Langmuir 2002;18:819e28.
[32] Wang N, Butler J-P, Ingber D-E. Mechanotransduction across the cell surfaceand through the cytoskeleton. Science 1993;260:1124e7.
[33] Riveline D, Zamir E, Balaban N-Q, Schwarz U-S, Geiger B, Kam Z, et al. Focalcontact as a mechanosensor: externally applied local mechanical forceinduces growth of focal contacts by an mDia1-dependent and ROCK-inde-pendent mechanism. Cell Biol 2001;153:1175e85.
[34] Dalby M-J, Berry C-C, Riehle M-O, Sutherland D-S, Agheli H, Curtis A-S-G.Attempted endocytosis of nano-environment produced by colloidal lithog-raphy by human fibroblasts. Exp Cell Res 2004;295:387e94.
[35] Lim J-Y,DreissA-D, ZhouZ,Hansen J-C, Siedlecki CA-,HengstebeckR-W,et al. Theregulation of integrin-mediated osteoblast focal adhesion and focal adhesionkinase expression by nanoscale topography. Biomaterials 2007;28:1787e97.
[36] Mitik-Dineva N, Wang J, Mocanasu R-C, Stoddart P-R, Crawford R-J, Ivanova E-P. Impact of nano-topography on bacterial attachment. Biotechnol J2008;3:536e44.
[37] Rich A, Harris AK. Anomalous preferences of cultured macrophages forhydrophobic and roughened substrata. J Cell Sci 1981;50:1e7.
[38] Zaveri TD, Dolgova NV, Chu BH, Lee J, Wong J, Lele TP, et al. Contributions ofsurface topography and cytotoxicity to the macrophage response to zinc oxidenanorods. Biomaterials 2010;31:2999e3007.
[39] Buzsáki G. Large-scale recording of neuronal ensembles. Nat Neurosci2004;7:446e51.
[40] Butterwick A, Huie P, Jones B-W, Marc R-E, Marmor M, Palanker D. Effect ofshape and coating of a subretinal prosthesis on its integration with the retina.Exp Eye Res 2009;88:22e9.
[41] Cretich M, di Carlo G, Longhi R, Gotti C, Spinella N, Coffa S, et al. High sensi-tivity protein assays on microarray silicon slides. Anal Chem 2009;81:5197e203.