cellular mechanisms of organ-specific metastasis of ewing's sarcoma
TRANSCRIPT

Cellular Mechanisms of Organ-Specific Metastasis
of Ewing’s Sarcoma
Henrike Knizia
Student number: 089160064
A thesis submitted in part requirement for the degree of Doctor of Philosophy from the
Faculty of Medical Sciences at Newcastle University,
Newcastle upon Tyne, UK
March 2011
Leukaemia Stem Cell Research Group, Northern Institute for Cancer Research, Paul O’Gorman Building, Medical School, Framlington Place, University of Newcastle,
Newcastle-upon-Tyne, NE2 4HH, UK.

“When a plant goes to seed, its seeds are carried in all directions;
but they can only grow if they fall on congenial soil.”
Sir Stephen Paget

Author’s declaration
I hereby declare that no parts of the work referred to in this thesis have
previously been submitted in support of an application for another degree or
qualification of this or any other University.
Cloning work was performed in cooperation with Dr. Frida Ponthan and Dr. Olaf
Heidenreich, histology was supported by Dr. Christopher Bacon and imaging
was supported by the imaging groups in Münster and Newcastle upon Tyne.
Parts of the work of this thesis in hand were performed at the Westfälische
Wilhelms-University and University Hospital Münster, Germany.
Henrike Knizia
March 2011

Abstract
I
Abstract
Ewing's sarcoma is the second most common bone tumour in children and
adolescents. The prognosis is mainly influenced by the occurrence of primary
metastasis. Although great improvement in treatment has been achieved, still
only 2/3 of patients with localized disease can be cured. Furthermore, the 3-year
event free survival in patients with lung metastases is only ~50%, and is less than
20% in patients with bony metastases. Metastatic models of Ewing’s sarcoma
developed in this study using cell lines in immunocompromised mice show a
pattern of disease spread similar to that found in patients, providing a suitable
system for studying the metastatic process likely occurring in the course of
Ewing’s sarcoma. The comparison of microarray gene expression patterns
revealed interesting candidate genes for diagnosis and identified putative
metastasis-specific targets that might be exploited in the development of new
treatment approaches. However, it will be necessary to additionally analyse these
patterns in primary material.
One gene that formerly has been shown to play a role in the metastasis to bones
in a variety of cancer types is CXCR4, which encodes for the cytokine receptor
of CXCL12 (SDF-1), and which plays a role in the metastasis to bones in a
variety of other cancer types. As Ewing’s sarcoma cells express CXCR4, a
shRNA vector was constructed, transduced and stably expressed to investigate
the role of the CXCR4/CXCL12 axis in Ewing’s sarcoma cells via RNA
interference. This stability provides the possibility of an in vitro and furthermore
an in vivo use for investigations.
In order to investigate the biology of bone malignancy and especially the
interaction of tumour cells with cells of the microenvironment of the bone

Abstract
II
directly, an orthotopic model for Ewing’s sarcoma was developed. Additionally,
osteosarcoma as a further primary bone sarcoma and prostate carcinoma as a
cancer type with frequent bone metastases were tested in this model. The
previously described technique of intrafemoral transplantation was used in this
model. Using small animal imaging techniques such as nano computed
tomography and magnetic resonance imaging in combination with histology it
could be shown that the transplanted cells led to the development of orthotopic
tumours presenting a comparable picture to the clinical situation. This model will
be further used for research projects performed in the Northern Institute for
Cancer Research on the effectiveness of drugs targeting Ewing’s sarcoma cells.

Acknowledgments
III
Acknowledgments
My special thanks go to my supervisor Prof. Dr. Josef Vormoor for giving me
the opportunity to study for a PhD and develop as a researcher. Many thanks also
to Dr. Marc Hotfilder and Dr. Georg Hempel in Münster for their support during
the first phase of my PhD.
My dear colleagues: thank you very much for all the fun and for bearing me
during the stressful times. Thanks, Patricia for sharing all your expertise, thanks
Mike for all the hard work, help and expertise on mice and spending all this time
down there in the CBC. Thanks to Klaus and Kerrie for company in the CBC.
Thanks to Hesta and Annegret for their sorting support and to Andrea, Christoph,
Rebekka and the girls from the KMT ward for the scientific exchange and
discussions. I made a lot of good friends that contributed to the success of my
thesis: Miriam, Mirjam, Andreas, Stephan and more in Münster, Patricia,
Christine, Lisa, Klaus & Co. and more in Newcastle. Thanks for a great time!
Furthermore, my thanks go to all the collaborators for their help and support,
especially to Gilberto Almeida, Ian Wilson, Dr. Ross Maxwell, Dr. Chris Bacon
and Kieran O’Toole.
I would like to thank the Deutsche Krebshilfe, the Bone Cancer Research Trust,
the North of England’s Children’s Cancer Research Fund and the Newcastle
Healthcare Charity for funding parts of my studies.
My very special thanks go to my dear parents, my dear little brother Jan and the
rest of my siblings and family for always being such a great support, lending an
ear and taking so much care!

Table of Contents
iv
Table of Contents
Abstract ................................................................................................................. I
Acknowledgments ............................................................................................. III
Table of Contents ................................................................................................ iv
List of Figures ..................................................................................................... xii
List of Tables ...................................................................................................... xv
List of Abbreviations ..................................................................................... xviii
1. Chapter – Background and Introduction ................................................... 1
1.1 Ewing’s sarcoma ........................................................................................... 1
1.1.1 Epidemiology ......................................................................................... 2
1.1.2 Clinical presentation and diagnosis ....................................................... 3
1.1.3 Adverse factors and prognosis ............................................................... 5
1.1.4 Pathology ............................................................................................... 6
1.1.5 Genetic background ............................................................................... 7
1.1.5.1 Chromosomal translocations in Ewing’s sarcoma .................................... 8
1.1.5.2 Further aberrations .................................................................................. 10
1.1.6 Mechanisms of fusion transcripts in tumorigenesis ............................. 10
1.1.7 Potential cell of origin of Ewing’s sarcoma ........................................ 12
1.1.8 Current treatment and studies .............................................................. 15
1.2 Bone Biology .............................................................................................. 16
1.2.1 Bone structure ...................................................................................... 17
1.2.1.1 Molecular structure ................................................................................. 17
1.2.1.2 Cellular structure ..................................................................................... 20
1.2.1.3 Macroscopic structure ............................................................................. 22
1.2.2 Bone remodelling ................................................................................. 23
1.2.2.1 Initiation and activation of osteoclasts .................................................... 24

Table of Contents
v
1.2.2.2 Attachment of osteoclasts to and resorption of bone material ................ 26
1.2.2.3 Reversal ................................................................................................... 27
1.2.2.4 Formation of new bone material ............................................................. 28
1.2.3 Cancer metastasis to the bone .............................................................. 30
1.2.3.1 Clinical picture of bone metastases ......................................................... 31
1.2.3.2 General mechanisms of metastasis.......................................................... 31
1.2.3.3 Mechanisms of metastasis to the bone .................................................... 33
1.2.3.4 Metastasis in Ewing’s sarcoma ............................................................... 34
1.2.3.5 Degradation of extracellular matrix ........................................................ 35
1.2.3.6 Growth factors and cytokines ................................................................. 36
1.2.3.7 Chemokines and their receptors .............................................................. 37
1.3 The CXCL12/CXCR4-axis ......................................................................... 38
1.3.1 Role of the CXCL12/CXCR4 axis ...................................................... 39
1.3.2 The CXCL12/CXCR4 axis in cancer metastasis ................................. 41
1.3.3 Potential role of CXCL12/CXCR4 axis in Ewing’s sarcoma .............. 43
2. Chapter – Hypothesis and aims ................................................................. 45
3. Chapter – Materials and Methods ............................................................ 47
3.1 General devices and materials .................................................................... 47
3.1.1 Equipment ............................................................................................ 47
3.1.2 Material ................................................................................................ 48
3.1.3 Kits ....................................................................................................... 48
3.1.4 Chemicals ............................................................................................ 48
3.2 Microbiological work ................................................................................. 49
3.2.1 Bacteria ................................................................................................ 49
3.2.2 Plasmids ............................................................................................... 49
3.2.3 Media, additives and growth conditions .............................................. 50
3.2.4 Strain conservation .............................................................................. 51
3.2.5 Preparation of competent Escherichia coli .......................................... 52
Table of Contents
vi
3.2.6 Transformation of plasmids into competent Escherichia coli ............. 53
3.3 Nucleic acid methods .................................................................................. 54
3.3.1 Isolation of plasmid DNA from bacteria ............................................. 54
3.3.2 Isolation of plasmid DNA from bacteria under endotoxin-free
conditions ...................................................................................................... 55
3.3.3 Isolation of genomic DNA from mammalian cells .............................. 56
3.3.4 Isolation of RNA from mammalian cells ............................................. 57
3.3.5 Determination of the concentration of DNA and RNA samples ......... 58
3.3.6 Polymerase chain reaction ................................................................... 59
3.3.7 Digestion of DNA using restriction endonucleases ............................. 61
3.3.8 Hybridisation of DNA-oligo single strands ......................................... 62
3.3.9 Isolation of DNA-fragments from agarose gels ................................... 63
3.3.10 Ligation of DNA-fragments .............................................................. 64
3.3.11 Agarose gel electrophoresis for separation of DNA-fragments ......... 65
3.3.12 Reverse transcription polymerase chain reaction .............................. 66
3.3.13 Quantitative real time polymerase chain reaction.............................. 68
3.3.14 DNA polyacrylamide gel electrophoresis .......................................... 70
3.3.15 DNA sequencing ................................................................................ 71
3.4 Mammalian cell culture .............................................................................. 72
3.4.1 Cell lines .............................................................................................. 72
3.4.2 Culture media and supplements ........................................................... 73
3.4.3 Collagen coating of tissue culture plastic ............................................ 74
3.4.4 General cell culture and cell harvesting ............................................... 74
3.4.5 Cell counting ........................................................................................ 76
3.4.6 Cell cryopreservation ........................................................................... 77

Table of Contents
vii
3.5 In vitro assays on mammalian cells ............................................................ 78
3.5.1 Cytospin ............................................................................................... 78
3.5.2 Cell viability assay using MTT ............................................................ 78
3.5.3 Adhesion assay .................................................................................... 79
3.5.4 Cell cycle analysis ............................................................................... 81
3.5.5 Colony-forming assay .......................................................................... 82
3.5.6 Transfection of mammalian cells using LipofectaminTM .................... 83
3.5.7 Flow cytometry .................................................................................... 85
3.5.8 Fluorescence activated cell sorting (FACS) ........................................ 85
3.6 In vivo assays on mammalian cells ............................................................. 86
3.6.1 Keeping of animals .............................................................................. 86
3.6.2 Preparation of animals for surgical procedures ................................... 88
3.6.3 Intravenous transplantation .................................................................. 89
3.6.4 Intrafemoral transplantation ................................................................. 89
3.6.5 Positron emission tomography tracer preparation ............................... 90
3.6.6 Positron emission tomography ............................................................ 91
3.6.7 X-ray computed tomography ............................................................... 92
3.6.8 Magnetic resonance imaging ............................................................... 93
3.6.9 Dissection of mice ............................................................................... 94
3.7 Pathology .................................................................................................... 95
3.7.1 Immunohistochemistry ........................................................................ 95
3.7.2 Haematoxylin and Eosin staining ........................................................ 96
4. Chapter – Metastasis model for Ewing’s sarcoma in Non-obese
diabetic/Severe combined immunodeficient mice (NOD/Scid) ...................... 97
4.1 Introduction ................................................................................................. 97

Table of Contents
viii
4.1.1 Metastasis in Ewing’s sarcoma and patient outcomes ......................... 97
4.1.2 Mouse model systems in cancer research ............................................ 99
4.1.2.1 Nude Mice ............................................................................................. 100
4.1.2.2 Scid Mice .............................................................................................. 102
4.1.2.3 NOD/Scid Mice..................................................................................... 103
4.1.2.3 The established intravenous NOD/Scid mouse model .......................... 104
4.1.3 The principles of expression profiling ............................................... 106
4.1.3.1 Variations of gene expression data ....................................................... 110
4.1.3.2 Statistical and biological significance ................................................... 111
4.2 Aims .......................................................................................................... 111
4.3 Materials and Methods ............................................................................. 112
4.3.1 Tracer preparation and positron emission tomography (Münster) .... 112
4.3.2 Isolation of organ-specific subclones from metastases ..................... 113
4.3.3 Expression arrays ............................................................................... 114
4.3.3.1 Affymetrix U133 plus 2.0 array ............................................................ 114
4.3.3.2 Probe sets on the GeneChip .................................................................. 115
4.3.3.3 Planning the experiment and replicates ................................................. 115
4.3.3.4 Sample preparation ............................................................................... 116
4.3.4 Analysis of expression arrays ............................................................ 117
4.3.5 Further biological analysis ................................................................. 118
4.3.6 Microarray validation experiment using qRT-PCR ........................... 119
4.4 Results ....................................................................................................... 120
4.4.1 Intravenous transplantations and re-transplantation of subclones ..... 120
4.4.2 In vitro characterisation of tissue specific subclones ......................... 125
4.4.2.1 Validation of clones – flow cytometry and PCR of fusion transcripts .. 125
4.4.2.2 Colony assay ......................................................................................... 128
4.4.2.3 Cytospins ............................................................................................... 129
4.4.2.4 Further in vitro investigations ............................................................... 130
4.4.3 Expression profiling ........................................................................... 130

Table of Contents
ix
4.4.3.1 Analysis of comparisons between organ-subclones directly ................. 130
4.4.3.2 Analysis of comparisons between VH-64 and the derived subclones .. 134
4.4.3.3 Validation of microarray results with qRT-PCR .................................. 140
4.5 Discussion ................................................................................................. 143
4.6 Conclusions ............................................................................................... 148
5. Chapter – The role of CXCL12 in metastasis of Ewing’s sarcoma ...... 149
5.1 Introduction ............................................................................................... 149
5.1.2 RNA interference ............................................................................... 149
5.1.2.1 Gene expression control in eukaryotic cells .......................................... 150
5.1.2.2 Using shRNA for silencing of genes ..................................................... 154
5.1.3 The vector pEPI-1 and the promoter H1 ............................................ 155
5.2 Aims .......................................................................................................... 156
5.3 Methods and Materials ............................................................................. 157
5.3.1 Cloning strategy for the knockdown construct .................................. 157
5.3.2 Fluorescence activated cell sorting .................................................... 161
5.3.3. G418 selection of clones ................................................................... 161
5.4 Results ....................................................................................................... 162
5.4.1 Examination of stability of pEPI-EGFP in Ewing’s sarcoma cell lines
.................................................................................................................... 162
5.4.2 Verification of CXCR4-positivity of Ewing’s sarcoma cell lines ..... 165
5.4.3 Verification of knockdown plasmid-positive Ewing’s sarcoma cell
lines ............................................................................................................. 166
5.4.4 Selection of plasmid-positive cells .................................................... 167
5.5 Discussion ................................................................................................. 168
5.6 Conclusion ................................................................................................ 170
6. Chapter – Development, establishment and validation of preclinical
orthotopic mouse models for bone malignancies .......................................... 171

Table of Contents
x
6.1 Introduction ............................................................................................... 171
6.1.1 Further malignancies of the bone ...................................................... 171
6.1.2 Preclinical models for bone malignancies ......................................... 173
6.1.2.1 Preclinical models of primary bone malignancies ................................ 174
6.1.2.2 Orthotopic preclinical models for primary bone malignancies ............. 175
6.1.2.3 Preclinical models for CaP metastases of the bone ............................... 177
6.1.2.4 Development of the intrafemoral transplantation method ..................... 178
6.1.2.5 NSG mice .............................................................................................. 179
6.1.3 Imaging techniques ............................................................................ 181
6.1.3.1 Computed tomography .......................................................................... 182
6.1.3.2 Positron emission tomography .............................................................. 182
6.1.3.3 Magnetic resonance imaging ................................................................ 183
6.2 Aims .......................................................................................................... 184
6.3 Results ....................................................................................................... 185
6.3.1 Preliminary experiments .................................................................... 185
6.3.2 Reduction of background signal in positron emission tomography .. 190
6.3.3 Development of an orthotopic model for bone malignancies ............ 192
6.3.3.1 Induction of pathological new bone formation ..................................... 193
6.3.3.2 Malignant new bone formation ............................................................. 197
6.3.3.3 Induction of osteolytic lesions .............................................................. 199
6.3.3.4 Documentation of soft tissue involvement using MRI.......................... 201
6.4 Discussion ................................................................................................. 204
6.5 Conclusions ............................................................................................... 207
7. Chapter – General Discussion and Conclusions .................................... 209
7.1 General Discussion ................................................................................... 209
7.2 Future Directions ...................................................................................... 216
8. Chapter – Bibliography ............................................................................ 218
9. Chapter – Appendix .................................................................................... A
9.1 Abstracts and posters for scientific meetings .............................................. A

Table of Contents
xi
9.2 Internal Presentations ................................................................................... R
9.3 External Presentations ................................................................................. R
9.4 Publications ................................................................................................... S

List of Figures
xii
List of Figures
Figure 1.1: Age and sex distribution of patients with ES/PNET at the date of the
initial diagnosis. ..................................................................................................... 3
Figure 1.2: Skeletal dissemination of primary ES/PNET. ..................................... 4
Figure 1.3: Percentage dissemination of primary metastases to organs................. 6
Figure 1.4: Scheme of the proteins EWS and FLI1 as well as the EWS-FLI1
fusion protein type 1............................................................................................... 9
Figure 1.5: Scheme of the cross section of a typical human long bone ............... 19
Figure 1.6: Initiation of osteoclast formation ....................................................... 25
Figure 1.7: Control of bone formation in remodelling ......................................... 30
Figure 1.8: Hypothetical role of the CXCL12/CXCR4 axis in migration of
normal stem cells (SC) and metastasis of malignant stem cells (cancer SC). ...... 42
Figure 4.1: Event free survival of ES/PNET patients in correlation with existence
and localisation of metastases. ............................................................................. 98
Figure 4.2: Scheme for the workflow of expression analysis using an Affymetrix
GeneChip®. ........................................................................................................ 109
Figure 4.3: Scheme of transplantations and acquired metastases from primary
and secondary mice. ........................................................................................... 116
Figure 4.4: Representative PET images of a mouse transplanted intravenously
with the cell line VH-64. .................................................................................... 121
Figure 4.5: Mean time in days from transplantation to reaching of limits of the
protocol. ............................................................................................................. 124
Figure 4.6: CD99 staining and flow-cytometric control of subclones derived from
VH-64 transplanted mice. .................................................................................. 126

List of Figures
xiii
Figure 4.7: CD99 staining and flow-cytometric control of subclones derived from
TC-71 transplanted mice. ................................................................................... 127
Figure 4.8: Appearance of colonies. .................................................................. 128
Figure 4.9: Microscopic examination of cytospins. .......................................... 129
Figure 4.10: qRT-PCRs performed for the validation of the microarray
experiment. ......................................................................................................... 141
Figure 5.1: The RNAi pathway in vertebrate cells. ........................................... 151
Figure 5.2: Map of the pSUPER vector. ............................................................ 158
Figure 5.3: Map of the pEPI-EGFP vector. ....................................................... 160
Figure 5.4: Flow-cytometric verification of e-GFP positivity of
pEPI-EGFP-transfected TC-71 cells. ................................................................. 163
Figure 5.5: Examination of stability of pEPI-EGFP expression in TC-71 over
time. .................................................................................................................... 164
Figure 5.6: Examination of CXCR4 (CD184)-positivity of the ES cell lines VH-
64 and TC-71. .................................................................................................... 165
Figure 5.7: First examination of transfected cells using a fluorescence
microscope. ........................................................................................................ 167
Figure 6.1: Normal structure of a murine femur. ............................................... 186
Figure 6.2: PET/CT image of a VH-64 i. f. transplanted mouse. ...................... 187
Figure 6.3: PET/CT image of a TC-71 i. f. transplanted mouse. ....................... 188
Figure 6.4: PET/CT image of a PC3M i.f. transplanted mouse. ........................ 189
Figure 6.5: PET/CT images comparing inhalable and injectable anaesthesia. .. 191
Figure 6.6: Induction of new bone formation after VH-64 transplantation. ...... 194
Figure 6.7: Lysis of bone and induction of new bone formation after TC-71
transplantation. ................................................................................................... 195

List of Figures
xiv
Figure 6.8: Lysis of bone and induction of new bone formation after SaOS-2
transplantation. ................................................................................................... 197
Figure 6.9: Malignant bone formation within the tumour mass after SaOS-2
transplantation. ................................................................................................... 198
Figure 6.10: Osteolytic lesion caused by injection of PC3M. ........................... 200
Figure 6.11: MR imaging of VH-64 Ewing sarcoma of the injected femur
showing a larger extra-osseous tumour component. .......................................... 201
Figure 6.12: Metastases identified in histology. ................................................ 203
Figure 6.13: Series of three MRI images of the abdomen of a PC3M-transplanted
mouse. ................................................................................................................ 204

List of Tables
xv
List of Tables
Table 3.1: List of purchased and constructed vectors. ......................................... 50
Table 3.2: Recipe for Lysogeny broth (LB). ........................................................ 51
Table 3.3: Antibiotics and used concentrations. .................................................. 51
Table 3.4: Recipe for TSS buffer. ........................................................................ 53
Table 3.5: SOC-Medium. ..................................................................................... 54
Table 3.6: Recipe for PCR master mix. ............................................................... 59
Table 3.7: PCR cycling conditions....................................................................... 60
Table 3.8: Recipe for 10x Brady buffer. .............................................................. 60
Table 3.9: PCR primers for ES fusion transcript EWS-FLI1 (embedded PCR). . 61
Table 3.10: Recipe for restriction reactions. ........................................................ 61
Table 3.11: Hybridisation buffer used for DNA oligos. ...................................... 63
Table 3.12: Oligonucleotides for cloning of shRNA-plasmids, 5' - 3' (Purimex,
Grebenstein, Germany). ....................................................................................... 63
Table 3.13: Recipe for TBE buffer. ..................................................................... 66
Table 3.14: Recipe for the reaction mix for RT-PCR. ......................................... 67
Table 3.15: Recipe for RT-PCR reaction master mix. ......................................... 67
Table 3.16: Recipe for the qRT-PCR reaction mix. ............................................. 68
Table 3.17: qRT-PCR cycling conditions. ........................................................... 69
Table 3.18: Example for the recipe for an 8% TBE-PAGE gel. .......................... 70
Table 3.19: Sequencing primers. .......................................................................... 71
Table 3.20: Type and origin of cell lines. ............................................................ 73
Table 3.21: Recipe for PBS buffer. ...................................................................... 75
Table 3.22: Recipe for Trypsin/EDTA solution. .................................................. 75

List of Tables
xvi
Table 3.23: Recipe for cell dissociation buffer. ................................................... 76
Table 3.24: Recipe for cryopreservation medium. ............................................... 77
Table 3.25: Recipe for lysis buffer for mammalian cells. .................................... 79
Table 3.26: Recipe for PBS2+ solution. ................................................................ 80
Table 3.27: Recipe for adhesion medium. ........................................................... 81
Table 3.28: Recipe for RNAse A-solution. .......................................................... 82
Table 3.29: Recipe for serum-containing colony-forming assay medium. .......... 83
Table 4.1: Details of qRT-PCR primers from Sigma. ........................................ 119
Table 4.2: Ewing tumour formation in intravenously transplanted NOD/Scid
mice. ................................................................................................................... 122
Table 4.3: Pattern of metatstasis in tumour baring NOD/Scid mice. ................. 123
Table 4.4: Comparisons of gene expression between the different VH-64-derived
organ-specific subclones. ................................................................................... 131
Table 4.5: Genes differentially expressed in more than one comparison. ......... 132
Table 4.6 continued. ........................................................................................... 133
Table 4.7: Comparisons of gene expression between the parental cell line VH-64
and deriving subclones. ...................................................................................... 134
Table 4.8: Fold changes of genes differentially expressed in the organ-specific
subclones in comparison to the parental cell line VH-64. ................................. 136
Table 4.9: Top Canonical pathways associated with the comparisons between
VH-64 and the different organ-specific subclones. ............................................ 138
Table 4.10: Top biological functions of genes listed in the comparisons between
VH-64 and the different organ-specific subclones. ............................................ 139
Table 4.11: Notable genes flagging up in the different comparisons and their
most striking functions known so far. ................................................................ 147

List of Tables
xvii
Table 6.1: Experimental mice for the development of an orthotopic model for
bone malignancies. ............................................................................................. 192

List of Abbreviations
xviii
List of Abbreviations
APC – Allophycocyanin
BM – Bone marrow
BMPs – Bone Morphogenic Proteins
BSA – Bovine serum albumin
CaP – Carcinoma of the prostate
CD – Cluster of differentiation
CSC – Cancer stem cell
CT – Computed tomography
d – day
ddH2O – Distilled, deionised water
DMSO – Dimethylsulfoxide
dNTP – Deoxyribonucleotide triphosphate
ddNTP – Dideoxynucleoside triphosphate
E. coli – Escherichia coli
EDTA – Ethylediaminetetraacetic acid
eGFP – Enhanced green fluorescence protein
(EI)CESS – European Intergroup Cooperative Ewing’s Sarcoma Study
EMT – Epithelial-to-mesenchymal transition
ES – Ewing’s sarcoma
ES/PNET – Ewing’s sarcoma/Primitive neuroectodermal tumours
et al. – et alia (lat. and others)
EURO-E.W.I.N.G. – EUROpean Ewing tumour Working Initiative and National
Groups

List of Abbreviations
xix
FACS – Fluorescence activated cell sorting
FDG – 18F-2-Fluor-2-deoxy-D-glucose
FCS – Foetal calf serum
FITC – Fluorescein isothiocyanate
FOV – Field of view
FSC – Forward scatter parameter
G – Gauge, used to specify diameter of a needle
h – hour
IDDM – insulin-dependent diabetes mellitus
i. f. – Intrafemoral
i. p. – Intraperitoneal
IPA – Ingenuity pathway analysis
i. t. – Intratibial
i. v. – Intravenous
kVp – Peak kilovoltage
LB – Lysogeny broth
MMP1 - Matrix metalloproteinase 1
MMPs – Matrix metalloproteinases
MRI – Magnetic resonance imaging
MSC – Mesenchymal stem cell
MTT – 3-([4,5-Dimethylthiazol-2-yl]-2,5-dimethyltetrazoliumbromide
NOD – Non-obese diabetic
NSG – NOD.Cg-Prkdcscid Il2rgtm1Wjl/SzJ
OD – Optical density
OS – Osteosarcoma

List of Abbreviations
xx
PAA – Polyacrylamide
PAGE – Polyacrylamide gel electrophoresis
PBS – Phosphate buffered saline
PCR – Polymerase chain reaction
PE – Phycoerthrin
PET – Positron emission tomography
PNET – Primitive neuroectodermal tumours
qRT-PCR – quantitative reverse transcriptase polymerase chain reaction
RPMI – Roswell Park Memorial Institute medium
s. c. – Subcutaneous
scid – Severe combined immunodeficiency
SSC – Side scatter parameter
TBE – Tris/boric acid/EDTA buffer
TE – Echo time
TR – Repetition time
Only terms used more than three times were abbreviated. Gene names, general
biologic terms and SI units were not included.

Chapter 1 – Background and Introduction
1
1. Chapter – Background and Introduction
Ewing’s sarcoma/Primitive neuroectodermal tumour (ES/PNET) is a rare disease
and its diagnosis can still be fatal for patients. However, over the past decades
outcome of patients has significantly improved. While 30 years ago more than
90% of patients would die nowadays the long-term survival rates have improved
to 60-70% for patients with localised disease. Regardless, relapse rates of over
30% are still unacceptably high and these patients usually have a very poor
prognosis (Leavey et al., 2008). Patients with systemic disease still have a poor
prognosis (Paulussen et al., 2008).
Improved treatment of this malignant tumour has been achieved through
application of multimodal treatments including local management as well as the
introduction of chemotherapeutic approaches. The lack of alternatives to
chemotherapeutic treatment approaches shows the necessity of basic and
translational research to discover more specific, accurate, and effective targets
for molecular therapies and diagnosis of ES/PNET.
1.1 Ewing’s sarcoma
ES/PNET was first described by Lücke and Hildebrand but in 1921 the US-
American pathologist James Ewing was the first to publish an elaborate
characterisation of the disease which he described as a “diffuse endothelioma”
and an “endothelial myeloma”. This approach characterised the disease as being
distinct from lymphoma and other types of cancer (Lücke, 1866; Hildebrand,
1890; Ewing, 1921, 1924).

Chapter 1 – Background and Introduction
2
1.1.1 Epidemiology
ES/PNET is the second most common primary malignant tumour of the bone in
Caucasian children and adolescents with a median age at diagnosis of 15 years.
In the UK it accounts for 39% of primary malignant tumours of the bone with a
yearly incidence of approximately three new diagnoses per one million children
under the age of 15 years and approximately 2.4 new diagnoses per one million
adolescents between 15 and 25 years according to the (EI)CESS studies
(European Intergroup Cooperative Ewing’s Sarcoma Study). However, since new
molecular tools for diagnoses have been introduced, more and more cases of
unclassified sarcomas are identified as ES/PNET. This results in a growing
number of diagnoses of ES/PNET in patients older than 20 years and a
decreasing number of cases in patients aged 30 and older (Pieper et al., 2008).
More than 50% of new diagnoses are made for children and adolescents in their
second decade of life and men are affected with an overall ratio of 1.5:1, which
even increases with age (see Figure 1.1) However, data for the ratio between
male and female patients vary between different studies.

Chapter 1 – Background and Introduction
3
Figure 1.1: Age and sex distribution of patients with ES/PNET at the date of the initial
diagnosis. Data based on 1426 patients of the (EI)CESS studies; f; female; m, male; n, number
(Jürgens et al., 2006).
The incidence of ES/PNET in the African or Asian populations in very low,
suggesting a genetic predisposition, although the formal evidence for this is
limited (Fraumeni and Glass, 1970; Li et al., 1980; Hense et al., 1999).
1.1.2 Clinical presentation and diagnosis
Typically, patients present with diffuse pain which very often at first is thought
to be caused by a trauma or “growth pain”. However, there is no correlation
between ES/PNET and traumas. Usually, the pain increases with physical
activity but persists also in periods of recovery and during the night. This pain
advances and results from the expansion of the periosteum caused by the

Chapter 1 – Background and Introduction
4
formation of new bone which ultimately leads to a swelling of the effected
region. This swelling is very often misinterpreted as an inflammation.
The primary tumour is most frequently localised in the os ilium of the pelvis or
the long bones of the extremities with the femur being affected in 20% of the
cases (see Figure 1.2). Usually, the localisation in the long bones is diaphysial
opposed to the metaphysical localisation of osteosarcoma (Hauben and
Hogendoorn, 2010).
Figure 1.2: Skeletal dissemination of primary ES/PNET. Data based on 1426 patients of
(EI)CESS studies (modified from Bernstein et al., 2006).

Chapter 1 – Background and Introduction
5
Further symptoms include increased body temperature or, depending on
localisation and size of the tumour, neurological deficits. These symptoms are
more common in advanced and metastatic stages of the disease and can be of
indirect prognostic value (Widhe and Widhe, 2000; Bernstein et al., 2006).
The first tool for diagnosis of a suspected osseous lesion is imaging. Usually a
radiograph in two planes is performed and images are investigated for tumour
related osteolysis, Codman triangles (detachment of the periosteum from the
bone) and formation of new bone (spiculae of calcification in the soft tissue mass
of the tumour). To be able to more precisely evaluate the extent of the lesion and
the location of the tumour in relation to blood vessels and nerves, magnetic
resonance imaging (MRI) is performed (Bernstein et al., 2006).
1.1.3 Adverse factors and prognosis
Numerous factors are associated with poor prognosis in ES/PNET patients. The
most unfavourable marker, which is important to clarify during initial staging, is
the presence of metastases. Approximately, a quarter of patients present with
metastatic disease at the time point of diagnosis (see Figure 1.3; further discussed
in chapter 4). An additional important prognostic factor is age of the patient at
the time of diagnosis. Patients younger than 10 years have a better outcome than
older patients (Grier et al., 2003; Paulussen et al., 2007). A further unfavourable
factor is a tumour volume larger than 200ml. Very often this is the case for
tumours located in the pelvis as these are recognised and diagnosed relatively
late. The response of the tumour to chemotherapy can be evaluated after surgical
resection and gives evidence for prognosis as well (Paulussen et al., 2001).

Chapter 1 – Background and Introduction
6
The site of the primary tumour can also impact on prognosis. Patients with
tumours located in the axial skeleton have a worse prognosis than patients with
primary tumours in other sites as these are usually more difficult to treat and may
not come into consideration for surgery (Cotterill et al., 2000a).
Taking the evidence based importance of these adverse prognostic factors into
account several current therapeutic approaches and regimens are stratified
accordingly.
Figure 1.3: Percentage dissemination of primary metastases to organs. Data based on 1426
patients of (EI)CESS studies (modified from Bernstein et al., 2006).
1.1.4 Pathology
Macroscopically, ES cells of the bone, primitive neuroectodermal tumours
(PNET) and Askin’s tumours of the thoracic wall are histochemically
characterised through a monomorphic appearance of small blue round cells
lung 10% bone/bone
marrow10%
combined/ other6%
no 74%
Primary metastases
Chapter 1 – Background and Introduction
7
(routine hematoxylin and eosin staining). This predominance of blue staining is
due to the fact that the tumour cells consist predominantly of a nucleus and scant
cytoplasm. The existing glycogen inclusions can be visualised through periodic
acid-Schiff staining (Roessner and Jürgens, 1993).
When characterising cells of these types of tumours immunhistochemically, 95%
show positivity for the MIC2-antigen (CD99). However, CD99 is also expressed
by other cell types and has a high incidence of expression in myeloid
haematopoietic neoplasms. This limits the use of CD99 for differential diagnosis
(Zhang et al., 2000).
To be able to further distinguish between the different tumour types, the presence
of neuronal markers is also tested. Tumours that lack neuronal markers are
termed as classical ES. However, tumours with two or more neuronal markers
such as S-100 protein, neuron-specific enolase or synaptophysin are named
PNET (Schmidt et al., 1991).
Today, the World Health Organisation classification no longer distinguishes
between the three types of tumours as their biology is very similar and there is no
evidence that the prognosis for patients with PNET and Askin’s tumours differs
from prognosis for patients with classical ES. Therefore, the currently used term
is Ewing’s sarcoma/primitive neuroectodermal tumours (ES/PNET; Dirksen and
Jürgens, 2010).
1.1.5 Genetic background
Regardless of neuronal markers, ES/PNETs are classified as a biologic entity
through the common chromosomal translocation they harbour. They represent

Chapter 1 – Background and Introduction
8
the first group of sarcomas for which a chromosomal translocation was
characterized (Delattre et al., 1992, 1994). This molecular similarity is widely
believed to play a major role in tumour pathology and biology.
1.1.5.1 Chromosomal translocations in Ewing’s sarcoma
CD99-positive tumours are classified as ES/PNET+ve when a translocation
exists between the EWS gene (Ewing’s sarcoma breakpoint region 1, also known
as EWSR1) at 22q12 and a member of the ETS (E26 transformation specific
gene) family of transcription factors. In 85% of ES/PNET cases a translocation
t(11;22)(q24;q12) is detected which fuses EWS to the gene FLI1 (Friend
leukaemia virus integration 1). This results in the fully functional but aberrant
fusion transcript EWS-FLI1 (Delattre et al., 1992; Zucman et al., 1993; Delattre
et al., 1994). In half of such cases, this translocation results in a fusion protein
consisting of the first 264 N-terminal amino acids of the EWS protein
(breakpoint in intron 7) and the 233 C-terminal amino acids of FLI1 (breakpoint
in intron 5), which is termed “type 1” fusion protein (see Figure 1.4). There are
further EWS-FLI1 fusion proteins involving slightly different breakpoints of the
two genes (Delattre et al., 1992; Plougastel et al., 1993; Zucman et al., 1993).

Chapter 1 – Background and Introduction
9
Figure 1.4: Scheme of the proteins EWS and FLI1 as well as the EWS-FLI1 fusion protein
type 1. DNA-BD, DNA-binding domain; Pro, proline-rich activation domain; PTD, pointed
domain; RGG, arginine-glycine-glycine-rich region; RRM, RNA-recognition motif; SYQC,
serine-tyrosine-glutamine-glycine-rich region; ZN, zinc finger (modified from (Janknecht, 2005).
All possible EWS-FLI1 translocations create fusion proteins consisting of the
potent transactivation domain of the EWS protein and the DNA binding and
proline-rich transcription-advancing domains of FLI1. Thus, the aberrant fusion
proteins are potent transcription factors that are capable of binding to DNA
(Bailly et al., 1994; Mao et al., 1994; Lessnick et al., 1995).
Approximately 10% of ES/PNETs harbour a t(21;22)(q22;q12) translocation
between EWS and the ETS gene ERG (ETS-related gene). Further translocation
partner genes of EWS include ETV1 (ETS variant gene 1), FEV (fifth Ewing’s
sarcoma variant) and E1AF (E1A enhancer binding protein) (Jeon et al., 1995;
Kaneko et al., 1996; Peter et al., 1997; Sorensen et al., 1994; Urano et al., 1996;
Zucman et al., 1993). All different forms of translocations produce chimeric
proteins that function as potent aberrant transcription factors because the
transactivation domain of EWS is fused to a DNA-binding domain of a member
of the ETS-family of transcription factors (Uren et al., 2004a; Janknecht, 2005).

Chapter 1 – Background and Introduction
10
Recently, it has been shown that neither the fusion partner nor the different
breakpoints (different types of EWS/FLI) are of prognostic relevance (Le Deley
et al., 2010; van Doorninck et al., 2010).
1.1.5.2 Further aberrations
In 80% of the cases there are molecular abnormalities discovered in addition to
the characteristic translocations between EWS and members of the ETS family of
transcription factors (Roberts et al., 2008). However, numbers vary in different
studies. In the majority of cases these non-random chromosomal aberrations are
chromosomal gains with number changes. Most often a trisomy of chromosome
8, as well as chromosomes 2, 12 and 20 can be detected. Additional structural
aberrations are less common and appear as unbalanced rearrangements involving
chromosomes 1 and 16 with a net gain of 1q and loss of 16q (Hattinger et al.,
2002). Different studies suggest that these chromosomal gains may be of
prognostic value or may even lead to a worse prognosis for patients (Armengol et
al., 1997; Hattinger et al., 2002; Roberts et al., 2008).
1.1.6 Mechanisms of fusion transcripts in tumorigenesis
In vitro studies have proven that the EWS-ETS fusion proteins contribute to
tumorigenesis and behave as oncoproteins. This was established using NIH3T3
cells transformed following transfection and ectopic expression of EWS-FLI1
(May et al., 1993a, 1993b; Lessnick et al., 1995; Thompson et al., 1999).
Chapter 1 – Background and Introduction
11
Furthermore, antisense experiments in ES/PNET cells led to growth impairment,
increased apoptosis rates and prevention of tumour formation in vivo proving that
the fusion protein is also critically important for maintaining the ES/PNET
phenotype (Lambert et al., 2000; Prieur et al., 2004; Siligan et al., 2005).
Recently, development of new techniques has allowed detailed investigations of
direct and indirect downstream target genes of chimeric fusion proteins,
including investigations elucidating the function of EWS-FLI1 as an aberrant
transcription activator and repressor. Amongst other functions, genes that are
transactivated are involved in cell survival and proliferation, such as IGF1
(Cironi et al., 2008) and Myc (Sollazzo et al., 1999), or differentiation (SOX2;
(Riggi et al., 2010). Repressed genes include, amongst others, TGFB2 (Hahm,
1999) and IGFBP3 (Prieur et al., 2004).
Important cellular signalling pathways activated in ES/PNET include amongst
others the Wnt signalling pathway and the insulin growth factor 1 (IGF1)
mediated tyrosine kinase pathway. In ES/PNET cell lines Wnt/Frizzled-
signalling has been shown to be functional with the canonical Wnt/β-catenin
signalling enhancing motility of cells and thus probably contributing to
metastasis of ES/PNET (Uren et al., 2004b; Endo et al., 2008; Navarro et al.,
2010). The interplay of IGF1 and its receptor IGF1R and subsequently
downstream targets of this pathway have been shown to be effected by EWS-
FLI1 knockdown (Herrero-Martín et al., 2009). This in turn influences growth
and maintenance of the tumour.
Other functions of fusion transcripts and proteins are currently further
investigated, including RNA binding, aberrant RNA splicing and protein-protein
interactions (Watson et al., 1997; Yang et al., 2000; Toretsky et al., 2006).

Chapter 1 – Background and Introduction
12
Although progress has been made in identifying downstream targets, it has
become clear that the identification of the cell of origin in ES/PNET is
immensely important. It is possible to transform the immortalised cell line
NIH3T3 but so far transformation experiments with native murine and human
fibroblasts has not been successful, primarily because expression of EWS-FLI1
leads to cell cycle arrest (Lessnick et al., 2002).
All this underlines the importance of further investigations for the cell of origin
as the fusion transcript seems to have different effects on varying cell types.
Furthermore, in this context the role of additional aberrations has to be kept in
mind as well.
1.1.7 Potential cell of origin of Ewing’s sarcoma
As mentioned before, all ES/PNET harbour an in-frame EWS-ETS translocation.
This translocation and the resulting fusion transcripts act on the affected cells
with complex mechanisms of which the function as an aberrant transcription
factor is best known. The specificity of the EWS-FLI1 and other EWS-ETS
fusions for ES/PNET tumours suggests that the cell of origin is critical for
EWS-FLI1-induced oncogenesis. However, despite elaborate and extensive
investigations the cell of origin is currently still unknown (Prieur et al., 2004).
On the one hand, historically and histologically, for a long time ES/PNET has
been thought to be of neuroectodermal origin as early neural markers and other
features can be detected that are typically found in primitive neuroectodermal
cells (Cavazzana et al., 1987). Although these findings strongly suggested the
origin to be neuroectodermal the fact that these neural markers are just found in a

Chapter 1 – Background and Introduction
13
minority of cases and the fact that EWS-FLI1 induces neuroectodermal
differentiation and upregulation of a number of genes associated with early
neural differentiation raise the assumption that the cell of origin might not
necessarily be of neuroectodermal origin (Teitell et al., 1999; Hu-Lieskovan et
al., 2005b). This is why, the finding suggest that occasional neuroectodermal
features of ES/PNET cells are a direct result of the fusion transcrips rather than
the cell of origin.
On the other hand, there is evidence that ES/PNET might originate from a
mesenchymal stem cell (MSC). As all bones of the skeleton except the cranial
bones and the cells of the bone marrow originate from the mesenchyme and
ES/PNET most often arise in the long bones or the pelvis it seems to be plausible
that the cell of origin of ES/PNET is a resident of the bone. Besides, MSC from
the bone marrow show some characteristics of neuroectodermal cells (Olsen et
al., 2000; Takashima et al., 2007) which could explain neuroectodermal features
of ES/PNET cells. Admittedly, the term of MSCs is not exact enough. One of the
problems is that extraction of MSCs from bone marrow leads to a mixture of
cells enriched from all adherent cells through selection of specific surface
markers (Bianco et al., 2008; Lin et al., 2011). This implies that more defined
extraction terms will have to be identified as there is evidence of more than one
type of pluripotent non-haematopoietic cell within the bone marrow (Colter et
al., 2001; Jiang et al., 2002). The current definition of MSC is that of multipotent
stem cells that are able to differentiate into mature cell types, including
osteoblasts, chondrocytes (cartilage cells) and adipocytes (fat cells) (Beyer Nardi
and da Silva Meirelles, 2008).

Chapter 1 – Background and Introduction
14
However, approaching from the opposite side, a subpopulation of CD133+
tumour cells from ES/PNET has been identified and characterised. These are
characterised through a high degree of plasticity similar to MSCs and are able to
initiate and promote the growth of tumours in in vivo experiments with
immunodeficient mice (Suvà et al., 2009).
Furthermore, there is more direct evidence supporting the hypothesis of a MSC-
like cell as origin of ES/PNET. EWS-FLI1 knockdown experiments in ES/PNET
cell lines leave the cells with the ability to differentiate into a range of
comparable cell types as MSCs are able to differentiate into (Tirode et al., 2007).
The identified “core” EWS-FLI1 transcriptional pattern achived through
knockdown of the fusion transcript could be shown to resemble the one of human
MSCs (Hancock and Lessnick, 2008; Kauer et al., 2009).
Additionally, knock-in experiments with murine MSCs produce transformed
cells that form sarcomas in vivo (Castillero-Trejo et al., 2005; Riggi et al., 2005).
Transfection of human MSCs did not lead to tumour formation after
transplantation into immunocompromised mice but the cells took on an
ES/PNET -like morphology and CD99 expression was upregulated (Miyagawa et
al., 2008; Riggi et al., 2008).
It seems that due to the additional genetic changes in ES/PNET cells these cannot
be reverted to normal MSCs by a simple knockdown of EWS-FLI1. Although a
lot of data is suggestive that MSCs are the cell of origin for ES/PNET additional
studies are necessary and the phenotype for extraction of MSCs needs to be
further defined. This leads to the assumption that they cannot yet be definitely
understood as the cell of origin (Lin et al., 2011).

Chapter 1 – Background and Introduction
15
1.1.8 Current treatment and studies
Shortly after the first description of ES/PNET it was clear that the tumours are
sensitive to radiotherapy (Ewing, 1939). However, only since the 1970s it was
possible to achieve a cure of the disease and increase survival rates because
multimodal multidisciplinary treatment was developed applying neoadjuvant
systemic chemotherapy and local therapy consisting of surgery and/or
radiotherapy (Stiller et al., 2001). Today, current regimens reach a 5-year
survival of up to 75% of patients with localised disease (Paulussen et al., 2001).
Currently, surgical therapy following initial chemotherapy is performed when the
primary tumour is located in the extremities, the thoracic wall or the pelvis as
long as the sacrum is not involved. Through the development of novel surgical
techniques, including amongst others extendable endoprostheses for children and
adolescents, nowadays, limb salvage can often be achieved (Kotz et al., 2002).
Postoperative radiotherapy care has to be considered and the dosage depends on
histologic response of the tumour to chemotherapy and the success of surgery.
The combination of surgery and radiotherapy opposed to radiotherapy alone
increases survival rates by 15-20% (Schuck et al., 2003).
First studies in the early 1960s proved the sensitivity of ES/PNET to cytostatics
(Sutow and Sullivan, 1962). About a decade later, first combinations of
cytostatics were tested in clinical trials and a combination of VACD (vincristine,
actinomycin D, cyclophosphamide, doxorubicin) soon became standard in many
trials for non-metastatic disease. Local control and event free survival could be
improved but at the same time increased doses of doxorubicin lead to greater
cardiac morbidity (Nesbit et al., 1990; Burgert et al., 1990).

Chapter 1 – Background and Introduction
16
Subsequently, inclusion of ifosfamide (I) and etoposide (E) showed improvement
of ES/PNET of patients with localised disease as well as better prognoses for
relapsed patients (Craft et al., 1998; Grier et al., 2003).
During the course of the EICESS-92 trial patients were divided into standard risk
and high risk groups (tumour volume </≥ 200ml). Standard risk patients did not
benefit from the VAID regime opposed to VACD and there was no significant
benefit for high risk patients when treated with an EVAID regime compared to
patients treated with VAID. Despite the insufficient power of the study, however,
etoposide might be beneficial to those patients (Paulussen et al., 2008).
To be able to recruit more patients the EURO-E.W.I.N.G.99 (EUROpean Ewing
tumour Working Initiative of National Groups - Ewing tumour studies 1999) trial
was initiated bringing together major European study groups. The aims of the
study are to address whether further increases in treatment intensity will lead to
further benefits for patients as well as to further improve survival of patients with
poorer prognosis and to decrease long-term effects of toxicity. Furthermore, the
effect of a myeloablative therapy with haematopoietic stem cell rescue in high
risk patients will be investigated (Rodriguez-Galindo et al., 2003).
Up to today it is not possible to make a reliable statement about the outcome of
the study although first results are published (Ladenstein et al., 2010) and final
results are awaited to be published.
1.2 Bone Biology
One of the major specialised tissues of the human body is bone, a composite
tissue of inorganic materials, organic matrix and cells. Bone does not only have a

Chapter 1 – Background and Introduction
17
mechanical function of giving the body structural support, allowing movement
by supporting musculature and protecting vital organs but also has biological and
metabolic functions. These functions include maintenance of mineral
homeostasis and acid-base balance as well as keeping a reservoir of growth
factors and cytokines. Furthermore, bone provides within the bone marrow cavity
an environment for haematopoiesis (Clarke, 2008).
1.2.1 Bone structure
There are two different types of bone structure. Trabecular bone (also referred to
as cancellous or spongy bone) is made of characteristic irregular branches giving
it a honey comb appearance. The emerging cavity contains the bone marrow.
Due to its fine branches and the close proximity to the bone marrow, trabecular
bone is more metabolically active than cortical bone.
Trabecular bone is surrounded by cortical bone giving bones the typical smooth,
white appearance. It makes up 80% of the dry weight of the total bone mass and
accounts for the mechanic stability of bones due to its compactness (Safadi et al.,
2009).
1.2.1.1 Molecular structure
The inorganic compound makes up 60% of the try weight of bone tissue and
consists mainly of crystalline calcium phosphate salts (hydroxyapatite,
Ca10(PO4)6(OH)2), carbonate, fluoride, magnesium, acid phosphate and citrate.
Chapter 1 – Background and Introduction
18
To resist applied forces, calcium hydroxyapatite crystals are arranged in parallel
to collagen fibres. This orientation maximises resistance to stretch (type I
collagen) and compression (calcium hydroxyapatite salt) forces (Sela et al., 1987;
Safadi et al., 2009).
The organic matrix produces mainly type I collagen which is synthesised
intracellularely as tropocollagen. When cells export tropocollagen, fibrils are
formed. Proteoglycans, glycoproteins, phospholipids, phosphoproteins and
various growth factors are part of the organic matrix as well. This means besides
mechanical functions bone tissue also fulfils the function as a reservoir for
inorganic ions and is involved in metabolic processes through the active
participation in the calcium/phosphate balance and release of growth factors and
other components resting within the bone tissue (Safadi et al., 2009).
According to the pattern in which collagen and other proteins form the osteoid,
there are two types of bone tissue – woven and lamellar bone. Woven bone is
characterised by a rather high number of osteocytes and a disorganised
appearance due to randomly orientated collagen fibres. This disorganisation
accounts for a weaker structure. It is mainly found in sites of rapid growth such
as the embryonic skeleton and later at sites of fractures (Price et al., 1994).
Lamellar bone is the mature form of bone which grows slowly and in parallel
lines of deposited bone, the collagen fibres are highly organised and run in
opposite directions to maximise mechanical stability. Usually it is deposited on
pre-existing bone (Khurana and Safadi, 2009).
The secondary structure of lamellar bone accounts for the high level of
organisation of compact bone (see Figure 1.5).

Chapter 1 – Background and Introduction
19
Figure 1.5: Scheme of the cross section of a typical human long bone (Standring and Gray,
2008).
The part of the bone formed by compact bone (surrounding the trabecular bone
part in the centre of the bone) consists of closely packed osteons (also called
Haversian systems). Each osteon consists of a Haversian canal in the centre
through which blood and lymphatic vessels as well as nerves run. The canal is
surrounded by 5-15 concentric layers, or lamellae, of compact bone tissue
arranged in parallel to the long axis of the bone. Volkmann’s canals connect
Haversian canals to each other as well as to the blood system of the body (Safadi
et al., 2009).
Between layers osteocytes are located in spaces termed lacunae. These are
interconnected through canaliculi and connected to the Haversian channel to
provide all cells equally with nutrition. The entity of tubular osteons is
surrounded by outer circumferential lamellae that lie underneath the periosteum
and in parallel to it. The periosteum is a fibrous layer coating the entire bone

Chapter 1 – Background and Introduction
20
except at joints where articular cartilage covers the bone surface. It consists of an
outer connective tissue layer containing fibroblasts, nerves and blood vessels
supplying the bone tissue and an inner cambium layer containing osteoprogenitor
cells.
The inner circumferential lamellae are located next to the endosteum, which is a
membranous layer. The endosteum covers the inner surface of cortical bone,
trabecular bone and the Haversian and Volkmann’s canals and contains blood
vessels, osteoblasts and osteoclasts (Clarke, 2008; Safadi et al., 2009).
The rods and plates forming the structure of trabecular bone consist of so-called
packets (trabecular osteons). These have a semilunar shape and consist of
concentric lamellae.
1.2.1.2 Cellular structure
The existence of bone and its continuous remodelling relies on the precise
equilibrium between the different types of cells present in this tissue.
Within the bone marrow there is a small population of MSCs which are distinct
from the haematopoietic stem cells. These MSCs are capable of giving rise to
various cell types one of them being osteoprogenitor cells. Osteoprogenitor cells
differentiate to different cell types (Pittenger et al., 1999). One of those cell types
is the osteoblast which is a bone-forming, large and mononuclear cell that
deposits osteoid (organic bone matrix). This is why one of the characteristics of
osteoblasts are large Golgi structures and an extensive endoplasmic reticulum.
Subsequently, the osteoid becomes mineralised through the secretion of alkaline
phosphatase and non-collageneous, calcium- and phosphate-binding proteins.

Chapter 1 – Background and Introduction
21
However, osteoblasts are heterogeneous in their expression of gene patterns
which may explain different microarchitecture of skeletal sites, site-specific
disease manifestation and regional differences in response to drug treatments
(Harada and Rodan, 2003; Clarke, 2008).
Another type of cell is the osteocyte which resides within the bone tissue and
maintains the structure of it. It originates from formerly active osteoblasts and
changes shape throughout the production of mineralised bone. When trapped in
the lacunae between the lamellae of bone osteocytes keep in contact with each
other via canaliculi (Safadi et al., 2009).
Furthermore, there are protective lining cells that cover the surface and are
thought to be quiescent osteoblasts. They form the endosteum and underlie the
periosteum on mineralised bone. Usually, lining cells are found in close
proximity to osteoblasts and interact with those (Clarke, 2008).
Osteoclasts are antagonising osteoblasts. They are multinucleated and originate
from mononuclear precursor cells of the monocyte-macrophage lineage (Boyle et
al., 2003). Osteoclasts are able to bind to the bone surface because they express
integrin receptors that bind collagen, fibronectin and laminin of the bone matrix
(Ross and Teitelbaum, 2005). Upon binding to the bone matrix, the osteoclast
becomes polarised and apical a ruffled border is formed. The cytoskeleton of the
osteoclast forms a ring to seal in the periphery of the osteoclast’s attachment to
the bone surface (Howship’s lacuna or resorption pit). Subsequently, acidified
vesicles export proteins via the ruffled border into the Howship’s lacuna.
Amongst others matrix metalloproteinases (such as MMP-1) and cathepsins
(such as pro-cathepsin K) are secreted, the latter of which are activated through
exocytosis within the acidic milieu of the Howship’s lacunae. The acidified
Chapter 1 – Background and Introduction
22
condition is achieved through secretion of H+ ions via H+-ATPase and chloride
channels (Väänänen et al., 2000). While enzymes cause resorption of the organic
part of the bone matrix, the acidic milieu leads to solubilisation of the crystalline
calcium hydroxyapatite.
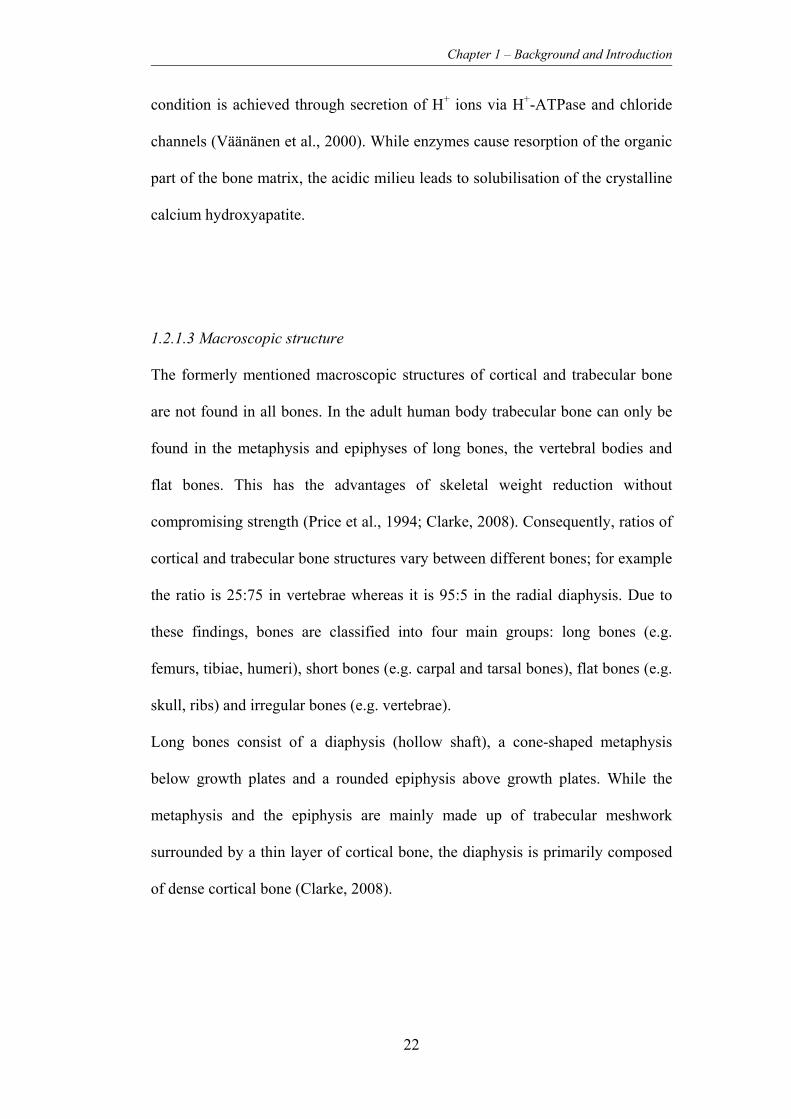
1.2.1.3 Macroscopic structure
The formerly mentioned macroscopic structures of cortical and trabecular bone
are not found in all bones. In the adult human body trabecular bone can only be
found in the metaphysis and epiphyses of long bones, the vertebral bodies and
flat bones. This has the advantages of skeletal weight reduction without
compromising strength (Price et al., 1994; Clarke, 2008). Consequently, ratios of
cortical and trabecular bone structures vary between different bones; for example
the ratio is 25:75 in vertebrae whereas it is 95:5 in the radial diaphysis. Due to
these findings, bones are classified into four main groups: long bones (e.g.
femurs, tibiae, humeri), short bones (e.g. carpal and tarsal bones), flat bones (e.g.
skull, ribs) and irregular bones (e.g. vertebrae).
Long bones consist of a diaphysis (hollow shaft), a cone-shaped metaphysis
below growth plates and a rounded epiphysis above growth plates. While the
metaphysis and the epiphysis are mainly made up of trabecular meshwork
surrounded by a thin layer of cortical bone, the diaphysis is primarily composed
of dense cortical bone (Clarke, 2008).

Chapter 1 – Background and Introduction
23
1.2.2 Bone remodelling
Throughout life, bone tissue is constantly remodelled giving it an adaptive and
regenerative capacity. Remodelling of bone takes place alongside the processes
of growth and skeletal modelling taking place in childhood. This means,
remodelling already starts before birth and continues until death. It is achieved
through the simultaneously, and normally counterbalanced, processes of bone
formation and resorption (Clarke, 2008; Safadi et al., 2009).
There are different aspects of the randomness of remodelling sites in the human
skeleton. On the one hand, to achieve one of the goals of remodelling, i.e.
maintaining the balance of essential minerals, remodelling does not have to target
a specific site and thus mostly occurs randomly. On the other hand, to achieve
the goals of maintenance of stability, adaption to mechanical stress and repair of
damage, remodelling has to be targeted (Burr, 2002).
Studies with genetically modified mice have shown that net bone formation
occurs when mice are deficient for normal osteoclasts. Net resorption takes place
when mice cannot develop fully functional osteoblast. This suggests that the two
types of cells do not require each other to function or be activated but that
balance in bone metabolism can only be achieved with both cell types controlling
each other (Corral et al., 1998; Kong et al., 1999). In humans defects in the fine
equilibrium of bone remodelling leads to a variety of different bone diseases
including osteoporosis, osteopetrosis and Paget’s disease.
The process of remodelling not only involves osteoclasts and osteoblasts but as
well osteocytes and lining cells. The tightly coupled cells function together as the
basic multicellular unit and perform the four sequential phases of remodelling:
initiation, resorption, reversal and formation.

Chapter 1 – Background and Introduction
24
However, due to the complexity of remodelling this subchapter can only
selectively highlight some of the more important processes of remodelling (Sims
and Gooi, 2008).
1.2.2.1 Initiation and activation of osteoclasts
Haematopoietic myelomonocytic osteoclast precursor cells are attracted to the
site of remodelling, where they fuse and subsequently bind to the bone surface as
multinucleated cells (see Figure 1.6). Cells of the osteoblasts lineage
(pre-osteoblasts, mature osteoblasts, lining cells and osteocytes) play a critical
role in each of those steps (Sims and Gooi, 2008).F
One the one hand, chemoattractants released by the osteoblast-lineage are
responsible for the control of the movement of osteoclast-precursors towards
each other and the bone surface. These factors might be directly released by
osteoblasts and/or lining cells, bone matrix-derived (osteocalcin,
α2 HS-glycoprotein, collagen I fragments, aging of bone resulting in
isomerisation of collagen I) or set free through apoptosis of osteocytes (see
further below). In more detail, factors released by osteoblast-lineage cells include
CXCL12 (chemokine (C-X-C motif) ligand 12; also referred to as SDF-1,
stromal-derived factor 1), CCL3, CCL5 and CCL7 (chemokine (C-C motif)
ligands 3, 5 and 7). In addition to promotion of osteoclast formation these factors
increase chemotaxis of osteoclast-precursors in vitro (Yu et al., 2003, 2004). It
could also be shown that some of these factors play a role in osteoclast-precursor
attraction in pathological conditions such as multiple myeloma or bone
metastases caused by breast and prostate cancer, but their role in

Chapter 1 – Background and Introduction
25
non-pathological remodelling remains to the greatest extend unclear (Aggarwal
et al., 2006; Guise et al., 2006).
Figure 1.6: Initiation of osteoclast formation (osteoclast-lineage cells shown in red shades,
osteoblast-lineage cells shown in blue shades). Proliferation of osteoclast precursors (light red
cells) and expression of RANK is stimulated through CSF-1 produced by osteoblasts. Locally
acting factors such as IL-11, OSM, PGE2 and PTHrP (grey arrow) and microdamage-induced
osteocyte apoptosis (lightning) induce RANKL (receptor activator of NF-κB ligand) expression
on osteoblasts. chemoattractants (blue arrows) released from osteoblast-lineage cells and bone
matrix attract osteoclast precursors. Resulting interaction between RANKL and RANK leads to
expression of fusion proteins (green blocks). Lining cells (light blue) prepare the bone surface
(collagenases) and lift off to form the bone remodelling compartment, in which osteoclast
precursors enter. They attach to the bone surface as resorbing osteoclasts (red cell) (Sims and
Gooi, 2008).
A lot of cytokine receptors that stimulate bone resorption through initiation of
osteoclast formation are expressed in cells of the osteoblast-lineage. This proves

Chapter 1 – Background and Introduction
26
that at least to parts osteoblast-lineage cells are required for the formation and
activation of osteoclasts (Suda et al., 1999). Subsequent to osteoblasts binding,
indirectly acting osteoclast-activating factors like IL-11 (interleukin 11), PGE2
(prostaglandin E2), OSM (oncostatin M) and PTHrP (parathyroid hormone-
related protein), intracellular signalling is activated. In most cases intracellular
signalling results in osteoclast-activation mediated through RANKL (receptor
activator of NF-κB ligand) which is presented on the osteoblast cell surface. A
further important factor produced by osteoblasts is the soluble TNF receptor
superfamily member OPG (osteoprotegerin), which inhibits osteoclast formation
(Yasuda et al., 1998; Horwood et al., 1998; Liu et al., 1998; Palmqvist et al.,
2002). The very complex interactions leading to the activation of osteoclasts are
only described to parts in Figure 1.6.
Further to released factors, the interruption of a physiological link between
osteocytes and existing osteoclasts, as well as the release of certain factors such
as cytokines and prostaglandins through apoptosis of osteocytes, might trigger
the osteoclast formation (Sims and Gooi, 2008).
1.2.2.2 Attachment of osteoclasts to and resorption of bone material
Attachment of osteoclasts to the bone surface depends on the activity of
terminally differentiated lining cells deriving from the osteoblast-lineage. These
lining cells are thought to prepare the bone surface for resorption by releasing
collagenase to destroy the fine layer of non-mineralised matrix on which they are
located (Chambers and Fuller, 1985). This causes the lift off of lining cells from
the bone surface and formation of a cover underneath which a space is created.

Chapter 1 – Background and Introduction
27
This space serves as a temporary bone remodelling compartment where the bone
surface is exposed to osteoclasts for resorption as well as to osteoblasts for
subsequent bone formation, but it still remains unclear, how both cell types enter
the bone remodelling compartment. It has to be mentioned that the bone
remodelling compartment is highly supplied with blood vessels indicating that
stromal derived osteoblasts might be able to arrive via the blood stream (Parfitt,
2001; Sims and Gooi, 2008).
The attachment itself occurs when osteoclast-expressed integrins bind to an
arginine-glycine-aspartic acid sequence of bone matrix proteins such as
osteopontin and bone sialoprotein which have been laid down within the matrix
by osteoclasts in previous cycles of remodelling (Ross and Teitelbaum, 2005).
Polarisation of the osteoclast attached to the bone surface and sealing of the
resorptive pit allows directed and selective resorption (see chapter 1.2.1.2).
When resorption and recycling of matrix components is completed, osteoclasts
die through apoptosis and detach from the bone surface. Currently, it is unknown
whether the apoptotic process is initiated by the osteoclast itself or whether the
osteoblast-lineage cells are involved.
1.2.2.3 Reversal
The process of reversal is still not known entirely. After apoptosis of osteoclasts
mononuclear cells of unknown origin enter the resorptive pit. These are thought
to be haematopoietic phagocytes as well as osteoblast-lineage cells that might
complete the process of resorption through release of MMPs and serine proteases

Chapter 1 – Background and Introduction
28
as well as prepare the bone surface by formation of a “reversal line” (Tran Van et
al., 1982; Everts et al., 2002).
Amongst several influences that activate osteoblasts, osteoclast-secreted factors
play a role in this activation (Matsuo and Irie, 2008) as well as factors released
from the bone matrix during resorption (see Figure 1.7). These factors include
IGF-1 and -2 (insulin-like growth factor 1 and 2), BMPs (bone morphogenic
proteins) (Schmid et al., 1992; Harris et al., 1994).
The process of reversal requires more detailed research to be entirely understood.
1.2.2.4 Formation of new bone material
To achieve bone formation osteoblasts have to mature from progenitors.
Osteoblastogenesis has been shown to be influenced by a number of different
pathways. One of the more prominent ones is the Wnt/β-catenin pathway (also
referred to as canonical wnt (wingless) signalling) which mediates cell fate
determination, proliferation and survival through increase of β-catenin levels.
Furthermore, alteration of the expression pattern of genes occurs due to the
transcription factor Lef/Tcf (Lymphoid enhancer factor/T cell factor) binding β-
catenin (Westendorf et al., 2004). As a consequence of downstream signalling, β-
catenin accumulates in the cytoplasm, translocates to the nucleus, and alters gene
expression (Krishnan et al., 2006).
Further promoters of osteoblastogenesis are BMPs which belong to the large
superfamily of TGFβ. In vitro BMPs are capable of causing differentiation of
myoblastic cell lines into osteoblast-lineage cells. Besides, induction of
osteoblast specific proteins such as alkaline phosphatase, osteocalcin and

Chapter 1 – Background and Introduction
29
transcription factor Runx2/Cfba1 (member of the Runt-related family of
transcription factors) could be achieved through a SMAD-dependent downstream
signalling (Katagiri et al., 1994). Intracellular SMAD proteins are transduce
extracellular signals mediated through transforming growth factor beta ligands to
the nucleus where they activate downstream TGF-β gene transcription.
Following osteoblast differentiation formation of new bone is achieved by the
secretion of collagen I and other proteins and factors through osteoblasts. This
organic part of the bone material gets mineralised most probably through alkaline
phosphatase (Wennberg et al., 2000).
Further factors from different other cell types seem to be required to initiate bone
formation (see Figure 1.7). A direct contact-dependent mechanism between
osteoclasts and osteoblasts seems to play a role although direct contact of
osteoclasts and osteoblasts can usually not be observed in histology (Zhao et al.,
2006).
Furthermore, osteoblasts use contact-dependent mechanisms (e.g. gap-junctions)
as well as expression of membrane-bound and secreted factors to “communicate”
with each other. Factors like ephrines, PTHrP and sclerostine for example are
expressed at all stages of differentiation (Sims and Gooi, 2008).
At the end of the remodelling cycle, osteoblasts become quiescent and cover the
bone surface as lining cells or become osteocytes when they remain within the
bone tissue.
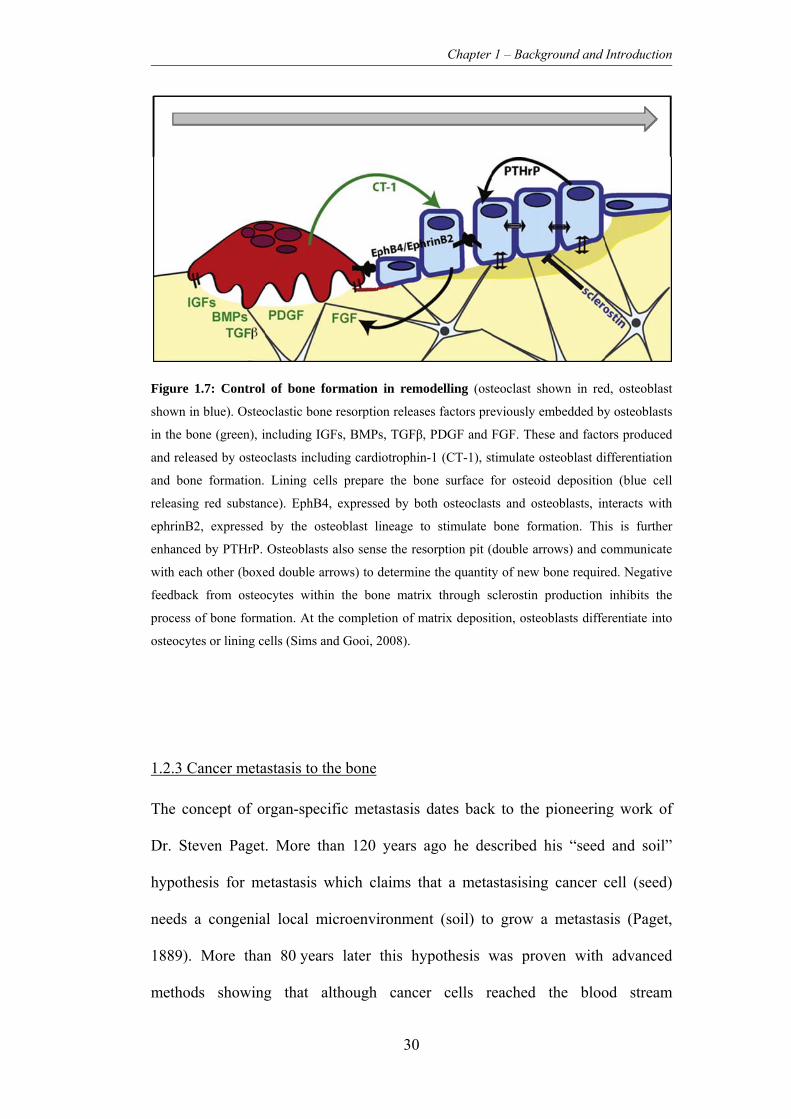
Chapter 1 – Background and Introduction
30
Figure 1.7: Control of bone formation in remodelling (osteoclast shown in red, osteoblast
shown in blue). Osteoclastic bone resorption releases factors previously embedded by osteoblasts
in the bone (green), including IGFs, BMPs, TGFβ, PDGF and FGF. These and factors produced
and released by osteoclasts including cardiotrophin-1 (CT-1), stimulate osteoblast differentiation
and bone formation. Lining cells prepare the bone surface for osteoid deposition (blue cell
releasing red substance). EphB4, expressed by both osteoclasts and osteoblasts, interacts with
ephrinB2, expressed by the osteoblast lineage to stimulate bone formation. This is further
enhanced by PTHrP. Osteoblasts also sense the resorption pit (double arrows) and communicate
with each other (boxed double arrows) to determine the quantity of new bone required. Negative
feedback from osteocytes within the bone matrix through sclerostin production inhibits the
process of bone formation. At the completion of matrix deposition, osteoblasts differentiate into
osteocytes or lining cells (Sims and Gooi, 2008).
1.2.3 Cancer metastasis to the bone
The concept of organ-specific metastasis dates back to the pioneering work of
Dr. Steven Paget. More than 120 years ago he described his “seed and soil”
hypothesis for metastasis which claims that a metastasising cancer cell (seed)
needs a congenial local microenvironment (soil) to grow a metastasis (Paget,
1889). More than 80 years later this hypothesis was proven with advanced
methods showing that although cancer cells reached the blood stream

Chapter 1 – Background and Introduction
31
development of metastasis could only be observed in specific organs (Fidler and
Kripke, 1977; Hart and Fidler, 1980).
1.2.3.1 Clinical picture of bone metastases
After lung and liver, bone tissue is the third most common site for metastatic
tumours and metastatic carcinoma is the most frequent malignancy occurring in
the skeleton of humans. Preferred sites of metastasis are spine, pelvis, femur and
ribs (Berrettoni and Carter, 1986; Hauben and Hogendoorn, 2010). Bone
metastases may lead to complications in many malignancies. Bone tissue
involvement can worsen the clinical picture and impair the quality of life
immensely and increases morbidity significantly. Amongst the most common
skeletal complications are pain, hypercalcemia, spinal cord compression and
pathological fractures (Coleman, 2006).
1.2.3.2 General mechanisms of metastasis
It has been suggested that the complex mechanism of metastasis can be separated
into two phases. The first phase, the physical translocation of a cancer cell,
involves intravasation and extravasiation. Intravasation includes the invasion of
the surrounding tissue of the primary tumour and entry to the lymph and blood
system. Extravasation takes place, when the cell survives and translocates via the
blood stream to microvessels of distant tissues and enters this tissue from the
blood stream.

Chapter 1 – Background and Introduction
32
The second phase describes the colonisation, involving survival in the new
microenvironment, adaption and finally proliferation to form a secondary
tumour. The complexity and many different aspects of the second phase of
metastasis still remain to be investigated to a greater extent (Chaffer and
Weinberg, 2011).
One aspect of the first phase that has been investigated during the last decades is
the epithelial-to-mesenchymal transition (EMT) that mainly plays an important
role as cell-biological program in early embryonic morphogenesis (Thiery et al.,
2009). EMT involves dedifferentiation of cells and improvement of their motility
by reduction of cell-cell-contacts and thus adhesion. However, recently it could
be shown for breast cancer that non-CSCs can transform into CS-like cells due to
EMT. This might be a key mechanism by which dissemination of cancer takes
place (Mani et al., 2008; Morel et al., 2008; Thiery et al., 2009).
In carcinoma, the activation of this EMT-program in tumourigenesis calls for
signalling between cancer cells and their neighboring stromal cells so that a
variety of different cell types are attracted to the surrounding stroma. These cells
lead to the formation of a “reactive” stroma leading to an inflammation and
finally in the release of EMT-inducing molecules. This triggers the expression of
certain EMT transcription factors by the carcinoma cells resulting in the EMT
programm (Yang and Weinberg, 2008; Chaffer and Weinberg, 2011).
However, the concept of EMT as a mediator of dissemination and subsequently
metastasis as well as the mechanisms of colonisation as the second phase of
metastasis still have to be investigated in other types of cancers and sarcomas as
such.

Chapter 1 – Background and Introduction
33
1.2.3.3 Mechanisms of metastasis to the bone
Regarding the site of bone metastases of different types of cancers, it is obvious
that these are mainly affecting bone regions which contain red bone marrow,
which consists mainly of haematopoietic tissue. This might play a role in the
process of metastasis to the bone (marrow) because properties of circulation,
cells and extracellular matrix in the bone might support homing and growth of
metastasised cancer cells. Furthermore, post-mortem studies in animals and
humans have shown that venous blood from breast and pelvis does not only flow
into the vena cava but also into a vertebral-venous plexus. This might, to a
certain extent, explain the tendency of breast, prostate and other cancer types to
metastasise to bones at certain anatomical sites (Batson, 1940; Coleman, 2006).
Disseminating tumour cells become attracted to certain regions and are
physically trapped in the capillary beds of a variety of tissues. However, the
tumour cells have to interact with the local tissue and this is only possible in
tissues that offer the appropriate microenvironment for survival and growth to
which the disseminating cell has to adapt. This process of communication plays a
critical role in homing and establishment of metastatic disease. In more detail
this involves degradation of extracellular matrix, secretion of appropriate growth
factors, chemokines and cytokines, and expression of receptors on tumour cells
(Nannuru and Singh, 2010).
Furthermore, it is thought that bone metastasis can be described as a vicious
circle in which tumour cells get attracted by growth factors released from bone
tissue through normal osteoclastic resorption during bone remodelling. This leads
to enrichment of the microenvironment and leads to increased tumour cell
growth and alteration of tumour cell phenotypes. This, in turn, influences the

Chapter 1 – Background and Introduction
34
cells of the bone microenvironment and disturbs the fine equilibrium between
osteoblasts and osteoclasts (Bussard et al., 2008).
1.2.3.4 Metastasis in Ewing’s sarcoma
Metastatic disease is one of the most important factors influencing prognosis,
disease and the choice of treatment in ES/PNET (for more details see chapter 4).
ES/PNET is known to be a systemic disease with patients most commonly dying
from lung metastases (Cotterill et al., 2000; Grier et al., 2003; Paulussen et al.,
2008).
Until today, the process of detatchment form the primary tumour has been
investigated in ES/PNET. It is known that activation of certain downstream
signalling pathways is important for anchorage-independent survival and growth,
such as PI3K/Akt. Furthermore, the activation of tyrosin-kinase receptors
involving IGF-1R (insulin-like growth factor 1 receptor) may not only be
important in the survival of detached ES/PNET cells but as well in maintenance
of a malignant phenotype (Strauss et al., 2010).
As a further mechanism promoting tumour development, growth and a metastatic
phenotype chromatin modifications are increasingly recognized in different
cancer types and as well ES/PNET. EZH2 (histone methyltransferase Enhancer
of Zeste, Drosophila, Homolog 2), the enzymatic subunit of the polycomb PRC2
complex has been shown to methylate histone H3K27. This ultimately leads to
gene silencing.

Chapter 1 – Background and Introduction
35
EWS-FLI1 was found to be bound to the promoter of EZH2 in vivo and its
downregulation suppressed tumour development and metastasis in vivo (Burdach
et al., 2009).
The exact mechanisms of metastasis in ES/PNET as such still remain unclear.
With micrometastases in many cases being resistant to chemotherapy and
responsible for a high risk of relapse and a worse outcome for patients
(Schleiermacher et al., 2003; Strauss et al., 2010) it is crucial to investigate the
development of metastasis in order to improve treatment strategies and patient
outcome.
1.2.3.5 Degradation of extracellular matrix
Proteases are released by tumour cells metastasising to the bone as well as by
bone cells themselves to degrade extracellular matrix. Tumour cells require these
to invade into bone tissue.
MMPs are zinc-dependent endoproteases employed for this purpose. Breast
cancer cells and other cells of further malignancies can express different MMPs
at high levels and this correlates with a poor prognosis (Leppä et al., 2004).
Additionally, TIMPs (tissue inhibitor of metalloproteinases) are often inhibited in
malignant and non-malignant cells during the metastatic process. In vitro
inhibition of MMPs and addition of TIMP1 and TIMP2 to cultures of breast
cancer cell lines lead to reduced adherence and migration (Zhao et al., 1999;
Saad et al., 2000).
More recently, the role of MMP-7 and MMP-9 has been investigated. Both
proteases seem to contribute to osteolytic metastatic lesions. While MMP-7

Chapter 1 – Background and Introduction
36
solubilises RANKL (presented on the osteoblast cell surface, usually leads to
osteoclast-activation; see chapter 1.2.2.2) in prostate cancer models of bone
metastases, MMP-9 is thought to be involved in osteoclast recruitment (Dong et
al., 2005; Lynch et al., 2005).
Cathepsins have been shown to be vital for differentiation and activation of
osteoclasts. Cathepsin G has been shown to mediate activation of MMP-9 and
thus promote bone destruction. Targeting cathepsin G inhibits tumour
vascularisation through reduced levels of VEGF (vascular endothelial growth
factor) and chemoattractant protein-1 (Ishikawa et al., 2001; Wilson et al., 2009,
2010).
1.2.3.6 Growth factors and cytokines
The bidirectional interaction between tumour cells and stromal cells of the bone
microenvironment has been investigated extensively. On both sides this interplay
induces production of growth factors and cytokines leading to complex signalling
cascades. These factors can be categorised into bone-resorbing and bone-forming
factors (Mundy, 2002).
Amongst many factors that promote resorption the role of different cytokines and
growth-factors in metastasis of cancer to the bone has been investigated and they
often act in a RANKL-dependent way. Thus, differentiation of newly recruited
osteoclast precursors to active osteoclasts is triggered (Thomas et al., 1999;
Bendre et al., 2005). The limiting step in this interaction is the direct cell-to-cell
contact between RANKL-expressing osteoblasts and RANK-expressing
osteoclasts.

Chapter 1 – Background and Introduction
37
However, promotion of RANK-RANKL interaction can be achieved through
cleavage of the membrane bound form of RANKL into a fully functional soluble
RANKL. MMP-7 and cathepsin G are able to cleave the membrane bound form
of RANKL. Their expression and thus promotion of osteoclast activation could
be shown in different types of cancers metastasising to the bone (Lynch et al.,
2005; Thiolloy et al., 2009).
A form of promotion of osteoblastic metastases of the bone could be achieved
through endothelins. Osteoblasts produce ETA and ETB receptors (endothilin A
and B receptors) and thus bind ET-1 (endothelin 1) which triggers mitogenesis
and consequently proliferation of osteoblasts via the Wnt/β-catenin signalling
pathway (Clines et al., 2007).
Thus, tumour cell derived ET-1 might stimulate osteoblasts as well as promote
tumour cells themselves in an autocrine fashion (Takuwa et al., 1990; Chiao et
al., 2000; Guise and Chirgwin, 2003).
As mentioned before, the bone matrix is rich in a range of growth factors such as
IGF-1 and -2, TGF-β, BMPs, FGF (fibroblast growth factor) and PDGF released
during osteolysis. These additionally promote proliferation and survival of
tumour cells in the bone microenvironment which closes the “vicious cycle” of
metastasis to the bone.
1.2.3.7 Chemokines and their receptors
Chemokines and their G-protein-coupled receptors play an important role in the
interaction of tumour cells and the bone microenvironment. Chemokines,
secreted by tumour cells or through degradation of the extracellular matrix,

Chapter 1 – Background and Introduction
38
provide a chemotactic signal to cells expressing the appropriate receptors. This
attraction is likely to be responsible, at least in part, for distant organ-specific
metastasis (Nannuru and Singh, 2010).
The first two chemokine receptors, which initiated the idea of chemokine driven
metastasis to bone, were CCR7 and CXCR4. These are highly expressed in
breast cancer cells while the associated ligands CCL21 and CXCL12 are
expressed in bone as well as lung and lymph nodes (Müller et al., 2001).
Furthermore, evidence for expression of CXCR4 could also be found in prostate
cancer cells where interaction of CXCR4 with CXCL12 has amongst others the
effect of increasing MMP-9 expression which subsequently promotes
invasiveness of tumour cells (Chinni et al., 2006). There are many more effects
of the CXCR4/CXCL12-axis but it can be reasoned in general that this leads to
the establishment of the cancer stem-like cell niche where high levels of
CXCL12 recruit a population of highly tumorigenic cells promoting cell survival,
proliferation, angiogenesis, and further metastasis (Wennberg et al., 2000; Chinni
et al., 2008).
The CCL22/CCR4-axis attracts lung cancer cells to the bone marrow (Nakamura
et al., 2006). Conversely, CCL2 expression seems to inhibit the metastasis of
breast cancer cells to bone and lung (Takahashi et al., 2009).
1.3 The CXCL12/CXCR4-axis
Chemokines are a subgroup of cytokines with the ability to chemically attract
cells expressing the appropriate chemokine receptor. Thus, chemokines are major
regulators of cell trafficking and adhesion.

Chapter 1 – Background and Introduction
39
Chemokine receptors are seven-span transmembrane proteins which are coupled
to G proteins. All chemokines present the N-terminus at the cell surface and the
C-terminus to the cytoplasm with three extra- and three intracellular loops. One
of the latter interacts with heterotrimeric G proteins. As mentioned before, this
initiates a signalling cascade (Sun et al., 2010).
1.3.1 Role of the CXCL12/CXCR4 axis
For years, the interaction between CXCL12 and CXCR4 was thought to be
exclusive. Just recently the picture of CXCL12 changed when it became clear
that CXCR4 is not its only receptor. A new receptor was identified on murine
fetal liver cells which was still able to bind CXCL12 after CXCR4 knockout
(Burns et al., 2006). However, the work at hand will focus on the interaction of
CXCL12 with the receptor CXCR4.
So far, there is a variety of tasks known which the axis of CXCL12/CXCR4
fulfils: it is primarily thought to regulate the migration of haematopoietic stem
cells into and out of the bone marrow, and facilitates the cells transmigration
through endothelial cell barriers (Möhle et al., 1997; McGrath et al., 1999).
Furthermore, it is a key regulator of B cell lymphopoiesis and leukocyte
migration (Nagasawa et al., 1996).
Additionally to those functions in the adult body, in mice genetically deleted of
CXCL12, early stage embryos exhibit profound defects in the formation of large
vessels, septal malformation during cardiac development and abnormal brain
development (Nagasawa et al., 1996). Eventually, between days 15 and 18 of
gestation embryonic lethality is observed. Other investigations demonstrated that

Chapter 1 – Background and Introduction
40
CXCL12 can induce angiogenesis ex vivo and in vivo (Tachibana et al., 1998;
Salcedo et al., 1999).
CXCL12 has two major isoforms due to alternative splicing. The predominant
α-isoform is involved in many local tissue-specific physiological processes and is
expressed in nearly all organs. In blood it rapidly undergoes proteolysis.
CXCL12β is more resistant to proteolysis and is mainly found in highly
vascularised organs such as liver, spleen and kidneys (Janowski, 2009). There are
four more isoforms of CXCL12 which, however, have to be further investigated
(Yu et al., 2006).
In the bone marrow, CXCL12 is mainly produced by osteoblast-derived lining
cells and regulates the migration of CD34+ cells. The homology of the human
and the murine variants of CXCL12 contribute amongst other factors to human
CD34+ cells being able to repopulate the bone marrow of NOD/Scid mice
(Ponomaryov et al., 2000; Jung et al., 2006; Janowski, 2009).
CXCR4 is highly conserved and binds CXCL12 as a ligand. It is mainly
expressed during development but later on it mediates migration of resting
leukocytes and haematopoietic progenitors and plays a role in the immune
system (Zou et al., 1998; Aiuti et al., 1999).
The interaction of ligand and receptor leads to intracellular binding of a
G protein complex to CXCR4. This causes the dissociation of the subunits of the
G protein complex resulting in the activation of multiple downstream effectors of
ERK1/2 (extracellular-signal-regulated kinase 1 and 2), different MAPKs
(mitogen-activated protein kinases), and AKTs (v-akt murine thymoma viral
oncogene homologs) (Lee et al., 2007; Lu et al., 2009).

Chapter 1 – Background and Introduction
41
The role of the CXCL12 and CXCR4 as mediators of migration and initiator of
angiogenesis offers a high possibility for this axis to play a role in cancer as well.
1.3.2 The CXCL12/CXCR4 axis in cancer metastasis
Lapidot and co-workers suggested the concept of cancer stem cells by studying
on leukaemia (Bode et al., 1992; Lapidot et al., 1994). Further investigations on
different cancer types suggest indeed, that there is evidence for specific cancers
arising from quiescent tissue-committed stem cells (cell of origin) acquiring
several mutations over time. Furthermore, during the development of the specific
tumours some cells remain in a quiescent, stem cell-like state allowing metastasis
and relapse (cancer maintaining stem cell). This is due to their relative resistance
to chemotherapeutics which target rapidly dividing cells. Recently, research has
shown that these cancer stem cells play a pivotal role in many cancer types such
as breast, prostate and brain cancers (Dontu et al., 2003; Singh et al., 2004;
Collins and Maitland, 2006) and seem to share molecular mechanisms with
normal stem cell trafficking as displayed in Figure 1.8 (Kucia et al., 2005).

Chapter 1 – Background and Introduction
42
Figure 1.8: Hypothetical role of the CXCL12/CXCR4 axis in migration of normal stem cells
(SC) and metastasis of malignant stem cells (cancer SC). Cells (I) leave their stem cell niches
(SC) or primary tumour (cancer SC) and enter circulation, (II) arrive at the site of homing (SC)
or metastasis (cancer SC) via the peripheral blood or lymph, (III) adhere to the endothelium, (IV)
invade tissues, and (V) proliferate and expand at a location that provides a supportive
environment (Furusato et al., 2010).
As CXCR4 is expressed on stem cells of various organs as well as on many
tumour cells themselves, researchers suggest that these tumour types arise from
CXCR4+ stem cells (Furusato et al., 2010). So far, some cancers that are positive
for CXCR4 have been shown to metastasise and home to bone via the blood
stream in a CXCL12-dependent way (Geminder et al., 2001; Müller et al., 2001;
Sun et al., 2003). Therefore, metastases of breast and prostate tumours can be
found in tissues excreting high levels of CXCL12 such as lymph nodes, lung,

Chapter 1 – Background and Introduction
43
liver and bone marrow (Allinen et al., 2004; Gladson and Welch, 2008). The
hypothesis of the CXCL12/CXCR4-dependent homing is supported by findings
of in vivo studies where neutralising antibodies against CXCR4 inhibited
metastasis (Du et al., 2008).
CXCR4 is overexpressed in a variety of different cancer types, and cancer cell
lines such as for example breast cancer, prostate cancer, and melanoma.
However, it is conspicuous that in all cases the originating tissue does not
express CXCR4 (Müller et al., 2001; Scotton et al., 2001; Sun et al., 2003).
Therefore, CXCR4 expression of cancer cells might not be due to transformation
of a CXCR4-positive mesenchymal stem cell but a consequence of the malignant
programme that drives the metastatic phenotype.
The up-regulation might be caused by different mechanisms. One of those might
be the induction of CXCR4 expression through VGEF, which in turn can be up-
regulated itself through the transcription factor HIF-1 (hypoxia-inducible
factor 1) under hypoxic conditions. This has been shown to be the case for
glioblastoma (Zagzag et al., 2006).
The interesting and important role CXCL12/CXCR4 seems to play in different
types of cancers suggests a potential role of this axis in ES/PNET as well. This,
however, still needs to be investigated.
1.3.3 Potential role of CXCL12/CXCR4 axis in Ewing’s sarcoma
Until today, no research results have been published that had the direct aim to
investigate on the role of CXCL12/CXCR4 in ES/PNET. However, different
projects revealed interesting results that involved CXCL12/CXCR4.

Chapter 1 – Background and Introduction
44
Recently, data was published describing a novel method of gene expression
analysis called intercohort gene expression co-analysis. This study shows that
higher CXCR4 expression correlates with metastatic behaviour of ES/PNET.
Furthermore, the patient group with ES/PNET cells highly expressing CXCR4
and CXCR7 had the worst survival rates (Bennani-Baiti et al., 2010).
Knockdown experiments targeting the fusion transcript EWS/FLI1 revealed that
CXCR4 expression seems to be directly or indirectly regulated through the
aberrant transcription factor EWS/FLI1 (Chansky et al., 2004; Bennani-Baiti et
al., 2010).
Additionally to this, HIF-1 might be responsible for the expression of CXCR4 in
ES/PNET. As mentioned previously, HIF-1 can up-regulate VEGF expression,
which in turn can up-regulate CXCR4 expression. In ES/PNET HIF-1α
influences the expression of EWS/FLI1 and may also be responsible for up-
regulation of CXCR4 via VEGF. This, however, needs to be investigated further
(Aryee et al., 2010).
To date, there is still a need for a direct experimental proof of a role of the
CXCL12/CXCR4-axis in the metastasis of ES/PNET. But taking its high
expression in nearly all ES cell lines and many primary tumours as well as the
role of this axis in other cancers into account there is strong indication for
CXCR4 involvement in the organ-specific metastasis of ES/PNET.

Chapter 2 - Aims
45
2. Chapter – Hypothesis and aims
The main aim of this thesis was to investigate different aspects of the cellular
mechanisms of organ-specific metastasis in ES/PNET. In different studies on
ES/PNET it has been observed that the occurrence and location of primary
metastases in ES/PNET plays an important role for the outcome of patients.
These studies revealed as well that metastasis to distinct organs leads to different
survival rates in patients. Thus, the overall hypothesis of this thesis was that cells
metastasising to different organs would be distinct from each other. Especially, it
was thought that this would be manifested in the expression of genes, in vitro and
in vivo behaviour.
As CXCR4 has been shown to play a role in the metastasis of other cancer types
and has been shown to be expressed in ES/PNET it was hypothesised to have a
potential role in the metastatic behaviour of this sarcoma type as well.
More specifically the aims were as follows:
to isolate organ-specific ES/PNET subclones employing the established
i. v. metastasis model for ES/PNET.
on-going from this to identify organ-specific gene expression signatures
using microarray analyses.

Chapter 2 - Aims
46
to create a stable knockdown vector against CXCR4 for further
investigations on its role in the metastasis of ES/PNET.
to develop and characterise an orthotopic model for ES/PNET to
investigate the interaction of ES/PNET cells in the appropriate
microenvironment.
The development of an orthotopic model for ES/PNET is justified by the need of
investigation of the interaction of the tumour cells in the microenvironment of
the bone. Employment of such an orthotopic preclinical model would facilitate
fundamental research on the biology of ES/PNET. Furthermore, it would provide
an improved tool for drug development as compared with current subcutaneous
(s. c.) models.

Chapter 3 - Materials and Methods
47
3. Chapter – Materials and Methods
3.1 General devices and materials
If not stated otherwise or directly in the correlating chapter the following
equipment and materials were used:
3.1.1 Equipment
ABI 7000 Real Time detection system, Applied Biosystems, Warrington, UK
ABI 7500 Fast Real-Time PCR system, Applied Biosystems
ABI 7000 SDS program, Applied Biosystems
ABI 7900HT Sequence detection system, Applied Biosystems
ABI SDS 2.2, Applied Biosystems
Agarose gel electrophoresis unit, BIO-Rad, Hemel-Hempsted, UK
FACSCalibur, Becton Dickinson, Oxford, UK
FACSCanto, Becton Dickinson
MINI-PROTEAN II electrophoresis cell, BIO-Rad
ND-1000 spectrophotometer, Nanodrop Technologies Ltd., Wilmington, USA
Spectramax 250 multiwell plate reader, Molecular devices, Crawley, UK
Centrifuge 5415C, Eppendorf AG, Germany
Centrifuge 5415R, Eppendorf AG
L870M Ultracentrifuge, Beckman Coulter, UK
Allegra® X-12 benchtop centrifuge, Beckman Coulter, High Wycombe, UK
Bio Mat2 Class II Microbiological Safety Cabinet, Medical Air Technology Ltd.,
Oldham, UK
Chapter 3 - Materials and Methods
48
CO2 Incubator, Sanyo E&E Europe, Loughborough, UK
Sub-Cell® GT gel-electrophoresis chamber, BIO-Rad
ChemiDoc XRS+ system, BIO-Rad
GeneAmp® PCR System 2700, Applied Biosystems
Thermomixer comfort, Eppendorf AG
3.1.2 Material
Costar® Cell culture flask, different sizes, Corning Incorporated, USA
CryoTubes, Nunc A/S, Denmark
Costar® cell culture plates, different sizes, Corning Incorporated, USA
FACS tubes, BD Bioscience, Oxford, UK
3.1.3 Kits
Maxiprep Endofree Plasmid Isolation Kit, Qiagen, Crawley, UK
QIAprep Spin MiniPrep Kit, Qiagen
RNeasy kit, Qiagen
QIAShredder spin colums, Qiagen
3.1.4 Chemicals
If not stated otherwise, chemicals were purchased from Sigma-Aldrich (Poole,
UK) or Fisher Scientific (Loughborough, UK).

Chapter 3 - Materials and Methods
49
3.2 Microbiological work
3.2.1 Bacteria
Escherichia coli K12 JM109
A suspension of Escherichia coli (E. coli) K12 JM109 grown in minimal media
and cryopreserved in 50 % glycerol was purchased from Promega
(Southhampton, UK). Competent bacteria were produced from this stock.
Genotype: F´ traD36 proA+B+ lacIq Δ(lacZ)M15/ Δ(lac-proAB) glnV44 e14-
gyrA96 recA1 relA1 endA1 thi hsdR17
Escherichia coli K12 ER2925
A suspension of E. coli ER2925 grown in Lysogeny broth (LB) and
cryopreserved in 50 % glycerol was purchased from New England BioLabs
(Hitchin, UK). This strain is dam- and dcm- and was used for the production of
plasmids in which the restriction site XbaI was used.
Genotype: ara-14 leuB6 fhuA31 lacY1 tsx78 glnV44 galK2 galT22 mcrA dcm-6
hisG4 rfbD1 R(zgb210::Tn10)TetS endA1 rpsL136 dam13::Tn9 xylA-5 mtl-1 thi-
1 mcrB1 hsdR2
3.2.2 Plasmids
Table 3.1 lists all plasmids purchased, used and constructed for the projects of
this work.

Chapter 3 - Materials and Methods
50
Table 3.1: List of purchased and constructed vectors.
Plasmid Antibiotic
resistance
Manufacturer/Co-operator
pSUPER Ampicillin Oligoengine, Seattle, USA
pSUPERshMA6Mut1 Ampicillin Dr. Frida Ponthan
pSUPERshCXCR4 Ampicillin Henrike Knizia
pEPI-EGFP Kanamycin Prof. Lipps, University of
Witten/Herdecke, Germany
pEPI shCXCR4 Kanamycin Henrike Knizia
pEPI shMA6Mut1 Kanamycin Henrike Knizia
For the selection of bacteria carrying the designated plasmid the adequate
antibiotic was added to the culture medium.
3.2.3 Media, additives and growth conditions
Table 3.2 and 3.3 describe the medium and additives used to cultivate and select
bacteria. Medium was sterilised before use for 20 minutes at 121°C and
2×10⁵ Pa. To create selection pressure antibiotics were added after cooling down
the media. Cultures were incubated at 37°C in a shaking incubator either
overnight or until the designated density was obtained. To produce agar plates
1.8% (w/v) agar was added to the medium prior to autoclaving.

Chapter 3 - Materials and Methods
51
Table 3.2: Recipe for Lysogeny broth (LB).
LB medium
Bacto-tryptone 1% w/v
Yeast extract 0,5%w/v
NaCl 1%w/v
ddH2O ad 1000ml
pH 7.5
Table 3.3: Antibiotics and used concentrations.
Antibiotic Stock solution End concentration
Ampicillin 50mg/ml 50μg/ml
Kanamycin 50mg/ml 50μg/ml
3.2.4 Strain conservation
For short term conservation strains were maintained on LB agar plates with the
appropriate antibiotics. These plates were sealed with Parafilm® M (American
National Can Company, Chicago, USA) and stored inverted at 4°C in a
designated refrigerator.
For long term conservation E. coli strains were stored as glycerine-suspensions.
Therefore, bacteria were cultivated overnight in liquid LB medium with the
appropriate antibiotics. Aliquots of the bacteria solution were brought to an end
concentration of 20% (v/v) with sterile glycerine and stored in a screw cap glass
tube at -80°C.

Chapter 3 - Materials and Methods
52
To reactivate the frozen bacteria a sterilised inoculation loop was used to pick up
the frozen stock and inoculate a LB culture with the adequate antibiotics.
3.2.5 Preparation of competent Escherichia coli
A 5ml culture of bacteria was incubated overnight at 37°C in LB medium. The
culture was transferred into a sterilised 200ml conical flask and 25-50ml of fresh
LB medium was added (the dilution should at least be 1/100). The diluted culture
was grown to an optical density at 600nm (OD600) of 0.2-0.5, which was
examined every 30 minutes. After the required OD600 was reached the culture
was split and transferred into 50ml tubes and incubated on ice for 10 minutes.
The bacteria were centrifuged for 10 minutes at 1000g at 4°C and the supernatant
discarded. The required number of 1.5ml reaction tubes were pre-chilled on ice
and the pellet was resuspended in ice-cold TSS buffer (see Table 3.4; 10% of the
former culture volume). The solution was mixed gently, to dissolve all
aggregates. From this solution 100µl aliquots were added to the chilled 1.5ml
reaction tubes and these were immediately transferred from ice to a -80°C
freezer.
For each batch of competent bacteria a positive control was performed and the
transformation efficiency calculated.

Chapter 3 - Materials and Methods
53
Table 3.4: Recipe for TSS buffer.
TSS buffer End concentration
Polyethylene glucol 8000 (PEG) 10% (v/v)
DMSO (Dimethyl sulfoxid) 5% (v/v)
MgCl2 30mM
LB medium ad 50ml
The solution was filter sterilised (0.22µm filter) and stored at 4 or -20°C.
3.2.6 Transformation of plasmids into competent Escherichia coli
The method is based on a heat shock treatment of competent E. coli with the
purpose to transfer plasmid-DNA. Subsequent, the plasmid amplified occurs
following the incubation and growth of the bacteria.
The competent bacteria (in 100μl aliquots), were thawed on ice prior to the
addition of 0.1-50ng of purified plasmid and 2μl of a ligation mix. The mix was
incubated on ice for 30 minutes to allow the plasmids to bind to the surface of the
bacteria. The heat shock was performed at 42°C in a water bath for 45 seconds,
followed by incubation on ice for 2 minutes. Next, 450μl of ice cold
SOC-Medium was added (see Table 3.5), and the transformed E. coli were
incubated for 1 h at 37°C to facilitate recovery.
The transformed bacteria were centrifuged in a 1.5ml reaction tube at full speed
using a benchtop microcentrifuge at 1200g, the supernatant was discarded and
the bacteria were resuspended in the remaining liquid on the pellet and placed on
a pre-warmed LB agar plate (containing the appropriate antibiotic as a selection

Chapter 3 - Materials and Methods
54
marker if required). The bacteria were spread on the agar plate with a
Drigalski-applicator and incubated overnight at 37°C in an inverted position.
Table 3.5: SOC-Medium.
SOC-Medium
Tryptone (pancreatic digest of casein) 2% (w/v)
Yeast extract 0.5% (w/v)
NaCl 10mM
KCl 2.5mM
MgSO4 20mM
Glucose 200mM
The glucose solution had to be sterilised before adding it to the recipe. Adjust to
pH 7.0.
3.3 Nucleic acid methods
3.3.1 Isolation of plasmid DNA from bacteria
A QIAprep Spin MiniPrep Kit (Qiagen) was used to extract plasmid DNA from
cultured bacteria according to the manufacturer’s instructions, as follows:
Bacteria carrying the plasmid were cultivated overnight at 37°C with shaking and
2ml of this culture was centrifuged for 5 minutes at 8000g in a microcentrifuge.
Chapter 3 - Materials and Methods
55
The bacterial pellet was re-suspended in 250µl of buffer P1 (Qiagen) and
bacteria were lysed by adding 250µl of buffer P2 (Qiagen) and incubated for
5 minutes at room temperature. Lysis was terminated by adding 350µl of
neutralising buffer N3 (Qiagen) and inverting the reaction tubes cautiously. To
sediment the resulting precipitates the solution was centrifuged for 10 minutes at
full speed in a benchtop microcentrifuge. The supernatant was transferred to a
QIAprep spin column, centrifuged at full speed for 1 minute and the flow-
through was discarded. Column-bound DNA was washed with 500µl PB buffer
(Qiagen), and then washed with 750µl of PE buffer (Qiagen). The flow-through
was discarded following each wash step. To ensure complete removal of residual
ethanol, the spin column was transferred into a new 2ml reaction tube and
centrifuged again for 1 minute at full speed to dry the column. To elute the
column-bound DNA 50µl of EB buffer (Qiagen) were added to the column, the
column incubated for 5 minutes and the resuspended DNA centrifuged for
5 minutes at full speed.
Plasmids were stored at -20°C until further use.
3.3.2 Isolation of plasmid DNA from bacteria under endotoxin-free conditions
Plasmids used for work carried out on mammalian cells samples must be
endotoxin-free. Endotoxins produced by bacteria are harmful for mammalian
cells and therefore have to be removed. This was achieved using the Maxiprep
Endofree Plasmid Isolation Kit (Qiagen).
To isolate a plasmid in larger quantities, 2ml of a pre-culture were used to
inoculate a 100-150 ml overnight-culture in LB-medium with the require

Chapter 3 - Materials and Methods
56
antibiotic that was incubated at 37°C on a shaking platform. The next day, the
bacteria were harvested by centrifugation at 6000g for 15 minutes at 4°C. The
pellet was re-suspended in 10ml buffer P1 (Qiagen) and lysed by the addition of
10ml buffer P2 (Qiagen). To ensure a complete lysis, the sealed tube was
inverted and subsequently the mixture was incubated for 5 minutes at room
temperature. During the incubation the QIAfilter cartridge was prepared.
The lysis was neutralised by the addition of 10ml pre-chilled buffer P3 (Qiagen),
vigorous inversion and incubation on ice for 20 minutes. The mixture was
applied to the barrel of the filter cartridge, incubated for an additional 10 minutes
and filtered into a new 50ml tube. Where required an endotoxin removal step was
performed by adding 2.5ml of buffer ER (Qiagen) to the filtered lysate and
incubation for 30 minutes on ice. During the incubation, the QIAGEN-tip 500
columns were equilibrated by applying buffer QBT (Qiagen). Subsequently, the
mixture was centrifuged for 30 minutes with 20,000g at 4°C. The supernatant
was applied to the equilibrated QIAGEN-tip 500, allowed to enter the resin by
gravity flow and washed twice with 30ml of buffer QC (Qiagen). Plasmid DNA
was eluted with buffer QF (Qiagen).
3.3.3 Isolation of genomic DNA from mammalian cells
To be able to investigate genetic features such as fusion genes it was necessary to
isolate the genomic DNA of cells. To acquire genomic DNA the QIAamp DNA
Mini Kit (Qiagen) was used.
Five million cells were centrifuged at 300g for 5 minutes. Cells were
re-suspended in 200µl of phosphate-buffered saline (PBS; GIBCO, Invitrogen)

Chapter 3 - Materials and Methods
57
and 4µl of DNase-free RNase (100mg/ml) were added. The suspension was
incubated for 2 minutes at room temperature. Cells were lysed by adding 200µl
buffer AL (room temperature, Qiagen) and 20µl Proteinase K. The samples were
mixed by vortexing, briefly microcentrifuged and incubated for 10 minutes at
70°C. Then 200µl of absolute ethanol was added and the solution was transferred
to a QIAamp DNA spin column placed in a 2ml collection tube. By
centrifugation at 6000g for 1 minute the DNA bound to the column matrix. The
flow-through was discarded and the column was washed once with 500µl buffer
AW1 (Qiagen) and subsequently with 500µl buffer AW2 (Qiagen) by
centrifugation at 6000g. Again, the flow-through was discarded. To avoid a
possible negative effect of remaining ethanol on subsequent reactions, the
column was centrifuged once again at full speed for 3 minutes. To elute bound
DNA from the column it was transferred into a 1.5ml reaction tube, incubated
with 100µl of buffer AE (Qiagen) for 1 minute and centrifuged for 1 minute at
full speed.
DNA was stored at -20°C if not used immediately.
3.3.4 Isolation of RNA from mammalian cells
RNA from mammalian cells was isolated using the RNeasy kit and QIAShredder
spin columns (both Qiagen). Therefore, cells were harvested and counted as
usual. One x106 cells were pelleted at 300g. The cell pellet was resuspended in
350µl of RLT buffer (Qiagen). Additionally, the cells were disrupted
mechanically using QIAShredder columns.

Chapter 3 - Materials and Methods
58
One volume of 70% ethanol was added to the homogenized lysate. Up to 700μl
of the sample were transferred to an RNeasy spin column placed in a 2ml
collection tube and centrifuged for 15 seconds at 8000g. The flow-through was
discarded.
To wash the spin column, 700μl of buffer RW1 (Qiagen) and twice 500μl buffer
RPE (Qiagen) were added to the spin column. With both buffers the column was
centrifuge for 15 seconds (for 2 minutes during the last wash step) at 8000g and
the flow-through discarded. The spin column was placed in a new 1.5ml
collection tube and 30-50μl RNase-free water was applied directly to the spin
column membrane. To elute the RNA, the sample was centrifuged for 1 minute
at 8000g.
RNA was quantified and stored at -20°C until further use.
3.3.5 Determination of the concentration of DNA and RNA samples
A NanoDrop® ND-1000 spectrophotometer was used to determine the
concentration of DNA and RNA samples after isolation.
Briefly, 1.2μl was applied onto the pedestal of the spectrophotometer and
measured at 260nm and given in ng/μl. Additionally, by calculation of the ratio
of the absorbance at 260 and 280nm the purity of the DNA sample was checked.
DNA absorbs maximally at 260nm while proteins absorb maximally at 280nm.
An OD260/280 ratio of 1.8 would indicate highest purity. However, values above
1.4 are considered as sufficient.

Chapter 3 - Materials and Methods
59
3.3.6 Polymerase chain reaction
To amplify specific genes the technique of polymerase chain reaction (PCR) was
used. If required for genomic DNA, a prolonged denaturation step prior to
addition of the polymerase and start of the PCR has been applied to avoid
problems.
After pipetting the PCR reaction-mix (see Tables 3.6, 3.8 and 3.9) into a 200µl
PCR tube, 5-25 µl of DNA-sample (200ng-1µg DNA) was added and the
mixture was overlaid with 20µl of mineral oil (PCR-grade). A negative control
containing water instead of sample was included.
If a hot-start PCR was performed, the samples were put into the thermal cycler
and denatured for 10 minutes at 95°C, before adding the Taq (Thermus
aquaticus) polymerase and starting the actual PCR programme described in
Table 3.7.
Table 3.6: Recipe for PCR master mix.
PCR master mix 50 µl
10x Brady buffer 1x
3’ primer 0,2µM
5’ primer 0,2µM
dNTPs 0,2mM
Taq-Polymerase (GibcoBRL Taq-Polymerase) 0,2U
ddH2O ad 50µl
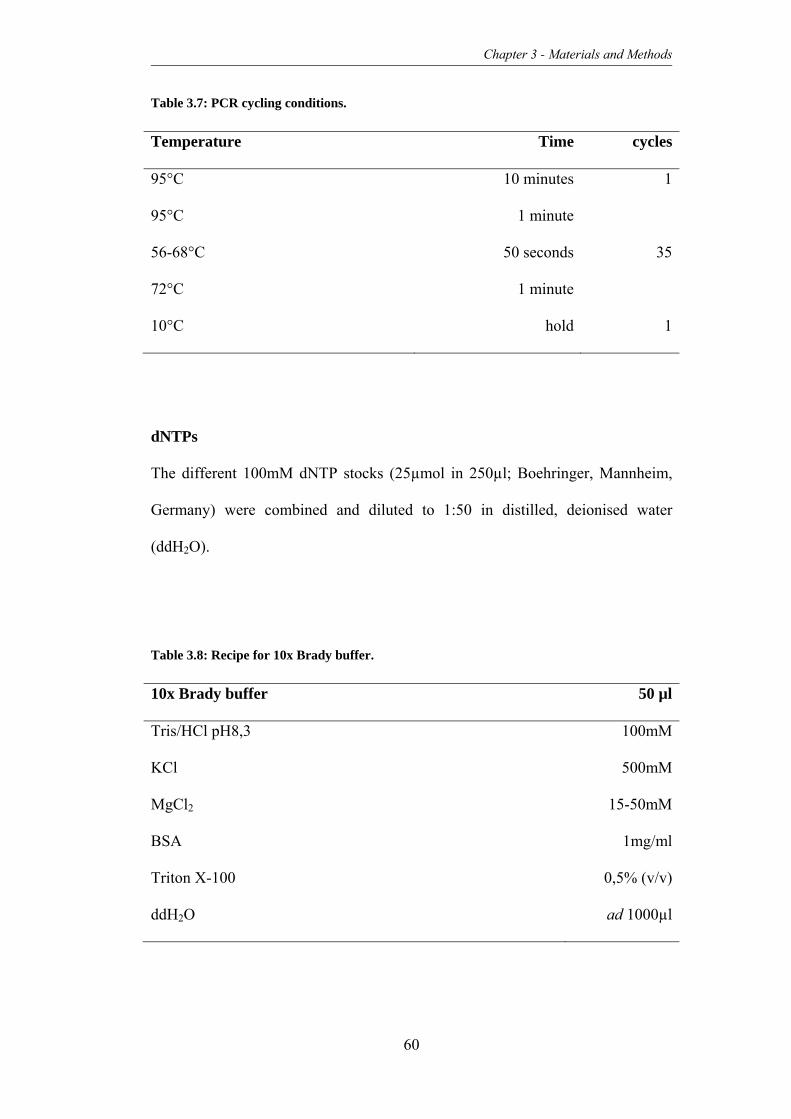
Chapter 3 - Materials and Methods
60
Table 3.7: PCR cycling conditions.
Temperature Time cycles
95°C 10 minutes 1
95°C 1 minute
3556-68°C 50 seconds
72°C 1 minute
10°C hold 1
dNTPs
The different 100mM dNTP stocks (25µmol in 250µl; Boehringer, Mannheim,
Germany) were combined and diluted to 1:50 in distilled, deionised water
(ddH2O).
Table 3.8: Recipe for 10x Brady buffer.
10x Brady buffer 50 µl
Tris/HCl pH8,3 100mM
KCl 500mM
MgCl2 15-50mM
BSA 1mg/ml
Triton X-100 0,5% (v/v)
ddH2O ad 1000µl

Chapter 3 - Materials and Methods
61
Table 3.9: PCR primers for ES fusion transcript EWS-FLI1 (embedded PCR).
Gene 5’ sense 3’ antisense
EWS FLI-1
1. PCR CCACTAGTTACCCACCCCAAAC AACTCCCCGTTGGTSCCYTCC
EWS FLI1
2. PCR TCCTACAGCCAAGCTCCAAGTC GAATTGCCACAGCTGGATCTG
3.3.7 Digestion of DNA using restriction endonucleases
The sequence-specific hydrolysis of the DNA backbone was achieved by using
restriction endonucleases of the type II (Fermentas, York, UK). These are able to
recognise sequences that are palindromic and produce single strand cohesive
ends or blunt ends.
For a typical restriction digest a reaction volume of 20μl was used and the mix
was prepared with ddH2O (see Table 3.10):
Table 3.10: Recipe for restriction reactions.
Restriction reaction
dsDNA 0.7pmol
Buffer (10x) 1x
Restriction enzyme 5U
The volume of the restriction enzyme should not exceed 10% of the total volume
as the glycerol supplied with the enzyme will inhibit the reaction. Thus, only

Chapter 3 - Materials and Methods
62
0.5μl of enzyme, typically 10Units/μl (U/μl) were used when carrying out double
digests.
The reaction mixture was incubated in a water bath or heating block at 37°C for
1 hour and heat inactivated at 65°C or 80°C according to manufacturer’s
information.
3.3.8 Hybridisation of DNA-oligo single strands
Lyophilised sense and antisense oligonucleotides were re-suspended in
hybridisation buffer (see Table 3.11 and 3.12), adjusting the stock to a
concentration of 100µM each. Both stocks were combined to a final
concentration of 10µM in 10x buffer O+ (Fermentas) and ddH2O. To denature
possible secondary structures the mix was heated for 30 seconds at 95°C.
Subsequently, the thermomixer (Eppendorf) was switched off and the
hybridisation mix was allowed to slowly cool down to room temperature within
the heat block. During the cooling down process hybridisation could occur
during which the complimentary strands annealed. The generated duplexes were
stored at -20°C until further use.

Chapter 3 - Materials and Methods
63
Table 3.11: Hybridisation buffer used for DNA oligos.
Hybridisation buffer
NaCl 100mM
Tris 25mM
pH 7.5
Table 3.12: Oligonucleotides for cloning of shRNA-plasmids, 5' - 3' (Purimex, Grebenstein,
Germany).
Gene Orientation Sequence
CXCR4 Sense GATCCCCCACCCTGTTTCCGTGAAGAATTCAAGAGAT
TCTTCACGGAAACAGGGTTTTTCTAGAAAG
Antisense TCGACTTTATAGAAAAACCCTGTTTCCGTGAAGAATC
TCTTGAATTCTTCACGGAAACAGGGTGGGG
MLL/AF4 Sense GATCCCCGAGAAAAGCAGACCTACTCCATTCAAGAG
ATGGAGTAGGTCTGCTTTTCTCTTTTTG
Antisense TCGACAAAAAGAGAAAAGCAGACCTACTCCATCTCT
TGAATGGAGTAGGTCTGCTTTTCTCGGG
3.3.9 Isolation of DNA-fragments from agarose gels
Following restriction digestion of plasmid DNA and agarose gel electrophoresis,
linearised DNA fragments of interest were isolated from the agarose gel. DNA
band is illuminated using a UV light source and the specific band is excised
using a sterile scalpel blade. The DNA was extracted from the gel using the
QIAquick Gelextraction Kit (Qiagen).

Chapter 3 - Materials and Methods
64
The excised agarose gel piece containing the DNA was put into a 2ml reaction
tube and weighed on a balance. Three volumes of QG buffer (Qiagen; 100µl
buffer equivalent to 100mg agarose gel) were added to and the mixture was
incubated for 10-15 minutes at 50°C until complete dissolution of the gel piece.
One volume of isopropanol was added to the reaction mixture, up to 700µl were
applied onto a QIAquick spin column and the DNA bound to the matrix by
centrifugation for 1 minute at full speed in an microcentrifuge. Subsequently, the
flow-through was discarded and the column was washed with 500µl of QG
buffer and again centrifuged for 1 minute at full speed to remove any residual
agarose or QG buffer. Flow-through was thrown away and the column was
washed with 750µl of PE buffer (Qiagen). The column was transferred to a new
2ml collection tube and dried by centrifugation at full speed for 1 minute. DNA
was eluted from the column by incubation with 30µl of pre-warmed EB buffer
(Qiagen) and centrifugation for 5 minutes at full speed.
3.3.10 Ligation of DNA-fragments
DNA-fragments that were obtained from gel extraction, restriction digests or
hybridisation were ligated to obtain the required complete circular plasmid with
insert suitable for subsequent transformation.
Therefore, a ligation reaction consisting of the plasmid DNA and insert DNA
was carried out using T4 DNA ligase (Fermentas). This enzyme catalyses the
ligation between the phosphate group of one strand of DNA with the hydroxyl
group of the other. The amount of plasmid to insert used in this work was 1:3 and
1:6 ratio of vector to insert respectively. Typically, 1U of T4 DNA ligase per μg

Chapter 3 - Materials and Methods
65
DNA, 1μl T4 ligase buffer (Fermentas), vector and insert mixture was made up
to 10-15μl with ddH2O and incubated overnight at 14°C.
Transformation of competent E. coli was subsequently carried out using 1-2μl of
the ligation mixture and the rest was stored for short term storage at -20°C.
3.3.11 Agarose gel electrophoresis for separation of DNA-fragments
Agarose gel electrophoresis allows the separation of DNA fragments according
to their size and possible secondary structures (for example intact plasmids). To
achieve separation DNA samples were loaded onto a 0.8-2% agarose gel
according to their expected size, in which a higher concentration of agarose is
used to separate smaller fragments. Due to the negative charge of the sugar-
phosphate backbone of the DNA, it migrates towards the positive electrode once
an electrical current is applied.
Loading dye buffers and DNA ladders were applied to be able to monitor the
degree of migration in the agarose gel and to size fragments. Loading buffer
consisted of bromophenol blue, glycerol and Tris (Fermentas). Four μl of this
loading buffer was mixed with 16μl of DNA sample for loading onto the gel.
The appropriate amount of agarose powder (Invitrogen) was completely
resuspended in 1x Tris/boric acid/EDTA (ethylediaminetetraacetic acid) (TBE;
see Table 3.13) buffer by heating in a microwave and poured into a casting stand
(Agarose gel electrophoresis unit, BIO-Rad). A comb was placed into the stand
and the gel was allowed to set for 30 minutes. The gel was transferred to an
electrophoresis tank filled with TBE, and DNA samples mixed with loading dye
were loaded into the pockets formed by the comb. To allow band size

Chapter 3 - Materials and Methods
66
approximation 5μl of DNA ladder (Fermentas) was loaded alongside the DNA
samples. The type of ladder was chosen before to match the sizes of the DNA
samples. A voltage of 80V was impressed for approximately 45 minutes.
The gel was transferred into a tank containing water and ethidium bromide and
allowed to stain for 10-15 minutes. Ethidium bromide intercalates the DNA,
which then can be visualised by using the fluorescence of ethidium bromide
when visualised by ultraviolet light. The DNA was visualised and recorded using
a BIO-Rad system.
Table 3.13: Recipe for TBE buffer.
TBE buffer 1x
Tris base 89mM
Boric acid 89mM
EDTA-Na2 2mM
ddH2O ad 1000ml
pH 8.0
3.3.12 Reverse transcription polymerase chain reaction
Total RNA isolated from cells was used to synthesis cDNA with the Revert Aid
H Minus First Strand cDNA Synthesis kit (Fermentas) in a reverse transcription
polymerase chain reaction (RT-PCR) using the recipe described in Table 3.14.
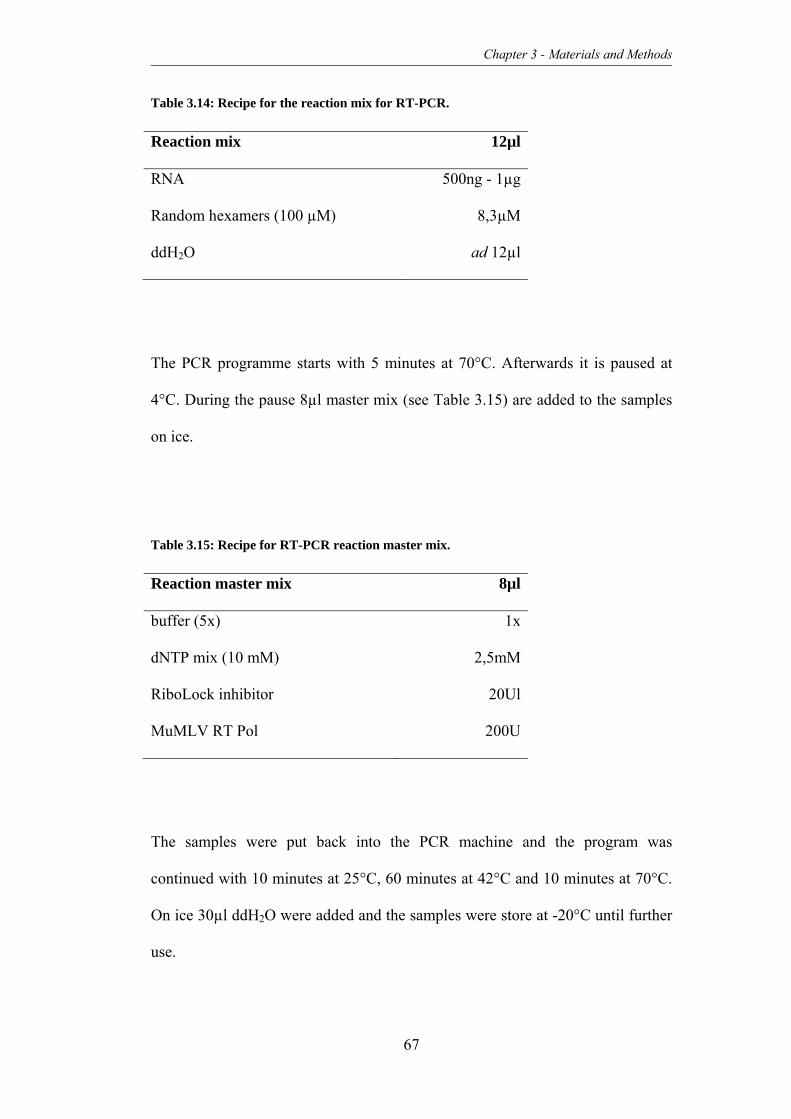
Chapter 3 - Materials and Methods
67
Table 3.14: Recipe for the reaction mix for RT-PCR.
Reaction mix 12µl
RNA 500ng - 1µg
Random hexamers (100 µM) 8,3µM
ddH2O ad 12µl
The PCR programme starts with 5 minutes at 70°C. Afterwards it is paused at
4°C. During the pause 8µl master mix (see Table 3.15) are added to the samples
on ice.
Table 3.15: Recipe for RT-PCR reaction master mix.
Reaction master mix 8µl
buffer (5x) 1x
dNTP mix (10 mM) 2,5mM
RiboLock inhibitor 20Ul
MuMLV RT Pol 200U
The samples were put back into the PCR machine and the program was
continued with 10 minutes at 25°C, 60 minutes at 42°C and 10 minutes at 70°C.
On ice 30µl ddH2O were added and the samples were store at -20°C until further
use.

Chapter 3 - Materials and Methods
68
3.3.13 Quantitative real time polymerase chain reaction
To detect and simultaneously quantify the expression of specific targeted genes,
cDNA (can range from 200ng transcribed RNA to up to 5µg RNA, standard
condition is 1µg transcribed RNA) derived from total RNA was used in a
quantitative real time polymerase chain reaction (qRT-PCR) using the reaction
mix described in Table 3.16. For detection of the amplicon SYBR® Green QCR
Supermix w/ROX (Invitrogen, Paisley, UK) was used, which intercalates with
dsDNA and on doing so emits a fluorescent signal of specific wave-length. ROX
was used as a reference dye. The ABI 7500 Fast Real-Time PCR system
(Applied Biosystems) was used.
Table 3.16: Recipe for the qRT-PCR reaction mix.
Reaction mix 10µl
Primer (10µM fw+rev mix) 300nM
SyBr-Green master mix (2x) 1x
cDNA 200ng - 5µg
ddH20 ad 10µl
The master reaction mix was prepared without the sample cDNA and 8µl were
added per well required of 384-well plate. The template cDNA was added to the
appropriate wells to reach 10µl total reaction volume. The plate was sealed and
briefly centrifuged.

Chapter 3 - Materials and Methods
69
The qRT-PCR was performed with the following temperature profile
(Table 3.17). The signal was recorded at the 60°C-amplification step.
Table 3.17: qRT-PCR cycling conditions.
cycles temperature time
Dissociation (1x) 50°C 2 minutes
95°C 10 minutes
Amplification (40x) 95°C 15 seconds
60°C 1 minute
Amplicon-dissociation (1x) 95°C 15 seconds
60°C 1 minute
All samples were performed in triplicate and water was used as a negative
control to look for eventual primer dimers. Glycerinaldehyd-3-phosphat-
dehydrogenase was used for normalisation and all primers were checked for
quality by loading the qRT-PCR sample onto a DNA-polyacrylamide (PAA) gel
and performing a polyacrylamide gel electrophoresis (PAGE) to check amplicon
length and possible side products.
Analysis of the data was performed using ABI SDS 2.2 System software and by
using the ∆∆Ct method. Here, SYBR-Green was used as a reporter dye for
accumulating amplification products. The intensity of the emitted SYBR Green
signal can be assumed as being proportional to the amount of amplified DNA.

Chapter 3 - Materials and Methods
70
3.3.14 DNA polyacrylamide gel electrophoresis
The method of PAGE is especially performed for small amplicons typically
generated by qRT-PCR primers as a vertical PAA gel in a TBE buffer system is
used (see Table 3.13). This produces smaller mesh pore sizes and so leads to a
higher resolution of the small amplicons. Typically, for an expected product size
smaller than 50bp a 10%-TBE-PAA gel, for a product size of 50bp-300bp an
8%-TBE-PAA gel and for product sizes of 300bp-500bp a 6%-TBE-PAA gel
would be performed.
To produce two TBE-PAA-gels the recipe described in Table 3.18 was used.
Table 3.18: Example for the recipe for an 8% TBE-PAGE gel.
8%-TBE-PAGE (example)
40% Acrylamide/Bisacrylamide solution
(37.5:1)
8% (v/v)
5x TBE buffer 1x
ddH2O ad 10ml
Ammonium persulfate, APS (10%) 0,1% (v/v)
Tetramethylethylenediamine, TEMED 0,17% (v/v)
If samples of a qRT-PCR had to be analysed the seal of the 348-well plate was
punctured, 2µl 6x DNA loading buffer were added to the sample and 5µl of
this/well were loaded on a gel.

Chapter 3 - Materials and Methods
71
3.3.15 DNA sequencing
Constructed plasmids were sequenced by Eurofins MWG Operon's sequencing
service (Ebersberg, Germany). Primers were provided (see Table 3.19) as
required and purchased before sequencing through Sigma.
Eurofins MWG Operon uses the Cycle Sequencing Technology (dideoxy chain
termination/cycle sequencing), which is modified from the traditional Sanger
sequencing method. The components are DNS, primer, heat-resistant DNA-
polymerase, four dNTP’s, four ddNTP’s (dideoxy terminator nucleotides), which
are labelled with four different fluorescent markers as well as buffer containing
Mg2+ and K+ ions. The single primer binds to the DNA and is elongated in a
linear manner until a ddNTP is bound. The polymerase is not able to elongate the
fragment due to the dideoxy-characteristic of the nucleotide and the process is
aborted.
An ABI 3730XL Sequencer (Applied Biosystems) was used.
Table 3.19: Sequencing primers.
Plasmid Primer sequence
pSUPER T7 primer AATACGACTCACTATAG
pEPI Fwd pEPI CTGAAAGAGATTGTAGAA

Chapter 3 - Materials and Methods
72
3.4 Mammalian cell culture
3.4.1 Cell lines
For in vitro and in vivo studies ES/PNET cell lines CADO-ES1, RD-ES, RM-82,
TC-71, VH-64 and WE-68 were used. These 6 cell lines represent Ewing’s
sarcoma cells with different fusion transcrips and thus were chosen for the
experiments (see Table 3.20).
The prostate carcinoma cell lines PC3M and LNCaP (both cell lines behave in
vivo in a metastatic manner) and the OS cell line SaOS-2 (chosen as cells were
isolated from primary site and have been shown to grow in vivo, see chapter
6.1.2.1) were used as an addition for the mouse model on bone malignancies (see
Table 3.20).

Chapter 3 - Materials and Methods
73
Table 3.20: Type and origin of cell lines.
Cell line Type ES
translocations
Origin Co-operator
CADO-ES1 ES t(21;22)(q22;q12) pleural effusion Dr. van Valen
RD-ES ES t(11;22)(q24;q12) humerus Dr. van Valen
RM-82 ES t(21;22)(q22;q12 femur Dr. van Valen
TC-71 ES t(11;22)(q24;q12) humerus
(relapse)
T. J. Triche
VH-64 ES t(11;22)(q24;q12) pleural effusion Dr. van Valen
WE-68 ES t(21;22)(q22;q12 Fibula Dr. van Valen
SaOS-2 OS Primary site Prof. Lunec
LNCaP CaP Lymph node
metastasis
Prof. Robson
PC3M CaP Transplant from
mouse (PC3)
Prof. Robson
3.4.2 Culture media and supplements
To produce growth medium, Roswell Park Memorial Institute (RPMI) 1640
medium, a modification of McCoy′s 5A Medium, containing 1000mg glucose/L
pyridoxine HCL and NaHCO3 was routinely supplemented with 10% (v/v) foetal
calf serum (FCS) and 2mM L-glutamine. If necessary, 100IU/ml Penicillin and
100μg/ml Streptomycin were added to the medium.
To obtain cryopreservation medium, growth medium was additionally
supplemented with 10% (v/v) DMSO and further 10% (v/v) of FCS to obtain a
final concentration of 20% (v/v) FCS. DMSO prevents ice crystal formation
within the cells during storage.
All media was stored at 4°C and pre-warmed to 37°C in a water bath before use.

Chapter 3 - Materials and Methods
74
3.4.3 Collagen coating of tissue culture plastic
To provide suitable conditions for ES/PNET derived cell lines all tissue culture
plasticware had to be coated with collagen I. Rat collagen I (BD Bioscience) was
diluted in a 0.1N HAc solution to a final concentration of 0.2mg/ml.
Cell culture flasks (25cm2 and 75cm2) with filter-lid (Corning Incorporated) were
coated with 1.5ml/flask or 4.5ml/flask, respectively. The collagen I-solution was
left in the flasks for 2 days with the lid closed. After discarding the solution from
the flasks these were left to dry with open lids in an activated safety cabinet
overnight.
Tissue culture well plates (Corning Incorporated) were coated with the same
collagen I-solution. 96-well plates were coated with 50µl/well of the solution and
from this the amount of solution required was scaled up according to the size of
the well plate (6-, 24-, 48-well).
3.4.4 General cell culture and cell harvesting
All mammalian cells were grown in 5% CO2 humidified atmosphere in a 37°C
incubator. The cells were passaged on a regular basis in a safety cabinet every
2-3 days at a ratio of 1:5 to 1:6 once a confluence of 80-90% was achieved.
Cells were detached from the coated cell culture plastic ware by washing off
residual medium with PBS (see Table 3.21) before incubation at 37°C with pre-
warmed 1:10 Trypsin/EDTA 10x (see Table 3.22) in PBS solution for
approximately 1-2 minutes inside an incubator. The digestion of surface proteins
was stopped by adding FCS-supplemented medium. The cells were centrifuged
for 5 minutes at 300g to pellet them and the supernatant was discarded. The

Chapter 3 - Materials and Methods
75
remaining cell pellet was re-suspended in an appropriate volume of pre-warmed
media to be used for further culturing or experiments.
Table 3.21: Recipe for PBS buffer.
PBS
NaCl 137mM
KCl 2.7mM
Na2HPO4 4.3mM
pH 7.4
PBS was prepared using PBS tablets resuspended in deionised water. The
solution was autoclaved in house at >120°C for sterility.
Table 3.22: Recipe for Trypsin/EDTA solution.
Trypsin/EDTA solution 10x
Trypsin 0.5% (v/v)
EDTA 0.2% (w/v)
NaCl 0.9% (w/v)
pH 7.4
If experiments were performed involving attachment abilities of the cells, a less
drastic detachment method using cell dissociation buffer was performed (see
Table 3.23):

Chapter 3 - Materials and Methods
76
Table 3.23: Recipe for cell dissociation buffer.
Cell dissociation buffer
TrisHCl 0.04mM
EDTA 1mM
NaCl 0.15M
pH 7.4
The buffer was sterilised by using a steam autoclave or sterile filters.
An appropriate amount of cell dissociation buffer was added to the previously
washed cells and the cells were incubated for 10 minutes at 37oC. Dissociated
cells were collected in a tube, centrifuged at 300g and washed with pre-warmed
PBS. Subsequently, cells could be used for experiments as required.
3.4.5 Cell counting
After harvesting, cells were routinely counted using an Improved Neubauer
counting chamber (Hawksley, Lancing, UK). The particles of a trypan blue
solution given to the cells get into the cells. Only viable cells are able to export
these again and thus viable cells can be distinguished from dead cells and
counted.
Briefly, cells were harvested as described before and 45µl of the cell solution
were mixed with 5µl of a 0.4% Trypan blue solution. This mix was allowed to
diffuse beneath the cover slip of the haemocytometer. Cells in 4x4 squares of the
grid were counted under a light microscope using x20 magnification. The

Chapter 3 - Materials and Methods
77
average was divided by 4 (squares) and 10 (dilution) to obtain the number of
cells in million per millilitre of the cell solution. Viable cells were distinguished
by their ability to exclude the Trypan blue. Therefore, dead cells appeared blue
while viable ones appeared bright and lighter.
3.4.6 Cell cryopreservation
All cells were routinely cryopreserved for long term storage at, ideally, an early
passage number. After harvesting and counting of cells these were centrifuged
and the pellet was re-suspended in an appropriate volume of cryopreservation
medium to obtain an approximate density of 1x10⁶ cells/ml (see Table 3.24). One
ml of the solution of cells was transferred into a cryo-tube (Nunc) and placed in
an isopropanol filled container. Transferring the cells from room temperature to
-80°C in an isopropanol filled container allows a gradual cooling of cells at a rate
of 1°C per minute. For long-term storage cells were transferred to liquid nitrogen
(-196°C).
Table 3.24: Recipe for cryopreservation medium.
Cryopreservation medium
FCS 20% (v/v)
DMSO 10% (v/v)
RPMI ad 50ml

Chapter 3 - Materials and Methods
78
3.5 In vitro assays on mammalian cells
3.5.1 Cytospin
Cells were harvested and counted as described before and 2x10⁵ cells in 200µl
were pipetted into the cytofunnel placed on a glass slide. Cytospins were
performed for 6 minutes at 115g using a Shandon CytoSpin III Cytocentrifuge
(Thermo Fisher Scientific, Schwerte, Germany). Afterwards, the glass slides
were dried for 10 minutes at the air and stained for 30 seconds in May-Grünwald
and 4.5 minutes in Giemsa.
3.5.2 Cell viability assay using MTT
This assay is used to measure the proliferation of cells. To quantify living cells
mitochondria are stained (indirect quantification) with 3-([4,5-Dimethylthiazol-
2-yl]-2,5-dimethyltetrazoliumbromide (MTT). MTT is a yellow tetrazolium-salt
that is soluble in water and taken up by mitochondria. Within the mitochondria
this salt is reduced to a non-soluble blue formazan by mitochondrial
dehydrogenases.
Usually this test was used to either determine the growth rate of cells or to
quantify cells and their growth subsequent to a test (e.g. adhesion test).
Cells were either simply cultivated in 96-well plates or according to specific test
conditions (see growth and adhesion assays).

Chapter 3 - Materials and Methods
79
Ten µl MTT (5mg/ml in PBS) was given into each well onto the cells using a
Multipette plus (Eppendorf AG) and plates were incubated for 3 to 4 hours in an
incubator at 37°C.
Afterwards the MTT-containing supernatant was aspirated and 100µl of lysis-
buffer were pipetted onto the cells and plates were moved carefully back and
forth to insure that the resulting solution is equally mixed (see Table 3.25).
The optical density of the solution was measured using an ELISA-reader
(FLx800, BioTek, Winooski, USA) at 550nm, using a reference measurement at
630nm. Values measured at 630nm were subtracted from values measured at
550nm.
Table 3.25: Recipe for lysis buffer for mammalian cells.
Lysis buffer
Dimethylformamid 50% (v/v)
ddH2O 50% (v/v)
Sodium dodecyl sulfate 69.3mM
To remove all remaining solids the buffer was filtered after complete solution.
3.5.3 Adhesion assay
To test whether specific agents influence the adhesion of cells to collagen-coated
cell culture flasks an adhesion assay was performed. It was essential to use a
PBS2+ solution for collagen-coating of 96-well plates that was supplemented with
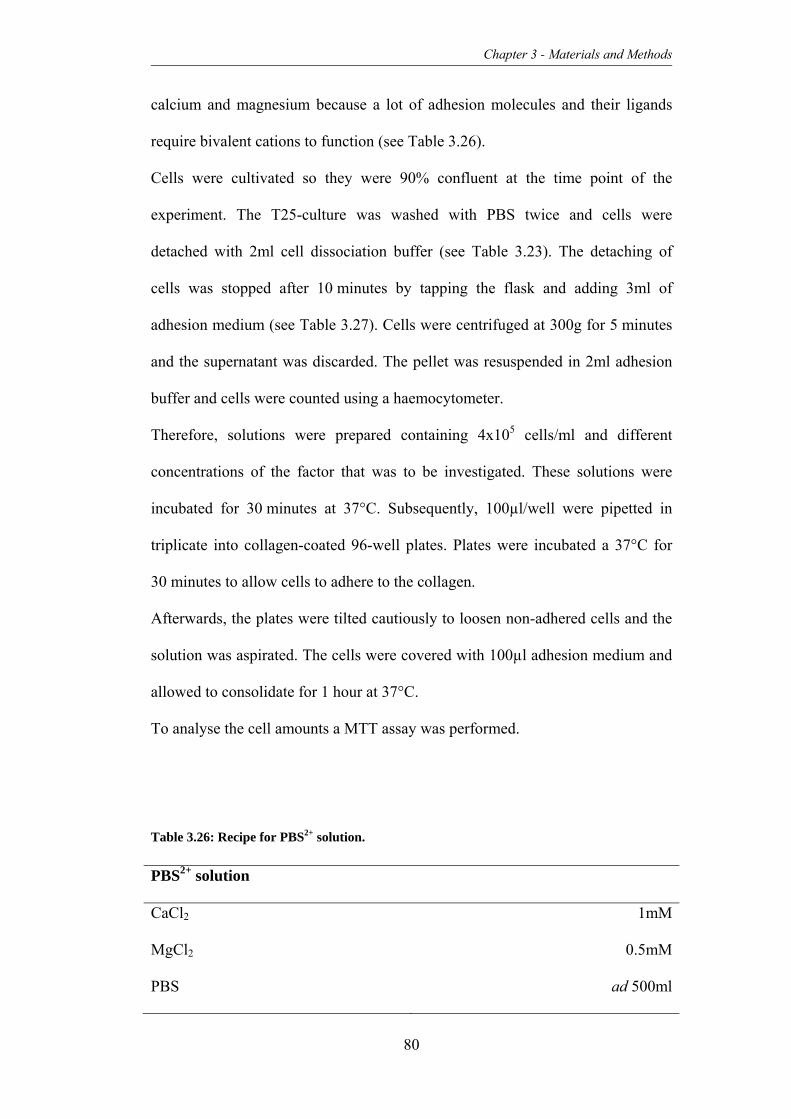
Chapter 3 - Materials and Methods
80
calcium and magnesium because a lot of adhesion molecules and their ligands
require bivalent cations to function (see Table 3.26).
Cells were cultivated so they were 90% confluent at the time point of the
experiment. The T25-culture was washed with PBS twice and cells were
detached with 2ml cell dissociation buffer (see Table 3.23). The detaching of
cells was stopped after 10 minutes by tapping the flask and adding 3ml of
adhesion medium (see Table 3.27). Cells were centrifuged at 300g for 5 minutes
and the supernatant was discarded. The pellet was resuspended in 2ml adhesion
buffer and cells were counted using a haemocytometer.
Therefore, solutions were prepared containing 4x10⁵ cells/ml and different
concentrations of the factor that was to be investigated. These solutions were
incubated for 30 minutes at 37°C. Subsequently, 100µl/well were pipetted in
triplicate into collagen-coated 96-well plates. Plates were incubated a 37°C for
30 minutes to allow cells to adhere to the collagen.
Afterwards, the plates were tilted cautiously to loosen non-adhered cells and the
solution was aspirated. The cells were covered with 100µl adhesion medium and
allowed to consolidate for 1 hour at 37°C.
To analyse the cell amounts a MTT assay was performed.
Table 3.26: Recipe for PBS2+ solution.
PBS2+ solution
CaCl2 1mM
MgCl2 0.5mM
PBS ad 500ml
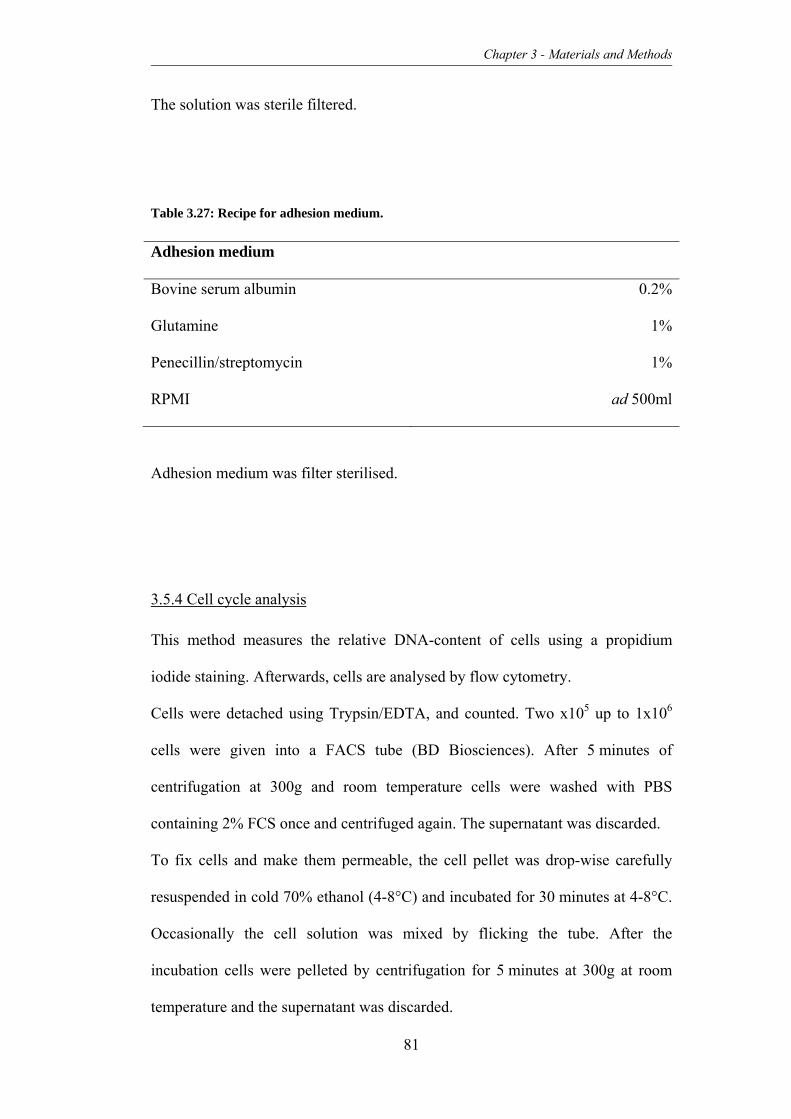
Chapter 3 - Materials and Methods
81
The solution was sterile filtered.
Table 3.27: Recipe for adhesion medium.
Adhesion medium
Bovine serum albumin 0.2%
Glutamine 1%
Penecillin/streptomycin 1%
RPMI ad 500ml
Adhesion medium was filter sterilised.
3.5.4 Cell cycle analysis
This method measures the relative DNA-content of cells using a propidium
iodide staining. Afterwards, cells are analysed by flow cytometry.
Cells were detached using Trypsin/EDTA, and counted. Two x105 up to 1x10⁶
cells were given into a FACS tube (BD Biosciences). After 5 minutes of
centrifugation at 300g and room temperature cells were washed with PBS
containing 2% FCS once and centrifuged again. The supernatant was discarded.
To fix cells and make them permeable, the cell pellet was drop-wise carefully
resuspended in cold 70% ethanol (4-8°C) and incubated for 30 minutes at 4-8°C.
Occasionally the cell solution was mixed by flicking the tube. After the
incubation cells were pelleted by centrifugation for 5 minutes at 300g at room
temperature and the supernatant was discarded.

Chapter 3 - Materials and Methods
82
Subsequently the pellet was resuspended in 500µl PBS containing 2% FCS, 20µl
RNAse A stock solution (see Table 3.28; end concentration of 400µg/ml) and
100µl propidium iodide stock solution (end concentration of 10µg/ml; Carl Roth
GmbH & Co. KG, Karlsruhe, Germany) and incubated for 1 hour in the dark.
After the incubation the solution was topped up with 2ml of PBS, centrifuged at
300g for 5 minutes at room temperature. The supernatant was discarded and the
pellet resuspended in 100µl PBS.
Cells were analysed using a FACS Canto or flow cytometer (BD Biosciences).
Table 3.28: Recipe for RNAse A-solution.
RNAse A-solution
RNAse A 10mg/ml
TrisHCl 10mM
NaCl 15mM
pH7.5
3.5.5 Colony-forming assay
To investigate the potential to grow in colonies under non-adherent conditions
colony-forming assays were performed. These give information about the ability
of cells or cell lines to grow under substrate independent conditions.
Stocks of methylcellulose, 2% (v/v) BSA in RPMI medium and FCS were sterile
filtered and used for the experiment. Each colony assay was performed in
duplicate in 30mm petri dishes (Nunc).

Chapter 3 - Materials and Methods
83
Cells were detached using cell-dissociation buffer, counted and then diluted to
achieve the required cell suspensions. The cell suspension was mixed with the
serum-containing colony-forming assay medium using a 1.2 Gauge (G) needle
and a 5ml-syringe (see Table 3.29).
Table 3.29: Recipe for serum-containing colony-forming assay medium.
Colony-forming assay medium 5ml
Methylcellulose 45% (v/v)
FCS 15% (v/v)
RPMI 16% (v/v)
Cell suspension in RPMI 24% (v/v)
The cells were plated carefully into the dishes avoiding the development of air
bubbles. Per cell line two dishes with 500 cells/ml and two dishes with
1000 cells/ml were prepared. Colonies were counted after 14 days under a light
microscope and photographs were taken for documentation. The entire
experiment was carried out twice.
3.5.6 Transfection of mammalian cells using LipofectaminTM
On the day before transfection of cells, these were plated in 1000μl of growth
medium in 12-well format so that the cells would be 50–80% confluent at the
time of transfection.

Chapter 3 - Materials and Methods
84
The next day complexes were prepared for each transfection sample as follows
(according to supplier’s manual, Invitrogen):
1. One μg of plasmid DNA was diluted in 200μl Opti-MEM® I Reduced Serum
Medium and mixed thoroughly.
2. PLUS™ Reagent was mixed gently before use and added directly to the
diluted DNA from step 1. The solution was gently mixed by inversion and
incubated for 5 minutes at room temperature.
3. The Lipofectamine™ LTX solution was mixed by inversion and 2.5μl were
added to the DNA solution. The DNA-lipid complex was incubated for 30
minutes at room temperature.
After incubation approximately 200μl of the complex was added drop-wise to the
well containing the previously seeded cells. To dispense the complex evenly over
the cells the plates were rocked gently back and forth.
The cells were incubated at 37°C in a CO2 incubator for 18-48 hours prior to
testing for transgene expression and the medium was exchanged after 12 hours
post lipofection. As soon as the wells were around 90% confluent, cells were
transferred to collagen-coated T25 cell culture flasks.
If necessary, it was possible to scale the lipofection mix down by using 24- or
48-well plates and amending the amounts of reagents and DNA used in the
experiment.

Chapter 3 - Materials and Methods
85
3.5.7 Flow cytometry
Flow cytometry using fluorescently labelled antibodies offers the opportunity to
characterise cell populations by specific markers. In this work only cell surface
markers were analysed.
Cells were harvested, counted and 2x10⁵ to 1x10⁶ cells were re-suspended in
100μl PBS. Samples were treated with 5μl of fluorescently conjugated antibodies
to markers of interest and incubated for 20 minutes in the dark. Afterwards the
samples were washed twice with 1ml of PBS and centrifuged at 300g for
5 minutes. Following this, cells were re-suspended in 200μl PBS and were ready
to be analysed on the FACS Canto or FACS Calibur (BD Bioscience). At least
100,000 events were acquired. An unstained sample was used as a negative
control.
FITC-Mouse Anti-Human CD99 and APC-Mouse Anti-Human CD184 (also
called CXCR4, clone 12G5) were both purchased from BD Bioscience.
3.5.8 Fluorescence activated cell sorting (FACS)
Where necessary, cells were prepared as described previously (3.5.7). Cells that
harboured a plasmid containing an eGFP-gene were auto-fluorescing and thus
did not have to be labelled.
Cells were harvested, counted and the solution was adjusted to a cell
concentration of approximately 5x10⁶ cells per 100μl with the total volume of
solution not exceeding 300μl in growth medium. The FCS contained within the
medium was filtered using a 0.2μm Minisart syringe filter (Sartorius Stedim
Biotech S.A., Aubagne Cedex, France) prior to being added to media. Prior to
Chapter 3 - Materials and Methods
86
cell sorting, the FACS Vantage SE cell sorter (BD Biosciences) was sterilised
with 70% ethanol solution and washed with water and growth medium. Cells
were acquired at a moderate event rate, typically 0.8-1.3x10³ cells per second,
and sorted fractions were collected in growth medium.
After sorting, at least 300-500 sorted cells were re-acquired to assess purity of
the desired population.
Depending on the amount of sorted cells, these were taken back into culture in
96-well or 6-well plates or directly in T25-tissue culture flasks.
3.6 In vivo assays on mammalian cells
3.6.1 Keeping of animals
In vivo experiments performed at Newcastle University were done under Home
Office license number PPL 60/3846 and ethical approval with the
ERC Project ID 203. Experiments performed in Münster were approved by the
district government licence number G54/2005. All care and experiments were
carried out according to individual personal license and project license
regulations. If necessary, advice or treatment was given from the on-site
veterinary surgeon.
Animals selected for experiments in at the University Hospital in Münster were
NOD/LtSz-Prkdcscid/J mice (hereafter referred to as NOD/Scid, The Jackson
Laboratory, Maine, USA) and at the Northern Institute for Cancer Research in
Newcastle upon Tyne NOD.Cg-Prkdcscid Il2rgtm1wjl/SzJ mice (hereafter referred

Chapter 3 - Materials and Methods
87
to as NSG, The Jackson Laboratory, Maine, USA). The reasons for choosing
these specific strains will be further discussed in chapter 3 and 5, respectively.
Due to the immunodeficiency of these mouse strains housing, handling
and general care of these mice was carried out using aseptic techniques such as a
laminar flow hood (Faster Ultrasafe Class II Microbiological safety cabinet,
Wolf laboratories Ltd, Yorkshire, UK). It was not possible to image mice under
sterile conditions but all possible safety precautions were taken such as wiping of
surfaces with ethanol, wearing of gloves, disposable paper lab coats and face
masks to avoid extensive exposure of mice to pathogens.
In Münster, as well as in Newcastle upon Tyne, mice were bred on site and
maintained in single sex groups not exceeding five mice per cage. Bubble style
isolators or individually ventilated cages were used for housing of mice, bedding
and irradiated diet were exchanged once a week in a changing station. Water was
provided in sterile disposable water packs or water bottles with autoclaved
nozzles.
Handling was only performed when wearing disposable paper lab coats or clean
surgical gowns and nitrile gloves. These were sprayed down with disinfectant
between handling individual cages.
Once mice showed signs of tumour formation or generally appeared unwell
(inactivity, breathing problems, hunched back, and untended fur), they were
euthanized by high cervical dislocation.

Chapter 3 - Materials and Methods
88
3.6.2 Preparation of animals for surgical procedures
The induction of the anaesthesia of experimental animals was carried out in a
small chamber connected to an Isofluorane vaporiser and oxygen supply (Mie
Cavendish 500 anaesthetic machine, fitted with an Ohmeda Isotec 400 volatile
anaesthetic vaporiser and Fluovac scavenge system, Key Health Solutions Ltd,
Wiltshire, UK). Excess anaesthetic was scavenged for safety. Typically 4-5%
Isofluorane (IsoFlo, Abbott Laboratories, Maidenhead, UK) was supplied in
1500cc/min oxygen. To determine suitable depth of anaesthesia the chamber was
cautiously tilted to check if mice still had a righting reflex. Furthermore, the foot
withdrawal in response to mild pain was used to determine suitable depth of
anaesthesia.
Anaesthetised mice were afterwards transferred to a face mask supplying
Isofluorane in oxygen and maintained at a suitable depth of anaesthesia. Usually,
this required between 2.5-4% Isofluorane in oxygen dependent on the mice
weight. To assure that mice would not suffer after the procedure, 10μl of
Carprofen (Rimadyl, Pfizer, Kent, UK) per 10g body weight was injected
subcutaneously (s. c.) into the skin over the back of the mouse.
All required anaesthetics and veterinary medicine were sourced through the
responsible veterinarian of the Comparative Biology Centre, Newcastle
University.

Chapter 3 - Materials and Methods
89
3.6.3 Intravenous transplantation
To obtain a systemic spread of disease and model late stages of ES/PNET with
cells spreading and homing to different organs mice were transplanted
intravenously (i. v.).
NOD/Scid mice were irradiated with 3.5Gy 24 hours in a 60Co unit before
planned transplantation of cells. The next day, mice were transferred into a
laminar flow hood within their cage and an infrared heat-lamp was placed above
the open cage for 5-10 minutes. This increased the circulation to the surface
blood vessels (as the mouse regulates its body temperature) and led to expanding
of the diameter of veins in the tail. Hereafter, mice were trapped in a restraining
device, which was made of a 60ml syringe. The top which usually is attached to
the needle was cut off and closed with a rubber plug that was slotted dent to
allow the tail of the mouse to hang out of the device. The plunge was used to
restrain the mouse in space.
Immediately, 5x10⁶ cells in 100-200µl growth medium were transplanted into the
tail vein of these mice using a very small diameter needle with 27G. The mouse
was marked and released back into the cage and observed for a while to ensure it
recovered and calmed down after the procedure.
3.6.4 Intrafemoral transplantation
Orthotopic preclinical models are the gold standard for the characterisation of
tumour cell interaction with the microenvironment. Therefore, an intrafemoral
(i. f.) model for ES /PNET was developed within this thesis.

Chapter 3 - Materials and Methods
90
Male NSG mice where prepared for the procedure as described before and placed
supine breathing further anaesthesia. Subsequently, the right knee of the mouse
was shaved and disinfected.
The knee was flexed and grasped with the left hand to be able to puncture the
femur with a 25G needle. The position of the drill needle was checked carefully
to ensure, that the sample would be placed into the bone marrow cavity of the
femur. Sample volumes of up to 30μl with 1x10⁶ cells were subsequently
injected with a 30G insulin syringe through the previously drilled hole. Upon
needle withdrawal the leg was straightened to close the femoral puncture site and
minimise backflow of the cell suspension. Additionally, control transplantations
with medium injected into the right femur were performed.
3.6.5 Positron emission tomography tracer preparation
18F-2-Fluor-2-deoxy-D-glucose (FDG) for positron emission tomography (PET)
experiments was purchased from Iba Molecular UK Ltd. (Sheffield, UK). Where
possible, spare FDG originally delivered for patients was used. The tracer was
diluted with sterile saline if required, to obtain a solution of which an appropriate
amount could be used to inject 10MBq into mice.
The isotope 18F emits positrons with a half-life of 109.8 minutes, which can be
detected with a positron-emission tomography system. 18F is not found naturally
and has to be produced with the help of a cyclotron for example through positron
bombardment of the oxygen-isotope 18O.

Chapter 3 - Materials and Methods
91
3.6.6 Positron emission tomography
To be able to determine metastatic spread of ES/PNET and to characterise local
tumours that arose after i. f. transplantation of cells, PET scans of previously
injected mice were performed.
In Newcastle, all in vivo imaging experiments were performed in cooperation
with the group “Drug Discovery and Imaging” (Northern Institute for Cancer
Research, group leader Ross Maxwell).
PET scans were performed with the high-resolution Philips Mosaic HP (Philips
Medical Systems, Eindhoven, The Netherlands) with a field of view (FOV) of
128 x 120mm. The first PET scan in each mouse was performed approximately
two weeks after i. f. transplantation of tumour cells. Follow-up PET scans were
performed in different intervals.
Before tracer injection, mice were anaesthetised by Isoflurane/oxygen inhalation
for the entire experimental procedure or by an intraperitoneal (i. p.) injection of
Ketamin/Medetomidine (75mg/kg and 1mg/kg, respectively). Rectal temperature
was maintained at physiological values by use of a heating pad between the start
of the anesthesia and the experimental procedures. Scans were performed 1 hour
after i. v. injection of 10MBq FDG. Mice anaesthetised with Isoflurane/oxygen
were kept under anesthesia during the experimental procedure using a Minerve
Animal Anesthesia System (Equipement Vétérinaire Minerve, Esternay, France).
Within the machine the body temperature was maintained by air flow through the
animal bed. Once imaging had taken place, mice that had been anaesthetised with
Ketamin/Medetomidine were recovered through i. p. injection of 0.5-1mg/kg
Atipamezole. All mice were observed for 30 minutes after recovery from
anaesthesia.

Chapter 3 - Materials and Methods
92
Reconstruction of PET images was performed using the 3D-RAMLA algorithm
with no attenuation correction (Browne and de Pierro, 1996).
3.6.7 X-ray computed tomography
The technique of X-ray based computed tomography (CT) was used to visualise
and characterise eventual changes to bones that could occur through the injection
of tumour cells into the femur of mice. In this case NanoCT scans were carried
out using the Bioscan NanoCT (Bioscan, Paris, France), which is able to produce
data with resolution that is high enough to visualise the relatively fine bones of
mice.
The FOV for the scans performed was 150 x 75mm. Parameters of whole-body
images were: standard resolution, 180 projections, 55kVp, 1000ms exposure time
and 10-12 minutes acquisition time, leading to a dose of ~150Sv. The parameters
for scans of a higher resolution taken from just the lower limbs: ultra-fine
resolution, 360 projections, 45kVp, 400ms exposure time, 2-3.5 minutes
acquisition time, leading to a radiation dose of ~105Sv. The images were
reconstructed using the Exact Cone Beam FBP (Filtered Back Projection) with
the SheppLogan filter. The resulting voxel/pixel size is 0.10/0.096mm.
Mice were anaesthetised by Isoflurane/oxygen inhalation for the entire
experimental procedure using a Minerve Animal Anesthesia System
(Equipement Vétérinaire Minerve, Esternay, France) and a physiological body
temperature was ensured by air flow through the animal bed.

Chapter 3 - Materials and Methods
93
If PET scans were performed the same day as CT scans these were performed
before each PET scan using the same animal bed so that mice were kept in the
same position and a fusion of PET and CT images was possible afterwards.
3.6.8 Magnetic resonance imaging
MRI was used to describe the soft tissue component of tumours.
One week after the last PET and CT scans transplanted mice underwent a final
MRI scan. MRI scans were performed with a high-resolution 7T Varian MR
system (Varian Inc., Palo Alto, USA) using a Coil-Rapid 72mm quadrature
volume coil (RAPID Biomedical GmbH, Rimpar, Germany). Mice were
anaesthetised for the entire experimental procedure by Isoflurane/oxygen
inhalation and physiological temperatures were assured by the use of a rectal
thermometer and a heating pad on which mice were placed through the whole
procedure.
Parameters for the lung scans were: fast spin echo sequence with respiratory
gating, repetition time (TR) 2439ms, effective echo time (TE) 39ms, FOV
30 x 35mm, in plane resolution 0.13mm and slice thickness 2mm.
Parameters for the leg scans were: spin echo sequence, TR 500, TE 17, FOV
30 x 35mm, in plane resolution 0.13mm and slice thickness 2mm.
For analysis of tumour volumes the software Vnmr J (Varian) Version 2.3 Rev.
A was used.

Chapter 3 - Materials and Methods
94
3.6.9 Dissection of mice
In order to provide terminal analysis of tumour and metastasis development and
to recover organs for pathology mice were dissected subsequent to euthanasia.
Protocol limits were either a high tumour burden or a generally poor condition of
a mouse. Mice used as controls were euthanized once all experimental mice had
culled.
Intravenously injected mice were dissected and lungs, liver, kidneys and spleen
were taken for pathology. At this stage of the experimental work (Münster) it
was not possible to recover bone tissue for pathology. Thus, bone tissue was only
taken from mice when there was a clear sign of tumour development.
Additionally, the bone marrow of both femurae was recovered. Therefore, a
small section from each end of both femurs was clipped and bone marrow was
extracted by flushing the lumen with transplant media repeatedly using an insulin
syringe. Metastases from organs that were visible by eye and bone marrow
flushes were taken into culture in RPMI growth medium containing
Penicillin/Streptomycin. Using a sterile blade, tissues were disintegrated into fine
pieces and incubated for 1 hour in trypsin/EDTA to ensure that tissue would
break up. Following the enzymatic digest the tissue was pipetted up and down to
apply shearing force to further separate the cells. To obtain a single cell solution
for cultivation cells were forced through a fine mesh using a FACS tube with a
Cell Strainer Cap (BD Biosciences).
Lungs, liver, kidneys and spleen were collected from all i. f. transplanted mice.
Instead of collecting bone marrow from the hind limbs these were stripped of
skin and separated from the rest of the body by transection of the spin just above
the pelvis and the tail. Organs and hind limbs were fixed in formalin and

Chapter 3 - Materials and Methods
95
preserved in 70% ethanol. The hind limbs were decalcified to make them suitable
for pathological sectioning (see chapter 3.7.1).
3.7 Pathology
3.7.1 Immunohistochemistry
Samples of organs and metastases were fixed in 10% neutral buffered formalin
(4% formaldehyde in phosphate buffered saline), embedded in paraffin, and cut
into 4–5 μm thick sections. These were stained with hematoxylin and eosin or
used for immunohistochemistry to detect expression of huCD99 (commonly used
as an ES/PNET marker). Typically, lung, liver, kidneys and spleen were screened
for tumour cells also if no sign of metastases could be seen during dissection.
Staining for antigens was carried out as follows: slides were de-paraffinised, re-
hydrated and neutralised in hydrogen peroxide solution. Antigen retrieval was
performed by heating the slides twice for 5 minutes in 0.01M citrate buffer (pH
6.0) using a microwave. The slides were cooled down in the buffer and then
rinsed under tap water. Slides were then washed twice for 5 minutes in 50mM
Tris-buffered saline with a pH 7.6. A couple of drops Tween-20 were added to
break the surface tension.
Immunohistochemical staining was carried out manually using the Menapath Kit
(Menarini Diagnostics, Florence, Italy). Primary antibodies included monoclonal
rat anti-human anti-CD99 (Dako, Carpinteria, CA, USA) diluted 1:50 and
monoclonal rat anti-human anti-CD45 (Dako, Carpinteria, CA, USA) diluted

Chapter 3 - Materials and Methods
96
1:50. Diluted antibodies were dropped on the slides and incubated for 30-60
minutes. Slides were incubated for 10-20 minutes with the universal probe
(Manapath Kit) then incubated for 20-30 minutes with HPR polymer, 30 minutes
with VectaStain ABC reagent (Vector Laboratories, Peterborough, UK) and
washed under tap water for 5 minutes. Slides were 10 seconds counter-stained
with Harris’s hematoxylin (BDH, VWR International, Lutterworth, UK), rinsed
for 5 minutes under tap water, dehydrated, and cover-slipped. If not indicated
differently, rinses were performed using Tris-buffered saline wash buffer.
3.7.2 Haematoxylin and Eosin staining
This method gives consistent results and is very simple to perform.
Hematoxylin is used because it produces a stained section with clearly defined
nuclei in blue while the background stays completely colourless. The cytoplasm
stains in various shades of pink which helps to identify different tissues.
Sections were prepared as described before (see section 3.7.1). Subsequent, the
sections were stained for 15 minutes in hematoxylin solution and then wash in
running tap water for 20 minutes. Sections were counterstain with eosin (Leica,
Peterborough, UK) from 15 seconds up to 2 minutes depending on the age of the
eosin, and the desired depth of counterstain.
Finally, for dehydration sections were transferred to 95% and absolute alcohol
twice for 2 minutes each or until excess eosin was removed. Sections were
cleared in xylene twice for 2 minutes each and mounted.

Chapter 4 – Metastasis model for Ewing’s sarcoma in NOD/Scid mice
97
4. Chapter – Metastasis model for Ewing’s sarcoma in Non-
obese diabetic/Severe combined immunodeficient mice
(NOD/Scid)
4.1 Introduction
In the first half of the 19th century clinicians realised that there were common
features in the histology of ES/PNET and other sarcomas such as PNET, and
Askin tumour of the thoracic wall (see Chapter 1). The development of new
diagnostic techniques such as PCR has made it possible for these tumours to be
grouped as one entity due to the characterisation of the first chromosomal
translocation in this disease subtype. Thus, the Ewing’s family of tumours serve
as a model for understanding the biology of human sarcomas (Delattre et al.,
1992, 1994).
Despite this similarity the group of sarcomas is heterogeneous in clinical and
histochemical features and the exact cell or tissue of origin still remains unknown
(see chapter 1). ES of the bone alone shows differences in course of disease and
this heterogeneity reflects in treatment difficulties still present.
4.1.1 Metastasis in Ewing’s sarcoma and patient outcomes
It has been known for many years that ES/PNET is radiosensitive (Ewing, 1939).
Thus, for a long time radiotherapy combined with surgery was the gold standard
for treatment of this sarcoma. Nevertheless, more than 90% of patients receiving
immediate local radiotherapy died of systemic metastasis within two years of

Chapter 4 – Metastasis model for Ewing’s sarcoma in NOD/Scid mice
98
diagnosis. This demonstrates that micrometastases establish early on in the
course of this disease. Over the last 30 years, treatment protocols have combined
radiotherapy, chemotherapy and surgery leading to an improved prognosis for
ES/PNET patients and cure is achievable (see chapter 1).
Today, using modern multimodality therapy, one of the most important
prognostic factors is the occurrence of primary metastasis (see Figure 4.1). The
majority of tumours are primarily located in bony sites and while two thirds of
ES/PNET patients with localized disease can be cured, the 5-year event free
survival in patients presenting with osseous metastases or bone marrow
infiltration is less than one fifth (accounting for approximately 10% of patients),
while only 30% of patients with lung metastases survive (Paulussen et al., 1998a,
1998b, 2001).
Figure 4.1: Event free survival of ES/PNET patients in correlation with existence and
localisation of metastases. Localised disease (blue line), lung metastases (red line), bone
(marrow) metastases (green line). (EI)CESS 81-92 study (modified from (Jürgens et al., 2006).

Chapter 4 – Metastasis model for Ewing’s sarcoma in NOD/Scid mice
99
Metastatic disease is one of the most important factors influencing prognosis,
and thus the intensity of treatment. The mechanisms of metastasis in ES/PNET
remain unclear; therefore it is crucial to investigate the development of
metastasis in order to improve treatment strategies and patient outcome.
4.1.2 Mouse model systems in cancer research
For more than 50 years it has been possible to use in vivo models to investigate
complex correlations of cancerous diseases (Gellhorn and Hirschberg, 1955;
Oettel and Wilhelm, 1955). The first studies were mainly performed by the
National Cancer Institute (Bethesda, USA) with the three murine cell lines
sarcoma 180, L1210 leukemia, and carcinoma 755. However, concerns arose due
to the fact that the majority of studies were initially based on the murine L1210
leukemia model. Although relevant for some leukaemias, this model could have
potentially selected for anti-cancer drugs only effective against rapidly growing
tumours (Venditti et al., 1984).
During subsequent years, treatment of human leukaemia and lymphoma
improved as a result of preclinical work on combinations of different
chemotherapeutics in murine models of these malignancies (Zubrod, 1965; Frei
et al., 1965; DeVita and Schein, 1973). In contrast, no significant improvements
for human solid tumours were achieved (Suggitt and Bibby, 2005).
In 1966 a revolutionary publication describing a nude athymic (nu/nu) mouse
strain (Flanagan, 1966) enabled the establishment of different human solid
tumour xenografts, including breast, colon and lung tumours (Rygaard and
Povlsen, 1969; Geran et al., 1972).

Chapter 4 – Metastasis model for Ewing’s sarcoma in NOD/Scid mice
100
Many more mouse strains have since been developed and preclinical models
have played a crucial role in medical research. They did not only help to improve
the understanding of diseases but led to the development and improvement of
therapy strategies and new drugs. Traditionally, these studies still are often
carried out as s. c. experiments, which offer an easy approach and lead to
tumours that are easily visible and palpable. Despite these advantages s. c.
experimental protocols can be criticised as they simplify tumour formation due to
the vigorous supply of blood from the skin. This leads to a quick vascularisation
of the implant and subsequently to faster growth of the tumour. Furthermore it is
usually only cell lines that engraft which may be due to the unnatural
microenvironment they have to grow in.
In order to investigate metastasis intravenous models are also often used, which
better reflect the late steps of metastasis that occur via dissemination in the blood
stream, including organ-specific homing, extravasation, trans-endothelial
migration, invasion into tissue, clonal expansion of tumour cells and tumour
angiogenesis (Vormoor et al., 2001). Equally important to the choice of the
method of transplantation is the selection of the most appropriate mouse strain.
Mice have to be immunodeficient in order to allow human tumour cells to
engraft in host tissues and to prevent the rejection of the xenograft by the host’s
immune system.
4.1.2.1 Nude Mice
The first immunodeficient mouse strain used in preclinical investigations was the
Nude (nu/nu) strain discovered by Flanagan in the 1960s. Investigations showed

Chapter 4 – Metastasis model for Ewing’s sarcoma in NOD/Scid mice
101
that the spontaneous mutation leading to nude mice is caused by a genetic change
in the gene forkhead box N1 (Foxn1) on chromosome 11. Amongst others, one
result of this pleiotropic mutation is the abnormal development of the thymic
epithelium. These athymic mice lack functional T lymphocytes, which normally
develop in the thymus from progenitors derived from haematopoietic stem cells
of the bone marrow. Under normal circumstances haematopoietic progenitors are
able to populate the thymus and expand by cell division to generate a large
population of immature thymocytes subsequently resulting the generation of
mature T cells (Pantelouris, 1968; Schwarz and Bhandoola, 2006). This lack of
functional T cells in Nude mice results in an absent T cell-mediated immune
response. As a direct result, Nude mice also carry a T cell-dependent defect in
B cell maturation, function and immune response (Kaushik et al., 1995).
For a long time researchers used xenograft models of human solid tumours
including ES/PNET characterised by s. c. transplantation into the flanks of Nude
mice (Scotlandi et al., 1998). However, this model does not mirror the typical
clinical occurrence and growth pattern. Additionally, it is not possible to grow all
cell lines or even primary material in Nude mice as they have a residual immune
function that prevents engraftment, tumour development and metastasis.
This fact and the observation that under suitable conditions even aging Nude
mice can develop mature T cells deriving from haematopoietic progenitors
(leakiness) made it necessary to develop mouse strains with less residual immune
function. Nevertheless, although such profoundly immunodeficient strains were
developed and used, Nude mice are still important in the preclinical evaluation of
potential therapeutics in s. c. tumour models.

Chapter 4 – Metastasis model for Ewing’s sarcoma in NOD/Scid mice
102
4.1.2.2 Scid Mice
In the early 1980s the discovery and promotion of another spontaneous mutation
led to the development of a mouse strain termed “severe combined
immunodeficient” (Scid), which was of great use in the studies of xenograft
implantation (Bosma et al., 1983). In comparison to Nude mice, these have a
more severe immunodeficiency and are thus less likely to reject implanted
xenografts. This immune defect occurs as a result of a homozygous recessive
mutation in the gene protein-kinase, DNA activated, catalytic polypeptide
(Prkdc) on chromosome 16. This gene encodes for the DNA-dependent protein
kinase catalytic subunit, which is a subunit of the DNA-dependent protein kinase
(DNA-PK). The mutation in Prkdc hinders the interaction between the
DNA-dependent protein kinase catalytic subunit and its ligands leading to a
defect both in immunoglobulin and T cell receptor rearrangements. This results
in the humoral and cellular immune systems failing to mature and Scid mice,
therefore, present with impaired ability to produce mature T and B lymphocytes.
This renders the mice ineffective at fighting infections, and unable to raise an
adaptive immune response against any foreign antigen, including implanted
tumour cells (Custer et al., 1985; Bosma et al., 1988b; Lieber et al., 1988).
The inability of the mutated Prkdc to bind the other components of the
DNA-PK-complex additionally leads to a defect in DNA repair function of the
complex. Thus, Scid mice are hypersensitive to ionising radiation (Fulop and
Phillips, 1990). This effect is often used to further enhance the immune defect in
Scid mice as ionising radiation removes all cells of the bone marrow.
One major disadvantage of the Scid mouse strain is the possibility that few Scid
lymphocytes can have productive rearrangements at the appropriate Ig

Chapter 4 – Metastasis model for Ewing’s sarcoma in NOD/Scid mice
103
(immunoglobulin) or T cell receptor loci and thus survive and express an antigen
receptor despite the defect. When these “leaking” lymphocytes expand, mice are
not sufficiently immunocompromised anymore. This effect may occur due to
immune stimulus caused by housing animals in an environment that is not
pathogen-free (Bosma et al., 1983, 1988a; Nonoyama et al., 1993).
However, Scid mice remain an important milestone in the research of xenograft
models for human solid tumours (Phillips et al., 1989) but knowledge could be
further advanced by the use of different strains of mice combining the Scid
background.
4.1.2.3 NOD/Scid Mice
An important step in the development of immunodeficient mouse strains was the
creation of the NOD/Scid mouse strain. By backcrossing the previously
described spontaneously occurred Scid mutation (Prkdc mutation) onto the
NOD/Lt strain background, a mouse strain with defective lymphoid function
accompanied by reduced non adaptive immunologic function was created (Shultz
et al., 1995). NOD/Lt mice harbour less functional NK cells (natural killer cells)
(Kataoka et al., 1983; Serreze and Leiter, 1988), lack the complement system
(Baxter and Cooke, 1993), and have defects in differentiation and function of
antigen-presenting cells (Serreze et al., 1993). NOD/Lt mice show a high
incidence of Type I insulin-dependent diabetes mellitus (IDDM), which is
mediated by T cells. Backcrossing the Scid mutation onto this background,
however, results in NOD/LtSz-Prkdcscid/J (NOD/Scid mice, Jackson Laboratory)
that do not develop IDDM (Christianson et al., 1993) but carry a complex

Chapter 4 – Metastasis model for Ewing’s sarcoma in NOD/Scid mice
104
immunodeficiency which is characterised through the absence of T and
B lymphocytes, macrophages, and the complement system as well as less
efficient NK cells. This results in an almost complete inability to reject human
xenotransplants, as the strain provides a more permissive environment for human
cells than traditional Nude or Scid mice. However, remaining NK cell activity
should be erased through immune depletion (e.g. ionising radiation) to minimise
the remaining chances of rejection of transplants (Vormoor et al., 2001).
4.1.2.3 The established intravenous NOD/Scid mouse model
In the early 2000s, Vormoor et al. published a novel preclinical model for
ES/PNET in immunocompromised mice (Vormoor et al., 2001) shortly after first
models for other types of solid tumours in NOD/Scid mice had been introduced
(Bogenmann, 1996; Klein et al., 1997). The aim of this study was to engraft
ES/PNET cell lines and primary material in vivo via i. v. transplantation of single
cell suspensions into NOD/Scid mice.
The motivation for the development of this model was the need to investigate the
clonogenic frequency of ES/PNET cell lines and the proliferative ability of
primary material in vivo as opposed to its often impaired growth in vitro. The
NOD/Scid mice showed a pattern of disease spread similar to that found in
patients with metastases in lung, kidney, ovary, bone, and s. c. tumours as well as
involvement of bone marrow. Additionally, the time of tumour development of
1-6 months for cell lines and 4-9 month for primary material in mice was
comparable to the occurrence of relapse in patients.

Chapter 4 – Metastasis model for Ewing’s sarcoma in NOD/Scid mice
105
It can be assumed that the result of this study was a potential model for
investigations not only for the clonogenic frequency of ES/PNET but also for its
hematogenic spread. The fact that pattern of and time to metastasise were very
similar to the clinical situation showed that the late and very complex stages of
metastasis of ES/PNET seem to be reproducible in this mouse model. These
include spread via the blood stream, organ-specific homing, adhesion to the
endothelial wall, transendothelial migration and tissue invasion through
chemotaxis as well as proliferation and the potential of self-renewal, and
induction of angiogenesis. This proves as well that the interaction between
human tumour cells and the specific microenvironment of the different organs of
the mouse is sufficiently conserved.
Until now this model has been used successfully for different investigations on
treatment opportunities and biological mechanisms of metastasis (Hotfilder et al.,
2002; Staege et al., 2004; Hu-Lieskovan et al., 2005a).
Taking the advantages of this model into account, NOD/scid mice were chosen
for studies of the metastasis of ES/PNET and to obtain different organ-specific
tumours for further investigations. Since the development of this model the even
more immunodeficient mouse strains NSG has been developed which were not
available at the time (Shultz et al., 2005). NSG mice were used for the
development of an orthotopic model for bone malignancies and are described in
chapter 5.

Chapter 4 – Metastasis model for Ewing’s sarcoma in NOD/Scid mice
106
4.1.3 The principles of expression profiling
Sequencing of the human genome has been a major breakthrough for biomedical
research (McPherson et al., 2001; International Human Genome Sequencing
Consortium, 2004). Together with new techniques of functional genomics it is
now possible to perform global analyses of the expression of thousands of genes
(Eisen and Brown, 1999) and to understand complex molecular processes
involved in the development and progression of diseases such as cancer. During
the years that expression profiling was available and got more and more
important, microarray analysis has become the preferably used technique as it is
a straightforward approach which does not require the sequencing of DNA. An
alternative which offers the advantage of faster results is RNA-Seq (RNA
sequencing). However, this method is a lot more expensive than microarrays at a
comparable resolution of accuracy.
Thus, research could be performed to investigate gene profiles that correlate with
a metastatic phenotype of tumour cells (Hynes, 2003). These profiles did not
only discover genes responsible for the general ability of metastasis in specific
tumours (van ’t Veer et al., 2002), but furthermore identified clones within
tumours and tumour cell lines that prefer specific organs as a site of metastasis
(Kang et al., 2003). It may well be that solid tumours are maintained from rare
cells within the tumour that have tumour initialising abilities. This is also the
case in hematologic malignancies and may be accountable for metastasis of other
malagnancies as well (Tu et al., 2002).
The analysis of different tumour systems, such as non-small cell lung cancer
(Diederichs et al., 2004), breast cancer (Kang et al., 2003) and melanoma (Clark
et al., 2000) has proven that there are organ-specific features driving metastasis

Chapter 4 – Metastasis model for Ewing’s sarcoma in NOD/Scid mice
107
and this may give hints on the cellular mechanisms of organ-specific metastasis
in general.
Gene microarrays represent a high throughput technology, which allows for the
identification and quantification of thousands of genes from multiple samples in
parallel that have pre-defined characteristics such as treatment versus no
treatment (Mocellin and Rossi, 2007). The important advantages of this
technique are
the possibility to discover new genes and further investigate their
functions.
the opportunity to clarify gene regulation and regulatory networks.
the chance to facilitate and improve diagnosis and prognosis by
identification of disease- and stage-specific gene expression profiles.
Southern blotting is the technique, which led to the development of microarrays.
This method requires the attachment of fragmented sample-DNA to a substrate.
The DNA of the known gene of interest is then given onto the prepared substrate.
This tests, whether the gene of interest is contained within the sample.
The underlying concept of microarray technique using GeneChips® is
straightforward (see Figure 4.2). Briefly, RNA is isolated from cells or tissue,
cDNA is synthesised, and biotin-labelled cRNA is generated in an IVT (in vitro
transcription) reaction to obtain the target. This is fragmented and hybridised to
the probes attached to the solid matrix of the microarray. The microarray with the
hybridised sample is stained with PE-conjugated (phycoerythrin) streptavidin
and scanned by the laser scanner of the system unit used. GeneChips® contain

Chapter 4 – Metastasis model for Ewing’s sarcoma in NOD/Scid mice
108
several different 25-mer oligonucleotides matching one gene. Additionally, every
oligonucleotide comes with a negative control containing a mismatch. From
these match- and mismatch-oligonucleotide sets expression of the gene of
interest can be derived and expression values of the different samples can
subsequently be compared and analysed to obtain biological information (Staal et
al., 2003).

Chapter 4 – Metastasis model for Ewing’s sarcoma in NOD/Scid mice
109
Figure 4.2: Scheme for the workflow of expression analysis using an Affymetrix
GeneChip®. RNA is extracted from cells or tissue, cDNA is produced and in an IVT reaction
cRNA is created and biotinylated (target). After fragmentation the template is hybridised to the
probes on the GeneChip®, the chip is stained and finally scanned using a laser scanner.
Although, the human genome has been sequenced it still remains un-interpreted
to a great extent and even the exact number of genes encoded is still unknown.
Thus, analysis of expression profiling can only be an approximation and there

Chapter 4 – Metastasis model for Ewing’s sarcoma in NOD/Scid mice
110
will always be unknown transcripts appearing in expression profiles that cannot
yet give any biological information without further investigations on the function
of that very gene.
4.1.3.1 Variations of gene expression data
Affymetrix oligonucleotide arrays have several advantages. The most important
one is that several probes are used for one transcript. This leads to more reliable
data with less variation. However, one of the major problems examining global
gene expression is the reliability of resulting data at the lower end of the
confidence scale. This is the case when the signal for a probe is extremely weak,
or to the other extreme very saturated. It also has to be taken into account that
fold changes in expression of transcribed genes compared between different
samples (in this case parental cell line and mouse-derived organ-specific
subclones) might not reflect the importance and emphasis of a down-stream
occurring effect in biological pathways. For example, small changes on transcript
level can be amplified through intracellular signalling pathways but may not be
detected by the analysis of the expression arrays due to the set threshold of fold
change (in this study 2-fold). However, it is likely that high fold changes
detected in gene expression experiments have an impact in the cell and thus are
important for the undertaken investigations.
Another drawback is that the sensitivity of oligonucleotide arrays has been found
to differ between single arrays and the different platforms. This might be
responsible for the mismatch between collected gene expression data from
various studies handicapping meta-analysis of in theory comparable data.

Chapter 4 – Metastasis model for Ewing’s sarcoma in NOD/Scid mice
111
4.1.3.2 Statistical and biological significance
Two types of replicates for gene expression microarray experiments ensure that
collected data is statistically and biologically significant; these are technical and
biological replicates. On the one hand, technical replicates are applied to
determine variation of preparation of RNA samples, handling and its
hybridisation onto the microarray GeneChip. On the other hand, biological
replicates are achieved through testing of different samples derived from
repeated experiments.
The Affymetrix platform is very well standardised leading to the biological
variation outweighing any technically caused variation. Thus, only biological
replicates had to be used in this set of experiments
4.2 Aims
The principle aim of this component of the project was to investigate cellular
mechanisms of organ-specific metastasis in ES/PNET.
The working hypothesis was that patients with pulmonary metastases and
patients with osseous metastases have different prognosis because the cells
initiating the metastases have a different biological properties. The heterogeneity
of ES/PNET cell lines and the resulting subclones with organ-specific metastasis
could correlate with differences in expression of genes leading to organ-specific
expression patterns. The identification and characterisation of these genes could
potentially give insight about mechanisms pertaining to organ-specific metastasis
and thus facilitate a better understanding of clinical differences between
pulmonary and osseous metastasis. Furthermore, new targets for molecular

Chapter 4 – Metastasis model for Ewing’s sarcoma in NOD/Scid mice
112
therapy strategies could be identified to improve diagnosis, treatment and
prognosis of ES/PNET.
Concluding, the specific aims were:
to isolate ES/PNET subclones with preferential tendency to metastasise to
specific organs.
to identify organ-specific gene expression signatures (lung versus bone
versus bone marrow).
4.3 Materials and Methods
Most work for this part of the thesis in hand was performed at the Westfälische
Wilhelms-University and University Hospital Münster, Germany.
4.3.1 Tracer preparation and positron emission tomography (Münster)
Tracer preparation [18F]fluoride was performed using an RDS 111e cyclotron
(CTI, Knoxville, USA) according to Wieland et al. (Wieland et al., 1989).
Subsequently, FDG was synthesised as previously described (Hamacher et al.,
1986).
PET scans were performed as previously described (Franzius et al., 2006). The
scanning was performed by a service unit of the research department of the
University Hospital Münster which uses the high-resolution multi-wire chamber
animal PET camera quadHIDAC (Oxford Positron Systems Ltd, Oxford, UK).

Chapter 4 – Metastasis model for Ewing’s sarcoma in NOD/Scid mice
113
Mice were starved overnight, anaesthetised and handled as described before
(3.6.1 and 3.6.3). One hour after i. v. injection of approximately 10MBq
18F-FDG mice were scanned for 15 minutes. The FOV was 28cm axially and
17cm in diameter. The volumetric spatial resolution was 1.09mm3 (using filtered
back projection reconstruction) and constant over the whole FOV. The absolute
sensitivity in the centre of the FOV was 18 cps/kBq. Whole-body emission
images were reconstructed by the iterative OPL-EM algorithm, which offers an
even higher spatial resolution of 0.7 mm full-width at half-maximum (FWHM).
4.3.2 Isolation of organ-specific subclones from metastases
Metastases were either localised by PET scanning or during dissection of mice.
To achieve isolation of organ-specific metastases, mice were euthanized,
dissected and metastases of the lung and bones as well as bone marrow flushes
were collected in pre-warmed medium within a 50ml reaction tube and further
treated as described before (see section 3.6.9).
Subsequently, subclones were cultivated along with the routine cell culture.
Remaining mouse cells in the cultures died very rapidly so that subclone-cells
could be frozen down as soon as the small culture flask was confluent. Therefore,
cell pellets of 5x10⁶ cells were aliquoted in 1.5ml reaction tubes and frozen in
liquid nitrogen. Cells were stored at -80°C until RNA was isolated for microarray
analysis (see chapter 3.3.4). For the validation of the quality of RNA see chapter
4.3.3.

Chapter 4 – Metastasis model for Ewing’s sarcoma in NOD/Scid mice
114
4.3.3 Expression arrays
Microarrays were performed by the IZKF (Interdisziplinäres Zentrum für
Klinische Forschung, Münster, an institutional research facility of the Medical
Faculty of the Westfälische Wilhelms-University, Münster).
The IZKF is an Affymetrix Core Laboratory using the Agilent Bioanalyzer 2100
to control the quality of the sample RNA. The unit separates the sample using
capillary electrophoresis. The Agilent Software offers an electropherogram
(fluorescence against time), a "gel-like image" and is able to automatically judge
about the quality. Therefore a database for RNA-analysis is used that offers 3000
electropherograms that were judged “by hand”.
The Affymetrix GeneChip System® 3000 is used for the entire workflow of
expression analysis.
4.3.3.1 Affymetrix U133 plus 2.0 array
For the analysis of gene expression the Affymetrix GeneChip® Human Genome
U133 Plus 2.0 Array from Affymetrix (Affymetrix Inc., Santa Clara, USA) was
used. This GeneChip® covers 1,300,000 unique oligonucleotide features which
account for over 47,000 transcripts and variants representing approximately
39,000 of the best characterized human genes.
Transcripts were derived and selected from GenBank®, dbEST, and RefSeq and
sequence clusters were created from the UniGene database (Build 133, April 20,
2001). The selection was then refined by analysis and comparison with a number
of other publicly available databases. Further information is available on the
Affymetrix Inc. homepage, www.affymetrix.com.

Chapter 4 – Metastasis model for Ewing’s sarcoma in NOD/Scid mice
115
4.3.3.2 Probe sets on the GeneChip
In situ synthesised probes on the GeneChip are 25 nucleotides long. This ensures
the specificity. For each transcript a probe set is created. This set consist of 11-16
probe pairs to allow multiple and independent measurements. A probe pair is
made up of a perfect match and a mismatch, which contains a single mismatched
base. The mismatch probe functions as an internal control to quantify levels of
non-specific hybridisations of perfect match. The intensity of hybridised
mismatch is subtracted from the intensity of the hybridised perfect match probe
to be able to control and correct for the noise in the array results.
4.3.3.3 Planning the experiment and replicates
To be able to analyse the expression of ES/PNET derived from different organs,
mice were transplanted with cells of different ES/PNET cell lines as mentioned
before (see Figure 4.3 and chapter 3.6.3). Mice developed different tumours,
which were isolated during dissection. Due to the isolation of tumours from the
comparable organ in multiple mice it was possible to perform the experiment
with biological replicates. Technical replicates (determining the variation in
handling and hybridisation onto the GeneChip) were not necessary as the
microarray platform used is very well standardised and validated. This means
that the biological variation of samples outweighs the technical variations.

Chapter 4 – Metastasis model for Ewing’s sarcoma in NOD/Scid mice
116
Figure 4.3: Scheme of transplantations and acquired metastases from primary and
secondary mice.
Figure 4.3 shows the experimental plan with transplantation of cells, aseptic
removal and isolation of metastases, re-cultivation of cells and secondary
transplantation into further experimental animals with subsequent removal of
metastases from secondary mice.
4.3.3.4 Sample preparation
RNA was isolated using the Qiagen kit as described before (3.3.4 and 3.3.5).
Ideally, the amount of 5-15µg RNA of the different samples was sent in. The
RNA had to be resuspended in ddH2O and delivered to the IZKF at 4°C. Further
steps were carried out by this institution as described in 4.3.3.

Chapter 4 – Metastasis model for Ewing’s sarcoma in NOD/Scid mice
117
In total, 19 microarrays were performed with each two replicates of the parental
cell lines VH-64 and TC-71 from which the subclones were derived.
4.3.4 Analysis of expression arrays
Raw data acquired directly from the microarray-chips was analysed using
GeneSpring GX 11 (Agilent Technologies Inc., Santa Clara, USA) and
BioConductor (Gentleman et al., 2004). Analysis was completed in cooperation
with the bioinformatics department of Newcastle University.
Data was imported from the CEL files (raw data from chip scanning) and
normalised with RMA (Robust Multi-array Average). Therefore, raw intensity
values were background corrected, log2-transformed and then quantile
normalized (Wu and Irizarry, 2005).
Data were filtered using MAS5 P/M/A calls (Microarray suite 5). Probe sets
were discarded if they did not have present or marginal calls in all samples in any
given experimental condition.
Finally, gene lists were filtered due to fold change. Transcripts whose abundance
were significantly altered (p<0.05) after 100 permutation tests on the class labels
and an absolute fold change greater than 2-fold were defined as differentially
expressed and were therefore further analysed.
Where applicable, differences between experimental groups were determined
using Rank Products (Breitling et al., 2004) and further analysed in GeneSpring.
Rank Products analysis provides a straightforward and statistically stringent way
to determine the significance level for each transcript. It allows for a flexible
control of the false-detection rate and family-wise error rate in the multiple

Chapter 4 – Metastasis model for Ewing’s sarcoma in NOD/Scid mice
118
testing situation of a microarray experiment. This technique has been shown to
reliably identify differentially expressed transcripts that do not originate from a
sophisticated statistical model but rather from an analysis of biological
reasoning.
4.3.5 Further biological analysis
For further, biological analysis of the normalised and processed data these were
exported into EXEL (Microsoft Corp., Redmond, USA). Resulting gene list were
then analysed through the use of Ingenuity Pathway Analysis 8.0 (IPA; Ingenuity
Systems Inc., Redwood City, USA; www.ingenuity.com). IPA is a web-based
software application, which allows the analysis and understanding of expression
data in a biological context. It is backed by the Ingenuity Knowledge Base of
highly structured, detail-rich biological and chemical findings. It is the largest
knowledge base of its kind, with millions of findings generated from the full text
literature and is updated on a weekly basis.
In more detail, IPA Core Analyses were performed on the comparison lists
generated in GeneSpring containing the differentially regulated transcripts. This
delivers a rapid assessment of the signalling and metabolic pathways, molecular
networks, and biological processes that are most significantly perturbed in a
dataset of interest.
IPA Core Analysis standard settings were used, including direct and indirect
relationships with a maximum of 35 molecules per network and 25 networks per
analysis.

Chapter 4 – Metastasis model for Ewing’s sarcoma in NOD/Scid mice
119
IPA uses computational algorithms to identify local networks that are particularly
enriched for the input genes, which are called focus genes by the IPA software.
Furthermore, IPA uses a Fisher's exact test to determine which pathways
(canonical pathways, toxicity pathways and biological functions) are
significantly linked to the input gene set compared with the whole Ingenuity
Knowledge Base.
4.3.6 Microarray validation experiment using qRT-PCR
Genes selected for validation of the microarray experiments via qRT-PCR are
listed in Table 4.1.
Table 4.1: Details of qRT-PCR primers from Sigma.
Gene Forward primer (5’ – 3’) Reverse Primer(5’ – 3’)
ALDH1A1 AGCTCTGCCAGGTAGAAGAAGGA ATCCAATCTGAAAAGCCTGTCTTG
APOC1 GGACAAGGCTCGGGAACTC TGAAAACCACTCCCGCATCT
CXCR4 CTGAGAAGCATGACGGACAA TGGAGTGTGACAGCTTGGAG
MEG3 ATCCCGGACCCAAGTCTTCT CACGTAGGCATCCAGGTGATG
NRG1 GTCCACTGCGCCATCCTT (exon 1)
CCCCGATTGAAAGAGATGAAAA
(exons 2/3)
TTGTCCCAGTGGTGGATGTAGA
VCAN CCGGTGCTTAGGAAATGGAA TTCATAGAATAAGTCCTTTGGTATGCA
The exact method for designing of qRT-PCR primers and the qRT-PCR itself are
described in chapter 3.3.13.

Chapter 4 – Metastasis model for Ewing’s sarcoma in NOD/Scid mice
120
4.4 Results
4.4.1 Intravenous transplantations and re-transplantation of subclones
To be able to isolate organ-specific metastases from immunocompromised mice,
the mouse model previously established by Vormoor and co-workers was
employed (Vormoor et al., 2001). Mice were scanned on a regular basis using the
PET-technique. To get a full and reliable picture of metastasis and to isolate
occurring metastases, mice were dissected and screened macroscopically. For
this project, FDG-PET did not prove to be the technique of choice as a lot of
metastases were not detected in sequential PET imaging but were discovered
when mice were finally euthanized and dissected due to their poor general
condition. In some cases, metastases were visible when the sections of the PET
scan were not summed up but rather examinated individually (see Figure 4.4).
Accumulation of FDG in the heart muscle continued to prevent the appearance of
lung metastases on PET images.

Chapter 4 – Metastasis model for Ewing’s sarcoma in NOD/Scid mice
121
Figure 4.4: Representative PET images of a mouse transplanted intravenously with the cell
line VH-64. A, image of all sections overlaid, accumulation of FDG in the heart (black arrow)
prevents the appearance of lung metastases; B, one section alone allows visibility of lung
metastases.
Mice that died due to transplantation-related toxicity within 3 weeks of
transplantation (n=3) or due to unexpected circumstances, for example during
PET scanning (n=13), were excluded from the analysis. The high number of
unexpected deaths of experimental animals seems to result from disadvantageous
housing conditions due to building activity on site. This might as well have
accounted for decreased breeding success and resulting small transplantation
numbers.
The remaining mice are listed in Table 4.2. Due to resulting small numbers there
was insufficient statistical power to analyse tumour formation.
After i. v. transplantation of VH-64 and TC-71 into NOD/Scid mice metastases
from lung, bone and bone marrow could be removed. From these metastases
subclones were isolated and cultivated and subsequently re-transplanted into
NOD/Scid mice.

Chapter 4 – Metastasis model for Ewing’s sarcoma in NOD/Scid mice
122
Table 4.2: Ewing tumour formation in intravenously transplanted NOD/Scid mice. VH-64,
TC-71 are ES/PNET cell lines; KM006, bone marrow derived subclone from mouse 006; K006,
bone derived subclone from mouse 006; L006, lung derived subclone from mouse 006; BD-99,
patient derived cell line. Mouse numbers in brackets had to be excluded from the study.
Cell lines Mouse numbers Number of transpl. cells
Tumour formation
VH-64 (001), (002), 003, 004, (005),
006
5 x 10⁶ 2/3
TC-71 (107), (108), 109, (128), (129),
130, 131, 132, (133)
2 x 10⁶ 3/4
KM006 r034, (r035), (r036) 5 x 10⁶ 1/1
K006 (r040), (r041), (r042), r052,
(r053), r054
5 x 10⁶ 2/2
L006 r043, (r044), r045, (r049),
r050, r051
4.5-5 x 10⁶ 2/4
BD-99 455, 456 7 x 10⁵ 0/2
Re-transplanted organ-specific subclones developed in different organs (see
Table 4.3). Although only relatively small numbers of transplantations were
analysed it was obvious that the pattern of metastasis correlated very well with
results reported previously (Vormoor et al., 2001). Specifically, all mice showed
metastasis to the lung. Involvement of the bone only occurred after
transplantation of VH-64 and re-transplantation of the bone-derived subclone
K006. In total, nine out of ten mice developed bone marrow metastases. Cells of
the re-transplanted lung metastases L006 were further able to establish a
subcutaneous and an intraperitoneal metastasis.

Chapter 4 – Metastasis model for Ewing’s sarcoma in NOD/Scid mice
123
Table 4.3: Pattern of metatstasis in tumour baring NOD/Scid mice. SC, subcutaneous
tumour; IP, intraperitoneal tumour.
Cell lines
Mice with tumours
Lung Bone Bone marrow
Kidney SC IP
VH-64 004, 006 2/2 2/2 2/2 0/2 0/2 0/2
TC-71 130, 131, 132 3/3 0/3 2/3 0/3 0/3 0/3
KM006 r034 1/1 0/1 1/1 0/1 0/1 0/1
K006 r052, r054 2/2 1/2 2/2 1/2 0/2 0/2
L006 r043, r051 2/2 0/2 2/2 0/2 1/2 1/2
Analysis of the pattern of metastasis as well as the time to occurrence of clinical
symptoms suggested that re-transplanted subclones derived from the lung or the
bone marrow led to tumours in a shorter period of time. The difference in growth
comparing lung-derived subclone to the parental cell line was statistically
significant. In contrast, bone-derived subclones led to metastases in a comparable
time to cell lines (see Figure 4.5). Analysis of the pattern of metastases for
subclones shows additionally to the classically occurring lung, bone and bone
marrow metastases subcutaneous and intraperitoneal as well as kidney
involvement (see Table 4.3).

Chapter 4 – Metastasis model for Ewing’s sarcoma in NOD/Scid mice
124
Figure 4.5: Mean time in days from transplantation to reaching of limits of the protocol.
Asterisk marks P <0.050 in the comparison of cell line VH-64 to the deriving subclones (one way
ANOVA, Bonferroni); L006, lung metastasis derived from mouse 006; KM006, bone marrow
metastasis derived from mouse 006; K006, bone metastasis derived from mouse 006.
Therefore, these data suggest that the growth pattern as well as the shortened
time to metastasis marks a more aggressive growth of subclones. However,
taking the small transplantation numbers into account (due to breading problems
on site and thus very low numbers of animals for the experiment) these data are
not statistically robust and can only suggest a trend (see Table 4.3 and
Figure 4.5).
Cell lines
1 2 3 4 5
Day
s to
dis
ease
0
20
40
60
80
100
VH-64 L006 KM006 K006 TC-71
*

Chapter 4 – Metastasis model for Ewing’s sarcoma in NOD/Scid mice
125
4.4.2 In vitro characterisation of tissue specific subclones
The isolated subclones were validated as arising from the transplanted cell lines
as well as further examined in vitro to characterise them and compare them to the
parental cell lines.
4.4.2.1 Validation of clones – flow cytometry and PCR of fusion transcripts
All isolated secondary and tertiary subclones could be validated as human
ES/PNET cells and therefore derived from the initially transplanted human cell
line.
Therefore, the well-established ES/PNET marker CD99 was used in flow
cytometry. All isolated metastases were positive for the surface-marker (see
Figures 4.6 and 4.7).
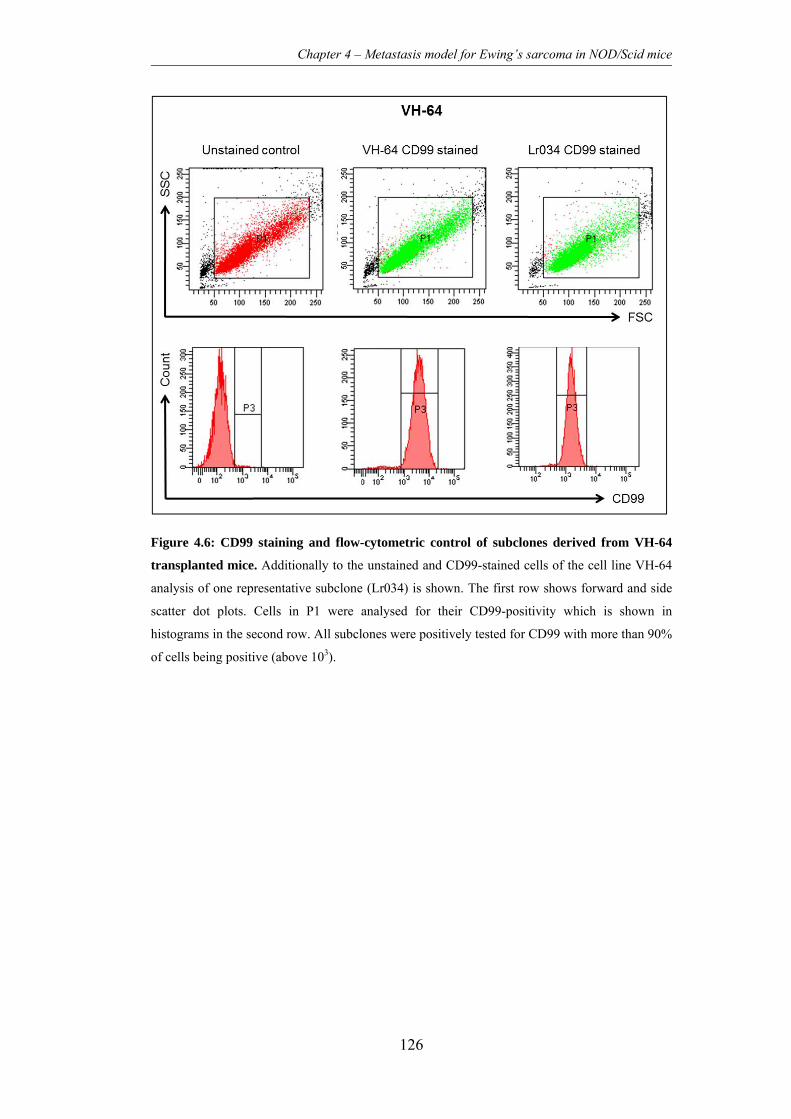
Chapter 4 – Metastasis model for Ewing’s sarcoma in NOD/Scid mice
126
Figure 4.6: CD99 staining and flow-cytometric control of subclones derived from VH-64
transplanted mice. Additionally to the unstained and CD99-stained cells of the cell line VH-64
analysis of one representative subclone (Lr034) is shown. The first row shows forward and side
scatter dot plots. Cells in P1 were analysed for their CD99-positivity which is shown in
histograms in the second row. All subclones were positively tested for CD99 with more than 90%
of cells being positive (above 103).

Chapter 4 – Metastasis model for Ewing’s sarcoma in NOD/Scid mice
127
Figure 4.7: CD99 staining and flow-cytometric control of subclones derived from TC-71
transplanted mice. Additionally to the unstained and CD99-stained cells of the cell line TC-71
analysis of one representative subclone (L130) is shown. The first row shows forward and side
scatter dot plots. Cells in P1 were analysed for their CD99-positivity which is shown in
histograms in the second row. All subclones were positively tested for CD99 with more than 90%
of cells being positive (above 103).
Additionally, all subclones were positively tested for the corresponding fusion
transcripts by RT-PCR. Cells of the parental cell line TC-71 and subclones
derived from this cell line harboured the EWS-FLI1 type 1 transcript, which
results from the fusion of EWS exon 7 in frame with FLI1 exon 6. VH-64 cells
and deriving subclones harboured the EWS-FLI1 type 2 transcript occurring
through fusion of EWS exon 7 in frame with FLI1 exon 5. The resulting size

Chapter 4 – Metastasis model for Ewing’s sarcoma in NOD/Scid mice
128
difference of the PCR products was distinguishable after agarose gel
electrophoresis.
4.4.2.2 Colony assay
Colonies of the two cell lines VH-64 and TC-71 showed a slight difference in
size. VH-64 colonies were smaller, which might be due to their smaller cell size
(Figure 4.8; see also chapter 4.4.2.3). There was no difference visible between
the parental cell lines and their derived subclones.
Figure 4.8: Appearance of colonies. A cell line VH-64, B cell line TC-71. Micrographs show
the appearance of colonies in methylcellulose gels at x20 magnification.
No difference in clonogenicity of the parental cell lines VH-64 and TC-71 could
be observed (data not shown).

Chapter 4 – Metastasis model for Ewing’s sarcoma in NOD/Scid mice
129
4.4.2.3 Cytospins
Representative subclones were brought onto glass slides using the technique of
cytospins to be able to analyse cells microscopically (Figure 4.9). Comparing
cells of the cell lines VH-64 and TC-71 against each other, it is obvious that
TC-71 cells and cells derived from this cell line are slightly bigger than VH-64
cells and its subclones.
However, all cells showed a relative high number and percentage of vacuoles
also indicating a high metabolic activity and rate of replication.
Figure 4.9: Microscopic examination of cytospins. A cell line VH-64, B cells of bone-derived
subclone K006 after VH-64 transplantation, C cell line TC-71, D lung-derived subclone L131
after TC-71 transplantation. Magnification x64.

Chapter 4 – Metastasis model for Ewing’s sarcoma in NOD/Scid mice
130
4.4.2.4 Further in vitro investigations
No differences in the proliferation of cell lines and their subclones could be
observed in vitro in a MTT viability assay (data not shown).
Cell cycle analysis also did not reveal any changes comparing the organ-specific
subclones against the parental cell lines (data not shown).
4.4.3 Expression profiling
Expression profiling was performed on selected subclones in comparison to the
parental cell line. Microarrays were performed on cell lines VH-64 and TC-71
and 17 derived subclones. The project focussed on VH-64 and derived subclones
and these could be analysed with statistical significance (see Tables 4.4 and 4.8).
Due to small numbers of experimental mice and thus resulting small numbers of
subclones it was not possible to include the second cell line TC-71 and derived
subclones into the analysis.
4.4.3.1 Analysis of comparisons between organ-subclones directly
The analysis of microarrays of the different organ-specific subclones against
each other was performed using the RankProd approach and subsequently
GeneSpring and IPA (see also chapter 4.3.4) to be able to identify gene profiles
that result from a more biological reasonable background. The performed
comparisons are listed in Table 4.4.

Chapter 4 – Metastasis model for Ewing’s sarcoma in NOD/Scid mice
131
Table 4.4: Comparisons of gene expression between the different VH-64-derived
organ-specific subclones.
Name of comparison 1. group 2. group
Lung vs. bone K004, K006, Kr054 L004, L006, L062, Lr034,
Lr043, Lr051, Lr052, Lr054
Bone marrow vs. bone K004, K006, Kr054 KM006, KM062, KMr043,
KMr052, Kr054
Lung vs. bone marrow KM006, KM062, KMr043,
KMr052, Kr054
L004, L006, L062, Lr034,
Lr043, Lr051, Lr052, Lr054
A comparison of “Lung vs. bone” metastases revealed that 314 genes were
significantly higher expressed in lung than in bone while only three genes were
significantly higher expressed in bone. “Bone marrow vs. bone” analysis of
expression showed that 38 genes were significantly higher and five genes were
less expressed in bone marrow compared to bone subclones. Comparing “Lung
vs. bone marrow” metastases, 23 genes were recognised to be higher expressed
in lung.
Possible organ-specific patterns for the different metastases could be filtered out
of the three comparisons. This was achieved by looking at the differentially
expressed gene profiles in more detail and comparing them against each other
(see Table 4.5).

Chapter 4 – Metastasis model for Ewing’s sarcoma in NOD/Scid mice
132
Table 4.5: Genes differentially expressed in more than one comparison. Values are
fold-change values. Bm, bone marrow. Genes in bold were especially notable.
Gene Description Lung
vs. bone
Lung
vs. bm
Bm vs.
bone
Specific
for
AK1 adenylate kinase 1 -2.029 -2.923 bone
C9ORF16 chr 9 open reading frame 16 -2.486 -3.318 bone
CAMK2N1 calcium/calmodulin-dependent
protein kinase II inhibitor 1
-2.377 -2.990 bone
CLPTM1 cleft lip and palate associated
transmembrane protein 1
-2.026 -3.450 bone
CXCL10 chemokine (C-X-C motif) ligand
10
-5.101 -4.558 bone
FBXW2 F-box and WD repeat domain
containing 2
-2.727 -3.302 bone
FCF1 FCF1 small subunit (SSU)
processome component homolog
-2.323 -3.791 bone
GAMT guanidinoacetate
N-methyltransferase
-2.268 -2.337 bone
GAS1 growth arrest-specific 1 -2.690 -3.143 bone
GDF10 growth differentiation factor 10 -3.028 -3.929 bone
HERC6 hect domain and RLD 6 -2.638 -2.050 lung
IFI44 interferon-induced protein 44 -4.726 -2.855 bone
IFI44L interferon-induced protein 44-like -7.259 -4.433 bone
IFI6 interferon, alpha-inducible protein
6
-3.175 -3.726 bone
KRT8 keratin 8 -2.113 -2.979 bone
MDFI MyoD family inhibitor -2.176 -2.846 bone
MMP1 Matrix metallopeptidase 1 5.321 -2.999 15.955
MRPL2 mitochondrial ribosomal protein
L2
-2.271 -3.014 bone
OASL 2'-5'-oligoadenylate synthetase-
like
-2.801 -2.138 lung
PDGFC platelet derived growth factor C -3.283 -3.508 bone
PRCC papillary renal cell carcinoma -2.630 -2.986 bone
PTP4A1 protein tyrosine phosphatase type
IVA, member 1
-2.946 -3.137 bone
RAB4A member RAS oncogene family 5.103 4.933 bone
RAD23B RAD23 homolog B -2.817 -3.752 bone

Chapter 4 – Metastasis model for Ewing’s sarcoma in NOD/Scid mice
133
Table 4.6 continued.
Gene Description Lung
vs. bone
Lung
vs. bm
Bm vs.
bone
Specific
for
RPL23 ribosomal protein L23 -2.975 -3.459 bone
RPS11 ribosomal protein S11 4.987 7.652 bone
RSAD2 radical S-adenosyl methionine
domain containing 2
-2.177 -2.554 lung
SLC16A3 solute carrier family 16, member 3 -2.338 -3.424 bone
SPAG16 sperm associated antigen 16 -3.335 -3.455 bone
UBE2M ubiquitin-conjugating enzyme
E2M
-2.452 -3.142 bone
ZYX Zyxin -2.888 -3.138 bone
The list shows 27 genes that might be specific for bone. Of these, 25 are less
expressed in bone than in lung and bone marrow while two are higher expressed
in bone than in the other metastases. Three genes were significantly up-regulated
in lung metastases compared to bone and bone marrow metastases.
Several genes were especially noticeable due to their fold changes in the different
comparisons of gene expressions. The genes CXCL10 (chemokine (C-X-C
motif) ligand 10), GDF10 (growth differentiation factor 10), IFI44 (interferon-
induced protein 44) and IFI44L (interferon-induced protein 44-like) were down-
regulated in metastases isolated from the bone while the genes RAB4A (member
RAS oncogene family) and PRS11 (ribosomal protein S11) were exclusively up-
regulated in metastases taken from the bone.
The genes HERC6 (hect domain and RLD 6) and RSAD2 (radical S-adenosyl
methionine domain containing 2) were up-regulated in lung metastases in
comparison to bone and bone marrow metastases.

Chapter 4 – Metastasis model for Ewing’s sarcoma in NOD/Scid mice
134
MMP1 (matrix metallopeptidase 1) showed very high expression values in
especially bone-derived subclones and also lung metastases in comparison to
bone marrow metastases.
4.4.3.2 Analysis of comparisons between VH-64 and the derived subclones
As described before, GeneSpring-derived comparative gene expression lists were
analysed using IPA. A core analysis with default settings was performed for each
comparison (for subclones included into the different comparisons see Table
4.6). The aim of these comparisons was to identify a sub-set of genes, which may
be responsible for imprinting through the in vivo microenvironment.
Table 4.7: Comparisons of gene expression between the parental cell line VH-64 and
deriving subclones. Microarrays from VH-64 were performed in biological replicates.
Name of created comparison Parental line Subclones
VH-64 vs. lung metastases VH-64 (2x) L004, L006, L062, Lr034,
Lr043, Lr051, Lr052,
Lr054
VH-64 vs. bone metastases VH-64 (2x) K004, K006, Kr054
VH-64 vs. bone marrow metastases VH-64 (2x) KM006, KM062, KMr043,
KMr052, Kr054
In more detail, the numbers of up- and down-regulated genes listed for these
comparisons varied. In the comparison of “VH-64 vs. lung metastases” the

Chapter 4 – Metastasis model for Ewing’s sarcoma in NOD/Scid mice
135
expression of 523 genes was significantly up-regulated (> 2-fold) in lung
metastases and for three genes was down-regulated. The comparison of “VH-64
vs. bone metastases” revealed up-regulation of the expression of 40 genes and
down-regulation for six genes. Comparing “VH-64 vs. bone marrow metastases”
87 genes were discovered to be up-regulated, while three genes were down
regulated.
The three comparisons showed 15 genes in common that were up-regulated and
two genes that were down-regulated (see Table 4.7). When comparing the fold
change of expression most genes showed values in the same range. Four genes
have to be mentioned because their values were noticeable. CTCFL
(CCCTC-binding factor (zinc finger protein)-like) showed an 6.9-fold up-
regulation in bone marrow metastases, while it’s up-regulation in metastases
taken from the bone was nearly three times higher with a change of 18.7-fold and
higher for lung metastases with a change of 10.3-fold.
A very high difference in fold changes for the different organ-specific subclones
was also observable for RSAD2 (radical S-adenosyl methionine domain
containing 2). While the fold change of bone and bone marrow metastases
compared to the parental cell line was 6.0 and 5.1, respectively, it was 13.0 when
comparing lung metastases against VH-64.
Furthermore, the genes RNF128 (ring finger protein 128) and TEX19 (testis
expressed 19) were striking with extreme fold-changes in down-regulation
compared to the parental cell line.

Chapter 4 – Metastasis model for Ewing’s sarcoma in NOD/Scid mice
136
Table 4.8: Fold changes of genes differentially expressed in the organ-specific subclones in
comparison to the parental cell line VH-64. Positive values indicate up-regulation, negative
values indicate down-regulation in the subclones. Bm, bone marrow. Genes marked with ‘D’
were represented in duplicate. Genes in bold were especially noticeable.
Gene Description Mean fold change
VH-64 vs. lung
metastases
VH-64 vs. bone
metastases
VH-64 vs. bm
metastases
AHNAK AHNAK nucleoprotein 2.843 2.716 2.384
CTCFL CCCTC-binding factor
(zinc finger protein)-like
10.296 18.692 6.938
CTSK cathepsin K 3.060 2.791 3.657
DLX1 distal-less homeobox 1 3.744 5.284 3.939
DLX2 distal-less homeobox 2 5.139 6.099 4.498
FAM26F family with sequence
similarity 26, member F
7.425 7.779 6.126
KCTD12 potassium channel
tetramerisation domain
containing 12
4.593 5.027 3.649
PPP1R9A protein phosphatase 1,
regulatory (inhibitor)
subunit 9A
5.635 5.262 5.214
RNF128 ring finger protein 128 -10.207 -11.701 -14.697
RSAD2 radical S-adenosyl
methionine domain
containing 2
13.027 5.985 5.100
SOX11 SRY (sex determining
region Y)-box 11
3.970 4.589 3.543
SPHK1 sphingosine kinase 1 3.216 2.269 3.226
TANC2 tetratricopeptide repeat,
ankyrin repeat and
coiled-coil containing 2
4.846 3.460 4.040
TBXA2R thromboxane A2 receptor 3.331 4.393 2.760
TEX19 testis expressed 19 -17.495 -18.247 -17.159
TP53I3 tumor protein p53
inducible protein 3
3.375 3.240 3.492
ZNF618 zinc finger protein 618 4.734 2.969 4.531

Chapter 4 – Metastasis model for Ewing’s sarcoma in NOD/Scid mice
137
Furthermore, some genes were regarded as interesting due to their functions and
due in some cases to very high fold-changes in expression. In detail, these were
ALDH1A1 (Aldehyde dehydrogenase 1 family, member A1) with a fold-change
of -7.1 and IL-8 (Interleukin-8) with a fold-change -15.2 in the comparison of
“VH-64 vs. bone metastases”. Furthermore, in the comparisons of cell line
against bone and lung NRG1 (Neuregulin 1) was differentially expressed with
fold-change values of –8.6 and -7.5, respectively. VCAN (Versican) was up-
regulated in lung and bone marrow metastases with fold changes of 6.5 and 5.8,
respectively.
For the comparison of “VH-64 vs. lung metastases” the IPA core analysis
revealed 143 canonical pathways that were most relevant based on the listed
genes. For “VH-64 vs. bone metastases” IPA discovered 56 relevant canonical
pathways and for the comparison of “VH-64 vs. bone marrow metastases” 161
canonical pathways were displayed as relevant.
The top canonical pathways for the comparisons of the parental cell line to the
organ-specific metastases are listed in Table 4.9.

Chapter 4 – Metastasis model for Ewing’s sarcoma in NOD/Scid mice
138
Table 4.9: Top Canonical pathways associated with the comparisons between VH-64 and
the different organ-specific subclones.
Canonical Pathways p-value Ratio
VH-64 vs. lung metastases Hypoxia Signalling in the Cardiovascular System 0.0002 11.8% Role of Pattern Recognition Receptors in Recognition of Bacteria and Viruses 0.0077 8.1% Granzyme A Signalling 0.0079 17.6% Cardiomyocyte Differentiation via BMP Receptors 0.0093 15.8% Activation of IRF by Cytosolic Pattern Recognition Receptors 0.0163 7.8% VH-64 vs. bone metastases Neuregulin Signalling 0.0123 2.1% Glycerolipid Metabolism 0.0140 2.1% Airway Pathology in Chronic Obstructive Pulmonary Disease 0.0157 12.5% Hepatic Cholestasis 0.0253 1.5% Aryl Hydrocarbon Receptor Signalling 0.0261 1.4% VH-64 vs. bone marrow metastases p53 Signalling 0.0087 3.3% T Cell Receptor Signalling 0.0095 3.0% Sphingosin-1-phosphate Signalling 0.0119 2,7% Glioma Invasiveness Signalling 0.0266 3.6% Estrogen-Dependent Breast Cancer Signalling 0.0313 3.1%
Table 4.10 lists the biological and disease processes, which IPA discovered as
most relevant to the gene lists of the comparisons.
The most relevant molecular and cellular process listed for all three comparisons
is “Cellular Development”. For the comparisons of lung and bone marrow
metastases to the parental cell line the processes of “Cellular Growth and
Proliferation” as well as “Cellular Movement” play a dominate role.
“Cancer” as a disease process is listed with very low p-values for all three organ-
specific comparisons.

Chapter 4 – Metastasis model for Ewing’s sarcoma in NOD/Scid mice
139
Table 4.10: Top biological functions of genes listed in the comparisons between VH-64 and
the different organ-specific subclones.
Biological and disease processes # molecules p-value
VH-64 vs. lung metastases Diseases and Disorders Developmental Disorder 25 0.0000-0.0490 Cancer 104 0.0007-0.0490 Reproductive System Disease 17 0.0022-0.0248 Infectious Disease 9 0.0025-0.0025 Respiratory Disease 9 0.0025-0.0025 Molecular and Cellular Functions Cellular Development 65 0.0000-0.0497 Cellular Growth and Proliferation 74 0.0000-0.0490 Cellular Movement 42 0.0000-0.0490 Cell Morphology 25 0.0003-0.0490 Cellular Assembly and Organisation 25 0.0003-0.0490 VH-64 vs. bone metastases Diseases and Disorders Cancer 5 0.0013-0.0098 Neurological Disease 4 0.0015-0.0292 Dermatological Diseases and Conditions 2 0.0020-0.0121 Developmental Disorder 1 0.0020-0.0020 Genetic Disorders 5 0.0020-0.0425 Molecular and Cellular Functions Cellular Development 9 0.0001-0.0482 Cell Cycle 3 0.0001-0.0463 Cell Morphology 5 0.0001-0.0482 Cellular Movement 6 0.0002-0.0482 Cellular Assembly and Organisation 4 0.0002-0.0311 VH-64 vs. bone marrow metastases Diseases and Disorders Cancer 23 0.0047-0.0415 Connective Tissue Disorders 1 0.0047-0.0047 Developmental Disorder 4 0.0047-0.0233 Genetic Disorders 10 0.0047-0.0415 Hematological Diseases 4 0.0047-0.0130 Molecular and Cellular Functions Cellular Development 12 0.0006-0.0450 Cellular Growth and Proliferation 5 0.0016-0.0233 Cellular Movement 8 0.0026-0.0415 Amino Acid Metabolism 1 0.0047-0.0047 Cell-To-Cell-Signalling and Interaction 5 0.0047-0.0187

Chapter 4 – Metastasis model for Ewing’s sarcoma in NOD/Scid mice
140
4.4.3.3 Validation of microarray results with qRT-PCR
Selected genes were used to validate the microarray results. ALDH1A1 as well
as MEG3 showed differential expression when bone-derived subclones were
compared with the parental cell line VH-64. Microarray results suggested up-
regulation of ALDH1A1 and down-regulation of MEG3. NRG1 was chosen due
to a suggested down-regulation in bone- and lung-derived subclones. Due to
microarray results APOC1 was down-regulated in bone marrow metastases. All
genes were selected because a literature research revealed research results for
their function in proliferation, growth and other supportive functions and
appearance in other types of cancer. Results of the performed qRT-PCRs are
displayed in Figure 4.10.

Chapter 4 – Metastasis model for Ewing’s sarcoma in NOD/Scid mice
141
Figure 4.10: qRT-PCRs performed for the validation of the microarray experiment. Cell
lines VH-64 and TC-71 as well as primary organ-specific subclones were tested for the
expression of ALDH1A1, MEG3, NRG1 and APOC1. Values are displayed as fold changes
relative to the according parental cell line. K004, K006 are bone-derived subclones; L004, L006,
L062, L132, L131, L130 are lung-derived subclones; KM006, KM062, KM132 are bone marrow-
derived subclones.
Although the same RNA samples were used for both experiments, fold-change
values from qRT-PCR and microarrays cannot be directly compared as the
methods are quite different and samples were handled in a different way.

Chapter 4 – Metastasis model for Ewing’s sarcoma in NOD/Scid mice
142
For NRG1 and APOC1 TC-71 and -derived subclones from lung respectively
bone marrow were tested additionally to VH-64 and derived subclones and
showed the same trend as VH-64-derived subclones.
All verified genes showed the same trend previously suggested by microarray
results. For ALDH1A1 fold-changes derived from the qRT-PCR data suggest a
knock-down in subclones compared to the parental cell line (K004, 0.19; K006,
0.44). The qRT-PCR derived fold-changes for NRG1 in the VH-64-derived
subclones varried with little variation from 0.28-fold to 0.5-fold (K004, 0.44;
K006, 0.28; L004, 0.36; L006, 0.5; L062, 0.49). Down-regulation in the TC-71-
derived subclones is less obvious with values of 0.73-fold to 0.86-fold (L132,
0.76; L131, 0.73; L130, 0.86).
For MEG3 the two tested bone-derived subclones showed up-regulation (K004,
50.6; K006, 3.63) compared to VH-64 but the values showed high variability.
For APOC1 a suggested up-regulation in bone marrow could not be entirely
verified as one of the VH-64-derived subclones showed a slight down-regulation
in comparison to the parental cell line (KM006, 0.90; KM062, 2.13). For the
only TC-71-derived bone marrow subclones the values was 1.06-fold.
However, due to the preliminary character of the data derived from qRT-PCR, it
is not possible to make a reliable statement about significance and variability of
values. The qRT-PCR experiments would have to be repeated with more
subclones derived from the different tissues investigated (lung, bone and bone
marrow).

Chapter 4 – Metastasis model for Ewing’s sarcoma in NOD/Scid mice
143
4.5 Discussion
Using a previously established mouse model of ES/PNET metastasis it was
possible to isolate organ-specific metastases (Vormoor et al., 2001). The initial
hypothesis that subclones would develop a preferential tendency to metastasise to
specific organs was not proven. It can only be assumed that after re-
transplantation of subclones cells derived from lung metastases were able to
establish in lung and bone marrow as the re-transplanted bone marrow-derived
subclone was as well. However, it was not possible to analyse these results
statistically due to small experimental numbers (see Table 4.3).
Analysis of the time to metastasis after re-transplantation of the lung-derived
subclone showed that these cells were able to establish metastases in a
significantly shorter period of time compared to the parental cell line and the
bone-derived subclone. There was no difference between the cell lines VH-64
and TC-71. These data suggest that subclones were selected in vivo for their
aggressiveness and proliferation rates. However, in vitro analysis of subclones
showed that there was no difference in growth behaviour, cell cycle or
clonogenicity. Morphologically subclones of VH-64 and TC-71 appeared to
contain slightly more vacuoles and therefore might have a slightly higher
metabolic rate compared to the parental cell lines which might indicate a higher
activity (see Figure 4.8).
Expression profiling of cell lines and organ-specific subclones revealed a subset
differentially expressed in all subclones compared to the parental cell line
VH-64. This subset might be composed of genes that play a general role in
metastasis of ES/PNET and that advance aggressiveness and proliferation of

Chapter 4 – Metastasis model for Ewing’s sarcoma in NOD/Scid mice
144
cells. However, it remains possible that this subset might be influenced by the
fact that metastases were taken back into culture after isolation from the mouse.
Interesting candidate genes will have to be further analysed to clarify their role in
metastasis of ES/PNET. Amongst these genes might be the two genes CTCFL
and RSAD2 which were extremely up-regulated in all subclones compared to the
cell line. Furthermore, RNF128 and TEX19 were down-regulated to a great
extend in comparison with the cell line VH-64.
CTCFL, also known as BORIS, is an 11-zinc-finger factor involved in gene
regulation. It utilizes different zinc fingers to bind varying DNA target sites thus
activating transcription and is also able to influence histone methylation. CTCFL
also positively influences hTERT (human telomerase reverse transcriptase)
transcription, conferring cells with the ability to divide indefinitely (Nguyen et
al., 2008; Renaud et al., 2010).
RSAD2 is best known for its vital role in the anti-viral response after infection
with different types of viruses (Jiang et al., 2008), where it inhibits steps in viral
proteins and/or RNA biosynthesis (Jiang et al., 2010).
RNF128, also known as GRAIL, is an E3 ubiquitin ligase associated with T cell
tolerance. Until now not much is known about RNF128 in other contexts,
however, GRAIL-deficient naive T cells, after activation, exhibited increased
proliferation and cytokine expression (Nurieva et al., 2010). Thus, down-
regulation of RNF128 in ES/PNET cells might influence proliferation positively.
The function and role of TEX19 remains to be fully elucidated. It is mainly
expressed in adult testis and in undifferentiated embryonic stem cells (Kuntz et
al., 2008).

Chapter 4 – Metastasis model for Ewing’s sarcoma in NOD/Scid mice
145
The analysis of gene expression of organ-specific subclones directly against each
other revealed subsets of genes that might harbour candidate genes that mirror
the specific influence of the microenvironment in the organs from which the
metastases were isolated. For bone down-regulation of CXCL10, GDF10, IFI44
and IFI44L as well as up-regulation of RAB4A and RPS11 seemed to be
specific.
CXCL10 is secreted by several cell types in response to IFN-γ and binds to
CXCR3. Expression of this chemokine leads to pleiotropic effects. These include
stimulation of monocytes, migration of natural killer and T cells, as well as
modulation of adhesion molecule expression. However, overexpression of
CXCL10 is unfavourable for the survival and proliferation of cancer cells
(Nagpal et al., 2006). Down-regulation of CXCL10 by bone-derived subclones
might indicate that cells are trying to prevent a host immune response. This has
been shown to play a role in tumour progression of ES/PNET (Zhang et al.,
2003; Berghuis et al., 2011).
GDF10 is also known as BMP3B (bone morphogenetic protein 3B). BMPs are
multifunctional cytokines involved in skeletal development and bone formation.
In the exquisite interplay of BMPs, GDF10 is an antagonist of BMP2, which is
usually expressed by osteoblasts and potently induces osteoblast differentiation
in a variety of cell types (Marie et al., 2002). Thus it might be reasoned that
down-regulation of GDF10 leads to increased osteoblast formation.
The function of IFI44 is not entirely understood. However, there is indication,
that overexpression of IFI44 cDNA impairs proliferation in vitro through
IFN-alpha activation, even in cells that are not responsive to IFN-alpha. A model
was proposed suggesting that IFI44 binds intracellular GTP, thus abolishing

Chapter 4 – Metastasis model for Ewing’s sarcoma in NOD/Scid mice
146
extracellular signal-regulated kinase (ERK) signalling and resulting in cell cycle
arrest (Hallen et al., 2007).
Relatively little is known about RAB4A. It is, however, known that it plays a
role in receptor recycling. Some receptors such as PDGF (platelet derived growth
factor)-beta receptor recycle back to the membranes through vesicular transport
dependent on the small GTPase Rab4a (Hellberg et al., 2009). Thus, up-
regulation of RAB4A might be supportive for cell proliferation and migration
through recycling of PDGF-beta receptor back to the cell surface.
RPS11 encodes a ribosomal protein that is a component of the 40S subunit of the
ribosome. Up-regulation of RPS11 might indicate an increased protein synthesis
and thus higher metabolic activity of the bone-derived subclones.
Furthermore, HERC6 and RSAD2 might be specific markers for lung metastases
as they were significantly up-regulated in lung subclones compared to the
parental cell line.
Comparing the three subclone-types it was also obvious that MMP1 is
up-regulated especially in bone but also in lung metastases while it is not
expressed to a greater extend in bone marrow metastases. MMP1 encodes for a
secreted enzyme which breaks down the interstitial collagens, types I, II, and III.
This is why it would have been expected to be up-regulated in metastases from
the bone especially to support growth within the bone microenvironment, which
contains collagen I to a great extent.
Interesting genes and their functions are finally summed up again in Table 4.10.

Chapter 4 – Metastasis model for Ewing’s sarcoma in NOD/Scid mice
147
Table 4.11: Notable genes flagging up in the different comparisons and their most striking
functions known so far.
Gene Regulation Functions and processes
VH-64 vs. Metastases
CTCFL ↑ in metastases DNA-binding, promoter binding, transcription activator
activity
RSAD2 ↑ in metastases Relatively unknown, catalytic activity
RNF128 ↓ in metastases Ligase activity, ubiquination of transmembrane proteins
TEX19 ↓ in metastases unknown
Metastases amongst each other
CXCL10 ↓ in bone metastases Chemokine-activity, receptor-binding, cell-cell-signalling
GDF10 ↓ in bone metastases Cytokine activity, growth factor activity
IFI44 ↓ in bone metastases Relatively unknown, response to virus
IFL44L ↓ in bone metastases Relatively unknown, immune response
RAB4A ↑ in bone metastases ATP-, GTP- and GDP-binding, signal mediation
RPS11 ↑ in bone metastases Gene expression, translation
HERC6 ↑ in lung metastases Ligase activity, protein-modification
RSAD2 ↑ in lung metastases See above
MMP1 ↑ in bone and lung metastases metalloendopeptidase activity, collagen catabolic process
A further point one has to bear in mind is that there is a clonal variation
influencing the comparisons and the resulting gene lists. As each metastasis
derives from one cell/clone the grouping of the organ-specific metastases has to
be seen critical.

Chapter 4 – Metastasis model for Ewing’s sarcoma in NOD/Scid mice
148
4.6 Conclusions
The described experiment indicates that there is no preference of cells derived
from organ-specific metastases to re-metastasis to their organ of origin. This is
why subsequent experiments will have to focus on specific genes, which were
identified in the mentioned comparisons. Gain-of-function or loss-of–function
experiments with certain genes of interest might clarify whether there is a
mechanism regulating the organ-specific metastasis in ES/PNET and whether the
specified genes have a potential to serve as markers or even therapeutic targets.
However, to be able to give a final answer to the hypothesis this experiment will
have to be repeated with primary material for transplantations. It is very likely
that the fact of pre-selection for high proliferation rates and aggressiveness of
cells in cell culture and the fact that cell lines lack a certain variety of cells
influence this experimental setting negatively.
Furthermore, it can be concluded that the identified genes in the comparison of
the parental cell line against the organ-specific metastases stand for an increased
aggressiveness and proliferation potential. However, further experiments will
have to follow as functions and role of most of the interesting genes is still not
entirely clear. These experiments could involve knockdown experiments and
subsequent in vivo examination as well as in vitro experiments on functions.
Chapter 5 – Role of CXCL12 in metastasis of Ewing’s sarcoma
149
5. Chapter – The role of CXCL12 in metastasis of Ewing’s
sarcoma
5.1 Introduction
CXCR4 is overexpressed in a variety of different cancer types and cancer cell
lines. The role of the CXCL12/CXCR4-axis in breast cancer, prostate cancer and
melanoma has been well established (see chapter 1.3.2) and its potential role in
ES/PNET is discussed in chapter 1.3.3.
RNA interference (RNAi) was used to knockdown CXCR4 in ES/PNET cell
lines to be able to investigate features of the role of this cytokine/receptor-
couple.
5.1.2 RNA interference
In 2006, Craig Mello and Andrew Fire were honoured with the Nobel Prize in
Physiology or Medicine for their work on RNAi (Zamore, 2006). They and their
co-workers were the first to demonstrate that double-stranded RNA (dsRNA)
triggers gene-silencing in Caenorhabditis elegans (Fire et al., 1998). Shortly
after the discovery, it became clear that mammalian cells operate with the same
RNAi mechanism and that this could potentially be used for therapeutic
approaches (Elbashir et al., 2001).
Subsequently, this landmark discovery developed into a technique that is now
widely used to target genes directly by silencing through RNAi, enabling
researchers to investigate the role of genes in a very elegant and isogenic way.
Chapter 5 – Role of CXCL12 in metastasis of Ewing’s sarcoma
150
5.1.2.1 Gene expression control in eukaryotic cells
There are many mechanisms controlling the expression of genes. Pre-
transcriptional control is achieved through epigenetic modifications of the DNA.
Post-transcriptionally RNAi offers a natural possibility of gene expression
control. This mechanism is believed to regulate vertebral differentiation and
development. Due to the complexity of the RNAi processes and further features
of gene expression control, the topic will not be described in all details (see
review Carthew and Sontheimer, 2009).
After its discovery and alongside its investigation, the mechanism of RNAi has
been used to develop techniques which are able to specifically knockdown and
investigate genes of interest (see Figure 5.1).

Chapter 5 – Role of CXCL12 in metastasis of Ewing’s sarcoma
151
Figure 5.1: The RNAi pathway in vertebrate cells. The left side of the picture presents
possibilities of interference into the natural process of RNAi by introducing siRNAs (small
interfering), shRNAs (small hairpin RNAs) transcribed by RNA Pol III or artificial pri-miRNAs
(primary micro RNA) into the cells. Not all factors involved in the process are shown. Ago2,
Argonaute-2; Dicer, Helicase; Drosha, RNAse III; Exp5, Exportin-5; Pol II and Pol III,
polymerases II and III; RISC, RNA-induced silencing complex (Cullen, 2005).
The natural process of RNAi in vertebrates is driven by endogenously encoded
micro RNAs (miRNAs). These are single-stranded and composed of

Chapter 5 – Role of CXCL12 in metastasis of Ewing’s sarcoma
152
~22 nucleotides (nt) which match part of the sequence of a specific mRNA. In
the human organism the number is currently estimated to up to 1000 miRNAs
which control the expression and activity of approximately 30% of the human
genes (Kurreck, 2009). This gives RNAi an impact that is as important as the
impact of transcription factors in gene regulation.
Polymerase II transcribes a ~85nt long primary miRNA (pri-miRNA). The
miRNA is part of a hairpin loop as secondary structure. Subsequent to
transcription, the pri-miRNA is processed by the RNAse III Drosha into a pre-
miRNA by cleaving the hairpin ~22nt away from the loop structure leaving a
characteristic 2nt 3’-overhang (Lee et al., 2002, 2003). Transported to the
cytoplasm by Exportin-5, the pre-miRNA is bound by the helicase Dicer. It
recognises the characteristic overhang and cleaves ~22nt away from the end so
that the loop is removed and a second 2nt 3’-overhang is produced (Bernstein et
al., 2001; Elbashir et al., 2001; Zhang et al., 2004).
The resulting duplex is bound by one of the four members of the Argonaute
subfamily of proteins (Ago proteins) and becomes part of the forming RISC
(RNA-induced silencing complex). This programming of RISC allows the
specific down-regulation of homologous mRNA (Cullen, 2004).
Two steps are necessary to complete RISC assembly: loading and unwinding of
the miRNA. Similar aspects apply to small interfering RNA (siRNA) duplexes
that can be introduced artificially. It is not yet completely known how RISC is
loaded in mammals. However, there seem to be two possible pathways – a Dicer-
dependent one and a Dicer-independent one.
Once the duplex is loaded onto the RISC, one of the two strands has to be
discarded in order to make a single strand able to bind to homologous mRNA.

Chapter 5 – Role of CXCL12 in metastasis of Ewing’s sarcoma
153
The determination of the strand to be cleaved is not random but follows
thermodynamic rules: The thermodynamic stability of the bases 1-4 at each end
is determining and the strand with a less stable 5’-end serves as the guide strand
and remains bound to RISC (Khvorova et al., 2003; Schwarz et al., 2003).
All four Ago proteins can repress translation of gene transcripts, but only one of
them, AGO2, has a cleavage (slicer) activity (Liu et al., 2004). This leads to the
passenger strand of the siRNA duplex being degraded as well as the bound
mRNA that is supposed to be destroyed. As target cleavage requires extensive
base pairing; only high complementary siRNA duplexes are processed by AGO2.
Most endogenous duplexes, however, harbour some mismatches.
The Slicer-independent version of the unwinding process of small RNA duplexes
is still not understood entirely. Recent findings suggest, that mismatches in
specific regions of the small RNA duplexes guide the process of slicer-
independent unwinding (Kawamata et al., 2009; Yoda et al., 2010). There is
strong evidence for the assembly of many different factors involved in the decay
of RNA, such as decapping proteins, nucleases and others in a complex called p-
body (Franks and Lykke-Andersen, 2008). Further investigations, however, are
required to fully understand this mechanism.
Both, slicer-dependent and –independent processes lead to elimination of
passenger strand debris or the whole passenger strand from the RISC. Debris and
whole strands are immediately degraded by nucleases so that the process is
essentially irreversible (Kawamata and Tomari, 2010).
Furthermore, the Ago proteins can also be loaded with single-stranded siRNA
via a so called “bypass loading”. This fact can be used to specifically knockdown
genes with exogenous siRNAs that are transferred into cells (Kurreck, 2009).

Chapter 5 – Role of CXCL12 in metastasis of Ewing’s sarcoma
154
5.1.2.2 Using shRNA for silencing of genes
SiRNAs form a class of double-stranded RNAs which play a decisive role in
biology. Amongst others, the most notable role is the involvement of siRNA in
RNAi, where it interferes with the transcrips of specific genes and thus their
expression.
Quickly, siRNA had been proven to offer a possibility of gene silencing in vitro
and in vivo (de Fougerolles et al., 2007) although there are certain disadvantages
of naked as well as of lipid-complexed siRNA. One of these is the delivered
siRNA has a short half-life. The intracellular expression of siRNA for a sustained
silencing of genes was achieved through especially constructed DNA vectors
which were transferred into cells. In general, the so called short hairpin RNA
(shRNA) is expressed through polymerase III (Pol III) promoters and the RNAi
machinery can be employed for the purpose of post-translational gene control
(Brummelkamp et al., 2002; Paddison et al., 2002).
The usage of viral approaches for transfection of plasmid-encoded shRNA leads
to a stable expression of shRNA and subsequently knockdown of targeted
mRNA following integration of the viral vector into the host genome. However,
there are also certain disadvantages to viral systems such as antiviral responses
being triggered through the presence of viral dsRNA resulting in expression of
factors that lead to an inhibition of the complete translation and subsequently
may lead to apoptosis of cells (Williams, 1997). Furthermore, the use of viral
vectors that cause insertion of DNA might result in destruction or alteration of
genes or their expression.

Chapter 5 – Role of CXCL12 in metastasis of Ewing’s sarcoma
155
5.1.3 The vector pEPI-1 and the promoter H1
In this project, a shRNA approach was used to attempt knockdown of CXCR4 in
ES/PNET cell lines using the vector pEPI-1 (see chapter 4.1.4) and the pol III
promoter H1.
The pEPI-1 vector is a non-viral and episomal vector that does not integrate into
the host’s genome. Therefore, it is less likely to interfere with any existing
genetic functions and furthermore does not rely on any position-depending
expression and thus has predictable characteristics.
The central element of this vector is the scaffold/matrix attachment element
(S/MAR) derived from the 5’-region of the human gene interferon β which
allows the attachment of certain chromatin domains to the protein skeleton of the
nucleus which makes vectors using this element very likely to be stabely
expressed and to be passed on during division of cells (Bode et al., 1992).
However, S/MARs have further advantages such as promotion of transcription
and replication of the vector using the cells machinery as well as protection of
the alien genetic material.
Furthermore, pEPI-1 harbours a Kanamycin/Neomycin-resistance gene allowing
for selection of positive clones during the cloning process as well as for the
resulting cell line.
This vector is stable within cells for several hundred generations without any
necessity of selective pressure (Piechaczek et al., 1999).
The described vector was used as a basis construct. It was necessary to insert a
pol III promoter for the expression of shRNA. In this case, the H1-RNA gene
promoter was chosen as pol III promoter because it creates a small RNA
transcript lacking a polyadenosine tail. Furthermore, it has a precise start of

Chapter 5 – Role of CXCL12 in metastasis of Ewing’s sarcoma
156
transcription and a termination signal involving five thymidine bases in a row
(T5). The most significant advantage is the fact that the transcribed shRNA is
cleaved after the second uridine (U) of the termination site. This produces a
transcript with ends resembling the ones of synthetic siRNAs as it also contains
two 3’ overhanging T or U nucleotides (Baer et al., 1990; Brummelkamp et al.,
2002).
5.2 Aims
CXCR4 plays a role in different cancer types such as breast cancer and prostate
carcinoma, and there is evidence that the CXCR4/CXCL12-axis might play a
role in the metastasis of ES/PNET, including consistent high expression in nearly
all ES/PNET cell lines and many primary tumours. Nevertheless, there is still a
need for a direct proof of this assumption. Given this, a knockdown system for
CXCR4 would allow researchers to investigate the importance and role of
CXCR4 in ES/PNET and the consequences of a CXCR4-knockdown in
ES/PNET cell lines.
The specific aims of this chapter were as follows:
to create a knockdown vector against the cytokine receptor CXCR4
to investigate functionality and influence of the knockdown vector

Chapter 5 – Role of CXCL12 in metastasis of Ewing’s sarcoma
157
5.3 Methods and Materials
5.3.1 Cloning strategy for the knockdown construct
The extra-chromosomal vector pEPI-EGFP (Figure 5.2) is a derivate of pEPI-1
containing an additional sequence for the eGFP gene and was kindly provided by
Prof. Dr. Lipps (University Witten-Herdecke, Witten, Germany). The aim of the
cloning strategy was to insert a pol III promoter as well as a sequence coding for
a shRNA directed against CXCR4 into pEPI-EGFP to create a knockdown
plasmid.
The pSUPER (Oligoengine, Seattle, USA; Figure 4.2) vector system was used to
create a cassette containing the H1-RNA pol III promoter and a custom DNA
sequence encoding for a shRNA against CXCR4.

Chapter 5 – Role of CXCL12 in metastasis of Ewing’s sarcoma
158
Figure 5.2: Map of the pSUPER vector. Important sites are H1 pol III promoter: 708-934; pUC
origin: 1373-2040; PstI: 705; BglII: 928; HindIII: 934; KpnI 974. Restriction sites used for
insertion of oligonucleotide for shRNA marked with red arrow, restriction sites used for excision
of cassette containing H1 pol III promoter and oligonucleotide marked with blue arrow.
A pair of custom oligonucleotides was purchased (Purimex, Grebenstein,
Germany) that contained amongst other features unique sequences in sense and
antisense orientations (capital letters) derived from the mRNA transcript of
CXCR4, separated by a spacer (Wang et al., 2005). The antisense strand of the
resulting shRNA duplex hybridises to the target region of the CXCR4-mRNA
(yellow).

Chapter 5 – Role of CXCL12 in metastasis of Ewing’s sarcoma
159
5’ gatccccCACCCTGTTTCCGTGAAGAAttcaagagaTTCTTCACGGAAACAGGGtttt 3’ gggGTGGGACAAAGGCACTTCTTaagttctctAAGAAGTGCCTTTGTCCCaaaa tctaga aag 3’ agatct ttcagct 5’
The 5’-end of the forward oligonucleotide formed an altered BglII restriction site
(in red, alteration in blue), that is able to bind to a BglII overhang in the restricted
vector but can afterwards not be used as a BglII restriction site again and a SalI
restriction site (in green). Furthermore, an XbaI restriction site (in purple) was
inserted after the T5 sequence.
The whole cassette containing the H1 pol III promoter, the sequence coding for
the shRNA directed against CXCR4 and the additional XbaI restriction site was
restricted using this XbaI restriction site and the PstI restriction site up-stream of
the H1 pol III promoter. To avoid methylation of especially the XbaI restriction
site a dam- E. coli strand was used (see chapter 2.1.1) which is impaired in its
ability to methylate DNA.
Both restriction sites, XbaI and PstI are located within the MCS (multiple
cloning site) of pEPI (see Figure 4.3) so that the cassette could be ligated into
pEPI. Hereafter, the resulting vector is called pEPI-EGFP-shCXCR4.

Chapter 5 – Role of CXCL12 in metastasis of Ewing’s sarcoma
160
Figure 5.3: Map of the pEPI-EGFP vector. Important sites are S/MAR: 1-1983;
Neomycin/Kanamycin resistance: 3251-4046; PstI: 1994; KpnI: 2006; XbaI: 2028. Restriction
sites are located within the MCS (provided by Prof. Dr. Lipps).
All restrictions were verified by PCR, all ligations were tested with test
restrictions and finally plasmids were sequenced (primers see chapter 3.3.15).
As a control construct the cassette containing H1 pol III promoter and a sequence
coding for a shRNA directed against the fusion transcript MLL-AF4 was cloned
into pEPI-EGFP which should not affect ES/PNET cells because this fusion does
not occur in ES/PNET. The pSUPER containing the custom DNA construct
coding for the shRNA was kindly provided by Dr. Frida Ponthan. The cassette
was linearised using the restriction enzymes PstI upstream of the H1 promoter
and KpnI downstream of the custom DNA sequence. KpnI is also contained in
the MCS of pEPI-EGFP so that the cassette could be ligated into the

Chapter 5 – Role of CXCL12 in metastasis of Ewing’s sarcoma
161
appropriately digested vector and be subsequently used as a control. Following,
the resulting vector is called pEPI-EGFP-shMA6-Mut1.
5.3.2 Fluorescence activated cell sorting
TC-71 and VH-64 cell lines were transfected using LipofectaminTM according to
chapter 3.5.6. Cells were cultured until approximately 5 x 10⁶ cells could be
harvested from a T25 culture flask (90% confluence).
The protocol from chapter 3.5.8 was used to sort cells. When enough cells could
be collected, 300-500 sorted cells were re-acquired to assess purity of the desired
population.
5.3.3. G418 selection of clones
Enriched clones derived from fluorescence activated cell sorting were further
treated with G418 (aminoglycoside antibiotic similar in structure to gentamicin
B1; GIBCO). This blocks the polypeptide synthesis by inhibiting the elongation
step in both prokaryotic and eukaryotic cells. Resistance to this antibiotic is
delivered by the Neo/Kan gene from Tn5, which codes for an aminoglycoside
3‘-phosphotransferase and is contained in the sequence of pEPI-EGFP.
Transfected and then FACS-sorted cultures were treated with different end
concentrations of G418 ranging from 100 to 500μg/ml. The determined
concentrations for selection of the different pEPI-EGFP clones were 200μg/ml

Chapter 5 – Role of CXCL12 in metastasis of Ewing’s sarcoma
162
for transfected VH-64 cells and 300μg/ml for transfected TC-71 cells. Treatment
was administered for a minimum of 14 days.
5.4 Results
5.4.1 Examination of stability of pEPI-EGFP in Ewing’s sarcoma cell lines
To investigate the possibility of transfection and the stability of pEPI-EGFP in
ES/PNET cell lines, TC-71 and VH-64 were transfected with the plasmid using
LipofectaminTM. Subsequently, cells were tested for the production of eGFP
using a flow-cytometer. Furthermore, the transfected cells were sequentially
sorted using FACS and the cell lines resulting from the different and sequential
sorts were examined for their fluorescence over a longer period of time. Data are
shown for TC-71 and pEPI-EGFP-transfected TC-71 (Figure 5.4).
Transfection resulted in very low numbers of cells being positive for the plasmid
and thus fluorescent. With sequential sorting using FACS fluorescence-positive
cells could be enriched. Therefore, transfected cells were sorted, the selected
cells were cultivated until enough cells for a second sort could be harvested. The
resulting three different cultures were followed up with flow cytometry
demonstrating that the cells of the second sort were still positive two month post-
transfection (Figure 5.4B).
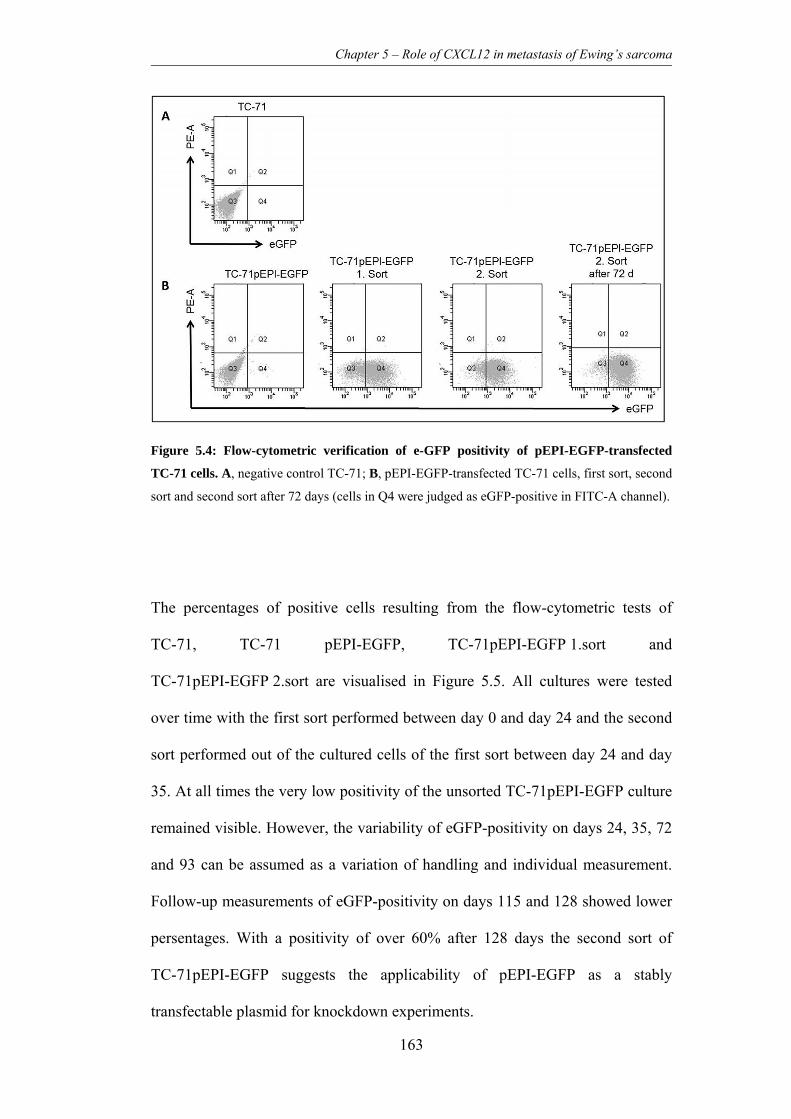
Chapter 5 – Role of CXCL12 in metastasis of Ewing’s sarcoma
163
Figure 5.4: Flow-cytometric verification of e-GFP positivity of pEPI-EGFP-transfected
TC-71 cells. A, negative control TC-71; B, pEPI-EGFP-transfected TC-71 cells, first sort, second
sort and second sort after 72 days (cells in Q4 were judged as eGFP-positive in FITC-A channel).
The percentages of positive cells resulting from the flow-cytometric tests of
TC-71, TC-71 pEPI-EGFP, TC-71pEPI-EGFP 1.sort and
TC-71pEPI-EGFP 2.sort are visualised in Figure 5.5. All cultures were tested
over time with the first sort performed between day 0 and day 24 and the second
sort performed out of the cultured cells of the first sort between day 24 and day
35. At all times the very low positivity of the unsorted TC-71pEPI-EGFP culture
remained visible. However, the variability of eGFP-positivity on days 24, 35, 72
and 93 can be assumed as a variation of handling and individual measurement.
Follow-up measurements of eGFP-positivity on days 115 and 128 showed lower
persentages. With a positivity of over 60% after 128 days the second sort of
TC-71pEPI-EGFP suggests the applicability of pEPI-EGFP as a stably
transfectable plasmid for knockdown experiments.

Chapter 5 – Role of CXCL12 in metastasis of Ewing’s sarcoma
164
Figure 5.5: Examination of stability of pEPI-EGFP expression in TC-71 over time. Graph
shows percentage of eGFP-positive and thus pEPI-EGFP positive cells from flow-cytometric
analysis of the different sorts over the period of 128 days.
Taking all results into account it can be assumed that it is possible to transfect
ES/PNET cell lines with the plasmid pEPI-EGFP, that the plasmid is expressed
in the cells and stable over a long period of time. This suggests that it could
allow for a stable knockdown of CXCR4 using a designed knockdown plasmid
based on pEPI-EGFP without any long-term selection pressure on the positive
cells. Thus, knockdown cells could be used for in vivo experiments without any
additional treatment of mice necessary. This is why in this project pEPI-EGFP
was used for further cloning of a knockdown plasmid against CXCR4 (strategy
see chapter 5.3.1).
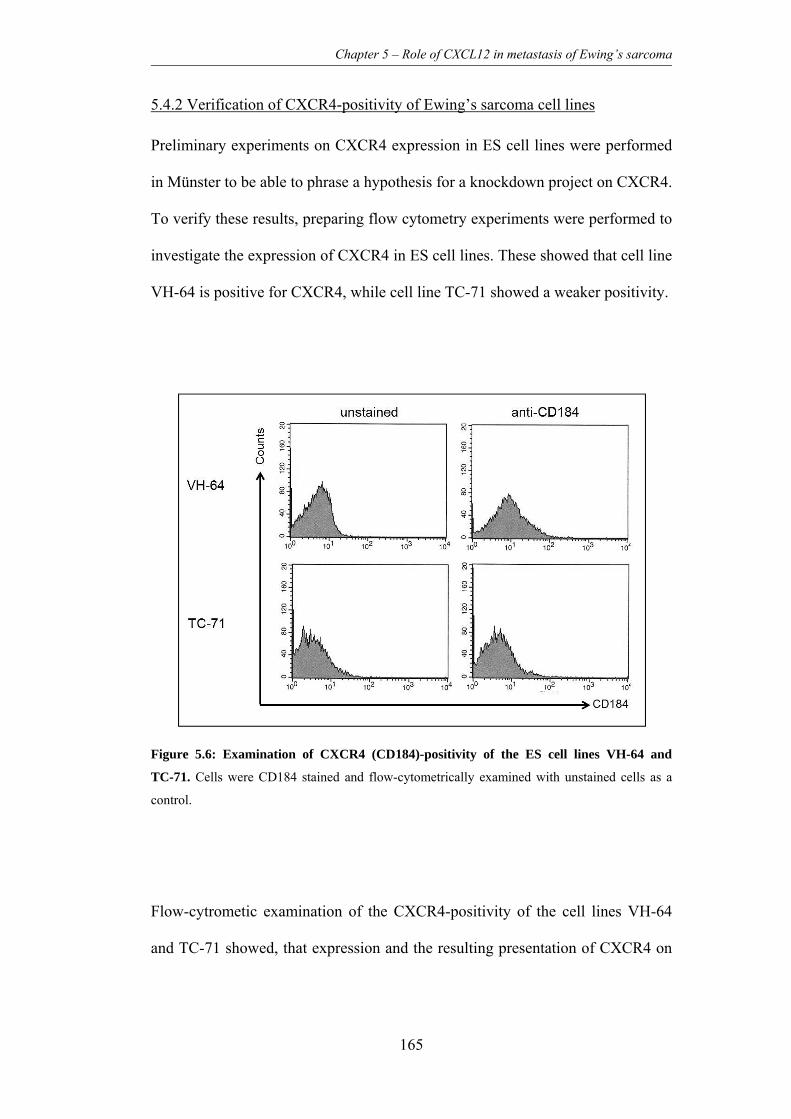
Chapter 5 – Role of CXCL12 in metastasis of Ewing’s sarcoma
165
5.4.2 Verification of CXCR4-positivity of Ewing’s sarcoma cell lines
Preliminary experiments on CXCR4 expression in ES cell lines were performed
in Münster to be able to phrase a hypothesis for a knockdown project on CXCR4.
To verify these results, preparing flow cytometry experiments were performed to
investigate the expression of CXCR4 in ES cell lines. These showed that cell line
VH-64 is positive for CXCR4, while cell line TC-71 showed a weaker positivity.
Figure 5.6: Examination of CXCR4 (CD184)-positivity of the ES cell lines VH-64 and
TC-71. Cells were CD184 stained and flow-cytometrically examined with unstained cells as a
control.
Flow-cytrometic examination of the CXCR4-positivity of the cell lines VH-64
and TC-71 showed, that expression and the resulting presentation of CXCR4 on

Chapter 5 – Role of CXCL12 in metastasis of Ewing’s sarcoma
166
the cell surface of VH-64 cells was slightly higher than in TC-71 cells (see
Figure 5.6).
Both cell lines were chosen for the following knockdown experiments using
constructed vectors containing a DNA-sequence, which is able to form a shRNA
for CXCR4-knockdown. This decision was made due to the fact that the majority
of experiments in the differents project parts were performed on those two cell
lines.
5.4.3 Verification of knockdown plasmid-positive Ewing’s sarcoma cell lines
Before transfection of cells plasmids were sequenced using the service of
Eurofins MWG Operon (compare chapter 3.2.15) to verify that pol III H1
promoter and the DNA-sequences coding for the shRNAs coding for mRNAs of
CXCR4 (shCXCR4) and the fusion MLL-AF4 (shMA6-Mut1) were cloned into
pEPI-EGFP resulting in the knockdown plasmid pEPI-EGFP-shCXCR4 and
negative control plasmid pEPI-EGFP-shMA6-Mut1.
After transfection of ES/PNET cell lines TC-71 and VH-64 a first verification of
plasmid uptake and eGFP production was performed. Therefore, pictures were
taken of the resulting transfected cell lines using a fluorescence microscope
(Figure 5.7).

Chapter 5 – Role of CXCL12 in metastasis of Ewing’s sarcoma
167
Figure 5.7: First examination of transfected cells using a fluorescence microscope. All
transfected cells showed fluorescence. A, TC-71pEPI-EGFP; B, TC-71pEPI-EGFP-shCXCR4;
C, TC-71pEPI-EGFP-shMA6-Mut1; D, VH-64pEPI-EGFP; E, VH-64pEPI-EGFP-shCXCR4;
F, VH-64pEPI-EGFP -shMA6-Mut1.
All produced cell lines showed plasmid-uptake resulting in eGFP expression and
thus green fluorescence of cells that could be visualised in the fluorescence
microscope. This led to the assumption that cells could be analysed flow-
cytometrically for plasmid expression as well as be sorted using FACS.
5.4.4 Selection of plasmid-positive cells
Subsequent to the first verification, transfected cells were sorted for eGFP-
positivity using FACS and subsequently, enriched cell lines were further selected
using G418.

Chapter 5 – Role of CXCL12 in metastasis of Ewing’s sarcoma
168
As previously shown for the preliminary experiment in which cells were
transfected with pEPI-EGFP, it was possible to serially FACS-sort for the
positivity of the knockdown plasmid and the control plasmid as well.
5.5 Discussion
The plasmid pEPI-EGFP proved to offer a good opportunity for stable
transfection of ES/PNET cell lines as transfected cells showed expression of
eGFP encoded by the plasmid over a long period of time. After more than four
months both transfected cell lines were still positive for the expression of eGFP
through pEPI-EGFP.
Following these results, a knockdown-plasmid containing DNA coding for a
shRNA against CXCR4 was constructed. Therefore, a cassette containing the
promoter H1 and the DNA encoding the shRNA was cloned into pEPI-EGFP.
All constructed plasmids were verified through sequencing.
First and very preliminary qRT-PCR experiments after transfection and selection
of cells from the two cell lines TC-71 and VH-64 were performed. A slight
knockdown of CXCR4 could be seen in TC-71pEPI-EGFP-hCXCR4. No
knockdown, however, was detected in VH-64pEPI-EGFP-shRNA (data not
shown due to missing repetitions and thus questionable significance). Due to
restriction of time no further experiments were performed and it was not possible
to fully examine the effect of CXCR4 knockdown on the cell phenotype. In the
future, verification of expression knockdown using qRT-PCR will have to be
performed. Furthermore, it will be necessary to perform functional experiments
after knockdown has been confirmed in the transfected cell lines. As previous

Chapter 5 – Role of CXCL12 in metastasis of Ewing’s sarcoma
169
work in CaP and breast cancer research has investigated the involvement of
CXCR4 in the metastasis of cells of these types of cancer it would be of interest
to investigate whether the knockdown of CXCR4 in ES/PNET cell lines
influences migration, adhesion and proliferation of cells. Subsequently, it would
be interesting to investigate the effect of a CXCR4-knockdown in the previously
established preclinical i. v. model which reflects the metastasis of ES/PNET as
seen in patients. Especially metastasis via the blood stream to bones in certain
types of cancer positive for CXCR4 has been shown to take place in a
CXCL12-dependent way (compare chapter 1.3.2).
There is evidence suggesting a role of the CXCL12/CXCR4 axis in ES/PNET as
well. High expression of CXCR4 was discovered to be correlated with a
metastatic behaviour and worse survival rates in ES/PNET patients. Moreover,
knockdown experiments targeting the fusion transcript EWS/FLI1 discovered
that CXCR4 expression seems to be up-regulated directly or indirectly through
this aberrant transcription factor. This supports a role of CXCR4 in the biology
of ES/PNET cells.
Subsequent to research performed in ES/PNET cell lines it should also be
considered to investigate the role of CXCR4 on primary material if possible. As
CXCR4 is currently considered to be a stem cell like marker, cultivation of cell
lines for a long time might have selected cells for their in vitro growth and as a
result of this might have left cells altered in their expression of several surface
markers. Furthermore, it might be interesting to consider a closer look especially
on the group of patients showing metastatic disease as the relation of metastatic
behaviour of ES/PNET to the expression of CXCR4 has been suggested
previously.

Chapter 5 – Role of CXCL12 in metastasis of Ewing’s sarcoma
170
5.6 Conclusion
To date, there is still a need for a direct proof of the responsibility and role of the
CXCL12/CXCR4-axis in the metastasis of ES/PNET. But taking the expression
levels of CXCR4 in nearly all ES/PNET cell lines and many primary tumours as
well as the role of this axis in other cancers into account there is strong indication
for an involvement of CXCR4 in the metastasis or even the organ-specific
metastasis of ES/PNET.
First results indicated that the constructed knockdown plasmid could be of value
as a system to stably repress expression of CXCR4. This is why further
investigations on the knockdown capacity of the constructed plasmid should be
carried out to be able to subsequently investigate on the effect of CXCR4
knockdown.

Chapter 6 – Development, establishment and validation of preclinical orthotopic mouse models for bone malignancies
171
6. Chapter – Development, establishment and validation of
preclinical orthotopic mouse models for bone malignancies
6.1 Introduction
Many varying models for investigations of the different aspects of ES/PNET
have been developed and used in studies (for a short overview see 6.1.2.2).
However, only orthotopic models can reflect and discover the interactions of
tumour cells in their “natural” microenvironment. Thus, i. f. transplantation into
the bone marrow cavity of immunodeficient mice might offer a more relevant
preclinical model for OS, ES/PNET and cancers that are known to metatstasise to
the bone marrow.
6.1.1 Further malignancies of the bone
The continuity of bone tissue relies on the balance between osteoblasts and
osteoclasts forming and resorbing new bone tissue, respectively. The presence of
cancer cells in this tissue and their interaction with the normal cells disturbs this
fragile equilibrium and can lead to aberrant new bone formation or destruction.
Although typically both processes may be observed in bone cancers such as
ES/PNET or OS, one is usually more prominent in each particular case
(Coleman, 2001). Factors released from the bone through bone remodelling are
believed to stimulate tumour growth and tumour cells are in turn able to produce
factors that stimulate osteoclast differentiation and activity. This results in the
establishment of a host-tumour relationship, often believed to be a “vicious

Chapter 6 – Development, establishment and validation of preclinical orthotopic mouse models for bone malignancies
172
cycle” due to its progressively destructive nature (Chirgwin and Guise, 2000).
The mechanisms of stimulation of osteogenesis through tumour cells associated
with osteoblastic lesions are still not well understood (Goltzman et al., 2000).
In childhood and adolescents, OS is the most frequent primary malignancy of the
bones and can originate in any bone, but is most commonly detected in the
metaphyses of long bones. Most common sites are the proximal humerus, the
distal femur or the proximal tibia with approximately 50% of cases occurring
around the knee area (Dahlin and Coventry, 1967; Weinfeld and Dudley, 1962;
Estrada-Aguilar et al., 1992). It develops mainly before the age of 30 years
(Pringle, 1999) with a metastatic spread mainly to the lungs, as seen in 20% of
presenting patients, which correlates with poor prognosis (Link et al., 1991;
Saeter et al., 1997). Based on the radiologic appearance bone lesions caused by
OS are characterized either as osteolytic, osteoblastic, or as mixed lesions
(Mundy, 2002). However, osteolysis is a common feature associated with OS, as
even predominantly osteoblastic lesions show osteolysis and this is mainly
caused by activation of osteoclasts and their bone-resorbing activity (Goltzman,
2001).
Furthermore, bone tissue is one of the most common sites for a metastatic course
of disease in many cancers including prostate carcinoma (CaP), breast and lung
cancer (see also chapter 1). This destruction of bone causes severe symptoms in
both bone sarcoma patients as well as cancer patients with metastatic disease of
the bone.
As a prominent example for a cancer type metastasising to the bone, more than
two thirds of advanced CaP cases develop bone metastases, with the axial
skeleton being most frequently affected (Reid and Hamdy, 2007). Furthermore,

Chapter 6 – Development, establishment and validation of preclinical orthotopic mouse models for bone malignancies
173
metastasis to weight-bearing bones can lead to pathological fractures and is
indicative of a worse prognosis (Oefelein et al., 2002).
To be able to grow both, cells of primary tumours as well as cells of metastatic
lesions need to interact with the matrix of the bone microenvironment so that the
restricting nature of the mineralized bone tissue can be overcome. This is
promoted by the mixed osteoblastic and osteolytic nature of bone tumours and
secondary lesions (Roodman, 2004). While the basic mechanisms of metastasis
of CaP to the metastatic niches have been explored (Lokeshwar et al., 1993;
Birchmeier and Behrens, 1994; Nagle et al., 1994), details of the mechanisms
still remain unknown. Furthermore, the process of bone remodelling in primary
bone tumours is still unclear and requires further investigation.
This lack of understanding of the biology of the underlying mechanisms of bone
remodelling has so far prevented the development of effective treatments for
osseous disease. The validation of a clinically relevant preclinical model should
provide a tool for both studying the mechanisms involved in disease progression,
and to examine novel treatments targeting the interaction of tumour cells with the
bone microenvironment.
6.1.2 Preclinical models for bone malignancies
Currently, many preclinical models of bone cancer still use s. c. xenografts,
which clearly do not mirror well the site of disease in patients. If the
effectiveness of a drug has been proven in vitro, it’s tolerance in vivo can easily
be tested in a simple mouse system. However, the more interesting and important
question is, whether the distribution of the drug and it’s interaction with the
Chapter 6 – Development, establishment and validation of preclinical orthotopic mouse models for bone malignancies
174
designated target is given and comparable to the situation in patients. One of the
experimental ways to address this problem is to employ an orthotopic model for
the research of new drugs and their effectiveness (Bibby, 2004).
6.1.2.1 Preclinical models of primary bone malignancies
A lot of preclinical models were developed using s. c. or i. v. techniques for
transplantation of xenografts. These techniques have their very own application
areas.
Subcutaneously transplanted ES/PNET cell lines (such as TC-71 and VH-64 in
own experiments) will form a solid tumour without difficulty so that this
technique is the most common one for investigations on different aspects of
tumour development and also used for pharmaceutical studies. There are, for
example, several research projects employing s. c. models to test the efficiency
of drugs against ES/PNET cells in vivo (Jia et al., 2006; Dalal and Burchill,
2009).
Injected into the flanks of athymic nude mice, development of tumours can be
supervised by eye and tumour volumes can easily be assessed with a calliper.
The measured length and width of the tumours are used to calculate the volume
applying specific formulas (Scotlandi et al., 2002; Sancéau et al., 2002). This
technique is applied vastly for the analysis of pharmacological aspects as it is a
simple readout-system. However, no interaction of tumour cells with the suitable
microenvironment of organs is given and thus tumours do not reflect the
situation in patients very well.

Chapter 6 – Development, establishment and validation of preclinical orthotopic mouse models for bone malignancies
175
As already mentioned before, i. v. transplantation of xenograft cells offers the
possibility to analyse the haematogenous metastatic behaviour of ES/PNET and
allows the interaction of these cells with the local microenvironment of tissues
and organs (see chapter 3.1.2.3). Transplantation of ES/PNET cells into
NOD/Scid mice leads to a pattern of metastasis similar to that seen clinically,
providing research with a suitable and reliable system for studying metastasis of
this disease. However, only relatively small numbers of the experimental mice in
these studies developed assessable bone metastases (Scotlandi et al., 2000;
Vormoor et al., 2001). This is why, it requires more effort to localise bone
metastases within this i. v. model and ideally involves the possibility to use non-
invasive imaging equipment.
OS can be induced in experimental animals through radiation. These tumours,
however, usually grow at a very low rate and are no xenographs and thus not of
human origin. This can hold problems for research (Witzel et al., 1992; Tinkey et
al., 1998). The development of xenograft models has been challenging, because
not all OS cell lines were able to manifest disease in vivo in
immunocompromised mice. However, several s. c and i. v. models using the cell
lines U2OS and SaOS-2 and derivates of those could be established (Zhou et al.,
1996; Jia et al., 1999; Manara et al., 2000).
6.1.2.2 Orthotopic preclinical models for primary bone malignancies
On-going from these established types of preclinical models it was necessary to
be able to model the primary tumour in its “natural” environment and tissue of
origin. Placing the transplant in the normal physiological location, such models

Chapter 6 – Development, establishment and validation of preclinical orthotopic mouse models for bone malignancies
176
would be more likely to mirror the human disease state. Therefore, more refined
techniques were developed referred to as orthotopic models.
In small experimental animals such as mice, ideal locations for orthotopic
transplantations would be the long bones of the leg: tibiae and femurs. An
orthotopic approach is usually technically more difficult than i. v.
transplantation, as animals have to be anaesthetised rather than simply restrained
for the procedure. However, demonstrably better results in these models justify
the additional effort and stress for the animals.
One of the methods uses transplantation of the xenograft directly into the tibia of
the mice. Zhou et al. established an orthotopic bone tumour model by
transplanting ES/PNET cells into the tibia of athymic nude mice. In this study
transplanted mice where treated with zoledronic acid or paclitaxel to investigate
the effect of these drugs on the developing tumours (Zhou et al., 2005). This i. t.
model was also employed for the analysis of the effects after knockdown of
VEGF (vascular endothelial growth factor) through siRNA (Guan et al., 2005).
There are more i. t. models for ES/PNET suggesting minimal-invasive
transplantation of tumour cells into the tibia of mice being a good opportunity to
investigate tumour-microenvironment interaction (Odri et al., 2010).
However, i. t. transplantation occasionally can imply an operation of the mouse
tibia due to difficulties of achieving injection through a punctual percutaneous
intraosseous intervention. This means a rather stressful procedure for the
experimental animals as well as a risk of infection.
This is why we suggest the method of i. f. injection for induction of orthotopic
tumours. As the state of research suggests a MSC to most likely be the cell of

Chapter 6 – Development, establishment and validation of preclinical orthotopic mouse models for bone malignancies
177
origin for ES/PNET (see chapter 1.1.7), placement of tumour cells within the
bone marrow cavity would be appropriate.
The method of i. f. transplantation provides a technically feasible and
reproducible system for cancer types associated with the bone or bone marrow
(Mazurier et al., 2003) and gives rise to tumours that are detectable by in vivo
imaging or with a certain size by palpation of the animals. One of the advantages
of an i. f. model is the relative good accessibility of the distal end of the femur
which has a larger diameter than the tibia. Therefore, this preclinical model
suggests being a good alternative orthotopic transplantation technique to the
technique of i. t. transplantation.
Recently, several orthotopic models for OS mainly using i. t. transplantation
have been established (Cao et al., 2005; Dass et al., 2005; Yuan et al., 2007).
However, as it still remains problematic to establish tumour formation in mice
after orthotopic transplantation some of these models employ genetically
modified cell lines. Therefore, they cannot be a true representation of the human
condition which has to be taken into account when using an orthotopic model.
6.1.2.3 Preclinical models for CaP metastases of the bone
In this project CaP was used as an exemplary type of cancer metastasising to the
bone. The metastasis of CaP to the bone has been studied extensively. Metastatic
behaviour of cell lines could be achieved through intracardiac as well as i. v.
transplantation and bone metastases could be observed (Glinskii et al., 2005;
Schneider et al., 2005). To be able to induce bone metastases directly, i. t.

Chapter 6 – Development, establishment and validation of preclinical orthotopic mouse models for bone malignancies
178
injections were performed resulting in tumours located within the bone (Corey et
al., 2002).
6.1.2.4 Development of the intrafemoral transplantation method
Orthotopic intraosseous transplantation could also be achieved through the
development of an i. f. model. Originally, this model was developed for the
transplantation of haematopoietic stem cells directly into the bone marrow cavity
(Mazurier et al., 2003).
Mazurier et al. showed that a class of cells with repopulating capability usually
found in the CD34+CD38lowCD36- compartment of human bone marrow was
detectable when human xenografts were injected directly into the murine femur.
As the majority of normal and malignant haematopoietic cells are located within
the bone marrow the process of homing through the circulatory system after i. v.
injection could be avoided through employment of the direct transplantation of
cells into the bone marrow cavity. This is especially important for cells which
lack the ability to migrate as they will not survive and establish in the bone
marrow. Thus, false negative results would be created. Indeed, previous research
suggested that the lack of this ability to migrate and home to the bone marrow
might be the cause for reported low seeding efficiency of no more than 10% of
human repopulating cells in mice (van Hennik et al., 1999).
This indicates that orthotopic injection of human xenografts is able to better
reflect the patient’s primary tumour as opposed to tumours derived through other
injection methods. The cell of origin for ES/PNET is still unknown but might
most possibly be a primitive pluripotential cell that exists in the bone marrow

Chapter 6 – Development, establishment and validation of preclinical orthotopic mouse models for bone malignancies
179
(Lin et al., 2011). This is why an orthotopic technique of transplantation is
thought to be suitable for transplantation of human ES/PNET cells directly into
their physiological appropriate microenvironment.
6.1.2.5 NSG mice
As described previously (chapter 3), immunocompromised mouse strains became
more and more important for preclinical studies. One of the more recently
developed mouse strains, offering an even higher grade of immunodeficiency
than NOD/Scid mice is the mouse strain NOD.Cg-Prkdcscid Il2rgtm1wjl/SzJ (NSG,
The Jackson Laboratory) developed by Shultz et al. (Shultz et al., 2005). The
motivation for the development of this mouse strain resulted from the
observation that NOD/Scid and other mouse strains with NOD background were
less able to reject implanted xenografts when the NK cell activity was further
depleted, e.g. through ionising radiation or anti-CD122 treatment (Hudson et al.,
1998; Shultz et al., 2003). However, irradiation of mice bares the disadvantage
that a strict and meticulous animal support is required and that significant
mortality rates can be observed (Hayakawa et al., 2009).
To obtain a mouse strain with a complete lack of NK cell activity, NOD-scid
females were crossed with B6.129S4-IL2Rγtm1Wjl/J males (IL2Rγ mutation is
X-chromosome-linked). The resulting (NOD x B6) F1 +/scid IL2Rγnull
hemizygous male offspring was backcrossed with NOD/Scid females for two
generations. Subsequently, females homozygous for scid and heterozygous for
the disrupted IL2Rγ gene were identified and the IL2Rγnull allele was backcrossed
for 8 generations onto the NOD-scid background. Resulting
Chapter 6 – Development, establishment and validation of preclinical orthotopic mouse models for bone malignancies
180
NOD.Cg-Prkdcscid IL2RγTm1Wjl/Sz (hereafter named NOD-scid IL2Rγ+/null) females
were crossed with NOD-scid IL2Rγnull/Y males. The NOD-scid IL2Rγnull female
and NOD-scid IL2Rγnull/Y male offspring was identified and intercrossed to
obtain the desired new mouse strain NOD.Cg-Prkdcscid Il2rgtm1Wjl/SzJ (Shultz et
al., 2005). These mice have a high level of immunodeficiency as they lack
mature T and B cells, functional NK cells and are depleted in cytokine signalling.
Additionally, the latter leads to these mice lacking the predisposition to thymic
lymphoma which is prevalent in the parental NOD/Scid strain. To avoid
confusion with other strains that have a NOD/scid background, The Jackson
Laboratories decided to give the strain the now common abbreviation of NSG
(NOD scid gamma).
Recently, several publications described that this mouse strain allows better
engraftment of human haematopoietic stem cells and cancer stem cells with
almost no rejection of xenotransplants due to the almost total absence of a
functional immune system. This makes this mouse strain a preferred tool for
research using preclinical models of diseases in this field (Agliano et al., 2008;
Goldstein et al., 2010). Based on these reports, the decision was made to use
NSG mice for the development of a novel preclinical and orthotopic model for
bone malignancies. Classically, NOD/Scid mice had been used for an i. v. model
of ES/PNET. These mice had to be irradiated before transplantation to deplete
the residual NK cell activity eventually causing rejection of xenografts.
However, irradiation led to a high burden of stress for experimental mice and
treatment-related deaths. Thus, the decision was made for NSG mice.

Chapter 6 – Development, establishment and validation of preclinical orthotopic mouse models for bone malignancies
181
6.1.3 Imaging techniques
A major difficulty in using orthotopic models of any cancer preclinically has
until now been the measurement of disease burden in a non-accessible site.
X-ray imaging was without a doubt a revolutionary innovation for medicine and
improved diagnosis to a great extent. However, more distinct and elegant
methods for imaging have been developed that allow to image and investigate
more features of the body and its diseases.
The current way of diagnosing ES/PNET is to scan the patient by X-ray in two
planes and take a biopsy of the possible tumour mass. MRI is used to examine
the patient’s stage of disease (Bernstein et al., 2006; Schmidt et al., 2007).
Ideally, all bones making up involved joints are imaged to be able to identify
possible skip lesions. CT is performed to be able to diagnose possible lung
metastases. PET is usually not used as a primary imaging modality for ES/PNET
and OS but may play a role in assessing treatment response. The variety of these
methods can nowadays also be applied for small animals using NanoCT- (in the
following referred to as CT), PET- or high-resolution MRI-machines.
The use of these newer in vivo imaging techniques offers the opportunity to
detect and monitor development and progression of the disease in clinically
relevant sites in transplanted mice and with the development of small animal
imaging technologies it is possible to develop and monitor orthotopic models of
disease investigating new drugs and cutting down animal numbers.
This chapter will not explain the techniques in detail but comment on advantages
and disadvantages of the different imaging opportunities (for details refer to
chapters 3.6.6, 3.6.7, and 3.6.8).

Chapter 6 – Development, establishment and validation of preclinical orthotopic mouse models for bone malignancies
182
6.1.3.1 Computed tomography
CT uses the technique of X-ray imaging. While X-ray images show one defined
plane and direction, a series of thousands of two-dimensional X-ray images taken
from changing perspectives can be calculated into a three-dimensional image.
Therefore, the exact absorption of radiation at a given location is recorded and
the obtained data can be reconstructed by a computer.
On the one hand, a disadvantage of the CT is the high dose of radiation patients
are exposed to. One abdominal CT is equivalent in radiation dose to 500 chest
X-rays (Rajarubendra and Lawrentschuk, 2010). This is why the diagnostic
benefit of a CT always has to be compared against the radiation exposure of the
patient.
On the other hand, the technique of CT images is able to show bony metastases
in detail. Bone structure, osteolytic as well as osteoblastic lesions, soft tissue
involvement and bone marrow metastases can be judged at early stages. Thus,
sensitivity of CT was reported to range from 71 to 100% (Gainford et al., 2005).
CT offers a good opportunity for preclinical research as images can be acquired
relatively fast and, therefore, many animals can be scanned in a row with short
anaesthesia times. Furthermore, newer small animal CT scanners offer high
resolution images that allow judging on processes taking place in the skeleton of
small experimental animals such as mice.
6.1.3.2 Positron emission tomography
FDG-PET imaging uses the fact that most malignant tumour cells exhibit
increased glucolysis (Smith, 1998). Most commonly, FDG is used as it behaves

Chapter 6 – Development, establishment and validation of preclinical orthotopic mouse models for bone malignancies
183
as a glucose analogue being accumulated by metabolically active cells. Thus, it is
able to provide qualitative and quantitative metabolic information leading to an
evaluation of a lesion.
The whole body can be scanned so that this technique also detects disease and
metastases in regions not routinely included in other imaging studies
(Rajarubendra and Lawrentschuk, 2010). Sensitivity of PET to detect metastases
has been estimated to 62 to 100% (Gainford et al., 2005).
To follow the progress of metastasis of ES/PNET non-invasively in the living
animal, high-resolution PET seems to constitute a useful tool and has been used
in several studies (Franzius et al., 2006).
6.1.3.3 Magnetic resonance imaging
One of the biggest advances of MRI is the fact that no ionizing radiation has to
be used to produce images. In the presence of a magnetic field the magnetic
moments of some of the protons of H2O change and align with the direction of
the field. Applied radiofrequency radiation is used to produce an electromagnetic
field which flips the spin of the aligned protons in the body. When the field is
turned off, the protons decay to the original spin-down state. The difference in
energy between the two states is released as a photon, which produces the
electromagnetic signal that the scanner detects and which is used to calculate
cross-sectional images of the body in any chosen plane (Rajarubendra and
Lawrentschuk, 2010).
Differences in intensity between the scanned tissues e.g. between tumour tissue
and bone or bone marrow make a detection and dimensioning of metastases

Chapter 6 – Development, establishment and validation of preclinical orthotopic mouse models for bone malignancies
184
possible. Furthermore, MRI is the only imaging modality that directly visualises
bone marrow and thus lesions can be found before destruction of the bone cortex
and before any osteoblastic or osteolytic changes occur (Vanel et al., 1998).
However, a disadvantage is the inability of MRI to depict destruction of the bone
structure as cortical bone does not give any signal. This is why, the current use of
imaging for diagnosis and staging of bone malignancies can only be a
combination of the three imaging techniques and CT and PET are often used in
combination as PET/CT with the images taken being overlaid.
6.2 Aims
The interaction between cells from certain types of cancer and the local
microenvironment of the bone remain undefined. There is a vast field of
preclinical research employing s. c. or i. v. models, but less work on orthotopic
models of bone cancer. As such, the aims of this chapter were as follows:
to develop an orthotopic in vivo model for malignant bone disease
(primary and metastatic) for preclinical drug testing.
to develop a model for studying the interaction between tumour cells and
bone (remodelling of the tumour microenvironment).
to investigate the opportunities for small animal in vivo bio-imaging to
monitor local disease progression.

Chapter 6 – Development, establishment and validation of preclinical orthotopic mouse models for bone malignancies
185
6.3 Results
6.3.1 Preliminary experiments
Preliminary experiments were performed to investigate whether the development
and establishment of an orthotopic model for primary bone sarcomas was
achievable through i. f. transplantation. Therefore, first i. f. transplantations in
small numbers were performed to investigate whether chosen cell lines TC-71
and VH-64 (ES/PNET), SaOS-2 (OS) and PC3M (CaP) were able to form
tumours in the desired orthotopic site. Furthermore, this preliminary experiment
was used to establish the imaging techniques and histology. These data are
included in the study and are presented together with the following results.
Additionally, mice that did not receive any treatment were used as controls in the
preliminary experiments (see Figure 6.1).

Chapter 6 – Development, establishment and validation of preclinical orthotopic mouse models for bone malignancies
186
Figure 6.1: Normal structure of a murine femur. A, Femur shaft with bone marrow cavity in
the centre (H&E staining, original magnification x10); B, detailed image of the cortex of a femur
with osteocytes within the bone tissue and periosteum lining the cortex at the outer border (H&E
staining, original magnification x40); C, distal end of the femur with growth plate and trabecular
bone structures (H&E staining, original magnification x4).
Images taken of histological H&E-stained sections showed intact bone marrow
(Figure 6.1 A), osteocytes within the cortical bone (Figure 6.1 B) and trabecular
bone as well as the growth plate within the distal end of the murine femur
(Figure 6.1C).
CT and PET images of transplanted mice were acquired as full-body images and
generally were overlaid in the first set of experiments (as described in 3.6.6 and
3.6.7, see Figure 6.2 to 6.4).
Generally, eyes, heart, intestines and in some animals the brain showed FDG
accumulation. Furthermore, the bladder and in some cases the kidneys as well

Chapter 6 – Development, establishment and validation of preclinical orthotopic mouse models for bone malignancies
187
showed FDG signal due to the FDG excretion. Muscles showed background
signal to a small extend in some cases.
Figure 6.2: PET/CT image of a VH-64 i. f. transplanted mouse. A, Image taken after 21 days;
B, Image taken after 42 days with the tumour marked with a white arrow (Maximum Intensity
Projection (MIP) CT image overlaid with FDG-PET image, dorsal view).
The PET/CT image taken of the ES/PNET cell line VH-64 i. f. transplanted
mouse did not show a tumour in the region of the right femur 21 days after
transplantation. After 42 days the PET/CT image showed formation of a tumour
surrounding the right femur. However, the contrast of the PET had to be very
high to make the tumour visible. This led to a lot of background and a very bright
heart signal making it impossible to judge whether there was pathologic
involvement of the lung (Figure 6.2).

Chapter 6 – Development, establishment and validation of preclinical orthotopic mouse models for bone malignancies
188
Figure 6.3: PET/CT image of a TC-71 i. f. transplanted mouse. A, Image taken after 22 days;
B, Image taken after 42 days with the tumour marked with a white arrow (MIP-CT image
overlaid with FDG-PET image, dorsal view).
The same accounts for the PET/CT image taken of the ES/PNET cell line TC-71
i. f. transplanted mouse. No tumour formation was visible in the region of the
right femur 22 days after transplantation. Forty-two days after transplantation the
PET/CT image showed a tumour surrounding the right femur. In this picture the
contrast is not as high as in the image taken of the VH-64 transplanted mouse but
there is still a lot of background and a very bright heart signal (Figure 6.3).

Chapter 6 – Development, establishment and validation of preclinical orthotopic mouse models for bone malignancies
189
Figure 6.4: PET/CT image of a PC3M i.f. transplanted mouse. A, Image taken after 21 days;
B, Image taken after 48 days with the tumour marked with a white arrow (MIP-CT image
overlaid with FDG-PET image, dorsal view).
The PET/CT image taken of the CaP cell line PC3M i. f. transplanted mouse did
not show tumour formation 21 days after transplantation. After 48 days the
PET/CT image showed tumour formation around the right femur. Again, the
contrast of the PET had to be very high to make the tumour visible. In this case
the kidneys gave a bright signal, which might be due to the excretion of the FDG
(Figure 6.4).

Chapter 6 – Development, establishment and validation of preclinical orthotopic mouse models for bone malignancies
190
6.3.2 Reduction of background signal in positron emission tomography
To be able to image potential metastasis to the lung the bright heart signal had to
be reduced. This is why, VH-64 and TC-71 cells were transplanted s. c to
produce tumours that were easy to locate and monitor.
Three mice each were anaesthetised with the inhalable anaesthetic Isoflorane and
with the injectable combination of Ketamine/Medetomidine (as described in
3.6.2). Thirty-three days after transplantation of VH-64 a palpable tumour had
formed on the right flank of all six experimental animals. S. c. TC-71 tumours
grew faster so that 5 out of 6 mice had to be culled before the planned FDG-PET
procedure. However, one remaining mouse with an s. c. TC-71 tumour was
imaged under Ketamine/Medetomidine anaesthesia and the tumour was visible
comparable to the VH-64 tumour shown in Figure 6.5.
As expected and seen before, the mice anaesthetised with Isoflorane showed a
bright signal of the heart muscle. In contrast to this, mice injected with
Ketamine/Medetomidine showed no signal of the heart muscle (see Figure 6.5).
This is why it can be assumed that possible lung metastases could be identified
easier when mice are anaesthetised with this injectable anaesthesia.

Chapter 6 – Development, establishment and validation of preclinical orthotopic mouse models for bone malignancies
191
Figure 6.5: PET/CT images comparing inhalable and injectable anaesthesia. A, Exemplary
mouse with s. c. VH-64 tumour anaesthetised with inhalable Isolflurane, picture showing
accumulation of FDG within the tumour but as well in the heart and bladder; B, Exemplary
mouse with s. c. VH-64 tumour anaesthetised with injectable Ketamin/Medetomidine. (each right
picture, MIP-CT; each left picture, section through the sagittal plane in the heart region).
However, due to a high noise to signal ratio of the PET images in the preliminary
experiment this technique was not used in the further development of the
orthotopic model for bone malignancies.

Chapter 6 – Development, establishment and validation of preclinical orthotopic mouse models for bone malignancies
192
6.3.3 Development of an orthotopic model for bone malignancies
Previous work has used i. v. transplantation to investigate the metastasis of
ES/PNET cell lines in vivo or i.t transplantations to achieve tumours in the bone.
To be able to study the direct interaction of different malignant cell types with
bone we developed a preclinical orthotopic model by injecting cells of different
tumour types directly into the femur of young NSG mice (see Table 6.1), a
method that is easily to perform even on young and not full-grown mice.
Table 6.1: Experimental mice for the development of an orthotopic model for bone
malignancies. VH-64 and TC-71, ES/PNET cell lines; SaOS-2, OS cell line; PC3M, CaP cell
line; Medium, mice were injected with medium alone.
Transplant Identification
of mice
Age at transplantation
(weeks, median, range)
Time to reach protocol
limits (d, median, range)
Tumour
formation
VH-64 F1921LN, F1921BN,
F4901RN, F4901BN,
F4901NN, F4968LN,
F4968N
12 (11-12) 38 (29-42) 100% (7/7)
TC-71 F1920RN, F4968BN,
F4968NN, F4965LN,
F4965RN, F4965BN
12 (11-12) 31 (15-42) 83.3% (5/6)
SaOS-2 F4967LN, F4967RN,
F4905LN, F5187LN,
F5187RN
12 (10-12) 70 (70-83) 100% (5/5)
PC3M F1927RN, F1927NN,
F4902LN, F4902RN,
F4902BN, F4902NN,
F4901LN
12 (12-13) 29 (29-31) 100% (7/7)
Medium F4965NN, F4970LN,
F4970RN, F4970BN,
F4970NN
11 (11-12) na 0% (0/5)
Mice were transplanted with a median age of 11 to 12 weeks. Transplanted
ES/PNET cell lines VH-64 and TC-71 developed tumours leading to euthanasia

Chapter 6 – Development, establishment and validation of preclinical orthotopic mouse models for bone malignancies
193
after 38 and 31 days, respectively. PC3M-transplanted mice had to be euthanized
after 29 days and SaOS-2-transplanted mice lived at mean 70 days. Except one
TC-71 transplanted mouse all experimental animals developed tumours at the site
of injection.
6.3.3.1 Induction of pathological new bone formation
CT images of the femurs injected with ES/PNET and OS cell lines showed
remodelling of the murine bone with induction of pathological new bone
formation. In all cases, the ES/PNET cell line VH-64 led to formation of
calcified structures, which were clearly visible in CT. In most cases these new
formations were manifested as sunray spicules, directly coming of the murine
femur (see Figure 6.6 A).

Chapter 6 – Development, establishment and validation of preclinical orthotopic mouse models for bone malignancies
194
Figure 6.6: Induction of new bone formation after VH-64 transplantation. A, Exemplary CT
image 42 days after transplantation (cross section of a femur, white arrow indicates sunray
spicules); B, Large periosteal reaction induced by the tumour and reactive bone (H&E staining,
original magnification 2x, arrows indicate the periosteum); C, Formation of cartilage in fibrous
bands (H&E staining, original magnification 10x); D, Spicules of new bone formation most
probably coming off the murine femur (H&E staining, original magnification 40x).
H&E stained histological sections of femurs injected with the ES/PNET cell line
VH-64 confirmed findings of the CT scans. Structures identified as sunray
spicules of immature bone arose directly from the murine femurs (Figure 6.6 A,
B, D) and led to progressively destroyed cortical bone. Furthermore, tumours
invaded the surrounding soft tissues. However, different from findings in patients
transplanted ES/PNET cells in this model seemed to induce formation of
cartilage as well.

Chapter 6 – Development, establishment and validation of preclinical orthotopic mouse models for bone malignancies
195
The ES/PNET cell line TC-71 showed a mixed pattern with CT pictures giving
evidence of both bone resorption as well as very weak induction of bone growth
(see Figure 6.7).
Figure 6.7: Lysis of bone and induction of new bone formation after TC-71 transplantation.
A, Exemplary CT image 15 days after transplantation (cross section of a femur, white arrow
indicates lysis of bone); B, Exemplary CT image 15 days after transplantation (longitudinal
section of a femur, white arrow indicates lysis of bone); C, Large periosteal reaction induced by
the tumour and reactive bone (H&E staining, original magnification 4x, arrows indicate the
location of the periosteum); D, Spicules of immature bone formation most probably coming off
the murine femur (H&E staining, original magnification 60x, arrows indicate flattened cells on
the bone surface).
Therein some areas of bone was resorbed and the cortical bone destroyed to a
great extent as seen in histology, whilst in others new and immature bone

Chapter 6 – Development, establishment and validation of preclinical orthotopic mouse models for bone malignancies
196
formation was induced with the periosteum lifted of the cortical bone like in VH-
64 transplanted mice (see Figure 6.7).
The fact that newly induced bone was not explicitly visible in CT suggests the
immaturity and thus poor calcification of bone. However, flattened cells were
visible on the surface of the reactive bone, which most probably are osteoclasts
induced through the presence of tumour cells (see Figure 6.7 D).
Murine femurs injected with the OS cell line SaOS-2 showed induction of new
bone formation in CT. In some cases lifting of the periosteum could be observed
in histological slides that resulted in formation of sub-periosteal new bone that
seemed to come of the murine cortical bone as it was the case in ES/PNET
transplanted mice (see Figure 6.8). However, the induction of reactive bone was
to a lesser extent than reactive bone formation as induced by VH-64 cells.

Chapter 6 – Development, establishment and validation of preclinical orthotopic mouse models for bone malignancies
197
Figure 6.8: Lysis of bone and induction of new bone formation after SaOS-2
transplantation. A, Exemplary CT image 77 days after transplantation (cross section of a femur,
white arrow indicates lysis of bone); B, Large periosteal reaction induced by the tumour and
reactive bone (H&E staining, original magnification 20x, arrows indicate the location of the
periosteum); C, Massive induction of reactive bone coming of the murine cortical bone of the
femur (H&E staining, original magnification 20x, arrow indicates reactive bone); D, Destruction
of the cortical bone by tumour cells growing through the existing bone (H&E staining, original
magnification 4x).
6.3.3.2 Malignant new bone formation
In addition to the induction of reactive bone, CT scans of femurs transplanted
with the OS cell line SaOS-2 showed formation of calcified structures within the
tumour mass itself. The destructive and permissive growth of the cells (see
Figure 6.9) had led to big tumour masses outside the femoral shaft as well and
the calcified structures within this tumour mass were not directly linked to the
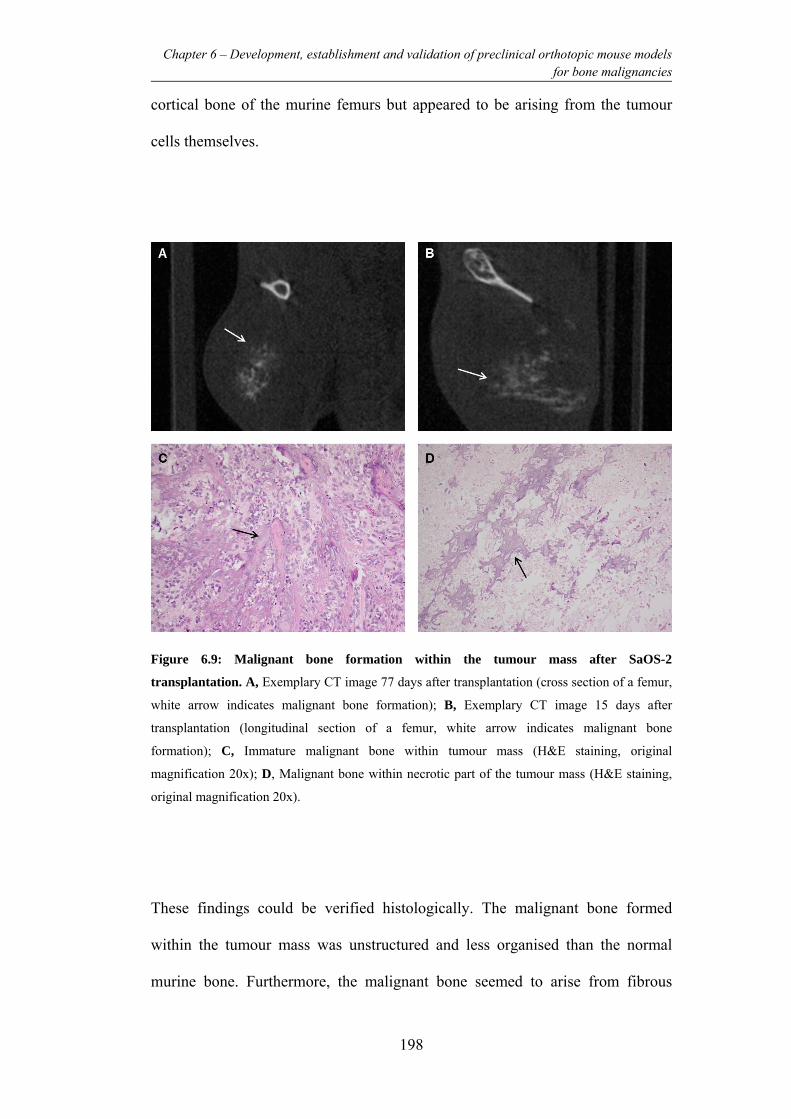
Chapter 6 – Development, establishment and validation of preclinical orthotopic mouse models for bone malignancies
198
cortical bone of the murine femurs but appeared to be arising from the tumour
cells themselves.
Figure 6.9: Malignant bone formation within the tumour mass after SaOS-2
transplantation. A, Exemplary CT image 77 days after transplantation (cross section of a femur,
white arrow indicates malignant bone formation); B, Exemplary CT image 15 days after
transplantation (longitudinal section of a femur, white arrow indicates malignant bone
formation); C, Immature malignant bone within tumour mass (H&E staining, original
magnification 20x); D, Malignant bone within necrotic part of the tumour mass (H&E staining,
original magnification 20x).
These findings could be verified histologically. The malignant bone formed
within the tumour mass was unstructured and less organised than the normal
murine bone. Furthermore, the malignant bone seemed to arise from fibrous

Chapter 6 – Development, establishment and validation of preclinical orthotopic mouse models for bone malignancies
199
structures within the tumour mass. In necrotic parts of the tumour malignant
bone remained as pointy sclerotic structures.
6.3.3.3 Induction of osteolytic lesions
As a comparison to the primary bone tumour cell lines the CaP cell line PC3M
was used to create a model for CaP in bone as its most common site of
metastasis. On CT images injected femurs showed mainly heavy signs of
resorption of bone leading to pathological fractures of the femur in two out of
seven injected mice (see Figure 6.10).

Chapter 6 – Development, establishment and validation of preclinical orthotopic mouse models for bone malignancies
200
Figure 6.10: Osteolytic lesion caused by injection of PC3M. A, Exemplary CT image 29 days
after transplantation (cross section of a femur, white arrow indicates lysis of the femur); B,
Exemplary CT image 29 days after transplantation (longitudinal section of a femur, white arrow
indicates lysis of the femur); C, Tumour mass destroying and dislocating femoral bone (H&E
staining, original magnification 10x, black arrow indicating gap in the cortex); D, lysis of the
bone with resorption pits of osteoclasts (upper black arrow) and osteoblastic reaction (lower
black arrow, H&E staining, original magnification 40x).
In histological H&E stained slides PC3M injected femurs showed a vigorous
resorption of bone material. The resorptive pits formed by active osteoclasts
could be visualised in histological sections. The outer shape of the femurs did not
appear as smooth as in controls but showed multiple sites of bone resorption (see
Figures 6.10 C and D). Furthermore, on the opposite site of the cortical bone,
osteoblastic formation of bone appeared as a compensational reaction. However,
this bone appeared less organised and mature.

Chapter 6 – Development, establishment and validation of preclinical orthotopic mouse models for bone malignancies
201
6.3.3.4 Documentation of soft tissue involvement using MRI
Where possible, tumour mass was documented by MR imaging immediately
before dissection. In all cases MRI was a useful technique to visualise and
investigate the tumour mass growing at the site of previous injection. It was
possible to calculate volumes of tumours by selecting the region of interest (ROI)
in sections that showed tumour mass (see Figure 6.11). In all investigated cases
(VH-64, PC3M and SaOS-2 transplanted mice) it was possible to measure the
ROI with results showing that the tumour volume had a nearly Gaussian
distribution.
Figure 6.11: MR imaging of VH-64 Ewing sarcoma of the injected femur showing a larger
extra-osseous tumour component. A, The region of interest (red circle) was measured in slices
that showed tumour and from these the volume of the tumour was calculated. Thickness of slices
was 2 mm; B, graphical distribution of region of interest volume showing a Gaussian distribution.

Chapter 6 – Development, establishment and validation of preclinical orthotopic mouse models for bone malignancies
202
MRI was also able to pick up metastases that were located in the liver of TC-71
and PC3M transplanted mice. Due to the small size of mice and the high
frequency of their respiration resulting images were of poor quality with the
given equipment. Thus, it was not possible to make reliable judgment about
metastases in the lungs in the given circumstances. Furthermore, due to
respiration abdominal metastases were also hard to judge. No metastases could
be documented for i. f. transplanted VH-64 and SaOS-2 in MRI.
Organs of representative mice of the experiment were analysed
immunohistochemically. TC-71 and PC3M i. f. transplanted mice showed liver
metastases and furthermore in a mouse transplanted with PC3M numerous very
small lung metastases could be observed in immunohistology. Therefore, tissue
slices were stained with huCD99 (staining process involved universal probe from
Menapath Kit, HPR polymer, and VectaStain ABC as well as counterstaining
with Harris’ hematoxylin; see 3.7.1) and examined microscopically. Cells of
metastases with human origin stained positively and thus could be distinguished
form the murine organ-tissue (Figure 6.12).

Chapter 6 – Development, establishment and validation of preclinical orthotopic mouse models for bone malignancies
203
Figure 6.12: Metastases identified in histology. A, Liver metastasis after i. f. transplantation of
ES cell line TC-71; B, Liver metastasis after i. f. transplantation of CaP cell line PC3M; C, Small
lung metastases after i. f. transplantation of CaP cell line PC3M (T, tumour; L, liver tissue; Lu,
lung tissue; all sections stained with huCD99).
Occasionally, it was possible to image metastases by MRI. However, due to the
distance between housing of the animals and the MRI facility it was not possible
to image all mice as these mice had to be euthanized as soon as they showed
signs of disease. Figure 6.13 displays an exemplary image of a metastasis
occurring in the liver of a PC3M-transplanted mouse.

Chapter 6 – Development, establishment and validation of preclinical orthotopic mouse models for bone malignancies
204
Figure 6.13: Series of three MRI images of the abdomen of a PC3M-transplanted mouse.
The white arrows indicates the tumour mass within the abdomen.
6.4 Discussion
The described findings show that all human cell lines tested were able to interact
with the murine bone microenvironment and to induce development of tumours.
While the ES cell lines induced reactive bone growth, the OS cell line was
additionally able to form malignant bone within the tumour mass itself. These
findings correlate to a great extent with the clinical situation of ES/PNET and OS
patients.
The CaP cell line PC3M formed tumours inducing lysis of the murine bone and
in two cases even caused pathological fractures. This correlates with the clinical
findings. However, most commonly osteoblastic lesions are observed in CaP
patients with metastatic disease. Nevertheless, pathological fractures are
frequently seen in CaP patients with osseous lesions as well (compare
introduction chapter 6). Until today, there are only very few preclinical models
that are able to mirror the osteoblastic features of bone metastases caused by

Chapter 6 – Development, establishment and validation of preclinical orthotopic mouse models for bone malignancies
205
CaP. In the majority of models in which CaP cells are transplanted directly into
the bone osteolysis is observed.
Mice transplanted with the ES/PNET cell lines VH-64 and TC-71 had to be
euthanized 38 and 31 days after transplantation, respectively. Mice transplanted
with the prostate cancer cell line PC3M reached protocol limits after 29 days.
However, the development of tumour sizes leading to euthanasia after SAOS-2
transplantation took 70 days which is significantly longer than development of
all other investigated tumour cell lines.
For a long time there has been the need for the development of orthotopic models
for bone malignancies. Currently, there are several orthotopic models available;
however, one of the advantages of an i. f. model is the relative accessibility of the
femur by simply bending the knee and accessing it through the distal end.
Compared to other systems such as transplantation of tumour cells into the ribs,
i. f. injection is a minimally invasive and a non-traumatic procedure, which
provides us with a reliable preclinical orthotopic model for bone malignancies. In
comparison to i. t. transplantation, transplantation into the bigger femur during
i. f. transplantation offers an easier approach. As the state of research suggests a
MSC to most likely be the cell of origin for ES/PNET (see chapter 1.1.7), it can
be assumed that the placement of tumour cells within the bone marrow cavity
would be appropriate and leave the ES/PNET cells in the orthotopic
environment.
New imaging techniques such as CT, PET and MRI can be of great help in
following the progression of disease in a preclinical model. Furthermore,
numbers of experimental animals can be cut down dramatically. In more detail,
CT proved to be a reliable tool for the investigation of bone reactions to

Chapter 6 – Development, establishment and validation of preclinical orthotopic mouse models for bone malignancies
206
transplanted cells while MRI was able to describe the soft tissue component of
the developed tumours. FDG-PET was not the technique of choice for this
project as the background signal was quite high so that the primary tumour was
difficult to define on the images. Furthermore, there was a high signal of the
heart muscle due to the routinely used Isoflorane. An experiment with s. c.
tumours induced through ES/PNET cell transplantation showed that by using the
injectable anaesthetics with Ketamine/Medetomidin avoids the strong
background signal from the heart. Therefore, this type of anaesthesia might be
the better choice for future PET studies. However, Ketamine/Medetomidin is not
as well-tolerated as inhalable anaesthesia with Isoflorane is (personal
experience).
PET was used in i. v. experiments performed before although it was here shown
not to be the technique of choice. This is due to the fact that the i. v. experiments
were performed in Münster, where PET was the only modern imaging
technology available at that time point. Even with input from clinically very
experienced radiologists metastases on PET images could only be detected when
analysing individual planes rather than looking at summation images. For the
experiments of the i. f. model, which was developed and investigated in
Newcastle, different PET equipment was used and thus results of PET imaging
performed here demonstrated that FDG-PET is not a very sensitive technique to
study local progression and systemic dissemination of ES/PNET in preclinical
models.
As by now, however, there are a lot of different radiolabelled compounds used as
tracers for tumour cells, which allow to study basically any biochemical process
of cellular function in vivo (Chatziioannou, 2002; Lewis et al., 2002). Thus,

Chapter 6 – Development, establishment and validation of preclinical orthotopic mouse models for bone malignancies
207
employing this orthotopic model of bone malignancies it will be possible to
investigate, if these components are more suitable for imaging of ES/PNET in
vivo. Succesfully tested tracers can than be employed in clinics and patients will
ultimately be able to benefit from this.
There are more in vivo imaging opportunities such as fluorescence and
bioluminescence imaging that can be used to visualise labelled cells in
preclinical models. Bioluminescence can visualise cells that are for example
transfected with plasmids encoding for appropriate genes such as luciferase. This
leads to light emission without the need of excitation when luciferin is injected.
This fact and the longer wavelength of the produced signal lead to better images
than images produced using cells labelled with eGFP. Currently, our group is in
the progress of developing preclinical models using bioluminescence to track
human tumour cells in vivo in the mice. This will provide further experimental
opportunities for this orthotopic model in the future.
6.5 Conclusions
The orthotopic model for bone malignancies offers a reliable and highly
reproducible tool for research on primary malignancies of the bone such as
ES/PNET and OS and other cancers that induce bone metastases. Further to the
development using different cell lines it will be necessary and interesting to
investigate the behaviour of primary material in this preclinical model.
The described i. f. model is established within the Northern Institute for Cancer
Research and will be used in further and on-going studies on pharmaceuticals for
therapy of ES/PNET. Furthermore, it offers a great opportunity for studying the

Chapter 6 – Development, establishment and validation of preclinical orthotopic mouse models for bone malignancies
208
interaction between tumour cells and their microenvironment in the bone and
thus for dissecting the biology of ES/PNET, OS as well of bone metastases
caused by other types of cancers. It will also give the possibility to further
investigate the effects of CXCR4-knockdown on ES/PNET cell lines as well as
the involvement of different genes and their products that were found to be
differentially expressed in different organ-specific metastases.

Chapter 7 – General Discussion
209
7. Chapter – General Discussion and Conclusions
The aim of this thesis has been to investigate different aspects of the mechanisms
of organ-specific metastasis in ES/PNET and whether it would be possible to
identify an organ-specific pattern of gene expression that would correlate with
organ-specific metastasis. Furthermore, a knockdown system was designed to
investigate the role of CXCR4 as a possible driver for metastasis in ES/PNET.
Finally, to be able to focus on the interaction of ES/PNET cells with their
orthotopic environment in the bm/bone, an i. f. mouse model was developed
using in vivo imaging.
7.1 General Discussion
Although in the past decades great progress has been made in our understanding
and the treatment of ES/PNET the knowledge of the basic mechanisms
underlying metastasis and tumour progression is still limited. Furthermore,
although treatment has changed immensely with the introduction of
chemotherapy and patients have better outcomes than ever, differences between
patients with localised and metastatic disease are still enormous. Patients with
metastases to the bones still have a particularly poor and unsatisfying outcome.
A first step to understanding the differences between patients with metastasis to
different organs has been undertaken. It was possible to identify differentially
expressed genes when comparing metastases from different organs in a
preclinical model of ES/PNET metastasis.

Chapter 7 – General Discussion
210
The initial hypothesis of the presence of subclones within tumour cell lines with
the ability of inducing organ-selective metastases could not be verified. After
re-transplantation tumour cells recovered from lungs or bone/bone marrow were
able to metastasise to other organs as well. However, (although no statistical
analysis could be performed due to the small number of experimental mice) it
appeared that re-transplanted clones derived from lungs of primary mice were
able to form metastases in secondary mice after a shorter period of time.
Furthermore, the results suggest that transplantation selected for an aggressive
type of cells as these were able to establish in different organs again after re-
transplantation. The function of some of the genes that could be identified in all
comparisons of gene expression lists of the parental cell line versus the different
metastases fit this hypothesis and may be responsible for the more aggressive
growth and increased proliferation in vivo. Future research will need to identify
the key drivers of this aggressive phenotype, particularly as the functions of
many of the genes on the list are unknown.
Genes that were noticeable in comparisons of microarrays of clones derived from
different organs directly against each other might mirror the influence of the
specific microenvironments on the cells that settled in these.
A further fact that has to be taken into account in this experiment is clonal
variation as every metastasis originates from one single cell that homed, settled
and subsequently developed a metastasis. This might also have influenced the set
of genes that is regarded as specific for the organ-specific metastases grouped
together and, therefore, the analysis needs to be extended to a higher number of
clones.

Chapter 7 – General Discussion
211
Most importantly, cell lines may not reflect tumour cell heterogeneity in primary
material. These cells have undergone selection in cell culture over a long period
of time and are expected to be less microenvironment-dependent as compared
with primary tumour cells. Thus, it would be of interest to underline and
strengthen these results with transplantation of primary material.
Attempts have been made to analyse specific gene patterns that would allow to
predict the course of disease and outcomes (prognostic biomarkers). Ohali et al.
suggest a gene pattern that might be able to give a classification of patients into
high- and low-risk subgroups and they have the identified overexpressed genes
from tumours with a poor prognosis that might be targets for the new cancer
therapies (Ohali et al., 2004).
Further work tried to describe molecular signatures that distinguish localised and
metastatic disease (Schaefer et al., 2008) or to identify marker genes which
reflect tumour resistance to chemotherapy using material from primary tumours
and metastases (Scotlandi et al., 2009).
However, to date there is a lack of research on the molecular programme that
drives the metastatic phenotype in ES/PNET and results in the different outcome
in patients with localised and metastatic disease.
Any hypotheses derived from the described xenograft mouse model will need to
be validated in primary patients. It would be especially interesting to analyse the
differences in gene expression in cells of different metastases from patients
directly. However, it is ethically difficult to obtain not only material from
primary tumours but also material from metastases as most patients are children
or adolescents and biopsing metastases would be purely for scientific reasons and
of no benefit for the patient. Material from metastases might be available after

Chapter 7 – General Discussion
212
treatment, if metastases have to be removed. However, cells of this material have
undergone at least chemotherapy and thus will have altered characteristics and
biology. This is why, it will remain a challenge to investigate why outcomes for
patients with pulmonary and bone metastases remains so poor.
As mentioned before, some cancer types such as breast and prostate cancer as
well as melanoma metastasise in a CXCL12/CXCR4-dependant manner. This
involves metastasis via the blood stream and subsequent homing to CXCL12 rich
tissues such as bone.
In previous research high expression of CXCR4 was correlated with a metastatic
behaviour and worse prognosis for ES/PNET patients, which might indicate a
role of the CXCL12/CXCR4 axis in the biology of ES/PNET cells. Due to this
evidence, investigations involving knockdown of this cytokine-receptor was
undertaken.
For the construction of a knockdown plasmid pEPI-EGFP was selected and
proved to be stable in ES/PNET cell lines without the need of a constant
selection pressure. It was possible to construct a knockdown plasmid against
CXCR4. But due to lack of time, it was not possible to investigate the
consequences of CXCR4 knockdown in this thesis.
If knockdown of CXCR4 in ES/PNET cell lines leads to a phenotype it would be
essential to validate these findings on primary material. Most ES/PNET cell lines
only show a weak expression of CXCR4 while it has been shown that primary
material expresses CXCR4. This lack of CXCR4 expression in cell lines might
result from the fact that cultivation of these for a long time might have left cells
altered in their expression of several surface markers and ES/PNET cell lines

Chapter 7 – General Discussion
213
have become less dependent on signals from their normal microenvironment
(here CXCL12). The role of CXCR4 expression as a prognostic biomarker that
predicts a metastatic phenotype would then need to be explored and confirmed in
a prospective clinical study.
Concluding, it could be demonstrated that the constructed vector pEPI-EGFP
with the pol III promoter H1 can be used in ES/PNET cells as a tool for
knockdown of different target genes as well. The pEPI-EGFP vector with the pol
II promoter H1 will be a useful tool to analyse candidate genes for ES/PNET
metastasis.
To be able to perform research focused on the interaction of ES/PNET cells in
the “natural” microenvironment an orthotopic model was developed by injecting
tumour cells directly into the easily assessable femur of mice. The significance
and great importance of orthotopic transplantation becomes obvious through the
proof that the whole process of metastasis is more efficient, closely mimics
human metastasis and metastases manifest in clinically relevant sites (Bibby,
2004).
The primary tumours developed in this orthotopic i. f. model for ES/PNET and
OS mirror to a great extent the clinical situation of primary bone tumours and
their interaction with the bone tissue in patients. CT images showed the influence
transplanted cells had on remodelling murine femur. In ES/PNET transplanted
mice bones reacted with formation of new bone material that appeared in form of
sunray spicules and lifting of the periosteum. In OS transplanted mice the
formation of reactive bone was visible as well. In addition to this malignant bone
formation within the tumour mass was visible. Further studies with improved

Chapter 7 – General Discussion
214
imaging techniques that visualise metastatic disease reliably will have to be
carried out to be able to also focus on metastatic progression in the experimental
mice.
The proposed model of i. f. transplantation in combination with NanoCT
imaging, MRI and histology promises to be a valuable and reliable tool for future
experiments on the interaction between tumour cells and the bone
microenvironment. It will be possible to directly investigate the influence of
tumour cells on the different cell types within this microenvironment. As the cell
of origin for ES/PNET is most probably a mesenchymal stem cell, a model
employing transplantation into the bone marrow cavity can be postulated to be
very likely orthotopic. However, this remains speculative as long as the cell of
orgin is open to debate. As ES/PNET metastasis is considered to be via
haematogenic spread and ES/PNET cells can be found in the bone marrow, this
model is likely to represent a model reflecting bone marrow and bone metastasis.
However, it has to be kept in mind that the “resolution” is very different with
5x10⁶ cells being transplanted where usually one cell turns malignant. And thus
interaction between injected tumour cells and the microenvironment has to be
understood as different in comparison to the interaction between a single
malignant cell of origin and its “natural” microenvironment (always bearing in
mind that there is also the difference between human and murine cells in the
microenvironment of the bone marrow). Further experiments should thus also be
carried out with down-scalled numbers of human ES/PNET cells transplanted
onto experimental mice.
Furthermore, studies on novel treatments will benefit from this model as it is
highly reproducible and easy to handle and could thus be used in addition to s. c.

Chapter 7 – General Discussion
215
models that are routinely used in drug development. Results of studies will have
high significance against the background of the employment of an orthotopic
model, particularly when using primary tumour cells that will be more
micronenvironment-dependent as compared with cell lines.
In conclusion, this model will provide an excellent tool for functional studies of
the metastatic phenotype using an RNAi approach; in particular to dissect the
role of CXCR4 and other candiate genes identified here through gene expression
studies.

Chapter 8 – Future Directions
216
7.2 Future Directions
Metastatic disease is the clinically most important adverse risk factor and
associated with a dismal outcome. Therefore, there is a great need of
understanding the biology of metastasis in ES/PNET. A mechanistic
understanding will be fundamental for the identification of new targets against
which drugs could be developed that are specifically active in metastatic disease.
One candidate mechanism that was studied in the thesis was CXCR4. CXCR4 is
expressed in a variety of cancer types and has been shown to play a role in
metastasis of these cancers. As CXCR4 is up-regulated by the EWS/FLI1 fusion
gene the key molecular event in ES/PNET and as CXCR4 is expressed on the
cell surface it is likely to play a role in migration and homing of ES/PNET cells.
A vector-based knockdown-system has been developed to study the role of
CXCR4 in vitro and in vivo. With this tool it will be possible to further
investigate the role of CXCR4 in migration, adhesion and invasion of ES/PNET
cells in vitro and on the metastatic phenotype in preclinical in vivo models.
CXCR4 might constitute a potential target for treatment and CXCR4 antagonists
that can disrupt CXCR4-mediated tumour cell adhesion to stromal cells and
sensitise cancer cells to chemotherapy are already in clinical development.
One key focus of this thesis has been a detailed investigation of the interactions
between human ES/PNET, OS and CaP cells and the murine bone and bone
marrow microenvironment in an orthotopic xenograft model. The human cancer
cells induce re-modelling of the murine bone in a fashion similar to that seen in
patients, including induction of reactive bone growth (spiculae fomation) and
osteolysis; and also formation of malignant bone within OS. Thus, this model
provides a good basis for future research in this field and will be a reliable tool

Chapter 8 – Future Directions
217
for investigations on the biology of these cancers as well as an addition to s. c.
models applied in investigations on new pharmaceuticals.
Beyond this, identification of the cell of origin still remains a goal that has to be
achieved. This is of specific interest as the knowledge about the cell of origin or
cells of origin for different types of ES/PNET will greatly influence our
understanding of the biology and thus the clinical behaviour of ES/PNET.

Chapter 9 – Bibliography
218
8. Chapter – Bibliography
Aggarwal, R., Ghobrial, I. M., and Roodman, G. D. (2006). Chemokines in
multiple myeloma. Exp. Hematol 34, 1289-1295.
Agliano, A., Martin-Padura, I., Mancuso, P., Marighetti, P., Rabascio, C.,
Pruneri, G., Shultz, L. D., and Bertolini, F. (2008). Human acute
leukemia cells injected in NOD/LtSz-scid/IL-2Rgamma null mice
generate a faster and more efficient disease compared to other NOD/scid-
related strains. Int. J. Cancer 123, 2222-2227.
Aiuti, A., Tavian, M., Cipponi, A., Ficara, F., Zappone, E., Hoxie, J., Peault, B.,
and Bordignon, C. (1999). Expression of CXCR4, the receptor for
stromal cell-derived factor-1 on fetal and adult human lympho-
hematopoietic progenitors. Eur. J. Immunol 29, 1823-1831.
Allinen, M., Beroukhim, R., Cai, L., Brennan, C., Lahti-Domenici, J., Huang, H.,
Porter, D., Hu, M., Chin, L., Richardson, A., et al. (2004). Molecular
characterization of the tumor microenvironment in breast cancer. Cancer
Cell 6, 17-32.
Armengol, G., Tarkkanen, M., Virolainen, M., Forus, A., Valle, J., Böhling, T.,
Asko-Seljavaara, S., Blomqvist, C., Elomaa, I., Karaharju, E., et al.
(1997). Recurrent gains of 1q, 8 and 12 in the Ewing family of tumours
by comparative genomic hybridization. Br. J. Cancer 75, 1403-1409.
Aryee, D. N. T., Niedan, S., Kauer, M., Schwentner, R., Bennani-Baiti, I. M.,
Ban, J., Muehlbacher, K., Kreppel, M., Walker, R. L., Meltzer, P., et al.
(2010). Hypoxia modulates EWS-FLI1 transcriptional signature and

Chapter 9 – Bibliography
219
enhances the malignant properties of Ewing’s sarcoma cells in vitro.
Cancer Res 70, 4015-4023.
Baer, M., Nilsen, T. W., Costigan, C., and Altman, S. (1990). Structure and
transcription of a human gene for H1 RNA, the RNA component of
human RNase P. Nucleic Acids Res 18, 97-103.
Bailly, R. A., Bosselut, R., Zucman, J., Cormier, F., Delattre, O., Roussel, M.,
Thomas, G., and Ghysdael, J. (1994). DNA-binding and transcriptional
activation properties of the EWS-FLI-1 fusion protein resulting from the
t(11;22) translocation in Ewing sarcoma. Mol. Cell. Biol 14, 3230-3241.
Batson, O. V. (1940). THE FUNCTION OF THE VERTEBRAL VEINS AND
THEIR ROLE IN THE SPREAD OF METASTASES. Ann. Surg 112,
138-149.
Baxter, A. G., and Cooke, A. (1993). Complement lytic activity has no role in the
pathogenesis of autoimmune diabetes in NOD mice. Diabetes 42, 1574-
1578.
Bendre, M. S., Margulies, A. G., Walser, B., Akel, N. S., Bhattacharrya, S.,
Skinner, R. A., Swain, F., Ramani, V., Mohammad, K. S., Wessner, L.
L., et al. (2005). Tumor-derived interleukin-8 stimulates osteolysis
independent of the receptor activator of nuclear factor-kappaB ligand
pathway. Cancer Res 65, 11001-11009.
Bennani-Baiti, I. M., Cooper, A., Lawlor, E. R., Kauer, M., Ban, J., Aryee, D. N.
T., and Kovar, H. (2010). Intercohort gene expression co-analysis reveals
chemokine receptors as prognostic indicators in Ewing’s sarcoma. Clin.
Cancer Res 16, 3769-3778.

Chapter 9 – Bibliography
220
Berghuis, D., Santos, S. J., Baelde, H. J., Taminiau, A. H., Maarten Egeler, R.,
Schilham, M. W., Hogendoorn, P. C., and Lankester, A. C. (2011). Pro-
inflammatory chemokine-chemokine receptor interactions within the
Ewing sarcoma microenvironment determine CD8(+) T-lymphocyte
infiltration and affect tumour progression. J. Pathol 223, 347-357.
Bernstein, E., Caudy, A. A., Hammond, S. M., and Hannon, G. J. (2001). Role
for a bidentate ribonuclease in the initiation step of RNA interference.
Nature 409, 363-366.
Bernstein, M., Kovar, H., Paulussen, M., Randall, R. L., Schuck, A., Teot, L. A.,
and Juergens, H. (2006). Ewing’s sarcoma family of tumors: current
management. Oncologist 11, 503-519.
Berrettoni, B. A., and Carter, J. R. (1986). Mechanisms of cancer metastasis to
bone. J Bone Joint Surg Am 68, 308-312.
Beyer Nardi, N., and da Silva Meirelles, L. (2008). Mesenchymal Stem Cells:
Isolation, In Vitro Expansion and Characterisation. In Stem Cells
(Springer).
Bianco, P., Robey, P. G., and Simmons, P. J. (2008). Mesenchymal stem cells:
revisiting history, concepts, and assays. Cell Stem Cell 2, 313-319.
Bibby, M. C. (2004). Orthotopic models of cancer for preclinical drug
evaluation: advantages and disadvantages. Eur. J. Cancer 40, 852-857.
Birchmeier, W., and Behrens, J. (1994). Cadherin expression in carcinomas: role
in the formation of cell junctions and the prevention of invasiveness.
Biochim. Biophys. Acta 1198, 11-26.

Chapter 9 – Bibliography
221
Bode, J., Kohwi, Y., Dickinson, L., Joh, T., Klehr, D., Mielke, C., and Kohwi-
Shigematsu, T. (1992). Biological significance of unwinding capability of
nuclear matrix-associating DNAs. Science 255, 195-197.
Bogenmann, E. (1996). A metastatic neuroblastoma model in SCID mice. Int. J.
Cancer 67, 379-385.
Bosma, G. C., Custer, R. P., and Bosma, M. J. (1983). A severe combined
immunodeficiency mutation in the mouse. Nature 301, 527-530.
Bosma, G. C., Fried, M., Custer, R. P., Carroll, A., Gibson, D. M., and Bosma,
M. J. (1988a). Evidence of functional lymphocytes in some (leaky) scid
mice. J. Exp. Med 167, 1016-1033.
Bosma, M., Schuler, W., and Bosma, G. (1988b). The scid mouse mutant. Curr.
Top. Microbiol. Immunol 137, 197-202.
Boyle, W. J., Simonet, W. S., and Lacey, D. L. (2003). Osteoclast differentiation
and activation. Nature 423, 337-342.
Breitling, R., Armengaud, P., Amtmann, A., and Herzyk, P. (2004). Rank
products: a simple, yet powerful, new method to detect differentially
regulated genes in replicated microarray experiments. FEBS Lett 573, 83-
92.
Browne, J., and de Pierro, A. B. (1996). A row-action alternative to the EM
algorithm for maximizing likelihood in emission tomography. IEEE
Trans Med Imaging 15, 687-699.
Brummelkamp, T. R., Bernards, R., and Agami, R. (2002). A system for stable
expression of short interfering RNAs in mammalian cells. Science 296,
550-553.

Chapter 9 – Bibliography
222
Burdach, S., Plehm, S., Unland, R., Dirksen, U., Borkhardt, A., Staege, M. S.,
Müller-Tidow, C., and Richter, G. H. S. (2009). Epigenetic maintenance
of stemness and malignancy in peripheral neuroectodermal tumors by
EZH2. Cell Cycle 8, 1991-1996.
Burgert, E. O., Nesbit, M. E., Garnsey, L. A., Gehan, E. A., Herrmann, J., Vietti,
T. J., Cangir, A., Tefft, M., Evans, R., and Thomas, P. (1990).
Multimodal therapy for the management of nonpelvic, localized Ewing’s
sarcoma of bone: intergroup study IESS-II. J. Clin. Oncol 8, 1514-1524.
Burns, J. M., Summers, B. C., Wang, Y., Melikian, A., Berahovich, R., Miao, Z.,
Penfold, M. E. T., Sunshine, M. J., Littman, D. R., Kuo, C. J., et al.
(2006). A novel chemokine receptor for SDF-1 and I-TAC involved in
cell survival, cell adhesion, and tumor development. J. Exp. Med 203,
2201-2213.
Burr, D. B. (2002). Targeted and nontargeted remodeling. Bone 30, 2-4.
Bussard, K. M., Gay, C. V., and Mastro, A. M. (2008). The bone
microenvironment in metastasis; what is special about bone? Cancer
Metastasis Rev 27, 41-55.
Cao, Y., Zhou, Z., de Crombrugghe, B., Nakashima, K., Guan, H., Duan, X., Jia,
S.-F., and Kleinerman, E. S. (2005). Osterix, a transcription factor for
osteoblast differentiation, mediates antitumor activity in murine
osteosarcoma. Cancer Res 65, 1124-1128.
Carthew, R. W., and Sontheimer, E. J. (2009). Origins and Mechanisms of
miRNAs and siRNAs. Cell 136, 642-655.
Castillero-Trejo, Y., Eliazer, S., Xiang, L., Richardson, J. A., and Ilaria, R. L.
(2005). Expression of the EWS/FLI-1 oncogene in murine primary bone-

Chapter 9 – Bibliography
223
derived cells Results in EWS/FLI-1-dependent, ewing sarcoma-like
tumors. Cancer Res 65, 8698-8705.
Cavazzana, A. O., Miser, J. S., Jefferson, J., and Triche, T. J. (1987).
Experimental evidence for a neural origin of Ewing’s sarcoma of bone.
Am. J. Pathol 127, 507-518.
Chaffer, C. L., and Weinberg, R. A. (2011). A perspective on cancer cell
metastasis. Science 331, 1559-1564.
Chambers, T. J., and Fuller, K. (1985). Bone cells predispose bone surfaces to
resorption by exposure of mineral to osteoclastic contact. J. Cell. Sci 76,
155-165.
Chansky, H. A., Barahmand-Pour, F., Mei, Q., Kahn-Farooqi, W., Zielinska-
Kwiatkowska, A., Blackburn, M., Chansky, K., Conrad, E. U., Bruckner,
J. D., Greenlee, T. K., et al. (2004). Targeting of EWS/FLI-1 by RNA
interference attenuates the tumor phenotype of Ewing’s sarcoma cells in
vitro. J. Orthop. Res 22, 910-917.
Chiao, J. W., Moonga, B. S., Yang, Y. M., Kancherla, R., Mittelman, A., Wu-
Wong, J. R., and Ahmed, T. (2000). Endothelin-1 from prostate cancer
cells is enhanced by bone contact which blocks osteoclastic bone
resorption. Br. J. Cancer 83, 360-365.
Chinni, S. R., Sivalogan, S., Dong, Z., Filho, J. C. T., Deng, X., Bonfil, R. D.,
and Cher, M. L. (2006). CXCL12/CXCR4 signaling activates Akt-1 and
MMP-9 expression in prostate cancer cells: the role of bone
microenvironment-associated CXCL12. Prostate 66, 32-48.
Chinni, S. R., Yamamoto, H., Dong, Z., Sabbota, A., Bonfil, R. D., and Cher, M.
L. (2008). CXCL12/CXCR4 transactivates HER2 in lipid rafts of prostate

Chapter 9 – Bibliography
224
cancer cells and promotes growth of metastatic deposits in bone. Mol.
Cancer Res 6, 446-457.
Chirgwin, J. M., and Guise, T. A. (2000). Molecular mechanisms of tumor-bone
interactions in osteolytic metastases. Crit. Rev. Eukaryot. Gene Expr 10,
159-178.
Christianson, S. W., Shultz, L. D., and Leiter, E. H. (1993). Adoptive transfer of
diabetes into immunodeficient NOD-scid/scid mice. Relative
contributions of CD4+ and CD8+ T-cells from diabetic versus prediabetic
NOD.NON-Thy-1a donors. Diabetes 42, 44-55.
Cironi, L., Riggi, N., Provero, P., Wolf, N., Suvà, M.-L., Suvà, D., Kindler, V.,
and Stamenkovic, I. (2008). IGF1 is a common target gene of Ewing’s
sarcoma fusion proteins in mesenchymal progenitor cells. PLoS ONE 3,
e2634.
Clark, E. A., Golub, T. R., Lander, E. S., and Hynes, R. O. (2000). Genomic
analysis of metastasis reveals an essential role for RhoC. Nature 406,
532-535.
Clarke, B. (2008). Normal bone anatomy and physiology. Clin J Am Soc
Nephrol 3 Suppl 3, S131-139.
Clines, G. A., Mohammad, K. S., Bao, Y., Stephens, O. W., Suva, L. J.,
Shaughnessy, J. D., Fox, J. W., Chirgwin, J. M., and Guise, T. A. (2007).
Dickkopf homolog 1 mediates endothelin-1-stimulated new bone
formation. Mol. Endocrinol 21, 486-498.
Coleman, R. E. (2001). Metastatic bone disease: clinical features,
pathophysiology and treatment strategies. Cancer Treat. Rev 27, 165-176.

Chapter 9 – Bibliography
225
Coleman, R. E. (2006). Clinical features of metastatic bone disease and risk of
skeletal morbidity. Clin. Cancer Res 12, 6243s-6249s.
Collins, A. T., and Maitland, N. J. (2006). Prostate cancer stem cells. Eur. J.
Cancer 42, 1213-1218.
Colter, D. C., Sekiya, I., and Prockop, D. J. (2001). Identification of a
subpopulation of rapidly self-renewing and multipotential adult stem cells
in colonies of human marrow stromal cells. Proc. Natl. Acad. Sci. U.S.A
98, 7841-7845.
Corey, E., Quinn, J. E., Bladou, F., Brown, L. G., Roudier, M. P., Brown, J. M.,
Buhler, K. R., and Vessella, R. L. (2002). Establishment and
characterization of osseous prostate cancer models: intra-tibial injection
of human prostate cancer cells. Prostate 52, 20-33.
Corral, D. A., Amling, M., Priemel, M., Loyer, E., Fuchs, S., Ducy, P., Baron,
R., and Karsenty, G. (1998). Dissociation between bone resorption and
bone formation in osteopenic transgenic mice. Proc. Natl. Acad. Sci.
U.S.A 95, 13835-13840.
Cotterill, S. J., Ahrens, S., Paulussen, M., Jürgens, H. F., Voûte, P. A., Gadner,
H., and Craft, A. W. (2000a). Prognostic factors in Ewing’s tumor of
bone: analysis of 975 patients from the European Intergroup Cooperative
Ewing’s Sarcoma Study Group. J. Clin. Oncol 18, 3108-3114.
Cotterill, S. J., Ahrens, S., Paulussen, M., Jürgens, H. F., Voûte, P. A., Gadner,
H., and Craft, A. W. (2000b). Prognostic factors in Ewing’s tumor of
bone: analysis of 975 patients from the European Intergroup Cooperative
Ewing’s Sarcoma Study Group. J. Clin. Oncol 18, 3108-3114.

Chapter 9 – Bibliography
226
Craft, A., Cotterill, S., Malcolm, A., Spooner, D., Grimer, R., Souhami, R.,
Imeson, J., and Lewis, I. (1998). Ifosfamide-containing chemotherapy in
Ewing’s sarcoma: The Second United Kingdom Children’s Cancer Study
Group and the Medical Research Council Ewing’s Tumor Study. J. Clin.
Oncol 16, 3628-3633.
Cullen, B. R. (2005). RNAi the natural way. Nat. Genet 37, 1163-1165.
Cullen, B. R. (2004). Transcription and processing of human microRNA
precursors. Mol. Cell 16, 861-865.
Custer, R. P., Bosma, G. C., and Bosma, M. J. (1985). Severe combined
immunodeficiency (SCID) in the mouse. Pathology, reconstitution,
neoplasms. Am. J. Pathol 120, 464-477.
Dahlin, D. C., and Coventry, M. B. (1967). Osteogenic sarcoma. A study of six
hundred cases. J Bone Joint Surg Am 49, 101-110.
Dalal, S., and Burchill, S. A. (2009). Preclinical evaluation of vascular-disrupting
agents in Ewing’s sarcoma family of tumours. Eur. J. Cancer 45, 713-
722.
Dass, C. R., Nadesapillai, A. P. W., Robin, D., Howard, M. L., Fisher, J. L.,
Zhou, H., and Choong, P. F. M. (2005). Downregulation of uPAR
confirms link in growth and metastasis of osteosarcoma. Clin. Exp.
Metastasis 22, 643-652.
Delattre, O., Zucman, J., Melot, T., Garau, X. S., Zucker, J. M., Lenoir, G. M.,
Ambros, P. F., Sheer, D., Turc-Carel, C., and Triche, T. J. (1994). The
Ewing family of tumors--a subgroup of small-round-cell tumors defined
by specific chimeric transcripts. N. Engl. J. Med 331, 294-299.

Chapter 9 – Bibliography
227
Delattre, O., Zucman, J., Plougastel, B., Desmaze, C., Melot, T., Peter, M.,
Kovar, H., Joubert, I., de Jong, P., and Rouleau, G. (1992). Gene fusion
with an ETS DNA-binding domain caused by chromosome translocation
in human tumours. Nature 359, 162-165.
Le Deley, M.-C., Delattre, O., Schaefer, K.-L., Burchill, S. A., Koehler, G.,
Hogendoorn, P. C. W., Lion, T., Poremba, C., Marandet, J., Ballet, S., et
al. (2010). Impact of EWS-ETS fusion type on disease progression in
Ewing’s sarcoma/peripheral primitive neuroectodermal tumor:
prospective results from the cooperative Euro-E.W.I.N.G. 99 trial. J. Clin.
Oncol 28, 1982-1988.
DeVita, V. T., and Schein, P. S. (1973). The use of drugs in combination for the
treatment of cancer: rationale and results. N. Engl. J. Med 288, 998-1006.
Diederichs, S., Bulk, E., Steffen, B., Ji, P., Tickenbrock, L., Lang, K., Zänker, K.
S., Metzger, R., Schneider, P. M., Gerke, V., et al. (2004). S100 family
members and trypsinogens are predictors of distant metastasis and
survival in early-stage non-small cell lung cancer. Cancer Res 64, 5564-
5569.
Dirksen, U., and Jürgens, H. (2010). Approaching Ewing sarcoma. Future Oncol
6, 1155-1162.
Dong, Z., Bonfil, R. D., Chinni, S., Deng, X., Trindade Filho, J. C., Bernardo,
M., Vaishampayan, U., Che, M., Sloane, B. F., Sheng, S., et al. (2005).
Matrix metalloproteinase activity and osteoclasts in experimental prostate
cancer bone metastasis tissue. Am. J. Pathol 166, 1173-1186.

Chapter 9 – Bibliography
228
Dontu, G., Al-Hajj, M., Abdallah, W. M., Clarke, M. F., and Wicha, M. S.
(2003). Stem cells in normal breast development and breast cancer. Cell
Prolif 36 Suppl 1, 59-72.
van Doorninck, J. A., Ji, L., Schaub, B., Shimada, H., Wing, M. R., Krailo, M.
D., Lessnick, S. L., Marina, N., Triche, T. J., Sposto, R., et al. (2010).
Current treatment protocols have eliminated the prognostic advantage of
type 1 fusions in Ewing sarcoma: a report from the Children’s Oncology
Group. J. Clin. Oncol 28, 1989-1994.
Du, Y.-F., Shi, Y., Xing, Y.-F., Xing, Y.-fei, Zeng, F.-Q., and Zeng, F.-qing
(2008). Establishment of CXCR4-small interfering RNA retrovirus vector
driven by human prostate-specific antigen promoter and its biological
effects on prostate cancer in vitro and in vivo. J. Cancer Res. Clin. Oncol
134, 1255-1264.
Eisen, M. B., and Brown, P. O. (1999). DNA arrays for analysis of gene
expression. Meth. Enzymol 303, 179-205.
Elbashir, S. M., Lendeckel, W., and Tuschl, T. (2001). RNA interference is
mediated by 21- and 22-nucleotide RNAs. Genes Dev 15, 188-200.
Endo, Y., Beauchamp, E., Woods, D., Taylor, W. G., Toretsky, J. A., Uren, A.,
and Rubin, J. S. (2008). Wnt-3a and Dickkopf-1 stimulate neurite
outgrowth in Ewing tumor cells via a Frizzled3- and c-Jun N-terminal
kinase-dependent mechanism. Mol. Cell. Biol 28, 2368-2379.
Estrada-Aguilar, J., Greenberg, H., Walling, A., Schroer, K., Black, T., Morse,
S., and Hvizdala, E. (1992). Primary treatment of pelvic osteosarcoma.
Report of five cases. Cancer 69, 1137-1145.

Chapter 9 – Bibliography
229
Everts, V., Delaissé, J. M., Korper, W., Jansen, D. C., Tigchelaar-Gutter, W.,
Saftig, P., and Beertsen, W. (2002). The bone lining cell: its role in
cleaning Howship’s lacunae and initiating bone formation. J. Bone
Miner. Res 17, 77-90.
Ewing, J. (1939). A review of the classification of bone tumors. Surg Gynecol
Obstet 68, 971–976.
Ewing, J. (1921). Diffuse endothelioma of bone. Proc NY Pathol Soc 21, 17-24.
Ewing, J. (1924). Further report of endothelial myeloma of bone. Proc NY Patho
l Soc 24, 93–100.
Fidler, I. J., and Kripke, M. L. (1977). Metastasis results from preexisting variant
cells within a malignant tumor. Science 197, 893-895.
Fire, A., Xu, S., Montgomery, M. K., Kostas, S. A., Driver, S. E., and Mello, C.
C. (1998). Potent and specific genetic interference by double-stranded
RNA in Caenorhabditis elegans. Nature 391, 806-811.
Flanagan, S. P. (1966). “Nude”, a new hairless gene with pleiotropic effects in
the mouse. Genet. Res 8, 295-309.
de Fougerolles, A., Vornlocher, H.-P., Maraganore, J., and Lieberman, J. (2007).
Interfering with disease: a progress report on siRNA-based therapeutics.
Nat Rev Drug Discov 6, 443-453.
Franks, T. M., and Lykke-Andersen, J. (2008). The control of mRNA decapping
and P-body formation. Mol. Cell 32, 605-615.
Franzius, C., Hotfilder, M., Poremba, C., Hermann, S., Schäfers, K., Gabbert, H.
E., Jürgens, H., Schober, O., Schäfers, M., and Vormoor, J. (2006).
Successful high-resolution animal positron emission tomography of

Chapter 9 – Bibliography
230
human Ewing tumours and their metastases in a murine xenograft model.
Eur. J. Nucl. Med. Mol. Imaging 33, 1432-1441.
Fraumeni, J. F., and Glass, A. G. (1970). Rarity of Ewing’s sarcoma among U.S.
Negro children. Lancet 1, 366-367.
Frei, E., Karon, M., Levin, R. H., Freireich, E. J., Taylor, R. J., Hananian, J.,
Selawry, O., Holland, J. F., Hoogstraten, B., Wolman, I. J., et al. (1965).
The effectiveness of combinations of antileukemic agents in inducing and
maintaining remission in children with acute leukemia. Blood 26, 642-
656.
Fulop, G. M., and Phillips, R. A. (1990). The scid mutation in mice causes a
general defect in DNA repair. Nature 347, 479-482.
Furusato, B., Mohamed, A., Uhlén, M., and Rhim, J. S. (2010). CXCR4 and
cancer. Pathol. Int 60, 497-505.
Gainford, M. C., Dranitsaris, G., and Clemons, M. (2005). Systemic treatment of
bone metastases from breast cancer: is it all that it’s cracked up to be? J.
Clin. Oncol 23, 4802-4803.
Gellhorn, A., and Hirschberg, E. (1955). Investigation of diverse systems for
cancer chemotherapy screening. Cancer Res 15, 1-125.
Geminder, H., Sagi-Assif, O., Goldberg, L., Meshel, T., Rechavi, G., Witz, I. P.,
and Ben-Baruch, A. (2001). A possible role for CXCR4 and its ligand,
the CXC chemokine stromal cell-derived factor-1, in the development of
bone marrow metastases in neuroblastoma. J. Immunol 167, 4747-4757.
Gentleman, R. C., Carey, V. J., Bates, D. M., Bolstad, B., Dettling, M., Dudoit,
S., Ellis, B., Gautier, L., Ge, Y., Gentry, J., et al. (2004). Bioconductor:

Chapter 9 – Bibliography
231
open software development for computational biology and
bioinformatics. Genome Biol 5, R80.
Geran, R. I., Greenberg, N. H., Macdonald, M. M., Schumacher, A. M., and
Abbott, B. J. (1972). Protocols for screening chemical agents and natural
productsagainst animal tumours and other biological systems. Cancer
Chemother Rep Part 3 3.
Gladson, C. L., and Welch, D. R. (2008). New insights into the role of CXCR4 in
prostate cancer metastasis. Cancer Biol. Ther 7, 1849-1851.
Glinskii, O. V., Huxley, V. H., Glinsky, G. V., Pienta, K. J., Raz, A., and
Glinsky, V. V. (2005). Mechanical entrapment is insufficient and
intercellular adhesion is essential for metastatic cell arrest in distant
organs. Neoplasia 7, 522-527.
Goldstein, A. S., Huang, J., Guo, C., Garraway, I. P., and Witte, O. N. (2010).
Identification of a cell of origin for human prostate cancer. Science 329,
568-571.
Goltzman, D. (2001). Osteolysis and cancer. J. Clin. Invest 107, 1219-1220.
Goltzman, D., Karaplis, A. C., Kremer, R., and Rabbani, S. A. (2000). Molecular
basis of the spectrum of skeletal complications of neoplasia. Cancer 88,
2903-2908.
Grier, H. E., Krailo, M. D., Tarbell, N. J., Link, M. P., Fryer, C. J. H., Pritchard,
D. J., Gebhardt, M. C., Dickman, P. S., Perlman, E. J., Meyers, P. A., et
al. (2003). Addition of ifosfamide and etoposide to standard
chemotherapy for Ewing’s sarcoma and primitive neuroectodermal tumor
of bone. N. Engl. J. Med 348, 694-701.

Chapter 9 – Bibliography
232
Guan, H., Zhou, Z., Wang, H., Jia, S.-F., Liu, W., and Kleinerman, E. S. (2005).
A small interfering RNA targeting vascular endothelial growth factor
inhibits Ewing’s sarcoma growth in a xenograft mouse model. Clin.
Cancer Res 11, 2662-2669.
Guise, T. A., and Chirgwin, J. M. (2003). Transforming growth factor-beta in
osteolytic breast cancer bone metastases. Clin. Orthop. Relat. Res, S32-
38.
Guise, T. A., Mohammad, K. S., Clines, G., Stebbins, E. G., Wong, D. H.,
Higgins, L. S., Vessella, R., Corey, E., Padalecki, S., Suva, L., et al.
(2006). Basic mechanisms responsible for osteolytic and osteoblastic
bone metastases. Clin. Cancer Res 12, 6213s-6216s.
Hahm (1999). Repression of the gene encoding the TGF-beta type II receptor is a
major target of the EWS-FLI1 oncoprotein. Nat. Genet 23, 481.
Hallen, L. C., Burki, Y., Ebeling, M., Broger, C., Siegrist, F., Oroszlan-Szovik,
K., Bohrmann, B., Certa, U., and Foser, S. (2007). Antiproliferative
activity of the human IFN-alpha-inducible protein IFI44. J. Interferon
Cytokine Res 27, 675-680.
Hamacher, K., Coenen, H. H., and Stöcklin, G. (1986). Efficient stereospecific
synthesis of no-carrier-added 2-[18F]-fluoro-2-deoxy-D-glucose using
aminopolyether supported nucleophilic substitution. J. Nucl. Med 27,
235-238.
Hancock, J. D., and Lessnick, S. L. (2008). A transcriptional profiling meta-
analysis reveals a core EWS-FLI gene expression signature. Cell Cycle 7,
250-256.

Chapter 9 – Bibliography
233
Harada, S.-ichi, and Rodan, G. A. (2003). Control of osteoblast function and
regulation of bone mass. Nature 423, 349-355.
Harris, S. E., Harris, M. A., Mahy, P., Wozney, J., Feng, J. Q., and Mundy, G. R.
(1994). Expression of bone morphogenetic protein messenger RNAs by
normal rat and human prostate and prostate cancer cells. Prostate 24, 204-
211.
Hart, I. R., and Fidler, I. J. (1980). Role of organ selectivity in the determination
of metastatic patterns of B16 melanoma. Cancer Res 40, 2281-2287.
Hattinger, C. M., Pötschger, U., Tarkkanen, M., Squire, J., Zielenska, M., Kiuru-
Kuhlefelt, S., Kager, L., Thorner, P., Knuutila, S., Niggli, F. K., et al.
(2002). Prognostic impact of chromosomal aberrations in Ewing tumours.
Br. J. Cancer 86, 1763-1769.
Hauben, E. I., and Hogendoorn, P. C. W. (2010). Epidemiology of Primary Bone
Tumors and Economical Aspects of Bone Metastases. In Bone Cancer:
Progression and Therapeutic Approaches (London, UK: Academic Press),
pp. 3-8.
Hayakawa, J., Hsieh, M. M., Uchida, N., Phang, O., and Tisdale, J. F. (2009).
Busulfan produces efficient human cell engraftment in NOD/LtSz-Scid
IL2Rgamma(null) mice. Stem Cells 27, 175-182.
Hellberg, C., Schmees, C., Karlsson, S., Ahgren, A., and Heldin, C.-H. (2009).
Activation of protein kinase C alpha is necessary for sorting the PDGF
beta-receptor to Rab4a-dependent recycling. Mol. Biol. Cell 20, 2856-
2863.
van Hennik, P. B., de Koning, A. E., and Ploemacher, R. E. (1999). Seeding
efficiency of primitive human hematopoietic cells in nonobese

Chapter 9 – Bibliography
234
diabetic/severe combined immune deficiency mice: implications for stem
cell frequency assessment. Blood 94, 3055-3061.
Hense, H. W., Ahrens, S., Paulussen, M., Lehnert, M., and Jürgens, H. (1999).
Deskriptive Epidemiologie der Ewing-Tumoren�: Analysen der
deutschen Patienten von (EI)CESS 1980-1997. Klinische Pädiatrie 211, 360-
380.
Herrero-Martín, D., Osuna, D., Ordóñez, J. L., Sevillano, V., Martins, A. S.,
Mackintosh, C., Campos, M., Madoz-Gúrpide, J., Otero-Motta, A. P.,
Caballero, G., et al. (2009). Stable interference of EWS-FLI1 in an Ewing
sarcoma cell line impairs IGF-1/IGF-1R signalling and reveals TOPK as
a new target. Br. J. Cancer 101, 80-90.
Hildebrand (1890). Über das tubuläre Angiosarkom oder Endotheliom des
Knochens. Dtsch Z Chir. 31, 261-281.
Horwood, N. J., Elliott, J., Martin, T. J., and Gillespie, M. T. (1998). Osteotropic
agents regulate the expression of osteoclast differentiation factor and
osteoprotegerin in osteoblastic stromal cells. Endocrinology 139, 4743-
4746.
Hotfilder, M., Lanvers, C., Jürgens, H., Boos, J., and Vormoor, J. (2002). c-KIT-
expressing Ewing tumour cells are insensitive to imatinib mesylate
(STI571). Cancer Chemother. Pharmacol 50, 167-169.
Hudson, W. A., Li, Q., Le, C., and Kersey, J. H. (1998). Xenotransplantation of
human lymphoid malignancies is optimized in mice with multiple
immunologic defects. Leukemia 12, 2029-2033.
Hu-Lieskovan, S., Heidel, J. D., Bartlett, D. W., Davis, M. E., and Triche, T. J.
(2005a). Sequence-specific knockdown of EWS-FLI1 by targeted,

Chapter 9 – Bibliography
235
nonviral delivery of small interfering RNA inhibits tumor growth in a
murine model of metastatic Ewing’s sarcoma. Cancer Res 65, 8984-8992.
Hu-Lieskovan, S., Zhang, J., Wu, L., Shimada, H., Schofield, D. E., and Triche,
T. J. (2005b). EWS-FLI1 fusion protein up-regulates critical genes in
neural crest development and is responsible for the observed phenotype
of Ewing’s family of tumors. Cancer Res 65, 4633-4644.
Hynes, R. O. (2003). Metastatic potential: generic predisposition of the primary
tumor or rare, metastatic variants-or both? Cell 113, 821-823.
International Human Genome Sequencing Consortium (2004). Finishing the
euchromatic sequence of the human genome. Nature 431, 931-945.
Ishikawa, T., Kamiyama, M., Tani-Ishii, N., Suzuki, H., Ichikawa, Y.,
Hamaguchi, Y., Momiyama, N., and Shimada, H. (2001). Inhibition of
osteoclast differentiation and bone resorption by cathepsin K antisense
oligonucleotides. Mol. Carcinog 32, 84-91.
Janknecht, R. (2005). EWS-ETS oncoproteins: the linchpins of Ewing tumors.
Gene 363, 1-14.
Janowski, M. (2009). Functional diversity of SDF-1 splicing variants. Cell Adh
Migr 3, 243-249.
Jeon, I. S., Davis, J. N., Braun, B. S., Sublett, J. E., Roussel, M. F., Denny, C. T.,
and Shapiro, D. N. (1995). A variant Ewing’s sarcoma translocation
(7;22) fuses the EWS gene to the ETS gene ETV1. Oncogene 10, 1229-
1234.
Jia, S. F., Worth, L. L., and Kleinerman, E. S. (1999). A nude mouse model of
human osteosarcoma lung metastases for evaluating new therapeutic
strategies. Clin. Exp. Metastasis 17, 501-506.

Chapter 9 – Bibliography
236
Jia, S.-F., Duan, X., Worth, L. L., Guan, H., and Kleinerman, E. S. (2006).
Intratumor murine interleukin-12 gene therapy suppressed the growth of
local and distant Ewing’s sarcoma. Cancer Gene Ther 13, 948-957.
Jiang, D., Guo, H., Xu, C., Chang, J., Gu, B., Wang, L., Block, T. M., and Guo,
J.-T. (2008). Identification of three interferon-inducible cellular enzymes
that inhibit the replication of hepatitis C virus. J. Virol 82, 1665-1678.
Jiang, D., Weidner, J. M., Qing, M., Pan, X.-B., Guo, H., Xu, C., Zhang, X.,
Birk, A., Chang, J., Shi, P.-Y., et al. (2010). Identification of five
interferon-induced cellular proteins that inhibit west nile virus and
dengue virus infections. J. Virol 84, 8332-8341.
Jiang, Y., Jahagirdar, B. N., Reinhardt, R. L., Schwartz, R. E., Keene, C. D.,
Ortiz-Gonzalez, X. R., Reyes, M., Lenvik, T., Lund, T., Blackstad, M., et
al. (2002). Pluripotency of mesenchymal stem cells derived from adult
marrow. Nature 418, 41-49.
Jürgens, H., Paulussen, M., and Zoubek, A. (2006). Ewing-Tumoren. In
Pädiatrische Hämatologie und Onkologie (Berlin, Germany: Springer),
pp. 894-910.
Jung, Y., Wang, J., Schneider, A., Sun, Y.-X., Koh-Paige, A. J., Osman, N. I.,
McCauley, L. K., and Taichman, R. S. (2006). Regulation of SDF-1
(CXCL12) production by osteoblasts; a possible mechanism for stem cell
homing. Bone 38, 497-508.
Kaneko, Y., Yoshida, K., Handa, M., Toyoda, Y., Nishihira, H., Tanaka, Y.,
Sasaki, Y., Ishida, S., Higashino, F., and Fujinaga, K. (1996). Fusion of
an ETS-family gene, EIAF, to EWS by t(17;22)(q12;q12) chromosome

Chapter 9 – Bibliography
237
translocation in an undifferentiated sarcoma of infancy. Genes
Chromosomes Cancer 15, 115-121.
Kang, Y., Siegel, P. M., Shu, W., Drobnjak, M., Kakonen, S. M., Cordón-Cardo,
C., Guise, T. A., and Massagué, J. (2003). A multigenic program
mediating breast cancer metastasis to bone. Cancer Cell 3, 537-549.
Katagiri, T., Yamaguchi, A., Komaki, M., Abe, E., Takahashi, N., Ikeda, T.,
Rosen, V., Wozney, J. M., Fujisawa-Sehara, A., and Suda, T. (1994).
Bone morphogenetic protein-2 converts the differentiation pathway of
C2C12 myoblasts into the osteoblast lineage. J. Cell Biol 127, 1755-
1766.
Kataoka, S., Satoh, J., Fujiya, H., Toyota, T., Suzuki, R., Itoh, K., and Kumagai,
K. (1983). Immunologic aspects of the nonobese diabetic (NOD) mouse.
Abnormalities of cellular immunity. Diabetes 32, 247-253.
Kauer, M., Ban, J., Kofler, R., Walker, B., Davis, S., Meltzer, P., and Kovar, H.
(2009). A molecular function map of Ewing’s sarcoma. PLoS ONE 4,
e5415.
Kaushik, A., Kelsoe, G., and Jaton, J. C. (1995). The nude mutation results in
impaired primary antibody repertoire. Eur. J. Immunol 25, 631-634.
Kawamata, T., and Tomari, Y. (2010). Making RISC. Trends Biochem. Sci 35,
368-376.
Kawamata, T., Seitz, H., and Tomari, Y. (2009). Structural determinants of
miRNAs for RISC loading and slicer-independent unwinding. Nat. Struct.
Mol. Biol 16, 953-960.

Chapter 9 – Bibliography
238
Khurana, J. S., and Safadi, P. J. (2009). Bone Structure, Development and Bone
Biology. In Essentials in Bone and Soft-Tissue Pathology (New York:
Springer), pp. 1-16.
Khvorova, A., Reynolds, A., and Jayasena, S. D. (2003). Functional siRNAs and
miRNAs exhibit strand bias. Cell 115, 209-216.
Klein, K. A., Reiter, R. E., Redula, J., Moradi, H., Zhu, X. L., Brothman, A. R.,
Lamb, D. J., Marcelli, M., Belldegrun, A., Witte, O. N., et al. (1997).
Progression of metastatic human prostate cancer to androgen
independence in immunodeficient SCID mice. Nat. Med 3, 402-408.
Kong, Y. Y., Feige, U., Sarosi, I., Bolon, B., Tafuri, A., Morony, S., Capparelli,
C., Li, J., Elliott, R., McCabe, S., et al. (1999). Activated T cells regulate
bone loss and joint destruction in adjuvant arthritis through
osteoprotegerin ligand. Nature 402, 304-309.
Kotz, R., Dominkus, M., Zettl, T., Ritschl, P., Windhager, R., Gadner, H.,
Zielinski, C., and Salzer-Kuntschik, M. (2002). Advances in bone tumour
treatment in 30 years with respect to survival and limb salvage. A single
institution experience. Int Orthop 26, 197-202.
Krishnan, V., Bryant, H. U., and Macdougald, O. A. (2006). Regulation of bone
mass by Wnt signaling. J. Clin. Invest 116, 1202-1209.
Kucia, M., Reca, R., Miekus, K., Wanzeck, J., Wojakowski, W., Janowska-
Wieczorek, A., Ratajczak, J., and Ratajczak, M. Z. (2005). Trafficking of
normal stem cells and metastasis of cancer stem cells involve similar
mechanisms: pivotal role of the SDF-1-CXCR4 axis. Stem Cells 23, 879-
894.

Chapter 9 – Bibliography
239
Kuntz, S., Kieffer, E., Bianchetti, L., Lamoureux, N., Fuhrmann, G., and Viville,
S. (2008). Tex19, a mammalian-specific protein with a restricted
expression in pluripotent stem cells and germ line. Stem Cells 26, 734-
744.
Kurreck, J. (2009). RNA interference: from basic research to therapeutic
applications. Angew. Chem. Int. Ed. Engl 48, 1378-1398.
Ladenstein, R., Pötschger, U., Le Deley, M. C., Whelan, J., Paulussen, M.,
Oberlin, O., van den Berg, H., Dirksen, U., Hjorth, L., Michon, J., et al.
(2010). Primary disseminated multifocal Ewing sarcoma: results of the
Euro-EWING 99 trial. J. Clin. Oncol 28, 3284-3291.
Lambert, G., Bertrand, J. R., Fattal, E., Subra, F., Pinto-Alphandary, H., Malvy,
C., Auclair, C., and Couvreur, P. (2000). EWS fli-1 antisense
nanocapsules inhibits ewing sarcoma-related tumor in mice. Biochem.
Biophys. Res. Commun 279, 401-406.
Lapidot, T., Sirard, C., Vormoor, J., Murdoch, B., Hoang, T., Caceres-Cortes, J.,
Minden, M., Paterson, B., Caligiuri, M. A., and Dick, J. E. (1994). A cell
initiating human acute myeloid leukaemia after transplantation into SCID
mice. Nature 367, 645-648.
Leavey, P. J., Mascarenhas, L., Marina, N., Chen, Z., Krailo, M., Miser, J.,
Brown, K., Tarbell, N., Bernstein, M. L., Granowetter, L., et al. (2008).
Prognostic factors for patients with Ewing sarcoma (EWS) at first
recurrence following multi-modality therapy: A report from the
Children’s Oncology Group. Pediatr Blood Cancer 51, 334-338.
Lee, R. L., Westendorf, J., and Gold, M. R. (2007). Differential role of reactive
oxygen species in the activation of mitogen-activated protein kinases and

Chapter 9 – Bibliography
240
Akt by key receptors on B-lymphocytes: CD40, the B cell antigen
receptor, and CXCR4. J Cell Commun Signal 1, 33-43.
Lee, Y., Ahn, C., Han, J., Choi, H., Kim, J., Yim, J., Lee, J., Provost, P.,
Rådmark, O., Kim, S., et al. (2003). The nuclear RNase III Drosha
initiates microRNA processing. Nature 425, 415-419.
Lee, Y., Jeon, K., Lee, J.-T., Kim, S., and Kim, V. N. (2002). MicroRNA
maturation: stepwise processing and subcellular localization. EMBO J 21,
4663-4670.
Leppä, S., Saarto, T., Vehmanen, L., Blomqvist, C., and Elomaa, I. (2004). A
high serum matrix metalloproteinase-2 level is associated with an adverse
prognosis in node-positive breast carcinoma. Clin. Cancer Res 10, 1057-
1063.
Lessnick, S. L., Braun, B. S., Denny, C. T., and May, W. A. (1995). Multiple
domains mediate transformation by the Ewing’s sarcoma EWS/FLI-1
fusion gene. Oncogene 10, 423-431.
Lessnick, S. L., Dacwag, C. S., and Golub, T. R. (2002). The Ewing’s sarcoma
oncoprotein EWS/FLI induces a p53-dependent growth arrest in primary
human fibroblasts. Cancer Cell 1, 393-401.
Li, F. P., Tu, J. T., Liu, F. S., and Shiang, E. L. (1980). Rarity of Ewing’s
sarcoma in China. Lancet 1, 1255.
Lieber, M. R., Hesse, J. E., Lewis, S., Bosma, G. C., Rosenberg, N., Mizuuchi,
K., Bosma, M. J., and Gellert, M. (1988). The defect in murine severe
combined immune deficiency: joining of signal sequences but not coding
segments in V(D)J recombination. Cell 55, 7-16.

Chapter 9 – Bibliography
241
Lin, P. P., Wang, Y., and Lozano, G. (2011). Mesenchymal Stem Cells and the
Origin of Ewing’s Sarcoma. Sarcoma 2011.
Link, M. P., Goorin, A. M., Horowitz, M., Meyer, W. H., Belasco, J., Baker, A.,
Ayala, A., and Shuster, J. (1991). Adjuvant chemotherapy of high-grade
osteosarcoma of the extremity. Updated results of the Multi-Institutional
Osteosarcoma Study. Clin. Orthop. Relat. Res, 8-14.
Liu, B. Y., Guo, J., Lanske, B., Divieti, P., Kronenberg, H. M., and Bringhurst,
F. R. (1998). Conditionally immortalized murine bone marrow stromal
cells mediate parathyroid hormone-dependent osteoclastogenesis in vitro.
Endocrinology 139, 1952-1964.
Liu, J., Carmell, M. A., Rivas, F. V., Marsden, C. G., Thomson, J. M., Song, J.-
J., Hammond, S. M., Joshua-Tor, L., and Hannon, G. J. (2004).
Argonaute2 is the catalytic engine of mammalian RNAi. Science 305,
1437-1441.
Lokeshwar, B. L., Selzer, M. G., Block, N. L., and Gunja-Smith, Z. (1993).
Secretion of matrix metalloproteinases and their inhibitors (tissue
inhibitor of metalloproteinases) by human prostate in explant cultures:
reduced tissue inhibitor of metalloproteinase secretion by malignant
tissues. Cancer Res 53, 4493-4498.
Lu, D.-Y., Tang, C.-H., Yeh, W.-L., Wong, K.-L., Lin, C.-P., Chen, Y.-H., Lai,
C.-H., Chen, Y.-F., Leung, Y.-M., and Fu, W.-M. (2009). SDF-1alpha
up-regulates interleukin-6 through CXCR4, PI3K/Akt, ERK, and NF-
kappaB-dependent pathway in microglia. Eur. J. Pharmacol 613, 146-
154.

Chapter 9 – Bibliography
242
Lücke, A. (1866). Beiträge zur Geschwulstlehre: III. Lympho-sarcom der
Achseldrüse: embolische Geschwülste der Lungen; allgemeine Leukämie.
Tod. Virchows Arch 35, 524-539.
Lynch, C. C., Hikosaka, A., Acuff, H. B., Martin, M. D., Kawai, N., Singh, R.
K., Vargo-Gogola, T. C., Begtrup, J. L., Peterson, T. E., Fingleton, B., et
al. (2005). MMP-7 promotes prostate cancer-induced osteolysis via the
solubilization of RANKL. Cancer Cell 7, 485-496.
Manara, M. C., Baldini, N., Serra, M., Lollini, P. L., De Giovanni, C., Vaccari,
M., Argnani, A., Benini, S., Maurici, D., Picci, P., et al. (2000). Reversal
of malignant phenotype in human osteosarcoma cells transduced with the
alkaline phosphatase gene. Bone 26, 215-220.
Mani, S. A., Guo, W., Liao, M.-J., Eaton, E. N., Ayyanan, A., Zhou, A. Y.,
Brooks, M., Reinhard, F., Zhang, C. C., Shipitsin, M., et al. (2008). The
epithelial-mesenchymal transition generates cells with properties of stem
cells. Cell 133, 704-715.
Mao, X., Miesfeldt, S., Yang, H., Leiden, J. M., and Thompson, C. B. (1994).
The FLI-1 and chimeric EWS-FLI-1 oncoproteins display similar DNA
binding specificities. J. Biol. Chem 269, 18216-18222.
Marie, P. J., Debiais, F., and Haÿ, E. (2002). Regulation of human cranial
osteoblast phenotype by FGF-2, FGFR-2 and BMP-2 signaling. Histol.
Histopathol 17, 877-885.
Matsuo, K., and Irie, N. (2008). Osteoclast-osteoblast communication. Arch.
Biochem. Biophys 473, 201-209.
May, W. A., Gishizky, M. L., Lessnick, S. L., Lunsford, L. B., Lewis, B. C.,
Delattre, O., Zucman, J., Thomas, G., and Denny, C. T. (1993a). Ewing

Chapter 9 – Bibliography
243
sarcoma 11;22 translocation produces a chimeric transcription factor that
requires the DNA-binding domain encoded by FLI1 for transformation.
Proc. Natl. Acad. Sci. U.S.A 90, 5752-5756.
May, W. A., Lessnick, S. L., Braun, B. S., Klemsz, M., Lewis, B. C., Lunsford,
L. B., Hromas, R., and Denny, C. T. (1993b). The Ewing’s sarcoma
EWS/FLI-1 fusion gene encodes a more potent transcriptional activator
and is a more powerful transforming gene than FLI-1. Mol. Cell. Biol 13,
7393-7398.
Mazurier, F., Doedens, M., Gan, O. I., and Dick, J. E. (2003). Rapid
myeloerythroid repopulation after intrafemoral transplantation of NOD-
SCID mice reveals a new class of human stem cells. Nat. Med 9, 959-
963.
McGrath, K. E., Koniski, A. D., Maltby, K. M., McGann, J. K., and Palis, J.
(1999). Embryonic expression and function of the chemokine SDF-1 and
its receptor, CXCR4. Dev. Biol 213, 442-456.
McPherson, J. D., Marra, M., Hillier, L., Waterston, R. H., Chinwalla, A.,
Wallis, J., Sekhon, M., Wylie, K., Mardis, E. R., Wilson, R. K., et al.
(2001). A physical map of the human genome. Nature 409, 934-941.
Miyagawa, Y., Okita, H., Nakaijima, H., Horiuchi, Y., Sato, B., Taguchi, T.,
Toyoda, M., Katagiri, Y. U., Fujimoto, J., Hata, J.-I., et al. (2008).
Inducible expression of chimeric EWS/ETS proteins confers Ewing’s
family tumor-like phenotypes to human mesenchymal progenitor cells.
Mol. Cell. Biol 28, 2125-2137.
Mocellin, S., and Rossi, C. R. (2007). The principles of gene microarray data
analysis. In Microarray Technology and Cancer Gene Profiling.

Chapter 9 – Bibliography
244
Advances in Experimental Medicine and Biology. (Austin, USA: Landes
Bioscience), pp. 19-30.
Möhle, R., Moore, M. A., Nachman, R. L., and Rafii, S. (1997). Transendothelial
migration of CD34+ and mature hematopoietic cells: an in vitro study
using a human bone marrow endothelial cell line. Blood 89, 72-80.
Morel, A.-P., Lièvre, M., Thomas, C., Hinkal, G., Ansieau, S., and Puisieux, A.
(2008). Generation of breast cancer stem cells through epithelial-
mesenchymal transition. PLoS ONE 3, e2888.
Müller, A., Homey, B., Soto, H., Ge, N., Catron, D., Buchanan, M. E.,
McClanahan, T., Murphy, E., Yuan, W., Wagner, S. N., et al. (2001).
Involvement of chemokine receptors in breast cancer metastasis. Nature
410, 50-56.
Mundy, G. R. (2002). Metastasis to bone: causes, consequences and therapeutic
opportunities. Nat. Rev. Cancer 2, 584-593.
Nagasawa, T., Hirota, S., Tachibana, K., Takakura, N., Nishikawa, S., Kitamura,
Y., Yoshida, N., Kikutani, H., and Kishimoto, T. (1996). Defects of B-
cell lymphopoiesis and bone-marrow myelopoiesis in mice lacking the
CXC chemokine PBSF/SDF-1. Nature 382, 635-638.
Nagle, R. B., Knox, J. D., Wolf, C., Bowden, G. T., and Cress, A. E. (1994).
Adhesion molecules, extracellular matrix, and proteases in prostate
carcinoma. J. Cell. Biochem. Suppl 19, 232-237.
Nagpal, M. L., Davis, J., and Lin, T. (2006). Overexpression of CXCL10 in
human prostate LNCaP cells activates its receptor (CXCR3) expression
and inhibits cell proliferation. Biochim. Biophys. Acta 1762, 811-818.

Chapter 9 – Bibliography
245
Nakamura, E. S., Koizumi, K., Kobayashi, M., Saitoh, Y., Arita, Y., Nakayama,
T., Sakurai, H., Yoshie, O., and Saiki, I. (2006). RANKL-induced
CCL22/macrophage-derived chemokine produced from osteoclasts
potentially promotes the bone metastasis of lung cancer expressing its
receptor CCR4. Clin. Exp. Metastasis 23, 9-18.
Nannuru, K. C., and Singh, R. K. (2010). Tumor-stromal interactions in bone
metastasis. Curr Osteoporos Rep 8, 105-113.
Navarro, D., Agra, N., Pestaña, A., Alonso, J., and González-Sancho, J. M.
(2010). The EWS/FLI1 oncogenic protein inhibits expression of the Wnt
inhibitor DICKKOPF-1 gene and antagonizes beta-catenin/TCF-mediated
transcription. Carcinogenesis 31, 394-401.
Nesbit, M. E., Gehan, E. A., Burgert, E. O., Vietti, T. J., Cangir, A., Tefft, M.,
Evans, R., Thomas, P., Askin, F. B., and Kissane, J. M. (1990).
Multimodal therapy for the management of primary, nonmetastatic
Ewing’s sarcoma of bone: a long-term follow-up of the First Intergroup
study. J. Clin. Oncol 8, 1664-1674.
Nguyen, P., Bar-Sela, G., Sun, L., Bisht, K. S., Cui, H., Kohn, E., Feinberg, A.
P., and Gius, D. (2008). BAT3 and SET1A form a complex with
CTCFL/BORIS to modulate H3K4 histone dimethylation and gene
expression. Mol. Cell. Biol 28, 6720-6729.
Nonoyama, S., Smith, F. O., Bernstein, I. D., and Ochs, H. D. (1993). Strain-
dependent leakiness of mice with severe combined immune deficiency. J.
Immunol 150, 3817-3824.
Nurieva, R. I., Zheng, S., Jin, W., Chung, Y., Zhang, Y., Martinez, G. J.,
Reynolds, J. M., Wang, S.-L., Lin, X., Sun, S.-C., et al. (2010). The E3

Chapter 9 – Bibliography
246
ubiquitin ligase GRAIL regulates T cell tolerance and regulatory T cell
function by mediating T cell receptor-CD3 degradation. Immunity 32,
670-680.
Odri, G. A., Dumoucel, S., Picarda, G., Battaglia, S., Lamoureux, F., Corradini,
N., Rousseau, J., Tirode, F., Laud, K., Delattre, O., et al. (2010).
Zoledronic acid as a new adjuvant therapeutic strategy for Ewing’s
sarcoma patients. Cancer Res 70, 7610-7619.
Oefelein, M. G., Ricchiuti, V., Conrad, W., and Resnick, M. I. (2002). Skeletal
fractures negatively correlate with overall survival in men with prostate
cancer. J. Urol 168, 1005-1007.
Oettel, H., and Wilhelm, G. (1955). Tests of compounds against Ehrlich ascites
tumor, sarcoma 180 and Walker carcino-sarcoma 256. Cancer Res Suppl.
2, 129-144.
Ohali, A., Avigad, S., Zaizov, R., Ophir, R., Horn-Saban, S., Cohen, I. J., Meller,
I., Kollender, Y., Issakov, J., and Yaniv, I. (2004). Prediction of high risk
Ewing’s sarcoma by gene expression profiling. Oncogene 23, 8997-9006.
Olsen, B. R., Reginato, A. M., and Wang, W. (2000). Bone development. Annu.
Rev. Cell Dev. Biol 16, 191-220.
Paddison, P. J., Caudy, A. A., Bernstein, E., Hannon, G. J., and Conklin, D. S.
(2002). Short hairpin RNAs (shRNAs) induce sequence-specific silencing
in mammalian cells. Genes Dev 16, 948-958.
Paget, S. (1889). The distribution of secondary growths in cancer of the breast.
Lancet 133, 571-573.
Palmqvist, P., Persson, E., Conaway, H. H., and Lerner, U. H. (2002). IL-6,
leukemia inhibitory factor, and oncostatin M stimulate bone resorption

Chapter 9 – Bibliography
247
and regulate the expression of receptor activator of NF-kappa B ligand,
osteoprotegerin, and receptor activator of NF-kappa B in mouse
calvariae. J. Immunol 169, 3353-3362.
Pantelouris, E. M. (1968). Absence of thymus in a mouse mutant. Nature 217,
370-371.
Parfitt, A. M. (2001). The bone remodeling compartment: a circulatory function
for bone lining cells. J. Bone Miner. Res 16, 1583-1585.
Paulussen, M., Ahrens, S., Burdach, S., Craft, A., Dockhorn-Dworniczak, B.,
Dunst, J., Fröhlich, B., Winkelmann, W., Zoubek, A., and Jürgens, H.
(1998a). Primary metastatic (stage IV) Ewing tumor: survival analysis of
171 patients from the EICESS studies. European Intergroup Cooperative
Ewing Sarcoma Studies. Ann. Oncol 9, 275-281.
Paulussen, M., Ahrens, S., Craft, A. W., Dunst, J., Fröhlich, B., Jabar, S., Rübe,
C., Winkelmann, W., Wissing, S., Zoubek, A., et al. (1998b). Ewing’s
tumors with primary lung metastases: survival analysis of 114 (European
Intergroup) Cooperative Ewing’s Sarcoma Studies patients. J. Clin. Oncol
16, 3044-3052.
Paulussen, M., Ahrens, S., Dunst, J., Winkelmann, W., Exner, G. U., Kotz, R.,
Amann, G., Dockhorn-Dworniczak, B., Harms, D., Müller-Weihrich, S.,
et al. (2001). Localized Ewing tumor of bone: final results of the
cooperative Ewing’s Sarcoma Study CESS 86. J. Clin. Oncol 19, 1818-
1829.
Paulussen, M., Craft, A. W., Lewis, I., Hackshaw, A., Douglas, C., Dunst, J.,
Schuck, A., Winkelmann, W., Köhler, G., Poremba, C., et al. (2008).
Results of the EICESS-92 Study: two randomized trials of Ewing’s
Chapter 9 – Bibliography
248
sarcoma treatment--cyclophosphamide compared with ifosfamide in
standard-risk patients and assessment of benefit of etoposide added to
standard treatment in high-risk patients. J. Clin. Oncol 26, 4385-4393.
Paulussen, M., Ranft, A., Dirksen, U., and Jürgens, H. (2007). Ewing tumours:
Outcome in children, adolescents and adult patients. European Journal of
Cancer Supplements 5, 209-215.
Peter, M., Couturier, J., Pacquement, H., Michon, J., Thomas, G., Magdelenat,
H., and Delattre, O. (1997). A new member of the ETS family fused to
EWS in Ewing tumors. Oncogene 14, 1159-1164.
Phillips, R. A., Jewett, M. A., and Gallie, B. L. (1989). Growth of human tumors
in immune-deficient scid mice and nude mice. Curr. Top. Microbiol.
Immunol 152, 259-263.
Piechaczek, C., Fetzer, C., Baiker, A., Bode, J., and Lipps, H. J. (1999). A vector
based on the SV40 origin of replication and chromosomal S/MARs
replicates episomally in CHO cells. Nucleic Acids Res 27, 426-428.
Pieper, S., Ranft, A., Braun-Munzinger, G., Jurgens, H., Paulussen, M., and
Dirksen, U. (2008). Ewing’s tumors over the age of 40: a retrospective
analysis of 47 patients treated according to the International Clinical
Trials EICESS 92 and EURO-E.W.I.N.G. 99. Onkologie 31, 657-663.
Pittenger, M. F., Mackay, A. M., Beck, S. C., Jaiswal, R. K., Douglas, R.,
Mosca, J. D., Moorman, M. A., Simonetti, D. W., Craig, S., and Marshak,
D. R. (1999). Multilineage potential of adult human mesenchymal stem
cells. Science 284, 143-147.

Chapter 9 – Bibliography
249
Plougastel, B., Zucman, J., Peter, M., Thomas, G., and Delattre, O. (1993).
Genomic structure of the EWS gene and its relationship to EWSR1, a site
of tumor-associated chromosome translocation. Genomics 18, 609-615.
Ponomaryov, T., Peled, A., Petit, I., Taichman, R. S., Habler, L., Sandbank, J.,
Arenzana-Seisdedos, F., Magerus, A., Caruz, A., Fujii, N., et al. (2000).
Induction of the chemokine stromal-derived factor-1 following DNA
damage improves human stem cell function. J. Clin. Invest 106, 1331-
1339.
Price, J. S., Oyajobi, B. O., and Russell, R. G. (1994). The cell biology of bone
growth. Eur J Clin Nutr 48 Suppl 1, S131-149.
Prieur, A., Tirode, F., Cohen, P., and Delattre, O. (2004). EWS/FLI-1 silencing
and gene profiling of Ewing cells reveal downstream oncogenic pathways
and a crucial role for repression of insulin-like growth factor binding
protein 3. Mol. Cell. Biol 24, 7275-7283.
Pringle, J. A. S. (1999). Bone-forming neoplasms arisingwithin bone. In
Pathology of bone and joint neoplasms. (Philadelphia: Saunders).
Rajarubendra, N., and Lawrentschuk, N. (2010). Imaging of Bone Cancer. In
Bone Cancer: Progression and Therapeutic Approaches (London, UK:
Academic Press), pp. 269-282.
Reid, S. H., and Hamdy, F. C. (2007). Epidemiology, Pathology, and
Pathogenesis. In Urological Oncology (New York: Springer), pp. 451-
469.
Renaud, S., Loukinov, D., Alberti, L., Vostrov, A., Kwon, Y.-W., Bosman, F. T.,
Lobanenkov, V., and Benhattar, J. (2010). BORIS/CTCFL-mediated

Chapter 9 – Bibliography
250
transcriptional regulation of the hTERT telomerase gene in testicular and
ovarian tumor cells. Nucleic Acids Res.
Riggi, N., Cironi, L., Provero, P., Suvà, M.-L., Kaloulis, K., Garcia-Echeverria,
C., Hoffmann, F., Trumpp, A., and Stamenkovic, I. (2005). Development
of Ewing’s sarcoma from primary bone marrow-derived mesenchymal
progenitor cells. Cancer Res 65, 11459-11468.
Riggi, N., Suvà, M.-L., Suvà, D., Cironi, L., Provero, P., Tercier, S., Joseph, J.-
M., Stehle, J.-C., Baumer, K., Kindler, V., et al. (2008). EWS-FLI-1
expression triggers a Ewing’s sarcoma initiation program in primary
human mesenchymal stem cells. Cancer Res 68, 2176-2185.
Riggi, N., Suvà, M.-L., De Vito, C., Provero, P., Stehle, J.-C., Baumer, K.,
Cironi, L., Janiszewska, M., Petricevic, T., Suvà, D., et al. (2010). EWS-
FLI-1 modulates miRNA145 and SOX2 expression to initiate
mesenchymal stem cell reprogramming toward Ewing sarcoma cancer
stem cells. Genes Dev 24, 916-932.
Roberts, P., Burchill, S. A., Brownhill, S., Cullinane, C. J., Johnston, C.,
Griffiths, M. J., McMullan, D. J., Bown, N. P., Morris, S. P., and Lewis,
I. J. (2008). Ploidy and karyotype complexity are powerful prognostic
indicators in the Ewing’s sarcoma family of tumors: a study by the
United Kingdom Cancer Cytogenetics and the Children’s Cancer and
Leukaemia Group. Genes Chromosomes Cancer 47, 207-220.
Rodriguez-Galindo, C., Spunt, S. L., and Pappo, A. S. (2003). Treatment of
Ewing sarcoma family of tumors: current status and outlook for the
future. Med. Pediatr. Oncol 40, 276-287.

Chapter 9 – Bibliography
251
Roessner, A., and Jürgens, H. (1993). Round cell tumours of bone. Pathol. Res.
Pract 189, 111-136.
Roodman, G. D. (2004). Mechanisms of bone metastasis. N. Engl. J. Med 350,
1655-1664.
Ross, F. P., and Teitelbaum, S. L. (2005). alphavbeta3 and macrophage colony-
stimulating factor: partners in osteoclast biology. Immunol. Rev 208, 88-
105.
Rygaard, J., and Povlsen, C. O. (1969). Heterotransplantation of a human
malignant tumour to “Nude” mice. Acta Pathol Microbiol Scand 77, 758-
760.
Saad, S., Bendall, L. J., James, A., Gottlieb, D. J., and Bradstock, K. F. (2000).
Induction of matrix metalloproteinases MMP-1 and MMP-2 by co-culture
of breast cancer cells and bone marrow fibroblasts. Breast Cancer Res.
Treat 63, 105-115.
Saeter, G., Alvegård, T. A., Elomaa, I., Wiebe, T., Björk, O., Strander, H., and
Solheim, O. P. (1997). Chemotherapy for osteosarcoma and Ewing’s
sarcoma. Acta Orthop Scand Suppl 273, 120-125.
Safadi, F. F., Barbe, M. F., Abdelmagid, S. M., Rico, M. C., Aswad, R. A.,
Litvin, J., and Popoff, S. N. (2009). Bone Structure, Development and
Bone Biology. In Bone Pathology (New York: Springer), pp. 1-50.
Salcedo, R., Wasserman, K., Young, H. A., Grimm, M. C., Howard, O. M.,
Anver, M. R., Kleinman, H. K., Murphy, W. J., and Oppenheim, J. J.
(1999). Vascular endothelial growth factor and basic fibroblast growth
factor induce expression of CXCR4 on human endothelial cells: In vivo

Chapter 9 – Bibliography
252
neovascularization induced by stromal-derived factor-1alpha. Am. J.
Pathol 154, 1125-1135.
Sancéau, J., Poupon, M.-F., Delattre, O., Sastre-Garau, X., and Wietzerbin, J.
(2002). Strong inhibition of Ewing tumor xenograft growth by
combination of human interferon-alpha or interferon-beta with
ifosfamide. Oncogene 21, 7700-7709.
Schaefer, K.-L., Eisenacher, M., Braun, Y., Brachwitz, K., Wai, D. H., Dirksen,
U., Lanvers-Kaminsky, C., Juergens, H., Herrero, D., Stegmaier, S., et al.
(2008). Microarray analysis of Ewing’s sarcoma family of tumours
reveals characteristic gene expression signatures associated with
metastasis and resistance to chemotherapy. Eur. J. Cancer 44, 699-709.
Schleiermacher, G., Peter, M., Oberlin, O., Philip, T., Rubie, H., Mechinaud, F.,
Sommelet-Olive, D., Landman-Parker, J., Bours, D., Michon, J., et al.
(2003). Increased risk of systemic relapses associated with bone marrow
micrometastasis and circulating tumor cells in localized ewing tumor. J.
Clin. Oncol 21, 85-91.
Schmid, C., Schläpfer, I., Futo, E., Waldvogel, M., Schwander, J., Zapf, J., and
Froesch, E. R. (1992). Triiodothyronine (T3) stimulates insulin-like
growth factor (IGF)-1 and IGF binding protein (IGFBP)-2 production by
rat osteoblasts in vitro. Acta Endocrinol 126, 467-473.
Schmidt, D., Herrmann, C., Jürgens, H., and Harms, D. (1991). Malignant
peripheral neuroectodermal tumor and its necessary distinction from
Ewing’s sarcoma. A report from the Kiel Pediatric Tumor Registry.
Cancer 68, 2251-2259.
Chapter 9 – Bibliography
253
Schneider, A., Kalikin, L. M., Mattos, A. C., Keller, E. T., Allen, M. J., Pienta,
K. J., and McCauley, L. K. (2005). Bone turnover mediates preferential
localization of prostate cancer in the skeleton. Endocrinology 146, 1727-
1736.
Schuck, A., Ahrens, S., Paulussen, M., Kuhlen, M., Könemann, S., Rübe, C.,
Winkelmann, W., Kotz, R., Dunst, J., Willich, N., et al. (2003). Local
therapy in localized Ewing tumors: results of 1058 patients treated in the
CESS 81, CESS 86, and EICESS 92 trials. Int. J. Radiat. Oncol. Biol.
Phys 55, 168-177.
Schwarz, B. A., and Bhandoola, A. (2006). Trafficking from the bone marrow to
the thymus: a prerequisite for thymopoiesis. Immunol. Rev 209, 47-57.
Schwarz, D. S., Hutvágner, G., Du, T., Xu, Z., Aronin, N., and Zamore, P. D.
(2003). Asymmetry in the assembly of the RNAi enzyme complex. Cell
115, 199-208.
Scotlandi, K., Benini, S., Manara, M. C., Serra, M., Nanni, P., Lollini, P. L.,
Nicoletti, G., Landuzzi, L., Chano, T., Picci, P., et al. (2000). Murine
model for skeletal metastases of Ewing’s sarcoma. J. Orthop. Res 18,
959-966.
Scotlandi, K., Benini, S., Nanni, P., Lollini, P. L., Nicoletti, G., Landuzzi, L.,
Serra, M., Manara, M. C., Picci, P., and Baldini, N. (1998). Blockage of
insulin-like growth factor-I receptor inhibits the growth of Ewing’s
sarcoma in athymic mice. Cancer Res 58, 4127-4131.
Scotlandi, K., Avnet, S., Benini, S., Manara, M. C., Serra, M., Cerisano, V.,
Perdichizzi, S., Lollini, P.-L., De Giovanni, C., Landuzzi, L., et al.
(2002). Expression of an IGF-I receptor dominant negative mutant

Chapter 9 – Bibliography
254
induces apoptosis, inhibits tumorigenesis and enhances chemosensitivity
in Ewing’s sarcoma cells. Int. J. Cancer 101, 11-16.
Scotlandi, K., Remondini, D., Castellani, G., Manara, M. C., Nardi, F., Cantiani,
L., Francesconi, M., Mercuri, M., Caccuri, A. M., Serra, M., et al. (2009).
Overcoming resistance to conventional drugs in Ewing sarcoma and
identification of molecular predictors of outcome. J. Clin. Oncol 27,
2209-2216.
Scotton, C. J., Wilson, J. L., Milliken, D., Stamp, G., and Balkwill, F. R. (2001).
Epithelial cancer cell migration: a role for chemokine receptors? Cancer
Res 61, 4961-4965.
Sela, J., Amir, D., Schwartz, Z., and Weinberg, H. (1987). Ultrastructural tissue
morphometry of the distribution of extracellular matrix vesicles in
remodeling rat tibial bone six days after injury. Acta Anat (Basel) 128,
295-300.
Serreze, D. V., and Leiter, E. H. (1988). Defective activation of T suppressor cell
function in nonobese diabetic mice. Potential relation to cytokine
deficiencies. J. Immunol 140, 3801-3807.
Serreze, D. V., Gaskins, H. R., and Leiter, E. H. (1993). Defects in the
differentiation and function of antigen presenting cells in NOD/Lt mice.
J. Immunol 150, 2534-2543.
Shultz, L. D., Schweitzer, P. A., Christianson, S. W., Gott, B., Schweitzer, I. B.,
Tennent, B., McKenna, S., Mobraaten, L., Rajan, T. V., and Greiner, D.
L. (1995). Multiple defects in innate and adaptive immunologic function
in NOD/LtSz-scid mice. J. Immunol 154, 180-191.

Chapter 9 – Bibliography
255
Shultz, L. D., Banuelos, S. J., Leif, J., Appel, M. C., Cunningham, M., Ballen,
K., Burzenski, L., and Greiner, D. L. (2003). Regulation of human short-
term repopulating cell (STRC) engraftment in NOD/SCID mice by host
CD122+ cells. Exp. Hematol 31, 551-558.
Shultz, L. D., Lyons, B. L., Burzenski, L. M., Gott, B., Chen, X., Chaleff, S.,
Kotb, M., Gillies, S. D., King, M., Mangada, J., et al. (2005). Human
lymphoid and myeloid cell development in NOD/LtSz-scid IL2R gamma
null mice engrafted with mobilized human hemopoietic stem cells. J.
Immunol 174, 6477-6489.
Siligan, C., Ban, J., Bachmaier, R., Spahn, L., Kreppel, M., Schaefer, K.-L.,
Poremba, C., Aryee, D. N. T., and Kovar, H. (2005). EWS-FLI1 target
genes recovered from Ewing’s sarcoma chromatin. Oncogene 24, 2512-
2524.
Sims, N. A., and Gooi, J. H. (2008). Bone remodeling: Multiple cellular
interactions required for coupling of bone formation and resorption.
Semin. Cell Dev. Biol 19, 444-451.
Singh, S. K., Hawkins, C., Clarke, I. D., Squire, J. A., Bayani, J., Hide, T.,
Henkelman, R. M., Cusimano, M. D., and Dirks, P. B. (2004).
Identification of human brain tumour initiating cells. Nature 432, 396-
401.
Smith, T. A. (1998). FDG uptake, tumour characteristics and response to
therapy: a review. Nucl Med Commun 19, 97-105.
Sollazzo, M. R., Benassi, M. S., Magagnoli, G., Gamberi, G., Molendini, L.,
Ragazzini, P., Merli, M., Ferrari, C., Balladelli, A., and Picci, P. (1999).

Chapter 9 – Bibliography
256
Increased c-myc oncogene expression in Ewing’s sarcoma: correlation
with Ki67 proliferation index. Tumori 85, 167-173.
Sorensen, P. H., Lessnick, S. L., Lopez-Terrada, D., Liu, X. F., Triche, T. J., and
Denny, C. T. (1994). A second Ewing’s sarcoma translocation, t(21;22),
fuses the EWS gene to another ETS-family transcription factor, ERG.
Nat. Genet 6, 146-151.
Staal, F. J. T., van der Burg, M., Wessels, L. F. A., Barendregt, B. H., Baert, M.
R. M., van den Burg, C. M. M., van Huffel, C., Langerak, A. W., van der
Velden, V. H. J., Reinders, M. J. T., et al. (2003). DNA microarrays for
comparison of gene expression profiles between diagnosis and relapse in
precursor-B acute lymphoblastic leukemia: choice of technique and
purification influence the identification of potential diagnostic markers.
Leukemia 17, 1324-1332.
Staege, M. S., Hansen, G., Baersch, G., and Burdach, S. (2004). Functional and
molecular characterization of interleukin-2 transgenic Ewing tumor cells
for in vivo immunotherapy. Pediatr Blood Cancer 43, 23-34.
Stiller, C. A., Craft, A. W., and Corazziari, I. (2001). Survival of children with
bone sarcoma in Europe since 1978: results from the EUROCARE study.
Eur. J. Cancer 37, 760-766.
Strauss, S. J., Ng, T., Mendoza-Naranjo, A., Whelan, J., and Sorensen, P. H. B.
(2010). Understanding micrometastatic disease and Anoikis resistance in
ewing family of tumors and osteosarcoma. Oncologist 15, 627-635.
Suda, T., Takahashi, N., Udagawa, N., Jimi, E., Gillespie, M. T., and Martin, T.
J. (1999). Modulation of osteoclast differentiation and function by the

Chapter 9 – Bibliography
257
new members of the tumor necrosis factor receptor and ligand families.
Endocr. Rev 20, 345-357.
Suggitt, M., and Bibby, M. C. (2005). 50 Years of Preclinical Anticancer Drug
Screening: Empirical to Target-Driven Approaches. Clinical Cancer
Research 11, 971 -981.
Sun, X., Cheng, G., Hao, M., Zheng, J., Zhou, X., Zhang, J., Taichman, R. S.,
Pienta, K. J., and Wang, J. (2010). CXCL12 / CXCR4 / CXCR7
chemokine axis and cancer progression. Cancer Metastasis Rev 29, 709-
722.
Sun, Y.-X., Wang, J., Shelburne, C. E., Lopatin, D. E., Chinnaiyan, A. M.,
Rubin, M. A., Pienta, K. J., and Taichman, R. S. (2003). Expression of
CXCR4 and CXCL12 (SDF-1) in human prostate cancers (PCa) in vivo.
J. Cell. Biochem 89, 462-473.
Sutow, W. W., and Sullivan, M. P. (1962). Cyclophosphamide therapy in
children with Ewing’s sarcoma. Cancer Chemother Rep 23, 55-60.
Suvà, M.-L., Riggi, N., Stehle, J.-C., Baumer, K., Tercier, S., Joseph, J.-M.,
Suvà, D., Clément, V., Provero, P., Cironi, L., et al. (2009). Identification
of cancer stem cells in Ewing’s sarcoma. Cancer Res 69, 1776-1781.
Tachibana, K., Hirota, S., Iizasa, H., Yoshida, H., Kawabata, K., Kataoka, Y.,
Kitamura, Y., Matsushima, K., Yoshida, N., Nishikawa, S., et al. (1998).
The chemokine receptor CXCR4 is essential for vascularization of the
gastrointestinal tract. Nature 393, 591-594.
Takahashi, M., Miyazaki, H., Furihata, M., Sakai, H., Konakahara, T., Watanabe,
M., and Okada, T. (2009). Chemokine CCL2/MCP-1 negatively regulates

Chapter 9 – Bibliography
258
metastasis in a highly bone marrow-metastatic mouse breast cancer
model. Clin. Exp. Metastasis 26, 817-828.
Takashima, Y., Era, T., Nakao, K., Kondo, S., Kasuga, M., Smith, A. G., and
Nishikawa, S.-I. (2007). Neuroepithelial cells supply an initial transient
wave of MSC differentiation. Cell 129, 1377-1388.
Takuwa, Y., Masaki, T., and Yamashita, K. (1990). The effects of the endothelin
family peptides on cultured osteoblastic cells from rat calvariae.
Biochem. Biophys. Res. Commun 170, 998-1005.
Teitell, M. A., Thompson, A. D., Sorensen, P. H., Shimada, H., Triche, T. J., and
Denny, C. T. (1999). EWS/ETS fusion genes induce epithelial and
neuroectodermal differentiation in NIH 3T3 fibroblasts. Lab. Invest 79,
1535-1543.
Thiery, J. P., Acloque, H., Huang, R. Y. J., and Nieto, M. A. (2009). Epithelial-
mesenchymal transitions in development and disease. Cell 139, 871-890.
Thiolloy, S., Halpern, J., Holt, G. E., Schwartz, H. S., Mundy, G. R., Matrisian,
L. M., and Lynch, C. C. (2009). Osteoclast-derived matrix
metalloproteinase-7, but not matrix metalloproteinase-9, contributes to
tumor-induced osteolysis. Cancer Res 69, 6747-6755.
Thomas, R. J., Guise, T. A., Yin, J. J., Elliott, J., Horwood, N. J., Martin, T. J.,
and Gillespie, M. T. (1999). Breast cancer cells interact with osteoblasts
to support osteoclast formation. Endocrinology 140, 4451-4458.
Thompson, A. D., Teitell, M. A., Arvand, A., and Denny, C. T. (1999).
Divergent Ewing’s sarcoma EWS/ETS fusions confer a common
tumorigenic phenotype on NIH3T3 cells. Oncogene 18, 5506-5513.

Chapter 9 – Bibliography
259
Tinkey, P. T., Lembo, T. M., Evans, G. R., Cundiff, J. H., Gray, K. N., and Price,
R. E. (1998). Postirradiation sarcomas in Sprague-Dawley rats. Radiat.
Res 149, 401-404.
Tirode, F., Laud-Duval, K., Prieur, A., Delorme, B., Charbord, P., and Delattre,
O. (2007). Mesenchymal stem cell features of Ewing tumors. Cancer Cell
11, 421-429.
Toretsky, J. A., Erkizan, V., Levenson, A., Abaan, O. D., Parvin, J. D., Cripe, T.
P., Rice, A. M., Lee, S. B., and Uren, A. (2006). Oncoprotein EWS-FLI1
activity is enhanced by RNA helicase A. Cancer Res 66, 5574-5581.
Tran Van, P., Vignery, A., and Baron, R. (1982). An electron-microscopic study
of the bone-remodeling sequence in the rat. Cell Tissue Res 225, 283-
292.
Tu, S.-M., Lin, S.-H., and Logothetis, C. J. (2002). Stem-cell origin of metastasis
and heterogeneity in solid tumours. Lancet Oncol 3, 508-513.
Urano, F., Umezawa, A., Hong, W., Kikuchi, H., and Hata, J. (1996). A novel
chimera gene between EWS and E1A-F, encoding the adenovirus E1A
enhancer-binding protein, in extraosseous Ewing’s sarcoma. Biochem.
Biophys. Res. Commun 219, 608-612.
Uren, A., Tcherkasskaya, O., and Toretsky, J. A. (2004a). Recombinant EWS-
FLI1 oncoprotein activates transcription. Biochemistry 43, 13579-13589.
Uren, A., Wolf, V., Sun, Y.-F., Azari, A., Rubin, J. S., and Toretsky, J. A.
(2004b). Wnt/Frizzled signaling in Ewing sarcoma. Pediatr Blood Cancer
43, 243-249.
Väänänen, H. K., Zhao, H., Mulari, M., and Halleen, J. M. (2000). The cell
biology of osteoclast function. J. Cell. Sci 113 ( Pt 3), 377-381.

Chapter 9 – Bibliography
260
Vanel, D., Bittoun, J., and Tardivon, A. (1998). MRI of bone metastases. Eur
Radiol 8, 1345-1351.
van ’t Veer, L. J., Dai, H., van de Vijver, M. J., He, Y. D., Hart, A. A. M., Mao,
M., Peterse, H. L., van der Kooy, K., Marton, M. J., Witteveen, A. T., et
al. (2002). Gene expression profiling predicts clinical outcome of breast
cancer. Nature 415, 530-536.
Venditti, J. M., Wesley, R. A., and Plowman, J. (1984). Current NCI preclinical
antitumor screening in vivo: results of tumor panel screening, 1976-1982,
and future directions. Adv Pharmacol Chemother 20, 1-20.
Vormoor, J., Baersch, G., Decker, S., Hotfilder, M., Schäfer, K. L., Pelken, L.,
Rübe, C., Van Valen, F., Jürgens, H., and Dockhorn-Dworniczak, B.
(2001). Establishment of an in vivo model for pediatric Ewing tumors by
transplantation into NOD/scid mice. Pediatr. Res 49, 332-341.
Wang, J., Wang, J., Sun, Y., Song, W., Nor, J. E., Wang, C. Y., and Taichman,
R. S. (2005). Diverse signaling pathways through the SDF-1/CXCR4
chemokine axis in prostate cancer cell lines leads to altered patterns of
cytokine secretion and angiogenesis. Cell. Signal 17, 1578-1592.
Watson, D. K., Robinson, L., Hodge, D. R., Kola, I., Papas, T. S., and Seth, A.
(1997). FLI1 and EWS-FLI1 function as ternary complex factors and
ELK1 and SAP1a function as ternary and quaternary complex factors on
the Egr1 promoter serum response elements. Oncogene 14, 213-221.
Weinfeld, M. S., and Dudley, H. R. (1962). Osteogenic sarcoma. A follow-up
study of the ninety-four cases observed at the Massachusetts General
Hospital from 1920 to 1960. J Bone Joint Surg Am 44-A, 269-276.

Chapter 9 – Bibliography
261
Wennberg, C., Hessle, L., Lundberg, P., Mauro, S., Narisawa, S., Lerner, U. H.,
and Millán, J. L. (2000). Functional characterization of osteoblasts and
osteoclasts from alkaline phosphatase knockout mice. J. Bone Miner. Res
15, 1879-1888.
Westendorf, J. J., Kahler, R. A., and Schroeder, T. M. (2004). Wnt signaling in
osteoblasts and bone diseases. Gene 341, 19-39.
Widhe, B., and Widhe, T. (2000). Initial symptoms and clinical features in
osteosarcoma and Ewing sarcoma. J Bone Joint Surg Am 82, 667-674.
Wieland, B. W., Bida, G. T., Padgett, H. C., and Go, H. (1989). Current status of
CTI target systems for the production of PET radiochemicals. In
Proceedings of the 3rd workshop of Targetry and Target Chemistry
(Vancouver, British Columbia, Canada).
Williams, B. R. (1997). Role of the double-stranded RNA-activated protein
kinase (PKR) in cell regulation. Biochem. Soc. Trans 25, 509-513.
Wilson, T. J., Nannuru, K. C., and Singh, R. K. (2009). Cathepsin G-mediated
activation of pro-matrix metalloproteinase 9 at the tumor-bone interface
promotes transforming growth factor-beta signaling and bone destruction.
Mol. Cancer Res 7, 1224-1233.
Wilson, T. J., Nannuru, K. C., Futakuchi, M., and Singh, R. K. (2010). Cathepsin
G-mediated enhanced TGF-beta signaling promotes angiogenesis via
upregulation of VEGF and MCP-1. Cancer Lett 288, 162-169.
Witzel, J. G., Prescher, A., and Weisser, H. (1992). Experimental animal model
for the evaluation of chemotherapeutical effects on osteosarcoma.
Chemotherapy 38, 251-260.

Chapter 9 – Bibliography
262
Wu, Z., and Irizarry, R. A. (2005). Stochastic models inspired by hybridization
theory for short oligonucleotide arrays. J. Comput. Biol 12, 882-893.
Yang, J., and Weinberg, R. A. (2008). Epithelial-mesenchymal transition: at the
crossroads of development and tumor metastasis. Dev. Cell 14, 818-829.
Yang, L., Chansky, H. A., and Hickstein, D. D. (2000). EWS.Fli-1 fusion protein
interacts with hyperphosphorylated RNA polymerase II and interferes
with serine-arginine protein-mediated RNA splicing. J. Biol. Chem 275,
37612-37618.
Yasuda, H., Shima, N., Nakagawa, N., Mochizuki, S. I., Yano, K., Fujise, N.,
Sato, Y., Goto, M., Yamaguchi, K., Kuriyama, M., et al. (1998). Identity
of osteoclastogenesis inhibitory factor (OCIF) and osteoprotegerin
(OPG): a mechanism by which OPG/OCIF inhibits osteoclastogenesis in
vitro. Endocrinology 139, 1329-1337.
Yoda, M., Kawamata, T., Paroo, Z., Ye, X., Iwasaki, S., Liu, Q., and Tomari, Y.
(2010). ATP-dependent human RISC assembly pathways. Nat. Struct.
Mol. Biol 17, 17-23.
Yu, L., Cecil, J., Peng, S.-B., Schrementi, J., Kovacevic, S., Paul, D., Su, E. W.,
and Wang, J. (2006). Identification and expression of novel isoforms of
human stromal cell-derived factor 1. Gene 374, 174-179.
Yu, X., Huang, Y., Collin-Osdoby, P., and Osdoby, P. (2004). CCR1 chemokines
promote the chemotactic recruitment, RANKL development, and motility
of osteoclasts and are induced by inflammatory cytokines in osteoblasts.
J. Bone Miner. Res 19, 2065-2077.
Yu, X., Huang, Y., Collin-Osdoby, P., and Osdoby, P. (2003). Stromal cell-
derived factor-1 (SDF-1) recruits osteoclast precursors by inducing

Chapter 9 – Bibliography
263
chemotaxis, matrix metalloproteinase-9 (MMP-9) activity, and collagen
transmigration. J. Bone Miner. Res 18, 1404-1418.
Yuan, K., Chung, L. W. K., Siegal, G. P., and Zayzafoon, M. (2007). alpha-
CaMKII controls the growth of human osteosarcoma by regulating cell
cycle progression. Lab. Invest 87, 938-950.
Zagzag, D., Lukyanov, Y., Lan, L., Ali, M. A., Esencay, M., Mendez, O., Yee,
H., Voura, E. B., and Newcomb, E. W. (2006). Hypoxia-inducible factor
1 and VEGF upregulate CXCR4 in glioblastoma: implications for
angiogenesis and glioma cell invasion. Lab. Invest 86, 1221-1232.
Zamore, P. D. (2006). RNA interference: big applause for silencing in
Stockholm. Cell 127, 1083-1086.
Zhang, H., Kolb, F. A., Jaskiewicz, L., Westhof, E., and Filipowicz, W. (2004).
Single processing center models for human Dicer and bacterial RNase III.
Cell 118, 57-68.
Zhang, H., Merchant, M. S., Chua, K. S., Khanna, C., Helman, L. J., Telford, B.,
Ward, Y., Summers, J., Toretsky, J., Thomas, E. K., et al. (2003). Tumor
expression of 4-1BB ligand sustains tumor lytic T cells. Cancer Biol.
Ther 2, 579-586.
Zhang, P. J., Barcos, M., Stewart, C. C., Block, A. W., Sait, S., and Brooks, J. J.
(2000). Immunoreactivity of MIC2 (CD99) in acute myelogenous
leukemia and related diseases. Mod. Pathol 13, 452-458.
Zhao, C., Irie, N., Takada, Y., Shimoda, K., Miyamoto, T., Nishiwaki, T., Suda,
T., and Matsuo, K. (2006). Bidirectional ephrinB2-EphB4 signaling
controls bone homeostasis. Cell Metab 4, 111-121.

Chapter 9 – Bibliography
264
Zhao, W., Byrne, M. H., Boyce, B. F., and Krane, S. M. (1999). Bone resorption
induced by parathyroid hormone is strikingly diminished in collagenase-
resistant mutant mice. J. Clin. Invest 103, 517-524.
Zhou, Y., Mohan, S., Linkhart, T. A., Baylink, D. J., and Strong, D. D. (1996).
Retinoic acid regulates insulin-like growth factor-binding protein
expression in human osteoblast cells. Endocrinology 137, 975-983.
Zhou, Z., Guan, H., Duan, X., and Kleinerman, E. S. (2005). Zoledronic acid
inhibits primary bone tumor growth in Ewing sarcoma. Cancer 104,
1713-1720.
Zou, Y. R., Kottmann, A. H., Kuroda, M., Taniuchi, I., and Littman, D. R.
(1998). Function of the chemokine receptor CXCR4 in haematopoiesis
and in cerebellar development. Nature 393, 595-599.
Zubrod, C. G. (1965). Combinations of drugs in the treatment of acute
leukemias. Proc. R. Soc. Med 58, 988-990.
Zucman, J., Melot, T., Desmaze, C., Ghysdael, J., Plougastel, B., Peter, M.,
Zucker, J. M., Triche, T. J., Sheer, D., and Turc-Carel, C. (1993).
Combinatorial generation of variable fusion proteins in the Ewing family
of tumours. EMBO J 12, 4481-4487.

Chapter 10 – Appendix
A
9. Chapter – Appendix
9.1 Abstracts and posters for scientific meetings
Abstract for the XXth Annual Research Meeting of the Kind-Philipp
Foundation for Leukemia Research, June 6th-9th, 2007 (Wilsede, Germany).
(Klin Padiatr. 2007 May-Jun;219(3):181-96):
Oral presentation
Identifying Cellular Mechanisms of Organ-Specific Metastasis of Ewing
Tumours
H Knizia1, M Hotfilder1, J Vormoor2
Dep. of Paediatric Haematology/Oncology, U of Muenster1, and NICR2,
Newcastle, UK
The most important factor in the prognosis of Ewing sarcomas is the presentation
of primary metastasis. The 5-year-outcome of patients with lung metastases and
with bone tumours or involvement of bone marrow it is 36% resp. only 20%.
Patients with a localised tumour can be cured in 50% of the cases. The metastasis
model for Ewing sarcoma in NOD/scid-mice shows a metastasis pattern equal to
patients. So the conservation of interaction between human tumour cells and the
microenvironment of the different mouse organs can be assumed. After
intravenous application of Ewing tumour cells, tumour clones are isolated,

Chapter 10 – Appendix
B
preferentially from lung, bone and bone marrow. These tumour clones are
analysed in vitro, and re-transplanted into mice. Global gene expression analysis
will identify genes, whose expression is correlated to organ specific metastasis.
Functional analysis of these genes will be done with the NOD/scid-mouse model.
(e.g. by siRNA technology). Intention of our work is the identification of genes,
which are involved in organ-specific metastasis and may function as new targets
for molecular therapies and diagnostic.

Chapter 10 – Appendix
C
Abstract for XXIth Annual Research Meeting of the Kind-Philipp
Foundation for Leukemia Research, June 11th-14th, 2008 (Wilsede,
Germany):
Oral presentation
Identifying Cellular Mechanisms of Organ-Specific Metastasis of Ewing’s
Sarcoma
H Knizia1, R Unland1, M Hotfilder1, E Korsching2, U Dirksen1, H Jürgens1, J
Vormoor3
Dep. of Paediatric Haematology/Oncology1, Dep. of Pathology2, University of
Münster, and NICR3, Newcastle, UK
Prognosis of Ewing sarcomas is mainly influenced by the occurrence of primary
metastasis. While 2/3 of patients with localized disease can be cured, the 3-year
ETS in patients with lung metastases only is ~50% and the prognosis of patients
with bony metastases is <20%. The metastasis model for Ewing sarcoma in
NOD/scid-mice shows a metastasis pattern equal to patients. So the conservation
of interaction between human tumour cells and the microenvironment of the
different mouse organs can be assumed.
Via transplantation of cell lines TC-71 and VH-64 onto NOD/scid-mice 14
subclones preferentially from lung, bone and bone marrow could be generated.
The tumour clones where analysed in vitro and re-transplanted into mice. First
global gene expression analysis identified 247 genes with different expression
levels in bone metastases resp. lung metastases. These genes may be correlated to

Chapter 10 – Appendix
D
organ specific metastasis. Functional analysis of these genes will be done with
the NOD/scid-mouse model. (e.g. by shRNA technology).
Intention of our work is the identification of genes, which are involved in organ-
specific metastasis and may function as new targets for molecular therapies and
diagnostic.

Chapter 10 – Appendix
E
Abstract for BACR/RSM Oncology Section/APS Joint Meeting: “Preclinical
models, biomarkers and targeted therapy”, November 27th, 2008 (London,
UK):
Selected for poster presentation and oral presentation (poster talk)
Identifying Cellular Mechanisms of Organ-Specific Metastasis of Ewing’s
Sarcoma
Knizia1,2 H, Batey1 M, Unland2 R, Korsching3 E, Dirksen2 U, Jürgens2 H,
Heidenreich1 O, Hotfilder2 M, Hempel2 G, Vormoor1 J
Northern Institute for Cancer Research1, Newcastle University, UK and Dep. of
Paediatric Haematology/Oncology2, Dep. of Pathology3, University of Münster,
Germany
Ewing's sarcoma is the second most common bone tumour in children and
adolescents. The prognosis of Ewing’s sarcomas is mainly influenced by the
occurrence of primary metastasis. While 2/3 of patients with localized disease
can be cured, the 3-year event free survival in patients with lung metastases is
only ~50% and <20% in patients with bony metastases. Metastatic models of
Ewing’s sarcoma in Rag2-/-�c-/-and Nod/Scid mice show a pattern of disease
spread similar to that found in patients, providing us with a suitable system for
studying this disease.
Transplantation of the TC-71 and VH-64 Ewing’s sarcoma cell lines into
NOD/scid-mice leads to the development of metastases in lung, bone and bone
marrow. Following aseptic removal and disaggregation of tumour cells from

Chapter 10 – Appendix
F
each of these sites, these cells were analysed in vitro and re-transplanted into
mice. Global gene expression analysis of clones and subclones identified several
genes with differential expression levels in bone metastases compared to lung
metastases. Functional analysis of these genes will be carried out in our
immunocompromised animal models.
Transplanted mice are imaged using PET and MRI to detect and monitor
growing metastases from early stages of development. We are utilising bone
density assessment software to interpret some of the MRI data. With this analysis
the correlation between possible bone metastases and a loss of bone density will
be determined.
Understanding the molecular mechanisms that underlie metastatic spread in
Ewing’s sarcoma, will allow us to develop more specific therapies for patients
with advanced stage Ewing's sarcoma in the future.
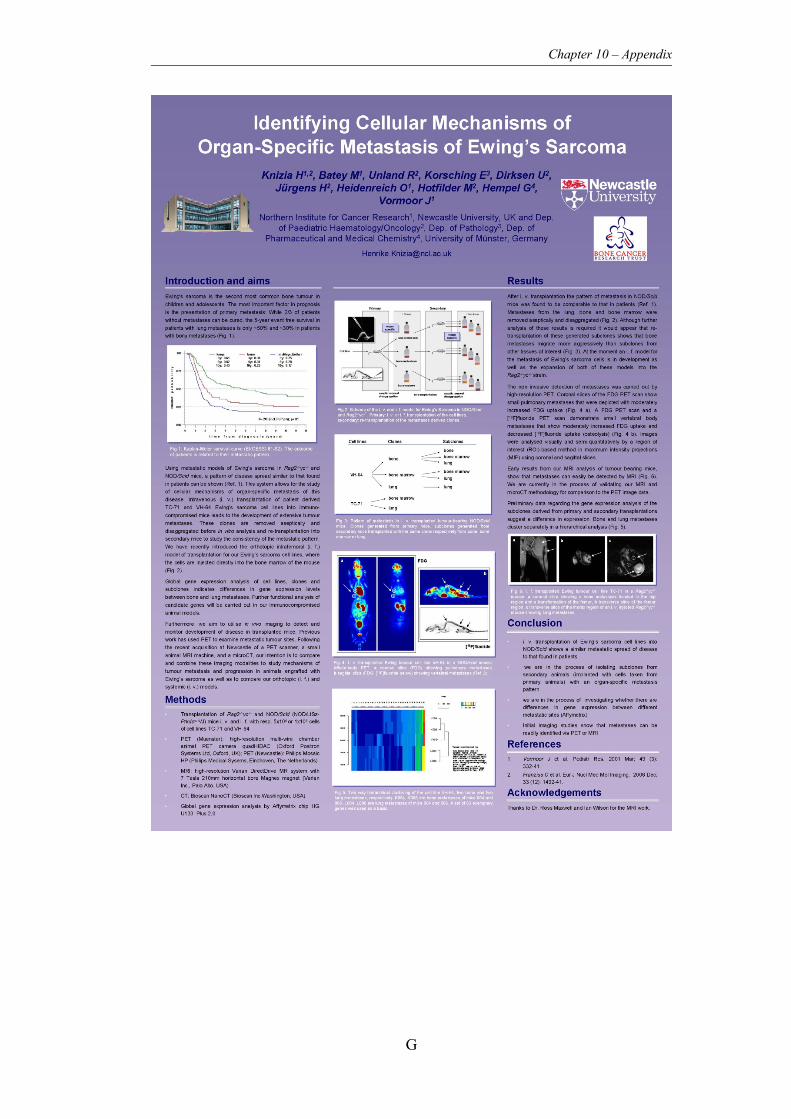
Chapter 10 – Appendix
G

Chapter 10 – Appendix
H
Abstract for AACR 101st Annual Meeting 2010, April 17th-21st, 2010
(Washington D.C., USA): Selected for poster presentation
Development of an orthotopic model for human malignant bone diseases in
immunocompromised NOD.Cg-Prkdcscid Il2rgtm1wjl/SzJ (NSG) mice
Knizia H, Batey MA, Almeida GS, Wilson I, Maxwell RJ, Dildey P, Hide IG,
Bacon CM, Vormoor J
Northern Institute for Cancer Research, Newcastle University, UK
Bone is the third most common site for metastatic disease in cancer. The
continuity of bone tissue relies on the delicate balance between osteoblasts and
osteoclasts and the formation and resorbtion of new bone tissue. The presence of
cancer cells disturbs this equilibrium and can lead to aberrant new bone
formation or destruction. In Ewing’s Sarcoma (ES) the 3-year event free survival
in patients with osseous metastases or bone marrow infiltration is less than 20%,
which accounts for 10% of patients. Clinically, the morphological changes to
bone caused by ES differ from those of other cancer types such as prostate cancer
(CaP).
To better address the interaction between ES and bone, we have developed a
preclinical orthotopic bone model. Intrafemoral (i. f.) transplantation is a
technically feasible and convenient method for the study of cancer types
associated with bone or bone marrow. Cells are injected directly into the bone
marrow cavity of the femur via the knee. ES cell lines TC-71 and VH-64 and the
CaP cell line PC3M were injected into the right femur of NSG mice at varying

Chapter 10 – Appendix
I
cell doses. The course of the disease was tracked using Computed Tomography
(CT) and 2-[18F]fluoro-2-deoxy-D-glucose-Positron Emission Tomography
(FDG-PET); a final MR documented the tumor before dissection. Areas of
interest, identified by imaging, were taken for immunohistochemistry (IHC) and
compared to patient images and IHC.
Seven weeks post injection, CT images of mice transplanted with the ES cell line
VH-64 showed development of structures identified as sunray spicules. The ES
cell line TC-71 did not initiate the development of such structures, but appeared
mottled and thickened compared to the left femur in the same mouse matching
the permeative growth of Ewing sarcoma in human patients. Conversely, 66% of
PC3M transplanted mice developed a pathological fracture of the right femur. In
addition to palpable tumors in the thigh, all experimental mice had developed
metastases at distant sites including liver and lungs. IHC analysis of the right
femurs confirmed the findings of CT, and both ES cell lines were shown to have
induced new bone formation. A review of ES patient images and IHC shows that
a considerable number of patients present with new bone formation
demonstrating the good concordance and clinical relevance of our proposed
model.
As 20% of ES arise in the diaphysis region of the femur and patients develop
lung or bone metastases, this i. f. model better reflects the situation in patients
than s. c. or i. v. models. All ES implanted animals developed bone tumors,
suggesting that this model may be useful in preclinical studies. I. f. injection is a
minimally invasive and non-traumatic procedure, which provides us with a
preclinical orthotopic model for ES and a model of primary metastasis in CaP. In
addition to examining the biology of bone malignancies to the model can be used

Chapter 10 – Appendix
J
study new drugs disturbing the interaction between cancer cells and bone
microenvironment.

Chapter 10 – Appendix
K

Chapter 10 – Appendix
L
Abstract for the BACR 50th Anniversary Celebration meeting 'Hallmarks
of Cancer: from Mechanisms to Therapies', June 13th-15th, 2010
(Edinburgh, UK):
Selected for poster presentation
Development of an orthotopic model for human malignant bone diseases in
immunocompromised NOD.Cg-Prkdcscid Il2rgtm1wjl/SzJ (NSG) mice
Knizia H1, Batey MA1, Almeida GS1, Wilson I1, Maxwell RJ1, Dildey P2, Hide
IG2, Bacon C1, Vormoor J1,2
1Northern Institute for Cancer Research, Newcastle University, Newcastle upon
Tyne, NE2 4HH, Newcastle upon Tyne, UK and
2Newcastle upon Tyne Hospitals, NHS Foundation Trust, Newcastle upon Tyne,
UK
The continuity of bone tissue relies on the delicate balance between osteoblasts
and osteoclasts and the formation and resorption of new bone tissue. The
presence of cancer cells disturbs this equilibrium. Ewing’s sarcoma (ES) and
osteosarcoma (OS) are the two most frequent primary osseous sarcomas in
childhood and adolescence and primary osseous metastasis is the main adverse
prognostic factor in patients. Clinically, the morphological changes to bone
caused by ES differ from those of other cancer types metastasizing to the bone,
such as prostate cancer (CaP).

Chapter 10 – Appendix
M
We developed a preclinical orthotopic intrafemoral (i. f.) model addressing the
interaction between tumour and bone directly. For this, ES cell lines TC-71 and
VH-64, OS cell line SaOS-2 and CaP cell line PC3M were injected into the right
femur of NSG mice via the knee. The course of the disease was tracked using
Computed Tomography (CT) and 2-[18F]fluoro-2-deoxy-D-glucose-Positron
Emission Tomography (FDG-PET); a final MR documented the tumour. Areas
of interest, identified by imaging, were taken for histopathology.
Post injection CT images of femurs injected with the ES cell line VH-64 showed
induction of sunray spicules, while femurs of TC-71 transplanted mice appeared
mottled. CT images of SaOS-2 transplanted mice showed, that the tumour cells
appear to be able to mature and form new malignant bone. Conversely, 66% of
PC3M transplanted mice developed a pathological fracture of the injected femur.
Histopathological analysis of the right femurs confirmed the findings of CT and
a review of patient images and pathology shows that a considerable number of
patients present with different forms of new bone formation. This demonstrates
the good concordance and clinical relevance of the proposed model and as all
implanted animals developed bone tumours, this model may be useful for
examining the biology of bone malignancies and in preclinical studies.

Chapter 10 – Appendix
N

Chapter 10 – Appendix
O
Abstract for the NCRI Cancer Conference 2010, November 7th-10th 2010
(Liverpool, UK): Selected for poster presentation
Establishment of a preclinical orthotopic model for human malignant bone
disease in immunocompromised NSG mice using small animal PET, CT and
MRI imaging
Knizia H1, Batey MA1, Almeida GS1, Wilson I1, Maxwell RJ1, Dildey P2,
Hide IG2, Bacon CM1, Vormoor HJ1,2
1Northern Institute for Cancer Research, Newcastle University, Newcastle upon
Tyne, NE2 4HH, UK and
2Newcastle upon Tyne Hospitals NHS Foundation Trust, Newcastle upon Tyne,
NE2 4HH, UK
Background: Ewing sarcoma (ES) and osteosarcoma (OS) are the two most
frequent primary osseous sarcomas in childhood and adolescence. In both
primary bone tumours and other cancers, bone metastases are the main adverse
prognostic factor. Through complex interactions with cells such as osteoblasts
and osteoclasts, cancer cells disturb the delicately balanced bone
microenvironment causing different patterns of bone remodelling. Orthotopic
models are needed both to study the biology of the interaction between tumour
cells and bone and as preclinical models for drug development.
Methods: To develop a preclinical orthotopic intrafemoral model addressing
interaction between tumour and bone, ES cell lines VH-64 and TC-71, OS cell
line SaOS-2 and prostate cancer (CaP) cell line PC3M were injected into the
right femurs of NSG mice. The disease was tracked using Computed

Chapter 10 – Appendix
P
Tomography (CT) and 2-[18F]fluoro-2-deoxy-D-glucose-Positron Emission
Tomography (FDG-PET); final Magnetic Resonance Imaging (MRI)
documented tumours. Areas of interest identified by imaging were taken for
histopathology.
Results: CT images of femurs injected with ES and OS cell lines showed
remodelling of the murine bone with induction of pathological new bone
formation. Additionally, OS transplanted mice showed formation of new
malignant bone within the tumour mass itself. However, CaP cells caused
osteolytic lesions and 28% of transplanted mice developed pathological fractures
of the injected femur.
Histopathological analysis of the femurs confirmed the findings of CT imaging.
Comparison of the model with images and pathology from patients with bone
tumours showed a considerable similarity, demonstrating the clinical and
biological relevance of the model. Finally, small animal MRI proved to be a
good tool to quantify tumour volumes.
Conclusions: We have established a consistent orthotopic xenograft mouse
model to study remodelling of the bone microenvironment by malignant cells.
Moreover, this model can be used as a quantitative assay for preclinical drug
testing.

Chapter 10 – Appendix
Q

Chapter 10 – Appendix
R
9.2 Internal Presentations
Research days of the Pediatric Oncology, University Hospital Münster,
Mittelberg, Kleinwalsertal, Austria:
March 2007
February 2008
March 2009
Friday Research Forum, Northern Institute for Cancer Research, Newcastle upon
Tyne, UK:
May 22nd 2009
March 12th 2010
Diverse Journal-Club presentations in the working groups in Münster and
Newcastle upon Tyne.
9.3 External Presentations
Cellular Tumour Immune-Therapy Meeting, University Hospital Münster,
Münster, Germany (invited):
September 2007
April 2008
Newcastle Cancer Centre Drug Discovery and Imaging Group Meeting, General
Hospital, Newcastle upon Tyne, UK (invited):
September 29th 2009

Chapter 10 – Appendix
S
9.4 Publications
Prepared manuscript which will be submitted to Neoplasia:
Knizia, H. K., Batey, M. A., Almeida, G. S., Wilson, I., O’Toole, K., Dildey, P.,
Hide, G. I., Maxwell, R. J., Bacon, C. M., Vormoor, H. J.
Development of an orthotopic model for human malignant bone diseases in
immunocompromised NOD.Cg-Prkdcscid Il2rgtm1wjl/SzJ (NSG) mice using in vivo
imaging techniques.
Manuscript in preparation:
Gene expression patterns in organ-specific metastases of Ewing’s sarcoma in an
in vivo model of NOD/Scid mice.