cellulose nanocrystals vs. cellulose nanofibrils: a ... · cellulose nanocrystals vs. cellulose...
TRANSCRIPT
Cellulose Nanocrystals vs. Cellulose Nanofibrils: A ComparativeStudy on Their Microstructures and Effects as Polymer ReinforcingAgentsXuezhu Xu,†,‡ Fei Liu,† Long Jiang,*,† J. Y. Zhu,§ Darrin Haagenson,⊥ and Dennis P. Wiesenborn⊥
†Department of Mechanical Engineering, ‡Program of Materials and Nanotechnology, ⊥Department of Agricultural and BiosystemsEngineering, North Dakota State University,Fargo, North Dakota 58108, United States§Forest Products Laboratory, USDA Forest Service, Madison, Wisconson 53726, United States
ABSTRACT: Both cellulose nanocrystals (CNCs) and cellulose nanofibrils (CNFs) are nanoscale cellulose fibers that haveshown reinforcing effects in polymer nanocomposites. CNCs and CNFs are different in shape, size and composition. This studysystematically compared their morphologies, crystalline structure, dispersion properties in polyethylene oxide (PEO) matrix,interactions with matrix, and the resulting reinforcing effects on the matrix polymer. Transparent PEO/CNC and PEO/CNFnanocomposites comprising up to 10 wt % nanofibers were obtained via solution casting. Scanning electron microscopy (SEM),wide-angle X-ray diffraction (WXRD), transmission electron microscopy (TEM), Fourier transform infrared spectroscopy(FTIR), dynamic mechanical analyzer (DMA), and tensile testing were used to examine the above-mentioned properties ofnanocellulose fibers and composites. At the same nanocellulose concentration, CNFs led to higher strength and modulus thandid CNCs due to CNFs’ larger aspect ratio and fiber entanglement, but lower strain-at-failure because of their relatively largefiber agglomerates. The Halpin-Kardos and Ouali models were used to simulate the modulus of the composites and goodagreements were found between the predicted and experimental values. This type of systematic comparative study can help todevelop the criteria for selecting proper nanocellulose as a biobased nano-reinforcement material in polymer nanocomposites.
KEYWORDS: cellulose nanocrystals, cellulose nanofibrils, polymer nanocomposites, reinforcing mechanism, Kapin−Kardos model,percolation theory
■ INTRODUCTIONBiobased materials have attracted immense research intrest inrecent years because of their great potential for producing avariety of high-value products with low impact on theenvironment. Both cellulose nanocrystals (CNCs) and cellulosenanofibrils (CNFs) can be isolated from plant cell walls. Theabundant availability of plant biomass and the superiormechanical properties of cellulose made nanocellulose includ-ing CNCs and CNFs a desirable reinforcing material forpolymer nanocomposites.1 Cellulose is a linear chainpolysaccharide consisting of repeated β-(1→4)-D-glucopyra-nose units. Hydroxyl groups are abundant on CNC and CNFsurfaces, allowing potential hydrogen bonding and surfacemodifications.CNCs (also called cellulose nanowhiskers) are needlelike
cellulose crystals of 10−20 nm in width and several hundred
nanometers in length. They are produced from variousbiological sources (e.g., bleached wood pulp, cotton, manila,tunicin, bacteria, etc.) often by strong acid hydrolysis.2,3 Acidtreatments remove noncellulose components and mostamorphous cellulose from the source materials and producehigh purity cellulose crystals. Therefore, CNCs are highlycrystalline. CNCs have been incorporated as reinforcing agentsinto a wide range of polymer matrices such as poly-(oxyethylene), poly(vinyl alcohol), natural rubber, starch, andpolyurethane.4−12 CNFs form long flexible fiber networks witha fibril diameter similar to or larger than CNCs. CNFs can beproduced by TEMPO-mediated oxidation (2,2,6,6,-tetrame-
Received: November 8, 2012Accepted: March 22, 2013Published: March 22, 2013
Research Article
www.acsami.org
© 2013 American Chemical Society 2999 dx.doi.org/10.1021/am302624t | ACS Appl. Mater. Interfaces 2013, 5, 2999−3009
thylpipelidine-1-oxyl radical), multi-pass high-pressure homog-enization, enzymatic hydrolysis13,14 or direct mechanicalfibrillation.15 The morphologies and dimensions of CNFs canvary substantially, depending on the degrees of fibrilation andany pretreatment involved. CNFs contain amorphous celluloseand are not as highly crystalline as CNCs. Numerous studieshave been carried out using various cellulosic fibers or fibrils forpolymer reinforment.16−26 These studies indicate that fibrilswith smaller diameters and longer lengths exhibit strongerreinforcing effect. For example, Siqueira et al. compared theeffects of CNCs and microfibrillated cellulose (MFC, averagediameter ca. 50 nm) on the crystallization and mechanicalproperties of polycaprolactone (PCL) matrix. The authors findthat CNCs act as a better nucleation agent for PCL than MFCbecause of the latter’s entanglement and confinement effectwhich restricts the growth of PCL crystallites.23 MFC impartshigher modulus to the composites than do CNCs for the samereason. However, MFC and CNCs were both shown todecrease the strength and strain-at-failure of PCL, with higherfiber contents leading to larger decrease.Both MFC and CNFs have large aspect ratios and are
expected to have some similarities as reinforcent materials;however, extended mechanical fibrillation imparts CNFscomplex fibril networks and much thinner fibrils comparedwith MFC. It is of great interest to compare the performance ofCNFs and CNCs as reinforcing materials for nanocomposites.In this study, we compared the effect of CNCs and CNFs onthe mechanical and thermal dynamic properties of PEO tounderstand the contributions of their morphologies anddispersions to the properties of PEO nanocomposites.Experimentally measured mechanical properties were comparedwith theoretical predictions on the basis of two mechanicalmodels and correlated with the microstructures of thenanocomposites. Remarkable differences in the reinforcingeffects between CNCs and CNFs were demonstrated and amicrostructural explanation was provided. Different forms ofcellulose nanofibers as reinforcement agents in polymernanocomposites have been intensively studied and greatpotential has been shown for their industrial applications. Inspite of all previous studies, a greater clarity is needed on thereinforcing effects of different cellulose nanofibers. The resultsfrom this study show clear distinctions between short rigidCNCs and long relatively tough CNFs in terms of theirreinforcing effects and mechanisms, thus providing a practicalguidance for the development of polymer nanocompositescontaining cellulose nanofibers. Novel applications of PEO/cellulose nanocomposites as water absorption and retentionmaterials27 and as solid−solid phase change materials forenergy storage28 can also benefit from this study.
■ MATERIALS AND METHODSCNCs and CNFs derived from bleached dry lap eucalyptus pulp werekindly provided by the USDA Forest Service Lab. Their methods ofproduction have been detailed elsewhere.15,29 Briefly, CNCs wereproduced by sulfuric acid hydrolysis followed by repeatedcentrifugation29 whereas CNFs were produced through a multi-passhigh pressure grinding process using a SuperMassColloider (MKZA6-2, Masuko Sangyo Co., Ltd, Japan).15 The as-received CNCs andCNFs were in the forms of 5.7 wt % suspension and 1.8 wt % gel(both in water), respectively. PEO with a viscosity average molecularweight (Mv) of 1 000 000 was purchased from Sigma-Aldrich. PEO/CNC and PEO/CNF nanocomposite films were prepared by solutioncasting. PEO was first dissolved in deionized water to make a 4 wt %solution. Various amounts of CNC suspension or CNF gel were addedto the solution to make mixtures comprising 0, 1, 4, 7, and 10 wt % ofCNCs or CNFs (based on PEO solid weight). The mixtures were firsthomogenized using a homogenizer (IKA T25 digital Ultra-Turrax) at100 rpm for 5 minutes at room temperature and then stirred using amagnetic stirrer at approximately 100 rpm at 60 °C for 12 h.Nanocomposite films were obtained by casting the mixtures in glassPetri dishes and drying the casts in a vacuum oven at 80 °C forapproximately 5 h.
TEM was used to study the morphology of CNC and CNF fibersand their dispersion states in PEO matrix. TEM imaging wasconducted on a JEOL JEM-2100 Lab6 operating at 200 kV. Toprepare the CNC and CNF samples for TEM study, the CNCsuspension and CNF gel were both diluted with distilled water.Specifically, 0.5 ml of the 5.7% CNC suspension was diluted 100 timesin distilled water. A drop (accurate measurements were not alloweddue to the high viscosity of the gel) of the 1.8% CNF gel was added to0.5 mL of distilled water and manually stirred. A drop of each dilutedsample was placed onto 300 mesh Formvar coated copper grids. Extraliquid was wicked off with filter paper. Samples were allowed to dry atroom temperature and finally stained with 1% phosphotungstic acid(PTA) or iodine vapor to produce additional contrast. To studydispersion of CNCs and CNFs in the PEO matrix, drops of mixturesolutions were deposited onto carbon-coated copper grids and allowedto dry at room temperature. The specimens were also stained withiodine vapor to enhance image contrast.
Wide-angle X-ray diffraction (WAXD) measurements wereperformed using an X-ray powder diffractometer (Philips X’PertMPD) operating at 45 kV and 40 mA with a Cu Kα X-ray source. Puredry CNC and CNF films (prepared by vacuum drying of the as-received dispersion and gel) were scanned from 2.5−60° at a scanningspeed of 0.05°/s.
Dynamic mechanical analysis (DMA) of composite films wasconducted using a DMA Q800-0790 (TA Instruments) equipped witha film tension clamp. Test samples (12.74 × 6.29 mm2) were preparedusing a die cutter. Tests were run from -100 to 20 °C (Tg of PEO: −48°C) at a rate of 3°C/min. Oscillation amplitude of 20 μm (withinlinear range) and a preload force of 0.01 N were applied on allsamples. At least three repeats were tested for each sample.
Differential scanning calorimetry (DSC) tests were conducted usinga Q1000 from TA Instruments. Samples (2−6 mg each) were sealed in
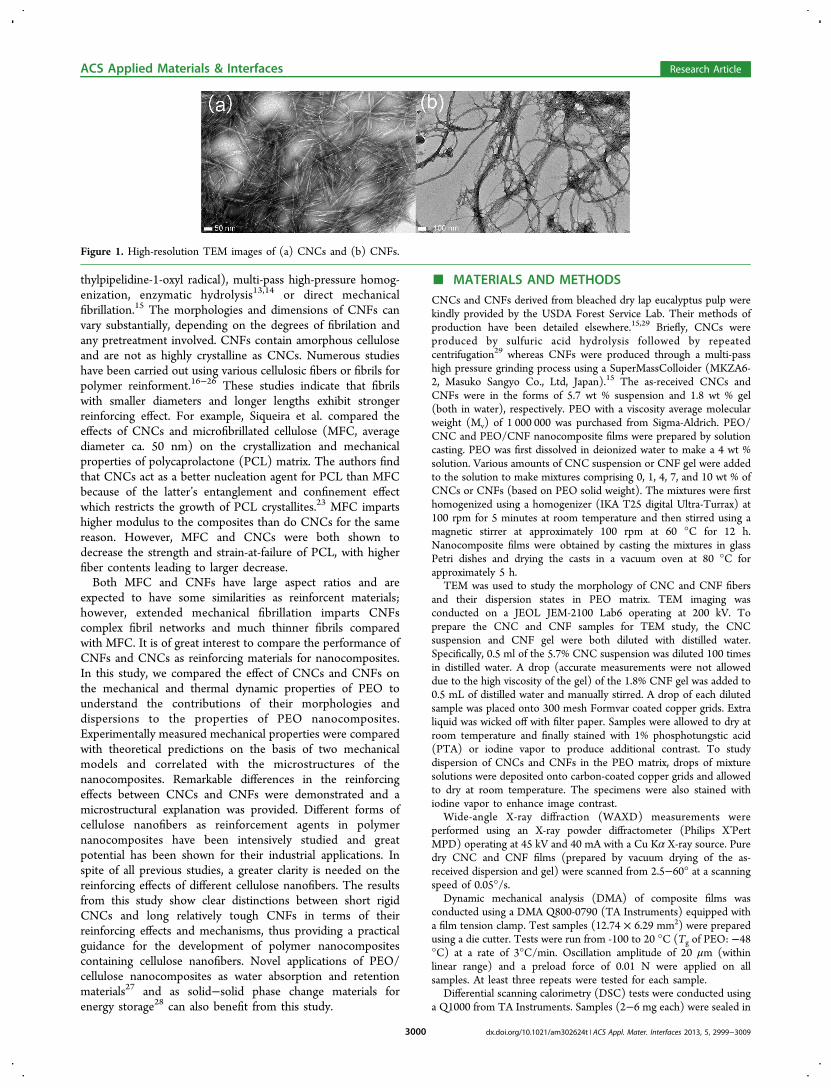
Figure 1. High-resolution TEM images of (a) CNCs and (b) CNFs.
ACS Applied Materials & Interfaces Research Article
dx.doi.org/10.1021/am302624t | ACS Appl. Mater. Interfaces 2013, 5, 2999−30093000
aluminum pans, tested under continuous nitrogen flow (50.0 mL/min), and scanned from 25 to 100 °C at a ramp rate of 10 °C/min.A Fourier transform infrared (FTIR) spectrometer (Nicolet 6700)
from Thermo Scientific was used to examine interactions between thenanofibers and the PEO matrix. Thirty-two repetitive scans with aresolution of 0.482 cm−1 were performed on each sample.Tensile tests were conducted using an Instron 5545 Tensile tester
equipped with a 100 N load cell. Tensile specimens were cut using adumbbell die with a width and length of 2 and 20 mm (narrow sectionof the die), respectively. The speed of testing was 20 cm/min. Tenspecimens were measured for each sample to get an average value.
■ RESULTS AND DISCUSSION
Morphology and Crystalline Structure of CNCs andCNFs. CNCs and CNFs show substantially different shapes andsizes in TEM micrographs (Figure 1). CNCs present a simpleneedle-like structure with an average length (L) of 151 ± 39nm, a width (w) of 19 ± 5 nm, and a resultant aspect ratio of L/w of 8 (based on 100 measurements from 5 micrographs).CNFs exhibit a complex, highly-entangled, web-like structure.Twisted/untwisted, curled/straight, and entangled/separatenanofibrils and their bundles with diameters ranging from 6to 100 nm in diameter can be identified from the micrograph.The highly entangled structure of CNFs significantly increasesresistance to flow and results in gel-like behavior of the as-received CNF sample. By contrast, the as-received CNCsuspension shows much lower viscosity than the CNF sampleeven at higher fiber concentration (5.7 vs. 1.8 wt %) because ofthe former’s low aspect ratio and lack of entanglement. GivenCNFs’ complex network morphology, it was difficult tomeasure the length and diameter of individual CNF withhigh accuracy. On the basis of the individual CNF and bundlesthat could be clearly identified from the micrographs, CNFsshow an average width and length of 20 ± 14 nm and 1030 ±334 nm (based on 50 measurements from 4 micrographs),resulting in an aspect ratio of L/w ≥ 52. Admittedly, the actualaspect ratio of CNFs in the composites might vary because ofthe existence of CNF bundles.X-ray diffraction patterns of CNCs and CNFs are compared
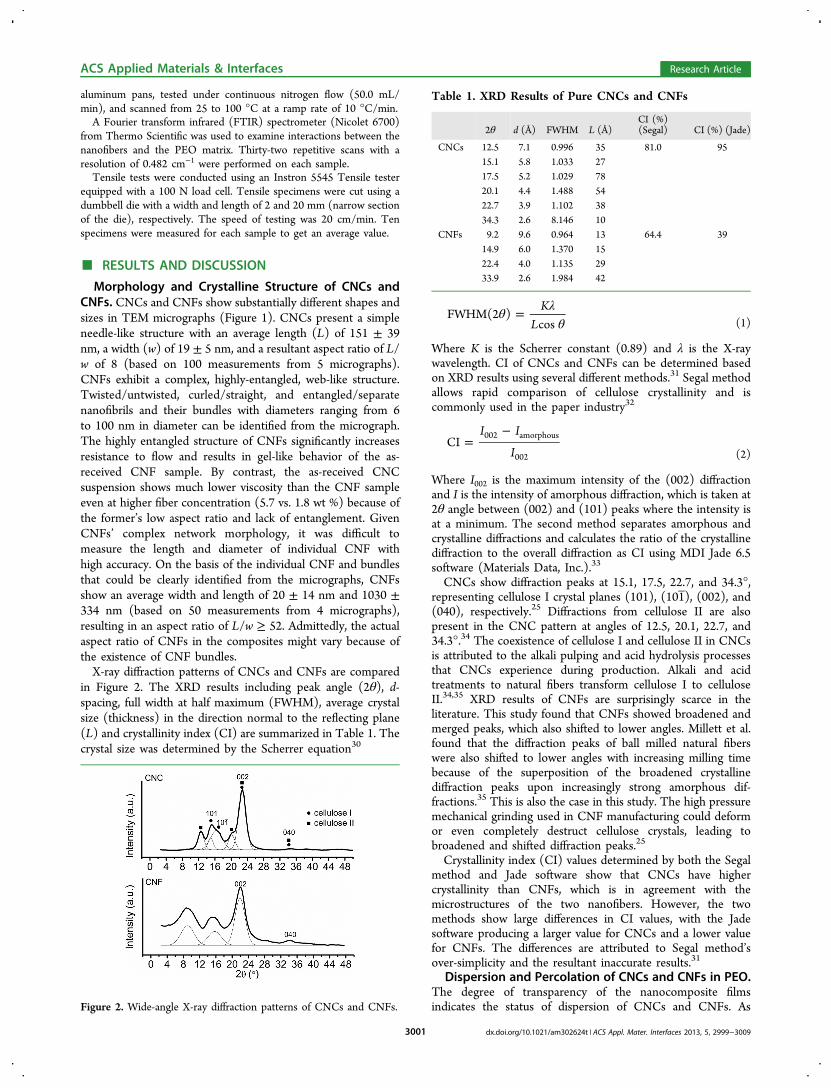
in Figure 2. The XRD results including peak angle (2θ), d-spacing, full width at half maximum (FWHM), average crystalsize (thickness) in the direction normal to the reflecting plane(L) and crystallinity index (CI) are summarized in Table 1. Thecrystal size was determined by the Scherrer equation30
θ λθ
= KL
FWHM(2 )cos (1)
Where K is the Scherrer constant (0.89) and λ is the X-raywavelength. CI of CNCs and CNFs can be determined basedon XRD results using several different methods.31 Segal methodallows rapid comparison of cellulose crystallinity and iscommonly used in the paper industry32
=−I I
ICI 002 amorphous
002 (2)
Where I002 is the maximum intensity of the (002) diffractionand I is the intensity of amorphous diffraction, which is taken at2θ angle between (002) and (101) peaks where the intensity isat a minimum. The second method separates amorphous andcrystalline diffractions and calculates the ratio of the crystallinediffraction to the overall diffraction as CI using MDI Jade 6.5software (Materials Data, Inc.).33
CNCs show diffraction peaks at 15.1, 17.5, 22.7, and 34.3°,representing cellulose I crystal planes (101), (101), (002), and(040), respectively.25 Diffractions from cellulose II are alsopresent in the CNC pattern at angles of 12.5, 20.1, 22.7, and34.3°.34 The coexistence of cellulose I and cellulose II in CNCsis attributed to the alkali pulping and acid hydrolysis processesthat CNCs experience during production. Alkali and acidtreatments to natural fibers transform cellulose I to celluloseII.34,35 XRD results of CNFs are surprisingly scarce in theliterature. This study found that CNFs showed broadened andmerged peaks, which also shifted to lower angles. Millett et al.found that the diffraction peaks of ball milled natural fiberswere also shifted to lower angles with increasing milling timebecause of the superposition of the broadened crystallinediffraction peaks upon increasingly strong amorphous dif-fractions.35 This is also the case in this study. The high pressuremechanical grinding used in CNF manufacturing could deformor even completely destruct cellulose crystals, leading tobroadened and shifted diffraction peaks.25
Crystallinity index (CI) values determined by both the Segalmethod and Jade software show that CNCs have highercrystallinity than CNFs, which is in agreement with themicrostructures of the two nanofibers. However, the twomethods show large differences in CI values, with the Jadesoftware producing a larger value for CNCs and a lower valuefor CNFs. The differences are attributed to Segal method’sover-simplicity and the resultant inaccurate results.31
Dispersion and Percolation of CNCs and CNFs in PEO.The degree of transparency of the nanocomposite filmsindicates the status of dispersion of CNCs and CNFs. AsFigure 2. Wide-angle X-ray diffraction patterns of CNCs and CNFs.
Table 1. XRD Results of Pure CNCs and CNFs
2θ d (Å) FWHM L (Å)CI (%)(Segal) CI (%) (Jade)
CNCs 12.5 7.1 0.996 35 81.0 9515.1 5.8 1.033 2717.5 5.2 1.029 7820.1 4.4 1.488 5422.7 3.9 1.102 3834.3 2.6 8.146 10
CNFs 9.2 9.6 0.964 13 64.4 3914.9 6.0 1.370 1522.4 4.0 1.135 2933.9 2.6 1.984 42
ACS Applied Materials & Interfaces Research Article
dx.doi.org/10.1021/am302624t | ACS Appl. Mater. Interfaces 2013, 5, 2999−30093001
shown in Figure 3, the PEO/CNC film was nearly opticallytransparent while the PEO/CNF film was translucent,
indicating CNCs’ smaller nanoparticle sizes and betterdispersion. A closer observation showed that PEO/CNCsexhibits higher transparency than does PEO/CNFs, most likelydue to CNCs’ smaller sizes and lack of agglomeration andentanglement. This property is advantageous to opticalapplications where several common nanocomposites (e.g.,carbon and clay naocomposites) can’t be used because oftheir lack of transparency.CNCs are seen homogeneously dispersed in the PEO matrix
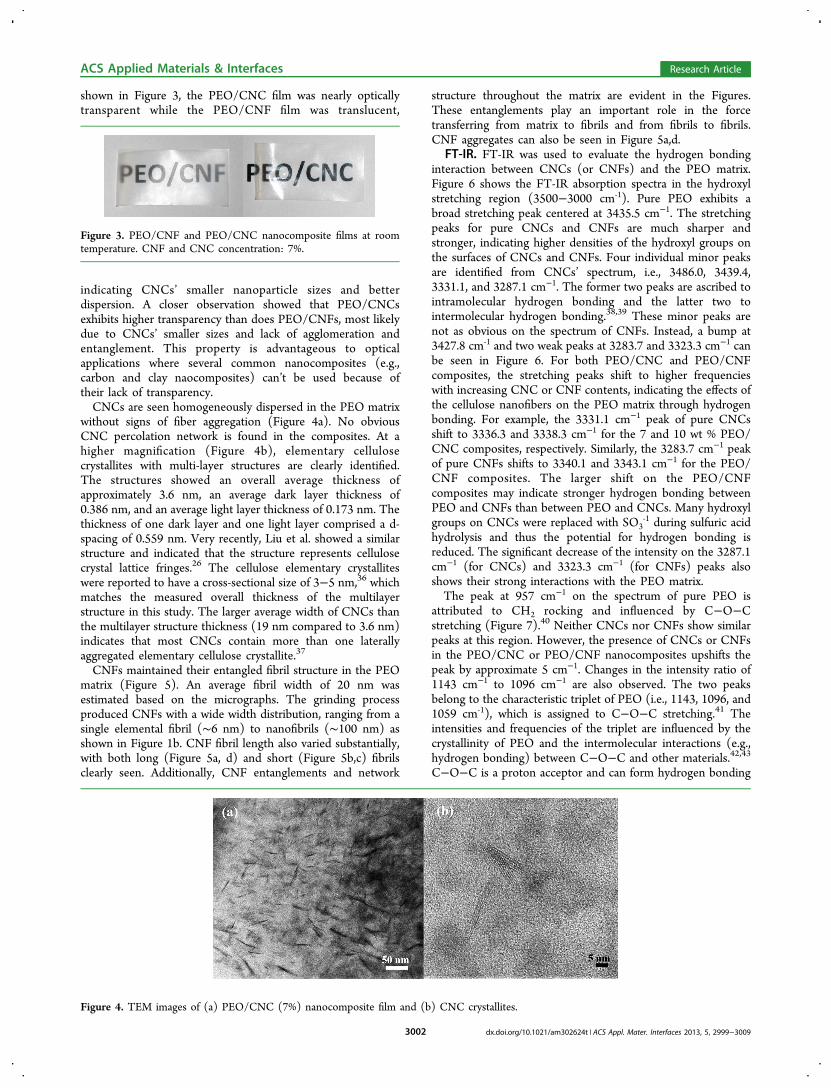
without signs of fiber aggregation (Figure 4a). No obviousCNC percolation network is found in the composites. At ahigher magnification (Figure 4b), elementary cellulosecrystallites with multi-layer structures are clearly identified.The structures showed an overall average thickness ofapproximately 3.6 nm, an average dark layer thickness of0.386 nm, and an average light layer thickness of 0.173 nm. Thethickness of one dark layer and one light layer comprised a d-spacing of 0.559 nm. Very recently, Liu et al. showed a similarstructure and indicated that the structure represents cellulosecrystal lattice fringes.26 The cellulose elementary crystalliteswere reported to have a cross-sectional size of 3−5 nm,36 whichmatches the measured overall thickness of the multilayerstructure in this study. The larger average width of CNCs thanthe multilayer structure thickness (19 nm compared to 3.6 nm)indicates that most CNCs contain more than one laterallyaggregated elementary cellulose crystallite.37
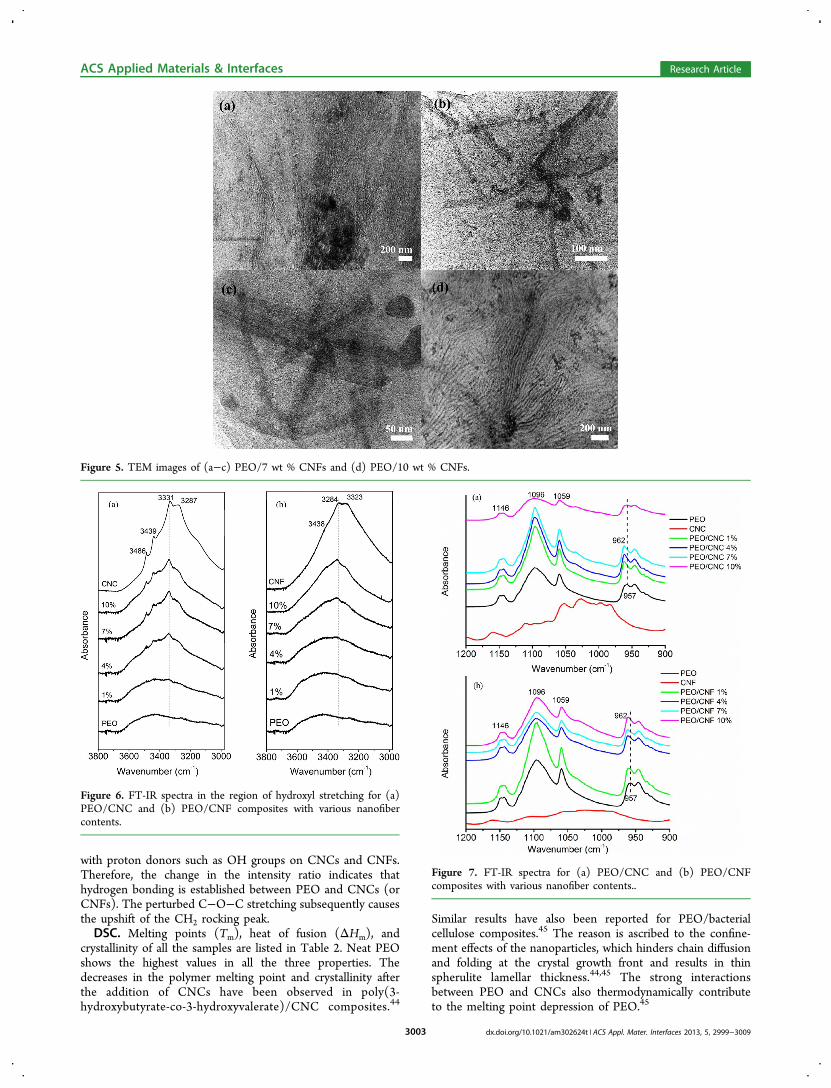
CNFs maintained their entangled fibril structure in the PEOmatrix (Figure 5). An average fibril width of 20 nm wasestimated based on the micrographs. The grinding processproduced CNFs with a wide width distribution, ranging from asingle elemental fibril (∼6 nm) to nanofibrils (∼100 nm) asshown in Figure 1b. CNF fibril length also varied substantially,with both long (Figure 5a, d) and short (Figure 5b,c) fibrilsclearly seen. Additionally, CNF entanglements and network
structure throughout the matrix are evident in the Figures.These entanglements play an important role in the forcetransferring from matrix to fibrils and from fibrils to fibrils.CNF aggregates can also be seen in Figure 5a,d.
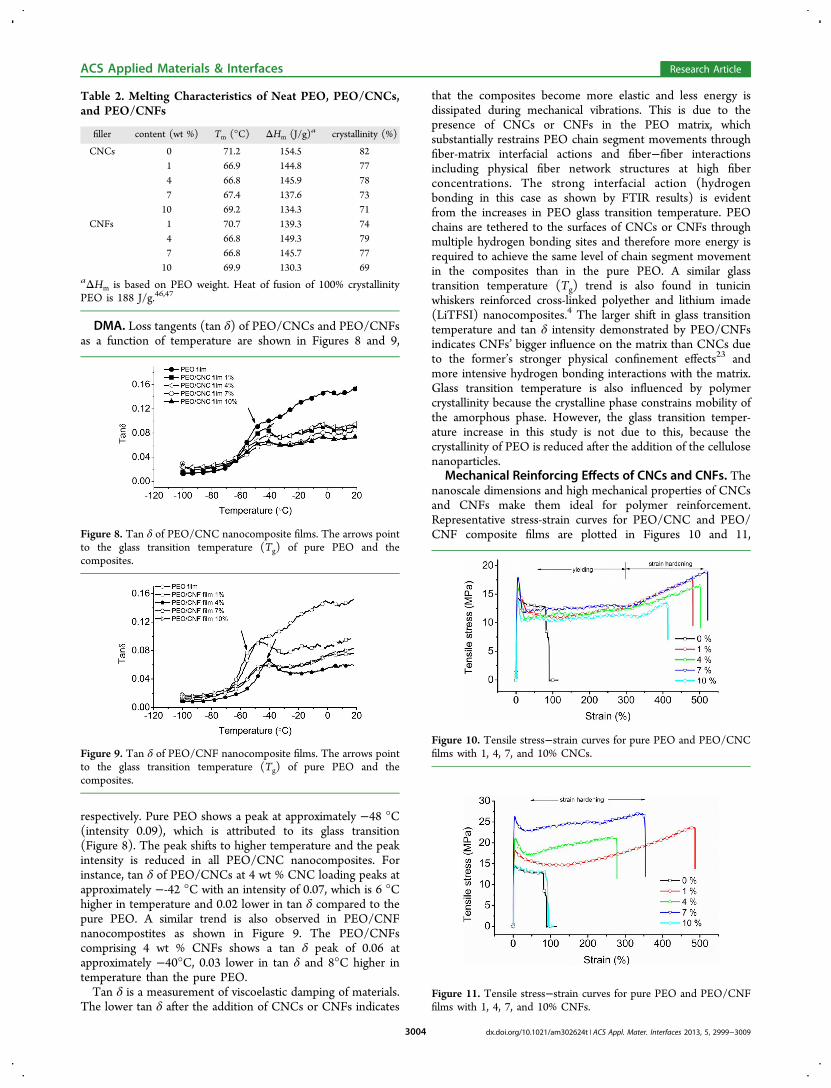
FT-IR. FT-IR was used to evaluate the hydrogen bondinginteraction between CNCs (or CNFs) and the PEO matrix.Figure 6 shows the FT-IR absorption spectra in the hydroxylstretching region (3500−3000 cm‑1). Pure PEO exhibits abroad stretching peak centered at 3435.5 cm−1. The stretchingpeaks for pure CNCs and CNFs are much sharper andstronger, indicating higher densities of the hydroxyl groups onthe surfaces of CNCs and CNFs. Four individual minor peaksare identified from CNCs’ spectrum, i.e., 3486.0, 3439.4,3331.1, and 3287.1 cm−1. The former two peaks are ascribed tointramolecular hydrogen bonding and the latter two tointermolecular hydrogen bonding.38,39 These minor peaks arenot as obvious on the spectrum of CNFs. Instead, a bump at3427.8 cm‑1 and two weak peaks at 3283.7 and 3323.3 cm−1 canbe seen in Figure 6. For both PEO/CNC and PEO/CNFcomposites, the stretching peaks shift to higher frequencieswith increasing CNC or CNF contents, indicating the effects ofthe cellulose nanofibers on the PEO matrix through hydrogenbonding. For example, the 3331.1 cm−1 peak of pure CNCsshift to 3336.3 and 3338.3 cm−1 for the 7 and 10 wt % PEO/CNC composites, respectively. Similarly, the 3283.7 cm−1 peakof pure CNFs shifts to 3340.1 and 3343.1 cm−1 for the PEO/CNF composites. The larger shift on the PEO/CNFcomposites may indicate stronger hydrogen bonding betweenPEO and CNFs than between PEO and CNCs. Many hydroxylgroups on CNCs were replaced with SO3
‑1 during sulfuric acidhydrolysis and thus the potential for hydrogen bonding isreduced. The significant decrease of the intensity on the 3287.1cm−1 (for CNCs) and 3323.3 cm−1 (for CNFs) peaks alsoshows their strong interactions with the PEO matrix.The peak at 957 cm−1 on the spectrum of pure PEO is
attributed to CH2 rocking and influenced by C−O−Cstretching (Figure 7).40 Neither CNCs nor CNFs show similarpeaks at this region. However, the presence of CNCs or CNFsin the PEO/CNC or PEO/CNF nanocomposites upshifts thepeak by approximate 5 cm−1. Changes in the intensity ratio of1143 cm−1 to 1096 cm−1 are also observed. The two peaksbelong to the characteristic triplet of PEO (i.e., 1143, 1096, and1059 cm‑1), which is assigned to C−O−C stretching.41 Theintensities and frequencies of the triplet are influenced by thecrystallinity of PEO and the intermolecular interactions (e.g.,hydrogen bonding) between C−O−C and other materials.42,43
C−O−C is a proton acceptor and can form hydrogen bonding
Figure 3. PEO/CNF and PEO/CNC nanocomposite films at roomtemperature. CNF and CNC concentration: 7%.
Figure 4. TEM images of (a) PEO/CNC (7%) nanocomposite film and (b) CNC crystallites.
ACS Applied Materials & Interfaces Research Article
dx.doi.org/10.1021/am302624t | ACS Appl. Mater. Interfaces 2013, 5, 2999−30093002
with proton donors such as OH groups on CNCs and CNFs.Therefore, the change in the intensity ratio indicates thathydrogen bonding is established between PEO and CNCs (orCNFs). The perturbed C−O−C stretching subsequently causesthe upshift of the CH2 rocking peak.DSC. Melting points (Tm), heat of fusion (ΔHm), and
crystallinity of all the samples are listed in Table 2. Neat PEOshows the highest values in all the three properties. Thedecreases in the polymer melting point and crystallinity afterthe addition of CNCs have been observed in poly(3-hydroxybutyrate-co-3-hydroxyvalerate)/CNC composites.44
Similar results have also been reported for PEO/bacterialcellulose composites.45 The reason is ascribed to the confine-ment effects of the nanoparticles, which hinders chain diffusionand folding at the crystal growth front and results in thinspherulite lamellar thickness.44,45 The strong interactionsbetween PEO and CNCs also thermodynamically contributeto the melting point depression of PEO.45
Figure 5. TEM images of (a−c) PEO/7 wt % CNFs and (d) PEO/10 wt % CNFs.
Figure 6. FT-IR spectra in the region of hydroxyl stretching for (a)PEO/CNC and (b) PEO/CNF composites with various nanofibercontents.
Figure 7. FT-IR spectra for (a) PEO/CNC and (b) PEO/CNFcomposites with various nanofiber contents..
ACS Applied Materials & Interfaces Research Article
dx.doi.org/10.1021/am302624t | ACS Appl. Mater. Interfaces 2013, 5, 2999−30093003
DMA. Loss tangents (tan δ) of PEO/CNCs and PEO/CNFsas a function of temperature are shown in Figures 8 and 9,
respectively. Pure PEO shows a peak at approximately −48 °C(intensity 0.09), which is attributed to its glass transition(Figure 8). The peak shifts to higher temperature and the peakintensity is reduced in all PEO/CNC nanocomposites. Forinstance, tan δ of PEO/CNCs at 4 wt % CNC loading peaks atapproximately −-42 °C with an intensity of 0.07, which is 6 °Chigher in temperature and 0.02 lower in tan δ compared to thepure PEO. A similar trend is also observed in PEO/CNFnanocompostites as shown in Figure 9. The PEO/CNFscomprising 4 wt % CNFs shows a tan δ peak of 0.06 atapproximately −40°C, 0.03 lower in tan δ and 8°C higher intemperature than the pure PEO.Tan δ is a measurement of viscoelastic damping of materials.
The lower tan δ after the addition of CNCs or CNFs indicates
that the composites become more elastic and less energy isdissipated during mechanical vibrations. This is due to thepresence of CNCs or CNFs in the PEO matrix, whichsubstantially restrains PEO chain segment movements throughfiber-matrix interfacial actions and fiber−fiber interactionsincluding physical fiber network structures at high fiberconcentrations. The strong interfacial action (hydrogenbonding in this case as shown by FTIR results) is evidentfrom the increases in PEO glass transition temperature. PEOchains are tethered to the surfaces of CNCs or CNFs throughmultiple hydrogen bonding sites and therefore more energy isrequired to achieve the same level of chain segment movementin the composites than in the pure PEO. A similar glasstransition temperature (Tg) trend is also found in tunicinwhiskers reinforced cross-linked polyether and lithium imade(LiTFSI) nanocomposites.4 The larger shift in glass transitiontemperature and tan δ intensity demonstrated by PEO/CNFsindicates CNFs’ bigger influence on the matrix than CNCs dueto the former’s stronger physical confinement effects23 andmore intensive hydrogen bonding interactions with the matrix.Glass transition temperature is also influenced by polymercrystallinity because the crystalline phase constrains mobility ofthe amorphous phase. However, the glass transition temper-ature increase in this study is not due to this, because thecrystallinity of PEO is reduced after the addition of the cellulosenanoparticles.
Mechanical Reinforcing Effects of CNCs and CNFs. Thenanoscale dimensions and high mechanical properties of CNCsand CNFs make them ideal for polymer reinforcement.Representative stress-strain curves for PEO/CNC and PEO/CNF composite films are plotted in Figures 10 and 11,
Table 2. Melting Characteristics of Neat PEO, PEO/CNCs,and PEO/CNFs
filler content (wt %) Tm (°C) ΔHm (J/g)a crystallinity (%)
CNCs 0 71.2 154.5 821 66.9 144.8 774 66.8 145.9 787 67.4 137.6 7310 69.2 134.3 71
CNFs 1 70.7 139.3 744 66.8 149.3 797 66.8 145.7 7710 69.9 130.3 69
aΔHm is based on PEO weight. Heat of fusion of 100% crystallinityPEO is 188 J/g.46,47
Figure 8. Tan δ of PEO/CNC nanocomposite films. The arrows pointto the glass transition temperature (Tg) of pure PEO and thecomposites.
Figure 9. Tan δ of PEO/CNF nanocomposite films. The arrows pointto the glass transition temperature (Tg) of pure PEO and thecomposites.
Figure 10. Tensile stress−strain curves for pure PEO and PEO/CNCfilms with 1, 4, 7, and 10% CNCs.
Figure 11. Tensile stress−strain curves for pure PEO and PEO/CNFfilms with 1, 4, 7, and 10% CNFs.
ACS Applied Materials & Interfaces Research Article
dx.doi.org/10.1021/am302624t | ACS Appl. Mater. Interfaces 2013, 5, 2999−30093004
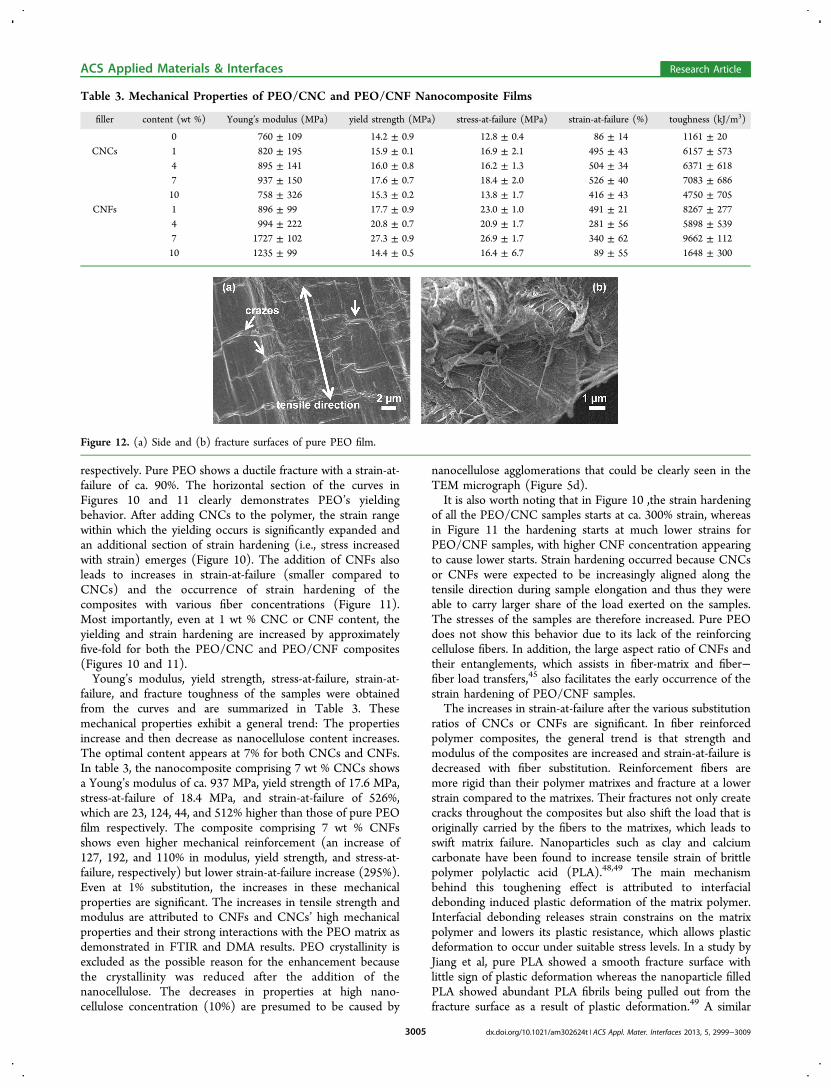
respectively. Pure PEO shows a ductile fracture with a strain-at-failure of ca. 90%. The horizontal section of the curves inFigures 10 and 11 clearly demonstrates PEO’s yieldingbehavior. After adding CNCs to the polymer, the strain rangewithin which the yielding occurs is significantly expanded andan additional section of strain hardening (i.e., stress increasedwith strain) emerges (Figure 10). The addition of CNFs alsoleads to increases in strain-at-failure (smaller compared toCNCs) and the occurrence of strain hardening of thecomposites with various fiber concentrations (Figure 11).Most importantly, even at 1 wt % CNC or CNF content, theyielding and strain hardening are increased by approximatelyfive-fold for both the PEO/CNC and PEO/CNF composites(Figures 10 and 11).Young’s modulus, yield strength, stress-at-failure, strain-at-
failure, and fracture toughness of the samples were obtainedfrom the curves and are summarized in Table 3. Thesemechanical properties exhibit a general trend: The propertiesincrease and then decrease as nanocellulose content increases.The optimal content appears at 7% for both CNCs and CNFs.In table 3, the nanocomposite comprising 7 wt % CNCs showsa Young’s modulus of ca. 937 MPa, yield strength of 17.6 MPa,stress-at-failure of 18.4 MPa, and strain-at-failure of 526%,which are 23, 124, 44, and 512% higher than those of pure PEOfilm respectively. The composite comprising 7 wt % CNFsshows even higher mechanical reinforcement (an increase of127, 192, and 110% in modulus, yield strength, and stress-at-failure, respectively) but lower strain-at-failure increase (295%).Even at 1% substitution, the increases in these mechanicalproperties are significant. The increases in tensile strength andmodulus are attributed to CNFs and CNCs’ high mechanicalproperties and their strong interactions with the PEO matrix asdemonstrated in FTIR and DMA results. PEO crystallinity isexcluded as the possible reason for the enhancement becausethe crystallinity was reduced after the addition of thenanocellulose. The decreases in properties at high nano-cellulose concentration (10%) are presumed to be caused by
nanocellulose agglomerations that could be clearly seen in theTEM micrograph (Figure 5d).It is also worth noting that in Figure 10 ,the strain hardening
of all the PEO/CNC samples starts at ca. 300% strain, whereasin Figure 11 the hardening starts at much lower strains forPEO/CNF samples, with higher CNF concentration appearingto cause lower starts. Strain hardening occurred because CNCsor CNFs were expected to be increasingly aligned along thetensile direction during sample elongation and thus they wereable to carry larger share of the load exerted on the samples.The stresses of the samples are therefore increased. Pure PEOdoes not show this behavior due to its lack of the reinforcingcellulose fibers. In addition, the large aspect ratio of CNFs andtheir entanglements, which assists in fiber-matrix and fiber−fiber load transfers,45 also facilitates the early occurrence of thestrain hardening of PEO/CNF samples.The increases in strain-at-failure after the various substitution
ratios of CNCs or CNFs are significant. In fiber reinforcedpolymer composites, the general trend is that strength andmodulus of the composites are increased and strain-at-failure isdecreased with fiber substitution. Reinforcement fibers aremore rigid than their polymer matrixes and fracture at a lowerstrain compared to the matrixes. Their fractures not only createcracks throughout the composites but also shift the load that isoriginally carried by the fibers to the matrixes, which leads toswift matrix failure. Nanoparticles such as clay and calciumcarbonate have been found to increase tensile strain of brittlepolymer polylactic acid (PLA).48,49 The main mechanismbehind this toughening effect is attributed to interfacialdebonding induced plastic deformation of the matrix polymer.Interfacial debonding releases strain constrains on the matrixpolymer and lowers its plastic resistance, which allows plasticdeformation to occur under suitable stress levels. In a study byJiang et al, pure PLA showed a smooth fracture surface withlittle sign of plastic deformation whereas the nanoparticle filledPLA showed abundant PLA fibrils being pulled out from thefracture surface as a result of plastic deformation.49 A similar
Table 3. Mechanical Properties of PEO/CNC and PEO/CNF Nanocomposite Films
filler content (wt %) Young’s modulus (MPa) yield strength (MPa) stress-at-failure (MPa) strain-at-failure (%) toughness (kJ/m3)
0 760 ± 109 14.2 ± 0.9 12.8 ± 0.4 86 ± 14 1161 ± 20CNCs 1 820 ± 195 15.9 ± 0.1 16.9 ± 2.1 495 ± 43 6157 ± 573
4 895 ± 141 16.0 ± 0.8 16.2 ± 1.3 504 ± 34 6371 ± 6187 937 ± 150 17.6 ± 0.7 18.4 ± 2.0 526 ± 40 7083 ± 68610 758 ± 326 15.3 ± 0.2 13.8 ± 1.7 416 ± 43 4750 ± 705
CNFs 1 896 ± 99 17.7 ± 0.9 23.0 ± 1.0 491 ± 21 8267 ± 2774 994 ± 222 20.8 ± 0.7 20.9 ± 1.7 281 ± 56 5898 ± 5397 1727 ± 102 27.3 ± 0.9 26.9 ± 1.7 340 ± 62 9662 ± 11210 1235 ± 99 14.4 ± 0.5 16.4 ± 6.7 89 ± 55 1648 ± 300
Figure 12. (a) Side and (b) fracture surfaces of pure PEO film.
ACS Applied Materials & Interfaces Research Article
dx.doi.org/10.1021/am302624t | ACS Appl. Mater. Interfaces 2013, 5, 2999−30093005
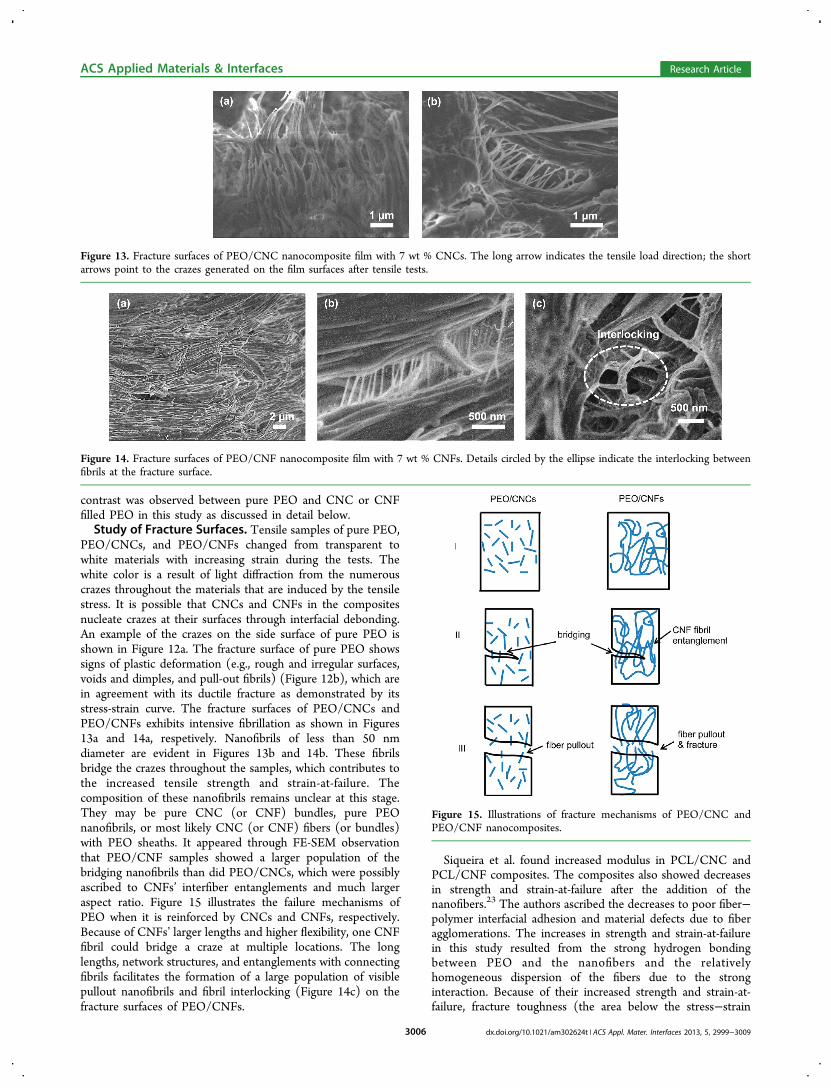
contrast was observed between pure PEO and CNC or CNFfilled PEO in this study as discussed in detail below.Study of Fracture Surfaces. Tensile samples of pure PEO,
PEO/CNCs, and PEO/CNFs changed from transparent towhite materials with increasing strain during the tests. Thewhite color is a result of light diffraction from the numerouscrazes throughout the materials that are induced by the tensilestress. It is possible that CNCs and CNFs in the compositesnucleate crazes at their surfaces through interfacial debonding.An example of the crazes on the side surface of pure PEO isshown in Figure 12a. The fracture surface of pure PEO showssigns of plastic deformation (e.g., rough and irregular surfaces,voids and dimples, and pull-out fibrils) (Figure 12b), which arein agreement with its ductile fracture as demonstrated by itsstress-strain curve. The fracture surfaces of PEO/CNCs andPEO/CNFs exhibits intensive fibrillation as shown in Figures13a and 14a, respetively. Nanofibrils of less than 50 nmdiameter are evident in Figures 13b and 14b. These fibrilsbridge the crazes throughout the samples, which contributes tothe increased tensile strength and strain-at-failure. Thecomposition of these nanofibrils remains unclear at this stage.They may be pure CNC (or CNF) bundles, pure PEOnanofibrils, or most likely CNC (or CNF) fibers (or bundles)with PEO sheaths. It appeared through FE-SEM observationthat PEO/CNF samples showed a larger population of thebridging nanofibrils than did PEO/CNCs, which were possiblyascribed to CNFs’ interfiber entanglements and much largeraspect ratio. Figure 15 illustrates the failure mechanisms ofPEO when it is reinforced by CNCs and CNFs, respectively.Because of CNFs’ larger lengths and higher flexibility, one CNFfibril could bridge a craze at multiple locations. The longlengths, network structures, and entanglements with connectingfibrils facilitates the formation of a large population of visiblepullout nanofibrils and fibril interlocking (Figure 14c) on thefracture surfaces of PEO/CNFs.
Siqueira et al. found increased modulus in PCL/CNC andPCL/CNF composites. The composites also showed decreasesin strength and strain-at-failure after the addition of thenanofibers.23 The authors ascribed the decreases to poor fiber−polymer interfacial adhesion and material defects due to fiberagglomerations. The increases in strength and strain-at-failurein this study resulted from the strong hydrogen bondingbetween PEO and the nanofibers and the relativelyhomogeneous dispersion of the fibers due to the stronginteraction. Because of their increased strength and strain-at-failure, fracture toughness (the area below the stress−strain
Figure 13. Fracture surfaces of PEO/CNC nanocomposite film with 7 wt % CNCs. The long arrow indicates the tensile load direction; the shortarrows point to the crazes generated on the film surfaces after tensile tests.
Figure 14. Fracture surfaces of PEO/CNF nanocomposite film with 7 wt % CNFs. Details circled by the ellipse indicate the interlocking betweenfibrils at the fracture surface.
Figure 15. Illustrations of fracture mechanisms of PEO/CNC andPEO/CNF nanocomposites.
ACS Applied Materials & Interfaces Research Article
dx.doi.org/10.1021/am302624t | ACS Appl. Mater. Interfaces 2013, 5, 2999−30093006
curves) of the PEO/CNC and PEO/CNF nanocompositescomprising 7 wt % cellulose nanofibers were 610% and 832%larger, respectively, than that of pure PEO.Mechanical Property Modeling. The Halpin-Kardos
model and the Ouali model were used to simulate the moduliof the composites and their results were compared with theexperimental values. The Halpin-Kardos model is a semi-empirical model for oriented short fiber composites50
η ζφ
η φ=
+
−E E
1
1mf
f (3)
η φη φ
=+−⊥
⊥
⊥E E
1 2
1mf
f (4)
where,
ηζ
=−
+
1EEEE
f
m
f
m (5)
η =−
+⊥
1
2
EEEE
f
m
f
m (6)
where E∥ and E⊥ are the longitudinal and transverse Young’smodulus of the unidirectional composite, φf is the fiber volumefraction, E− is the Young’s modulus of the matrix, and −f is themodulus of the fiber. ζ is a shape factor dependent on fibergeometry and orientation. Different equations have beenproposed to calculate ζ. Equation ζ = 2L/w is used forrelatively short fibers such as CNCs.51,52 Equation ζ = (0.5L/w)1.8 is proposed by Van Es for high aspect ratio fibers.53 Themodulus of a 3D randomly oriented composite (EC) can becalculated based on the laminate theory53
= + ⊥E E E0.184 0.816C (7)
The Ouali model is based on the percolation theory and is anextension of the phenomenological series-parallel modelproposed by Takayanagi.54−56 The Ouali model simulatespolymer composites using three phases: matrix, percolatingfiller network, and non-percolating filler phase. The model isgiven by the following equation
ψ ψφ φ ψ
φ φ ψ=
− + + −
− + −E
E E E
E E
(1 2 ) (1 )
(1 ) ( )f f
Cm f f
2
f f f m (8)
where the subscripts f and m refer to the filler and matrixphases, φf is the volume fraction of the filler, and E is themodulus. ψ denotes the volume fraction of the percolating fillernetwork and is obtained from
ψ φ φ= ≤0 f c (9)
ψ φφ φ
φφ φ=
−−
>⎛⎝⎜⎜
⎞⎠⎟⎟1f
f c
c
b
f c(10)
where b is the critical percolation exponent and a value of 0.4 isused for a three-dimensional network.54,55 φc is the criticalpercolation threshold (volume fraction)57
φ = L w0.7/( / )c (11)
where L and w are the length and diameter of the filler,respectively. φc for CNCs and CNFs were calculated to be 8.75and 1.35 vol% (12.7 and 1.8 wt %), respectively, when usingPEO density of 1.2 g/cm3 and CNC (or CNF) density of 1.59g/cm3. The modulus of PEO (Em) was taken as 760 MPa basedon the tensile results. The modulus of CNCs variesconsiderably (50−200 GPa) depending on the methods usedto measure the property, types of cellulose (i.e. cellulose I orII), and the ratio between the two cellulose.58−60 The modulusof CNFs is scarce in literature. A value of 78 ± 17 GPa wasobtained for a single bacterial cellulose nanofibril using anatomic force microscopy tip bending method.61 On the basis ofthe modulus of wood-derived CNF films (30 GPa),62 values of90 and 80 GPa can be obtained for a single nanofibril using theefficiency factors proposed by Cox63 and Krenchel,64
respectively. Most recently, using Raman spectroscopy theeffective moduli of single fibrils of bacterial cellulose and CNFswere estimated to be ∼84 and ∼33 GPa, respectively.65 In thisstudy, a value of 145 GPa for CNCs60 and 78 GPa for CNFswere used for theoretical modeling.The experimental moduli of PEO/CNCs and PEO/CNFs
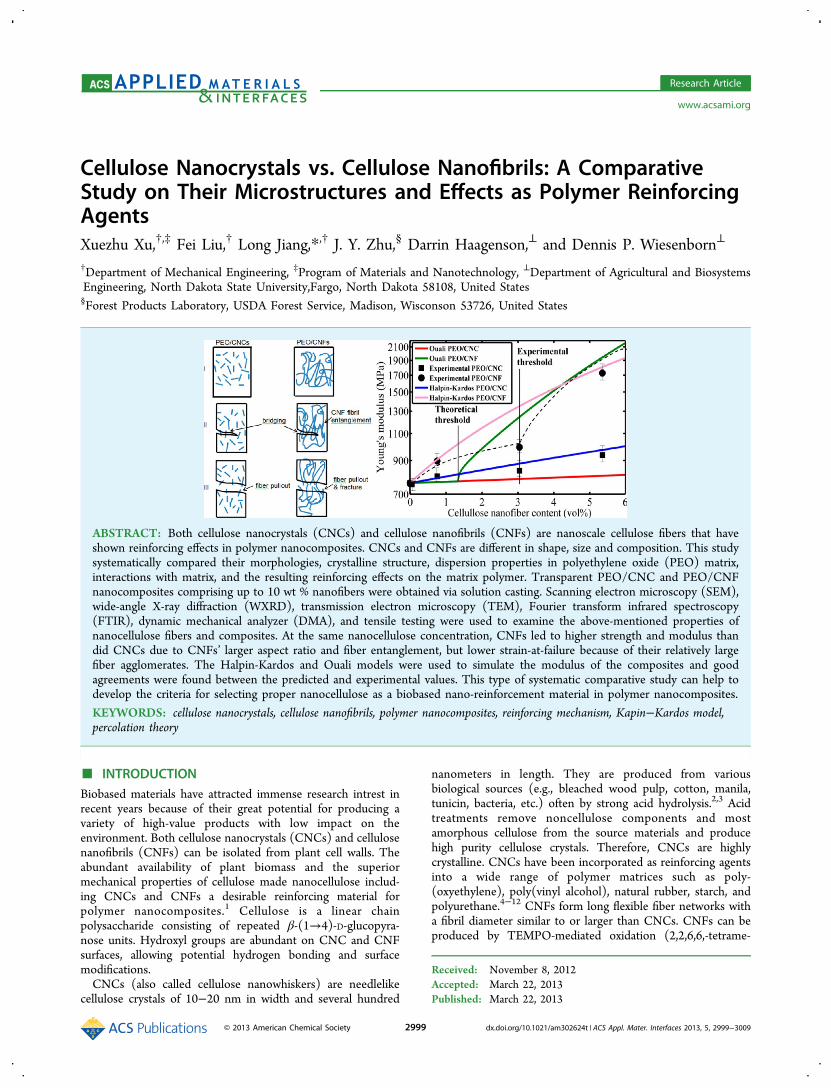
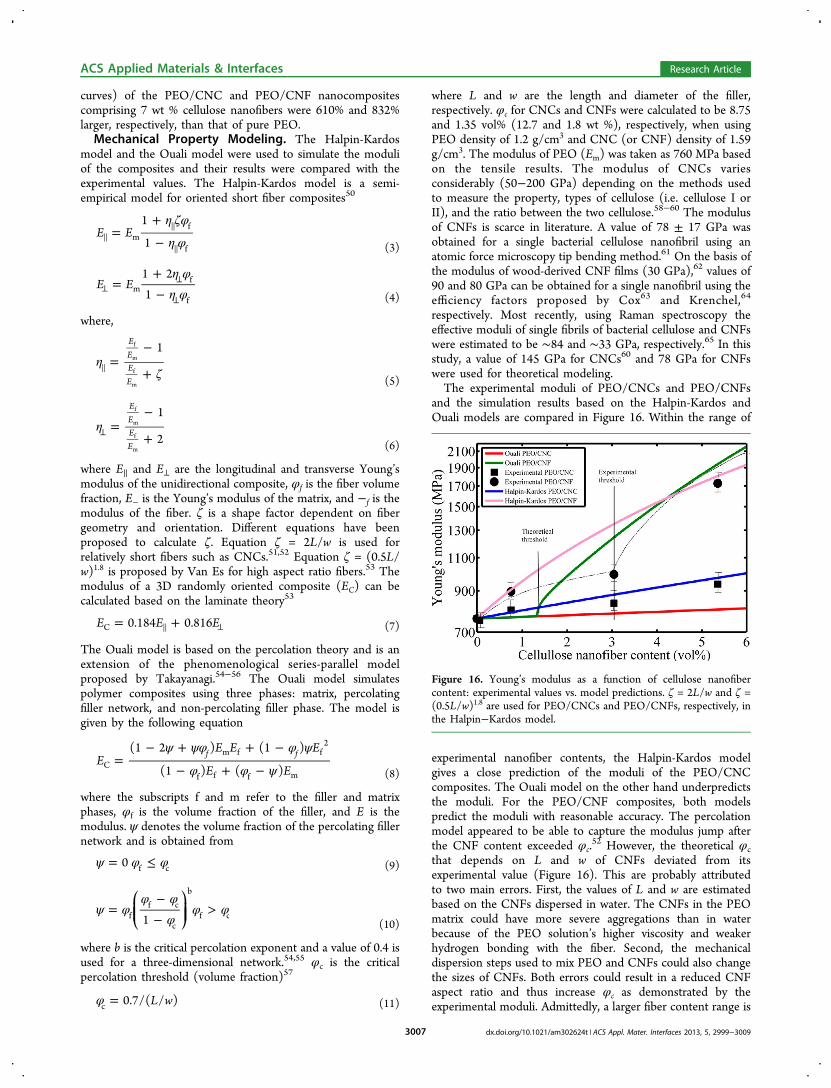
and the simulation results based on the Halpin-Kardos andOuali models are compared in Figure 16. Within the range of
experimental nanofiber contents, the Halpin-Kardos modelgives a close prediction of the moduli of the PEO/CNCcomposites. The Ouali model on the other hand underpredictsthe moduli. For the PEO/CNF composites, both modelspredict the moduli with reasonable accuracy. The percolationmodel appeared to be able to capture the modulus jump afterthe CNF content exceeded φc.
52 However, the theoretical φcthat depends on L and w of CNFs deviated from itsexperimental value (Figure 16). This are probably attributedto two main errors. First, the values of L and w are estimatedbased on the CNFs dispersed in water. The CNFs in the PEOmatrix could have more severe aggregations than in waterbecause of the PEO solution’s higher viscosity and weakerhydrogen bonding with the fiber. Second, the mechanicaldispersion steps used to mix PEO and CNFs could also changethe sizes of CNFs. Both errors could result in a reduced CNFaspect ratio and thus increase φc as demonstrated by theexperimental moduli. Admittedly, a larger fiber content range is
Figure 16. Young’s modulus as a function of cellulose nanofibercontent: experimental values vs. model predictions. ζ = 2L/w and ζ =(0.5L/w)1.8 are used for PEO/CNCs and PEO/CNFs, respectively, inthe Halpin−Kardos model.
ACS Applied Materials & Interfaces Research Article
dx.doi.org/10.1021/am302624t | ACS Appl. Mater. Interfaces 2013, 5, 2999−30093007
required to better compare the accuracy of the two models,especially for the results of the PEO/CNF composites.Nevertheless, the range is limited within 10 wt % in thisstudy because fiber agglomerations occur when the fibercontent exceeds 7 wt %.The Halpin−Kardos model is based on self-consistent theory
by considering a single fiber encased in a cylindrical shell ofmatrix.49 Interactions between fibers are not considered in thismodel. Takayanagi developed a phenomenological model tocalculate the modulus of a multi-phase polymer system bysymbolizing the system with serial/parallel phases. Oualiextended the Takayanagi model by adding a percolating fillernetwork phase (in parallel) to a series part comprising a matrixphase and a nonpercolating filler phase.54 When the volumeratio of filler exceeds its percolation threshold, filler−fillerinteractions are taken into account through the percolating fillerphase in Ouali’s model. Both Halpin−Kardos and Ouali modelsassume perfect filler−matrix bonding. Our results show that theHalpin−Kardos model is accurate for short fiber composites(i.e., PEO/CNCs) whose filler−filler interactions are negligible(i.e., filler concentration below percolation threshold). It fails tocapture the modulus jump in long fiber composites (i.e., PEO/CNFs) above the filler percolation threshold because filler−filler interactions are not considered in this model. In contrast,the Ouali model predicts the trend of the modulus of PEO/CNFs. One may expect that the Ouali model provides higherprediction accuracy than does the Halpin−Kardos model whenthe fiber concentration exceeds the tested range. The differencein the prediction results highlights the importance of filler−filler interactions to the properties of the composites containinghigh concentrations of fillers.In Figure 16, both model predictions and experimental values
show that CNFs lead to higher composite moduli than doCNCs at the same fiber contents. This is mainly due to CNFs’larger aspect ratio as evidenced by the model equations. Theextensive CNF fiber entanglements and percolation networkswhich are cemented together through hydrogen bonds andmechanical interlocking in the PEO matrix also contributes tothe high moduli. These results have important implications indeveloping new polymer composites. The high strength andmodulus of short fibers are often underused because theiraspect ratios are too small to enable a full-scale stress transferfrom the matrixes to the fibers.66 As a result, long fibers withrelatively low strength and modulus can outperform short high-strength fibers in reinforcing composites. Moreover, long fibersreach percolation at low fiber contents. The fiber−fiberinteractions caused by the percolation contribute to furtherimprovement in the mechanic properties of composites.Therefore in searching for the right fibers for reinforcement,fiber aspect ratio should outweigh fiber strength as a moreimportant consideration factor. This priority also has itseconomic benefits because low strength fibers are generallyless costly.
■ CONCLUSIONSA systematic comparison between CNCs and CNFs was madein this study with focus on their microstructures, interfacialbonding with the PEO matrix, and the resulting effects on thedynamic and mechanical properties of the PEO/CNC andPEO/CNF nanocomposites. The nanocomposites containingup to 10 wt % nanocellulose were prepared by simple solutioncasting. The maximum strength, modulus and fracturetoughness of the composites were found to occur at 7 wt %
fiber content for both CNCs and CNFs. The increases wereattributed to strong fiber-matrix interfacial bonding and largeaspect ratios of the fibers. CNFs led to higher strength andmodulus than did CNCs at the same fiber concentration due toCNFs’ much larger aspect ratio and their percolation networks.The entanglements and percolation of CNFs also resulted intheir higher probability of fiber agglomeration compared toCNCs, which caused lower strain-at-failure for PEO/CNFcomposites. The moduli of the composites were simulatedusing two models and their accuracies were compared. TheOuali model was found to be more accurate for PEO/CNFcomposites, whereas the Halpin-Kardos model was moresuitable for PEO/CNC composites. The results from thiscomparative study are important for proper selection ofnanocellulose materials as reinforcing agents in polymercomposites.
■ AUTHOR INFORMATIONCorresponding Author*E-mail: [email protected]. Tel: +1 (701) 231 9512. Fax: +1(701) 231 8913.NotesThe authors declare no competing financial interest.
■ ACKNOWLEDGMENTSThe authors thank Prof. Chad Ulven, Dr. Shanshan Huo,Jessica L. Lattimer and Tingting Zhou for their assistance withthe DMA tests. The authors are also grateful to Scott A. Payneand Moore Jayma for performing SEM and TEM. QianQianWang, a visiting student at the USDA Forest Service, ForestProducts lab, is also appreciated for producing the CNC andCNF samples. Financial support from North Dakota EPSCoRis greatly appreciated.
■ REFERENCES(1) Siqueira, G.; Bras, J.; Dufresne, A. Polymers 2010, 2, 728−765.(2) Habibi, Y.; Lucia, L. A.; Rojas, O. J. Chem. Rev. 2010, 110, 3479−3500.(3) Wang, Q. Q.; Zhu, J. Y.; Reiner, R. S.; Verrill, S. P.; Baxa, U.;McNeil, S. E. Cellulose 2012, 19, 2033−2047.(4) Samir, M. A. S. A.; Alloin, F.; Paillet, M.; Dufresne, A.Macromolecules 2004, 37, 4313−4316.(5) Samir, A.; Alloin, F.; Sanchez, J.; Kissi, N. E.; Dufresne, A.Macromolecules 2004, 37, 1386−1393.(6) Park, W. I.; Kang, M.; Kim, H. S.; Jin, H. J. Macromol. Symp.2007, 249-250, 289−294.(7) Cao, X.; Chen, Y.; Chang, P. R.; Muir, A. D.; Falk, G. ExpressPolym. Lett. 2008, 2, 502−510.(8) Qi, H.; Cai, J.; Zhang, L.; Kuga, S. Biomacromolecules 2009, 10,1597−1602.(9) Peresin, M. S.; Habibi, Y.; Zoppe, J. O.; Pawlak, J. J.; Rojas, O. J.Biomacromolecules 2010, 11, 674−681.(10) Cao, X.; Dong, H.; Li, C. M. Biomacromolecules 2007, 8, 899−904.(11) Siqueira, G.; Abdillahi, H.; Bras, J.; Dufresne, A. Cellulose 2009,17, 289−298.(12) Guhados, G.; Wan, W.; Hutter, J. L. Langmuir 2005, 21, 6642−6646.(13) Henriksson, M.; Berglund, L. A.; Isaksson, P.; Lindstrom, T.;Nishino, T. Biomacromolecules 2008, 9, 1579−1585.(14) Iwamoto, S.; Nakagaito, A. N.; Yano, H. Appl. Phys. A 2007, 89,461−466.(15) Wang, Q. Q.; Zhu, J. Y.; Gleisner, R.; Kuster, T. A.; Baxa, U.;McNeil, S. E. Cellulose 2012, 19, 1631−1643.(16) Chinga-Carrasco, G. Nanoscale Res. Lett. 2011, 6, 417.
ACS Applied Materials & Interfaces Research Article
dx.doi.org/10.1021/am302624t | ACS Appl. Mater. Interfaces 2013, 5, 2999−30093008
(17) Nakagaito, A. N.; Yano, H. Cellulose 2008, 15, 555−559.(18) Seydibeyog lu, M. O.; Oksman, K. Compos. Sci. Technol. 2008,68, 908−914.(19) Iwatake, a; Nogi, M.; Yano, H. Compos. Sci.Technol. 2008, 68,2103−2106.(20) Wu, Q.; Henriksson, M.; Liu, X.; Berglund, L. A.Biomacromolecules 2007, 8, 3687−3692.(21) Cheng, Q.; Wang, S.; Rials, T. G. Compos. Part A 2009, 40,218−224.(22) Choi, Y.; Simonsen, J. J. Nanosci. Nanotechnol. 2006, 6, 633−639.(23) Siqueira, G.; Bras, J.; Dufresne, A. Biomacromolecules 2009, 10,425−432.(24) Johnson, R. K.; Zink-Sharp, A.; Renneckar, S. H.; Glasser, W. G.Cellulose 2008, 16, 227−238.(25) Lee, K. Y.; Tammelin, T.; Schulfter, K.; Kiiskinen, H.; Samela, J.;Bismarck, A. ACS Appl. Mater. Interfaces 2012, 4, 4078−4086.(26) Liu, D.; Chen, X.; Yue, Y.; Chen, M.; Wu, Q. Carbohyd. Polym.2011, 84, 316−322.(27) Asghar, A.; Samad, Y. A.; Hashaikeh, R. J. Appl. Polym. Sci. 2012,125.(28) Pielichowska, K.; Pielichowski, K. Polym. Adv. Technol. 2011, 22,1633−1641.(29) Wang, Q. Q.; Zhu, J. Y.; Reiner, R. S.; Verrill, S. P.; Baxa, U.;McNeil, S. E. Cellulose 2012, 19, 2033−2047.(30) Scherrer, P. Gottinger Nachr. Ges. 1918, 26, 98−100.(31) Park, S.; Baker, J. O.; Himmel, M. E.; Parilla, P. A.; Johnson, D.K. Biotechnol. Biofuels 2010, 3−10.(32) Segal, L.; Creely, J. J.; Martin, A. E.; Conrad, C. M. Tex. Res. J.1959, 29, 786−794.(33) Li, R.; Fei, J.; Cai, Y.; Li, Y.; Feng, J.; Yao, J. Carbohyd. Polym.2009, 76, 94−99.(34) Oudiani, A. E.; Chaabouni, Y.; Msahli, S.; Sakli, F. Carbohyd.Polym. 2011, 86, 1221−1229.(35) Brown, R. D.; Jurasek, L. Hydrolysis of Cellulose: Mechanisms ofEnzymatic and Acid Catalysis; The Maple Press Co.: York, PA, 1979.(36) Moon, R. J.; Martini, A.; Nairn, J.; Simonsen, J.; Youngblood, J.Chem. Soc. Rev. 2011, 40, 3941−3994.(37) Elazzouzi-Hafraoui, S.; Nishiyama, Y.; Putaux, J.-L.; Heux, L.;Dubreuil, F.; Rochas, C. Biomacromolecules 2008, 9, 57−65.(38) Kadla, J. F.; Kubo, S. Macromolecules 2003, 36, 7803−7811.(39) Kondo, T.; Sawatari, C.; Gray, D. G. Macromolecules 1994, 27,210−215.(40) Su, Y. L.; Wang, J.; Liu, H. Z. J. Colloid Interface Sci. 2002, 251,417−423.(41) Kakade, M. V; Givens, S.; Gardner, K.; Lee, K. H.; Chase, D. B.;Rabolt, J. F. J. Am. Chem. Soc. 2007, 129, 2777−2782.(42) Xu, X.; Jiang, L.; Zhou, Z.; Wu, X.; Wang, Y. ACS Appl. Mater.Interfaces 2012, 4, 4331−4337.(43) Pereira, R. P.; Rocco, A. M.; Bielschowsky, C. E. Macromol.Symp. 2004, 108, 12677−12684.(44) Brown, E. E.; Laborie, M. G. Biomacromolecules 2007, 8, 3074−3081.(45) Ten, E.; Jiang, L.; Wolcott, M. P. Carbohyd. Polym. 2012, 90,541−550.(46) Cimmino, S.; Pace, E. Die Makromol. Chem. 2003, 191, 2447−2454.(47) Rocco, A. M.; Pereira, R. P.; Felisberti, M. I. Polymer 2001, 42,5199−5205.(48) Ozkoc, G.; Kemaloglu, S. J. Appl. Polym. Sci. 2009, 114, 2481−2487.(49) Jiang, L.; Zhang, J.; Wolcott, M. P. Polymer 2007, 48, 7632−7644.(50) Halpin, J. C.; Kardos, J. L. J. Appl. Phys. 1972, 43, 2235−2241.(51) Dalmas, F.; Cavaille, J. Y.; Gauthier, C.; Chazeau, L.; Dendievel,R. Compos. Sci. Technol. 2007, 67, 829−839.(52) Capadona, J. R.; Shanmuganathan, K.; Tyler, D. J.; Rowan, S. J.;Weder, C. Science 2008, 319, 1370−1374.
(53) Van Es, M. A.; Xiqiao, F.; van Turnhout, J.; van der Giessen, E.In Specialty Polymer Additives: Principles and Applications; Al-Malaika,S., Golovoy, A. W., Wilkie, C. A., Ed.; John Wiley & Son: Hoboken,NJ, 2001; pp 391−414.(54) Ouali, N.; Cavaille, J. Y.; Perez, J. Plast. Rubber Compos. Process.Appl. 1991, 16, 55−60.(55) Takayanagi, M.; Uemura, S.; Minami, S. J. Polym. Sci., Part C:Polym. Symp. 1964, 5, 113.(56) Favier, V.; Chanzy, H.; Cavaille, J. Y. Macromolecules 1996, 28,6365−6367.(57) Fourier, J.; Canova, G. R.; Shrivastava, S. C.; Cavaille, J. Y.Polym. Eng. Sci. 1997, 37, 1732−1739.(58) Rusli, R.; Eichhorn, S. J. Appl. Phys. Lett. 2008, 93, 033111.(59) Lahiji, R. R.; Xu, X.; Reifenberger, R.; Raman, A.; Rudie, A.;Moon, R. J. Langmuir 2010, 26, 4480−8.(60) Sturcova, A.; Davies, G. R.; Eichhorn, S. J. Biomacromolecules2005, 6, 1055−1061.(61) Guhados, G.; Wan, W.; Hutter, J. L. Langmuir 2005, 21, 6642−6646.(62) Hult, E. L.; Iotti, M.; Lenes, M. Cellulose 2010, 17, 575−586.(63) Cox, H. L. Br. J. Appl. Phys. 1952, 3, 72−79.(64) Krenchel, H. Fibre Reinforcement: Theoretical and PracticalInvestigations of the Elasticity and Strength of Fibre-Reinforced Materials;Akademisk Forlag: Copenhagen, Denmark, 1964; pp 11−20.(65) Tanpichai, S.; Quero, F.; Nogi, M.; Yano, H.; Young, R. J.;Lindstro, T.; Sampson, W. W.; Eichhorn, S. J. Biomacromolecules 2012,13, 1340−1349.(66) Agarwal, B. D.; Broutman, L. J.; Chandrashekhara, K. Analysisand Performance of Fiber Composites, 3rd ed.; Wiley: New York, 2006;pp 8−9.
ACS Applied Materials & Interfaces Research Article
dx.doi.org/10.1021/am302624t | ACS Appl. Mater. Interfaces 2013, 5, 2999−30093009