cen us of agriculture highlig ts - cornell university
TRANSCRIPT

DECEMBER 1994 E.. 94-26
CEN US OF AGRICULTURE HIGHLIG TS New York State, 1992
Number of Forms. 199
D Less thon 500
ITlJIII] 500 to 1.000
New York Total: 32.306 Farms
w. Knoblauch L. Putnam B. Stanton N. Merrill
Department of Agricultural, Resource, and Manageri Econo ics Colle e of Agriculture and Life Sci nce
Com II University, Ithaca, ew York 14853-7801

It is the Policy of Cornell University actively to support equality of
educational and employment opportunity. No person shall be denied
admission to any educational program or cti\lity or be denied
employment on the basis of any legally prohibited discrimin tion
involving, but otlimited to, such lactors as race, color, creed, religion,
national or ethnic origin, sell, age or handicap. The University Is
committed to the m intenance of affirmative action programs which will
assure the continuation of such equality of oppo unity.
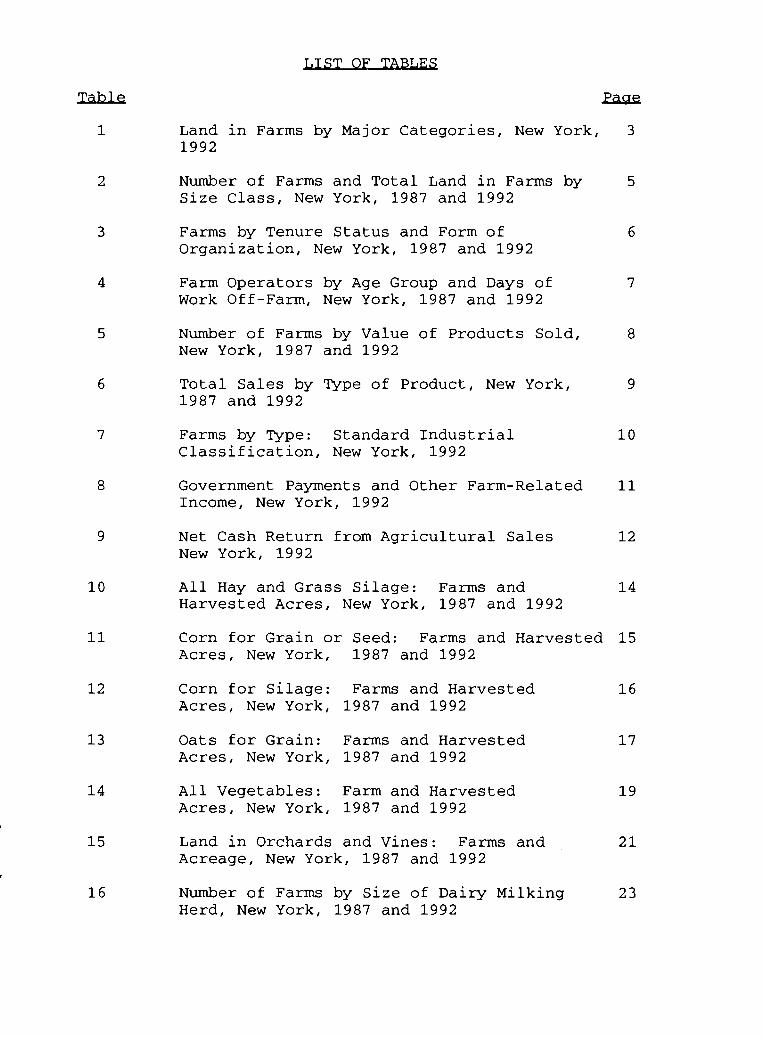
LIST OF TABLES
Table
1 Land 1992
in Farms by Major Categories, New York, 3
2 Number of Farms and Total Land in Farms Size Class, New York, 1987 and 1992
by 5
3 Farms by Tenure Status and Form of Organization, New York, 1987 and 1992
6
4 Farm Operators by Age Group and Days of Work Off-Farm, New York, 1987 and 1992
7
5 Number of Farms by Value New York, 1987 and 1992
of Products Sold, 8
6 Total Sales by Type 1987 and 1992
of Product, New York, 9
7 Farms by Type: Classification,
Standard Industrial New York, 1992
10
8 Government PaYments and Other Farm-Related Income, New York, 1992
11
9 Net Cash Return New York, 1992
from Agricultural Sales 12
10 All Hay and Grass Silage: Harvested Acres, New York,
Farms and 1987 and 1992
14
11 Corn for Grain or Acres, New York,
Seed: Farms and Harvested 1987 and 1992
15
12 Corn for Silage: Acres, New York,
Farms and Harvested 1987 and 1992
16
13 Oats for Grain: Acres, New York,
Farms and Harvested 1987 and 1992
17
14 All Vegetables: Acres, New York,
Farm and Harvested 1987 and 1992
19
15 Land in Orchards and Vines: Farms Acreage, New York, 1987 and 1992
and 21
16 Number of Farms Herd, New York,
by Size of Dairy Milking 1987 and 1992
23

LIST OF TABLES (Continued)
Table
17 Beef Cattle: 1987 and 1992
Farms and Numbers, New York, 24
18 Hens 1987
and Pullets of Laying Age, and 1992
New York, 25
19 Hogs and Pigs: New York, 1987
Farms and and 1992
Inventory Numbers, 26
20 Sheep and Lambs: Farms Numbers, New York, 1987
and Inventory and 1992
27
ii

LIST OF CHARTS
Chart
1 Land 1992
in Farms by Major Uses, New York 4
2 New York State Counties 31
iii

LIST OF FIGURES
Figure
1 Number of Farms, 1992 32
2 33Land in Farms, Thousand Acres, 1992
3 Harvested Cropland, Thousand Acres, 1992 34
4 Total Cropland, Thousand Acres, 1992 35
5 Total Cropland as a Percent of Land in 36 Farms, 1992
6 Value of Agricultural Products Sold, 37 $ Millions, 1992
7 Percent of Farms with Sales Less Than 38 $50,000, 1992
8 Number of Farms with $100,000 or More of 39 Sales, 1992
9 Corn Grain Acreage, Thousands, 1992 40
10 Corn Silage Acreage, Thousands, 1992 41
11 Hay Crops Acreage, Thousands, 1992 42
12 Oats for Grain Acreage, Thousands, 1992 43
13 Vegetables, Sweet Corn, and Melons Acreage 44 Harvested for Sale, Thousands, 1992
14 Potato Acreage, Thousands, 1992 45
15 Orchards and Vineyards Acreage, Thousands, 46 1992
16 Apple Acreage, Thousands, 1992 47
17 Grape Acreage, Thousands, 1992 48
18 Nursery and Greenhouse Product Sales, 49 $ Millions, 1992
19 Number of Milk Cows, Thousands, 1992 50
20 Number of Beef Cows, Thousands, 1992 51
21 Hog and Pig Inventory, Thousands, 1992 52
iv

Figure
22
23
24
25
LIST OF FIGURES (Continued)
Sheep and Lamb Inventory, Thousands, 1992 53
Total Farm Production Expenditures, 54 $ Millions, 1992
Total Net Cash Return from Agricultural 55 Sales, $ Millions, 1992
Net Cash Return from Agricultural Sales 56 per Farm, $ Thousands, 1992
v
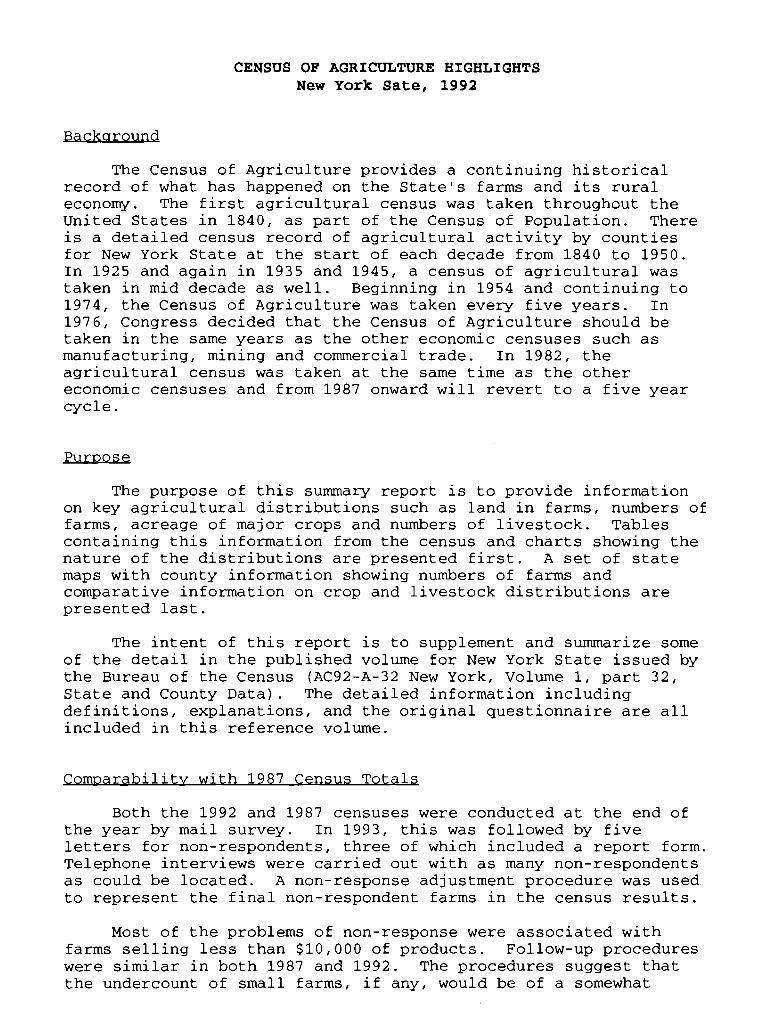
CENSUS OF AGRICULTURE HIGHLIGHTS New York Sate, 1992
Background
The Census of Agriculture provides a continuing historical record of what has happened on the State's farms and its rural economy. The first agricultural census was taken throughout the United States in 1840, as part of the Census of Population. There is a detailed census record of agricultural activity by counties for New York State at the start of each decade from 1840 to 1950. In 1925 and again in 1935 and 1945, a census of agricultural was taken in mid decade as well. Beginning in 1954 and continuing to 1974, the Census of Agriculture was taken every five years. In 1976, Congress decided that the Census of Agriculture should be taken in the same years as the other economic censuses such as manufacturing, mining and commercial trade. In 1982, the agricultural census was taken at the same time as the other economic censuses and from 1987 onward will revert to a five year cycle.
Purpose
The purpose of this summary report is to provide information on key agricultural distributions such as land in farms, numbers of farms, acreage of major crops and numbers of livestock. Tables containing this information from the census and charts showing the nature of the distributions are presented first. A set of state maps with county information showing numbers of farms and comparative information on crop and livestock distributions are presented last.
The intent of this report is to supplement and summarize some of the detail in the published volume for New York State issued by the Bureau of the Census (AC92-A-32 New York, Volume 1, part 32, State and County Data). The detailed information including definitions, explanations, and the original questionnaire are all included in this reference volume.
Comparability with 1987 Census Totals
Both the 1992 and 1987 censuses were conducted at the end of the year by mail survey. In 1993, this was followed by five letters for non-respondents, three of which included a report form. Telephone interviews were carried out with as many non-respondents as could be located. A non-response adjustment procedure was used to represent the final non-respondent farms in the census results.
Most of the problems of non-response were associated with farms selling less than $10,000 of products. Follow-up procedures were similar in both 1987 and 1992. The procedures suggest that the undercount of small farms, if any, would be of a somewhat

2
similar magnitude. A description of the statistical methodology can be obtained by referring to Appendix C, Statistical Methodology, in AC92-A-32. There is no apparent reason to assume that there is any methodological upward or downward bias in the number of farms reporting in these two census years.
One feature of the statistics for 1987 and 1992 is that farm prices were higher in 1992 than in 1987. The index of prices received by farmers in 1987 was 127 compared to 140 for 1992, using 1977 = 100. The New York milk price index was 127 in 1987 and 133 in 1992, using 1977 = 100. Thus, in making comparisons on the value of sales over this period, one should recognize that prices had generally increased by 10 percent and by 5 percent for milk.
Definition of a Farm
The Census defines a farm in both 1987 and 1992 as "any place from which $1,000 or more of agricultural products were sold or normally would have been sold during the census year." The previous definition used from 1959 to 1974 counted a farm as any place with less than 10 acres from which $250 or more of agricultural products were sold or any place of 10 acres or more where $50 or more of agricultural products were sold during the census year.
Since 1850, the census definition of a farm has changed nine times. In all cases, the effort has been made to include all the units where any commercial production occurred or where the operator obtained an important part of his livelihood from agriculture, even if no sales took place. Because of the changes in definitions and the large number of relatively small and part time farms, one should be cautious in making comparative statements about changes in farm numbers particularly in the past 20 years.
STATEWIDE DATA
Farm Numbers. Land in Farms and Farm Organization
The land area of the State of New York is about 30.6 million acres. In 1992, 24.5 percent or 7.5 million acres were in farms. This is a decrease of nearly 960,000 acres from 1987 and more than 1.7 million acres since 1982. One hundred years earlier, the census of 1880 reported 22.9 million acres in farms, the peak period in history. Much of the land formerly in farms has reverted to forest or brush. Much of this is privately owned and used for recreation or forestry. Some tracts were purchased by the State in the 1920s and 1930s in a period of great depression in agriculture.
Land in farms is distributed by the Census into four categories of cropland, woodland, other pastureland and rangeland, and land in house lots, ponds, roads and wasteland. Total cropland harvested increased gradually between 1969 and 1982, dropped back

3
in 1987 to about the 1969 level, and in 1992 fell considerably below 1969 acreage. Total cropland in 1992 was 4.88 million acres of which 72.5 percent was harvested.
Total cropland Total cropland harvested
(acres) (acres)
1969 6,081,847 3,835,623 1974 5,788,149 4,156,266 1978 5,940,788 4,348,591 1982 5,697,926 4,430,198 1987 5,382,175 3,899,819 1992 4,876,169 3,534,898
Of the total land in farms in 1992, over 65 percent is in cropland, an increase from 64 percent in 1987 (Table 1). As farms have gone out of production, the better cropland has been maintained in agricultural production and woodland and nontillable pasture makes up a smaller proportion of the total remaining in farms.
Table 1. LAND IN FARMS BY MAJOR CATEGORIES
New York, 1992
Percent Description 1992 of total
Total cropland Harvested Cropland pasture Idle cropland & government
programs All other cropland
Total woodland Woodland pastured Woodland not pastured
Other pastureland and rangeland
Land in house lots, ponds, roads and wasteland
Total land in farms
acres 4,876,169 3,534,898
709,566 436,986
194,719
1,542,993 293,669
1,249,324
554,338
484,515
7,458,015
65.4 47.4
9.5 5.8
2.6
20.7 3.9
16.8
7.4
6.5
100.0

-----
CHART 1.
4
LAND IN FARMS BY MAJOR USES New York, 1992
Total acres =7,458,015 Other cropland-cover, crops Cropland failed, and summer fallow ~I
Other land 6.5% ----: 6.5°,0
Cropland idle 6.5%
Pastureland and rangeland Cropland
7.4% pastured 14.5%
Cropland 65.4%
Woodland 20.7%
Cropland harvested 72.5%
5
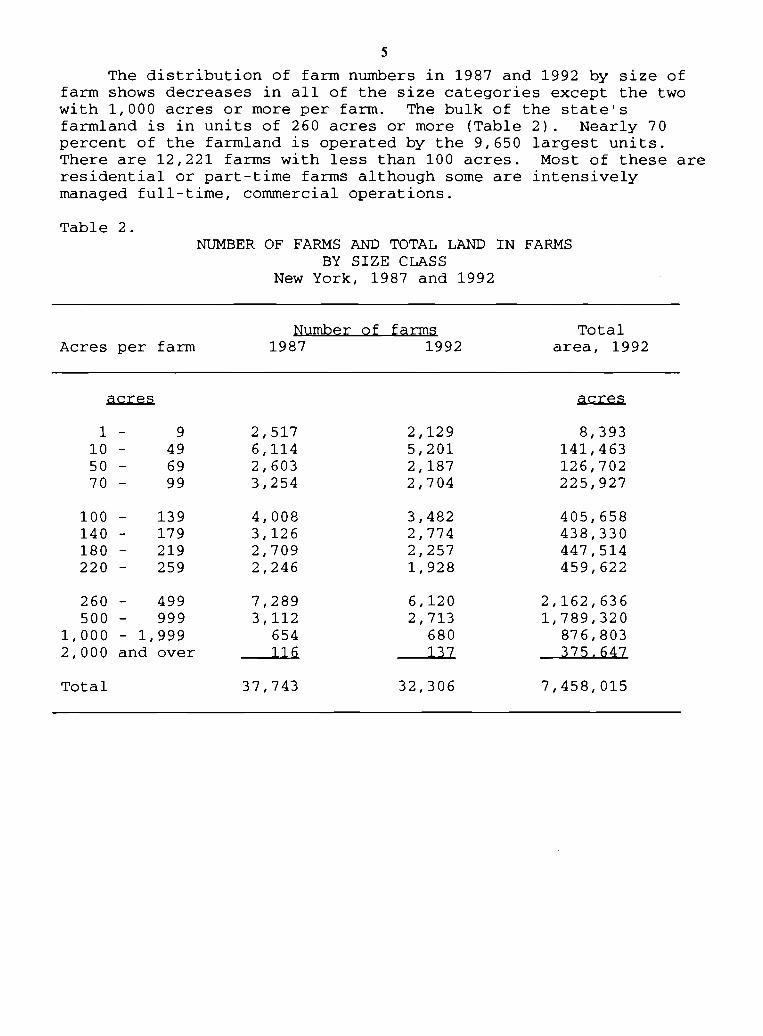
The distribution of farm numbers in 1987 and 1992 by size of farm shows decreases in all of the size categories except the two with 1,000 acres or more per farm. The bulk of the state's farmland is in units of 260 acres or more (Table 2). Nearly 70 percent of the farmland is operated by the 9,650 largest units. There are 12,221 farms with less than 100 acres. Most of these are residential or part-time farms although some are intensively managed full-time, commercial operations.
Table 2. NUMBER OF FARMS AND TOTAL LAND IN FARMS
BY SIZE CLASS New York, 1987 and 1992
Number of farms Total Acres per farm 1987 1992 area, 1992
acres acres
1 - 9 2,517 2,129 8,393 10 - 49 6,114 5,201 141,463 50 - 69 2,603 2,187 126,702 70 - 99 3,254 2,704 225,927
100 - 139 4,008 3,482 405,658 140 - 179 3,126 2,774 438,330 180 - 219 2,709 2,257 447,514 220 - 259 2,246 1,928 459,622
260 - 499 7,289 6,120 2,162,636 500 - 999 3,112 2,713 1,789,320
1,000 - 1,999 654 680 876,803 2,000 and over 116 137 375.647
Total 37,743 32,306 7,458,015
-

6
Full owners continue to be the dominant tenure class of farms (Table 3). Part owners account for one-third of the total number; these are primarily active commercial farms on which some land is rented from others to provide additional cropland or pasture. There was no important change in the distributions between 1987 and 1992.
Table 3. FARMS BY TENURE STATUS AND FORM OF ORGANIZATION
New York, 1987 and 1992
Number of Farms Land in Description 1987 1992 farms, 1992
acres Tenure status: Full owners 23,039 18,924 2,746,164 Part owners 12,532 11,417 4,310,632 Tenants 2.172 1. 965 401. 219
Total 37,743 32,306 7,458,015
Form of organization: Individual or family 32,149 27,346 5,387,802 Partnership 3,835 3,284 1,350,596 Corporations
Family-held/less than 10 stockholders 1,396 1,351 591,752
Family-held/more than 10 stockholders 16 14 9,902
Other than family-held 133 156 64,541
Other--cooperative, estates, trusts, and institutional 214 155 53.422
Total 37,743 32,306 7,458,015
The predominant form of organization is individual or family operation. Partnerships account for a little over 10 percent of the businesses. The number of incorporated businesses has decreased modestly from 1987 and is still a small component of the total. The number of non-family type corporations with farms is small and relatively unimportant in this state. The land they operate accounts for only 0.7 percent of the total farmed.
7
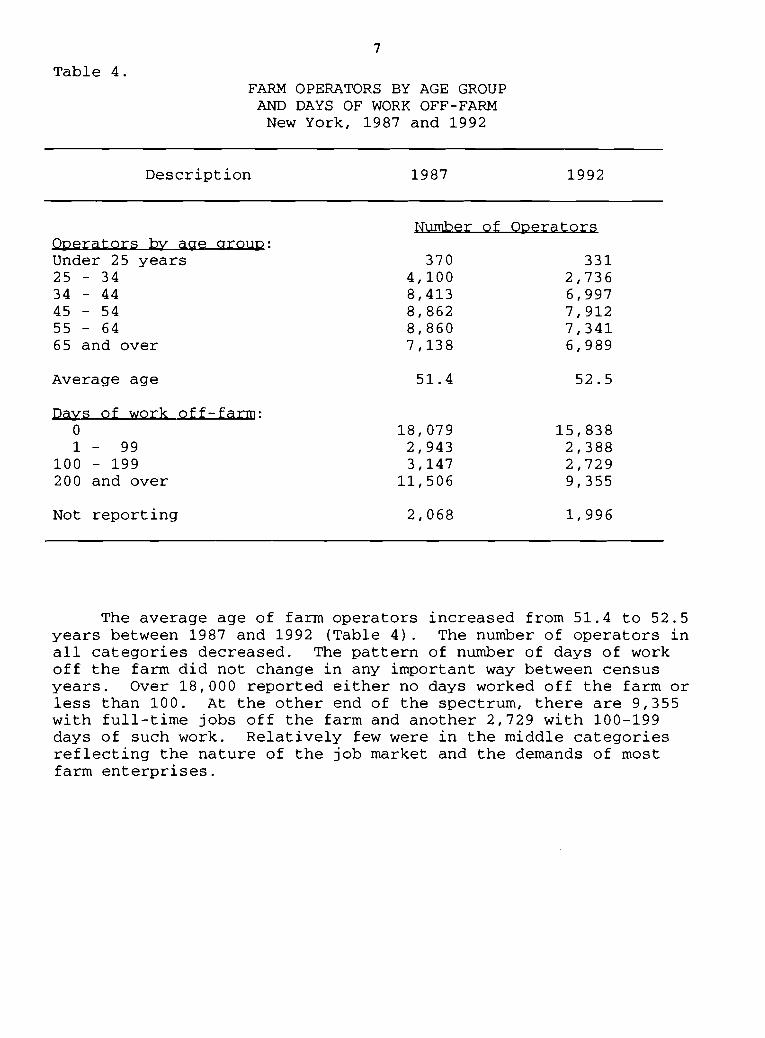
Table 4. FA&~ OPERATORS BY AGE GROUP
AND DAYS OF WORK OFF-FARM New York, 1987 and 1992
Description 1987 1992
Operators by age group: Under 25 years 25 - 34 34 - 44 45 - 54 55 - 64 65 and over
Average age
Days of work off-farm: a 1 - 99
100 - 199 200 and over
Not reporting
Number of Operators
370 331 4,100 2,736 8,413 6,997 8,862 7,912 8,860 7,341 7,138 6,989
51. 4 52.5
18,079 15,838 2,943 2,388 3,147 2,729
11,506 9,355
2,068 1,996
The average age of farm operators increased from 51.4 to 52.5 years between 1987 and 1992 (Table 4). The number of operators in all categories decreased. The pattern of number of days of work off the farm did not change in any important way between census years. Over 18,000 reported either no days worked off the farm or less than 100. At the other end of the spectrum, there are 9,355 with full-time jobs off the farm and another 2,729 with 100-199 days of such work. Relatively few were in the middle categories reflecting the nature of the job market and the demands of most farm enterprises.
8
Farro Size by Value of Products Sold
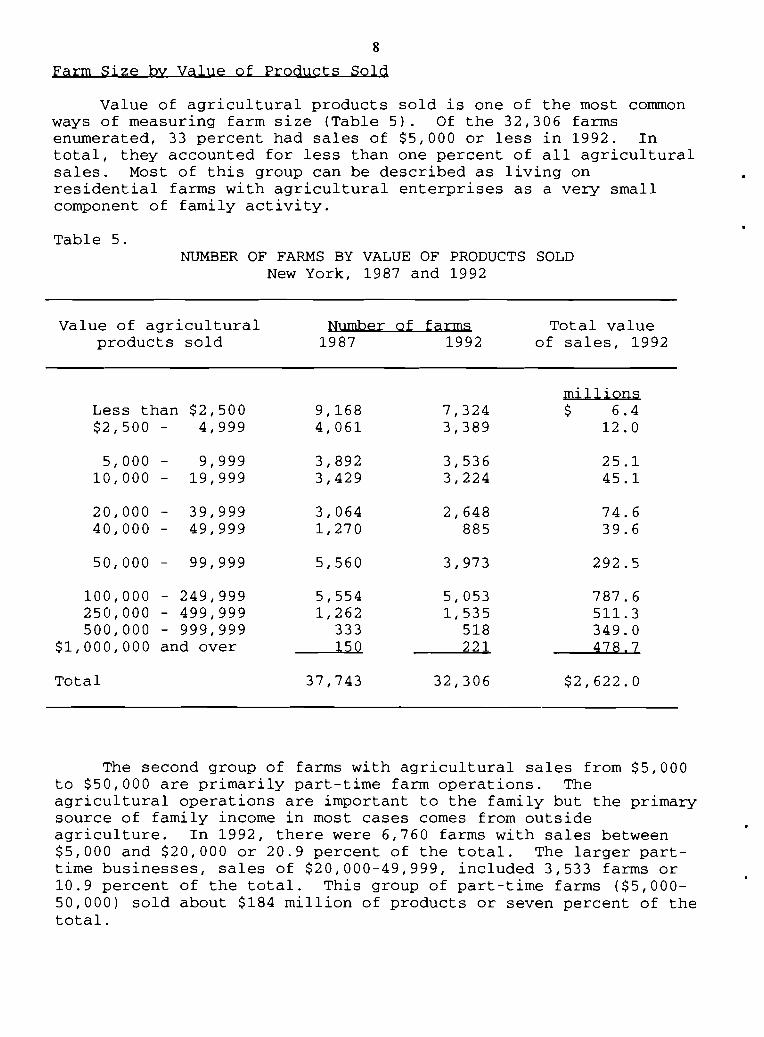
Value of agricultural products sold is one of the most common ways of measuring farm size (Table 5). Of the 32,306 farms enumerated, 33 percent had sales of $5,000 or less in 1992. In total, they accounted for less than one percent of all agricultural sales. Most of this group can be described as living on residential farms with agricultural enterprises as a very small component of family activity.
Table 5. NUMBER OF FARMS BY VALUE OF PRODUCTS SOLD
New York, 1987 and 1992
Value of agricultural Number of farms Total value products sold 1987 1992 of sales, 1992
millions Less than $2,500 9,168 7,324 $ 6.4 $2,500 - 4,999 4,061 3,389 12.0
5,000 - 9,999 3,892 3,536 25.1 10,000 - 19,999 3,429 3,224 45.1
20,000 - 39,999 3,064 2,648 74.6 40,000 - 49,999 1,270 885 39.6
50,000 - 99,999 5,560 3,973 292.5
100,000 - 249,999 5,554 5,053 787.6 250,000 - 499,999 1,262 1,535 511. 3 500,000 - 999,999 333 518 349.0
$1,000,000 and over 150 221 478.7
Total 37,743 32,306 $2,622.0
The second group of farms with agricultural sales from $5,000 to $50,000 are primarily part-time farm operations. The agricultural operations are important to the family but the primary source of family income in most cases comes from outside agriculture. In 1992, there were 6,760 farms with sales between $5,000 and $20,000 or 20.9 percent of the total. The larger part time businesses, sales of $20,000-49,999, included 3,533 farms or 10.9 percent of the total. This group of part-time farms ($5,OOO50,000) sold about $184 million of products or seven percent of the total.

9
The farms with sales of $50,000 or more include 11,300 businesses or 35 percent of the total. Most of these get their primary source of family income from farming. The largest decline in numbers between 1987 and 1992 was from the group with sales from $50,000-99,999. Those with sales of $100,000-249,999 decreased by nine percent in five years. The three larger sales classes all increased reflecting national trends. Ninety-two percent of all agricultural sales were produced by the farms with sales of $50,000 or more.
Total Sales by Type of Product and Type of Farm
The relative importance of individual crops and livestock products in terms of sales is presented in Table 6. Livestock products continue as the most important with the dairy industry dominant among that group. In the five-year period, relatively little change occurred in the aggregates. Poultry sales declined by 10 percent, an important change for that sector.
Table 6. TOTAL SALES BY TYPE OF PRODUCT
New York, 1987 and 1992
Description
Liyestock: Dairy products Cattle and calves Poultry and poultry
products Sheep, lambs & wool Hogs and pigs Other livestock
Value of sales 1987 1992
millions
$1,343.7 $1,428.8 210.4 218.7
90.3 80.9 3.7 3.5
15.6 13.7 76.8 67.1
Percent of total, 1992
54.5 8.3
3.1 0.1 0.5 2.6
Total livestock $1,740.5 $1,812.7 69.1
Crops: Fruit, nuts & berries Vegetables & melons Nursery & greenhouse
products Corn for grain Hay, silage, seeds Wheat Oats Other grains Miscellaneous crops
$144.2 158.5
168.2 86.1 63.1 9.6 6.2
15.4 50.1
$179.3 180.9
218.2 78.8 69.3 16.2
4.8 17.1 44.7
6.8 6.9
8.3 3.0 2.6 0.6 0.2 0.7 1.7
Total crops $701. 4 $809.3 30.9
Total agricultural sales $2,441.9 $2,622.0 100.0

10
Crop sales increased as a share of the total with the major change associated with nursery and greenhouse products. Sales were up 29.7 percent in five years reflecting important growth in this industry. Vegetables and melons were up by 14 percent; corn for grain was the commodity with a substantial drop in value, partly reflecting an important reduction in price as well as volume.
All farms are classified by type according to a Standard Industrial Classification (SIC) used for all census tabulations (Table 7). The most important group in terms of sales as well as numbers is dairy, 60 percent of all sales. The next three groups, horticultural specialties, vegetables and melons, and fruit and tree nuts are much smaller in both numbers of farms and value of sales. Average sales per farm for dairy, horticultural specialties and vegetables and melons are $100,000 or more. Fruit and tree nuts at $73,000 includes a number of part-time operations.
Table 7. FARMS BY TYPE: STANDARD INDUSTRIAL CLASSIFICATION
New York, 1992
Number of Market value Type of farm farms of total sales
Dairy Horticultural specialties Vegetables and melons Fruit and tree nuts Livestock: beef, sheep, hogs Field crops except cash grains Poultry and eggs Animal specialties Cash grains General: crops General: livestock
9,698 1,697 1, 503 2,397 6,738 4,920
294 1,940 1,559 1,282
278. 32,306
millions $1,585
217 182 175 109
91 82 64 80 25 11
$2,622
There are large numbers of part-time and residential farms especially in the groups designated as "Livestock: beef, sheep, hogs" and "Field crops except cash grains." The only other SIC group where the bulk of the farms are relatively large commercial enterprises is poultry and eggs; average sales per farm is $279,000.

11
Goyernment Payments and Other Farm-Related Income
Direct government payments to farmers have decreased in 1992 compared to 1987. Deficiency payments were received as part of participation in wheat and feed grains programs. New York farmers received a total of $28.7 million dollars from these sources (Table 8). This is a small amount of total cash receipts compared to the totals for states in the Corn Belt, Great Plains and much of the South.
Table 8. GOVERNMENT PAYMENTS
AND OTHER FARM-RELATED INCOME New York, 1992
Number of Total value Distribution of such income farms of such income
Goyernment payments: $0 - 999
1,000 - 4,999 5,000 - 9,999
10,000 - 24,999 25,000 - 49,999
$50,000 and over Total
Other farm-related income:* $0 - 999
1,000 - 4,999 5,000 - 9,999
10,000 - 24,999 25,000 - 49,999
$50,000 and over Total
1,820 2,751
934 604 110
29 6,248
3,383 3,524
928 798 138
64 8,835
millions
$0.9 6.9 6.4 8.8 3.7 1.9
$28.7
$ 1. 3 7.9 6.3
12.1 4.5 6.0
$38.1 *Includes custom work, rentals of real estate, sales of forest products, etc.
More than 6,000 farmers received some direct payments in New York. Over half, however, received payments of $5,000 or less. There were only 139 farms who received $25,000 or more during the year; most of these were individuals with relatively large acreages of corn for grain or wheat. This group received 20 percent of the total income.
Other farm-related income is reported but not included as part of agricultural sales. This is a relatively small component of total agricultural income in this state. Most of those receiving such returns do not rely on it for much of their total family income. More than 78 percent of those reporting obtained less than $5,000 from such sources. Custom work, renting out some land or buildings, sales of forest products, and recreation income are the primary items.

12
Net Cash Return from AQricultural Sales
For the second time, the Census provided a distribution of "net cash returns" based on subtracting cash farm expenses from cash agricultural sales. Depreciation and changes in inventory values are not included in making this calculation. It is a measure of cash flow provided from these records. Because such a large number of farms have sales of less than $20,000, 54 percent of the total, one should expect that a large number of the net cash returns would be small, falling between losses of $5,000 and gains of $5,000 (Table 9). In fact, there is a much wider distribution of gains and losses than might have been expected.
Table 9. NET CASH RETURN FROM AGRICULTURAL SALES
New York, 1992
Size of net Number Percent cash return or loss of farms of all farms
Gains of: $50,000 and over 25,000 - 49,999 10,000 - 24,999
5,000 - 9,999 1,000 - 4,999
$0 - 999 Subtotal
Losses of: $0 - -999
-1,000 - -4,999 -5,000 - -9,999
-10,000 - -24,999 -25,000 - -49,999
$-50,000 and over Total
Average net return Average net return, Average net return,
per farm farms w/gains farms w/losses
3,409 3,312 3,487 2,112 2,986 1. 467
16,773
1,757 6,483 3,841 2,691
544 224
32,313
$14,123 34,667 -8,050
10.5 10.2 10.8
6.5 9.2 4.5
51.7
5.4 20.1 11. 9
8.3 1.7 0.7
100.0
There were 16,773 farms reporting gains, 51.9 percent of the total. The number reporting cash losses was substantial; eleven percent of the total had losses of $10,000 or more. The spread in these statistics is perhaps the most noteworthy item of interest. There is no way to associate the large gains or losses with a particular type or size of farm operation.

13
Field Crops
Cropland harvested in New York decreased by a little more than 9 percent between 1987 and 1992 to about 3.5 million acres. Part of this reduction can be attributed to the federal Acreage Reduction Program requirement associated with producing wheat and feed grains. The primary uses of cropland were as follows:
Percent
Hay and grass silage 57 57 Corn for grain 15 15 Corn for silage 13 15 Oats 4 3 Wheat 2 3 Vegetables & potatoes 5 4 Fruit & berries 3 3 All other _1 ~
Total 100 100
Between 1987 and 1992, hay and grass silage maintained its importance even though the total acreage committed to these crops actually declined by 245,000 acres. Corn continues as the most important cereal grain. Both oats and wheat were relatively less important as percentages of the total.

14
Hay and Grass Silage
The most commonly grown field crop is hay or hay harvested as grass silage. Nearly 70 percent of all farms reported some acreage harvested. Of those with some hay harvested, 43 percent had 50 acres or less. Those with 50 acres or more included a large share of the commercial farms and accounted for 89 percent of the total acreage in these crops.
Table 10. ALL HAY AND GRASS SILAGE: FARMS AND HARVESTED ACRES
New York, 1987 and 1992
Acres harvested Number of
farms in 1992 Total
1987 acres
1992
1 15 25
---
14 24 49
2,774 2,366 4,421
29,757 56,676
185,167
23,193 44,494
154,143
50 100 250 500
1, 000
- 99 - 249 - 499 - 999 and over
5,451 5,866 1,324
162 12
450,797 1,010,415
411,843 92,723 21. 741
374,680 873,049 424,397 100,675
19,015
Total 22,376 2,259,119 2,013,646
15
Corn for Grain
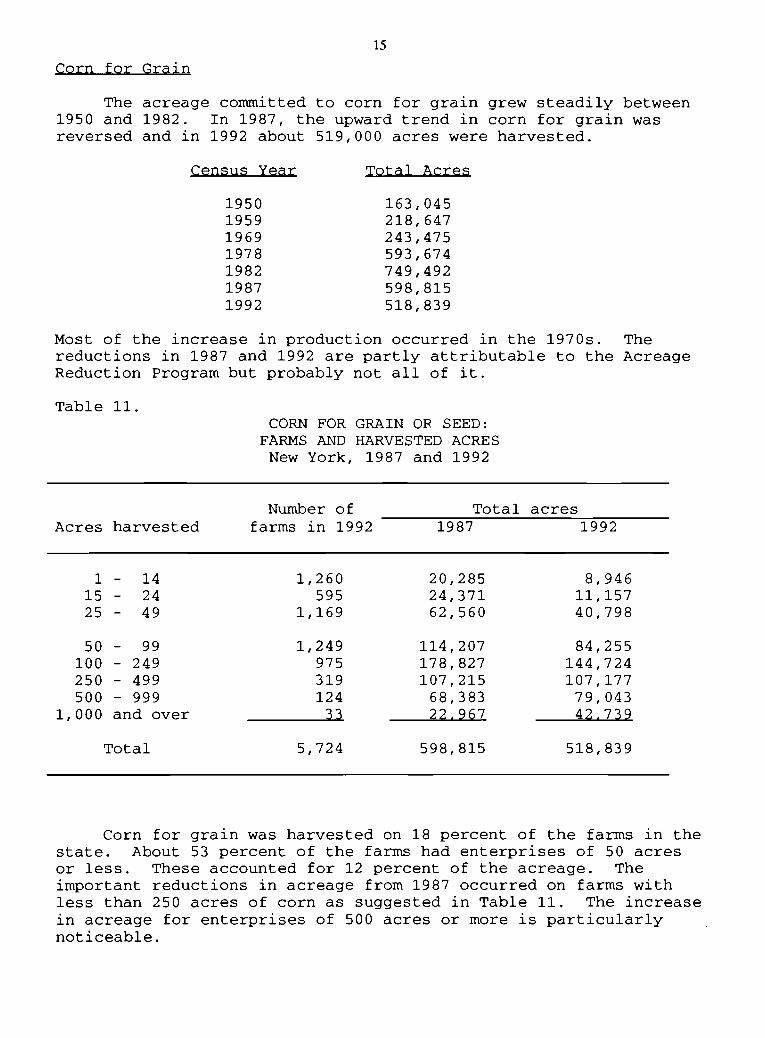
The acreage committed to corn for grain grew steadily between 1950 and 1982. In 1987, the upward trend in corn for grain was reversed and in 1992 about 519,000 acres were harvested.
Census Year Total Acres
1950 163,045 1959 218,647 1969 243,475 1978 593,674 1982 749,492 1987 598,815 1992 518,839
Most of the increase in production occurred in the 1970s. The reductions in 1987 and 1992 are partly attributable to the Acreage Reduction Program but probably not all of it.
Table 11. CORN FOR GRAIN OR SEED:
FARMS AND HARVESTED ACRES New York, 1987 and 1992
Number of Total acres Acres harvested farms in 1992 1987 1992
1 - 14 1,260 20,285 8,946 15 - 24 595 24,371 11,157 25 - 49 1,169 62,560 40,798
50 - 99 1,249 114,207 84,255 100 - 249 975 178,827 144,724 250 - 499 319 107,215 107,177 500 - 999 124 68,383 79,043
1,000 and over 33 22,967 42,739
Total 5,724 598,815 518,839
Corn for grain was harvested on 18 percent of the farms in the state. About 53 percent of the farms had enterprises of 50 acres or less. These accounted for 12 percent of the acreage. The important reductions in acreage from 1987 occurred on farms with less than 250 acres of corn as suggested in Table 11. The increase in acreage for enterprises of 500 acres or more is particularly noticeable.

16
Corn for Silage
Corn for silage is a primary source of feed for livestock on New York farms. It is particularly important on most dairy farms. Corn for silage was harvested on nearly 10,000 farms. The bulk of the acreage was in enterprises of 25 to 250 acres (Table 12). The total acres of corn for silage increased by almost 4 percent between 1987 and 1992. There were decreases in farms harvesting less than 100 acres, and increases in farms harvesting more than 100 acres.
Table 12. CORN FOR SILAGE: FARMS AND HARVESTED ACRES
New York, 1987 and 1992
Number of Total acres Acres harvested farms in 1992 1987 1992
1 - 14 1,811 21,736 15,192 15 - 24 1,544 41,724 29,103 25 - 49 2,830 120,363 97,484
50 - 99 2,288 163,289 149,743 100 - 249 1,159 130,379 159,688 250 - 499 187 35,624 60,182 500 - and over 43 12,343 32,653
Total 9,862 525,458 544,045
-

17
Oats continues as the most important of the small grains produced in the state even though the acreage harvested continues to decline. The trend has been rather steady since 1940.
Census Year Total Acres
1940 626,234 1950 563,728 1959 576,260 1969 361,600 1978 272,507 1982 249,804 1987 162,733 1992 109,686
The drop in acreage and in numbers of producers from 1987 is important. Acreage decreased by one-third. The number of producers dropped from 6,364 in 1982 to 4,059 in 1992. There were decreases in acreage in each of the different size of enterprise classes (Table 13) except farms with over 250 acres harvested.
Table 13. OATS FOR GRAIN: FARMS AND HARVESTED ACRES
New York, 1987 and 1992
Number of Total acres Acres harvested farms in 1992 1987 1992
1 - 14 1,738 23,521 14,410 15 - 24 879 25,748 16,174 25 - 49 864 45,290 28,597
50 - 99 422 38,759 26,487 100 - 249 139 24,733 17,860 250 - and over 17 4.682 6.158
Total 4,059 162,733 109,686
-

18
Other Small Grains
Wheat production increased between 1987 and 1992 from 86,345 to 117,908 acres. There have been other large ups and downs in wheat production. Only 64,655 acres were harvested in 1978, but 142,311 in 1969. Much depends on weather conditions and varieties available in the years the censuses are taken.
Numbers of farms reporting other field crops and the number of acres produced in 1987 and 1992 are listed below:
Farms Reporting Total Acres Crops ll.B.1.. ll.9..2. ll.B.1.. .l2..9.2.
Dry edible beans 505 430 36,895 36,531 Soybeans 382 627 25,059 48,107 Barley 788 409 19,113 9,791 Rye 283 483 6,145 9,842 Buckwheat 224 98 5,607 2,520 Sorghum, forage 364 290 4,909 4,873 Sunflowers 25 28 1,360 462
-
19
Vegetables
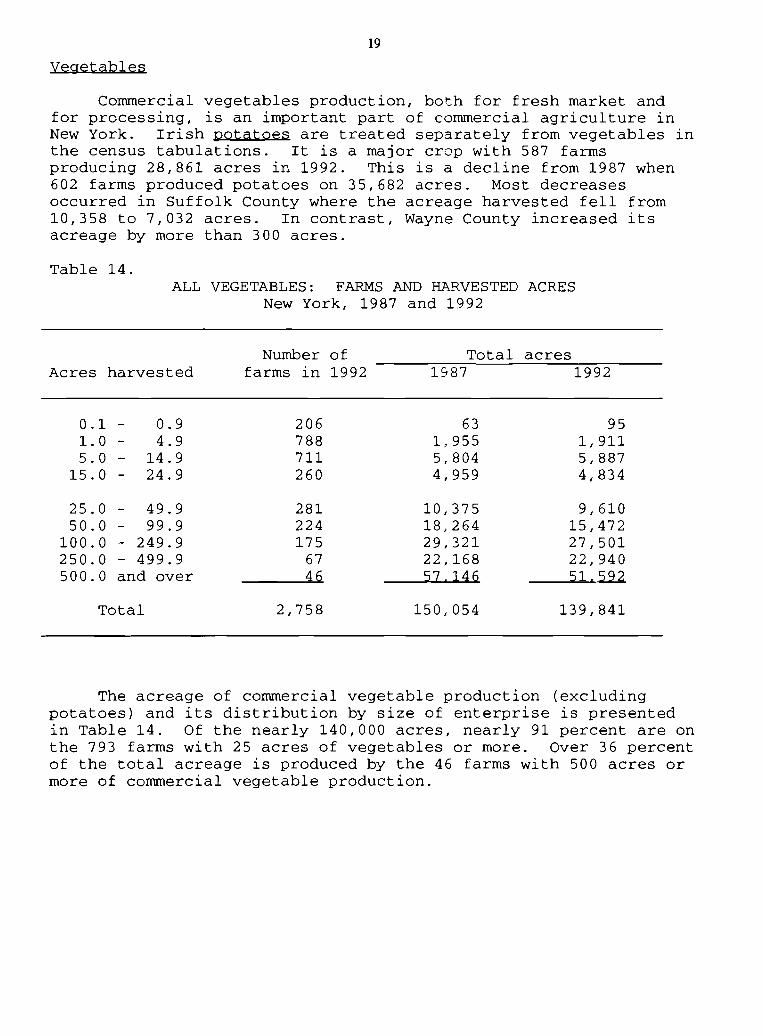
Commercial vegetables production, both for fresh market and for processing, is an important part of commercial agriculture in New York. Irish Qotatoes are treated separately from vegetables in the census tabulations. It is a major crop with 587 farms producing 28,861 acres in 1992. This is a decline from 1987 when 602 farms produced potatoes on 35,682 acres. Most decreases occurred in Suffolk County where the acreage harvested fell from 10,358 to 7,032 acres. In contrast, Wayne County increased its acreage by more than 300 acres.
Table 14. ALL VEGETABLES: FARMS AND HARVESTED ACRES
New York, 1987 and 1992
Number of Total acres Acres harvested farms ln 1992 1987 1992
0.1 - 0.9 206 63 95 1.0 - 4.9 788 1,.955 1,911 5.0 - 14.9 711 5,804 5,887
15.0 - 24.9 260 4,959 4,834
25.0 - 49.9 281 10,375 9,610 50.0 - 99.9 224 18,264 15,472
100.0 - 249.9 175 29,321 27,501 250.0 - 499.9 67 22,168 22,940 500.0 and over 46 57.146 51. 592
Total 2,758 150,054 139,841
The acreage of commercial vegetable production (excluding potatoes) and its distribution by size of enterprise is presented in Table 14. Of the nearly 140,000 acres, nearly 91 percent are on the 793 farms with 25 acres of vegetables or more. Over 36 percent of the total acreage is produced by the 46 farms with 500 acres or more of commercial vegetable production.
-
20
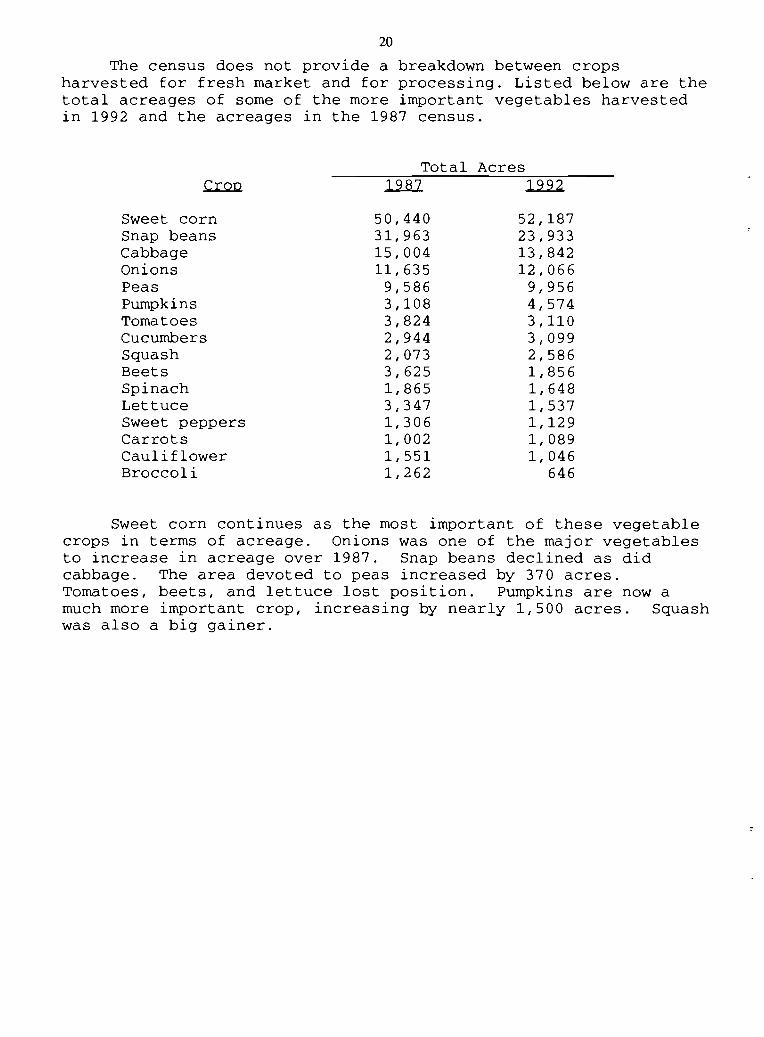
The census does not provide a breakdown between crops harvested for fresh market and for processing. Listed below are the total acreages of some of the more important vegetables harvested in 1992 and the acreages in the 1987 census.
Total Acres .c..I:..ml ll.81. llll
Sweet corn 50,440 52,187 Snap beans 31,963 23,933 Cabbage 15,004 13,842 Onions 11,635 12,066 Peas 9,586 9,956 Pumpkins 3,108 4,574 Tomatoes 3,824 3,110 Cucumbers 2,944 3,099 Squash 2,073 2,586 Beets 3,625 1,856 Spinach 1,865 1,648 Lettuce 3,347 1,537 Sweet peppers 1,306 1,129 Carrots 1,002 1,089 Cauliflower 1,551 1,046 Broccoli 1,262 646
Sweet corn continues as the most important of these vegetable crops in terms of acreage. Onions was one of the major vegetables to increase in acreage over 1987. Snap beans declined as did cabbage. The area devoted to peas increased by 370 acres. Tomatoes, beets, and lettuce lost position. Pumpkins are now a much more important crop, increasing by nearly 1,500 acres. Squash was also a big gainer.
-

21
Fruit and Berries
The acreage in commercial fruit production decreased by nearly 9.3 percent between 1987 and 1992. Most of the decrease was in apples and grapes, the two principal crops. There were 2,938 farms reporting some acreage of fruit (Table 15). Of these, 978 had orchards or vineyards of 25 acres or more which accounted for 86 percent of the total acres. Those with 100 acres or more made up 56 percent of the total.
Table 15. LAND IN ORCHARDS AND VINES: FARMS AND ACREAGE
New York, 1987 and 1992
Nwnber of Total acres Acres harvested farms in 1992 1987 1992
0.1 - 4.9 881 2,146 1,881 5.0 - 14.9 749 7,573 6,466
15.0 - 24.9 330 6,674 6,129
25.0 - 49.9 413 14,925 14,274 50.0 - 99.9 281 21,329 19,494
100.0 - 499.9 268 55,367 50,480 500 acres & over 16 16,418 12,433
Total 2,938 124,432 112,905
The primary fruit crops in 1992 compared to 1987 were:
Total Acres
Apples 73,195 67,313 Grapes 36,916 34,250 Cherries, tart 5,443 4,083 Cherries, sweet 1,461 1,122 Pears 3,634 2,882 Peaches 2,596 2,266 Berries, all brambles 3,479 3,264 Strawberries 2,369 1,991 Plums and prunes 1,038 584
-None of the fruit crops increased in acreage over this five
year period. In general, the nwnber of trees per acre has increased especially for apples as dwarf root stock is used to replace older trees.
22
Nursery and Greenhouse
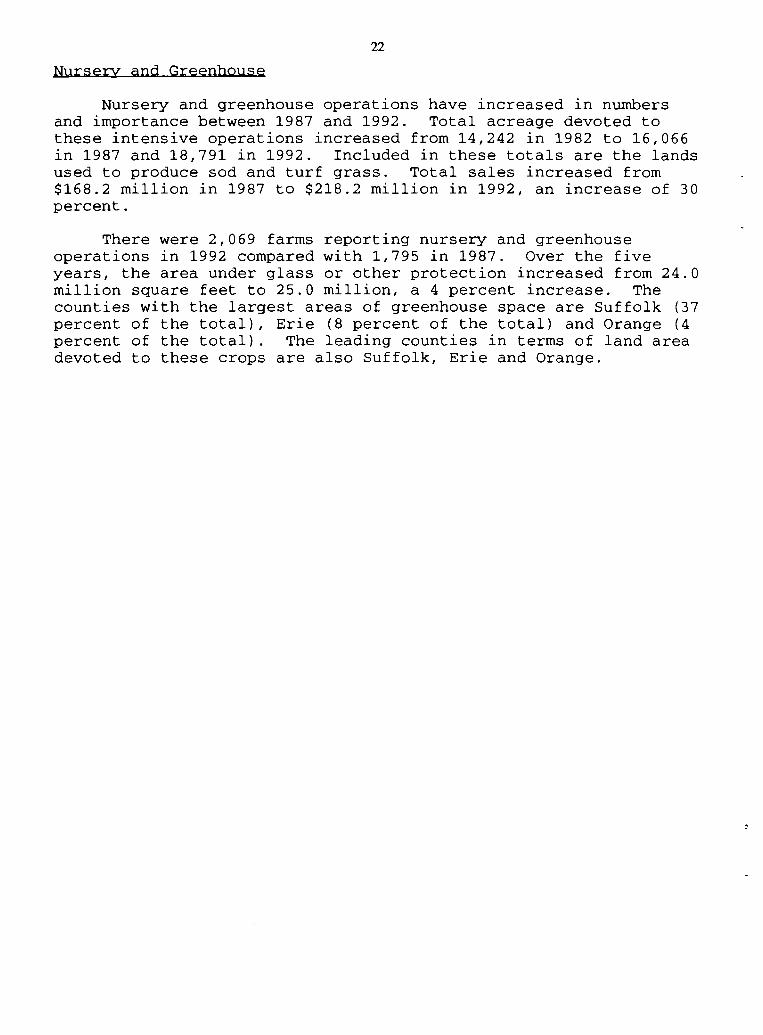
Nursery and greenhouse operations have increased in numbers and importance between 1987 and 1992. Total acreage devoted to these intensive operations increased from 14,242 in 1982 to 16,066 in 1987 and 18,791 in 1992. Included in these totals are the lands used to produce sod and turf grass. Total sales increased from $168.2 million in 1987 to $218.2 million in 1992, an increase of 30 percent.
There were 2,069 farms reporting nursery and greenhouse operations in 1992 compared with 1,795 in 1987. Over the five years, the area under glass or other protection increased from 24.0 million square feet to 25.0 million, a 4 percent increase. The counties with the largest areas of greenhouse space are Suffolk (37 percent of the total), Erie (8 percent of the total) and Orange (4 percent of the total). The leading counties in terms of land area devoted to these crops are also Suffolk, Erie and Orange.
....

I 23
LIVESTOCK
Dairy
Much of the cropland in New York is best suited for growing forage crops and these are converted most efficiently into saleable products over much of the State by dairy animals. Dairying is the dominant industry in most upstate counties. In 1992, there were 10,696 farms reporting one or more dairy animals. Unlike the crops, having a few dairy cows is not a very economic proposition unless it is one cow for family consumption. The 1,481 farms with less than 20 cows counted for 14 percent of the farms and one percent of all the dairy cows (Table 16).
Table 16. NUMBER OF FARMS BY SIZE OF DAIRY MILKING HERD
New York, 1987 and 1992
Number Number of Number of milk cows of milk cows farms in 1992 1987 1992
1 - 9 1,068 4,487 3,062 10 - 19 413 7,023 5,869 20 - 49 3,340 171,333 121,073
50 - 99 4,073 343,965 272,573 100 - 199 1,389 190,489 178,890 200 - 499 360 76,888 99,191 500 and over 53 20.276 40.628
Total 10,696 814,461 721,286
The size class with the most farms and the most cows was 50-99 milking animals. Most of the decreases in cows between 1987 and 1992 occurred on the farms with less than 100 cows. There were important reductions in each of the small herd sizes as some individuals moved out of dairying and others increased herd size. In the two larger herd sizes, cow numbers increased as has been generally true during the same period throughout the United States.

24
Beef Cattle
The other important user of pasture and forage crops in the State is the beef cattle industry. Cow-calf operations are the most important component of this industry although some animals are also fed out of slaughter weights.
Table 17. BEEF CATTLE: FARMS AND NUMBERS
New York, 1987 and 1992
Total number Number Number of of beef cows
of beef cows farms in 1992 1987 1992
1 - 9 3,517 17,688 14,114 10 - 19 1,295 18,643 17,041 20 - 49 874 20,538 24,148
50 - 99 145 7,720 9,250 100 - 199 36 2,949 4,548 200 and over 13 4,089 3,870
Total 5,880 71,627 72,971
The number of farms reporting beef cows in 1992 was 5,880, down quite sharply from 1987 when there was 6,798. Much of this decline in numbers is associated with farms reporting 1-9 cows, 3,517 in 1992 compared to 4,477 in 1987. In most of the other size categories, there was substantial stability (Table 17). The number of farms with 100 cows or more remains small, 49 such operations accounting for about 12 percent of all the cattle.
-

25
Laying Hens and Pullets
Egg production is the most important reason for keeping poultry in New York. This industry decreased by about 19 percent between 1987 and 1992 as numbers of layers decreased from 4.7 million to 3.8 million. There were 35 farms in 1992 with 20,000 hens or pullets of laying age or more. These 35 farms accounted for 94 percent of the state's laying flock (Table 18).
Table 18. HENS AND PULLETS OF LAYING AGE
New York, 1987 and 1992
Total number Hens and pullets Number of of hens and pullets
of laying age farms in 1992 1987 1992
1 - 99 1,863 62,843 41,659 100 - 399 112 35,517 17,689
400 - 3,199 33 ·74,922 41,953 3,200 - 19,999 15 387,285 137,667
20,000 - 49,999 17 810,776 506,434 50,000 - 99,999 9 844,657 600,730
100,000 and over 9 2,472,275 2,432,969
Total 2,058 4,688,275 3,779,101
There were decreases in numbers of farms with laying hens in each of the size categories in comparison with 1987. Most of the decrease in numbers reporting layers was in the smallest size category as individuals gave up keeping a small family flock. The tendency for most of the egg production to be concentrated on a few large farms is common throughout the United States.
Other Poultrv
There were 142 farms reporting broilers and other meat-type chickens sold in 1992 compared with 206 in 1987. Production was also down by 39 percent in 1992 with 1.0 million birds sold compared with 1.7 million in 1987. Most of this production was concentrated on the three farms with 100,000 birds or more. -
The number of farms selling turkeys decreased from 241 in 1987 to 171 in 1992. One large farm selling more than 100,000 turkeys accounted for most of the state's production.

26
Hogs and Pigs
The number of farms reporting hogs or pigs declined by 21 percent from 2,644 in 1987 to 2,094 in 1992. Most of this decrease was in farms with 1-24 pigs (Table 19). The number of hogs and pigs declined by 9 percent. Most of this occurred by reductions of numbers in the smaller enterprises. There were 94 farms with 200 hogs or more. They accounted for 66 percent of total numbers.
Table 19. HOGS AND PIGS: FARMS AND INVENTORY NUMBERS
New York, 1987 and 1992.
Total number Number of Number of of hogs and pigs
hogs and pigs farms in 1992 1987 1992
1 - 24 1,699 12,510 9,785 25 - 49 129 6,922 4,323 50 - 99 96 8,180 6,305
100 - 199 76 12,191 10,421 200 - 499 58 23,091 16,589 500 and over 36 36,666 42,859
Total 2,094 99,560 90,282
-
27
Sheep and Lambs
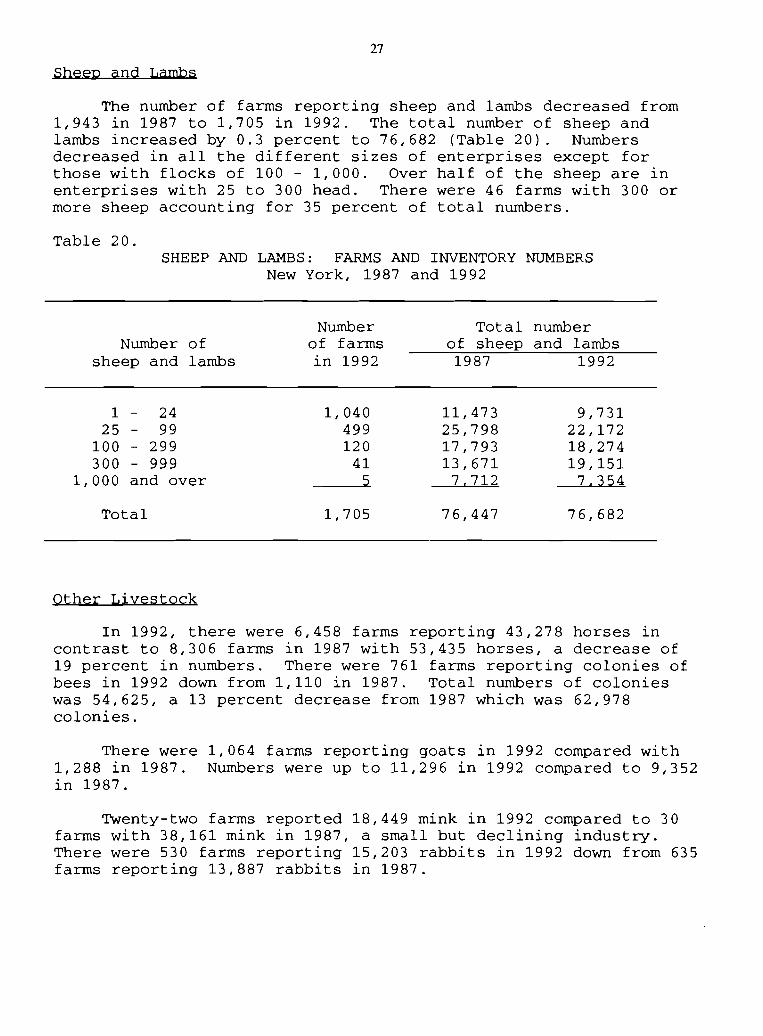
The number of farms reporting sheep and lambs decreased from 1,943 in 1987 to 1,705 in 1992. The total number of sheep and lambs increased by 0.3 percent to 76,682 (Table 20). Numbers decreased in all the different sizes of enterprises except for those with flocks of 100 - 1,000. Over half of the sheep are in enterprises with 25 to 300 head. There were 46 farms with 300 or more sheep accounting for 35 percent of total numbers.
Table 20. SHEEP AND LAMBS: FARMS AND INVENTORY NUMBERS
New York, 1987 and 1992
Number Total number Number of of farms of sheep and lambs
sheep and lambs in 1992 1987 1992
1 - 24 1,040 11,473 9,731 25 - 99 499 25,798 22,172
100 - 299 120 17,793 18,274 300 - 999 41 13,671 19,151
1, 000 and over 5 7,712 7,354
Total 1,705 76,447 76,682
Other Livestock
In 1992, there were 6,458 farms reporting 43,278 horses in contrast to 8,306 farms in 1987 with 53,435 horses, a decrease of 19 percent in numbers. There were 761 farms reporting colonies of bees in 1992 down from 1,110 in 1987. Total numbers of colonies was 54,625, a 13 percent decrease from 1987 which was 62,978 colonies.
There were 1,064 farms reporting goats in 1992 compared with 1,288 in 1987. Numbers were up to 11,296 in 1992 compared to 9,352 in 1987.
Twenty-two farms reported 18,449 mink in 1992 compared to 30 farms with 38,161 mink in 1987, a small but declining industry. There were 530 farms reporting 15,203 rabbits in 1992 down from 635 farms reporting 13,887 rabbits in 1987.

28
STATE MAPS
Twenty-five maps depicting concentrations by county of major agricultural commodities or characteristics of the New York agricultural industry follow this discussion. These maps provide a means to obtain spatial perspective on the geographic distribution of the State's agriculture. Each map is shaded from white to depict relatively low levels of activity, to single lines to represent intermediate density, to cross hatching for the highest levels. Within the borders of each county are the corresponding data and at the bottom of each map is the State total or average. For those unfamiliar with the State, a map including county names is included on page 31.
Farm Numbers. Land in Farms. and Value of Agricultural Product Sales
There is a wide and relatively even distribution of farms over the State with most counties containing a minimum of three to four hundred farms (Figure 1). Chautauqua County has the largest number of farms with over 1,600, second is St. Lawrence County with over 1,300 farms.
Land in farms exhibits a similar distribution to farm numbers (Figure 2). St. Lawrence County has the largest number of acres in farms with over 395,000 acres devoted to agriculture. Harvested cropland is a measure of the amount of land in each county which provides the basis for most of the production (Figure 3). St. Lawrence County also has the largest number of acres of harvested cropland at 164,000 followed by Steuben County at 154,000 and Cayuga County at 137,000. Total cropland acres measures the amount of land normally used for crop production (Figure 4). St. Lawrence and Steuben Counties, at 225,000 acres, have the largest number of acres followed by Jefferson, Cayuga and Livingston Counties.
Total cropland as a percent of land in farms enables a comparison of the intensity of use of land in farms from county to county (Figure 5). Relatively high percentages indicate that a large proportion of the land in farms was used for crops and a low percentage the opposite. All of the counties in the Finger Lakes and Western plains have a higher than average percentage with Rockland, Suffolk, Oswego, Niagara, Monroe, Seneca, Genesee, and Orleans Counties having the highest percentages.
The value of agricultural products sold represents the gross .... market value before taxes and production expenses are subtracted from the total (Figure 6). Suffolk County with sales of over 130 million dollars had the greatest output, followed by Wyoming, St. Lawrence, and Cayuga Counties. Seventeen counties recorded a value of agricultural products sold in excess of 60 million dollars in 1992.

29
A measure of the proportion of farms that are part-time or residential farms can be obtained by calculating the percent of total farms with sales less than $50,000 (Figure 7). Along the corridor from Ulster to Essex Counties and west of a line from Broome to Oswego Counties includes the greatest proportion of small farms.
Farms with sales of $100,000 or more represents average and larger "commercial farms" (Figure 8). The number of farms with sales of $100,000 or more is greatest in St. Lawrence County followed by Lewis, Chautauqua, Oneida, Wyoming, and Jefferson Counties.
Field Crops
Corn for grain acreage had steadily increased in recent years. The 1992 Census showed a significant reduction in corn acreage. The Finger Lakes and Western Plains regions are the centers of corn grain production in the State (Figure 9). Cayuga County had the largest corn for grain acreage -- over 57,000 followed by Ontario, Livingston, Wayne, Genesee, and Seneca Counties.
Corn silage acreage has remained relatively stable in recent years, with an increase in 1992. Corn silage acreage is more widely distributed over the State than is corn for grain (Figure 10). Wyoming, St. Lawrence, Washington, Madison, and Jefferson Counties have the largest acreages of corn silage.
The acreage of hay is widely distributed over the State (Figure 11). St. Lawrence County has the largest acreage; when combined with five other Northern New York counties they account for approximately one-fifth of the total hay acreage of the State. Central New York and the Western Southern Tier are other areas where large concentrations of hay acreage occur.
Oats for grain is the fourth most important crop in terms of acreage and is concentrated in Western New York and the Finger Lakes region (Figure 12). Steuben County has the largest oat acreage followed by Cayuga, Onondaga, and Madison Counties.
Vegetable Crops
New York's vegetable, sweet corn, and melon acreage is centered in Western and Central New York along with large acreages in Orange and Suffolk Counties in Southeastern New York (Figure 13). Genesee and Orleans Counties have the largest acreages accounting for more than one-fourth of the State total. -
Potato acreage is concentrated in Western New York with Steuben, Wyoming, Wayne, and Livingston Counties accounting for approximately 45 percent of the State's potato acreage (Figure 14). Suffolk County is the largest potato county with over 7,000 acres· of potatoes.

30
Orchards and Vineyards, and Nursery and Greenhouse Product Sales
Orchard and vineyard acreage is found in four important areas of the State (Figure 15). The Finger Lakes and Western New York regions are dominant with a significant acreage in the Hudson Valley and a smaller acreage in the Northern New York counties of Clinton and Essex along Lake Champlain. Apple acreage is concentrated along the shores of Lake Ontario in Western New York and in the Hudson Valley, primarily in Ulster County (Figure 16). Grape acreage is concentrated in Chautauqua County and the Finger Lakes region (Figure 17). Suffolk County has shown a significant increase in acreage in recent years.
Sales of nursery and greenhouse products are highest in the metropolitan areas of the State (Figure 18)« Suffolk County recorded sales of 90 million dollars or approximately 40 percent of the State total. Other counties with large sales were Erie, Orange, Wayne, and Oneida.
Livestock and Poultry
The distribution of milk cows across the State finds every county other than metropolitan New York City, Long Island, and the Adirondacks, with significant numbers of dairy cows (Figure 19). St. Lawrence and Wyoming Counties have the largest cow inventories followed by Jefferson, Madison, Oneida, Lewis, and Washington Counties.
The inventory of beef cows is also widespread throughout the State with the Western Southern Tier counties showing the greatest numbers (Figure 20). Finger Lakes and Western New York regions have the largest concentrations of hogs and pigs (Figure 21). The sheep and lamb inventory is largely located in Yates, Livingston, Cortland, and Dutchess Counties (Figure 22).
Economic Characteristics
Farm production expenditures totaled approximately 2.1 billion dollars in 1992 (Figure 23). Production expenditures include normal operating expenses such as feed, seed, fuel, labor, property taxes, repairs, and interest on debt. It does not include machinery and equipment or real estate purchases or depreciation on capital assets. Farms in almost every county purchased over 20 million dollars in inputs, adding in an important way to value-added in the county economy.
Net cash return from agricultural sales was over 456 million dollars in 1992 (Figure 24). Net cash return was calculated by the ....Census simply by subtracting cash expenses from cash receipts. Suffolk, St. Lawrence, and Wyoming Counties recorded the largest net return from agricultural sales.
Net cash return per farm averaged $14,123 in 1992 (Figure 25). Suffolk County averaged $51,000 net cash return per farm, the highest in the State.

New York State Counties
Ilegany
St. Lawrence
Broome
\..oJ .......
I

Figure 1. Number of Farms, 1992.
fARMS
o Less than 500
D 500 to 1.000
~ 1.000 and above
New York Total: 32,306 Farms
488
~
. I

Figure 2. Land in Farms, Thousand Acres, 1992.
t::l
IH.OllSAtiIL_AC_R£S 'I i \ ITTl.-7"'Y"
D Less than 150
D 150 to 250
~ 250 and Above
New York Total: 7,458,015 Acres
. I

Figure 3. Harvested Cropland. Thousand Acres. 1992.
~
63
5775
New York Total: 3,534,898 Acres
!HOUSAND ACRES -- ,~)
D 100 and Above
D Less than 50
D 50 to 100
. I

Figure 4. Total Cropland, Thousand Acres, 1992.
Il:iQUSAM.Il_ACR-ES -d'w> ,
86D Less than 100
D 100 to 150
~ 150 and Above ~
New York Total: 4,876,169 Acres

Figure 5. Total Cropland as a Percent of Land in Farms, 1992.
f.EBCENI /1- \54o Less than 60
[ill]]] 60 to 75
~ 75 and Above
59 57
5655
New York Average: 65%
~
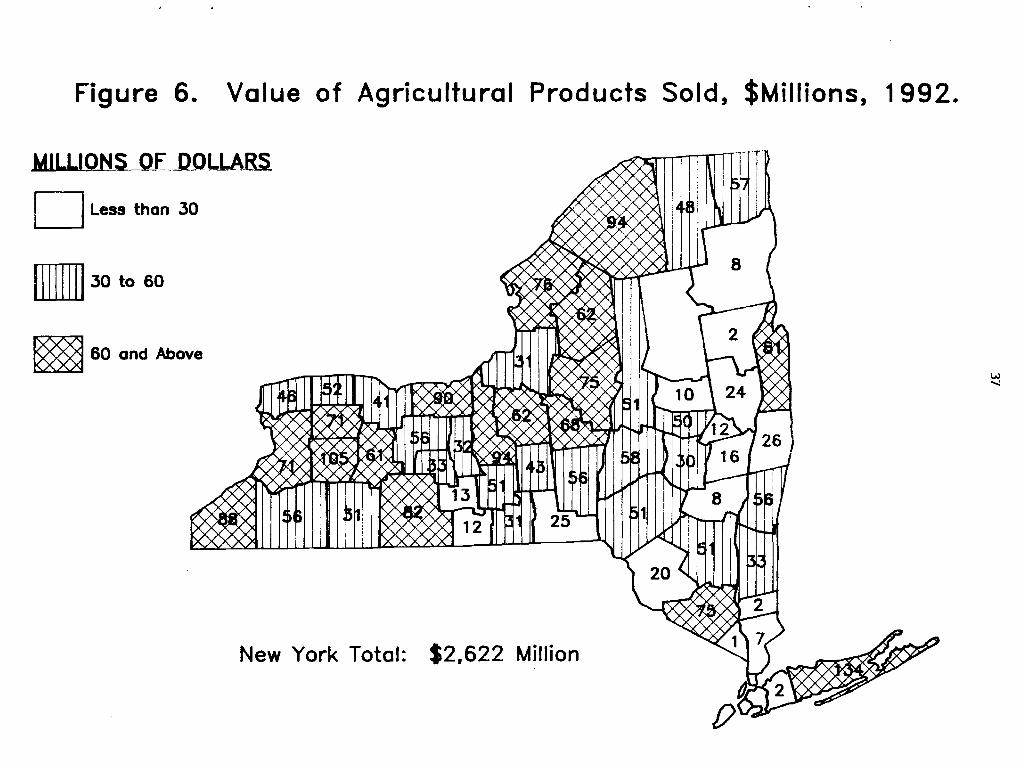
Figure 6. Value of Agricultural Products Sold, $Millions, 1992.
.MI.I.LLOtiS-OE,_DOLLAR-S
D Less thon 30
D30to60
~ 60 and Above
New York Total: $2,622 Million
W -...l
~ I

Figure 7. Percent of Farms with Sales Less Than $50,000, 1992.
fERCEtU
D Less than 60
[ill]]] 60 to 70
~ 70 and Above
New York Average: 65%
52
~
I

Figure 8. Number of Farms with $100,000 or More of Sales, 1992.
fARM-.S
W
D Less than 100
[[]]]] 100 to 200
~ 200 and Above -0
New York Totol: 7,327 Forms

Figure 9. Corn Grain Acreage, Thousands, 1992.
8
6
1624
New York Total: 518,839 Acres
.5
!HOUSAND_nACRES ---.r I ~
05 to 20
o 20 and Above
o Less than 5
, I

Figure 10. Corn Silage Acreage, Thousands, 1992.
IHOUSAND ACJ~_ES
D Less thon 10
nmm 10 to 15WlillJ
~ 15 and Above e:
New York Total: 544,045 Acres

.-t7"wr I I
New York Total: 2,013.646 Acres
Figure 11. Hay Crops Acreage, Thousands, 1992.
II:iOU.S.-~N_D_.A.CRE.S Iii til I I 11 n
D Less than 30
~s;~ 60 and Above ~
~

Figure 12. Oats for Grain Acreage, Thousands, 1992.
IHOUSANll. ACR-ES.
o Less than J
[[III] J to 10
~ 10 and Above
.7
2.7
New York Total: 109.686 Acres
--... i
t:;
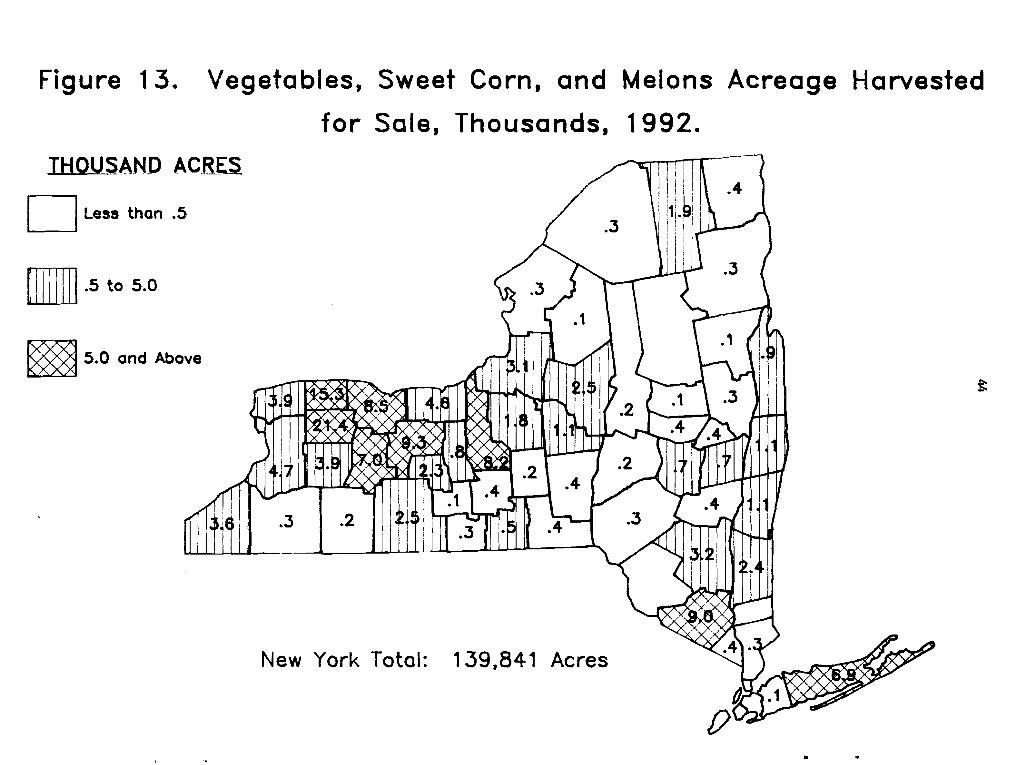
Figure 13. Vegetables, Sweet Corn, and Melons Acreage Harvested
for Sale, Thousands, 1992.
New York Total: 139,841 Acres
lHO.U..SAN_D AC_RES
o Less thon .5
D.5 to 5.0
~ 5.0 and Above
.3 .2 .4
.4
t
I

Figure 14. Potato Acreage, Thousands, 1992.
IHO.USAN.D_ACfiES
D Less than .5
lJIIllI] .5 to 1.0
~ 1.0 and Above
.1
New York Totol: 28.861 Acres
.eU'1
~ I
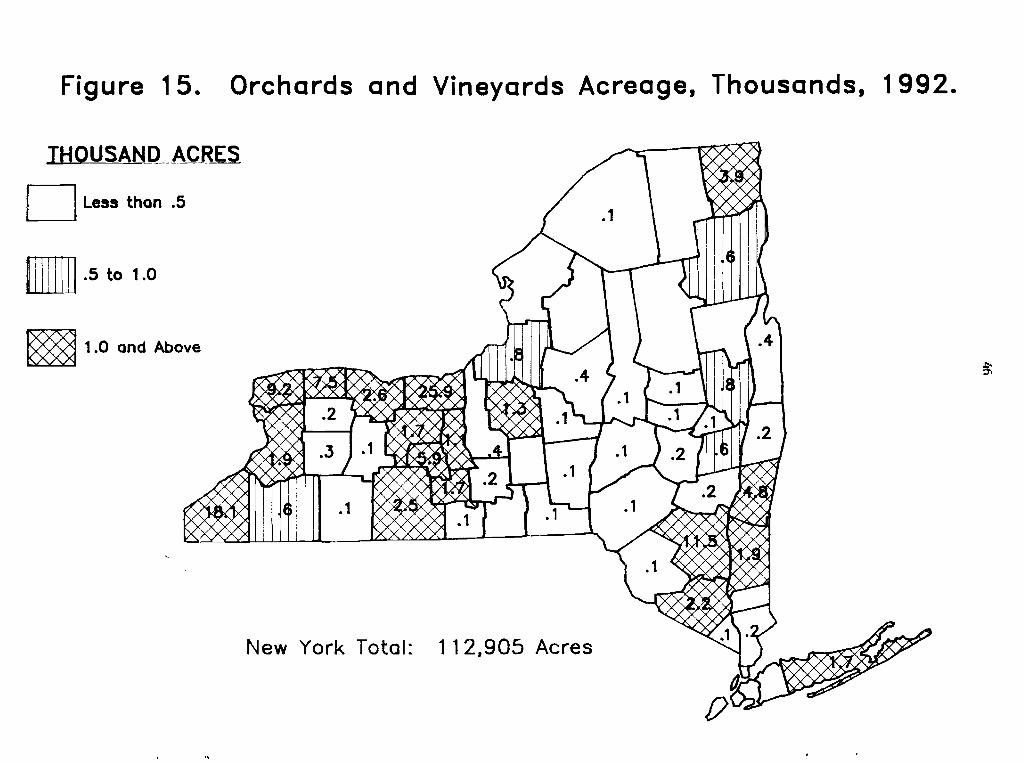
Figure 15. Orchards and Vineyards Acreage, Thousands, 1992.
.IHOUSAND .ACRES
D Less than .5
D.5 to 1.0
~ 1.0 and Above
New York Total: 112,905 Acres
bo
""
'.
I

•
New York Total: 67,.31.3 Acres
.e
Figure 16. Apple Acreage, Thousands, 1992.
IHOUSAHrLACRES
o Less than .5
ITIIIJ] .5 to 1.0
~ 1.0 and Above
-..J
.1.3

New York Total: 34,250 Acres
Figure 17. Grape Acreage, Thousands, 1992.
IHOUSANO ACRES ---... , )
D Less than .5
D.5 to 1.0
~ 1.0 and Above 5;
.... •

•
Figure 18. Nursery and Greenhouse Product Sales, $Millions, 1992.
.MI.LI.lOtiS-,_OF._D_OLLARS.
o Less than .5
g.5 to 1.0
~ 1.0 and Above ,c.. ..0
New York Total: $218,241,000

• •
Figure 19. Number of Milk Cows. Thousands. 1992.
THOUSAND MILK COWS ~_i iii i i II I 11111
D Less than 10
D 10 to 25
~ 25 and Above ~ , ,.--.
~
New York Total: 721,286 Cows
".

New York Total: 72,971 Beef Cows
.9
•
-<?.... , ~
Number of Beef Cows, Thousands, 1992.Figure 20.
~ 2.0 and Above
D 1.0 to 2.0
D Less than 1.0
THOUSAND BEEF COWS
U1 ~'.....t
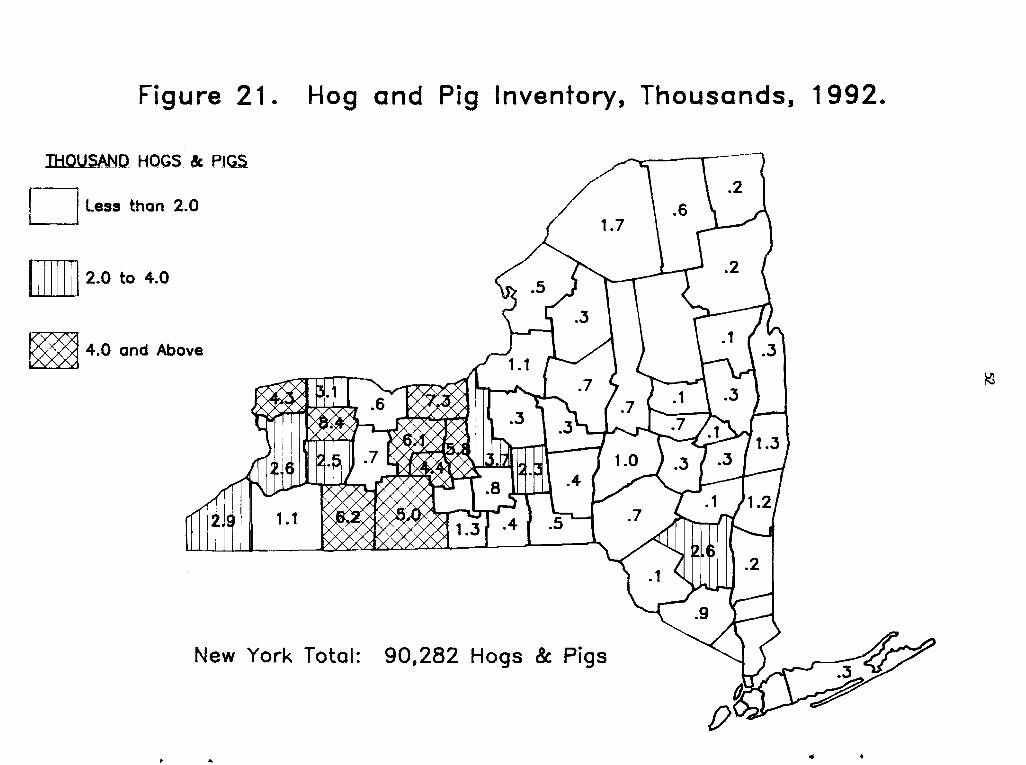
Figure 21. Hog and Pig Inventory, Thousands, 1992.
THOUSAND HOGS. & PJCLS.
D .2 Less than 2.0
.2.0 to 4.0
~ 4.0 and Above
~
New York Total: 90,282 Hogs & Pigs
..

•
Figure 22. Sheep and Lamb Inventory, Thousands, 1992.
-IHO.USAMlS.HEEP .&J"AMBS
D Less than 1.0
[]]]]] 1.0 to 3.0
~ 3.0 and Above
-- 11
<... ". I-'
"'~I . I I
,.) "
~ ..
\ .. "",~ I
.7 1."
.8 \/~' ~~ .9 .
I
;' i \ 1'1
11 -)t 21 : ... ...,... II II i
caJ/ I ~.llJ. Ii L1 .2
~lll t.1'~.4 1-, ,~~ I ~
I , !
,.1 6~~ .8. . I II I[
I: 15 n J ~
~ •~ ~ tI x~
ill:
,:.
~ I I ,..
~...
~) ~ .5, r '{ ~~.
'~I~ l f 4 .~ 1
,ll 1. '/.88
~ ,,1, *11I
fo, ,·.1 ~ 1'.4'.5 \11 "" •7 1 J.+..I+
.l~ , ~ ~ a.Y'1'~~ " ':-'''' II "l
1JI'~ lE .1 ) 14.~ ~ ~ ~ 1'"' 1 I.,... ...
'1"" 100''''''' ' ..... ., .....1I 7 '
.'5' - .9 .)••• ' r( · ~~ .......... ) ~
~ 1.9
',~ ....
New York Total: 76,682 Sheep & Lambs
') >f< ,~ ~ >Q1 _II ?'?
~ I .~ ) __ I
........ ,,'I
'-.........
a f)
~ -.1
-?
~

Figure 23. Total Farm Production Expenditures, $Millions, 1992.
New York Total: $2, 142, 169.000
MIWONS .Df_DOJ..LAB.S.
~
D Less thon 20
D20 to 50
~ 50 and Above
... +•
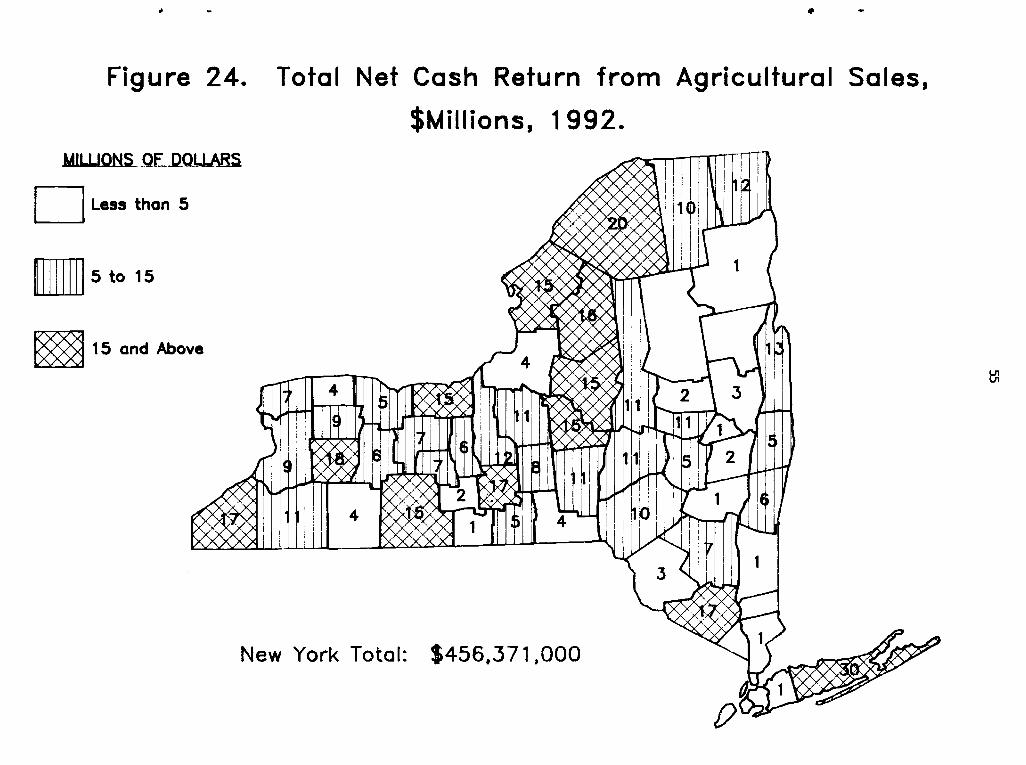
· - . Figure 24. Total Net Cash Return from Agricultural Sales,
$Millions, 1992.
~
UIWONS Of_D_QLJ.ABS
D Less than 5
Us to 15
~ 15 and Above
New York Total: $456,371,000

Figure 25. Net Cash Return from Agricultural Sales per Farm,
$Thousands, 1992. II:iOU.sANDS Of DOLLARS
D Less than 5
D 5 to 15
~ 15 and Above
~
New York Total: $14,123
• • ..

OTHER A..M.E. ~XTENSION BULLETINS (Formerly A.E. xtension PUblications)
o. 94-15 Dairy Farm B siness S mmary Easter Plateau Regio 1993
No. 94-16 Extra-Market Considerations in Farmla d and Agricultural Policy
No. 94-17 Fin ncial Consideratons When E panding Your Da'ry Farming Operation
No. 94-18 o r airy in Transition a the Industry
Your Farm
No. 94-19 Your Dairy in Transition A Planning Process for considering Dairy Farm Expansion
No. 94-20 Yo Down
Dairy Transition Your Farm Operation
Winding
No. 94-21 Dairy arm Bus'ness Summa y Eastern N v York Renter Summary 1993
0.' 94-22 Income Tax Consequences of Farm Debt Cancellation and Bankruptcy
o. 94-23 Farm Income Tax Management Report'ng Reference Manua
and
o. 94-24 Dair Far Business Summary New York Large Herd Farms, 300 Cows 0 Larger 1993
No. 94-25 N w York conomic Handbook 1995 Agric ltural situation and Outlook
Robert . Milligan Linda D. utnam John S. Carlson A. C rl Cr'spell Gerald A. LeClar
Gregor L. Poe
John R. Brake
Facu ty & Staff Cornell University
Faculty & Staf Cornel University
Jo R. Brake
Stuar F. it Lind D. Putnam
George Casler
George L. Casle Stuart F. S ith
Jason a szes S uart F. Smith Lin a D. P tnam
A. R. . E. Staff