center for microfinance and development university of dhaka cmd working paper · pdf...
TRANSCRIPT

Center for Microfinance and Development University of Dhaka
CMD Working Paper 05
Microfinance and Environment: Does the Participation in the Microcredit Based Social Forestry of Proshika in Bangladesh Improve Environmental
Literacy?
M. Jahangir Alam Chowdhury mjac (at) univdhaka.edu
Abstract: The study intends to assess the impact of the participation in the microcredit based social forestry program of Proshika in Bangladesh on the environmental literacy of participating households. The analysis is based on a household-level survey of 450 households. Considering the endogeneity in program participation, the instrumental variable (IV) technique has been used to achieve the objective of the paper. The results indicate that the participation in the social forestry program of Proshika significantly enhances the environmental literacy of participating households. Keywords: Microcredit, Social Forestry, Environmental Literacy, Proshika, Bangladesh
[An earlier version of this paper was presented at the Annual Conference of Pakistan Institute of Development Economics (PIDE), 13-15March, 2008, Islamabad, Pakistan]
August 2008 Dhaka

Microfinance and Environment: Does the Participation in the Microcredit Based Social Forestry of Proshika in Bangladesh Improve Environmental
Literacy?
M. Jahangir Alam Chowdhury1
Abstract: The study intends to assess the impact of the participation in the microcredit based social forestry program of Proshika in Bangladesh on the environmental literacy of participating households. The analysis is based on a household-level survey of 450 households. Considering the endogeneity in program participation, the instrumental variable (IV) technique has been used to achieve the objective of the paper. The results indicate that the participation in the social forestry program of Proshika significantly enhances the environmental literacy of participating households. Keywords: Microcredit, Social Forestry, Environmental Literacy, Proshika, Bangladesh
1.0 Introduction
The rapid reduction of forest resources has posed a serious threat to the ecological balance in
Bangladesh. There is a positive correlation between poverty and deforestation. Approximately 40%
of the population live under the poverty line. People are poor because they have lack of entitlement
on absolute minimum necessities of life. Absolute minimum necessities of life include food,
education, clothing, housing and health. Poverty of households contributes significantly to
deforestation as poor households are dependent on local forest for their livelihood and for fuelwood.
Firstly, the poor do not have the purchasing power to procure firewood from market. Secondly, the
local forest becomes the main source of income, for large number of poor household, due to lack of
employment opportunities and lack of capital required to start an independent business. Thus,
poverty becomes one of the many contributors to deforestation and consequently, to deterioration of
environment. According to studies, deforestation occurs due to the use of fuelwood, fodder and
other forest products by local poor people (WCED, 1987; Timberlake, 1985; Anderson and
Fishwick, 1984; IUCN et al. 1980). Currently the coverage of natural forest is 835,000 hectares
(excluding parks and sanctuaries), which accounts for 5.8 percent of the total land area of
1 Dr. Chowdhury is Professor in the Department of Finance and Executive Director of the Center for Microfinance and Development, University of Dhaka.
2

Bangladesh. At present, the per capita forestland is less than 0.02 hectares, which was 0.035
hectares per person in 1968-69 (Huq and Alim, 1995).
Against this backdrop, some non-government organizations (NGOs) in Bangladesh have come
forward with the objective of improving the environment and alleviating poverty through social
forestry programs. Some of these NGOs, for example Proshika, are using microcredit, small
collateral-free loans, to motivate poor households to participate in the social forestry program.
Social forestry consists of all programs and activities at the community level dealing with tree
planting in farms and other categories of lands, caring for the trees and using them for economic and
environmental benefits. The activities under the social forestry include tree nursery establishment,
tree planting on farms and other categories of land, management and utilization of wood and non-
wood forest products for a variety of goods and services. Social forestry programs are aimed
primarily at helping small farmers and landless to meet their consumption and income needs. The
participants receive training on environment and forestry. The main goals are to induce a large
number of poor people to plant trees for their own benefits and to make them more environmentally
knowledgeable.
Keeping in mind the objectives of Proshika in implementing social forestry program, this paper
intends to examine whether the participation in the social forestry projects improves the
environmental literacy of households. Due to time and financial constraints, the present study only
looks into strip and block plantation programs to achieve its objectives. The remainder of this paper
is organized as follows. Section two is a brief discussion of Proshika and its social forestry program.
Section three outlines the issue of environmental literacy. Section four describes the survey design.
The methodology and the estimation strategy of this paper are discussed in section five. Results are
presented in section six. Conclusions follow in section seven.
2.0 Proshika and the Social Forestry Program
Proshika, one of the three largest microfinance institutions in Bangladesh, was established in the
year 1976 and it envisages a society which is economically productive and equitable, socially just,
environmentally sound, and genuinely democratic. The organization’s mission is to conduct an
3
extensive, intensive, and participatory process of sustainable development through empowerment of
the poor. Empowerment makes the poor functionally literate, enables them to take better care of
their health, to get involved in environmental protection and regeneration, get elected in local
government bodies and community institutions, and provides the poor with better access to public
and common property resources. Up to December 2004, Proshika mobilized 2.6 million members
through out the country and disbursed a cumulative amount of Taka 20.6 billion.
Forestry is one of the key components of the activities of Proshika from the beginning. Forestry
activities are divided into two parts. The first part belongs to the Forest Management Program that
supports forestry protection in degraded sal areas and promotes agro-forestry and woodlots in forest
areas. But the size of the activities of the first part is comparatively small. It has presence in only six
upazillas2 in Bangladesh. The second part of the forestry program belongs to Social Forestry. The
activities of the social forestry are comparatively larger than the activities of the Forest Management
program. Currently, Proshika operates in 150 upazillas in 57 districts in Bangladesh. Under the
social forestry program, Proshika promotes two types of activities: (1) Strip and Block Plantations,
and (2) Institutional plantation.
Under the strip and block plantation program, Proshika members plant trees alongside roads,
railways or canals or privately owned land. Before starting a strip and block plantation project,
Proshika helps members of one or two groups to negotiate with owner of the land, who may be a
government agency or a private individual. After the completion of the negotiation and legal
formalities, members complete the plantation. The members of the groups that are involved in the
plantation select some caretakers who are paid to protect the seedlings for the first two to three
years, when the seedlings are especially at risk from grazing animals. Thereafter, the members are
expected to protect the trees from the theft and carry out the required maintenance, especially
periodic pruning and thinning. In return, these members are allowed to use the biomass produced
from trees. At the end, when the trees reach the maturity stage, they are cut off for selling as timber
and the proceeds that come from the sale are divided in agreed proportions among the parties,
Proshika members, landowner and Proshika that are involved in the plantation. During the period
2 In Bangladesh, every district is divided into several administrative proportions, each proportion is known as Thana. Currently, the word ‘Thana’ is replaced by the word ‘Upazilla’. Upazilla means sub-district.
4

1976 to 2002, Proshika completed 14,671 kilometres of strip (Table1) plantation with the
involvement of 6,729 groups and planted 7.3 million trees. Under the block plantation programs,
Proshika planted 48.9 million trees on 17,731 hectares of land during the period 1976 to 2002
(Table 2). Under this program Proshika involved 8,981 groups of their members.
Proshika implements the institutional plantation on the campuses of the educational institutions with
the objective of creating a more pleasant environment for the teachers and students. Sometimes
Proshika also implements this project as part of joint research into newly introduced species. During
the period 1998 to 2002, Proshika brought 562 institutions into its coverage under the institutional
plantation program. During the same period, Proshika planted 472, 378 seedlings in these 562
institutions.
3.0 Environmental Literacy
Environmental literacy can be defined as knowledge and understanding of individuals about the
factors and issues related to environment and also about how environmental factors affect the
quality of life of individuals. It can also be defined as the quality or state of being able to understand
environmental issues and the consequences of the changes in the factors that constitute the
environment on the quality of life of individuals. Hares et al. (2006) define environmental literacy
as “peoples perception of their physical environment”. They argue that the environmental literacy of
a person is shaped by the personal learning process of that person and the personal leaning process
depends on socio-economic, political, cultural, historical, and ecological circumstances that exist
around the person. In addition to the personal leaning process, individual features, for example age
and intelligence, also determine the level of environmental literacy.
It is expected that an environmentally literate person will have better perception about environment.
Whyte (1977) defines environmental perception as “the human awareness and understanding of the
environment in a general sense of the term”. Against the backdrop of climate change and its
consequences, the issue of public concern about environmental issues is getting increasingly
scholarly attention. But, the majority of work on public environmental perception has been done in
developed countries (Brechin and Kempton 1994; White and Hunter, 2005). Considering the
5

growing dependence on natural resources in developing countries, it is also important to conduct
researches on environmental perception in developing countries (High and Shakleton 2000; Twine
et al. 2003)
Roth (2002) identifies the following factors that environmentally literate people should know and
understand: (a) The physical process that shape the patterns of the Earth’s surface; (b) The
characteristics and spatial distribution of ecosystems on earth’s surface; (c) The characteristics,
distribution, and migration of human populations on earth; (d) The patterns and networks of
economic, social, and political interdependence on earth; (e) The processes, patterns, and functions
of human settlement; (f) How human actions modify the physical environment; (g) How physical
systems affect human systems; (h) The changes that occur in the perception, use, distribution, and
importance of resources.
In the present study, the households have been asked to give their opinion on thirteen environmental
issues to understand the level of environmental literacy of those households. These environmental
issues are: (1) I do not believe that human being are polluting environment; (2) Dust, smoke from
brick fields, and chemical wastage from factories are polluting environment; (3) Lack of
environmental knowledge is causing massive climate change; (4) The use of the pesticide and
fertilizer for agricultural purposes is not bed for environment; (5) A portion of the pesticide and
fertilizer that we use for agricultural purposes remains in food and it is bad for health; (6)
Environmental degradation, especially arsenic contamination, will create shortage of drinking water
in the near future; (7) Modern agricultural activities today lead to the destruction of natural biotopes
and to a reduction in wildlife as well as wild plants; (8) The incremental use of pesticide and
fertilizer reduces the product quality; (9) Environmental problems resulting from agricultural
activities are exaggerated by the media; (10) The use of pesticide and fertilizer in agriculture is
causing water pollution; (11) In spite of limitations, farmers can protect the environment; (12) The
use of pesticide and fertilizer is not harmful for the environment, rather they promote high quality
production; (13) The governmental and non-governmental organizations will have to become more
active in protecting environment.
6

The responding households have been asked to give their opinion on a 5-point scale, ranging from
“strongly agree” to “strongly disagree”. One the basis the responses of households related to the
above mentioned 13 points, an environmental literacy score has been calculated for every
household. In the case of an affirmative statement, the highest 5 points have been awarded to a
household if the response is “strongly agree” and the lowest 1 point has been awarded to “strongly
disagree”. In contrary, 5 points have been awarded to “strongly disagree” and 1 point has been
awarded to “strongly agree” in case of a negative statement. The highest achievable environmental
literacy score is 65 and the lowest achievable environmental literacy score is 13 for a household. A
household has been identified as an environmentally literate household if the total environmental
literacy score is more than 51. On the other hand a household has been considered as an
environmentally illiterate if the total environmental literacy score is less than or equal to 51.
4.0 Survey Design and Data
The analysis reported in this paper is based on a household-level survey of members of a Proshika
branch carried out from February to April 2007 (450 households). The data were collected through
face-to-face interviews following a four-stage sampling design. In the first stage, a district, out of 64
districts in Bangladesh, had been selected. The name of the district is Gazipur. In the second stage, a
branch from the list of the ‘branches’ of Proshika in Gazipur was selected. A branch usually consists
of some ‘centers’, with each center having 30 to 40 members. The selected branch was about 60 km
distant from Dhaka, the capital of Bangladesh. In the third stage, centers were selected from the
selected branch. In the fourth and final stage of sampling, individual households were selected. In
this randomly selected branch of Proshika, the total number of participating households was 6200.
Among these 6200 households, only 2100 households participated in social forestry projects. For
the data collection purpose, all the member households in the branch had been divided into three
categories: (1) households that participated microcredit as well as social forestry projects (SF
group); (2) households that participated in the microcredit program, but did not participate in social
forestry projects (comparison group 1); and (3) households of new members who had just received
their first loan, or were waiting for receiving the first loan (comparison group 2), but did not
participate in social forestry projects. The list of member households was obtained from the branch
office of Proshika and households were randomly selected from three categories of membership
7

mentioned above. The survey expected 150 questionnaires from each of three membership
categories. In some centers, households from the third category were not available. In case of the
non-availability of households in the third category of membership, these households had been
replaced by households from the first and second categories. During the data entry and data cleaning
stages, some questionnaires were dropped due to inconsistent responses and missing data. Finally,
these resulted in total 420 households (Table 4) from the branch for data analysis. In total,
information was collected from 152 households from the social forestry group; 174 households
from the comparison group 1 and 94 households from the comparison group 2.
Besides information on social forestry and environment, the survey collected detailed information
on a variety of factors. For example, demographic information (age, sex, marital status, etc.) and
socio-economic information (education, employment, food consumption, expenditure on health,
etc.) was collected for all household members. Detailed village-level information was also collected,
such as distance to nearest primary school, secondary school, market and district headquarters,
along with variables describing village infrastructure, such as the presence of schools, markets,
roads, electricity, etc. Information relating to the size of loan received, date of joining and other
membership characteristics was provided by branch officials and matched to the data.
5.0 Estimation Strategy
Keeping in mind the limitations of the simple comparison method, the multivariate analysis
technique has been used to assess the impact of the participation in the social forestry program of
Proshika on outcome variables at the household level. The main advantage of this technique,
compared to the simple comparison method, is that it enables the study to control those household
and village level variables that influence the outcomes.
Given the extensive geographic coverage of microcredit in Bangladesh it is difficult to find out a
perfect ‘control’ group that could be used to estimate the impact of microcredit based social forestry
on outcome variables. The choice of a household to attend a microcredit based social forestry is
likely to be related to the outcomes of interest i.e. environmental literacy in this paper. Given the
outcome for household i, the following equation has been estimated:
8

(1) Yi = β’xi + γSF + ui
where x is a vector of some control variables that are assumed to be exogenous (for example,
education of the household head, the existence of electricity in the household, etc.), and SF
represents the social forestry participation, and ui is the error term.
The participation in the social forestry is defined by the equation given below:
(2) SF = δ’xi + νi
Where xi represent some control variables and νi represent the error term of the model. While the
impact of SF is estimated using the equation (1), it is assumed that the error terms of equations (1)
and (2), i.e. ui and νi, are not correlated. But, these two error terms become correlated, if the
characteristics of households that influence the social forestry program participation decision also
determine the outcome variable, i.e. Yi in equation (1). In such a situation, the OLS estimation of
equation (1) yields a biased estimate of the parameter of interest γ. Keeping this in mind, the
instrumental variable (IV) technique has been used. In the IV technique, at least one variable that is
likely to affect the decision to participate in the social forestry program but is unlikely to affect
directly the outcomes of interest, i.e. environmental literacy, has been identified (Heckman 1997).
Under the instrumental variable approach, the equation (2) is rewritten as below:
(3) SF = δ’xi + λz + νi
where z is the instrumental variable. In order to obtain consistent estimates, we assume that λ≠0 and
that zi is uncorrelated with ui. Considering the geographical locations of social forestry projects and
participating households, it is believed that the distance of the household from the nearest social
forestry project is going to be a good instrument. Because it is considered that the nearest
households get priority in terms of joining the project when Proshika decides to implement a social
forestry project on a road in an area, and that this distance does not influence environmental literacy
of households. Some may confuse the distance of a household from the nearest social forestry
9
project with the distance of that household from the nearest paved road. The distance of the
household from the nearest social forestry project is different from the distance of the household
from the nearest paved road. Table 1 shows that the households that participate (SF households) in
the social forestry projects are on an average of 0.7 kilometers away from the nearest projects. On
the other hand, the households that do not participate in the social forestry projects (Non-SF
households) are 1.7 kilometers away from the nearest social forestry projects. It is evident from the
t-test that non-SF households are significantly away from the nearest social forestry projects
compared to SF households.
On top of applying the IV technique, a comparison has been done between those who participate in
the microcredit based social forestry program of Proshika (Program households) and those who are
the members of the microcredit program of Proshika, but have not participated in the social forestry
program (comparison group). Although, all non-social forestry households were divided into two
groups, CG1 and CG2, during the period of data collection, these households have been combined
together (CG households) during data analysis and have been compared with social forestry
households. The reason behind combining these two groups is that both the groups do not
participate in the social forestry projects. Since they did not receive any training from Proshika
regarding planting trees and environment, the environmental literacy is expected to be the same for
both the groups. The impact of social forestry has been assessed though comparing means and
distributions of outcome variables of program and comparison groups. The differences in the means
and the distributions of outcome variables of these two groups capture the impact of the
participation in the social forestry program at the household level.
Considering the endogeneity in the participation of households in microcredit based social forestry
projects, the assessment of the impact of microcredit based social forestry participation on the
environmental literacy has been done through using two stages of regression analysis. The first
stage regression (equation 3) models the participation decision of households in the social forestry
projects. In this model, some variables (xi) have been put on the right hand side of the model as
control variables that influence the participation decision of households along with the instrumental
variable (z). After running the first stage regression, the participation in the social forestry projects
has been predicted. The predicted participation and the residual of the model have been used as
10
independent variables along with other control variables in the second stage regression that model
(equation 1) environmental literacy score.
In the first stage regression, apart from the instrumental variable, the variables that have been used
as control variables are: four dummy variables that are related to the employment status of the
household head (empdl, empbu, empag and empsr); one variable which is related to land ownership
of households (land); eight variables on the size of a household in different age groups (tmm6b,
tfm6b, tmm625, tfm625, tmm2660, tfm2660, tmm60a, and tfm60a), two variables related to the
demographic information of the households head (hhage, and hhsex,), and finally two variables that
are associated with the education level of the household head and other members (hhedu and
xhhtedu)3.
In the second stage regression, the predicted value (psf) of the participation of a household in a
social forestry project which has been generated from the first stage regression has been used as a
control variable. The residual from the first stage regression (resid) has also been included in the
model as an independent variable. All variables of the first stage regression except the distance of
the household from the nearest social forestry project (sfdis) and total area of land (land) have been
used as control variables in the second stage regression. It is expected that the area of land of a
household does not influence the label of environmental literacy of that household. This is the
reason behind dropping the area of agricultural land as an independent variable is the second stage
regression. In addition, a dummy variable that represents the existence of electricity (elec) in the
household has been included in the model. The reason behind this inclusion is that the existence of
electricity in the household indicates the better access of the household to information on
environment through radio and television. It is assumed that the existence of electricity in a
household increases the probability of owning radio and television by that household.
5.0 Results
Table 3 presents the distribution of the responses of households regarding thirteen environmental
issues. It shows that the higher number of social forestry (SF) households give environmentally
3 Please see the detailed labels of these variables in Table 5.
11
logical responses compared to non-social forestry (CG) households. The chi-square test results
indicate that the distribution of the responses of SF households is significantly different from that of
non-social forestry households. All together, these results indicate that the participation in the SF
program enhances environmental knowledge of households and it enables households to give more
environmentally logical responses in response to the questions related to environment.
Table 4 shows the total environmental literacy score by household groups. It indicates that the
average literacy score of non-social forestry households (CG households) is 40. On the other hand,
the average literacy score of SF households is 49. On an average, the SF households have 25%
higher literacy score compared to CG households. The t test results indicate that SF households
have significantly higher environmental score compared to CG households.
Table 5 shows the distribution of environmental literacy status by household groups. The
environmental literacy status of a household has been determined on the basis of the methodology
that has already been explained in section 3. It shows that 36% of the households that participate in
the SF program of Proshika are environmentally literate. On the other hand, only 6% households
that do not participate in the SF program of Proshika are environmentally literate. These results
indicate that the environmental literacy rate is 30% higher among SF households compared to non-
social forestry households. This reveals that the participation in the SF program enhances
environmental knowledge of households and thus, it makes these households more environmentally
literate.
5.1 Determinants of Social Forestry Participation and Environmental Literacy
In the first stage regression, the probit model has been used since the dependent variable is a
dummy variable where a household has been assigned 1 if it participates in a social forestry project
and assigned 0 otherwise. The results on Table 7 show that the distance of the household from the
nearest social forestry project significantly determines the decision of a household to participate in a
social forestry project. The relationship between the distance of the household (sfdis) and the
participation in a social forestry project (sf) is negative. These results indicate that an increase in the
distance of the household from the nearest social forestry project reduces the probability of joining
12
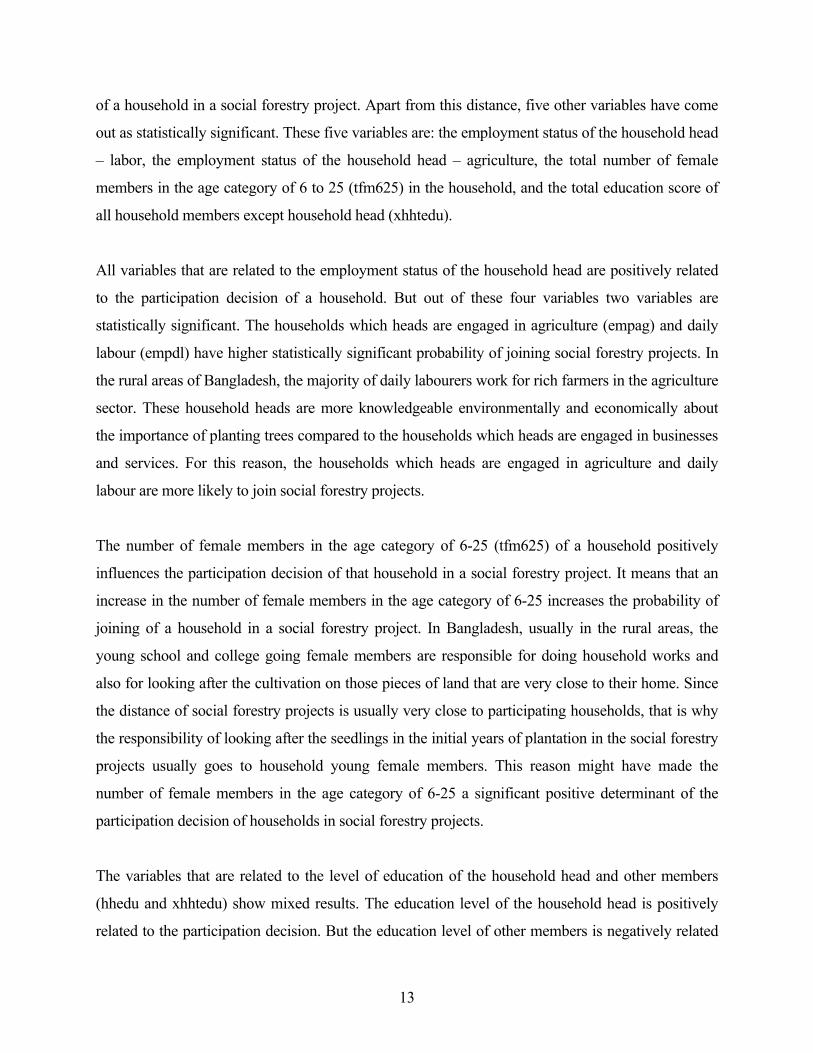
of a household in a social forestry project. Apart from this distance, five other variables have come
out as statistically significant. These five variables are: the employment status of the household head
– labor, the employment status of the household head – agriculture, the total number of female
members in the age category of 6 to 25 (tfm625) in the household, and the total education score of
all household members except household head (xhhtedu).
All variables that are related to the employment status of the household head are positively related
to the participation decision of a household. But out of these four variables two variables are
statistically significant. The households which heads are engaged in agriculture (empag) and daily
labour (empdl) have higher statistically significant probability of joining social forestry projects. In
the rural areas of Bangladesh, the majority of daily labourers work for rich farmers in the agriculture
sector. These household heads are more knowledgeable environmentally and economically about
the importance of planting trees compared to the households which heads are engaged in businesses
and services. For this reason, the households which heads are engaged in agriculture and daily
labour are more likely to join social forestry projects.
The number of female members in the age category of 6-25 (tfm625) of a household positively
influences the participation decision of that household in a social forestry project. It means that an
increase in the number of female members in the age category of 6-25 increases the probability of
joining of a household in a social forestry project. In Bangladesh, usually in the rural areas, the
young school and college going female members are responsible for doing household works and
also for looking after the cultivation on those pieces of land that are very close to their home. Since
the distance of social forestry projects is usually very close to participating households, that is why
the responsibility of looking after the seedlings in the initial years of plantation in the social forestry
projects usually goes to household young female members. This reason might have made the
number of female members in the age category of 6-25 a significant positive determinant of the
participation decision of households in social forestry projects.
The variables that are related to the level of education of the household head and other members
(hhedu and xhhtedu) show mixed results. The education level of the household head is positively
related to the participation decision. But the education level of other members is negatively related
13

to the participation decision. Among the microcredit member households that have more educated
household heads are more likely join a social forestry project. It is expected that more educated
heads are more knowledgeable about the importance of forestry in environment. That is why
households with more educated heads are more likely to join social forestry projects. But the
education level of the household head is not statistically significant. On the other hand, the
education level of other members in the household significantly negatively determines the
participation decision of households in social forestry projects. It means that the households that
have more educated members are less likely to join a social forestry project. The reason might be
that these households are better off in terms of employment opportunities and the income level and
the participation in social forestry projects is not economically attractive to them. For these reasons,
the households with the better education of members other than the head prepare not to join social
forestry projects.
Since the dependent variable in the second stage regression, the environmental literacy score of
households, has count data characteristics, poisson regression and negative binomial regression
techniques have been applied for determining the determinants of the household environmental
literacy. Table 8 shows the results of the second stage regression. The test of the over dispersion
parameter alpha has been conducted to examine whether negative binomial regression is a better
technique compared to poisson regression for this model. The test result shows that alpha is
significantly different from zero and thus indicates that the poisson distribution is not an appropriate
technique for this model. For this reason, finally, the negative binomial regression technique has
been applied for this model.
The results in Table 8 indicate that five variables significantly determine the household
environmental score. The participation in the social forestry program of Proshika (sf) appears as
significant and positive for the environmental literacy score. It means that participating households
are more environmentally literate compared to non-participating households and the reason is that
participating households receive training from Proshika on social forestry and environmental issues
which makes them more environmentally literate. The membership duration in the Proshika’s social
forestry program (sfd and ssfd) has significant impact on environmental literacy. The membership
duration increases environmental literacy score at a declining rate. The reason might be that the
14

older social forestry member households received lesser training compared to newer households and
that might have made them less literate about environment. These results illustrate that the
participation of households in social forestry projects of Proshika significantly enhances the
environmental literacy of households.
The existence of electricity (elec) in a household is a significant positive determinant of the
environmental literacy score of that household. The existence of electricity in a household increases
the probability of owning radio and television by that household. The ownership of radio and
television gives the household access to better information on environment. In Bangladesh, national
radio stations and television channels broadcast programs on environmental to make people more
aware of environmental issues. For this reason, the existence of electricity in the household
significantly increases the environmental score of the household.
The level of the education of the household head (hhedu) is very significant for the environmental
literacy score of households. It influences the environmental literacy score positively and
significantly. The higher the education level of the household head, the more environmentally
literate the household is. Like the education level of the household head, the education level of all
members in the household except the household head positively influences the environmental
literacy score of households. But it is not statistically significant. These results are very much
logical and expected, as it is considered that education enhances awareness of people about
environment.
7.0 Conclusion
The rapid reduction of forest resources has posed a serious threat to the ecological balance in
Bangladesh. At present, the per capita forestland is less than 0.02 hectares, which was 0.035
hectares per person in 1968-69. Against this backdrop, some non-government organizations (NGOs)
have come forward with the objective of improving the environment and alleviating poverty
through social forestry programs. The activities under the social forestry include tree nursery
establishment, tree planting on farms and other categories of land, management and utilization of
wood and non-wood forest products for a variety of goods and services. Social forestry programs
15

are aimed primarily at helping small farmers and landless to meet their consumption and income
needs. The main goal is to induce a large number of poor people to plant trees for their own
benefits. The participating households receive training on environment and forestry. So, it is
expected that the participating households have better knowledge on environment. Keeping this in
mind, the study attempts to assess the impact of the participation in the SF program of Proshika on
the environmental literacy of households.
Proshika, one of the three largest microfinance institutions in Bangladesh, was established in the
year 1976 and it visualizes a society which is economically productive and equitable, socially just,
environmentally sound, and genuinely democratic. During the period 1976 to 2002, Proshika
completed 14,671 kilometres of strip plantation with the involvement of 6,729 groups and planted
7.3 million trees. Under the block plantation programs, Proshika planted 48.9 million trees on
17,731 hectares of land during the period 1976 to 2002. Under this program Proshika involved
8,981 groups of their members. During the period 1998 to 2002, Proshika brought 562 institutions
into its coverage under the institutional plantation program. During the same period, Proshika
planted 472, 378 seedlings in these 562 institutions.
Environmental literacy can be defined as knowledge and understanding of individuals about the
factors and issues related to environment and also about how environmental factors affect the
quality of life of individuals. An environmental literacy score has been calculated on the basis of the
responses of households on 13 environmental issues on a 5-point scale ranging from “strongly
agree” to “strongly disagree” for every responding household. The highest achievable
environmental literacy score is 65 and the lowest achievable environmental literacy score is 13 for a
household. A household has been identified as an environmentally literate if the total environmental
literacy score is more than 51.
The analysis is based on a household-level survey of 450 households. Considering the endogeneity
in the program participation, the instrumental variable (IV) technique has been used to assess the
impact of the participation of households in the social forestry program of Proshika on the
environmental literacy. The results indicate that the participation in the social forestry program of
Proshika significantly enhances the environmental literacy of participating households.
16

17

References Anderson D, Fishwick R. 1984. Fuelwood consumption and Deforestation in African Countries: a review, World Bank Staff Working Paper 704. (World Bank: Washington, DC.) Brechin, Steven R. and Willett Kempton. 1994. “Global Environmentalism: A Challenge to the Postmaterialsm Thesis?” Social Science Quarterly. 75:245-269. Hares, Minna, Anu Eskonheimo, Timo Myllyntaus, and Olavi Luukkanenet (2006). Environmental Literacy in Interpreting Endangered Sustainability Case Studies from Thailand and the Sudan, Geoforum, 37: 128-44. Heckman, James. 1997. Instrumental Variables. A study of implicit behavior assumptions used in making program evaluation, Journal of Human Resources 32 (3): 441-61 High, C. and C.M. Shackleton. 2000. “The Comparative Value of Wild and Domestic Plants in Home Gardens of a South African Rural Village.” Agroforestry Systems. 48(2):141-156. Huq, M. F. and Alim, A. 1995. Social Forestry in Bangladesh: State of Art Study, BARC-Winrock International Agroforestry and Participatory Forestry Research and Training Support Program, Dhaka. IUCN. 1980. World Conservation Strategy. Living Resource Conservation for Sustainable Development. IUCN, UNEP and WWF. Roth, Charles E. (2002). A questioning Framework for Shaping Environmental Literacy, Earthlore Associates, Available at www.anei.org/ownload/82_questioning.pdf , Accessed on June 01 2007. Timberlake, L. 1985. Africa in Crisis: the Causes and Cures of Environmental Bankruptcy. Earthscan: London. Twine, W., D. Moshe, T. Netshiluvhi and V. Siphugu. 2003. “Consumption and Direct-Use Values of Savanna Bio-Resources Used by Rural Households in Mametja, a Semi-Arid Area of Limpopo Province, South Africa.” South African Journal of Science 99 Sept/Oct:467-473. White, Michael J. and Lori M. Hunter, 2005. Public Perception of Environmental Iuues in a Developing Setting, Working Paper EB2005-0003, Institute of Behavioral Science, University of Colorado at Boulder, Boulder, USA. Whyte, A. V.T. (1977). Field Methods in Guide Lines for Field studies in Environmental Perception, MAB, Technical Notes. 5, UNESCO, France. WCED. 1987. Our Common Future. Oxford University Press: Oxford.
18

Table 1 Social Forestry Program of Proshika
Types of Plantation
Period No. of Seedlings Planted
Area No. of Groups / Institutions Involved
Strip 1976 - 2002 7, 346, 269 14, 671 kilometres 6,729 Groups Block 1976 - 2002 48,915,016 17,731 hectares 8,981 Groups
Institutional 1998 - 2002 472,378 - 552 Institutions
Table 2 Sample Distribution
Sample Group Frequency Percent Cumulative Percent SFG 152 36.19 36.19 CG1 174 41.43 77.62 CG2 94 22.38 100.00 Total 420 100.00
SFG = Social Forestry Group; CG1 = Comparison Group 1, Households (HHs) with Proshika membership more than 1 year belong to this group; CG2 = Comparison Group 2, New member households belong to this group;
19

Table 3 Distribution of the Responses of Households on Environmental Related Issues (in %)
Statement SL Num.
Household Group
Strongly Agree
Agree (%)
Indifferent (%)
Disagree (%)
Strongly Disagree
Chi Square
SF 16.56 21.85 1.99 25.83 33.71 1 Non SF 36.02 9.96 39.85 9..58 4.60
144.29*
SF 58.94 36.42 1.32 2.65 0.66 2 Non SF 25.29 42.91 1.15 11.88 18.77
65.26*
SF 42.38 37.09 13.25 6.64 2.65 3 Non SF 16.48 23.75 28.35 13.41 18.01
65.68*
SF 10.60 16.56 11.92 21.85 39.07 4 Non SF 29.12 16.86 26.82 19.92 7.28
75.89*
SF 49.67 38.41 5.30 5.30 1.32 5 Non SF 16.86 33.72 16.48 13.41 19.54
76.60*
SF 56.95 32.45 4.64 4.64 1.32 6 Non SF 29.12 28.35 5.75 16.86 19.92
56.39*
SF 54.30 33.77 1.32 7.28 3.31 7 Non SF 16.48 26.82 16.09 21.46 19.16
96.03*
SF 44.37 33.77 6.62 11.92 3.31 8 Non SF 19.16 24.90 20.69 14.56 20.69
56.93*
SF 11.26 15.89 25.17 14.57 33.11 9 Non SF 32.18 35.25 18.77 10.73 3.07
94.17*
SF 52.32 35.76 5.30 3.97 2.65 10 Non SF 16.48 36.40 9.58 17.24 20.31
78.86*
SF 48.34 29.14 12.58 7.95 1.99 11 Non SF 15.71 29.89 16.86 16.09 21.46
68.14*
SF 9.27 24.50 12.58 18.54 35.10 12 Non SF 28.35 38.31 15.33 12.64 5.36
76.55*
SF 68.21 27.81 0.00 3.31 0.66 13 Non SF 37.55 22.22 8.43 14.56 17.24
67.54*
* Significant at 1% level.
20
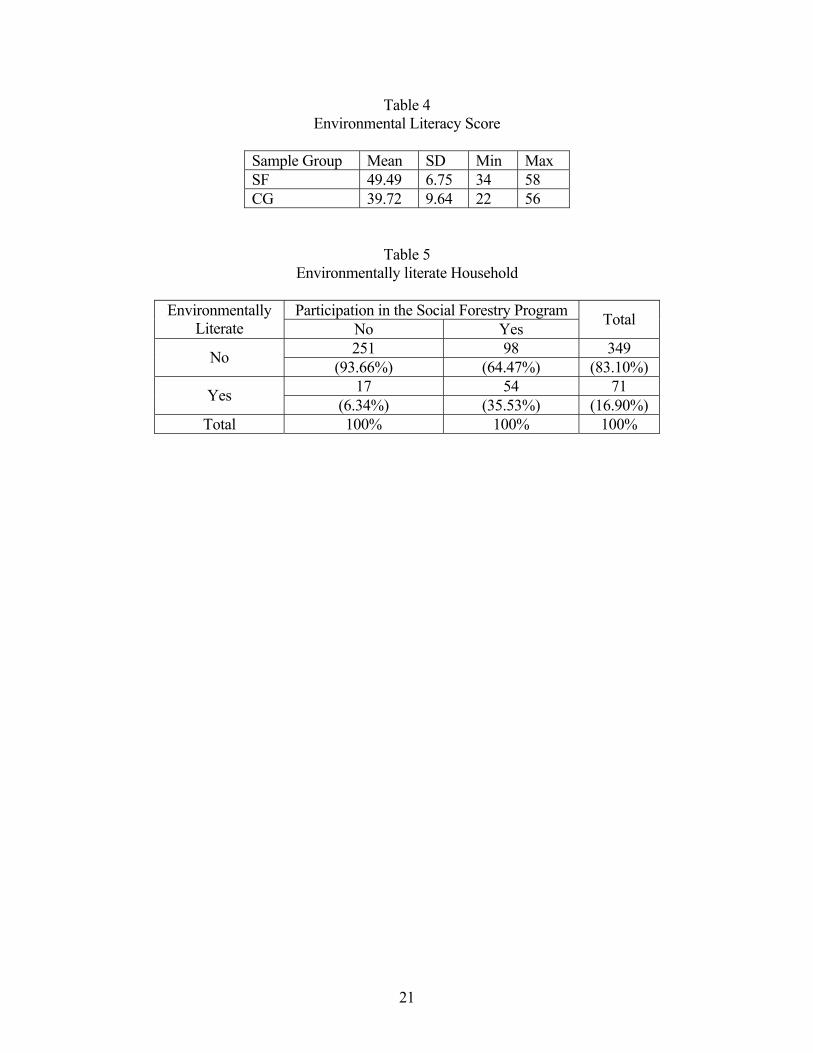
Table 4 Environmental Literacy Score
Sample Group Mean SD Min Max SF 49.49 6.75 34 58 CG 39.72 9.64 22 56
Table 5 Environmentally literate Household
Participation in the Social Forestry Program Environmentally
Literate No Yes Total
251 98 349 No (93.66%) (64.47%) (83.10%) 17 54 71 Yes (6.34%) (35.53%) (16.90%)
Total 100% 100% 100%
21

Table 6 Variables Used in the Analysis
Variable Definition Mean Standard
Deviation sf Social Forestry (SF) Participation, 1 if the
household participates in the SF project, 0 otherwise
0.36 -
sfdis Distance of the household from the nearest social forestry project (kilometres)
1.28 0.96
tnvs Total environmental literacy score 43.29 9.88 elec The existence of electricity in the village; 1 if
the village has electricity, 0 otherwise 0.83 -
land Total area of land (in decimal) 59.99 490.14 empdl Employment of the household head, 1 if head is
a daily labourer, 0 otherwise 0.14 -
empbu Employment of the household head, 1 if head is a businessmen, 0 otherwise
0.23 -
empag Employment of the household head, 1 if head is a farmer, 0 otherwise
0.35 -
empsr Employment of the household head, 1 if head is a service holder, 0 otherwise
0.12 -
tmm6b Total male household members in the age category of 6 and below
0.17 0.42
tfm6b Total female household members in the age category of 6 and below
0.14 0.38
tmm625 Total household male members in the age category of 6 to 25
1.07 0.95
tfm625 Total household female members in the age category of 6 to 25
1.02 0.95
tmm2660 Total household male members in the age category of 26 to 60
1.02 0.72
tfm2660 Total household female members in the age category of 26 to 60
0.79 0.62
tmm60a Total household male members in the age category of 60 and above
0.06 0.24
tfm60a Total household female members in the age category of 60 and above
0.01 0.11
hhsex Sex of the household head; 0 if head is a male, 0 otherwise
0.95 0.23
hhage Age of the household head (in months) 543.08 150.55 hhedu Total years of schooling of the household head 3.75 4.19 xhhtedu Total years of schooling of all household
members except the household head 14.13 11.74
sfd Duration of the membership in the social forestry program (in months)
42.21 81.13
22
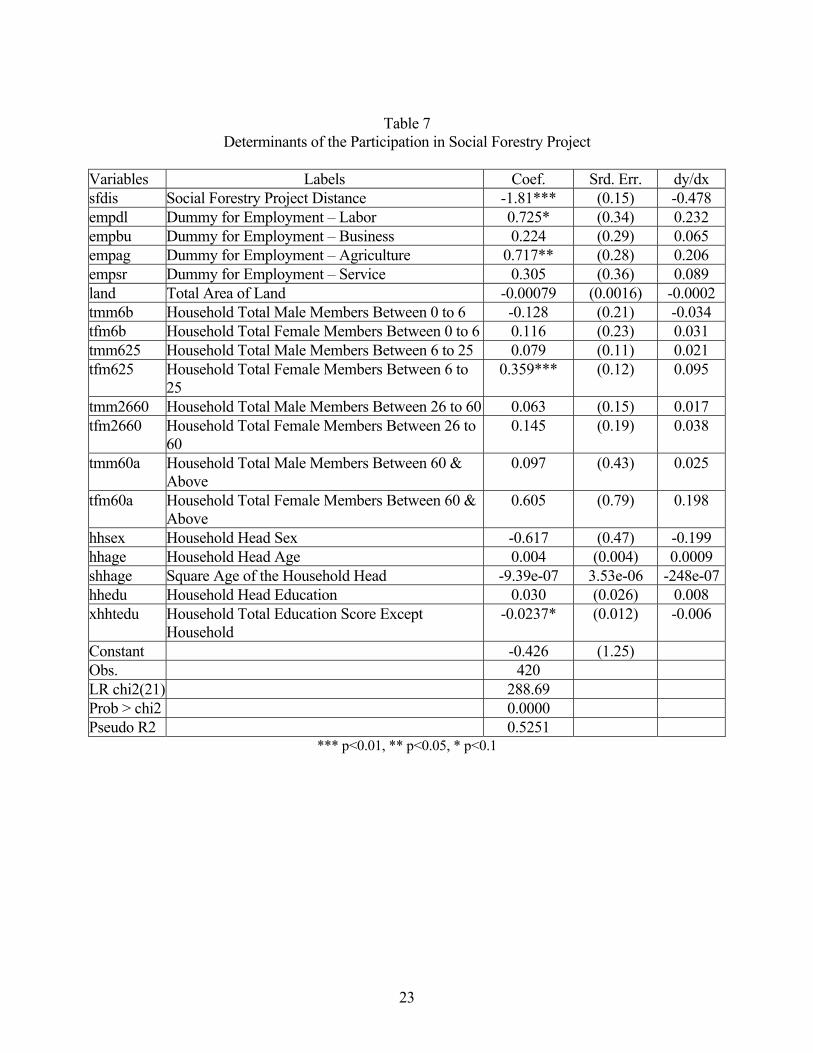
Table 7
Determinants of the Participation in Social Forestry Project
Variables Labels Coef. Srd. Err. dy/dx sfdis Social Forestry Project Distance -1.81*** (0.15) -0.478 empdl Dummy for Employment – Labor 0.725* (0.34) 0.232 empbu Dummy for Employment – Business 0.224 (0.29) 0.065 empag Dummy for Employment – Agriculture 0.717** (0.28) 0.206 empsr Dummy for Employment – Service 0.305 (0.36) 0.089 land Total Area of Land -0.00079 (0.0016) -0.0002 tmm6b Household Total Male Members Between 0 to 6 -0.128 (0.21) -0.034 tfm6b Household Total Female Members Between 0 to 6 0.116 (0.23) 0.031 tmm625 Household Total Male Members Between 6 to 25 0.079 (0.11) 0.021 tfm625 Household Total Female Members Between 6 to
25 0.359*** (0.12) 0.095
tmm2660 Household Total Male Members Between 26 to 60 0.063 (0.15) 0.017 tfm2660 Household Total Female Members Between 26 to
60 0.145 (0.19) 0.038
tmm60a Household Total Male Members Between 60 & Above
0.097 (0.43) 0.025
tfm60a Household Total Female Members Between 60 & Above
0.605 (0.79) 0.198
hhsex Household Head Sex -0.617 (0.47) -0.199 hhage Household Head Age 0.004 (0.004) 0.0009 shhage Square Age of the Household Head -9.39e-07 3.53e-06 -248e-07hhedu Household Head Education 0.030 (0.026) 0.008 xhhtedu Household Total Education Score Except
Household -0.0237* (0.012) -0.006
Constant -0.426 (1.25) Obs. 420 LR chi2(21) 288.69 Prob > chi2 0.0000 Pseudo R2 0.5251
*** p<0.01, ** p<0.05, * p<0.1
23

Table 8 Determinants of the Environmental Literacy Score
Variables Labels Coef. Std. Err. psf Predicted Social Forestry (SF) Participation 0.115*** (0.041) resid Residuals 0.112*** (0.041) sfdis Membership Duration in SF Projects 0.0015*** (0.0005) ssfdis Square of sfd -0.00000256 (0.0000019)elec Existence of Electricity in the Household 0.0467* (0.028) empdl Dummy for Employment – Labor -0.0026 (0.038) empbu Dummy for Employment – Business 0.0178 (0.033) empag Dummy for Employment – Agriculture -0.0049 (0.033) empsr Dummy for Employment – Service -0.0097 (0.039) tmm6b Household Total Male Members Between 0 to 6 0.0328 (0.025) tfm6b Household Total Female Members Between 0 to 6 0.0037 (0.027) tmm625 Household Total Male Members Between 6 to 25 -0.0025 (0.013) tfm625 Household Total Female Members Between 6 to 25 0.0122 (0.013) tmm2660 Household Total Male Members Between 26 to 60 -0.0193 (0.017) tfm2660 Household Total Female Members Between 26 to 60 -0.0099 (0.020) tmm60a Household Total Male Members Between 60 & Above 0.0124 (0.050) tfm60a Household Total Female Members Between 60 & Above -0.0818 (0.089) hhsex Household Head Sex -0.0568 (0.050) hhage Household Head Age -0.00047 (0.00044) shhage Square Age of the Household Head 0.000000403 (0.00000039)hhedu Household Head Education 0.007** (0.0030) xhhtedu Household Total Education Score Except Household 0.0012 (0.0014) Constant 3.79*** (0.14) Observations 410 LR chi2(24) 139.55 Prob > chi2 0.0000 Pseudo R2 0.0452
*** p<0.01, ** p<0.05, * p<0.1
24