central bank of kenya supervision reports... · central bank of kenya credit officer ... some of...
TRANSCRIPT
CENTRAL BANK OF KENYA
CREDIT OFFICER SURVEY
QUARTER ENDED JUNE 2012

2
Table of Contents
Contents Page
1.0 FOREWORD ......................................................................................................................... 3
1.1 KENYAN BANKING SECTOR PERFORMANCE ................................................................ 3
1.2 CREDIT OFFICER SURVEY ................................................................................................ 3
2.0 EXECUTIVE SUMMARY ....................................................................................................... 4
2.1 Survey methodology ............................................................................................................ 4
2.2 KEY FINDINGS ................................................................................................................... 4
3.0 DETAILED SURVEY FINDINGS ........................................................................................... 5
3.1 Factors affecting demand for Credit ..................................................................................... 6
3.2 Credit Standards .................................................................................................................. 7
3.4 Factors affecting credit standards ......................................................................................... 8
3.5 International Trade Finance ................................................................................................. 9
3.6 Non-Performing Loans ......................................................................................................11
3.7 Credit Recovery Efforts ......................................................................................................12
Annex I (List of Respondents ------------------------------------------------------------------------------------14
List of Charts
Chart 1: Demand for Credit --------------------------------------------------------------------------------------5
Chart 2: Impact of other factors affecting demand for credit ----------------------------------------------7
Chart 3: Credit Standards -----------------------------------------------------------------------------------------8
Chart 4: Impact of other factors affecting credit standards -------------------------------------------------9
Chart 5: Supply of Credit to International Trade Finance ------------------------------------------------10
Chart 6: Non Performing Loans Trend -----------------------------------------------------------------------11
Chart 7: Credit Recovery Efforts --------------------------------------------------------------------------------12
List of Tables
Table 1: Demand for Credit --------------------------------------------------------------------------------------6
Table 2: Impact of other factors affecting demand for credit ----------------------------------------------7
Table 3: Credit Standards -----------------------------------------------------------------------------------------8
Table 4: Impact of other factors affecting credit standards -------------------------------------------------9
Table 5: Supply of Credit to International Trade Finance ------------------------------------------------10
Table 6: Non Performing Loans Trends ----------------------------------------------------------------------11
Table 7: Credit Recovery Efforts --------------------------------------------------------------------------------12

3
1.0 FOREWORD
1.1 KENYAN BANKING SECTOR PERFORMANCE
For the quarter ended 30th
June 2012, the Kenyan Banking Sector demonstrated continued
growth. Some of the sector’s performance indicators were as follows:
The aggregate balance sheet increased by 4.8 percent from Kshs 2.1 trillion in March 2012 to
Kshs 2.2 trillion in June 2012.
Gross loans and advances expanded by 4.0 percent from Kshs 1.24 trillion in March 2012 to
Ksh 1.29 trillion in June 2012.
Deposits grew by 6.4 percent from KShs 1.56 trillion in March 2012 to Kshs 1.66 trillion in
June 2012.
Total capital increased by 4.8 percent from Kshs 280.9 billion in March 2012 to Kshs 294.3
billion in June 2012.
Gross non-performing loans increased by 7.1 percent from Kshs 53.7 billion in March 2012
to Kshs 57.5 billion in June 2012.
Unaudited pre-tax profits stood at Kshs 28.5 billion for the quarter ending 30th
June 2012
compared to Kshs 24.7 billion for the quarter ending 31st
March 2012, a 15.4% increase.
1.2 CREDIT OFFICER SURVEY
Credit risk is the single largest factor affecting the soundness of financial institutions and the
financial system as a whole and lending is the principal business activity for most banks. The total
percentage of loans to total assets for the period ended 30th
June 2012 was 58.7%. In order to
identify potential risks and enhance an understanding of credit risk, the Central Bank of Kenya
introduced a quarterly Credit Officer Survey effective March 2012. In this regard, CBK undertook
the initial banking sector credit officer survey for the quarter ended March 2012. The second
credit officer survey for the quarter ended 30th
June 2012 was conducted in July 2012 targeting
senior credit officers of all 42 operational banks and 1 mortgage finance company. Charterhouse
Bank Ltd which is currently under statutory management was excluded from the survey.
Out of the forty three questionnaires sent out, CBK received responses from forty three
institutions. The list of the respondents is attached to this report as Annex I.
Comparison of findings obtained in the quarter ended March 2012 and the quarter ended June
2012 reveals that:-
Demand for credit in the quarter ended June 2012 increased in manufacturing and personal
and household sectors but reduced for building and construction and real estate sectors.
Credit standards were tightened for the building and real estate sectors in June 2012.
Supply of international trade finance remained unchanged for all the sectors.
Banks expect NPLs to personal and household and trade sectors to rise and to remain
unchanged for all the other sectors.
The June 2012 credit survey shows that banks have intensified their credit recovery efforts in
building and construction, trade, transport and communication and real estate sectors.
CENTRAL BANK OF KENYA
AUGUST 2012

4
2.0 EXECUTIVE SUMMARY
2.1 Survey methodology
The credit officer survey for the quarter ended June 2012 comprised five questions that focused
on the following aspects:-
Demand for credit.
Credit standards.
International trade finance.
Non-Performing loans
Credit recovery efforts.
The survey has been complemented with questions dealing with demand for credit and credit
standards by including factors which can have an impact on these two variables.
The survey conducted in July 2012 targeted senior credit officers of all 42 operational banks and
1 mortgage finance company. Charterhouse Bank Ltd which is currently under statutory
management was excluded from the survey. All the forty three institutions responded. The list of
the respondents is attached to this report as Annex I.
2.2 KEY FINDINGS
The key findings from the survey are detailed below.
2.2.1 Demand for credit
Demand for credit in the agriculture, mining and quarrying, tourism as well as energy and water
sectors remained largely unchanged in the second quarter of 2012. Demand for credit increased
in the personal/households and manufacturing sectors. Demand for credit decreased in real estate
and building and construction sectors.
The survey indicated that Cost of borrowing was the greatest factor that led to a decrease of
demand for credit.
2.2.2 Credit Standards
Credit standards were tightened for the building and real estate sectors in June 2012. Some
banks expect the new land laws to adversely affect the performance of loans under building and
construction as well as the real estate sectors. This is due to the envisaged lengthy and more
complex credit appraisal procedures.
Competition from deposit taking microfinance institutions, SACCOs and other non bank credit
providers was cited as not having a significant impact on banks credit standards. Bank’s cost of
funds and balance sheet constraints were reported to have led to tightening of credit standards.
5
2.2.3 International Trade Finance
Generally the banks willingness to supply international trade finance to various sectors remained
unchanged in the quarter.
2.2.4 Non-Performing Loans
The forecast for NPLs for July to September 2012 indicate that 39 percent of the respondents
expect the NPLs in the personal and household sector to increase as compared to 64 percent
who expected NPLs in the same sector to increase as reported in March 2012 survey. This could
be informed by the lowering of Central Bank Rate (CBR) from 18 percent to 16.5 percent which
is likely to translate to lower lending rates hence lower default.
2.2.5 Credit Recovery Efforts
The June 2012 credit survey shows that banks have intensified their credit recovery efforts in
building and construction, trade, transport and communication and real estate sectors.
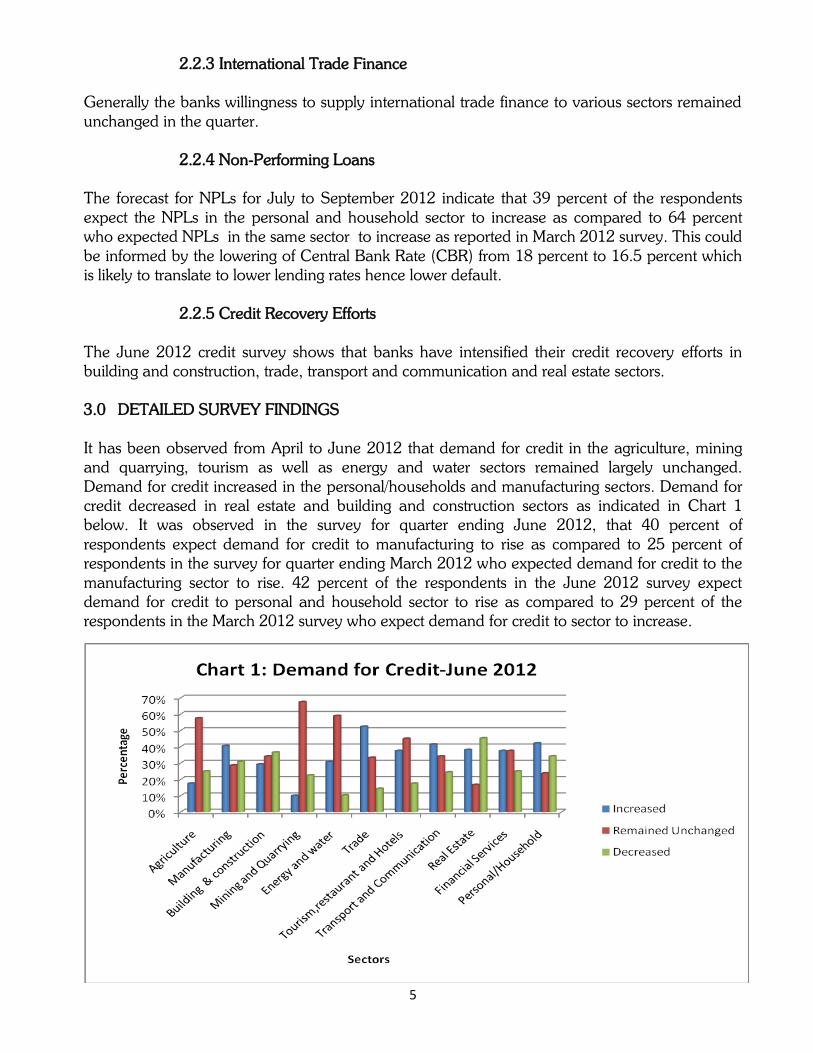
3.0 DETAILED SURVEY FINDINGS
It has been observed from April to June 2012 that demand for credit in the agriculture, mining
and quarrying, tourism as well as energy and water sectors remained largely unchanged.
Demand for credit increased in the personal/households and manufacturing sectors. Demand for
credit decreased in real estate and building and construction sectors as indicated in Chart 1
below. It was observed in the survey for quarter ending June 2012, that 40 percent of
respondents expect demand for credit to manufacturing to rise as compared to 25 percent of
respondents in the survey for quarter ending March 2012 who expected demand for credit to the
manufacturing sector to rise. 42 percent of the respondents in the June 2012 survey expect
demand for credit to personal and household sector to rise as compared to 29 percent of the
respondents in the March 2012 survey who expect demand for credit to sector to increase.
6
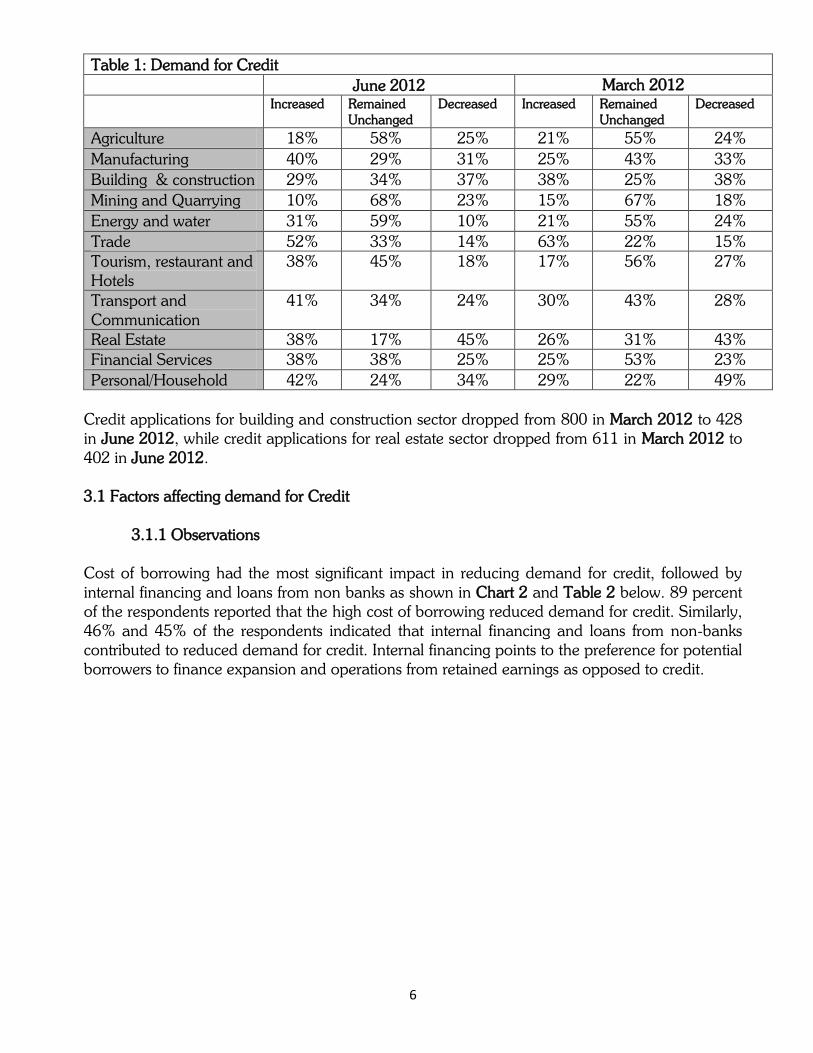
Table 1: Demand for Credit
June 2012 March 2012
Increased Remained
Unchanged
Decreased Increased Remained
Unchanged
Decreased
Agriculture 18% 58% 25% 21% 55% 24%
Manufacturing 40% 29% 31% 25% 43% 33%
Building & construction 29% 34% 37% 38% 25% 38%
Mining and Quarrying 10% 68% 23% 15% 67% 18%
Energy and water 31% 59% 10% 21% 55% 24%
Trade 52% 33% 14% 63% 22% 15%
Tourism, restaurant and
Hotels
38% 45% 18% 17% 56% 27%
Transport and
Communication
41% 34% 24% 30% 43% 28%
Real Estate 38% 17% 45% 26% 31% 43%
Financial Services 38% 38% 25% 25% 53% 23%
Personal/Household 42% 24% 34% 29% 22% 49%
Credit applications for building and construction sector dropped from 800 in March 2012 to 428
in June 2012, while credit applications for real estate sector dropped from 611 in March 2012 to
402 in June 2012.
3.1 Factors affecting demand for Credit
3.1.1 Observations
Cost of borrowing had the most significant impact in reducing demand for credit, followed by
internal financing and loans from non banks as shown in Chart 2 and Table 2 below. 89 percent
of the respondents reported that the high cost of borrowing reduced demand for credit. Similarly,
46% and 45% of the respondents indicated that internal financing and loans from non-banks
contributed to reduced demand for credit. Internal financing points to the preference for potential
borrowers to finance expansion and operations from retained earnings as opposed to credit.

7
Table 2: Factors affecting Demand for credit
Increased Remained Unchanged Decreased
Internal Financing 9% 46% 46%
Loans from other banks 5% 59% 35%
Loans from non banks 3% 52% 45%
Issuance of debt securities 3% 85% 12%
Issuance of equity 3% 79% 18%
Cost of borrowing 8% 3% 89%
Available investment opportunities 26% 50% 24%
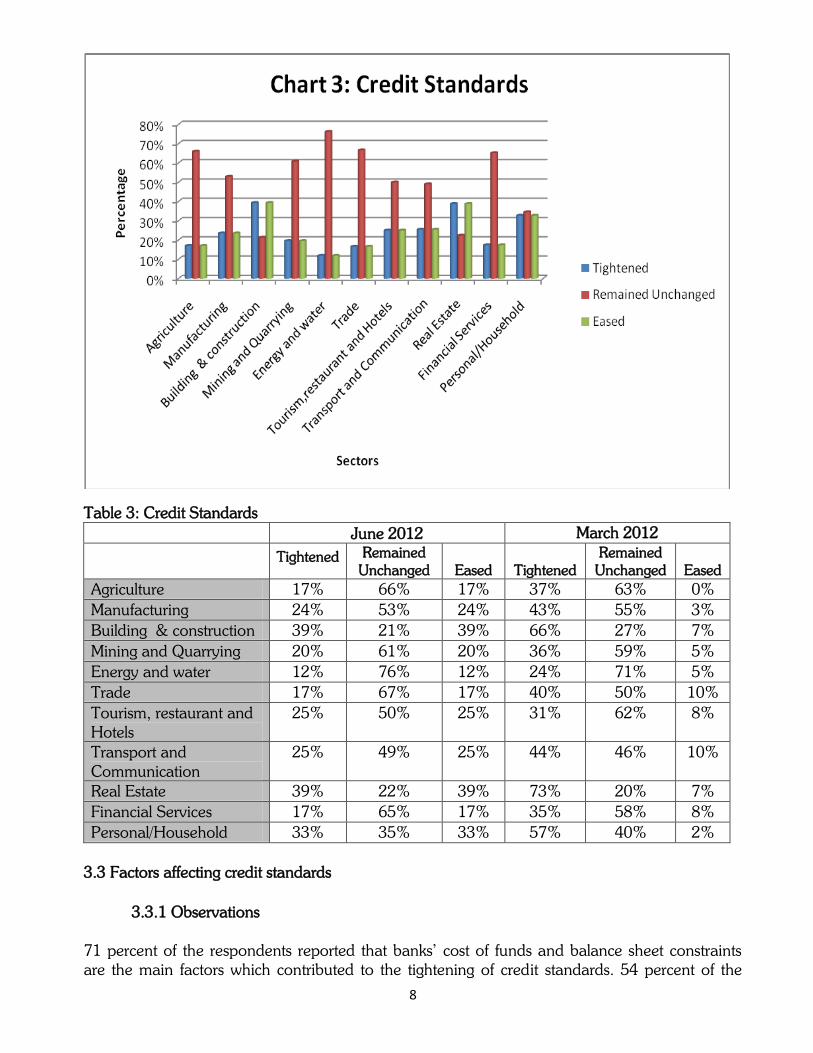
3.2 Credit Standards
3.2.1 Observations
In the quarter ended June 2012, there was generally no major change in credit standards to most
of the sectors. However, credit standards for the building and construction, and real estate sectors
were tightened in the quarter just as had been done in the quarter ended March 2012.
Nonetheless, the tightening in these two sectors appears to be easing with 39% of the
respondents reporting increased tightening unlike in March 2012 when 66 percent and 73
percent of the respondents who reported tightened credit standards to the building and
construction, and real estate sectors respectively. Chart 3 and Table 3 below details the responses
on credit standards in the quarter ended June 2012.
8
Table 3: Credit Standards
June 2012 March 2012
Tightened Remained
Unchanged Eased Tightened
Remained
Unchanged Eased
Agriculture 17% 66% 17% 37% 63% 0%
Manufacturing 24% 53% 24% 43% 55% 3%
Building & construction 39% 21% 39% 66% 27% 7%
Mining and Quarrying 20% 61% 20% 36% 59% 5%
Energy and water 12% 76% 12% 24% 71% 5%
Trade 17% 67% 17% 40% 50% 10%
Tourism, restaurant and
Hotels
25% 50% 25% 31% 62% 8%
Transport and
Communication
25% 49% 25% 44% 46% 10%
Real Estate 39% 22% 39% 73% 20% 7%
Financial Services 17% 65% 17% 35% 58% 8%
Personal/Household 33% 35% 33% 57% 40% 2%
3.3 Factors affecting credit standards
3.3.1 Observations
71 percent of the respondents reported that banks’ cost of funds and balance sheet constraints
are the main factors which contributed to the tightening of credit standards. 54 percent of the
9
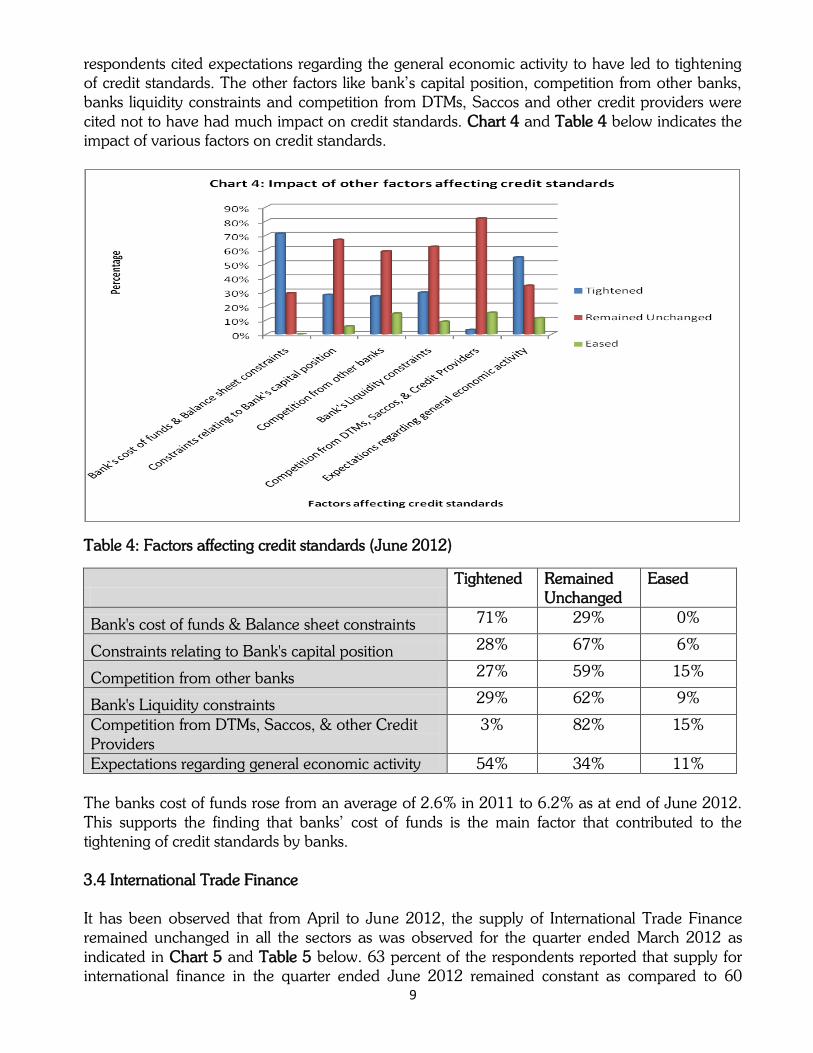
respondents cited expectations regarding the general economic activity to have led to tightening
of credit standards. The other factors like bank’s capital position, competition from other banks,
banks liquidity constraints and competition from DTMs, Saccos and other credit providers were
cited not to have had much impact on credit standards. Chart 4 and Table 4 below indicates the
impact of various factors on credit standards.
Table 4: Factors affecting credit standards (June 2012)
Tightened Remained
Unchanged
Eased
Bank's cost of funds & Balance sheet constraints 71% 29% 0%
Constraints relating to Bank's capital position 28% 67% 6%
Competition from other banks 27% 59% 15%
Bank's Liquidity constraints 29% 62% 9%
Competition from DTMs, Saccos, & other Credit
Providers
3% 82% 15%
Expectations regarding general economic activity 54% 34% 11%
The banks cost of funds rose from an average of 2.6% in 2011 to 6.2% as at end of June 2012.
This supports the finding that banks’ cost of funds is the main factor that contributed to the
tightening of credit standards by banks.
3.4 International Trade Finance
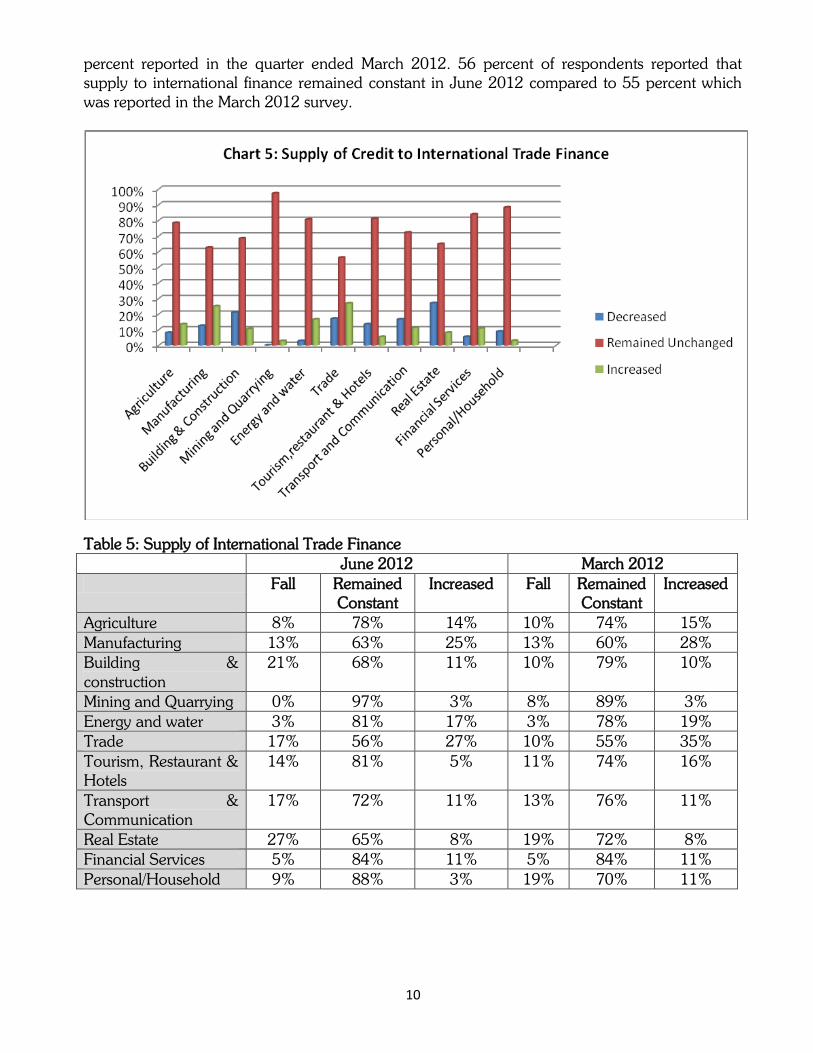
It has been observed that from April to June 2012, the supply of International Trade Finance
remained unchanged in all the sectors as was observed for the quarter ended March 2012 as
indicated in Chart 5 and Table 5 below. 63 percent of the respondents reported that supply for
international finance in the quarter ended June 2012 remained constant as compared to 60
10
percent reported in the quarter ended March 2012. 56 percent of respondents reported that
supply to international finance remained constant in June 2012 compared to 55 percent which
was reported in the March 2012 survey.
Table 5: Supply of International Trade Finance
June 2012 March 2012
Fall Remained
Constant
Increased Fall Remained
Constant
Increased
Agriculture 8% 78% 14% 10% 74% 15%
Manufacturing 13% 63% 25% 13% 60% 28%
Building &
construction
21% 68% 11% 10% 79% 10%
Mining and Quarrying 0% 97% 3% 8% 89% 3%
Energy and water 3% 81% 17% 3% 78% 19%
Trade 17% 56% 27% 10% 55% 35%
Tourism, Restaurant &
Hotels
14% 81% 5% 11% 74% 16%
Transport &
Communication
17% 72% 11% 13% 76% 11%
Real Estate 27% 65% 8% 19% 72% 8%
Financial Services 5% 84% 11% 5% 84% 11%
Personal/Household 9% 88% 3% 19% 70% 11%
11
3.5 Non-Performing Loans
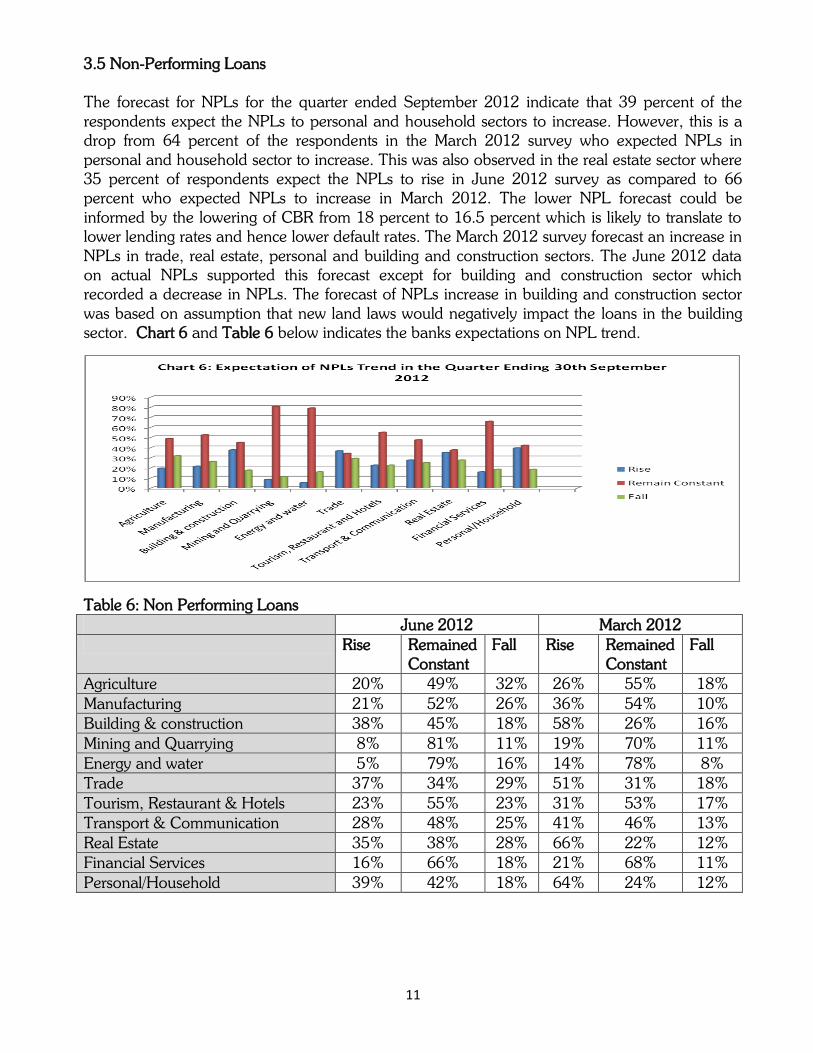
The forecast for NPLs for the quarter ended September 2012 indicate that 39 percent of the
respondents expect the NPLs to personal and household sectors to increase. However, this is a
drop from 64 percent of the respondents in the March 2012 survey who expected NPLs in
personal and household sector to increase. This was also observed in the real estate sector where
35 percent of respondents expect the NPLs to rise in June 2012 survey as compared to 66
percent who expected NPLs to increase in March 2012. The lower NPL forecast could be
informed by the lowering of CBR from 18 percent to 16.5 percent which is likely to translate to
lower lending rates and hence lower default rates. The March 2012 survey forecast an increase in
NPLs in trade, real estate, personal and building and construction sectors. The June 2012 data
on actual NPLs supported this forecast except for building and construction sector which
recorded a decrease in NPLs. The forecast of NPLs increase in building and construction sector
was based on assumption that new land laws would negatively impact the loans in the building
sector. Chart 6 and Table 6 below indicates the banks expectations on NPL trend.
Table 6: Non Performing Loans
June 2012 March 2012
Rise Remained
Constant
Fall Rise Remained
Constant
Fall
Agriculture 20% 49% 32% 26% 55% 18%
Manufacturing 21% 52% 26% 36% 54% 10%
Building & construction 38% 45% 18% 58% 26% 16%
Mining and Quarrying 8% 81% 11% 19% 70% 11%
Energy and water 5% 79% 16% 14% 78% 8%
Trade 37% 34% 29% 51% 31% 18%
Tourism, Restaurant & Hotels 23% 55% 23% 31% 53% 17%
Transport & Communication 28% 48% 25% 41% 46% 13%
Real Estate 35% 38% 28% 66% 22% 12%
Financial Services 16% 66% 18% 21% 68% 11%
Personal/Household 39% 42% 18% 64% 24% 12%
12
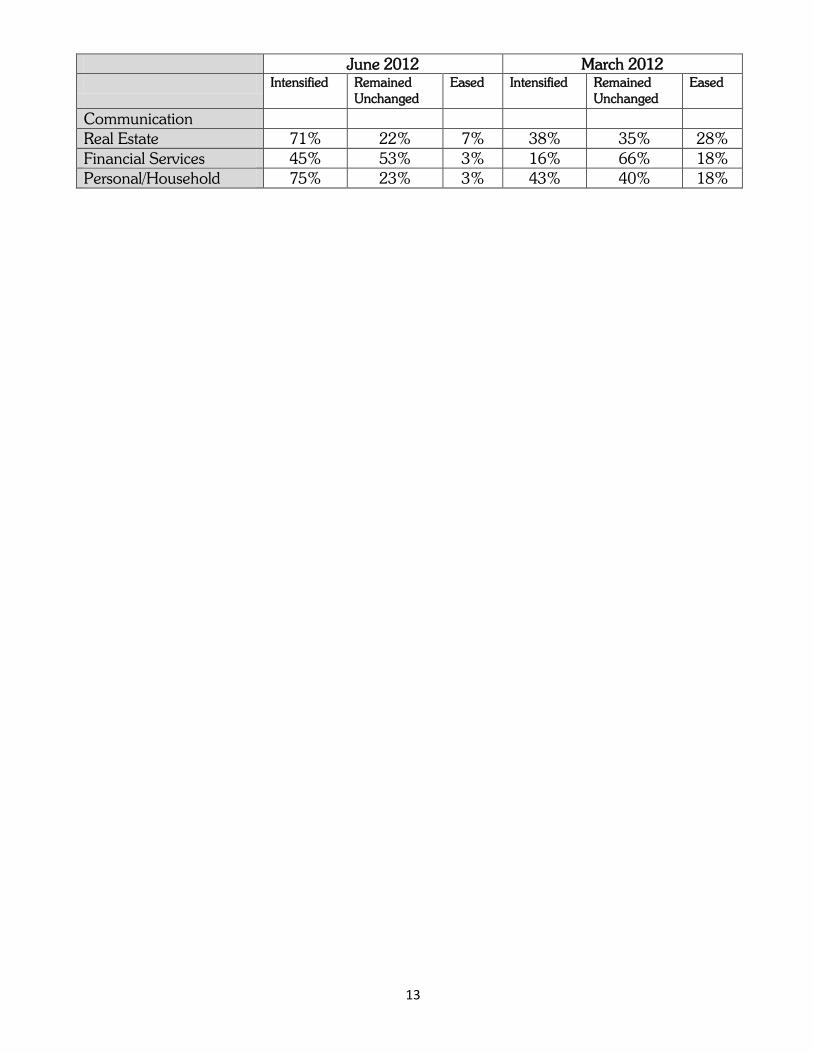
3.6 Credit Recovery Efforts
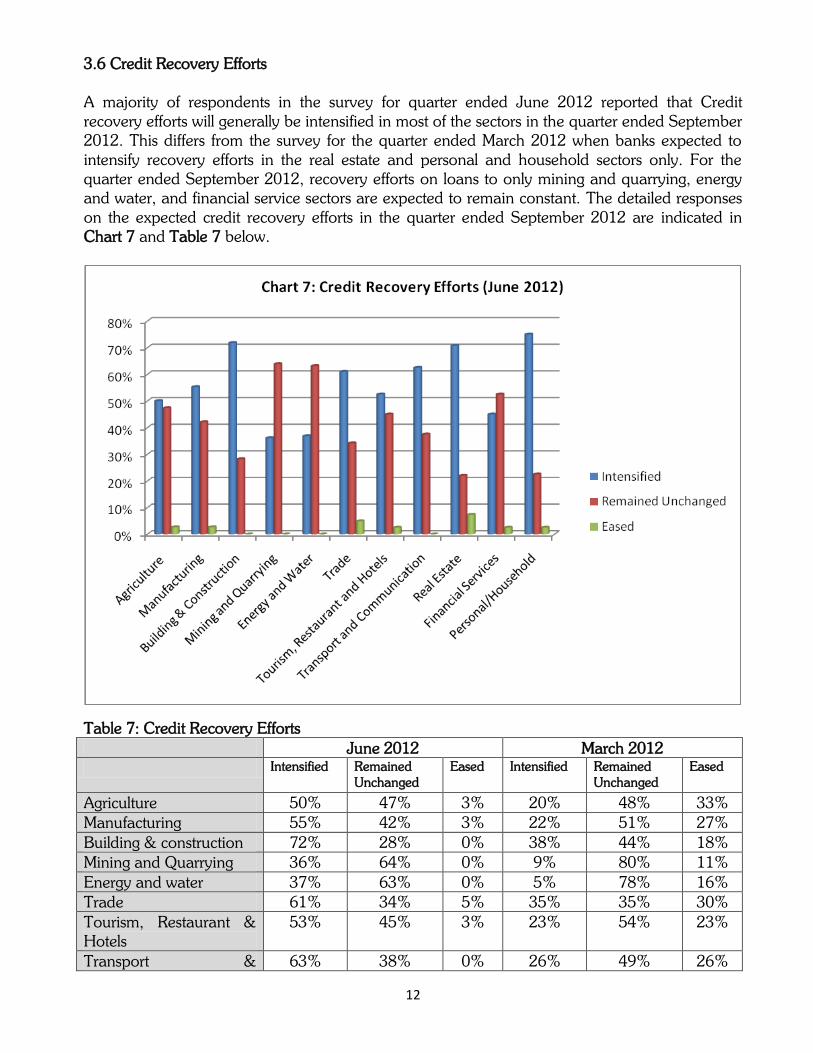
A majority of respondents in the survey for quarter ended June 2012 reported that Credit
recovery efforts will generally be intensified in most of the sectors in the quarter ended September
2012. This differs from the survey for the quarter ended March 2012 when banks expected to
intensify recovery efforts in the real estate and personal and household sectors only. For the
quarter ended September 2012, recovery efforts on loans to only mining and quarrying, energy
and water, and financial service sectors are expected to remain constant. The detailed responses
on the expected credit recovery efforts in the quarter ended September 2012 are indicated in
Chart 7 and Table 7 below.
Table 7: Credit Recovery Efforts
June 2012 March 2012
Intensified Remained
Unchanged
Eased Intensified Remained
Unchanged
Eased
Agriculture 50% 47% 3% 20% 48% 33%
Manufacturing 55% 42% 3% 22% 51% 27%
Building & construction 72% 28% 0% 38% 44% 18%
Mining and Quarrying 36% 64% 0% 9% 80% 11%
Energy and water 37% 63% 0% 5% 78% 16%
Trade 61% 34% 5% 35% 35% 30%
Tourism, Restaurant &
Hotels
53% 45% 3% 23% 54% 23%
Transport & 63% 38% 0% 26% 49% 26%
13
June 2012 March 2012
Intensified Remained
Unchanged
Eased Intensified Remained
Unchanged
Eased
Communication
Real Estate 71% 22% 7% 38% 35% 28%
Financial Services 45% 53% 3% 16% 66% 18%
Personal/Household 75% 23% 3% 43% 40% 18%
14
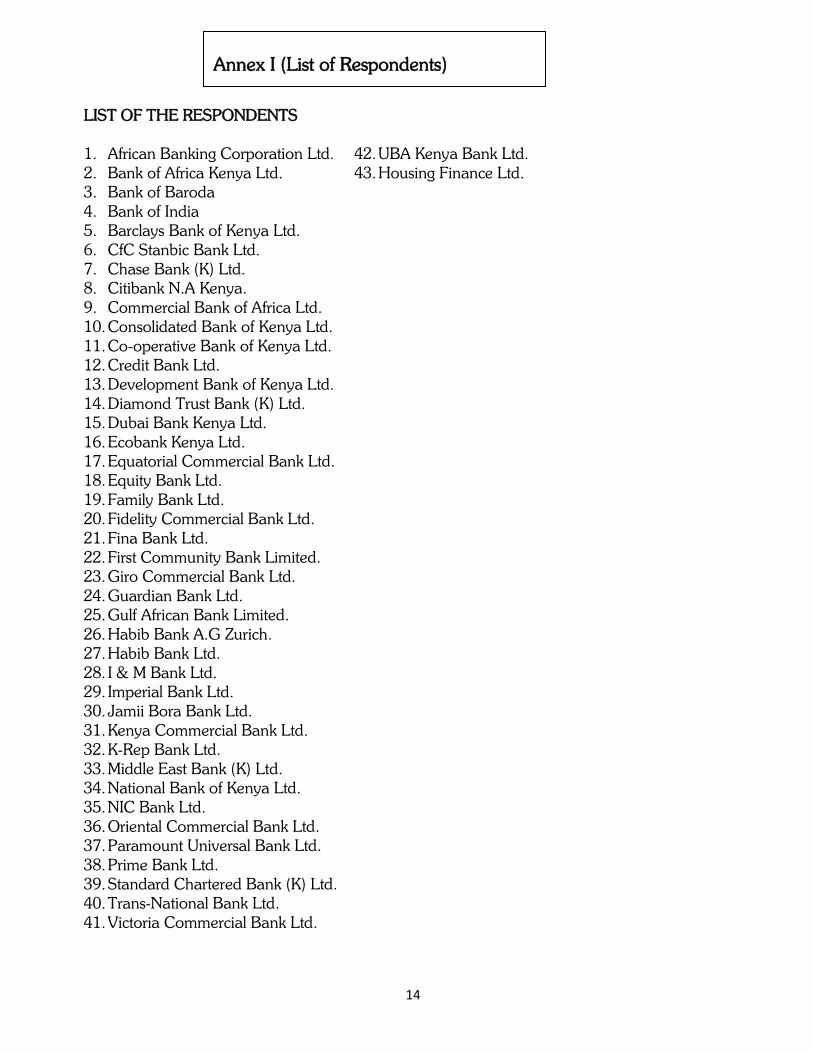
LIST OF THE RESPONDENTS
1. African Banking Corporation Ltd.
2. Bank of Africa Kenya Ltd.
3. Bank of Baroda
4. Bank of India
5. Barclays Bank of Kenya Ltd.
6. CfC Stanbic Bank Ltd.
7. Chase Bank (K) Ltd.
8. Citibank N.A Kenya.
9. Commercial Bank of Africa Ltd.
10. Consolidated Bank of Kenya Ltd.
11. Co-operative Bank of Kenya Ltd.
12. Credit Bank Ltd.
13. Development Bank of Kenya Ltd.
14. Diamond Trust Bank (K) Ltd.
15. Dubai Bank Kenya Ltd.
16. Ecobank Kenya Ltd.
17. Equatorial Commercial Bank Ltd.
18. Equity Bank Ltd.
19. Family Bank Ltd.
20. Fidelity Commercial Bank Ltd.
21. Fina Bank Ltd.
22. First Community Bank Limited.
23. Giro Commercial Bank Ltd.
24. Guardian Bank Ltd.
25. Gulf African Bank Limited.
26. Habib Bank A.G Zurich.
27. Habib Bank Ltd.
28. I & M Bank Ltd.
29. Imperial Bank Ltd.
30. Jamii Bora Bank Ltd.
31. Kenya Commercial Bank Ltd.
32. K-Rep Bank Ltd.
33. Middle East Bank (K) Ltd.
34. National Bank of Kenya Ltd.
35. NIC Bank Ltd.
36. Oriental Commercial Bank Ltd.
37. Paramount Universal Bank Ltd.
38. Prime Bank Ltd.
39. Standard Chartered Bank (K) Ltd.
40. Trans-National Bank Ltd.
41. Victoria Commercial Bank Ltd.
42. UBA Kenya Bank Ltd.
43. Housing Finance Ltd.
Annex I (List of Respondents)