central bank of nigeria annual report—2018 ar kama1.pdfcentral bank of nigeria annual...
TRANSCRIPT

Central Bank of Nigeria Annual Report—2018
i
CENTRAL BANK OF NIGERIA
ANNUAL REPORT 2018 DRAFT
Central Bank of Nigeria Annual Report—2018
ii
Central Bank of Nigeria
Corporate Head Office
33, Tafawa Balewa Way
Central Business District
P. M. B. 0187
Garki, Abuja
Website: www.cbn.gov.ng
Contact Centre
Number: +234 700 225 5226
© 2018 Central Bank of Nigeria
ISSN 1597 - 2976
DRAFT

Central Bank of Nigeria Annual Report—2018
iii
Vision
“Be THE MODEL CENTRAL BANK delivering PRICE and
FINANCIAL SYSTEM STABILITY and promoting
SUSTAINABLE ECONOMIC DEVELOPMENT”.
Mission
To be proactive in providing a stable framework for the
economic development of Nigeria, through the
effective, efficient and transparent implementation of
monetary and exchange rate policy, and
management of the financial sector.
DRAFT

Central Bank of Nigeria Annual Report—2018
iv
THE CENTRAL BANK OF NIGERIA
Established by the Central Bank of Nigeria
(CBN) Act of 1958, the principal objects of the
Bank, as contained in the new CBN Act, 2007,
are to:
ensure monetary and price stability;
issue legal tender currency in Nigeria;
maintain external reserves to safeguard
the international value of the legal
tender currency;
promote a sound financial system in
Nigeria; and
act as banker and provide economic
and financial advice to the Federal
Government of Nigeria.
DRAFT

Central Bank of Nigeria Annual Report—2018
v
BOARD OF DIRECTORS
AS AT 31st DECEMBER, 2018
DRAFT

Central Bank of Nigeria Annual Report—2018
vi
MEMBERS OF THE BOARD OF DIRECTORS OF THE BANK
AS AT 31ST DECEMBER, 2018
Following the dissolution of the Board in July 2015, a new Board was yet to be
constituted as at 31st December, 2017.
MEMBERS OF THE COMMITTEE OF GOVERNORS OF
THE BANK AS AT 31ST DECEMBER, 2018
1. Godwin I. Emefiele, CON - Governor (Chairman)
2. Okwu J. Nnanna - Deputy Governor (Financial System
Stability/ Economic Policy)
3. Adebayo A. Adelabu - Deputy Governor (Operations
/ Corporate Services)
4. Alice Karau - Secretary
MEMBERS OF THE MONETARY POLICY COMMITTEE (MPC)
AS AT 31ST DECEMBER, 2018
1. Godwin I. Emefiele, CON - Governor (Chairman)
2. Okwu J. Nnanna - Deputy Governor (Financial System
Stability/ Economic Policy)
3. Adebayo A. Adelabu - Deputy Governor (Operations
/ Corporate Services)
4. Dahiru Balami - Member
5. Abdul-Ganiyu Garba - Member
6. Adedoyin R. Salami - Member
7. Chibuike C. Uche - Member
8. Shehu Yahaya - Member
Moses. K. Tule - Secretary
PRINCIPAL OFFICERS OF THE BANK AS AT 31ST DECEMBER, 2018
A. Departmental Directors
1. Dipo T. Fatokun - Banking & Payments System
2. Ahmad Abdullahi - Banking Supervision
3. Salisu Rabeh - Branch Operations
4. Chizoba V. Mojekwu (Ms.) - Capacity Development
5. Umma Dutse (Haj.) - Consumer Protection
6. Isaac Okoroafor* - Corporate Communications
7. Alice Karau* - Corporate Secretariat
8. Prescilia Eleje* - Currency Operations
9. Mudashir A. Olaitan - Development Finance
10. Moro D. Arowosegbe - Finance
11. Alvan E. Ikoku - Financial Markets
12. Kevin N. Amugo - Financial Policy and Regulation
13. Mohammed D. Suleyman*** - FSS 2020
14. Anthony C. Ifechikwu - Governors’ Department
DRAFT

Central Bank of Nigeria Annual Report—2018
vii
15. Lametek E. Adamu - Human Resources
16. John I. Ayoh - Information Technology
17. Vivian I. Agu (Mrs.) - Internal Audit
18. Johnson O. Akinkumi - Legal Services
19. Faozat A. O. Bello (Mrs.) - Medical Services
20. Moses K. Tule - Monetary Policy
21. Agnes O. Martins - Other Financial Institutions
Supervision
22. Lazarus M. Agbor - Procurement & Support Services
23. Uwatt B. Uwatt - Research
24. Tirmidhi M. Yakubu - Reserve Management
25. Oluwafolakemi J. Fatogbe
(Ms.) - Risk Management
26. Olugbenga I. Amu - Security Services
27. Tumala, M. Musa - Statistics
28. Ibrahim Mu’azu - Strategy Management
29. Wuritka Dauda Gotring - Trade & Exchange
30. Eunice N. Egbuna** - Secondment to WAMI
* Overseeing the Department
** On secondment *** On posting
B. Special Advisers to the Governor
1. Leonard K. Chumo - Banking Supervision
2. Kingsley Obiora - Economic Matters
3. Emmanuel Ukeje - Financial Markets
4. Yakubu Umar - Non-Interest Banking
5. Titus O. Odozi - Nigerian Security Printing and
Minting (NSPM) Plc.
6. Aisha U. Mahmoud - Sustainable BankingDRAFT

Central Bank of Nigeria Annual Report—2018
viii
C. Branch Controllers/Currency Officers
1. Obiekwe A. Obiageli (Mrs.) - Abakaliki
2. Amao A. Babatunde - Abeokuta
3. Agu E. Oyibo - Abuja
4. Iwuaru C. Chibueze - Ado-Ekiti
5. Yusuf F. Adebare - Akure
6. Ikeghagu C. Hyacinth - Asaba
7. Sokari C. Monday - Awka
8. Umar A. Bello - Bauchi
9. Jumbo R. Davis - Benin
10. Babah N. Asmau (Mrs.) - Birnin-Kebbi
11. Kalio I. Graham - Calabar
12. Dibola I. Aliyu - Damaturu
13. Zakirai T. Ibrahim - Dutse
14. Okonjo C. Emmanuel - Enugu
15. Goringo S. Alhaji - Gombe
16. Abba B. Ibrahim - Gusau
17. Olatinwo F. Musibau - Ibadan
18. Ndarake E. Akpan - Ilorin
19. Abdullahi S. Mohammed - Jalingo
20. Jewon S. Jatau - Jos
21. Saleh S. Yargoje - Kaduna
22. Abubakar P. Amina (Mrs.) - Kano
23. Joda A. Hamman - Katsina
24. Ghasarah B. Ateh - Lafia
25. Iyari O. James - Lagos
26. Bafai B. Musa - Lokoja
27. Ibrahim Isyaku - Maiduguri
28. Achebe A. Emeka - Makurdi
29. Ibrahim M. Tulu - Minna
30. Bamidele B. Ibrahim - Osogbo
31. Itohan M. Ogbomon-Paul - Owerri
32. Alaka K. Adekunle - Port Harcourt
33. Wali Yusuf - Sokoto
34. Aqua V. Edem. - Umuahia
35. Nwokoro O. Cletus - Uyo
36. Nwajana G. Obiora - Yenagoa
37. Hussein Shuaibu - Yola
DRAFT
Central Bank of Nigeria Annual Report—2018
ix
TABLE OF CONTENTS
List of Abbreviations and Acronyms .. .. .. .. .. .. .. xxvii
Statement by the Governor .. .. .. .. .. .. .. .. xxxvi
Organisational Structure of the CBN as at 31st December, 2017 .. .. xl
Summary .. .. .. .. .. .. .. .. .. .. .. xli
PART ONE: ACTIVITIES OF THE CENTRAL BANK OF NIGERIA
CHAPTER 1 .. .. .. .. .. .. .. .. .. .. .. 1
1.0 CORPORATE ACTIVITIES OF THE CENTRAL BANK OF NIGERIA .. .. 1
1.1 Administration .. .. .. .. .. .. .. .. 1
1.1.1 The Board of Directors and Other Committees .. .. 1
1.1.2 The Monetary Policy Committee (MPC) .. .. .. 2
1.1.3 Development of CBN Branches and Intervention Projects 4
1.1.4 Information Technology .. .. .. .. .. 4
1.1.5 Library Operations .. .. .. .. .. .. 5
1.1.6 Legal Services .. .. .. .. .. .. .. 6
1.1.7 Security Services .. .. .. .. .. .. .. 7
1.1.8 Internal Audit .. .. .. .. .. .. .. 8
1.1.9 Risk Management .. .. .. .. .. .. 8
1.1.10 Strategic Initiatives and Business Process Management .. 9
1.1.11 Communications .. .. .. .. .. .. 10
1.1.12 Anti-Corruption and Ethical Issues .. .. .. .. 11
1.1.13 The Financial System Strategy (FSS) 2020 .. .. .. 12
1.1.14 The Shared Services Project .. .. .. .. .. 14
1.1.15 Staff .. .. .. .. .. .. .. .. 16
1.1.16 Medical Services .. .. .. .. .. .. .. 17
1.1.17 Training .. .. .. .. .. .. .. .. 18
1.1.18 The International Training Institute (ITI) .. .. .. 19
1.1.19 Staff Promotion .. .. .. .. .. .. .. 20
1.1.20 Corporate Social Responsibility (CSR) .. .. .. 20
1.1.20.1 Recreational Activities .. .. .. .. 20
1.1.20.2 Special Internvention Projects under CSR.. .. 21
1.1.21 Staff Social Responsibility .. .. .. .. .. 21
1.1.22 Nigerian Sustainable Banking Initiatives .. .. .. 22
1.2 Research and Collaborative Activities .. .. .. .. 22
1.3 The CBN Balance Sheet .. .. .. .. .. .. .. 24
1.3.1 Income and Appropriation .. .. .. .. .. 24
1.3.2 Assets and Liabilities .. .. .. .. .. .. 24
DRAFT

Central Bank of Nigeria Annual Report—2018
x
CHAPTER 2 .. .. .. .. .. .. .. .. .. .. .. 25
2.0 MONETARY POLICY, SURVEILLANCE ACTIVITIES, AND OPERATIONS OF
THE CBN.. .. .. .. .. .. .. .. .. .. .. 25
2.1 Monetary Operations .. .. .. .. .. .. .. 25
2.1.1 Monetary and Credit Developments .. .. .. 25
2.1.2 Liquidity Management .. .. .. .. .. .. 27
2.1.3 Interest Rate Policy and Developments .. .. .. 29
2.1.3.1 Money Market Rates .. .. .. .. .. 29
2.1.3.2 Deposit Rates .. .. .. .. .. .. 30
2.1.3.3 Lending Rates .. .. .. .. .. .. 30
2.1.4 Developments in the Payments System .. .. .. 32
2.1.4.1 The Bank Verification Number (BVN) Scheme .. 32
2.1.4.2 e-Dividend Mandate Management Portal .. 33
2.1.4.3 Nigeria Electronic Fraud Forum (NeFF) .. .. 34
2.1.4.4 Authorised Signature Verification Portal .. .. 35
2.1.4.5 Accreditation of Cheque Printers .. .. .. 35
2.1.4.6 Nigerian Cheque Standards (NCS) and Nigerian
Cheque Printers Accreditation Scheme (NICPAS) 35
2.1.4.7 Nigerian Automated Clearing System (NACS)
Upgrade.. .. .. .. .. .. .. 35
2.1.4.8 Electronic Payments Incentive Scheme (EPIS) .. 36
2.1.4.9 Aggregator Model .. .. .. .. .. 36
2.1.4.10 Licensing and Approval of Other Payments
Schemes/ Products .. .. .. .. .. 36
2.1.4.11 Payments System Vision 2020 (PSV 2020) .. .. 37
2.1.4.12 e-Payment Transactions .. .. .. .. 38
2.2 Currency Operations .. .. .. .. .. .. .. 39
2.2.1 The Issuance of Legal Tender Currency .. .. .. 39
2.2.2 Currency-in-Circulation (CIC) .. .. .. .. .. 39
2.2.3 Clean and Counterfeit Currency Notes .. .. .. 41
2.2.4 The Nigeria Cash Management Scheme (NCMS) .. 42
2.2.5 Sustainable Disposal of Currency Waste .. .. .. 42
2.2.6 Automation and Modernisation of currency Management 42
2.3 Foreign Exchange Management .. .. .. .. .. 43
2.3.1 Foreign Exchange Flows .. .. .. .. .. 44
2.3.2 Developments in the Foreign Exchange Market .. .. 48
2.3.3 Sectoral Utilisation of Foreign Exchange .. .. .. 48
2.3.4 External Reserves Management .. .. .. .. 50
2.4 Surveillance of the Activities of Financial Institutions .. .. 52
2.4.1 Banking Supervision .. .. .. .. .. .. 52
2.4.2 Credit Risk Management System .. .. .. .. 56
2.4.3 Prudential Review and Examination .. .. .. .. 57
2.4.4 Corporate Governance in the Nigerian Financial Services
Industry .. .. .. .. .. .. .. .. 58
DRAFT

Central Bank of Nigeria Annual Report—2018
xi
2.4.5 Financial Crimes Surveillance/Anti-Money Laundering .. 58
2.4.6 Routine, Special and Target Examination.. .. .. .. 60
2.4.7 Cross Border Supervisory Activities .. .. .. .. 61
2.4.8 Examination of Foreign Subsidiaries.. .. .. .. 63
2.4.9 Foreign Exchange Monitoring/Examination .. .. 63
2.4.10 Developments in Domestic Systemically Important Banks 63
2.4.11 Macro-Prudential Surveillance and Regulation .. .. 64
2.4.12 Banking Sector Soundness .. .. .. .. .. 64
2.4.13 Examination of Other Financial Institutions .. .. .. 65
2.4.14 Financial Literacy and Education .. .. .. .. 67
2.4.15 Consumer Protection .. .. .. .. .. .. 69
2.5 Developmental Functions of the CBN .. .. .. .. .. 71
2.5.1 The Agricultural Credit Guarantee Scheme (ACGS) .. 71
2.5.2 The Interest Draw-back Programme (IDP) .. .. .. 72
2.5.3 Anchor Borrowers’ Programme (ABP) .. .. .. 73
2.5.4 The Commercial Agriculture Credit Scheme (CACS) .. 74
2.5.4.1 The Paddy Aggregation Scheme (PAS) .. .. 75
2.5.5 The Agri-Business/Small and Medium Enterprises Investment
Scheme (AGSMEIS) .. .. .. .. .. .. 76 2.5.6 The Accelerated Agriculture Development Scheme (AADS) .. 76
2.5.7 The Non-Oil Export Stimulation Facility and the Export
Development Facility .. .. .. .. .. .. 76
2.5.8 The Micro, Small and Medium Enterprises Development
Fund (MSMEDF) .. .. .. .. .. .. .. 77
2.5.9 Nigeria Electricity Market Stabilisation Facility (NEMSF) .. 78
2.5.10 The Power and Airline Intervention Fund (PAIF) .. .. 80
2.5.11 The Nigeria Bulk Electricity Trading-Payment Assurance
Facility (NBET-PAF).. .. .. .. .. .. .. 81
2.5.12 The Small and Medium Enterprises Refinancing and
Restructuring Facility (SMERRF) and the Real Sector Support
Facility (RSSF) .. .. .. .. .. .. .. 82
2.5.12.1 The National Food Security Programme (NFSP) .. 83
2.5.12.2 The Presidential Fertilizer Initiative (PFI) .. .. 83
2.5.13 The Textile Sector Intervention Facility (TSIF).. .. .. 84
2.5.14 The National Collateral Registry (NCR) .. .. .. 84
2.5.15 The Financial Inclusion Programme .. .. .. .. 85
2.5.16 The Youth Entrepreneurship Development programme
(YEDP) .. .. .. .. .. .. .. .. 87 2.5.17 Other Development Finance Support Activities .. .. 87
2.5.17.1 Commodity Promotion .. .. .. .. .. 88
2.5.17.1.1 Oil Palm Seminar .. .. .. .. 88
2.5.17.1.2 2016/2017 National Survey on
Agricultural Exportable Commodities
Statistics in Nigeria .. .. .. .. 88
DRAFT

Central Bank of Nigeria Annual Report—2018
xii
2.5.17.1.3 The National Egg Production (NEGPRO) Scheme 89
2.5.17.2 Entrepreneurship Development .. .. .. 89
2.5.17.3 Microfinance Management .. .. .. 91
2.5.17.3.1 National Microfinance Policy
Consultative Committee (NMFPCC) .. 91
PART TWO: ECONOMIC REPORT
CHAPTER 3 .. .. .. .. .. .. .. .. .. .. .. 93
3.0 THE GLOBAL ECONOMY .. .. .. .. .. .. .. .. 93
3.1 Output Growth .. .. .. .. .. .. .. .. 93
3.2 Global Inflation .. .. .. .. .. .. .. .. 96
3.3 Global Commodity Demand and Prices .. .. .. .. 98
3.4 World Trade .. .. .. .. .. .. .. .. 99
3.5 International Financial Markets .. .. .. .. .. .. 100
3.5.1 Money Markets .. .. .. .. .. .. .. 100
3.5.2 Capital Markets .. .. .. .. .. .. .. 101
3.5.3 The International Foreign Exchange Market .. .. 102
3.5.4 Central Bank Policy Rates .. .. .. .. .. 104
3.6 The Impact of Global Economic Developments on Nigeria’s
Economy .. .. .. .. .. .. .. .. .. 106
CHAPTER 4 .. .. .. .. .. .. .. .. .. .. .. 109
4.0 FINANCIAL SECTOR DEVELOPMENTS .. .. .. .. .. .. 109
4.1 Institutional Developments .. .. .. .. .. .. 109
4.1.1 Growth and Structural Changes .. .. .. .. 109
4.1.2 Cheques .. .. .. .. .. .. .. .. 111
4.1.3 Use of e-Money Products .. .. .. .. .. 111
` 4.1.3.1 Automated Teller Machine (ATM) Transactions .. 113
4.1.3.2 Web Transactions .. .. .. .. .. 114
4.1.3.3 Point-of-Sale (PoS) Transactions .. .. .. 115
4.1.3.4 Mobile Payments .. .. .. .. .. 116
4.1.4 The Wholesale Payments System .. .. .. .. 117
4.1.4.1 The Real Time Gross Settlement (RTGS) System .. 117
4.1.4.2 NIBSS Instant Payment (NIP) Transactions .. .. 118
4.1.4.3 The NIBSS Electronic Funds Transfer (NEFT) .. .. 119
4.1.5 Institutional Savings .. .. .. .. .. .. 119
4.2 Monetary and Credit Developments .. .. .. .. .. 120
4.2.1 Reserve Money (RM) .. .. .. .. .. .. 120
4.2.2 Narrow Money (M1) .. .. .. .. .. .. 121
4.2.3 Quasi-Money .. .. .. .. .. .. .. 122
4.2.4 Broad Money (M2) .. .. .. .. .. .. .. 122
4.2.5 Drivers of Growth in Broad Money .. .. .. .. 123
4.2.5.1 Net Foreign Assets (NFAs) .. .. .. .. 123
DRAFT

Central Bank of Nigeria Annual Report—2018
xiii
4.2.5.2 Net Domestic Credit (NDC) .. .. .. .. 123
4.2.5.2.1 Net Credit to Government (NCG) .. 124
4.2.5.2.2 Credit to the Private Sector (CP) .. .. 125
4.2.5.2.2.1 Outstanding Consumer Credit .. 125
4.2.5.3 Other Assets (Net) (OAN) .. .. .. .. 126
4.2.6 Maturity Structure of Banks’ Loans and Advances, and
Deposit Liabilities.. .. .. .. .. .. .. .. 127
4.2.7 Sectoral Distribution of Credit .. .. .. .. .. 128
4.2.8 Financial/Banking System Developments .. .. .. 129
4.2.9 Money Multiplier and Velocity of Money .. .. .. 131
4.3 Money Market Developments .. .. .. .. .. 132
4.3.1 The Interbank Funds Market .. .. .. .. .. 132
4.3.2 Money Market Assets Outstanding .. .. .. .. 134
4.3.2.1 Nigerian Treasury Bills (NTBs) .. .. .. .. 135
4.3.2.2 Commercial Paper (CP) .. .. .. .. 137
4.3.2.3 Bankers’ Acceptance (BAs) .. .. .. .. 138
4.3.2.4 Federal Republic of Nigeria Treasury Bonds .. 138
4.3.2.5 Federal Government of Nigeria (FGN) Bonds .. 138
4.3.2.6 Domestic Debt and Charges .. .. .. .. 139
4.3.2.6.1 Domestic Debt.. .. .. .. .. 139
4.3.2.6.1.1 FGN Savings Bonds .. .. .. 140
4.3.2.6.1.2 FGN Green Bonds .. .. .. 140
4.3.2.6.1.3 FGN Sukuk Bonds .. .. .. 141
4.3.2.6.2 Domestic Debt Charges .. .. .. 141
4.3.3 Over-the-Counter (OTC) Transaction .. .. .. .. 141
4.3.3.1 OTC Transactions in Nigerian Treasury Bills (NTBs) .. 141
4.3.3.2 OTC Transactions in FGN Bonds .. .. .. 142
4.3.4 Open Market Operations (OMO) .. .. .. .. 142
4.3.4.1 OMO Auctions .. .. .. .. .. .. 142
4.3.4.2 CBN Promisory Note .. .. .. .. .. 142
4.3.4.3 Repurchase Transactions (Repo) .. .. .. 143
4.3.5 Discount Window Operations .. .. .. .. .. 143
4.3.5.1 CBN Standing Facilities .. .. .. .. .. 143
4.3.5.1.1 The Standing Deposit Facility (SDF) .. 143
4.3.5.1.2 The Standing Lending Facility (SLF) .. 143
4.3.4.2 Rediscounting Transactions .. .. .. .. 144
4.4 Other Financial Institutions .. .. .. .. .. .. 144
4.4.1 Development Finance Institutions (DFIs) .. .. .. 144
4.4.2 The Asset Management Corporation of Nigeria (AMCON) 145
4.4.3 The Nigeria Mortgage Refinance Company (NMRC) .. 145
4.4.4 Microfinance Banks (MFBs) .. .. .. .. .. 146
4.4.4.1 The Maturity Structure of Microfinance Banks’ (MFBs)
Loans and Advances, and Deposit Liabilities .. 147
4.4.5 Finance Companies (FCs) .. .. .. .. .. 148
DRAFT

Central Bank of Nigeria Annual Report—2018
xiv
4.4.6 Primary Mortgage Banks (PMBs) .. .. .. .. 148
4.4.7 Bureaux-de-Change (BDCs) .. .. .. .. .. 149
4.5 Capital Market Developments .. .. .. .. .. .. 149
4.5.1 Developments in the Nigerian Capital Market .. .. 149
4.5.2 The Nigerian Stock Exchange (NSE) .. .. .. .. 150
4.5.2.1 The Secondary Market .. .. .. .. .. 152
4.5.2.2 The NSE Value Index .. .. .. .. .. 155
4.5.2.3 The New Issues Market .. .. .. .. .. 156
CHAPTER 5 .. .. .. .. .. .. .. .. .. .. .. 159
5.0 FISCAL POLICY AND GOVERNMENT FINANCE .. .. .. .. 159
5.1 The Fiscal Policy Thrust .. .. .. .. .. .. .. 159
5.2 Federation Account Operations .. .. .. .. .. 161
5.2.1 Federally-collected Revenue .. .. .. .. 161
5.2.1.1 Oil Revenue .. .. .. .. .. .. 161
5.2.1.2 Non-oil Revenue .. .. .. .. .. 162
5.2.2 Federation Account Distribution .. .. .. .. 163
5.2.3 VAT Pool Account Distribution .. .. .. .. 164
5.2.4 Cumulative Distribution .. .. .. .. .. 164
5.3 General Government Finances .. .. .. .. .. 164
5.3.1 Aggregate Revenue .. .. .. .. .. .. 164
5.3.2 Aggregate Expenditure .. .. .. .. .. .. 165
5.3.3 Consolidated Fiscal Balance and Financing .. .. 166
5.3.4 Consolidated Expenditure on Primary Welfare Sectors .. 166
5.4 Federal Government Finances .. .. .. .. .. 167
5.4.1 The Overall Fiscal Balance and Financing .. .. .. 167
5.4.2 Federal Government-retained Revenue .. .. .. 167
5.4.3 Total Expenditure of the Federal Government .. .. 168
5.4.3.1 Recurrent Expenditure .. .. .. .. .. 169
5.4.3.2 Capital Expenditure .. .. .. .. .. 171
5.5 State Governments’ and the FCT’s Finances .. .. .. 172
5.5.1 The Overall Fiscal Balance and Financing .. .. .. 172
5.5.2 Revenue .. .. .. .. .. .. .. .. 173
5.5.3 Expenditure .. .. .. .. .. .. .. 174
5.6 Local Governments’ Finances .. .. .. .. .. .. 176
5.6.1 The Overall Fiscal Balance and Financing .. .. .. 176
5.6.2 Revenue .. .. .. .. .. .. .. .. 177
5.6.3 Expenditure .. .. .. .. .. .. .. 178
5.7 Consolidated Federal Government Debt .. .. .. .. 180
5.7.1 Domestic Debt .. .. .. .. .. .. .. 180
5.7.2 External Debt .. .. .. .. .. .. .. 181
5.7.3 Debt Service .. .. .. .. .. .. .. 182
DRAFT

Central Bank of Nigeria Annual Report—2018
xv
CHAPTER 6 .. .. .. .. .. .. .. .. .. .. .. 185
6.0 REAL SECTOR DEVELOPMENTS .. .. .. .. .. .. .. 185
6.1 Domestic Output .. .. .. .. .. .. .. .. 185
6.2 Agriculture .. .. .. .. .. .. .. .. .. 190
6.2.1 Agricultural Policy and Institutional Support .. .. .. 190
6.2.2 Agricultural Production .. .. .. .. .. .. 192
6.2.2.1 Crop Production .. .. .. .. .. .. 193
6.2.2.2 Livestock .. .. .. .. .. .. .. 193
6.2.2.3 Fishery .. .. .. .. .. .. .. 194
6.2.2.4 Forestry .. .. .. .. .. .. .. 194
6.2.3 Agricultural Prices .. .. .. .. .. .. 195
6.3 Industry .. .. .. .. .. .. .. .. .. 195
6.3.1 Industrial Policy and Institutional Support .. .. .. 195
6.3.2 Industrial Production .. .. .. .. .. .. 198
6.3.2.1 Manufacturing .. .. .. .. .. .. 199
6.3.2.2 Electricity Generation .. .. .. .. 200
6.3.2.3 Energy Consumption .. .. .. .. .. 201
6.3.2.3.1 Electricity Consumption .. .. .. 202
6.3.2.3.2 Hydro-power Consumption .. .. 202
6.3.3 The Extractive Industry .. .. .. .. .. .. 202
6.3.3.1 Oil and Gas Policy and Institutional Support .. 202
(a) Crude Oil Production, Refinery Utilisation, Petroleum
Products and Prices .. .. .. .. .. 203
(b) Gas .. .. .. .. .. .. .. .. 205
6.3.3.2 Solid Minerals .. .. .. .. .. .. 206
(a) Policy and Institutional Support .. .. .. 206
(b) Solid Minerals Production .. .. .. .. 207
6.3.4 Industrial Financing .. .. .. .. .. .. 208
6.3.4.1 The Nigeria Export-Import Bank (NEXIM) .. .. 208
6.3.4.2 The Bank of Industry .. .. .. .. .. 209
6.4 Transportation and Communications .. .. .. .. 210
6.4.1 Aviation Services .. .. .. .. .. .. .. 210
6.4.1.1 Policy and Airport Developments .. .. .. 210
6.4.1.2 Domestic Operations .. .. .. .. .. 211
6.4.1.3 International Operations .. .. .. .. 211
6.4.2 Railway Services .. .. .. .. .. .. .. 211
6.4.3 Maritime Services .. .. .. .. .. .. .. 212
6.4.4 Communications .. .. .. .. .. .. .. 214
6.5 Consumer Prices .. .. .. .. .. .. .. .. 216
6.6 The Social Sector .. .. .. .. .. .. .. .. 218
6.6.1 Employment and Job Creation .. .. .. .. .. 218
6.6.2 Education .. .. .. .. .. .. .. .. 219
6.6.3 Health .. .. .. .. .. .. .. .. 219
6.7 Housing and Urban Development .. .. .. .. .. 220
DRAFT

Central Bank of Nigeria Annual Report—2018
xvi
6.8 Activities of National Emergency Management Agency
(NEMA) .. .. .. .. .. .. .. .. .. 221
6.8 Environment .. .. .. .. .. .. .. .. 221
CHAPTER 7 .. .. .. .. .. .. .. .. .. .. .. 223
7.0 EXTERNAL SECTOR DEVELOPMENTS .. .. .. .. .. .. 223
7.1 Balance of Payments .. .. .. .. .. .. .. 223
7.1.1 Major Developments .. .. .. .. .. .. 223
7.2 The Current Account .. .. .. .. .. .. .. 226
7.2.1 The Goods Account .. .. .. .. .. .. 226
7.2.1.1 Imports: (CIF) .. .. .. .. .. .. 227
(a) Imports by End-User .. .. .. .. .. 228
(b) Imports by the Harmonised System (HS) Classification 228
(c) Non-oil Imports by Country of Origin .. .. .. 229
7.2.1.2 Exports: (fob) .. .. .. .. .. .. 230
(a) Direction of Oil Exports .. .. .. .. .. 230
(b) Non-oil Exports .. .. .. .. .. .. 231
(c) Non-oil Exports to the ECOWAS Sub-Region .. .. 233
(d)Activities of the Top 100 Non-Oil Exporters .. .. 233
7.2.2 The Services Account .. .. .. .. .. .. 234
7.2.3 The Income Account .. .. .. .. .. .. 236
7.2.4 Current Transfers .. .. .. .. .. .. .. 236
7.3 The Capital and Financial Account .. .. .. .. .. 237
7.4 Capital Importation .. .. .. .. .. .. .. 239
7.4.1 Capital Importation by Nature of Investment .. .. 239
7.4.2 Capital Importation by Country of Origin .. .. .. 240
7.4.3 Capital Importation by Sector .. .. .. .. .. 241
7.4.4 Capital Importation by Destination .. .. .. .. 242
7.5 The International Investment Position (IIP) .. .. .. .. 243
7.6 Exchange Rate Movements .. .. .. .. .. .. 246
7.7 The Nominal and Real Effective Exchange Rates .. .. .. 249
CHAPTER 8 .. .. .. .. .. .. .. .. .. .. .. 251
8.0 INTERNATIONAL AND REGIONAL INSTITUTIONS .. .. .. .. 251
8.1 The International Monetary System .. .. .. .. .. 251
8.1.1 The International Monetary Fund (IMF)/World Bank
Spring and Annual Meetings .. .. .. .. .. 251
8.1.2 African Caucus Meeting of the IMF/World Bank .. .. 253
8.1.3 The Group of Twenty-Four (G-24) Technical Group Meeting 254
8.1.4 The 95th Regular Council Meetings and Other Subsidiary
Bodies of the International Cocoa Organisation (ICCO) .. 256
8.1.5 The 96th Regular Council Session and Subsidiary Bodies
of the International Cocoa Organisation (ICCO) .. .. 258
DRAFT

Central Bank of Nigeria Annual Report—2018
xvii
8.2 Regional Institutions .. .. .. .. .. .. .. 259
8.2.1 The Annual Meetings of the African Development Bank (AfDB)259
8.2.2 The 40th Ordinary Meetings of the Assembly of Governors
of the Association of African Central Banks (AACB).. .. 260
8.2.3 Ordinary Meeting of the Bureau of the Association of
African Central Banks (AACB) .. .. .. .. .. 261
8.2.4 The Continental Seminar of the Association of African Central
Banks (AACB) .. .. .. .. .. .. .. 262
8.3 Sub-Regional Institutions .. .. .. .. .. .. .. 264
8.3.1 34th Meeting of the WAMZ Committee of Governors .. 264
8.3.2 32nd Meeting of the Board of Governors of the West African
Institute for Financial and Economic Management (WAIFEM) 265
8.3.3 49th Meeting of the Committee of Governors of Central
Banks of ECOWAS Member States .. .. .. .. 266
8.3.4 37th Meeting of the Convergence Council of Ministers and
Governors of Central Banks of the West African Monetary
Zone (WAMZ) .. .. .. .. .. .. .. 268
8.3.5 Mid-Year Statutory Meeting of the Economic Community of
West African States (ECOWAS) .. .. .. .. .. 268
8.3.6 The 4th Meeting of the Presidential Task Force on the
Economic Community of West African States (ECOWAS)
Single Currency Programme .. .. .. .. .. 268
DRAFT

Central Bank of Nigeria Annual Report—2018
xviii
LIST OF TABLES IN THE TEXT
Selected Macroeconomic and Social Indicators .. .. .. .. .. lv
1.1 Committee of Governors (COG) Meetings: Attendance in 2017 .. 2
1.2 Monetary Policy Committee (MPC) Meetings: Attendance in 2017 .. 2
1.3 MPC Decisions in 2017 .. .. .. .. .. .. .. .. 3
2.1 Key Policy Targets and Outcomes, 2013 – 2017 (per cent) .. .. 27
2.2 Money Market Rates (per cent) .. .. .. .. .. .. 30
2.2a Number and Value of e-Fraud in 2017 .. .. .. .. .. 34
2.2b Licensed Players in the Payments Ecosystem in 2017 .. .. .. 37
2.3 Breakdown of e-Payment Channels in 2017. .. .. .. .. 39
2.4 Currency Structure, 2013 – 2017 .. .. .. .. .. .. 41
2.5 Foreign Exchange Flows through the Economy (US$’Million), 2016 - 2017 46
2.6 Borrowers from the Banking Sector (Commercial and Merchant Banks).. 57
2.7 Funds Disbursements Under the ABP by Sector, 2015 – 2017 .. .. 73
2.8 Funds Disbursements Under CACS by Value Chain Activity (2017) .. 74
2.9 Funds Uptake and Repayment under the MSMEDF (2014 – 2017) .. 78
2.10 Funds Uptake under the NEMSF (2016 – 2017) .. .. .. .. 79
2.11 Funds Disbursement Under the NBET-PAF (2017) .. .. .. .. 81
2.12 Sectoral Distribution of Loans under SMERRF .. .. .. .. .. 82
2.13 Number and Value of Financing Statements by Registrants .. .. 84
2.14 Formal Financial Service Product Indicators .. .. .. .. .. 86
2.15 Channels for Formal Financial Services .. .. .. .. .. 87
2.16 Summary of EDCs Performance (Since Inception 2014 – 2017) .. .. 90
3.1 Changes in World Output and Prices (per cent) 2013 – 2017 .. .. 96
3.2 World Trade Volumes, 2013 – 2017 .. .. .. .. .. .. 100
3.3 Selected International Stock Market Indices as at December 31, 2017 102
3.4 Exchange Rates of Selected Countries (values in currency units to US$) 104
3.5 Monetary Policy Rates of Selected Countries 2016 – 2017 .. .. 106
4.1 Reserve Money (N’ Billion).. .. .. .. .. .. .. .. 120
4.2 Reserve Money (% growth rates).. .. .. .. .. .. .. 120
4.3 Contribution to the Growth in M2, 2013– 2017 (percentage points) .. 125
4.4 Composition of Total Monetary Aggregates (M2), 2013 - 2017 (per cent) 126
4.5 Maturity Structure of DMBs’ Loans and Advances, and Deposit Liabilities,
2015 – 2017 .. .. .. .. .. .. .. .. .. .. 127
4.6 Share in Outstanding Credit to the Core Private Sector, 2016 – 2017
(per cent) .. .. .. .. .. .. .. .. .. .. 129
4.7 Indicators of Financial Development .. .. .. .. .. .. 130
4.8 Money Multiplier and Velocity of M2, 2013 – 2017 .. .. .. .. 131
4.9 Composition of Money Market Assets Outstanding in 2016 and 2017 .. 135
4.10 NTB Issues, Subscription, Allotments and Repayments, 2013 - 2017 .. 136
4.11 Liquidity Flows, 2016 & 2017 .. .. .. .. .. .. .. 137
4.12 Outstanding Federal Government Debt Instrument as at December 31,
2017 .. .. .. .. .. .. .. .. .. .. .. 140
DRAFT

Central Bank of Nigeria Annual Report—2018
xix
4.13 Domestic Debt Charges (N’ Billion), 2017 .. .. .. .. .. 141
4.14 Maturity Structure of Assets and Liabilities of Microfinance Banks (MFBs),
2016 – 2017, (Per cent) .. .. .. .. .. .. .. .. 148
4.15 Indicators of Capital Market Developments in the Nigerian Stock
Exchange (NSE), 2013 – 2017 .. .. .. .. .. .. .. 155
5.1 Sources of Funds for the Three Tiers of Government, 2017 (N‘Billion) .. 165
5.2 State Governments’ Revenue .. .. .. .. .. .. .. 174
5.3 Local Governments’ Revenue .. .. .. .. .. .. 177
6.1 Sectoral Contribution to Growth Rates of GDP at 2010 Constant Basic
Prices (percentage points) .. .. .. .. .. .. .. 186
6.2 Sectoral Growth Rates of GDP at 2010 Constant Basic Prices (per cent) 187
6.3 Growth in Major Crop Production (per cent) .. .. .. .. 193
6.4 Headline Inflation (year-on-year) (per cent) .. .. .. .. .. 218
6.5 Labour Statistics, 2013 – 2017 .. .. .. .. .. .. .. 219
7.1 Summary of Balance of Payments (BOP) Statement .. .. .. 225
7.2 Net Share of Major Invisible Transactions, 2013 – 2017 (per cent) .. 235
7.3 Current Transfers (N’Billion), 2015 - 2017 .. .. .. .. .. 237
7.4 New Capital Inflows (US$’ Thousand) .. .. .. .. .. .. 240
7.5 Capital Importation: Country and Sector Inflows (US$’Million) .. .. 243
7.6 International Investment Position (IIP) (US$’Million), 2013 – 2017 .. .. 245
7.7 Nominal and Real Effective Exchange Rate Indices (November 2009=100) 249
DRAFT

Central Bank of Nigeria Annual Report—2018
xx
LIST OF FIGURES
1.1 Recruitment of New Employees in 2017 .. .. .. .. .. 16
1.2 Staff Strength by Category and Gender at end-December, 2017 .. 16
1.3 Staff Clinic Activities, 2017 .. .. .. .. .. .. .. 17
1.4 Specialist Medical Services, 2017 .. .. .. .. .. .. 18
1.5 Local and Foreign Training Distribution by Directorate, 2017 .. .. 18
1.6 Local and Foreign Training Distribution by Gender, 2017 .. .. .. 19
2.1 Money Market Rates (per cent) .. .. .. .. .. .. 30
2.2 Average Savings, Prime and Maximum Lending Rates, 2013 - 2017 .. 31
2.3 Spread Between the Average Term Deposit and Maximum Lending
Rates (2013 – 2017) .. .. .. .. .. .. .. .. 31
2.4 Real Interest Rates , 2013 - 2017 .. .. .. .. .. .. .. 32
2.5a Currency-in-Circulation, 2013 - 2017 .. .. .. .. .. .. 40
2.5b Ratio of Currency-in-Circulation to GDP, 2013 – 2017 .. .. .. 40
2.6 Foreign Exchange Disbursements through the CBN, 2017 .. .. 47
2.7 Foreign Exchange Flows through the CBN, 2016 - 2017 .. .. .. 47
2.8 Sectoral Utilisation of Foreign Exchange, 2017 .. .. .. .. 49
2.9 Gross External Reserves Position and Months of
Import Cover, 2013 - 2017 .. .. .. .. .. .. .. 50
2.10 Holdings of External Reserves at end-December, 2017 .. .. .. 51
2.11 External Reserves Position and Crude Oil Prices .. .. .. .. 51
2.12 Banks’ Non-Performing Loans, 2013 - 2017 (% of total credit) .. .. 65
2.13 Consumer Complaints by Cartegory, 2017 .. .. .. .. .. 70
2.14 Number and Value of Loans Guaranteed by Purpose under the ACGS,
2017 .. .. .. .. .. .. .. .. .. .. .. 72
2.15 Volume and Value of Financial Statements Registered on the NCR by
Debtor Type (2017), per cent .. .. .. .. .. .. .. 85
2.16 Comparative performance of EDCs in 2017 .. .. .. .. .. 89
4.1 Banks’ Branch Network, 2013 – 2017 .. .. .. .. .. .. 110
4.2a Volume of Cheques Cleared, 2014 – 2017 .. .. .. .. 111
4.2b Value of Cheques Cleared, 2014 – 2017 .. .. .. .. .. 111
4.3a Classification of e-Money Products by Volume, 2017 (per cent).. .. 112
4.3b Classification of e-Money Products by Value, 2017 (per cent) .. .. 112
4.4a Volume of Electronic Payments, 2015 - 2017 (Million) .. .. .. 113
4.4b Value of Electronic Payments, 2015 - 2017 (N ‘Billion) .. .. .. 113
4.5a Volume of ATM Transactions, 2015 – 2017 (Million) .. .. .. .. 114
4.5b Value of ATM Transactions, 2015 – 2017 (N ‘Billion).. .. .. .. 114
4.6a Volume of Web Transactions, 2015 – 2017 (Million).. .. .. .. 114
4.6b Value of Web Transactions, 2015 – 2017 (N’Billion) .. .. .. .. 115
4.7a Volume of Point-of-Sale (PoS) Transactions, 2015 – 2017 (Million).. .. 115
4.7b Value of Point-of-Sale (PoS) Transactions, 2015 – 2017 (N ‘Billion) .. 116
4.8a Volume of Mobile Transactions, 2015 – 2017 (Million) .. .. .. 116
4.8b Value of Mobile Transactions, 2015 – 2017 (N’Billion) .. .. .. 117
4.9a Volume of RTGS Transactions, 2015 – 2017 (Million).. .. .. .. 117
DRAFT

Central Bank of Nigeria Annual Report—2018
xxi
4.9b Value of RTGS Transactions, 2015 – 2017 (N’Billion).. .. .. .. 118
4.10a Volume of NIBSS Interbank Payments (NIP) Transactions, 2015 - 2017 .. 118
4.10b Value of NIBSS Interbank Payments (NIP) Transactions, 2015 - 2017 .. 118
4.11a Volume of NIBSS Electronic Funds Transfer (NEFT) Transactions, 2015 - 2017 119
4.11b Value of NIBSS Electronic Funds Transfer (NEFT) Transactions, 2015 - 2017 119
4.12a Reserve Money, 2013 – 2017 .. .. .. .. .. .. .. 121
4.12b Reserve Money Targets and Outcomes, 2013 - 2017 .. .. .. 121
4.13 Components of Narrow Money (M1) (per cent) 2013 - 2017 .. .. 121
4.14 Growth in Monetary Aggregates, 2013 – 2017 (per cent) .. .. 122
4.15 Growth in the Components of Broad Money (M2), 2013 - 2017 .. .. 123
4.16 Growth in Braod Money Supply (M2), 2013 - 2017 (per cent).. .. .. 124
4.17 Share of NFA, NDC, and OAN in M2 (per cent), 2013 - 2017 .. .. 124
4.18 Growth in Net Domestic Credit, 2013 - 2017 (per cent) .. .. .. 125
4.19 Consumer Credit, 2013 – 2017 .. .. .. .. .. .. .. 126
4.20a Maturity Structure of DMBs’ Loans and Advances at end-December,
2017 (per cent) .. .. .. .. .. .. .. .. .. 127
4.20b Maturity Structure of DMBs’ Deposits at end-December, 2017 .. .. 128
4.21 Ratio of Banking System’s Total Assets to GDP, 2013 – 2017 .. .. 131
4.22 Money Multiplier, Currency Ratio and Reserve Ratio, 2013 - 2017 .. 132
4.23 Velocity of Broad Money, 2013 – 2017 .. .. .. .. .. 132
4.24 Value of Interbank Funds Market Transactions, 2013 - 2017.. .. .. 133
4.25 Share of Interbank Funds Market Transactions, 2017 (per cent) .. .. 133
4.26 Money Market Assets Outstanding, 2013 - 2017 .. .. .. .. 134
4.27 Growth Rates of Money Market Assets Outstanding, 2017 (per cent) .. 134
4.28 NTB Issues, Subscriptions & Allotments , 2013 -2017. . .. .. .. 135
4.29 Nigerian Treasury Bills Outstanding, 2013 – 2017 .. .. .. .. 136
4.30 Nigerian Treasury Bills: Breakdown of Allotments, 2017 .. .. .. 137
4.31 Nigerian Treasury Bills Outstanding: Classes of Holders in 2017 (per cent).. 137
4.32 Outstanding FGN Bonds, 2017 .. .. .. .. .. .. .. 139
4.33 FGN Bonds by Holder, 2017 (per cent) .. .. .. .. .. 139
4.34 OMO Issues and Sales, 2013 - 2017 .. .. .. .. .. .. 142
4.35 Trends in Market Capitalisation and NSE Value Index, 2013 - 2017 .. 153
4.36 Aggregate Market Capitalisation (per cent) .. .. .. .. 154
4.37 Share of Banks in the 20 Most Capitalised Stocks in the NSE, 2013 – 2017 155
4.38 New Issues by Sector, 2017 (per cent) .. .. .. .. .. 157
5.1 Oil and Non-oil Revenue, 2013 - 2017 (per cent of GDP) .. .. .. 161
5.2 Federation Account: Composition of Revenue, 2013 – 2017 (N‘Billion) 162
5.3 Composition of Non-oil Revenue, 2017 .. .. .. .. .. 163
5.4 Cumulative Distribution of Statutory Revenue & VAT, 2017 (N‘Billion) .. 164
5.5 Composition of General Government Expenditure, 2017 .. .. .. 166
5.6 Federal Government Fiscal Deficit, 2013 - 2017 (per cent of GDP).. .. 167
5.7 Composition of Federal Government-retained Revenue, 2017 (per cent) 168
5.8 Federal Government Revenue and Expenditure, 2013 – 2017
(per cent of GDP) .. .. .. .. .. .. .. .. .. 168
DRAFT

Central Bank of Nigeria Annual Report—2018
xxii
5.9 Composition of Federal Government Expenditure, 2017 (per cent) .. 169
5.10 Economic Classification of FG Recurrent Expenditure, 2017 .. .. 170
5.11 Federal Government Recurrent Expenditure and Personnel Cost,
2013 - 2017 (per cent of GDP) .. .. .. .. .. .. .. 170
5.12 Functional Classification of Federal Government Recurrent
Expenditure, 2017 (per cent) .. .. .. .. .. .. .. 171
5.13 Federal Government’s Expenditure in Key Primary Welfare Sectors, 2017
(per cent of total and GDP) .. .. .. .. .. .. .. 172
5.14 State Governments’ and FCT’s Revenue, 2017, (N ‘Billion) .. .. 173
5.15 State Governments’ Expenditure, 2013 - 2017 (per cent of GDP) .. 174
5.16 State Governments’ Expenditure in Key Primary Welfare Sectors, 2017
(per cent of Total Expenditure) .. .. .. .. .. .. .. 175
5.17 State Governments’ Expenditure in Key Primary Welfare Sectors, 2017
(per cent of GDP).. .. .. .. .. .. .. .. .. 176
5.18 Local Governments’ Revenue and Overall Balance, 2013 - 2017
(per cent of GDP).. .. .. .. .. .. .. .. .. 176
5.19 Local Governments’ Expenditure, 2013 - 2017 (per cent of GDP) .. 178
5.20 Local Governments’ Expenditure in the Primary Welfare Sector, 2017
(per cent of total expenditure) .. .. .. .. .. .. .. 179
5.21 Local Governments’ Expenditure in Primary Welfare Sector, 2017
(per cent of GDP) .. .. .. .. .. .. .. .. .. 179
5.22 Consolidated Public Debt Stock, 2013 - 2017 (per cent of GDP) .. 180
5.23 Composition of Domestic Debt Stock by Holder, 2017 .. .. .. 181
6.1 GDP Growth Rate, 2013-2017 (per cent) .. .. .. .. .. 185
6.2 Sectoral Shares in GDP, 2013 - 2017 .. .. .. .. .. .. 188
6.3 Growth Rate of Major Sectors of Non-oil GDP, 2013 – 2017 (per cent) .. 188
6.4 Contributions to Growth Rate of Non-oil GDP, 2013 – 2017 (per cent) .. 189
6.5 GDP (Expenditure Approach) at 2010 Purchasers’ Price, 2013 - 2017 .. 190
6.6 Index of Industrial Production, 2013 - 2017 .. .. .. .. .. 199
6.7 Index of Manufacturing Production and Capacity Utilisation, 2013 - 2017 200
6.8 Nigeria’s Power System: Composition in 2017 by Source (per cent) .. 200
6.9 Nigeria’s Power System: Composition in 2017 by Holding (per cent) .. 201
6.10 Electricity Power Generation, 2013 – 2017 .. .. .. .. .. 201
6.11 Electricity Consumption, 2013 - 2017 .. .. .. .. .. .. 202
6.12 Bonny Light Monthly Prices in 2016 and 2017 .. .. .. .. 205
6.13 Gas Production and Utilisation, 2013 – 2017 .. .. .. .. 206
6.14 Summary of NEXIM Disbursements by Facility, 2017 (per cent) .. .. 208
6.15 Summary of NEXIM Disbursements by Sector, 2017 (per cent) .. .. 209
6.16 Summary of BOI Disbursements by Sector, 2017 (per cent) .. .. 210
6.17 Trends of Mobile Lines and Teledensity, 2013 – 2017 .. .. .. 214
6.18 Market Share by Operator (GSM), December 2017 .. .. .. 215
6.19 Trends in Inflation 2017 (Year-on-year, 12-Month Moving Average
and Month-on-Month) .. .. .. .. .. .. .. .. 217
6.20 Trends in Inflation (Composite, Core and Food), 2017 .. .. .. 217
DRAFT

Central Bank of Nigeria Annual Report—2018
xxiii
7.1 Balance of Payments, 2013 – 2017 (per cent of GDP) .. .. .. 224
7.2 Value of Imports, Exports and Trade Balance, 2013 – 2017 (N ‘Million) .. 227
7.3 Imports by Major Groups, 2017 (per cent).. .. .. .. .. .. 228
7.4 Non-oil Imports by Country of Origin, (2013 – 2017)
(percentage share of total) .. .. .. .. .. .. .. 229
7.5 Direction of Crude Oil Exports, 2013 - 2017 .. .. .. .. 231
7.6 Non-oil Exports by Product, 2017 .. .. .. .. .. .. 232
7.7 Percentage Share of Major Invisible Services, 2013 - 2017 .. .. 235
7.8 Capital Importation by Country of Origin, 2017 (per cent) .. .. 241
7.9 Capital Importation by Sector, 2017 (per cent) .. .. .. .. 241
7.10 Capital Importation by Destination States, 2017 (per cent) .. .. 242
7.11 Net International Investment Position (IIP), 2013 – 2017 (US$ ’Million) .. 246
7.12 Demand and Supply of Foreign Exchange, and Exchange Rate
Premium, 2015 – 2017 .. .. .. .. .. .. .. .. 247
7.13 Average Yearly Exchange Rate of the Naira per US Dollar, 2013 - 2017 248
7.14 End-Period Exchange Rate of the Naira per US Dollar, 2013 – 2017 .. 248
7.15 Quarterly Average Exchange Rate of the Naira vis-à-vis US Dollar,
2013 - 2017.. .. .. .. .. .. .. .. .. .. 248
7.16 Nominal and Real Effective Exchange Rate Indices, 2013 - 2017 .. 249
DRAFT

Central Bank of Nigeria Annual Report—2018
xxiv
LIST OF BOXES
1 Enhancing Macroeconomic Modeling Toolkit at the Central Bank of
Nigeria .. .. .. .. .. .. .. .. .. .. 23
2 The Federal Government of Nigeria Green Bonds .. .. .. .. 183
3 The Voluntary Assets and Income Declaration Scheme (VAIDS) .. .. 184
LIST OF APPENDICES
A Financial Statement .. .. .. .. .. .. .. .. 271
B Glossary of Selected Terms.. .. .. .. .. .. .. .. 278
C Policy Circulars and Guidelines Issued in 2016 .. .. .. .. 288
1. Banking Supervision Department.. .. .. .. .. .. 288
2. Financial Policy and Regulation Department .. .. .. 290
3. Trade and Exchange Department .. .. .. .. .. 290
4. Currency Operations Department .. .. .. .. .. 291
5. Banking and Payments System Department .. .. .. 292
6. Monetary Policy Department .. .. .. .. .. 293
D Tables In the Appendices .. .. .. .. .. .. .. 294
1 Selected Interest Rates (per cent) .. .. .. .. .. .. 294
2 Loans Guaranteed under the ACGSF by Size and Purpose.. .. .. 295
3 Foreign Exchange Flows through the Economy .. .. .. .. 296
4 Currency-in-Circulation .. .. .. .. .. .. .. .. 297
5 Money Supply and its Determinants .. .. .. .. .. .. 298
6 Banking System Credit to the Economy .. .. .. .. .. 299
7 Summary of Deposit Money Banks’ Activities .. .. .. .. 301
8 Deposit Money Banks’ Sources and Application of Funds .. .. 302
9 Summary of Microfinance Banks’ Activities .. .. .. .. .. 303
10 Discount Houses’ Statement of Assets and Liabilities .. .. .. 304
11 Summary of Assets and Liabilities of Finance Companies .. .. 305
12 Value of Money Market Assets .. .. .. .. .. .. 306
13 Treasury Bills: Issues and Subscriptions .. .. .. .. .. 307
14 Holdings of Treasury Bills Outstanding .. .. .. .. .. 308
15 Open Market Operations at OMO Sessions .. .. .. .. .. 309
16 Transactions on the Nigerian Stock Exchange .. .. .. .. 310
17 Market Capitalisation of Quoted Companies: Equities only .. .. 311
18 Value Index of All Common Stocks Listed by Sector on the NSE .. 312
19 Federation Account Operations .. .. .. .. .. .. 313
20 Federally-collected Revenue Distributions .. .. .. .. .. 314
21 Summary of General Government Finances .. .. .. .. 315
DRAFT

Central Bank of Nigeria Annual Report—2018
xxv
22 General Government’s Expenditure on Selected Primary Welfare Sectors 316
23 Summary of Federal Government Finances .. .. .. .. 317
24 Functional Classification of Federal Government Recurrent
and Capital Expenditure .. .. .. .. .. .. .. 318
25 Federal Government Expenditure on Key Primary Welfare Sectors .. 319
26 State Governments’ and FCT’s Finances .. .. .. .. .. 320
27 Functional Classification of State Governments’ Recurrent and Capital
Expenditure .. .. .. .. .. .. .. .. .. 321
28 Summary of State Governments’ and FCT’s Finances: State-by-State,
2016 .. .. .. .. .. .. .. .. .. .. .. 322
29 State Governments’ and FCT’s Expenditures on Selected Sectors .. 326
30 Summary of Local Governments’ Finances .. .. .. .. 327
31 Summary of Local Governments’ Finances, State-by-State, 2016 .. 328
32 Local Governments’ Expenditure on Selected Primary Welfare Sectors 332
33 Consolidated Debt of the Federal Government .. .. .. .. 333
34 External Public Debt Outstanding .. .. .. .. .. .. 334
35 Gross Domestic Product at 2010 Constant Basic Prices .. .. .. 335
36 Gross Domestic Product at Current Basic Prices .. .. .. .. 336
37 Gross Domestic Product at 2010 Purchasers’ Price: Expenditure
Approach .. .. .. .. .. .. .. .. .. .. 337
38 Gross Domestic Product at Current Purchasers’ Price: Expenditure
Approach .. .. .. .. .. .. .. .. .. .. 337
39 National Income at 2010 Constant Market Prices .. .. .. 338
40 Index of Agricultural Production by Type of Activity .. .. .. 338
41 Estimated Output of Major Agricultural Commodities .. .. .. 339
42 Indices of Average World Prices (c.i.f) of Nigeria’s Major Agricultural
Export Commodities (Dollar-based) .. .. .. .. .. 340
43 Indices of Average World Prices (c.i.f) of Nigeria’s Major Agricultural
Export Commodities (Naira-based) .. .. .. .. .. .. 340
44 Average Prices of Selected Cash Crops .. .. .. .. .. 341
45 Index of Industrial Production .. .. .. .. .. .. .. 342
46 Index of Manufacturing Production .. .. .. .. .. .. 343
47 Production of Principal Solid Minerals .. .. .. .. .. .. 344
48 Energy Consumption .. .. .. .. .. .. .. .. 345
49 Consumption of Petroleum Products .. .. .. .. .. .. 346
50 Contribution from Local Refineries (MT) .. .. .. .. .. 346
51 Gas Production, Utilization and Disposal (mscf) .. .. .. .. 347
52 World Crude Oil Production and Consumption .. .. .. .. 348
53 Analysis of the Average Spot Prices of Selected Global Crudes .. 349
54 Composite Consumer Price Index .. .. .. .. .. .. 350
55 Urban Consumer Price Index .. .. .. .. .. .. .. 351
56 Rural Consumer Price Index .. .. .. .. .. .. .. 352
57 Balance of Payments (US$’ Million) .. .. .. .. .. .. 353
58 Balance of Payments (N‘Million) .. .. .. .. .. .. 356
DRAFT

Central Bank of Nigeria Annual Report—2018
xxvi
59 Balance of Payments Analytical Presentation (US$’ Million) .. .. 359
60 Balance of Payments Analytical Presentation (N’ Million) .. .. 361
61 Visible Trade .. .. .. .. .. .. .. .. .. 363
62 Imports by Major Groups .. .. .. .. .. .. .. 364
63 Non-oil Imports by Country of Origin (cif) .. .. .. .. .. 365
64 Non-oil Exports by H. S. Section .. .. .. .. .. .. .. 366
65 Direction of Crude Oil Export .. .. .. .. .. .. .. 367
66 Non-oil Exports by Product .. .. .. .. .. .. .. 368
67 Top 100 Non-oil Exporters in Nigeria in 2016 .. .. .. .. .. 369
68 Exchange Rate Movements (N/$) .. .. .. .. .. .. 372
69 International Investment Position of Nigeria (US$’ Million) .. .. .. 373
70 International Investment Position of Nigeria (N’ Million) .. .. .. 375
DRAFT

Central Bank of Nigeria Annual Report—2018
xxvii
LIST OF ABBREVIATIONS AND ACRONYMS
AACB Association of African Central Banks
ABS Analytical Balance Sheet
ACGSF Agricultural Credit Guarantee Scheme Fund
ACSS Agricultural Credit Support Scheme
ADF African Development Fund
ADPs Agricultural Development Programmes
AES African Econometrics Society
AFC Africa Finance Corporation
AfDB African Development Bank
AGOA African Growth Opportunity Act
AIPs Approvals-In-Principle
AMCON Asset Management Corporation of Nigeria
AMCP African Monetary Cooperation Programme
AML/CFT Anti-Money Laundering/Combating the Financing of Terrorism
ATAP Agricultural Transformation Action Plan
APRM Africa Peer Review Mechanism
ATMs Automated Teller Machines
AU African Union
AUC Africa Union Commission
BAs Bankers’ Acceptances
BDCs Bureaux-de-Change
BoE Bank of England
BOI Bank of Industry
BWIs Bretton Woods Institutions
CAC Corporate Affairs Commission
CACS Commercial Agriculture Credit Scheme
CAMA Companies and Allied Matters Act
CAMEL Capital Adequacy, Asset Quality, Management Efficiency,
Earnings and Liquidity
CAR Capital Adequacy Ratio
DRAFT

Central Bank of Nigeria Annual Report—2018
xxviii
CBN Central Bank of Nigeria
CBP Capacity Building Programme
CBs Community Banks
CDMA Code Division Multiple Access
CEPR Centre for Economic Policy Research
CG Credit to Government
CIC Currency-in-Circulation
CIFTS Central Bank Interbank Funds Transfer System
CIS Commonwealth of Independent States
CIT Companies Income Tax
COB Currency Outside Banks
COBEC Code of Business Ethics and Conduct
COPAL Cocoa Producers’ Alliance
CPS Credit to the Private Sector
CPI Consumer Price Index
CP Commercial Paper
CRMS Credit Risk Management System
CRR Cash Reserve Requirement
CSAR Country Self-Assessment Report
CSCS Central Securities Clearing System
CSOs Civil Society Organisations
DFIs Development Finance Institutions
DHs Discount Houses
DLF Direct Lending Facilities
DISCOs Distribution Companies
DMBs Deposit Money Banks
DMO Debt Management Office
DS Development Stocks
ECB European Central Bank
EBP Electronic Budgeting and Planning
EBSCO Host EBSCO Host Research Database
DRAFT

Central Bank of Nigeria Annual Report—2018
xxix
ECA Economic Commission for Africa
ECOWAS Economic Community of West African States
EDCs Entrepreneurship Development Centres
EEG Export Expansion Grant
e-FASS Electronic Financial Analysis and Surveillance System
EFCC Economic and Financial Crimes Commission
e-FinA Enhancing Financial Innovation and Access
EMDCs Emerging Markets and Developing Economies
e-Money Electronic Money
EMS Enterprise Management and Security
ERP Enterprise Resource Planning
ETF Education Tax Fund
FAAC Federation Accounts Allocation Committee
FCs Finance Companies
FCT Federal Capital Territory
FDI Foreign Direct Investment
FGN Federal Government of Nigeria
FHAN Finance Houses Association of Nigeria
FIRS Federal Inland Revenue Service
FITC Financial Institutions Training Centre
FM F Federal Ministry of Finance
fob Free on Board
FRIN Forestry Research Institute of Nigeria
FSS 2020 Financial System Strategy 2020
G-24 Group of Twenty-Four (G24) Developing Countries
GDP Gross Domestic Product
GENCOs Generation Companies
GES Growth Enhancement Scheme
GSM Global System of Mobile Communications
IAS International Accounting Standards
IBRD International Bank for Reconstruction and Development
DRAFT

Central Bank of Nigeria Annual Report—2018
xxx
ICCO International Cocoa Organization
ICO International Coffee Organization
IDA International Development Assistance
IDMS Integrated Document Management System
IEA International Energy Agency
IFAD International Fund for Agricultural Development
IFT Interbank Funds Transfer
IGR Internally Generated Revenue
IIP International Investment Position
ILN Interactive Learning Network
IMF International Monetary Fund
IPI Information Publication Investment
IPOs Initial Public Offers
IPPs Independent Power Plants
ISPs Internet Service Providers
IT Information Technology
ITU International Telecommunication Union
JSTOR Journal Storage
JVCs Joint Venture Cash Calls
KYC Know Your Customer
LOKAP Lagos, Kano, Aba and Port-Harcourt
LPFO Low Pour Fuel Oil
LR Liquidity Ratio
LROs Lead Research Organisations
LVIFT Large Value Interbank Funds Transfer
M1 Narrow Money
M2 Broad Money
mbd Million barrels per day
MDGs Millennium Development Goals
MFBs Microfinance Banks
MICR Magnetic Ink Character Recognition
DRAFT

Central Bank of Nigeria Annual Report—2018
xxxi
MMDs Money Market Dealers
MoU Memorandum of Understanding
MPC Monetary Policy Committee
MPR Monetary Policy Rate
MRR Minimum Rediscount Rate
MSME Micro Small and Medium Enterprises
MTEF Medium-Term Expenditure Framework
MYTO Multi-Year Tariff Order
NACRDB Nigerian Agricultural, Cooperative and Rural Development Bank
NACS Nigerian Automated Clearing System
NAFDAC National Agency for Food, Drug Administration and Control
NAICOM National Insurance Commission
NAOC Nigeria Agip Oil Company
NAPCON National Petroleum Company of Nigeria
NAPRI National Animal Production Research Institute
NBS National Bureau of Statistics
NCS Nigeria Custom Service
NDC Net Domestic Credit
NDIC Nigeria Deposit Insurance Corporation
NEEDS National Economic Empowerment and Development Strategy
NEER Nominal Effective Exchange Rate
NEPAD New Partnership for Africa’s Development
NERC National Electricity Regulatory Commission
NERFUND National Economic Reconstruction Fund
NEXIM Nigerian Export-Import Bank
NFAs Net Foreign Assets
NGC Nigerian Gas Company
NGOs Non-Governmental Organisations
NIBBS Nigeria Interbank Settlement System
NIBOR Nigerian Inter-Bank Offered Rate
NICPAS Nigerian Cheque Printers Accreditation Scheme
DRAFT

Central Bank of Nigeria Annual Report—2018
xxxii
NIMASA Nigerian Maritime Administration and Safety Agency
NITDF National Information Technology Development Fund
NNPC Nigerian National Petroleum Corporation
NPC National Population Commission
NPSC National Payments System Committee
NSE Nigerian Stock Exchange
NSPFS National Special Programme for Food Security
NSPM Nigerian Security Printing and Minting
NTBs Nigerian Treasury Bills
NWG National Working Group
OAGF Office of the Accountant General of the Federation
OARE Online Access to Research in the Environment
OBB Open-Buy-Back
ODA Overseas Development Assistance
OFIs Other Financial Institutions
OMO Open Market Operations
OPEC Organisation of Petroleum Exporting Countries
OTC Over-the-Counter
P&A Purchase and Assumption
PENCOM National Pension Commission
PEP Politically Exposed Person
PHCN Power Holding Company of Nigeria
PIR Process Improvement and Redesign
PMIs Primary Mortgage Institutions
PMS Portfolio Management System
PoS Point-of-Sale
PPT Petroleum Profit Tax
PSI Policy Support Instrument
PSV Payments System Vision
QE Quantitative Easing
RBDAs River Basins Development Authorities
DRAFT

Central Bank of Nigeria Annual Report—2018
xxxiii
RBS Risk Based Supervision
rDAS Retail Dutch Auction System
REC Regional Economic Commission
REER Real Effective Exchange Rate
RRF Refinancing and Restructuring Fund
RTEP Root and Tuber Expansion Project
RTGS Real Time Gross Settlement
S4 Scripless Securities Settlement System
SBUs Strategic Business Units
SEC Securities and Exchange Commission
SFU Special Fraud Unit
SITC Standard International Trade Classification
SME Small and Medium Enterprises
SMECGS Small and Medium Enterprises Credit Guarantee Scheme
SMEDAN Small and Medium Enterprises Development Agency
SMEEIS Small and Medium Enterprises Equity Investment Scheme
SME-RRF SME Refinancing and Restructuring Fund
SON Standards Organisation of Nigeria
SPDC Shell Petroleum Development Company
SSA Sub-Saharan Africa
SSC South - South Cooperation
SWETS SWETS Wise-Database Consolidators
SWIFT Society for Worldwide Interbank Financial Telecommunication
TCs Travellers’ Cheques
TFM Trust Fund Model
TIB Temenos Internet Banking
TSA Treasury Single Account
UAT User Acceptance Test
UNIDO United Nations Industrial Development Organisation
VAT Value Added Tax
WABA West African Bankers Association
DRAFT

Central Bank of Nigeria Annual Report—2018
xxxiv
WACB West African Central Bank
WAIFEM West African Institute for Financial and Economic Management
WAMA West African Monetary Agency
WAMI West African Monetary Institute
WAMZ West African Monetary Zone
WB The World Bank
wDAS Wholesale Dutch Auction System
DRAFT

Central Bank of Nigeria Annual Report—2018
xxxv
GOVERNOR’S PICTURE
DRAFT
Central Bank of Nigeria Annual Report—2018
xxxvi
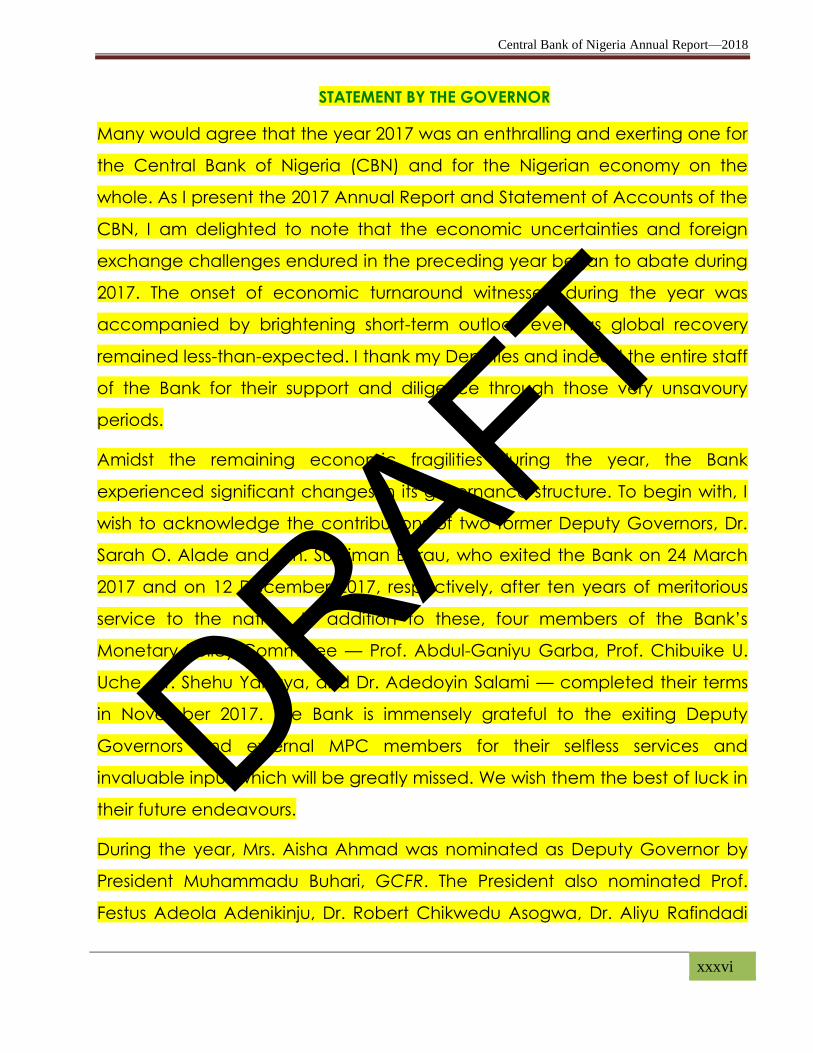
STATEMENT BY THE GOVERNOR
Many would agree that the year 2017 was an enthralling and exerting one for
the Central Bank of Nigeria (CBN) and for the Nigerian economy on the
whole. As I present the 2017 Annual Report and Statement of Accounts of the
CBN, I am delighted to note that the economic uncertainties and foreign
exchange challenges endured in the preceding year began to abate during
2017. The onset of economic turnaround witnessed during the year was
accompanied by brightening short-term outlook even as global recovery
remained less-than-expected. I thank my Deputies and indeed the entire staff
of the Bank for their support and diligence through those very unsavoury
periods.
Amidst the remaining economic fragilities during the year, the Bank
experienced significant changes in its governance structure. To begin with, I
wish to acknowledge the contributions of two former Deputy Governors, Dr.
Sarah O. Alade and Alh. Suleiman Barau, who exited the Bank on 24 March
2017 and on 12 December 2017, respectively, after ten years of meritorious
service to the nation. In addition to these, four members of the Bank’s
Monetary Policy Committee –– Prof. Abdul-Ganiyu Garba, Prof. Chibuike U.
Uche, Dr. Shehu Yahaya, and Dr. Adedoyin Salami –– completed their terms
in November 2017. The Bank is immensely grateful to the exiting Deputy
Governors and external MPC members for their selfless services and
invaluable input which will be greatly missed. We wish them the best of luck in
their future endeavours.
During the year, Mrs. Aisha Ahmad was nominated as Deputy Governor by
President Muhammadu Buhari, GCFR. The President also nominated Prof.
Festus Adeola Adenikinju, Dr. Robert Chikwedu Asogwa, Dr. Aliyu Rafindadi
DRAFT

Central Bank of Nigeria Annual Report—2018
xxxvii
Sanusi, and Dr. Asheikh A. Maidugu as external members of the MPC.
Similarly, Prof. Ummu Ahmed Jalingo, Prof. Michael Idiahi Obadan, Prof.
Justitia Odinakachukwu Nnabuko, Mr. Adeola Adetunji, and Dr. Abdu
Abubakar were nominated as non-executive members of the CBN Board. I
congratulate all the nominees and look forward to a cordial and effective
working relationship. Given the extensive background and wealth of
experiences of these nominees, I believe that their contributions to the Bank
will indeed be immeasurable.
In 2017, the global economy witnessed a gradual dissipation of the
vulnerabilities that hitherto undermined growth and outlook. The observed
recovery of global growth reflected the uptick global demand, strengthened
business and consumer confidence, the benign global financial environment,
and the significant pickups in investment, trade, and industrial production,
among others. This occasioned an increase in global crude oil demand and
led to oil price recoveries. Accordingly, the average spot price of Nigeria’s
reference crude, the Bonny Light (37API), rose 12.5 per cent from US$48.82
per barrel in 2016 to US$54.91 per barrel in 2017. Nonetheless, the risks
associated with the pervasive global geopolitical tensions, protectionist
overtones in some major economies, and the potential US-Fed instigated
capital flow reversals from many emerging market economies are veritable
threats to the global recovery.
After the external shock induced slowdown, the Nigerian economy began to
recover and exited recession during 2017. Having recorded a 1.6 per cent
contraction in 2016, the economy expanded by 0.8 per cent in 2017. This
rebound derives both from the favourable outcomes in international oil
market and from improved non-oil performance following the various efforts
at diversifying the economy. Similar improvements were displayed by
DRAFT

Central Bank of Nigeria Annual Report—2018
xxxviii
domestic prices changes as headline inflation moderated from 18.6 per cent
in December 2016 to 15.4 per cent in December 2017. In the financial
markets, foreign exchange pressures which characterised the preceding year
abated considerably during 2017 as the naira-dollar exchange rate
appreciated, converged and stabilised across the various windows and
segments of the market. External reserves also recovered remarkably during
the year under review with a 45.8 per cent annual accretion to US$39.35
billion as at end-December 2017. The burgeoning investors’ optimism and
brightening business sentiments that resulted from the effective policies and
the macroeconomic rebound also reflected in capital market gains.
Consequently, the Nigeria All-Share Index (ASI) rallied by 42.3 per cent to
38,243.2 at end-December 2017 from 26,874.6 at end-December 2016.
These welcome outcomes and the economic rebound followed a number of
countervailing monetary policy, exchange rate policy and development
finance actions of CBN. Based on the understanding that the welfare gains of
rapid disinflation outstripped the benefits of output stabilisation, the Bank’s
Monetary Policy Committee maintained a tight stance during the year in
order to rein in inflation. This was supported with the continuous use of Open
Market Operations. The Bank also adopted far-reaching strategies to stabilize
the exchange rate and eliminate pressures from speculators, bettors, round-
trippers and rent-seekers. During the year, special foreign exchange windows
for small and medium enterprises and for Investors-Exporters were established
to increase market transparency, stabilise the rates, improve investment
sentiments in Nigeria and bolster foreign exchange supply. In addition to
these, the CBN buoyed local production of goods in the real sector with
sustained development financing. Accordingly, the Bank continued its
programmes to increase access and flow of credit to the real sector,
DRAFT

Central Bank of Nigeria Annual Report—2018
xxxix
promote financial inclusion, support job creation and encourage
entrepreneurship development.
To conclude this statement, I would like to express my profound gratitude to
the Management and Staff of the Central Bank of Nigeria for their tireless
support, commitment, diligence, innovativeness and loyalty through the
outgoing year. They contributed in no small measure to the success recorded
in 2017. I also wish to gratefully acknowledge the Presidency, the leadership
of the National Assembly, Honourable Ministers of the Federal Republic,
Nigeria’s development partners, the organized private sector, as well as other
stakeholders for their sustained support and cooperation during the year.
Godwin I. Emefiele, CON
Governor,
Central Bank of Nigeria
December 2018
DRAFT

Central Bank of Nigeria Annual Report—2018
xl
Organisational Structure of the CBN as at 31st December, 2018
Board of
Directors
Governor
Deputy Governor (Corporate Services)
Deputy Governor
(Economic Policy)
Deputy Governor
(Financial System Stability)
Deputy Governor (Operations)
Finance
Corporate Communications
Legal Services
Information Technology
Statistics
Banking Supervision
Financial Policy & Regulation
Banking & Payments System
Branch Operations
Financial Markets
Development Finance
Corporate Secretariat
Internal Audit
Strategy Management
Monetary Policy
Currency Operations Research
Governors’
Department
Risk Management
Medical Services
Procurement & Support Services
Security Services
Trade & Exchange
Other Financial Institutions Supervision
Reserve Management
Human Resources
Consumer Protection
Capacity Development
FSS 2020
DRAFT

Central Bank of Nigeria Annual Report—2018
xli
CENTRAL BANK OF NIGERIA
ANNUAL ECONOMIC REPORT
FOR THE YEAR ENDED DECEMBER 31, 2018
SUMMARY
The Annual Report reviews the operations and policies of the Central Bank of
Nigeria (CBN) and the macroeconomic developments in 2018. The Bank continued
to focus on achieving monetary and price stability, by ensuring optimal banking
system liquidity that promote sustainable economic growth. A non-expansionary
monetary policy stance of the Bank was maintained throughout the year, in
response to prevailing global and domestic economic and financial conditions.
Consequently, a cocktail of policy measures were implemented to attract foreign
capital inflow, ensure relative stability in the foreign exchange market, increase
credit to the real economy, promote efficient functioning of the financial market
and stem inflationary pressures. Thus, headline inflation decelerated consistently
throughout the review period, closing at 11.44 per cent, indicating 3.99 percentage
points below the level in the preceding year, but was above the single digit
benchmark. Aggregate output grew by 1.9 per cent, compared with 0.8 per cent in
2017. Also, the premium between the average interbank and BDC rates narrowed
significantly to 18.1 per cent in 2018, compared with 29.3 per cent in 2017.
The Report is structured into two parts. Part 1 highlights the corporate activities and
operations of the Bank, while Part II reviews the performance of the economy,
against the backdrop of various policy measures taken to promote
macroeconomic stability and growth.
CORPORATE ACTIVITIES
The Board of Directors and Other Committees
The Board of Directors of the CBN was reconstituted in 2018, following the
appointment of two Deputy Governors, Lametek E. Adamu and Aishah N. Ahmad
on March 23, 2018; and four Non-Executive Directors namely: Mike I. Obadan;
DRAFT

Central Bank of Nigeria Annual Report—2018
xlii
Justitia Nnabuko; Ummu A. Jalingo; and Adeola Adetunji on June 7, 2018, by the
President. The Deputy Governor, Operations, Adebayo A. Adelabu voluntarily
resigned from the services of the Bank on July 15, 2018, while Folashodun A. Shonubi
was appointed on October 17, 2018.
The Board of Directors held two (2) regular meetings, while the Committee of
Governors held thirty-six (36) meetings. The Finance and General Purpose,
Corporate Strategy and Investment Committees held one (1) meeting each, while
the Audit and Risk Management Committee and the Pension Fund Management
Committee held two (2) meetings apiece.
The Monetary Policy Committee
The Monetary Policy Committee held five (5) regular meetings in April, May, July,
September and November 2018. At these meetings, major developments in the
global and domestic economic and financial environment were reviewed and
appropriate monetary policy decisions taken and promptly communicated to the
public.
Monetary Policy and Surveillance Activities
A non-expansionary monetary policy stance of the Bank was maintained in 2018, to
rein-in inflation. The monetary policy rate was retained at 14.0 per cent, with
asymmetric corridor of +200 and -500 basis points around the MPR, throughout 2018.
Similarly, the cash reserve and liquidity ratios were retained at 22.5 and 30.0 per
cent, respectively. Open market operations (OMO), remained the primary tool for
liquidity management, complemented by reserve requirements, discount window
operations and intervention in the foreign exchange market.
The stability in the foreign exchange market was sustained in 2018, on account of
the improved foreign exchange liquidity and other management measures
implemented by the Bank. Thus, the premium between the average interbank and
BDC rates narrowed significantly to 18.1 per cent in 2018, compared with 29.3 per
DRAFT
Central Bank of Nigeria Annual Report—2018
xliii
cent in 2017. Similarly, the premium between the BDC and I&E rates narrowed to 0.1
per cent in 2018, compared with 7.9 per cent in 2017.
The Bank, during the review period, introduced a broader measure of money supply
(M3) to account for the monetary liabilities of primary mortgage banks and
microfinance banks, as well as, the holdings of CBN bills by non-bank public. Growth
in the major monetary aggregates was moderate and generally lower than the
indicative benchmarks for 2018, reflecting the non-expansionary monetary policy
stance. Broad money supply, M2 and M3, grew by 12.1 and 16.6 per cent,
respectively, at end-December 2018, compared with their respective levels of 2.3
and 0.6 per cent at end-December 2017. Narrow money supply (M1), also
increased by 5.2 per cent at end-December 2018. Aggregate bank credit to the
domestic economy (net) grew by 6.3 per cent, in contrast to the indicative
benchmark growth of 8.5 per cent for fiscal 2018. The development reflected,
mainly, the 33.7 and 1.9 per cent, increase in net claims on the Federal Government
and claims on the private sector, respectively. The net foreign assets of the banking
system increased by 18.5 per cent, reflecting growth in foreign assets of the CBN.
Interest rates were generally lower than their levels in the preceding year, reflecting
excess liquidity in the market in 2018.
Indicators of financial sector development were mixed in 2018. Systemic relevance
of the financial sector development, measured by the ratio of M3 to GDP, was 26.2
per cent, compared with 25.3 per cent in 2016. Banking system’s capacity to
finance economic activities, measured by the ratio of aggregate credit to GDP,
was 21.6 per cent, compared with 22.8 per cent in 2017. Also, credit to the core
private sector, as a proportion of GDP fell to 17.8 per cent, from 19.6 per cent in
2017. Total money market assets outstanding fell by 1.9 per cent below the level at
end-December 2017 due, largely, to the decline in Bankers’ Acceptances and
Nigeria Treasury Bills outstanding. Activities on the Nigerian Stock Exchange were
bearish in 2018, as most market indices trended downward.
DRAFT

Central Bank of Nigeria Annual Report—2018
xliv
The structure of the Nigerian banking sector remained unchanged in the review
period as the number of licensed banks at 27, same as in the preceding year. The
licensed banks comprised, 21 commercial banks, five (5) merchant banks and one
(1) non-interest bank. In the other financial institutions (OFIs) sub-sector, there were
5,488 licensed institutions at end-December 2018, compared with 4,870 institutions in
2017, comprising, seven (7) DFIs, 35 PMBs, 885 MFBs, 69 FCs and 4,492 BDCs.
The Bank continued its supervisory and surveillance activities in 2018, with a view to
ensuring the safety and soundness of banking institutions, as well as, promoting
public confidence in the Nigerian banking system. The Nigerian Banking Industry
began the implementation of IFRS 9 in January 2018, in accordance with the final
version of IFRS 9 standard on Financial Instruments by the International Accounting
Standards Board (IASB). A joint CBN/NDIC IFRS 9 Implementation Project Team was
constituted to pilot the implementation process. In addition, the electronic line card
scheme, codenamed Credit Assessment Analysis System (CAAS) was fully deployed
in 2018, as a technological approach in the evaluation of banks’ credit and all
examinations involving risk assets appraisal. In addition, the Bank continued to
monitor the implementation of the Basel II/III standards to ensure regular update
and improvement in its regulatory and supervisory framework.
In the other financial institutions sub-sector, on-boarding of microfinance banks
(MFBs) on the National Association of Microfinance Banks Unified Information
Technology (NAMBUIT) platform continued. At end-December 2018, NAMBUIT had
been successfully deployed in 10 MFBs, comprising 1 National and 9 Unit MFBs. In
addition, the CBN granted financial assistance to MFBs to procure Data Capturing
Machines (DCM) for the BVN enrollment of their customers. At end-December 2018,
376 out of 879 MFBs had submitted their BVN enrolment to the CBN, totaling 1.5
million, representing 19.1 per cent of the 8.2 million active customers.
The CBN continued to monitor banks’ compliance with the requirements of the
Redesigned Credit Risk Management System (CRMS), which enables early
identification of predatory borrowers and ensure transparency, credibility and
DRAFT

Central Bank of Nigeria Annual Report—2018
xlv
efficient debt profiling of the banking industry. Also, a pilot run for on-boarding Non-
Interest Banks (NIBs) to the CRMS was concluded during the review year. In addition,
an interface was created for the NDIC to manage credit records in respect of loans
of banks in liquidation. The new CRMS continued to serve as a platform for the
management of credit information in the banking industry.
The CBN continued to follow-up with banks on the level of implementation of the
recommendations of the money laundering and financing of terrorism (ML/FT)
national risk assessment (NRA). Further to the circular issued to banks and OFIs, as
well as, a cautionary notice to the public drawing their attention on money
laundering and terrorism financing risks associated with virtual currency (VC), the
CBN continued to monitor developments in the virtual currency space with a view
to formulating substantive regulations to deal with the phenomenon. In addition,
the Bank conducted AML/CFT compliance examination of banks to ascertain the
level of compliance with the statutory thresholds for cash deposits of foreign and
local currencies, as well as, treatment of suspicious transactions.
The Industry average capital adequacy ratio (CAR) of banks rose to 15.3 per cent
at end-December 2018, compared with 10.2 and 8.0 per cent at end-December
2017 and the minimum capital requirement for international banks under the Basel
Accord, respectively. Similarly, the Industry Non-Performing Loans (NPL) ratio, at 11.4
per cent, showed an improvement compared with 14.8 per cent recorded at end-
December 2017. At this level, the industry NPL ratio, however, remained significantly
above the maximum regulatory threshold of 5.0 per cent. Furthermore, the industry
average liquidity ratio (LR), was 51.7 per cent at end-December 2018, compared
with 45.6 per cent at end-December 2017, and was above the regulatory minimum
of 30.0 per cent by 21.7 percentage points.
To consolidate the progress achieved in modernising the payments system, the Bank
continued with the implementation of existing initiatives and introduced new ones,
towards enhancing the credibility, reliability and efficiency of the payments system.
Furthermore, the Bank sustained its developmental activities, in response to
DRAFT

Central Bank of Nigeria Annual Report—2018
xlvi
increasing demand for economic diversification and sustainable economic
development; improve the flow of affordable credit to the real sector and stimulate
growth. Thus, sustaining the implementation of existing initiatives such as: the
Agricultural Credit Guarantee Scheme Fund (ACGSF); the Anchor Borrowers’
Programme (ABP); the Commercial Agriculture Credit Scheme (CACS); the Micro,
Small and Medium Enterprises Development Fund (MSMEDF); and the Power and
Airline Intervention Fund (PAIF), among others. It also introduced new Rice
Distributors Facility (RDF) under the Paddy Aggregation Scheme (PAS). The
interventions were expected to create new jobs, facilitate micro, small and medium
enterprise (MSME) development, and promote financial inclusion and inclusive
growth.
Operations of the CBN
The Bank sustained quality information technology (IT) delivery in the areas of
enterprise mobility management (EMM), IT support, cybersecurity, information and
asset security, as well as, integration of core applications. The second phase of the
e-Library Project, comprising the Institutional Repository and Discovery System was
deployed during the review year leading to increased awareness and usage of
library resources. Furthermore, the Bank ensure a high level of security to provide a
safe and conducive working environment. During the period, the Bank commenced
the deployment of a Security Command and Control Centre to provide centralised
linkages of all vital security systems, equipment and communications. Also, the
surveillance systems were enhanced in all branches of the Bank for improved
monitoring of effective security practices, processes and equipment utilisation.
The CBN continued to strengthen the legal and regulatory framework for its
oversight of the financial system in line with its mandate. Thus, relevant bills from the
National Assembly were reviewed including: the Chartered Institute of Finance and
Control in Nigeria Bill, 2018; Stamp Duties (Amendment) Bill, 2018; Review of the
Proposed Microfinance Bill; and Data Protection, 2017, among others. The Bank was
involved in 835 cases in 2018. A total of 144 cases were decided, of which 137 were
DRAFT

Central Bank of Nigeria Annual Report—2018
xlvii
either struck out, dismissed or discontinued by the plaintiffs, while three (3) were
referred for settlement out of court. The Bank, however, complied with the Order of
Court by paying judgment sums to creditors in the remaining four (4) cases.
In 2018, detailed audit was conducted, involving sixty (60), fifty (50) and eighty (80)
audit of departments, processes and branches, respectively. Also, 236 currency
disposal operations, requiring audit witnesses, were completed. In addition, risk
management effort focused primarily on the implementation of the approved
enterprise risk mechanism (ERM) framework and risk management policies.
Consequently, thirty-five (35) Risk Control Self Assessments (RCSA) and Independent
Risk Assessments (IRA) workshops for selected Business Units (BUs) in line with the
requirements of the Bank’s ERM Frameworks were conducted. Furthermore, as part
of its strategic initiatives and business process management, the annual budgeting
and funnelling processes were completed. These involved the rationalisation and
prioritisation of all existing and proposed strategic initiatives of the Bank.
DRAFT

Central Bank of Nigeria Annual Report—2018
xlviii
ECONOMIC REPORT
The Global Economy
Global economic growth moderated to 3.7 per cent, from 3.8 per cent in 2017, due
to trade policy uncertainty occasioned by trade tension between the US and
China, intensified BREXIT uncertainty and pockets of geopolitical tensions. Growth in
the advanced economies fell slightly to 2.3 per
cent, from 2.4 per cent in 2017. Similarly, growth in
the emerging markets and developing economies
decelerated to 4.6 per cent in 2018, from 4.7 per
cent in 2017, as a result of higher energy prices and
slow export growth in the euro area. In sub-Saharan Africa, growth remained strong
at 2.9 per cent in 2018, same as in 2017, due to higher oil prices and loose global
financial condition.
Global inflation rose in 2018, owing to recovery in oil prices. Other commodity prices,
however, generally soften in 2018, relative to 2017, on account of weak global
economic activities. This development was due to dampening effect of trade
tension between the US and China. Headline inflation, however, increased
moderately in advance economies, although still below target.
The 2018 Spring and Annual Meetings of the Bretton Woods Institutions (BWIs) were
held in Washington D. C., USA from April 16 to 22, 2018 and October 8 to 14, 2018,
respectively. The Meetings urged the IMF and WBG to strengthen their support for
domestic resources mobilisation, combat illicit financial flows and mitigate the
adverse social and distributional impact of fiscal adjustment. In addition, the G-24
Ministers noted that digitalisation and technological changes would further create
opportunities, but also challenges; and called on IMF, other IFIs and financial
standard-setters to assess the implications of technological advances on the
financial system. Also, the African Caucus Meeting of the IMF/World Bank
appreciated the commitment of IFC to increase investment by 40.0 per cent in LICs
and urged them to materialise this commitment in Africa, especially through SME
Global output moderated to 3.7 per cent in 2018, due to sluggish growth in advanced economies and the
emerging economies.
DRAFT

Central Bank of Nigeria Annual Report—2018
xlix
financing. Within the sub-Region, the 36th Meeting of the WAMZ Committee of
Governors urged the West African Securities Regulation Association (WASRA) to
approve phases I and II of the integration of the capital markets in ECOWAS.
The Domestic Economy
Fiscal Operations of Government
Nigeria’s fiscal policy in 2018, was aimed at consolidating on the achievement of
the reflationary policies of the Government in the past two years. Total federally-
collected revenue (gross) was N9,551.6 billion (7.3% of GDP) in 2018, indicating a rise
of 28.3 per cent, above the receipt in fiscal 2017. The development reflected
improvement in both oil and non-oil revenue sources. Overall, oil revenue (gross)
was N5,545.6 billion or 58.1 per cent of the total (4.3% of GDP), while non-oil revenue
(gross), at N4,006.0 billion, accounted for 41.9 per cent of total revenue (3.0% of
GDP).
The consolidated revenue and expenditure of the General Government was
N9,573.6 billion (7.5% of GDP) and N13,967.0 billion (3.4% of GDP), respectively,
resulting in an overall deficit of N4,393.3 billion (3.4% of GDP).
Federal Government retained revenue and aggregate expenditure were N4,185.6
billion and N7,813.7 billion, respectively, resulting in an overall deficit of N3,628.1
billion, or 2.8 per cent of GDP, compared with N3,609.4 billion, or 3.2 per cent of
GDP in 2017. The deficit was within the revised WAMZ primary convergence criterion
and Fiscal Responsibility Act, 2007 of 3.0 per cent of GDP. The deficit was financed
by 29.6 per cent from external sources and 70.4 per cent from domestic sources.
The consolidated Federal Government debt stock, at end-September 2018 was
N18,901.4 billion, or 15.2 per cent of GDP, compared with N18,377.0 billion or 16.2
per cent of GDP in 2017. Increase in debt stock was as a result of additional
disbursement on commercial loans (Euro and Diaspora). Domestic debt constituted
65.0 per cent, while external debt accounted for the balance.
DRAFT

Central Bank of Nigeria Annual Report—2018
l
The Real Sector
Gross domestic product (GDP), measured at 2010 constant basic prices, grew by 1.9
per cent in 2018, compared with 0.8 per cent in 2017. The non-oil sectors drive the
growth with 2.0 per cent increase, while oil sector output grew by 1.1. The services,
agricultural, industrial and construction sectors contributed 1.1, 0.5, 0.3 and 0.1 per
cent, respectively, to GDP growth, while the trade sector contributed negative
growth of 0.1 per cent. The growth in output was attributed to: higher crude oil
prices; fiscal stimulus which led to increased infrastructural spending following
sustained implementation of the Economic Recovery and Growth Plan; sustained
implementation of the Anchor Borrowers’ Programme; increased capital inflow into
the country, arising from improved investors’ confidence, enhanced access to
foreign exchange and lower inflationary pressure.
Sectoral Shares in GDP, 2013 - 2017
Source: NBS
0
5
10
15
20
25
30
35
40
2013 2014 2015 2016 2017
per
cen
t
Agriculture Industry Construction Trade ServicesDRAFT

Central Bank of Nigeria Annual Report—2018
li
Growth Rate of Major Sectors of Non-oil GDP, 2013 – 2017
(Per cent)
Source: NBS
Average spot price of Nigeria’s reference crude, the Bonny Light (370API), was
US$72.53 per barrel in 2018, compared with US$54.90 per barrel in 2017, an increase
of 32.1 per cent. Similarly, average price of the OPEC basket of 15 crude streams
rose by 32.8 per cent to US$69.61 per barrel in 2018. The increase in oil price during
the year was influenced by tension in the Korean peninsula; U.S. withdrawal from
the Iran deal; and agreement by OPEC and its Russia-led allies to cut in oil
production by 1.2 million barrels per day.
Headline inflation (year-on-year) decelerated consistently from 15.13 per cent, at
end-January 2018, to 11.44 per cent, at end-December 2018. Similarly, the 12-month
moving average headline inflation was 12.10 per cent, at end-December 2018,
compared with 16.50 per cent at end-December 2017.
-15
-10
-5
0
5
10
15
20
25
2013 2014 2015 2016 2017
Per
cen
t
Agriculture Industry Construction Trade Services
DRAFT

Central Bank of Nigeria Annual Report—2018
lii
Trends in Inflation, 2017 (Composite, Core and Food)
Source: NBS
The External Sector
The performance of the external sector moderated in 2018. The balance of
payments showed a surplus of N990.49 billion (0.8% of GDP), compared with
N3,737.37 billion (3.3% of GDP) in 2017. The positive trend reflected favourable crude
oil price and relative stability in foreign exchange market. The current account, also
maintained a surplus of 2.3 per cent of GDP, though, lower than 2.8 per cent of GDP
in 2017. This was as a result of high import bills and widened deficits in both the
services and income account. The capital and financial account recorded a net
financial liability of 3.3 per cent of GDP, as against, a net financial asset of 1.2 per
cent of GDP in 2017, attributed, largely, to higher inflow of other investment and
foreign portfolio liabilities.
0.0
5.0
10.0
15.0
20.0
25.0
Jan Feb Mar Apr May Jun Jul Aug Sept Oct Nov Dec
Rat
es (p
er c
ent)
Composite Core Food
DRAFT

Central Bank of Nigeria Annual Report—2018
liii
Balance of Payments, 2013-2017 (Per cent of GDP)
The stock of external reserves, at end-December 2018, stood at US$42.59 billion and
could finance 13.0 months of import of goods only or 7.5 months of import of goods
and services. This exceeded both the international benchmark and the West
African Monetary Zone (WAMZ) convergence criterion of 3 months import cover.
The stock of external debt at end-December 2018 was US$21.59 billion or 5.3 per
cent of GDP and remained within the threshold of 40.0 per cent of GDP. The
international investment position (IIP) recorded a higher net liability of US$71.02
billion, indicating an increase of 22.9 per cent over the US$57.80 billion in the
preceding period.
Nigeria’s Gross External Reserves Position (US$’Billion) and
Months of Import Equivalent
-5
0
5
10
15
20
25
30
2013 2014 2015 2016 2017
Pe
r ce
nt
Current Account Balance Overall Balance
Capital & Financial Account Balance Export of Goods and Servces
Import of Goods & Services
0
5
10
15
20
0
10
20
30
40
50
2013 2014 2015 2016 2017 Mo
nth
s o
f Im
po
rt c
ove
r
US
$ b
illio
n
External Reserves(LHS) Months of Import Cover(RHS)
DRAFT

Central Bank of Nigeria Annual Report—2018
liv
The foreign exchange market witnessed stability in 2018, despite increased demand
pressure experienced in the second half of the year. The continued intervention in
the foreign exchange market and various measures implemented by the Bank were
responsible for the stability. The exchange rate of the naira to the US dollar at the
inter-bank segment depreciated to N306.08/US$, compared with N305.79/US$ in
2017.
The annual average exchange rate at the BDC segment appreciated by 9.4 per
cent to N361.51/US$ in 2018, as against N395.42/US in 2017. The end period
exchange rate also appreciated to N361.00/US$ in the review year, indicating an
appreciation of 0.6 per cent, relative to N363.00/US$ in 2017. The annual average
exchange rate at the I&E window was N361.96/US, while the end-period exchange
rate stood at N364.00/US$.
Figure 7.14: End-period Exchange Rate of the Naira per US Dollar, 2013 - 2017
0.00
100.00
200.00
300.00
400.00
500.00
600.00
2013 2014 2015 2016 2017
N/U
S$
rDAS Interbank BDC
rDAS segment closed in
DRAFT

Central Bank of Nigeria Annual Report—2018
lv
Figure 7.15: Quarterly Average Exchange Rate of the Naira
vis-à-vis US Dollar, 2013 - 2017
-
50.00
100.00
150.00
200.00
250.00
300.00
350.00
400.00
-
100.00
200.00
300.00
400.00
500.00
wD
AS/
rDA
S(N
/US$
)
N/U
S$
Interbank BDC wDAS/rDAS I&E
wDAS/rDAS discontinued in february 2015
I&E window was introduced in April 2017
DRAFT

Central Bank of Nigeria Annual Report—2018
lvi
Selected Macroeconomic and Social Indicators
Selected Macroeconomic and Social Indicators Indicator 2013 2014 2015 2016 2017 /2
Domestic Output and Prices
GDP at Current Mkt Prices (₦ billion) 81,010.0 90,137.0 95,177.7 102,575.4 114,906.7
GDP at Current Mkt Prices (US$ billion) 515.0 568.5 492.5 404.6 375.8
GDP per Capita (₦) 461,884.4 498,516.4 510,557.5 533,739.6 579,982.4
GDP per Capita (US$) 2,936.1 3,144.2 2,641.9 2,105.5 1,896.7
Real GDP Growth (%) 5.5 6.2 2.8 (1.6) 0.8
Oil Sector (13.1) (1.3) (5.4) (14.4) 4.8
Non-oil Sector 8.4 7.2 3.7 (0.2) 0.5
Sectoral GDP Growth (%)
Agriculture 2.9 4.3 3.5 4.1 3.4
Industry (0.1) 6.0 (3.8) (9.4) 2.1
Construction 14.2 13.0 (0.4) (5.9) 1.0
Trade 6.6 5.9 4.7 (0.2) (1.1)
Services 9.4 7.1 3.3 (1.2) (0.7)
Oil Production (mbd) 1.9 1.9 2.1 1.6 1.9
Manufacturing Capacity Utilisation (%) 58.3 59.8 59.9
GDP Deflator Growth (%) 3/ 5.9 4.7 2.9 9.5 11.1
Inflation Rate (%) (Dec-over-Dec) 8.0 8.0 9.6 18.5 15.4
Inflation Rate (%) (12-month moving average) 8.5 8.0 9.0 15.7 16.5
Core Inflation Rate (%) (Dec-over-Dec) 4/ 7.9 6.2 8.7 18.1 12.1
Core Inflation Rate (%) (12-month moving average) 4/ 7.7 6.9 8.2 15.3 13.5
Food Inflation Rate (%) (Dec-over-Dec) 9.3 9.2 10.6 17.4 19.4
Food Inflation Rate (%) (12-month moving average) 9.7 9.5 9.9 14.9 19.5
Aggregate Demand and Savings (% of GDP) 5/
Aggregate Demand 94.2 93.3 99.3 101.6 98.8
Private Final Consumption Expenditure 72.9 71.7 78.6 81.6 81.8
Government Final Consumption Expenditure 7.2 6.5 5.9 5.4 5.0
Gross Fixed Capital Formation 14.2 15.1 14.8 14.7 12.1
Increase in Stock 0.7 0.7 0.7 0.6 0.6
Net Export of Goods and Non-factor Services 5.1 6.0 (0.0) (2.3) 0.6
Export of Goods and Non-factor Services 18.0 18.4 10.7 9.2 11.1
Import of Goods and Non-factor Services 13.0 12.5 10.7 11.5 10.4
Domestic Saving 20.0 21.8 15.5 13.1 13.2
Gross National Saving 14.0 16.8 11.5 10.5 9.5
Public Finance (% of GDP)
General Government
Revenue 11.9 9.9 7.9 6.5 7.7
Expenditure 13.6 11.3 10.2 9.4 10.3
Transfers 1.2 0.9 0.8 0.7 1.1
Current Balance 4.0 2.7 0.8 (0.2) 0.5
Primary Balance (0.7) (0.2) (1.1) (1.5) (0.9)
Overall Balance (1.7) (1.4) (2.3) (2.9) (2.7)
Federal Government
Retained Revenue 5.0 4.2 3.6 3.1 4.0
Total Expenditure 6.4 5.1 5.2 5.2 5.9
Recurrent Expenditure 4.6 3.8 4.0 4.1 4.5
Of which: Interest Payments 1.0 1.0 1.1 1.4 1.7
Foreign 0.1 0.1 0.1 0.1 0.0
Domestic 1.0 1.0 1.0 1.3 1.7
Capital Expenditure and Net Lending 1.4 0.9 0.9 0.7 1.0
Transfers 0.5 0.4 0.4 0.5 0.4
Current Balance (Deficit(-)/Surplus(+)) 0.4 0.4 (0.4) (1.0) (0.6)
Primary Balance (Deficit(-)/Surplus(+)) (0.4) 0.1 (0.5) (0.7) (0.3)
Overall Fiscal Balance (Deficit(-)/Surplus(+)) (1.4) (0.9) (1.6) (2.1) (2.0)
Financing 1.4 0.9 1.6 2.1 2.0
Foreign 0.0 0.0 0.0 0.0 0.6
Domestic 1.4 0.9 1.6 2.1 1.4
DRAFT
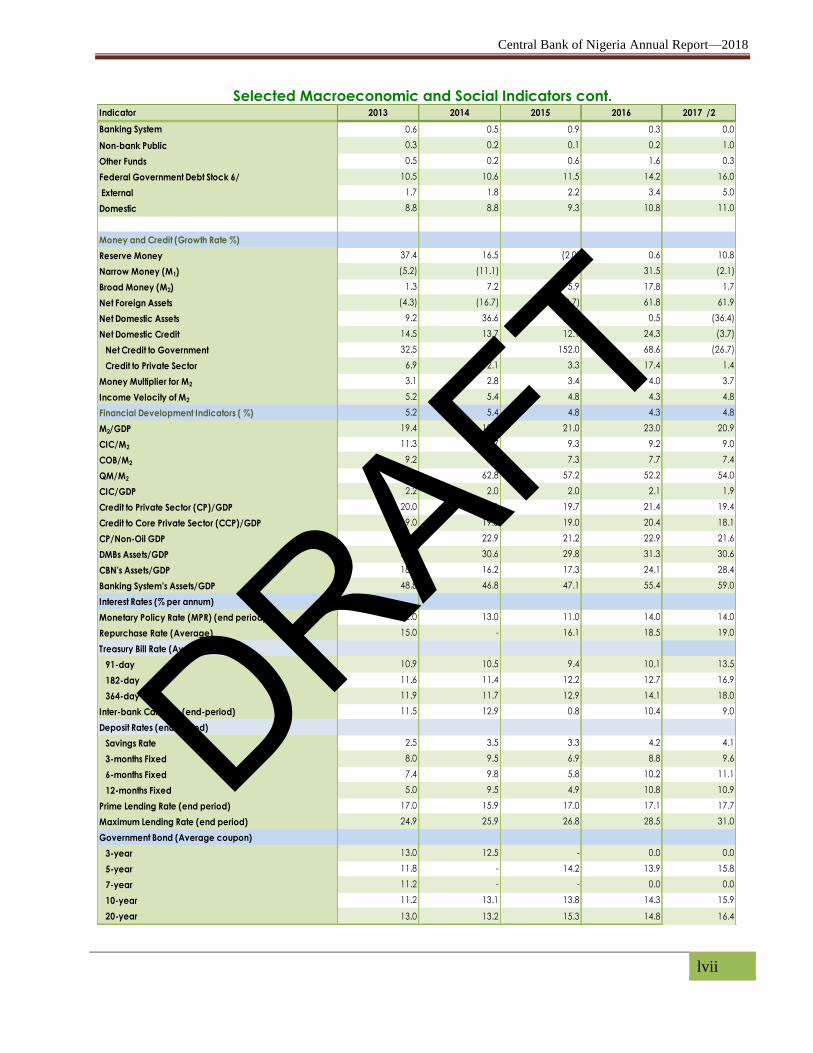
Central Bank of Nigeria Annual Report—2018
lvii
Selected Macroeconomic and Social Indicators cont. Indicator 2013 2014 2015 2016 2017 /2
Banking System 0.6 0.5 0.9 0.3 0.0
Non-bank Public 0.3 0.2 0.1 0.2 1.0
Other Funds 0.5 0.2 0.6 1.6 0.3
Federal Government Debt Stock 6/ 10.5 10.6 11.5 14.2 16.0
External 1.7 1.8 2.2 3.4 5.0
Domestic 8.8 8.8 9.3 10.8 11.0
Money and Credit (Growth Rate %)
Reserve Money 37.4 16.5 (2.0) 0.6 10.8
Narrow Money (M1) (5.2) (11.1) 24.1 31.5 (2.1)
Broad Money (M2) 1.3 7.2 5.9 17.8 1.7
Net Foreign Assets (4.3) (16.7) (18.7) 61.8 61.9
Net Domestic Assets 9.2 36.6 20.2 0.5 (36.4)
Net Domestic Credit 14.5 13.7 12.1 24.3 (3.7)
Net Credit to Government 32.5 1.9 152.0 68.6 (26.7)
Credit to Private Sector 6.9 12.1 3.3 17.4 1.4
Money Multiplier for M2 3.1 2.8 3.4 4.0 3.7
Income Velocity of M2 5.2 5.4 4.8 4.3 4.8
Financial Development Indicators ( %) 5.2 5.4 4.8 4.3 4.8
M2/GDP 19.4 18.7 21.0 23.0 20.9
CIC/M2 11.3 10.7 9.3 9.2 9.0
COB/M2 9.2 8.1 7.3 7.7 7.4
QM/M2 55.2 62.8 57.2 52.2 54.0
CIC/GDP 2.2 2.0 2.0 2.1 1.9
Credit to Private Sector (CP)/GDP 20.0 20.1 19.7 21.4 19.4
Credit to Core Private Sector (CCP)/GDP 19.0 19.3 19.0 20.4 18.1
CP/Non-Oil GDP 23.2 22.9 21.2 22.9 21.6
DMBs Assets/GDP 30.2 30.6 29.8 31.3 30.6
CBN’s Assets/GDP 18.6 16.2 17.3 24.1 28.4
Banking System’s Assets/GDP 48.8 46.8 47.1 55.4 59.0
Interest Rates (% per annum)
Monetary Policy Rate (MPR) (end period) 7/ 12.0 13.0 11.0 14.0 14.0
Repurchase Rate (Average) 15.0 - 16.1 18.5 19.0
Treasury Bill Rate (Average)
91-day 10.9 10.5 9.4 10.1 13.5
182-day 11.6 11.4 12.2 12.7 16.9
364-day 11.9 11.7 12.9 14.1 18.0
Inter-bank Call Rate (end-period) 11.5 12.9 0.8 10.4 9.0
Deposit Rates (end-period)
Savings Rate 2.5 3.5 3.3 4.2 4.1
3-months Fixed 8.0 9.5 6.9 8.8 9.6
6-months Fixed 7.4 9.8 5.8 10.2 11.1
12-months Fixed 5.0 9.5 4.9 10.8 10.9
Prime Lending Rate (end period) 17.0 15.9 17.0 17.1 17.7
Maximum Lending Rate (end period) 24.9 25.9 26.8 28.5 31.0
Government Bond (Average coupon)
3-year 13.0 12.5 - 0.0 0.0
5-year 11.8 - 14.2 13.9 15.8
7-year 11.2 - - 0.0 0.0
10-year 11.2 13.1 13.8 14.3 15.9
20-year 13.0 13.2 15.3 14.8 16.4
DRAFT

Central Bank of Nigeria Annual Report—2018
lviii
Selected Macroeconomic and Social Indicators cont. Indicator 2013 2014 2015 2016 2017 /2
External Sector
Current Account Balance (% of GDP) 3.7 0.2 (3.2) 0.7 2.8
Goods Account 8.2 3.7 (1.3) (0.1) 3.5
Services Account (net) (3.8) (4.0) (3.4) (2.0) (3.5)
Income Account (net) (5.0) (3.3) (2.6) (2.1) (3.1)
Current Transfers 4.2 3.8 4.2 4.9 5.8
Capital and Financial Account Balance (% of GDP) 1.5 2.1 (0.2) 0.7 (1.1)
Overall Balance (% of GDP) (0.2) (1.5) (1.2) (0.2) 3.3
External Reserves (US$ million) 42,847.3 34,241.5 28,284.8 26,990.6 39,353.5
Number of Months of Import Equivalent 9.3 6.7 6.5 9.2 14.4
Average Crude Oil Price (US$/barrel) 111.4 100.7 53.1 48.8 54.5
Average Official Rate (₦/US$) 157.31 158.55 193.25 253.49 305.79
End of Period Official Rate (₦/US$) 157.26 169.68 197.00 305.00 306.00
Average Bureau de Change Exchange Rate (₦/US$) 162.45 171.45 222.79 372.86 395.70
End of Period Bureau de Change Exchange Rate (₦/US$) 172.00 191.50 267.00 490.00 363.00
Capital Market
All Share Value Index (1984=100) 41,329.2 34,696.7 28,679.1 26,914.6 38,243.2
Value of Stocks Traded (Billion Naira) 2,350.9 1,334.8 961.2 578.5 1,078.2
Value of Stocks/GDP (%) 2.9 1.5 1.0 0.6 0.9
Market Capitalization (Billion Naira) 19,077.4 16,875.1 17,003.4 16,185.7 22,917.9
Of which: Banking Sector (Billion Naira) 2,940.0 2,367.0 1,447.6 1,456.9 2,501.8
Market Capitalization/GDP (%) 23.5 18.7 17.9 15.8 19.9
Of which: Banking Sector/GDP (%) 3.6 2.6 1.5 1.4 2.2
Insurance Sector/GDP (%) 0.2 0.2 0.2 0.1 0.1
Banking Sector Cap./Market Capitalization (%) 15.4 14.0 8.5 9.0 10.9
Insurance Sector Cap./Market Capitalization (%) 0.9 0.9 0.9 0.8 0.6
Social Indicators
Population (million) 175.4 180.8 186.4 192.2 198.1
Population Growth Rate (%) 3.1 3.1 3.1 3.1 3.1
Unemployment Rate (%) 10.0 6.4 10.4 14.2 18.8
Life Expectancy at Birth (Years) 52.1 52.5 53.0 53.4
Adult Literacy Rate (%)
Incidence of Poverty
1/ Revised
2/ Provisional
3/ Based on GDP measured at basic prices.
4/ Core Inflation is measured as the rate of change of all-item
Consumer Price Index (CPI) less farm produce.
5/ Computations are based on GDP at Current Market Prices.
6/ Includes State Government Debts
7/ MPR replaced MRR with effect from December 11, 2006.
Sources: Central Bank of Nigeria (CBN), Federal Ministry of Finance (FMF), National Bureau of Statistics (NBS), National Population Commission (NPOPC)
Nigeria National Petroleum Corporation (NNPC), Nigerian Stock Exchange (NSE)
M 1 = Narrow Money; M 2 = Broad Money; GDP = Gross Domestic Product; CIC = Currency in Circulation
COB = Currency Outside Bank; QM = Quasi-Money; CP = Credit to Private Sector, CCP = Credit to Core Private Sector
DRAFT

Central Bank of Nigeria Annual Report—2018
1
he coordination, monitoring and reporting of the Bank strategic projects and initiatives
continued during the review period. These activities provided the required information to
make informed decisions on initiatives that were being implemented. The CBN sustained
effort at providing a conducive environment for staff and customers, as well as, public
sector interventions in the review year. Thus, the following projects were completed: CBN
Branch renovation (1 location); Banknotes Disposal System (BDS) ventilation improvement in
CBN Branches (23 locations); Diagnostic and Treatment Centres (1 location); and
intervention in secondary schools (3 locations).
The Bank sustained quality information technology (IT) delivery in the areas of enterprise
mobility management (EMM), IT support, cybersecurity, information and asset security as well
as integration of core applications. It continued its Corporate Social Responsibility (CSR) by
encouraging knowledge acquisition, through capacity building, youth, sports and women
developments, provision of financial and other forms of assistance to institutions and
organisations for the hosting of conferences, seminars and workshops. The Bank also
provided financial support towards the implementation of 67 CSR projects, spread across the
six geo-political zones, valued at N291.5 million, compared with 271 projects valued at
N269.5 million, in 2015. The staff of the Bank sustained their support for the less-privileged,
physically-challenged groups and gender-related issues/initiatives in the society through
regular contributions to the CBN Staff Alms Fund (C-SAF).
1.1 ADMINISTRATION
1.1.1 The Board of Directors and Other Committees
The Board of Directors of the Central Bank of Nigeria (CBN) was reconstituted
in 2018, with the appointment by the President following the confirmation of
the Senate, of two Deputy Governors, Lametek E. Adamu and Aishah N.
Ahmad on March 23, 2018; and four Non-Executive Directors namely: Mike I.
Obadan; Justitia Nnabuko; Ummu A. Jalingo; and Adeola Adetunji on June 7,
2018. Adebayo A. Adelabu, Deputy Governor, Operations resigned
voluntarily from the services of the Bank on July 15, 2018 and Folashodun A.
Shonubi was appointed on October 17, 2018.
The Board of Directors held two (2) regular meetings, while the Committee of
Governors held thirty-six (36) Meetings. The Finance and General Purpose,
Corporate Strategy and Investment Committees held one (1) meeting each,
T
CHAPTER ONE
CORPORATE ACTIVITIES OF THE
CENTRAL BANK OF NIGERIA
DRAFT

Central Bank of Nigeria Annual Report—2018
2
Audit and Risk Management, as well as, Pension Fund Management
Committees held two (2) meetings each in the review period.
Table 1.1: Committee of Governors (CoG) Meetings:
Attendance in 2018
S/N Member Number of Meetings Attended
1 Godwin I. Emefiele 34 out of 36
2 Edward L. Adamu 25 out of 36
3 Okwu J. Nnanna 32 out of 36
4 Aishah N. Ahmad 24 out of 36
5 Adebayo A. Adelabu* 13 out of 36
*Voluntarily resigned on July 15, 2018
**Appointed on October 17, 2018
Source: CBN
1.1.2 The Monetary Policy Committee (MPC)
The Monetary Policy Committee held five (5) regular meetings in April, May,
July, September and November 2018. At these meetings, major
developments in the global and domestic economic and financial
environment were reviewed and appropriate monetary policy decisions
taken and promptly communicated to the public.
Table 1.2: Monetary Policy Committee (MPC) Meetings: Attendance in 2018
S/N Name Number of Meetings Attended
1. Godwin I. Emefiele 5 out of 5
2. Edward L. Adamu 5 out of 5
3. Okwu J. Nnanna 5 out of 5
4. Aishah N. Ahmad 5 out of 5
5. Adebayo A. Adelabu* 2 out of 5
6 Folashodun A. Shonubi** 1 out of 5
7. Dahiru Balami 5 out of 5
8. Robert Asogwa 5 out of 5
9. Adeola Adenikinju 5 out of 5
10. Aliyu R. Sanusi 5 out of 5
11. Mike I. Obadan *** 3 out of 5
12. Mahmoud Isa-Dutse*** 2 out of 5
* Adebayo A. Adelabu voluntarily resigned as Deputy Governor (Operations) on July
15, 2018.
** Folashodun A. Shonubi was appointed Deputy Governor on October 17, 2018.
*** Mike I. Obadan was appointed Non-Executive Board Member on July 15, 2018.
***Mahmoud Isa-Dutse was appointed Non-Executive Board Member on July 15, 2018. Source: CBN
1
DRAFT

Central Bank of Nigeria Annual Report—2018
3
Table 1.3: MPC Decisions in 2017
Date MPR (%) Decisions
April 03 – 04, 2018
Communiqué No. 117
14.00 Retained the MPR at 14.0 per cent;
Retained the CRR at 22.5 per cent;
Retained the Liquidity Ratio at 30.0
per cent; and
Retained the Asymmetric corridor at
+200 and -500 basis points around
the MPR.
May 21 – 22, 2018
Communiqué No. 118
14.00 Retained the MPR at 14.0 per cent;
Retained the CRR at 22.5 per cent;
Retained the Liquidity Ratio at 30.0
per cent; and
Retained the Asymmetric corridor at
+200 and -500 basis points around
the MPR.
July 23 - 24, 2018
Communiqué No. 119
14.00 Retained the MPR at 14.0 per cent;
Retained the CRR at 22.5 per cent;
Retained the Liquidity Ratio at 30.0
per cent; and
Retained the Asymmetric corridor at
+200 and -500 basis points around
the MPR.
September 24-26, 2018
Communiqué No. 120
14.00 Retained the MPR at 14.0 per cent;
Retained the CRR at 22.5 per cent;
Retained the Liquidity Ratio at 30.0
per cent; and
Retained the Asymmetric corridor at
+200 and -500 basis points around
the MPR.
November 21–22, 2018
Communiqué No. 121
14.00 Retained the MPR at 14.0 per cent;
Retained the CRR at 22.5 per cent;
Retained the Liquidity Ratio at 30.0
per cent; and
Retained the Asymmetric corridor at
+200 and -500 basis points around
the MPR.
*As at January 2018, the MPC had not been reconstituted
Source: CBN
1
DRAFT

Central Bank of Nigeria Annual Report—2018
4
1.1.3 Development of CBN Branches and Intervention Projects
The Bank sustained its effort at providing a conducive environment for staff
and customers, as well as, public sector interventions in the review year. Thus,
the following projects were completed: CBN Branch renovation (1 location);
banknotes disposal system (BDS) ventilation improvement in CBN Branches
(23 locations); diagnostic and treatment centre (1 location); and intervention
in secondary schools (3 locations). Also, forty-eight (48) building projects were
on-going at end-December 2018. These were: CBN new Branch/Property,
including Clinics development (12); CBN Branch renovation/remodeling (10);
BDS ventilation improvement (4); replacement of vault doors in CBN Kano (1);
secondary school interventions (1); tertiary institutions interventions (7); and
other public sector projects (13).
1.1.4 Information Technology
The Bank sustained quality information technology (IT) delivery in the areas of
enterprise mobility management (EMM), IT support, cybersecurity, information
and asset security as well as integration of core applications. In the review
year, there was improvement in customer satisfaction, as staff on the
average, were relatively satisfied across Strategic Business Units (SBUs), with
the quality of IT support as stakeholders satisfaction rating on: service
availability, speed of IT platforms and quality of support were rated 90.0 per
cent, 88.0 per cent and 78.0 per cent, respectively compared with 73.0 per
cent apiece, and 76.0 per cent in 2017.
In the review period, a maturity assessment using Gartner ITscore was 2.9 out
of 5.0. The result was above the financial industry (FI) average of 2.7. The
assessment evaluates the maturity of both the IT organisation as an enabler
of IT services and the enterprise as a consumer of IT.
As part of effort to reduce operating cost, the Bank adopted a break and fix
technique of work tool. Thus, 66.0 per cent of the budgeted amount for
maintenance was saved.
During the year under review, the CBN held its 1st Cybersecurity conference
on August 2, 2018, at the International Training Institute (ITI), Abuja. The theme
1
DRAFT

Central Bank of Nigeria Annual Report—2018
5
was “Building Cyber Resilience: the JP Morgan Experience”. The Conference
had over 350 attendees from financial institutions, MDAs and other private
sector organisations. Furthermore, to safeguard the CBN from cyber-attack
threats that could likely cause disruptions to financial services capabilities,
particularly payments systems, cybersecurity awareness training programmes
were organised for over 5,000 staff in the year under review. The effort
increased the awareness rate by 72.0 per cent. The Bank also put in place
technologies that blocked spam mails before they found their ways into its
network.
In order to further strengthen endpoint protection, the CBN deployed the
Cylance Protect Software. It is an end-point security solution which detects,
prevents and blocks threats. It works principally using Artificial Intelligence. It
can predict and prevent execution of advanced threats and malware at
end-points. Also, to ensure better security for the payments system, the Bank
implemented measures to ensure that its applications are well secured and
protected from infiltration by hackers. Thus, it achieved full compliance on
the mandatory controls as requested by Society for Worldwide Interbank
Financial Telecommunication (SWIFT) for all users worldwide. Some of the
measures undertaken among others were:
Migration of all SWIFT users to two-factor (2FA) authentication;
Enabling the monitoring of security events on swift alliance application;
Daily Validation Report on swift application;
Provision of separate work tools for swift users;
Creation of the secure zone for swift network; and
Integration of the T24 to 2FA
In an effort to control and manage the use of smartphones and tablet
devices by staff to access enterprise information, the CBN deployed
Enterprise Mobile Management (EMM) solution using IBM MaaS360. The
solution helps to manage the risk of data leakage from mobile devices
getting to unauthorised persons in case of theft, loss or misplacement. A total
1
DRAFT

Central Bank of Nigeria Annual Report—2018
6
of 6,576 devices which cut across Android, iOS and Windows platforms had
been registered.
The British Standards Institute (BSI) Surveillance Audit was conducted from
May 14 – 23, 2018 and the CBN was recertified for the 6th time. Following
some observations of non-conformities by the BSI, the Bank took measures to
address issues relating to the non-disclosure agreement.
1.1.5 Library Operations
The number of library resources consulted by staff in 2018 was 49,248
representing an increase of 68.0 per cent above 29,272 recorded in 2017. This
was attributed to increased awareness and the successful implementation of
the second phase of the e-Library, comprising the Institutional Repository and
the Discovery system. The volume of books in the Bank’s library system rose by
1.2 per cent to 114,216 in 2018 above112,872 in 2017.
The Bank provided access to the electronic books and journals covering
economics, finance, business and banking from the following platforms:
Springer; and Elsevier ScienceDirect. Other e-book sources included: the IMF
e-Library and the World Bank Open Knowledge Repository (OKR); Databases
included: EBSCOHost; Journal Storage (JStor); Access to Global Online
Research in Agriculture (AGORA); and Online Access to Research in
Environment (OARE). The data and statistical sources accessed by the Library
were: FitchConnect (former Business Monitor International (BMI)); the
International Monetary Fund (IMF) Data; World Bank Open Data; and the
Economist Intelligence Unit (EIU).
Furthermore, the Library Committee organised a Library week with the theme
“Promoting Information Access and Visibility: the Role of the CBN Library”
which was held in the Corporate Head Office, Abuja from May 30 - 31, 2018.
The aim was to acquaint staff with the information resources available in the
Library and increase staff access. Approval for the implementation of an
online platform for improving the visibility of CBN publications was granted
during the year under review.
1
DRAFT

Central Bank of Nigeria Annual Report—2018
7
1.1.6 Legal Services
The Bank continued to strengthen the legal and regulatory framework to
improve the overall effectiveness of the financial system in line with its
mandate. In the review period, relevant bills from the National Assembly were
reviewed including: the Chartered Institute of Finance and Control in Nigeria
Bill, 2018; Stamp Duties(Amendment) Bill, 2018; Review of the Proposed
Microfinance Bill; and Data Protection Bill 2017, among others.
The CBN was involved in 835 cases, out of which four (4) were foreign. One
(1) of the foreign cases was determined in favour of the Bank. Of the 831
local cases, 510 were garnishee proceedings. The other cases bordered on a
wide range of issues arising from disputes on the exercise of regulatory
powers of the Bank, breach of contract, alleged wrongful termination of
contracts, banking/financial operations, revocation of banking licence and
matters involving the Bank’s landed properties.
In the review period, 144 cases were decided, of which 137 were either struck
out, dismissed or discontinued by the plaintiffs, while three (3) were referred
for settlement out of court. Also, in the remaining four (4) cases, the Bank
complied with the Order of Court by paying judgment sums to creditors.
1.1.7 Security Services
During the review period, the Bank sustained its objective of maintaining the
highest level of corporate security, and provided a safe and conducive
working environment for effective and efficient performance of its processes.
Thus, the Bank adopted security management best practices; deployed
security tools and equipment to guarantee asset protection, personnel safety
and operational resilience to minimise the cost of security operations.
The CBN commenced the deployment of a Security Command and Control
Center to provide centralised linkages of all vital security systems, equipment
and communications. This was to ensure seamless and mass distribution of
critical instructions, notifications, and alerts, based on formalised response
plans, to reduce response time to security incidents.
1
DRAFT

Central Bank of Nigeria Annual Report—2018
8
The surveillance systems were enhanced in all branches of the Bank for
improved monitoring of effective security practices, processes and
equipment utilisation. Furthermore, it strengthened collaboration with
relevant security agencies, including the Nigeria Police, the Department of
State Security Services and the Federal Fire Service, and implemented
specific security measures to mitigate unforeseen threats against Bank’s
facilities and operations. It also carried out offsite/onsite monitoring of its
profiled service providers in line with the Service Level Agreement (SLA).
In order to enhance the capacity of security operatives, the Bank organised
a Basic Security Operations course for about 501 security personnel. In
addition, due to heightened security concerns in the country, the CBN
organised security awareness seminars to enlighten, educate and ensure
staff alertness and safety.
To further guard against fire emergencies and complement existing facilities,
the Bank complied with the National Fire Safety Code requirement on the
testing of fire and safety installations in the Abuja Head Office. Also, it
implemented a Fire Safety Policy and established the ISO 450001
Occupational Health and Safety Standards, to strengthen its safety
management processes.
Furthermore, as part of its strategy to stem the abuse of the naira, the Bank
intensified collaboration with the security agencies, and sustained the
intelligence-based and sensitisation approaches to curb counterfeiting, illicit
sale and abuse of the currency.
1.1.8 Internal Audit
During the review period, a detailed audit was conducted, involving sixty
(60), fifty (50) and eighty (80) audits of departments, processes and branches.
Two hundred and thirty-six (236) currency disposal operations, requiring audit
witnesses, were completed. At end-December 2018, currency stock taking
was conducted in all branches of the Bank. Also, a capacity development
programme was organised for auditees and auditors on the audit
management software (Teammate), Interactive Data Explorative Analysis
1
DRAFT

Central Bank of Nigeria Annual Report—2018
9
(IDEA), and Caseware monitor solution, to ensure smooth auditing process.
The deployment of these softwares provided a standardised audit approach
across business processes and transactions in the Bank.
1.1.9 Risk Management
In 2018, the Bank’s risk management effort focused primarily on the
implementation of the approved enterprise risk mechanism (ERM) framework
and risk management policies. This was to develop frameworks for the
identification, management and control of risks that could impede the
fulfillment of the Bank’s mandate; and promote strong corporate
governance, sound risk culture and relevant expertise across the Bank and
financial sector.
The Bank conducted thirty-five (35) Risk Control Self Assessments (RCSA) and
Independent Risk Assessments (IRA) workshops for selected Business Units
(BUs) in line with its ERM Frameworks. The RCSA and IRA were key risk
management tools required for the identification, evaluation and
prioritisation of risks associated with the Bank’s operations. The outcomes of
the workshops were used to initiate necessary risk mitigation measures as well
as update the Enterprise Risk Register.
In addition, Key Risk Indicators (KRIs) were established across all 37 SBUs as a
proactive measure to monitor early warning signals associated with key risks
facing the Bank. The KRIs were measured against agreed thresholds that
allowed for timely corrective actions to avert risk and mitigate the impact of
associated risk in the event that they occur.
The CBN served as the secretariat for the financial industry’s Chief Risk
Officers’ Forum that deliberated on key challenges of the sector with
suggestions on how to advance the practice of risk management in the
financial sector.
1.1.10 Strategic Initiatives and Business Process Management
The CBN continued the coordination, monitoring and reporting of its strategic
projects and initiatives during the review period. These activities provided the
1
DRAFT

Central Bank of Nigeria Annual Report—2018
10
required data and information to make informed decisions on strategic
initiatives that were being implemented.
In addition, the annual budgeting and funnelling processes were completed.
These involved the rationalisation and prioritisation of all existing and
proposed strategic initiatives of the Bank. The exercise requires engagement
with all strategic business units (SBUs) in the Bank to clarify their intentions on
initiatives in the succeeding year, and ensuring that only initiatives aligned
with the Bank’s strategic objectives and priorities were recommended to the
Board for funding. The output of this task forms an input to the annual
budgeting process of the Bank.
The CBN continued to strengthen its project governance, through the
implementation of the Enterprise Programme Management (EPM) functions
to achieve better performance monitoring of projects, reduce project
implementation cycle time, obtain timely project benefits and effectively
manage project budget utilisation. Several engagements were successfully
held with all the Business Units, on key performance expectations, with the
aim of stimulating improved operational performance culture across the
Bank. Considering the developments in technology and the need to address
regulatory gaps and increase effectiveness in the supervision of non-bank
financial institutions in the Nigeria payment space, a new department, the
Payments System Management Department, was established.
The Bank also reassessed the current practice of Enterprise Architecture (EA)
operating model domiciled in the Information Technology Department and
the need to re-model it in line with People, Process and Technology (PPT)
became apparent. Consequently, a Division was created in each of the
following Departments: Human Resources, Strategy Management and
Information Technology. This was to ensure effective and efficient practice of
EA in the Bank.
The CBN conducted skills upgrade workshop for strategy facilitators across
the SBUs to build the capacity required to perform assigned tasks. The
Workshop was aimed at motivating, supporting and inspiring actions towards
1
DRAFT

Central Bank of Nigeria Annual Report—2018
11
the implementation of the Bank’s strategy by ensuring the understanding of
its strategic priorities, stimulating and institutionalising change management
among staff, and fostering increased participation and commitment to the
Strategy.
1.1.11 Communications
The communication channels of the Bank were sustained for the
dissemination, and enlightenment of stakeholders and the general public on
policies, programmes and other activities of the Bank. The publication of
communiqués of the MPC and the decisions of the Bankers’ Committee, as
well as, policy positions of the Bank continued. This was to uphold
transparency and accountability in the conduct of the Banks’ activities in line
with global best practice.
In addition, the Bank approved the transmission of MPC Communiqué to the
Chairmen of Banking Committees (Senate and House of Representatives) of
the National Assembly within 48 hours of its release. Also, the CBN periodically
provided adequate briefing to various Committees of the two chambers of
the National Assembly on the state of the economy, and in particular, the
health of the banking system.
Furthermore, there were public enlightenments/documentaries on the Bank’s
interventions in the Inter-Bank Foreign Exchange market; Currency swap
agreement between the Central Bank of Nigeria (CBN) and the Peoples’
Bank of China (PBoC); development finance interventions, especially the
Anchor Borrowers’ Programme; and the exclusion of 42 items from the list of
items valid for access to foreign exchange on the official window.
The CBN coordinated an oversight visit to its project in Lagos from February 22
– 23, 2018 by the House of Representatives Committee on Banking and
Currency. The maiden statutory briefing of the National Assembly through the
Senate Committee on Banking, Insurance and Other Financial Institutions was
also held in Lagos from November 1 – 2, 2018.
1
DRAFT
Central Bank of Nigeria Annual Report—2018
12
Two Chatham House-style stakeholder engagements were held in Lagos and
Abuja to educate media practitioners on various policies/issues concerning
the Bank such as:
Autonomy of the CBN;
Proposed Amendment of the Currency Offences Act;
Delayed confirmation of Bank’s Board members and members of
the Monetary Policy Committee (MPC) by the Senate;
Currency swap agreement between the Central Bank of Nigeria
(CBN) and the Peoples’ Bank of China (PBoC); and
Foreign exchange market operations.
The Bank alerted Hosting Service Providers (HSPs) and domain name
Registrars of fake websites that misguided users who wanted to contact the
CBN or its branches. This helped to curb the growth of fake websites.
As part of further effort in expanding its reach to the public, the Bank
participated in two(2) International Trade Fairs, which held in Abuja and
Lagos. It won the “Best Supporter for SMEs Award” at the Abuja International
Trade Fair and was recognised for active participation at the Lagos
International Trade Fair. In addition, the Bank participated at the AgrikExpo
and AgroFood conferences 2018 held at the International Conference
Centre, Abuja from September 18 - 20, 2018.
In the review year, the Bank developed a feedback mechanism to gather
information for the selection of its “Best Managed Branch”. It also established
a registration portal for the 2018 Mid-Year Statutory Meetings of West African
Monetary Agency (WAMA), West African Monetary Institute (WAMI) and West
African Institute for Financial and Economic Management (WAIFEM). The
portal provided an invaluable logistics ease and enhanced participants’
identification, management of pick-ups and hotel reservations, among other
needs of the participants.
Furthermore, the website for the Financial System Stability (FSS) 2020 was
developed and completed in the review period. Similarly, the development
of the website for the Payments System Vision 2020 reached 90.0 per cent
1
DRAFT

Central Bank of Nigeria Annual Report—2018
13
completion. Also, the various departmental portals on the intranet were
completed.
The Bank sustained capacity building for Finance Correspondents and
Business Editors by organising the Annual Seminar in two runs. The first run was
held at Uyo, Akwa Ibom State from April 3 – 6, 2018, while the second run
took place at Lokoja, Kogi State from October 24 - 27, 2018. Also, the CBN
hosted over 90 associations/Institutions on educational excursions to its Lagos
and Abuja Offices.
1.1.12 Anti-Corruption and Ethical Issues
The Bank conducted the Annual Ethics, Compliance and Anti-Corruption
Seminar for its employees with the theme “Compliance and Ethics Disasters:
Prevention and Control”, to re-emphasise the consequences of corruption
and unethical conduct. The CBN received 1,554 scam e-mails and acted
promptly to protect potential fraud victims from scammers on spurious
contracts and requests soliciting for monies from persons in Europe, South
America, Asia and Africa. Fifty-seven (57) complaints were received from
members of the public against commercial banks, some of the mails were
referred to other business units of the Bank for investigation and others to the
EFCC for necessary action.
As part of its effort on anti-money laundering and combating financing of
terrorism (AML/CFT), the CBN AML/CFT Policy and Procedure Manual was
completed and approved by Management. Also, the Bank engaged with
both internal and external stakeholders. These included: inter-departmental
stakeholders meetings; Association of Chief Compliance Officers of Banks in
Nigeria (ACCOBIN) bi-monthly meetings; quarterly Inter Governmental
Agencies meetings with NFIU; EFCC; and other Law Enforcement Agencies,
Inter-governmental Action Group against Money Laundering in West Africa
(GIABA); Special Control Unit for Money Laundering (SCUML); Ministries of
Justice, Finance, and Interior.
In all 37 CBN Branches, customers due diligence (CDD) exercises were
conducted out to ascertain their levels of compliance with Know Your
1
DRAFT

Central Bank of Nigeria Annual Report—2018
14
Customer (KYC) documentation requirements. Also, their compliance with
the rendition of AML/CFT returns on monthly basis was confirmed.
Recommendations and measures to address identified lapses were made to
Management.
Also, a sensitisation exercise on “Fraud as a Predicate Offence” was carried
out at all the branches and five (5) departments in the Head Office. AML/CFT
questionnaires were received from 15 correspondent banks, including
Commerz Bank, Deutsche Bundes Bank, Access Bank UK, Zenith Bank UK and
FCMB UK. The questionnaires were completed and forwarded to the
respective banks. Similarly, the CBN AML/CFT questionnaires were
administered to correspondent banks to assist in determining the level of
compliance with FATF Regulations and all other relevant laws.
Branches rendered Special Report on Funds Transactions (SRFT) in
compliance with the AML/CFT Laws and Regulations. The Bank was
represented in a Special Committee set up by the Attorney-General of the
Federation and Minister of Justice on the recovery of the National Health
Insurance Scheme (NHIS) funds trapped in commercial banks.
1.1.13 The Financial System Strategy (FSS) 2020
The CBN continued to strengthen the domestic financial market by aligning it
with the international financial market, through the activities of the FSS 2020.
The actions were aimed at ensuring a sustainable economic growth through
its five (5) Sectors (mortgage, insurance, pension, commodity and MSME), as
well as three (3) Enabler initiatives (legal, communication and advocacy).
Also, the Bank collaborated with other critical stakeholders to initiate and
implement policies to promote the rapid development of the mortgage
sector that would alleviate the dearth of affordable long-term finance to
satisfy the housing needs of Nigerians. To address this challenge, quarterly
FSS2020 Mortgage Forum was held in Abuja. It recommended, among others,
that pension contributions of workers in retirement savings accounts (RSAs)
should be used as equity for securing mortgages; the establishment of credit
rating standards for mortgages; and the harmonisation of mortgage sector
Bills before the National Assembly.
1
DRAFT

Central Bank of Nigeria Annual Report—2018
15
During the period under review, the CBN organised a high-level roundtable
on the proposed Nigeria Green Smart City Project (NGSCP). This would
provide a veritable platform to attract international finance for sustainable
housing delivery in Nigeria. Four (4) states (Lagos, Rivers, Kaduna and Enugu),
and the Federal Capital Territory (FCT) were selected to pilot the NGSCP.
Also, the Bank collaborated with the African Diaspora Chamber of
Commerce (ADCC) on the use of Diaspora Fund for Infrastructure
Development.
The CBN set up a Technical Committee to assess the possibility of introducing
mortgage products, with a single digit interest rate, to address the challenge
of high interest rates for mortgage, which was between 17.5 and 22.0 per
cent. Furthermore, the Bank organised a discussion series for mortgage
experts on the theme – “Mobilisation of Finance for Affordable Housing” to
sensitise the public on the activities of the Sector.
In the review year, the CBN participated in the assignment on Commodity
Trading Ecosystem in Nigeria, coordinated by the Security and Exchange
Commission (SEC) Technical Committee. The Committee made some
recommendations and assigned responsibilities to relevant stakeholders in
four phases for effective implementation. Phase 1 was to ensure food
sufficiency and security, price discovery and market development, while the
second phase, focused on developing strong trades in export commodities.
The third phase, involved the introduction of solid minerals, energy and
derivatives and the fourth phase, was to ensure strong international presence
in the local exchanges. Also, the Bank collaborated with the Nigeria
Economic Summit Group (NESG), Alliance for Green Revolution (AGRA), and
AFEX Commodity Exchange to develop a robust framework on e-trading
price index, and how to leverage on solid minerals commodity markets in
Nigeria.
To further improve compliance, the CBN engaged key stakeholders to
promote the adoption of the pension compliance certificate as a pre-
condition to accessing the CBN SME Intervention funds. Pension sector Forum
1
DRAFT

Central Bank of Nigeria Annual Report—2018
16
brought together all stakeholders from the pension industry to deliberate and
brainstorm on emerging issues affecting the industry.
Furthermore, the CBN organised capacity building programme for
Directors/Heads of Strategy of the Implementing Institutions, aimed at
building skills for the implementation of FSS 2020 programmes. At the end of
the retreat, the following recommendations, among others were made:
facilitate the implementation of 17 new cross-cutting sectoral initiatives;
improve funding for the secretariat to enhance implementation of initiatives
by all stakeholders; review programme timeline from 2020 to a new date to
enable the Secretariat continue the coordination of the implementation of
the on-going and new cross cutting initiatives; and establish a technical
committee comprising Directors/Heads of Strategy of implementing
agencies, to review programme status and set up the Programme
Supervisory Board (PSB) as the highest decision making body of the
Secretariat, with the Governor of the CBN as the Chairman.
During the year under review, the Bank collaborated with the SMEDAN, the
BOI, and the NEXIM to facilitate the development of a framework for the
establishment of an SME Rating Agency for Nigeria (SMERAN). The SMERAN
initiative was to de-risk lending and provide credit position of intending
borrowers to all parties in the MSME space. Communication and advocacy
of activities of the FSS 2020 was done through electronic and print media,
Newsletter, web portal and social media.
1.1.14 The Shared Services Project
The CBN continued its nationwide sensitisation campaign on the Cashless
Policy, aimed at encouraging members of the public to adopt alternative
means of payment in their daily transactions. The campaign covered 30
states of the Federation, which were not yet under the policy. The Policy was
being implemented in some States, namely, Abia, Anambra, Kano, Lagos,
Ogun, and Rivers and the FCT.
Also, the Nigeria electronic Fraud Forum (NeFF) led a delegation of industry
stakeholders to the Office of the National Security Adviser (ONSA), to assess
1
DRAFT

Central Bank of Nigeria Annual Report—2018
17
the capacity of the Nigerian Cert Computer Emergency Response Team
(ngCERT) and explore the possibility of the Office partnering with the financial
industry. In addition, the NeFF partnered with the Nigeria Communications
Commission (NCC), to conduct an industry stakeholders workshop on
Cybercrime, and subsequently, on-boarded representatives of all the major
TELCOs as members of the NeFF. Similarly, discussions commenced on the
creation of an automated system (a shared infrastructure) for real-time
exchange of information between banks and the mobile network operators
(MNOs), which will curb the rising incidences of fraud, occasioned by
unauthorised Subscriber Identity Module (SIM) swaps and SIM recycle in the
country. The infrastructure was proposed to be located at the Nigeria Inter-
Bank Settlement System (NIBSS) Office.
During the review period, the NeFF Steering Committee held a retreat in
Ibadan, Oyo State, where the payments industry’s focus of engagement for
2018 was deliberated and agreed upon. The theme of the Retreat was
“Operationalising a Four-Sided Approach to Preventing Fraud”. It provided
opportunity for dissecting contemporary issues affecting the payments
system from four (4) perspectives, namely: Banking; Ecosystem; Law
Enforcement; and Telecommunication. At the end of the retreat, an Industry-
wide Stakeholders committee was constituted to review issues on ATM-
related channels fraud and come up with recommendations for
implementation in the first quarter of 2018.
To provide opportunity for a reduction of operating costs and improve the
overall efficiency of the Nigerian banking sector, the Bank, in conjunction
with the Bankers Committee, accepted the implementation of the shared IT
Infrastructure initiatives. The initiatives were: the Shared National Financial
Services Network (NFSN); the Shared Power Infrastructure; and the Tier-3
Recovery Data Centre (RDC).
Under the Shared Data Centre Project, the following vendors, namely:
MainOne, MTN and Rack Centre, were selected to provide Tier-3 Data Centre
Services for the DMBs. In addition, a Master Service Agreement (MSA) was
1
DRAFT

Central Bank of Nigeria Annual Report—2018
18
executed between the vendors and the CBN, on behalf of the industry to
guide the provision of the Data Centre Services and its usage.
To articulate and define the IT Standards blueprint for industry adoption and
improve IT leverage to enhance operating efficiency of banks, the following
milestones were achieved:
Developed IT Standards Blueprint for compliance by publishing it
on the CBN website;
Developed Governance Model and processes;
Inaugurated the IT Standards and Governance Council;
Carried out the first annual review of the IT Standards Blueprint;
Conducted IT Standards baseline Audit for IT Infrastructure Library
(ITIL) and the ISO 27001 and ISO 8583; and
Conducted IT Standards remediation exercise for gaps identified
in the baseline audit.
1.1.15 Staff
The Bank lost the services of two hundred and fifty-four (254) staff through the
following modes of exit: voluntary retirement, thirty-eight (38); compulsory
retirement, two (2); mandatory retirement, 143; withdrawal of service, four (4);
resignation, sixteen (16); and death, twenty-two (22). The appointments of
five (5) staff were terminated; seventeen (17) were dismissed; and the
services of seven (7) contract staff were determined.
Figure 1.1: Recruitment of New Employees in 2017
Source: CBN
0
50
100
150
200
Senior
Junior
261
163
Nu
mb
er
of
Ne
w E
mp
lye
es
1
DRAFT

Central Bank of Nigeria Annual Report—2018
19
Figure 1.2: Staff Strength by Category and Gender at end-December, 2017
Source: CBN
1.1.16 Medical Services
The Bank provided varied medical interventions to sustain a healthy and
productive workforce. The Bank’s staff clinics attended to a total of 133,743
cases, involving staff and their dependants. Of these cases, 19,689 were
referred to stand-by hospitals, while seventy-one (71) staff/dependants were
treated overseas for conditions that could not be handled locally. A total of
two thousand, four hundred and ninety-five (2,495) routine immunisation were
administered to staff children in the review period. Also, 782 prospective
employees were screened for diseases and substance abuse.
As part of the comprehensive health care plan for Bank staff, several health
talks/seminars were conducted on topical health issues such as: ebola virus
disease (EVD); hepatitis B infection; HIV/AIDS; diabetes mellitus; and
hypertension. Furthermore, the average participation rate at the Healthy
Lifestyle Programme (HLP) organised in the branches was 78.1 per cent, while
those in Abuja and Lagos recorded low participation rates of 17.0 per cent
and 14.0 per cent, respectively.
Of the five (5) in-house specialty clinics, physiotherapy had the highest
attendance of 3,973, followed by ophthalmology with 3,606 and
gastroenterology had the least attendance of 534. The Bank also sponsored
comprehensive medical screening of 395 executives.
0
1000
2000
3000
GovernorExecutive
SeniorJunior
3 521
4,746
2,623
Staf
f St
ren
gth
1
DRAFT

Central Bank of Nigeria Annual Report—2018
20
Figure 1.3: Staff Clinic Activities, 2018
Source: CBN
Figure 1.4: Specialist Medical Services, 2018
Source: CBN
1.1.17 Training
In line with the Bank’s manpower development strategy, 2,725 staff
participated in 227 training programmes in the review period. The training
distribution pattern of the five (5) Directorates of the Bank showed that the
Corporate Services Directorate recorded the highest with 465; followed by the
Financial System Stability with 452; while the Economic Policy Directorate
recorded the least with 251. Also, 248 new appointees/hires participated in
induction courses.
- 20,000 40,000 60,000 80,000
100,000 120,000 140,000
Pat
ien
ts T
reat
ed a
tC
linic
Pat
ien
ts R
efer
red
to
Stan
db
y C
linic
s
Pat
ien
ts R
efer
red
to
Spe
cial
ist
Clin
ics
Vac
cin
atio
ns
Re
ceiv
ed
Exec
uti
ve M
edic
alSc
ree
nin
g
133,743
19,689 11,653
2,495 395
Nu
mb
er o
f A
ctiv
itie
s
3,606 3,973
2,075
1,465
534
-
500
1,000
1,500
2,000
2,500
3,000
3,500
4,000
4,500
Op
thal
mo
logy
Ph
ysio
ther
aph
y
Car
dio
logy
E.N
.T
Gas
tro
ente
rolo
gy
No
of
Spe
cial
ist
Serv
ice
s
1
DRAFT
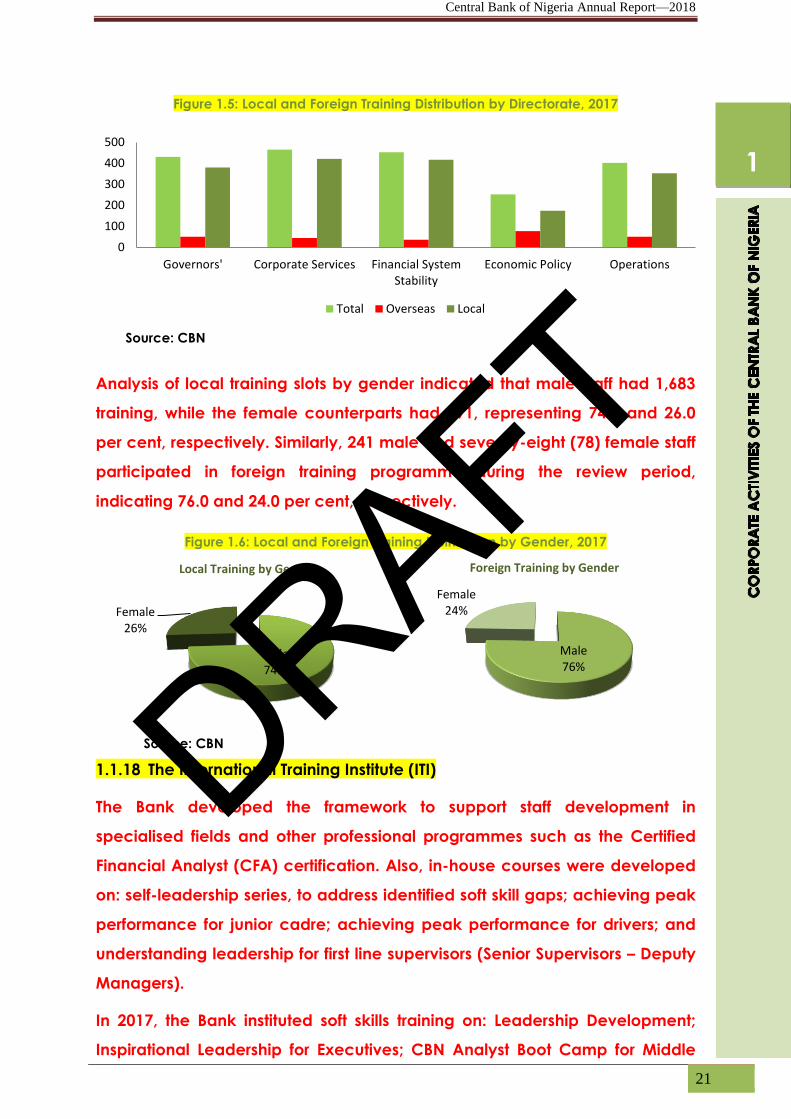
Central Bank of Nigeria Annual Report—2018
21
Figure 1.5: Local and Foreign Training Distribution by Directorate, 2017
Source: CBN
Analysis of local training slots by gender indicated that male staff had 1,683
training, while the female counterparts had 591, representing 74.0 and 26.0
per cent, respectively. Similarly, 241 male and seventy-eight (78) female staff
participated in foreign training programme during the review period,
indicating 76.0 and 24.0 per cent, respectively.
Figure 1.6: Local and Foreign Training Distribution by Gender, 2017
Source: CBN
1.1.18 The International Training Institute (ITI)
The Bank developed the framework to support staff development in
specialised fields and other professional programmes such as the Certified
Financial Analyst (CFA) certification. Also, in-house courses were developed
on: self-leadership series, to address identified soft skill gaps; achieving peak
performance for junior cadre; achieving peak performance for drivers; and
understanding leadership for first line supervisors (Senior Supervisors – Deputy
Managers).
In 2017, the Bank instituted soft skills training on: Leadership Development;
Inspirational Leadership for Executives; CBN Analyst Boot Camp for Middle
0
100
200
300
400
500
Governors' Corporate Services Financial SystemStability
Economic Policy Operations
Total Overseas Local
Male 74%
Female 26%
Local Training by Gender
Male 76%
Female 24%
Foreign Training by Gender
1
DRAFT
Central Bank of Nigeria Annual Report—2018
22
Level Managers; and Lean Management for Branch Controllers and
Executives. Others were: Meeting Management and Minute Writing for Senior
and Executive staff; Management Development; Pre-Retirement training; and
diversified SkillSoft e-Learning platform for all staff.
In the review period, the ITI delivered seventy-four (74) training programmes.
The programmes were hosted in partnership with notable institutions such as:
the Federal Reserve Bank of America (FRB), the International Monetary Fund
(IMF), the West African Institute for Financial and Economic Management
(WAIFEM), the Lagos Business School (LBS), the Association for Talent
Development (ATD), USA and Myers-Briggs Type Indicator (MBTI) institute.
Twenty-four (24) Bank staff were certified as Myers-Briggs Type Indicator
(MBTI) professionals in the review period. The ITI witnessed increased
participation from other African central banks and MDAs, namely, Ghana,
The Gambia, Lesotho, Liberia, Zimbabwe, Swaziland, Kenya, Malawi and the
African Export Import Bank (AFREXIM), Egypt, as well as, the Nigerian
Immigration Services (NIS), Nigerian Export-Import Bank (NEXIM), the Nigerian
Association of Chamber of Commerce, Industry, Mines and Agriculture
(NACCIMA), the Nigerian Maritime Administration and Safety Agency
(NIMASA), Nigeria Technical Cooperation Fund (NTCF), the Nigerian Ports
Authority (NPA), Ministry of Industry, Trade and Investment, Ministry of Foreign
Affairs and the Standards Organisation of Nigeria (SON).
Furthermore, the Institute in 2017 commenced live streaming of the capacity
development programmes with the 2017 Executive Seminar held in Lagos
and launched the CBN Open On-line Learning (COOL).
1.1.19 Staff Promotion
To boost morale and enhance performance, the Bank upgraded 198 Staff
and promoted 2,300 to different grades in the review period.
1.1.20 Recreational Activities
The Bank, in collaboration with relevant stakeholders, sponsored various
competitions in line with its corporate social responsibility. These included
lawn tennis, football and golf competitions. The 40th CBN Senior Open Tennis
1
DRAFT

Central Bank of Nigeria Annual Report—2018
23
Championship was held in Abuja from March 31 - April 7, 2018. Similarly, the
13th Edition of the CBN Junior Tennis Tournament was held in Lagos from June
21 - 30, 2018. Also, the 38th edition of the Governor’s Cup Football
Competition for all CBN branches was held at the Sani Abacha Stadium,
Kano, Kano State on July 28, 2018 and the Lagos Branch won the
competition.
Furthermore, the 32nd All Financial Institutions Football Competition was held
in Ibadan, Oyo State on October 20, 2018, the Security and Exchange
Commission (SEC) Football Club emerged the winner. The Bank also
sponsored the 12th Edition of the CBN Governor’s Golf Tournament, which
took place at the IBB International Golf and Country Club, Abuja, on
December 8, 2018. It maintained the workplace gymnasia at the Bank’s
Corporate Head Office, Abuja, and in some branches of the Bank, which
enjoyed high patronage.
1.1.21 Corporate Social Responsibility (CSR)
The Bank continued its corporate social responsibility through capacity
building and the provision of financial and other forms of assistance to
institutions and organisations. One hundred and sixty-six (166) project
requests for financial assistance were received and processed in the review
period. Of this number, sixty-seven (67) projects, spread across the six geo-
political zones of the country, were approved, resulting in the disbursement of
N291.5 million, compared with 271 projects valued at N269.5 million in 2015.
Further analysis of the projects indicated that thirty-five (35) focused on
community development; health care, twelve (12); education and research,
eleven (11); women and youth empowerment, six (6); and sports
development, three (3).
1.1.22 Special Intervention Projects under CSR
Pursuant to the objective of providing learning support infrastructure for
universities and secondary schools across the country, the Bank completed
the construction of facilities for the following institutions in the review period:
Boys Secondary School, Awkunanu, Enugu State; Anambra State University,
Uli; Rumfa College, Kano, Kano State; and Government Science College,
1
DRAFT

Central Bank of Nigeria Annual Report—2018
24
Badarawa, Kebbi State. Others included: Community Secondary School,
Dukku, Gombe State; Federal Science and Technical College, Otukpo, Benue
State; Cross River State University of Technology, Calabar; Bishop Phillips
Academy, Ibadan, Oyo State; Lisabi Grammar School, Abeokuta, Ogun
State; and Oyo State University of Technology, Ibadan.
No projects were embarked on in 2018. However, a technical Committee has
identified three (3) Charity homes and awaiting Board of Trustees (BOT)
approval for the commencement of the projects at the selected charity
homes.
1.1.23 Staff Social Responsibility
The staff of the Bank sustained their support for the less-privileged in the
society through regular contributions to the CBN Staff Alms Fund (C-SAF). A
total of N13,564,310.00 was realised from the monthly departmental
contributions at end - December, 2018. Furthermore, food and gift items
totaling N2.00 million were donated to the less privileged to commemorate
the 2018 Annual Sallah and Christmas celebrations in Lagos and Abuja. The
Branches also contributed and carried out various charity projects in their
locations.
1.1.24 Nigerian Sustainable Banking Initiatives
The Bank sponsored sustainability awards for the banking industry in three
categories: sustainable bank of the year; bank of the year in women
economic empowerment; and sustainable transaction of the year. This was
to encourage the industry operators to effectively implement the sustainable
banking principles. The Annual International Women and World Environment
Days were celebrated on March 8, 2018 and June 5, 2018, respectively.
Consequently, there were awareness sessions on plastic pollution and the
steps the Bank took to reduce its greenhouse gas emissions through recycling
of paper waste. The CBN received the first batch of the recycled waste
paper in the form of toilet papers and distributed them across all SBUs to
further enhance sustainable banking principles among staff.
1
DRAFT

Central Bank of Nigeria Annual Report—2018
25
1.2 RESEARCH AND COLLABORATIVE ACTIVITIES
The CBN conducted research and collaborative studies, and disseminated
information on key issues relating to the Nigerian economy. The regular
publications of the Bank were sustained in the review period. These included
the: 2017 Annual Report; 2018 Half-Year Economic Report; Monetary Policy
Review; bi-annual Financial Stability Report; Quarterly CBN Economic and
Financial Review; the biennial CBN Briefs; the 2017 Statistical Bulletin; and the
bi-annual CBN Journal of Applied Statistics. Others included: occasional
paper series, titled Fiscal Incentives in the Manufacturing Sector in Nigeria;
Nowcasting Nigeria’s External Balance; An Appraisal of Microfinance Banks in
Nigeria; Dynamics of the Nigerian Banking System; and Forecasting Nigeria’s
Gross Domestic Product using A Data Rich Framework in Nigeria; the
Proceedings of the FLAC and the MPIC; as well as the CBN Bullion.
The Bank also collaborated with the National Bureau of Statistics (NBS) to
conduct the 2018 Household, Finance and Consumption Survey. It honoured
requests to present papers and facilitated training programmes, including
those from the Federal Ministry of Budget and National Planning, Chartered
Institute of Bankers of Nigeria (CIBN), the West
African Institute for Financial and Economic
Management (WAIFEM), the College of
Supervisors for the West African Monetary Zone
(CSWAMZ), the Association of African Central
Banks (AACB), and the International Monetary
Fund (IMF). In addition, staff presented papers at professional conferences,
nationally and internationally, including the Nigerian Economic Society (NES),
and the Nigerian Statistical Association (NSA).
The Bank conducted research and
collaborative studies, and
disseminated information on key
issues relating to the Nigerian
economy, through its various
publications.
1
DRAFT

Central Bank of Nigeria Annual Report—2018
26
BOX 1: Enhancing the Macroeconomic Modeling Toolkits at the Central Bank of Nigeria
Towards achieving the core mandate of price and financial stability, the Central Bank of
Nigeria (CBN) continues to rely on “suite of econometric models”, to provide forward-
guidance in decision-making process for the Monetary Policy Committee (MPC). It also
provides support on critical contemporary issues for Management.
Generally, in macroeconomic modeling, there are two problems that are frequently
encountered. The first is related to differences in the frequency of variables. The second is
the problem of dimensionality, which stems from having too many explanatory variables in a
regression model, in the face of limited sample observations.
In the review period, one of the initiatives of the Bank’s modeling Team was the construction
of a Factor Augmented Mixed Data Sampling (FAMIDAS) regression framework to generate
forecasts of real GDP growth and its components (i.e oil and non-oil GDP), for Nigeria. The
FAMIDAS is a dynamic model that can extract principal component of several independent
variables with different frequencies to forecast the variable of interest, thereby eliminating
the problem of dimensionality associated with the inclusion of a large set of variables. In an
effort to forecast real GDP growth through the FAMIDAS, the leading indicators of real GDP
growth were compressed into two groups of five (5) monthly and quarterly variables each,
and these variables were incorporated into the FAMIDAS regression framework to generate
nowcasts and forecasts of real GDP growth and its components.
Furthermore, other models were developed during the review period to enhance the
robustness of the toolkits available to the Bank’s Management in order to enrich monetary
policy discussions. These included: Revisiting the Inflation Threshold for Nigeria; and Financial
Conditions Index and the CBN Factor-Augmented Vector Autoregression (FAVAR).
1.3 THE CBN BALANCE SHEET
1.3.1 Income and Appropriation
The audited financial statements of the CBN for the year ended 31st
December, 2017 indicated that total income was N2,165.10 billion, compared
with N1,675.81 billion in 2016. At N400.46 billion, net operating income
showed a 38.8 per cent decrease below the N654.87 recorded in 2016. The
decrease in net operating income was as a result of fair value loss on
financial instruments. The fair value loss thereby brought about a reduction of
the net income for 2017 to N70.17 billion, compared with N104.93 in 2016. In
line with the provisions of the Fiscal Responsibility Act 2011, 20.0 per cent of
the net income will be credited to retained earnings (reserves), while the
balance will be paid to the Federal Government.
1.3.2 Assets and Liabilities
The size of CBN’s balance sheet expanded further in 2017 as total assets/
liabilities increased by 35.0 per cent to N29.31 trillion. The increase in assets
resulted mainly from External Reserves, Loans and Receivables, holdings of
1
DRAFT

Central Bank of Nigeria Annual Report—2018
27
SDR and Quota in the IMF. The corresponding increase on the liability side
resulted mainly from increased CBN issued instruments, increased IMF and
other liabilities.
DRAFT

Central Bank of Nigeria Annual Report—2018
28
DRAFT

Central Bank of Nigeria Annual Report—2018
29
onetary policy was shaped by major developments in the global and domestic
macroeconomic environment in 2018. Developments on the global front included:
moderate global growth; unabated volatility in the global financial markets;
continued uncertainty surrounding BREXIT; and monetary policy normalisation in
advanced economies, particularly the United States. At the domestic scene, the key
developments were: sustained economic recovery; increase in external reserves;
persistent banking system liquidity; and inflationary pressure. Consequently, the non-
expansionary monetary policy stance of the Bank was maintained in 2018. The monetary
policy rate (MPR) was retained at 14.0 per cent throughout the year, alongside the
asymmetric corridor of +200 and -500 basis points around the MPR for the standing facilities.
The cash reserve ratio (CRR) and liquidity ratio (LR) were retained at the respective rates of
22.5 and 30.0 per cent, to sustain the potency of previous monetary policy measures. The
Bank also introduced a broader measure of money supply (M3)1 during the review period to
account for the monetary liabilities of primary mortgage and microfinance banks as well as
the holdings of CBN bills by the non-bank public.
Major monetary aggregates trended upwards in the review period and were higher than
their indicative targets for the year. Interest rates reflected liquidity conditions in the banking
system and were generally lower than their levels in the preceding year. Open Market
Operations (OMO) remained the main tool for liquidity management, complemented by
discount window activities, reserve requirements and interventions in the foreign exchange
market.
Furthermore, the Bank sustained its supervisory and surveillance activities to maintain the
stability and soundness of the banking system. The progress made in the payments and
settlement system was sustained, and development finance interventions of the Bank
remained active in 2018.
2.1 MONETARY OPERATIONS
2.1.1 Monetary and Credit Developments
Monetary policy was influenced by global and domestic macroeconomic
factors in 2018. Major global developments included: moderate growth in
global output; unabated volatility in the global financial markets; continued
uncertainty surrounding BREXIT negotiations; and the monetary policy
normalisation by the US Federal Reserve, which had combined negative
effects of capital flows. The key developments on the domestic front were:
sustained economic recovery; stability in the exchange rate; increase in
1 M3 comprises M2 plus stock of CBN bills held by the non-bank public; M2 =M1 + Saving and time deposits in
commercial banks, merchant banks, primary mortgage banks and microfinance banks.
M
CHAPTER TWO
MONETARY POLICY, SURVEILLANCE
ACTIVITIES, AND OPERATIONS OF THE
CBN
DRAFT

Central Bank of Nigeria Annual Report—2018
30
external reserves; persistent surplus banking system liquidity; and resurging
inflationary pressure.
Consequently, the non-expansionary monetary policy stance was
maintained in 2018, to improve internal and external macroeconomic
balances. The Bank maintained its MPR at 14.0 per cent, throughout the year,
along with the asymmetric corridor of +200 and -500 basis points around the
MPR. Also, the CRR and LR were retained at the respective rates of 22.5 and
30.0 per cent.
Broad measures of money supply, M2 and M3, grew by 12.1 per cent and 16.6
per cent, respectively, at end–December 2018, compared with their
respective levels of 2.3 and 0.6 per cent at end-December 2017. The growth
in M2 was on account of the 18.5, 6.3 and 1.3 per cent increase in net foreign
assets, aggregate credit (net) and other assets (net) of the banking system,
respectively, while growth in M3 reflected the 38.9 per cent growth in non-
bank holdings of CBN bills. Narrow money supply (M1) and quasi-money grew
by 5.2 and 18.1 per cent, respectively at end-December 2018. The growth in
M1 reflected the respective increase of 4.8 and 7.3 per cent in its demand
deposits and currency components, while quasi money grew on account of
the 28.1 per cent growth in foreign currency deposits with the banks. At end-
December 2017, growth in quasi money was 5.2 per cent, while narrow
money supply declined by 0.9 per cent.
Growth in aggregate credit to the domestic economy (net) was 6.3 per cent
at end-December 2018, in contrast to the decline of 3.5 per cent at end-
December 2017. The development was due to the 33.7 and 1.9 per cent
increase in net claims on the Federal Government and claims on the private
sector, respectively. The growth of NDC at end-December 2018, however, fell
short of the indicative benchmark of 14.6 per cent for 2018.
Reserve money grew by 10.1 per cent, year-on-year, but was lower than the
benchmark rate of 14.6 per cent for 2018. The upward movement in reserve
money owed to the respective growth of 20.1 per cent and 40.8 per cent in
net foreign and net domestic assets of the CBN, while the corresponding
2
DRAFT

Central Bank of Nigeria Annual Report—2018
31
change in monetary liabilities reflected growth in currency-in-circulation and
bank reserves of 8.0 per cent and 11.1 per cent, respectively.
Targ
et
Ou
tco
me
Targ
et
Ou
tco
me
Targ
et
Ou
tco
me
Targ
et
Ou
tco
me
Targ
et
Ou
tco
me
Growth in base money 21.28 16.52 16.78 -1.99 13.21 0.61 11.41 10.70 14.64 10.05
Growth in broad money (M2) 15.02 20.55 15.25 5.90 10.98 17.78 10.29 1.74 11.92 12.17
Growth in narrow money (M3) 11.84 2.22 31.32 0.59 16.58
Growth in narrow Money (M1) 16.23 -1.82 9.91 24.14 11.34 31.50 11.07 -2.09 5.15
Growth in aggregate bank
credit28.49 32.60 29.30 12.13 17.94 24.27 17.93 -3.70 11.64 6.42
Growth in bank credit to the
private sector23.07 11.95 26.06 3.28 13.38 17.42 14.88 1.40 8.49 1.96
Inflation 8.00 9.55 11.90 18.55 10.71 15.37 12.71 11.37
2016 2017 2018
Table 2.1 : Key Policy Targets and Outcomes, 2014- 2018 (per cent)
2014 2015
Source: CBN
1/ Revised
2/Provisional
2.1.2 Liquidity Management
The lingering excess liquidity in the banking system was accentuated by
increased fiscal disbursements in 2018, on account of increased foreign
exchange receipts, following a recovery in crude oil production and
prices. In addition, the liquidity situation was exacerbated by injections from
maturing CBN bills and the redemption of FGN Bonds and Nigerian Treasury
Bills (NTBs) during the review period. Accordingly, monetary policy focused on
liquidity management to achieve the Bank’s mandate of monetary and
price stability conducive to economic growth.
The Bank also retained its monetary tightening stance, together with
adoption of a confluence of policy measures to attract foreign capital and
build external reserves, thereby moderating exchange rate and inflationary
pressures during the review period.
2
DRAFT

Central Bank of Nigeria Annual Report—2018
32
Consequently, an appropriate cocktail of policy measures was implemented
to support the financial market and ensure adequate funding of the real
sector of the economy. The measures included: retaining MPR at 14.0 per
cent with an asymmetric corridor of +200/-500 basis points for the standing
lending facility (SLF) and standing deposit facility (SDF), respectively. In
addition, the Cash Reserve Ratio (CRR) and Liquidity Ratio (LR) were also
retained at 22.5 and 30.0 per cent, respectively. Furthermore, the Bank
sustained intervention in the foreign exchange market, and retained the
‘Investors’ and ‘Exporters’ (I&E) window to boost foreign exchange supply
from autonomous sources and stabilise the domestic currency. Thus, the
naira/US dollar exchange rate generally stabilised, with marginal
appreciation in all segments of the market during the year.
The Bank’s key liquidity management instrument remained Open Market
Operations (OMO), complemented by reserve requirements, repurchase
agreements, standing facilities and discount window operations. The use of
these money market instruments was complemented by the Bank’s regular
interventions in the foreign exchange market. In the review period, the Bank’s
monetary policy measures generally helped to manage liquidity surfeit in the
banking system, and moderated domestic prices. Consequently, headline
inflation declined during the year.
The performance of monetary aggregates relative to their benchmarks were
mixed for the year. The monetary aggregate (M2), however, out-performed
its target, reflecting an increase in the net foreign assets and net domestic
assets of the banking system during the review period. Growth in broad
money supply (M2) at 12.1 per cent was above the growth benchmark of
11.9 per cent. In addition, aggregate bank credit and credit to the private
sector, which grew by 6.3 per cent and 1.9 per cent, however, performed
significantly lower than their respective benchmarks of 14.6 and 8.2 per cent.
The net foreign assets of the banking system grew by 18.5 per cent,
compared with 69.6 per cent recorded at end-December 2017. The reserve
money (RM) increased by 10.1 per cent to N7,135.73 billion in 2018, from
2
DRAFT
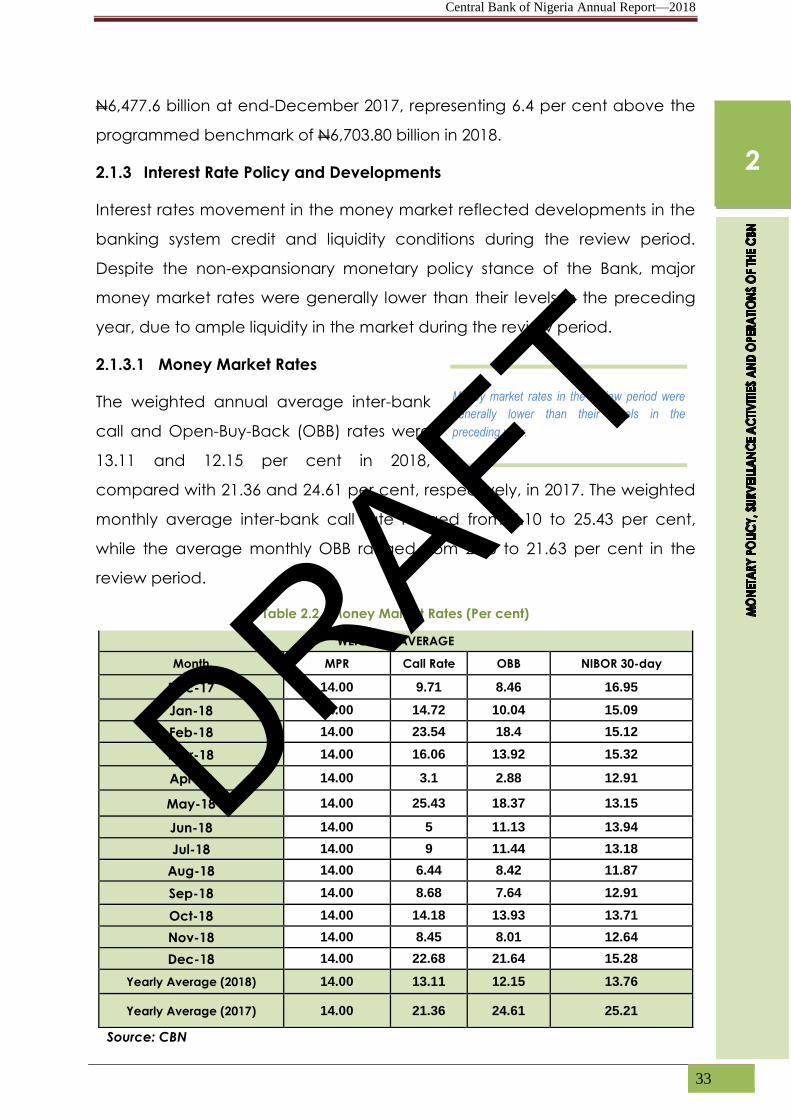
Central Bank of Nigeria Annual Report—2018
33
N6,477.6 billion at end-December 2017, representing 6.4 per cent above the
programmed benchmark of N6,703.80 billion in 2018.
2.1.3 Interest Rate Policy and Developments
Interest rates movement in the money market reflected developments in the
banking system credit and liquidity conditions during the review period.
Despite the non-expansionary monetary policy stance of the Bank, major
money market rates were generally lower than their levels in the preceding
year, due to ample liquidity in the market during the review period.
2.1.3.1 Money Market Rates
The weighted annual average inter-bank
call and Open-Buy-Back (OBB) rates were
13.11 and 12.15 per cent in 2018,
compared with 21.36 and 24.61 per cent, respectively, in 2017. The weighted
monthly average inter-bank call rate ranged from 3.10 to 25.43 per cent,
while the average monthly OBB ranged from 2.88 to 21.63 per cent in the
review period.
Table 2.2 : Money Market Rates (Per cent)
Source: CBN
WEIGHTED AVERAGE
Month MPR Call Rate OBB NIBOR 30-day
Dec-17 14.00 9.71 8.46 16.95
Jan-18 14.00 14.72 10.04 15.09
Feb-18 14.00 23.54 18.4 15.12
Mar-18 14.00 16.06 13.92 15.32
Apr-18 14.00 3.1 2.88 12.91
May-18 14.00 25.43 18.37 13.15
Jun-18 14.00 5 11.13 13.94
Jul-18 14.00 9 11.44 13.18
Aug-18 14.00 6.44 8.42 11.87
Sep-18 14.00 8.68 7.64 12.91
Oct-18 14.00 14.18 13.93 13.71
Nov-18 14.00 8.45 8.01 12.64
Dec-18 14.00 22.68 21.64 15.28
Yearly Average (2018) 14.00 13.11 12.15 13.76
Yearly Average (2017) 14.00 21.36 24.61 25.21
Money market rates in the review period were
generally lower than their levels in the
preceding year.
2
DRAFT

Central Bank of Nigeria Annual Report—2018
34
Figure 2.1: Money Market Rates (per cent), 2018
Source: CBN
2.1.3.2 Deposit Rates
Average term deposit rate for the year rose by 27 basis points to 8.65 per
cent in 2018, compared with 8.38 per cent in 2017, reflecting the Bank’s effort
to attract domestic savings.
2.1.3.3 Lending Rates
The weighted average prime lending rate fell by 55 basis points to 17.0 per
cent, while maximum lending rate rose by 50 basis points to 31.15 per cent in
2018, compared with 17.52 and 30.65 per cent, respectively in 2017.
Figure 2.2: Average Savings, Prime and Maximum Lending Rates, 2014 - 2018
Source: CBN
Consequently, the spread between the average term deposit and maximum
lending rates widened marginally to 22.49 percentage points, in the review
year, from 22.26 percentage points in 2017.
0
10
20
30
Dec. 17 Mar '18 Jun '18 Sep '18 Dec '18
Pe
r ce
nt
MPR Call Rate OBB
0
10
20
30
40
2014 2015 2016 2017 2018
SDR AvTrm Dep PrLR MaxLR
2
DRAFT

Central Bank of Nigeria Annual Report—2018
35
Figure 2.3: Spread Between the Average Term Deposit and Maximum Lending Rates, 2014-
2018
Source: CBN
With the headline year-on-year inflation at 11.44 per cent at end-December
2018, all the deposit rates were negative in real terms, while the prime and
maximum lending rates were positive.
Figure 2.4: Real Interest Rates, 2013 - 2018
Source: CBN
2.1.4 Developments in the Payments System
To consolidate the progress achieved in modernising the payments system,
the Bank continued with the implementation of existing initiatives and
introduced new ones. The major activities in the review period were as
follows:
2.1.4.1 The Bank Verification Number (BVN) Scheme
Implementation of the Framework for BVN operations and Watch-list
continued during the review period. At end-December 2018, a total of
0.00
5.00
10.00
15.00
20.00
25.00
0.00
5.00
10.00
15.00
20.00
25.00
30.00
35.00
2014 2015 2016 2017 2018
AvTrm Dep PrLR MaxLR Sprd(MXL-Avtrm Dep) rhs
-20.00
-10.00
0.00
10.00
20.00
30.00
2013 2014 2015 2016 2017 2018
Rat
es
Maximum Lending Rate Savings Rate Prime Lending Rate
2
DRAFT

Central Bank of Nigeria Annual Report—2018
36
36,170,176 customers had been registered under the Scheme, with 49,318,972
accounts out of 71,214,706 active customer accounts linked with BVN.
2.1.4.2 Nigeria electronic Fraud Forum (NeFF)
The Forum remained focused on achieving its mandate of:
Educating and informing all Banks and other stakeholders on various
electronic fraud issues and trends (both locally and globally);
Proactively sharing fraud data/information amongst banks and service
providers, to enable prompt responses to prevent fraud-related cases;
and
Developing cohesive and effective fraud and risk management
strategies, and defining key requirements relating to e-payment
security on behalf of the industry.
In view of the above, many stakeholder engagements were held to tackle
ineffective e-product design and account management in the industry. The
engagements further helped in shaping the fight against e-fraud in Nigeria
leading to consistent reduction in fraud losses in the country.
2.1.4.3 Authorised Signature Verification Portal
The uploading and updating of signatories, verification of mandates and
signatories management in the industry continued during the review period.
The Bank conducted training for stakeholders on the use of the Portal.
2.1.4.4 Accreditation of Cheque Printers
The Bank, in collaboration with the MICR Technical Implementation
Committee (MTIC), conducted biennial accreditation of Cheque Printers in
Nigeria for 2018. The five (5) existing accredited security printing companies,
namely: Nigeria Security Printing and Minting Company Plc, Tripple Gee and
Company Plc, Superflux International Limited, Papi Printing Company Limited
and Euphoria Group Limited, maintained their accreditation. Two (2) new
security printing companies, KAS Arts Service Limited and Yalliam Press
Limited, were accredited during the year, bringing the total number of
accredited cheque printers in Nigeria to seven (7).
2
DRAFT

Central Bank of Nigeria Annual Report—2018
37
2.1.4.5 Nigerian Cheque Standards (NCS) and Nigerian Cheque Printers
Accreditation Scheme (NICPAS)
The Bank approved the revised Nigeria Cheque Standards and Nigeria
Cheque Printers Accreditation Scheme, to improve the safety and efficiency
of the clearing system. Notable changes in the revised Standards include
introduction of QR code for faster verification of cheque details, expiry date
of printed cheque booklet and clear zone at the back of the cheque. The
new and old cheque standards would run concurrently till August 1, 2020.
Subsequently, only cheques that conform with the new standards would be
allowed in the clearing system.
2.1.4.6 Cheque Standard Administration
In furtherance of the Bank’s efforts to promote the Cheque Standard
Administration, 1,665 sample cheques were processed compared with
290 in 2017. The significant increase was due to special analysis of
sample cheques printed under the newly approved 2nd edition of the
Nigeria Cheque Standard (NCS) and Nigeria Cheque Printers
Accreditation Scheme (NICPAS).
The sample cheques were made up of 1,585 cheques, received from
accredited cheque printers for image testing and analysis, while 80
were personalised cheques, from DMBs for MICR quality tests and
analysis. The quality assurance test was to ascertain compliance level
of the accredited cheque printers and the personalisers with the
Nigeria Cheque Standard (NCS).
2.1.4.7 Upgraded of Nigerian Automated Clearing System (NACS)
In 2018, the Nigeria Automated Clearing System (NACS), which was
upgraded to iTeller CH in 2017, operated seamlessly. Similarly, the Bank, in
collaboration with NIBSS conducted a workshop on cheque truncation to
acquaint users with changes in the upgraded system.
2
DRAFT

Central Bank of Nigeria Annual Report—2018
38
2.1.4.8 Electronic Payments Incentive Scheme (EPIS)
The Electronic Payments Incentive Scheme (EPIS) continued in the year under
review. Approval for the redesign of the Point-Based Loyalty Scheme was
granted. Many banks paid out cashback rewards to customers who used
their cards to perform electronic transactions.
2.1.4.9 Temenos Connect Internet Banking (TCIB)
To improve the operations of the Treasury Single Account (TSA), the Bank
deployed the Temenos Connect Internet Banking (TCIB) on the T24 core
banking application for the use of external customers. It is a product aimed
at efficient service delivery for the Banks’ customers, particularly the Federal
Government and its various agencies. It also enables local currency funds
transfer, viewing and printing of account statement, account balances and
bulk upload, among others.
The TCIB would serve not only as an alternative, but an eventual application
for Government transactions. The Platform was introduced to the Office of
the Accountant General of the Federation (OAGF), with a view to providing
a gateway for electronic payment of the Federation Account Allocation
Committee (FAAC) disbursements, initially operated through physical/manual
mandates. It has also been deployed for Kaduna State Government and the
Nigeria Incentive-based Risk Sharing System for Agricultural Lending (NIRSAL).
The Armed Forces and the Independent National Electoral Commission
(INEC) were in the process of adopting the application.
2.1.4.10 Licensing and Approval of other Payments Schemes/Products
Two (2) new operating licences were issued to payment solution service
providers (PSSPs), while one (1) was renewed. A new licence was granted to
payment terminal service provider (PTSP). Similarly, two (2) new licences were
granted to mobile money operators and two (2) others, renewed.
The status of all categories of licences issued to players in the payment
ecosystem at end-December 2018 was as follows:
2
DRAFT
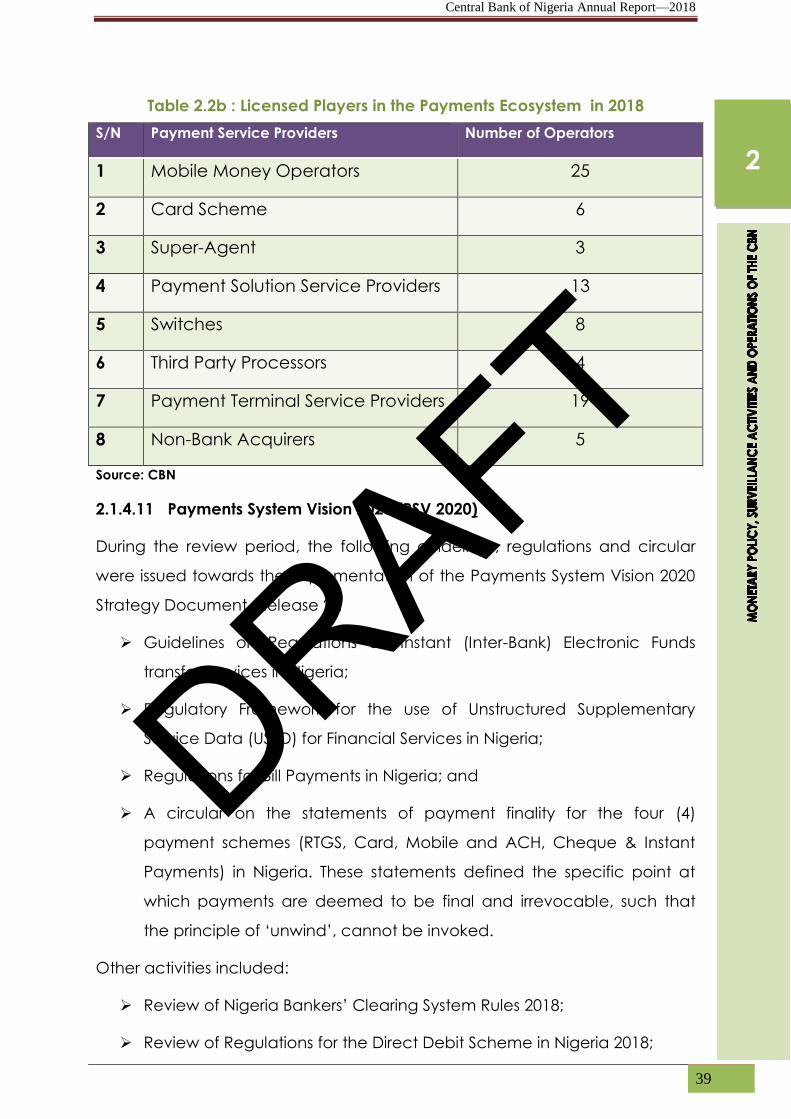
Central Bank of Nigeria Annual Report—2018
39
Table 2.2b : Licensed Players in the Payments Ecosystem in 2018
S/N Payment Service Providers Number of Operators
1 Mobile Money Operators 25
2 Card Scheme 6
3 Super-Agent 3
4 Payment Solution Service Providers 13
5 Switches 8
6 Third Party Processors 4
7 Payment Terminal Service Providers 19
8 Non-Bank Acquirers 5
Source: CBN
2.1.4.11 Payments System Vision 2020 (PSV 2020)
During the review period, the following guidelines, regulations and circular
were issued towards the implementation of the Payments System Vision 2020
Strategy Document (Release 2):
Guidelines on Regulations on Instant (Inter-Bank) Electronic Funds
transfer Services in Nigeria;
Regulatory Framework for the use of Unstructured Supplementary
Service Data (USSD) for Financial Services in Nigeria;
Regulations for Bill Payments in Nigeria; and
A circular on the statements of payment finality for the four (4)
payment schemes (RTGS, Card, Mobile and ACH, Cheque & Instant
Payments) in Nigeria. These statements defined the specific point at
which payments are deemed to be final and irrevocable, such that
the principle of ‘unwind’, cannot be invoked.
Other activities included:
Review of Nigeria Bankers’ Clearing System Rules 2018;
Review of Regulations for the Direct Debit Scheme in Nigeria 2018;
2
DRAFT

Central Bank of Nigeria Annual Report—2018
40
Engagement with the Bank for International Settlements (BIS), for a
more active role for Nigeria in its activities; and
Further review of the Regulations on Banking Operations in the Free
Zones in Nigeria, to address the concerns raised by banks operating in
the zones.
2.1.4.12 e-Payment Transactions
The volume and value of electronic payments in 2018 rose by 38.4 and 34.0
per cent to 2,046.4 million and N133,042.2 billion, respectively, compared with
1,478.5 million and N99,292.3 billion in 2017. The rise was attributed to
increased consumer awareness and confidence in the e-payment channels.
Table 2.3 : Breakdown of e-Payment Transactions in 2018
Channels Volume Value (N) Proportion in
Volume
(Per cent)
Proportion in
Value
(Per cent)
NEFT 26,760,852 11,030,961,545,925.40 1.31 8.29 ATM 875,519,307 6,480,085,899,670.37 42.78 4.87 POS 295,890,167 2,383,108,901,148.12 14.46 1.79 INTERNET(WEB) 50,815,901 404,600,990,712.52 2.48 0.30 MMO 59,858,632 1,236,053,815,632.65 2.93 0.93 NIP 663,124,139 80,423,025,698,377.30 32.41 60.45 m-CASH 229,328 1,198,731,322.12 0.01 0.00 EBILLSPAY 1,053,342 500,214,507,607.64 0.05 0.38 REMITA 44,461,846 18,495,987,427,570.80 2.17 13.90 NAPS 27,384,756 12,078,905,639,559.80 1.34 9.08 CENTRAL PAY 1,260,380 8,101,555,613.41 0.06 0.01
TOTAL 2,046,358,650 133,042,244,713,140.00 100.00 100.00
Source: CBN
2
DRAFT

Central Bank of Nigeria Annual Report—2018
41
2.2 CURRENCY OPERATIONS
2.2.1 The Issuance of Legal Tender Currency
The Bank approved an indent of 3,351.34 million pieces of banknotes of
various denominations. This was 25.3 per cent higher than the level in the
preceding year. The Nigerian Security Printing and Minting (NSPM) PLC was
awarded the contract for the production of the entire indent. The NSPM Plc
delivered 2,653.31 million pieces or 79.2 per cent of the total, with an
outstanding balance of 698.03 million at end-December 2018. In addition, the
Company, under a domestication arrangement, delivered 22.89 million
pieces of the N100 commemorative centenary banknote awarded to Crane
Currency Sweden in 2014. At end-December 2018, a cumulative sum of
992.50 million pieces or 99.3 per cent had been delivered.
The CBN continued its currency processing and sorting activities in 2018.
Consequently, the Bank’s clean notes policy was sustained through: the
production of new banknotes; processing of banknotes into clean (fit) and
(unfit) dirty notes; the withdrawal of unfit/soiled banknotes; and the re-
issuance of clean (fit) notes into circulation, as well as, the reduction in cycle
time of processing unsorted currency banknotes deposits by banks from six
(6) to three (3) months.
The Bank adopted the tiered pricing mechanism aimed at encouraging
banks to deposit lower denomination banknotes with the CBN and forestall
the re-circulation of unfit banknotes. Accordingly, a three-month window was
introduced during which the surcharge was reduced from N12,000 to N1,000
per box for deposit of unsorted lower denomination currency banknotes (N5,
N10, N20, and N50) and at the expiration, N2,000 per box. However, the
surcharge for the deposit of the higher denominations currency banknotes
(N100, N200, N500 and N1000) was retained at N12,000 per box.
Furthermore, in pursuit of the clean notes policy, the public was enlightened
on how to identify the basic security features to deter counterfeiting, proper
handling habits to forestall abuse/aid banknotes longevity, dangers and
consequences of sale of the naira, hoarding and counterfeiting of the
2
DRAFT

Central Bank of Nigeria Annual Report—2018
42
banknotes and the attendant consequences. Section 21(4) of the CBN Act
2007 provides that the sale/abuse of naira in any form shall attract payment
of N50, 000 or six months imprisonment or both, while Section 20 states that
counterfeiting shall attract a minimum of 5 years imprisonment without any
option of fine. To curb the incidences of counterfeiting, illegal sale and other
forms of abuse of the legal tender currency, the Bank sustained publicity
campaigns, collaborated with security agencies and arrested 53 suspected
offenders with the sum of N21,754,565.00 confiscated as exhibits. In an effort
to ease retail transactions amongst economic agents, the Bank, under a
special intervention scheme, collaborated with banks and exchanged lower
denominations for various market associations, merchants, supermarkets,
through their respective banks. To forestall abuse, sale and ensure the
banknotes exchanged were utilised in line with the objectives of the scheme,
the CBN used the banknote processing systems (BPS) C1, that has functional
capacity to record banknotes serial numbers and also link them specifically
to currency boxes, before issuance to banks for onward exchange to the
identified beneficiaries.
2.2.2 Currency-in-Circulation (CIC)
Currency-in-Circulation (CIC) grew by 0.8 per cent to N2,329.7 billion at end-
December 2018. The growth in CIC reflected the increased use of cash in the
economy. A breakdown of the CIC indicated that, in terms of volume and
value, the proportion of higher denomination banknotes (N100, N200, N500
and N1000), in total, rose to 44.3 and 97.6 per cent, from 41.9 and 96.9 per
cent in 2017, respectively. The lower denomination currency notes continued
to be preponderant in terms of volume, constituting 55.7 per cent of the total.
In value terms, it constituted 2.4 per cent of the total banknotes.
2
DRAFT

Central Bank of Nigeria Annual Report—2018
43
Figure 2.5a: Currency-in-Circulation, 2014 - 2018
Source: CBN
Table 2.4: Currency Structure, 2014 – 2018 2014 2015 2016
Volume Value Volume Value Volume Value Volume Value Volume Value
(million) (N billion) (million) (N billion) (million) (N billion) (million) (N billion) (million) (N billion)
N2 107.54 0.22 107.57 0.22 107.71 0.22 107.57 0.22 204.38 0.41
N 1 616.46 0.62 616.49 0.62 616.67 0.62 616.49 0.62 736.08 0.74
50k 579.95 0.29 580.07 0.29 580.24 0.29 580.07 0.29 681.48 0.34
25k 348.23 0.087 348.23 0.087 348.23 0.09 348.23 0.09 348.25 0.09
10k 315.55 0.032 315.57 0.032 315.57 0.03 315.57 0.03 315.58 0.03
1k 31.24 0.003 31.24 0.003 31.24 0.01 31.24 0.0003 31.372 0.0003
Sub Total 1,998.97 1.25 1,999.17 1.25 1,999.66 1.26 1,999.17 1.25 2,317.14 1.61
Notes
N1000 1,068.93 1,068.93 1,011.64 1,011.64 1,224.08 1,224.08 1,228.84 1,228.84 1,297.52 1,297.52
N500 1051.75 525.88 1,322.26 661.13 1,453.93 726.96 1,316.57 658.28 1,597.99 798.99
N200 569.16 113.83 401.63 80.33 559.11 111.82 664.46 132.89 562.9 112.58
N100 426.34 42.63 558.95 55.89 629.04 62.9 705.59 70.56 641.25 64.12
N50 327.68 16.38 388.18 19.41 365.27 18.26 608.25 30.41 449.42 22.47
N20 956.74 19.13 1,065.56 21.31 1,189.44 23.79 1,058.81 21.18 1,097.84 21.96
N10 746.02 7.46 549.54 5.49 749.51 7.49 1006.82 10.07 797.68 7.98
N5 496.74 2.48 299.64 1.49 521.58 2.61 752.15 3.76 494.89 2.47
Sub-Total 5,722.52 1,796.72 5,597.40 1,856.69 6,691.96 2,177.91 7,341.49 2,155.99 6,939.49 2,328.09
Total 7,705.89 1,797.97 7,596.57 1,857.94 8,691.62 2,179.17 9,340.66 2,157.24 9,256.63 2,329.70
20182017
Coins
Source: CBN
2.2.3 Clean Notes Policy and Banknote Fitness Guidelines
The Bank approved the issuance of the clean notes policy and banknote
fitness guidelines to be used by major cash handlers such as banks,
microfinance banks, service providers, and the public, among others. The
clean notes policy encapsulates diverse currency management activities
with defined processes and procedures for implementation by all the
stakeholders across the currency management value-chain with a view to
0.00
500.00
1,000.00
1,500.00
2,000.00
2,500.00
2014 2015 2016 2017 2018
Nai
ra B
illio
n
2
2
DRAFT

Central Bank of Nigeria Annual Report—2018
44
ensuring sustained supply and circulation of clean notes. It requires that the
production, issuance of new notes and recirculation of used banknotes by
banks/CPCs must conform with CBN set/defined standards. It also aims at
ensuring that the quality of banknotes in circulation must be in good
condition to allow for processing and free acceptability by the general
public. The policy document clearly displays features on the obverse and
reverse of the banknotes; and states the responsibility for issuance,
recirculation, processing, handling, counterfeits and mutilated banknotes
management, as well as standards for banknotes processing by currency
management stakeholders across the industry value chain.
The banknote fitness guidelines provide stakeholders and the general public
with clear, uniform acceptable criteria for determining the good quality and
removal of unfit banknotes in circulation. It shows the quality
standards/stages through print appearance(s), details the banknotes
degradation by soiling, limpness and thus, defines the acceptable threshold
for (fit) clean and (unfit) dirty banknotes. The guidelines also provide pictorial
classifications of ATM fit notes, Teller fit and unfit banknotes as a guide to the
currency handlers, users and key stakeholders to effectively manage the
banknotes.
The two policy documents were produced by the Bank in collaboration with
key industry stakeholders, including Cash-in-Transit Companies (CITs), banks
and Currency Processing Companies (CPCs). The non-compliance with the
provisions therein shall be sanctioned according to the relevant sections of
the CBN Act 2007, Banks and Other Financial Institutions Act (BOFIA) and
other relevant regulations/guidelines by the CBN.
2.2.4 The Nigeria Cash Management Scheme (NCMS)
The Bank sustained its cash management policy under the Nigerian Cash
Management Scheme. The Scheme leverages the shared services platform
to reduce the cost of currency management. Thus, the Bank intensified its
efforts at reducing the cost of currency management. These included: the
review/update of request for proposal (RFP) for the integrated cash
management platform in line with contemporary technological
2
DRAFT

Central Bank of Nigeria Annual Report—2018
45
developments; raising the capacity of Cash–in–Transit (CIT)/Cash Processing
Companies (CPC) by encouraging regional participation; providing exit
options for the Bank and the management of human and material options;
and developed/carried out user acceptance test (UAT) and deployed CBN
Cash Application Reporting Portal (CARP). The CBN’s CARP application had
gone live and commenced the transmission of data on its Currency
Management activities to the industry coordinator, NIBSS. The CARP, a stop
gap solution for integrated management platform, was designed to provide,
credible currency management data from the CBN, banks, and CITs/CPCs.
Twenty (20) banks had integrated their CARP application solutions, enabling
transmission of currency management data to NIBSS, while others were in the
process of linking-up with NIBSS. At end-December 2018, the Bank had
registered eight (8) CITs operators, two (2) of which have been granted Cash
Processing Licences.
2.2.5 Sustainable Disposal of Banknote Waste
To ensure compliance with Nigerian Sustainable Banking Principles (NSBP),
the CBN collaborated with some recycling companies and sustained efforts
to promote sustainable waste management in currency disposal. An in-depth
chemical analysis of polymer wastes was carried out with a view to mitigating
the Bank’s carbon foot prints. Following this, was a pilot run of recycling
polymer wastes into re-usable products such as pallets, chairs, dustbins,
flower pots, among others, etc., by some recycling companies. The outcome
showed that polymer waste was cost effective and another income stream
to meet the Bank’s corporate social responsibility (CSR).
2.2.6 Authentication & Processing of Foreign Currency Deposit by Banks
The Bank continued with the policy of processing and authentication of
foreign currency deposits by banks during the review period. This was carried
out through the receipts, processing and authentication of excess dollar
deposits by banks with Lagos Branch at a handling charge of 0.03 per cent of
the total deposit. To make the operation seamless, the Bank issued a circular
to banks to classify their US$ deposits into OLD and NEW series prior to deposit
2
DRAFT

Central Bank of Nigeria Annual Report—2018
46
at CBN Lagos Branch. A total of US$7.44 billion was processed as at
December 31, 2018, and the sum of ₦6.82 billion was generated.
2.2.7 Automation and Modernisation of Currency Management
In a bid to minimise human intervention, usher a regime of more efficient and
secured cash handling in line with the Bank’s vision, and conform to best
practice in currency management operations, the Bank commenced
processes for the deployment of an end-to-end solution for integrated cash
handling management at its branches.
The implementation would be on a pilot basis starting with three (3) branches
namely: Asaba; Abuja; and Abeokuta where the conveyor belt system had
earlier been installed and would be replicated in other branches of the Bank.
The Scheme would provide seamless integration with the existing conveyor
system and other cash infrastructure for optimal currency management.
2.3 FOREIGN EXCHANGE MANAGEMENT
2.3.1 Foreign Exchange Market and Management
The foreign exchange market witnessed increased demand pressure,
especially in the second half of 2018, on account of capital flow reversal,
precipitated by the normalisation of interest rates in advanced economies,
particularly the US and perceived political uncertainties in the wake of the
2019 general elections. The CBN sustained its intervention in the foreign
exchange market and adopted various measures to promote stability of the
naira and engender a stable macroeconomic environment. The Bank
abolished commission on retail foreign exchange transactions on invisible
services, such as business travel allowance (BTA), personal travel allowance
(PTA), medical and school fees.
The Bank also adjusted downward, the selling rate of foreign exchange to
Bureaux de Change (BDCs) operators and increased the frequency of its
interventions in the other windows, to ease access and availability of foreign
exchange to end-users. The Bank, on April 27, 2018, signed a 3-year bilateral
currency swap agreement of US$2.5 billion - equivalent to ¥15.0 billon or
N720.0 billon- with the Peoples Bank of China (PBoC), as of the effort to
reduce foreign exchange demand pressure and facilitate investment
2
DRAFT

Central Bank of Nigeria Annual Report—2018
47
between Nigeria and China. Furthermore, the Bank added fertilizer to the list
of “items not valid for foreign exchange” in the official market, bringing the
total number of items to 42.
The stability in the foreign exchange market sustain into 2018, on account of
the foreign exchange management measures implemented by the Bank.
Thus, the premium between the average interbank and BDC rates narrowed
significantly to 18.1 per cent in 2018, compared with 29.3 per cent in 2017.
Similarly, the premium between the BDC and I&E rates narrowed to 0.1 per
cent in 2018, compared with 7.9 per cent in 2017.
2.3.2 Foreign Exchange Flows
Aggregate foreign exchange inflow into the economy increased by 34.7 per
cent to US$122.60 billion, compared with US$91.00 billion in 2017. A
breakdown showed that inflows through the CBN and autonomous sources,
constituted 48.3 and 51.7 per cent, respectively, of the total, compared with
46.3 and 53.7 per cent in 2017.
A further analysis indicated that foreign exchange inflow through the CBN,
increased to US$59.25 billion, compared with US$42.17 billion in 2017. A
breakdown of foreign exchange inflow through the CBN, showed that
earnings from crude oil export rose by 44.9 per cent to US$15.03 billion, above
the US$10.37 billion in the preceding year. This was due to increase in both
price and production of crude oil, compared with the levels in 2017. The non-
oil component of the inflow through the Bank increased by 39.0 per cent to
US$44.22 billion, compared with US$31.80 billion in 2017. The development
was attributed mainly to 110.3, 116.3 and 46.0 per cent increase in TSA & third
party receipts, interbank swaps and other official receipts to US$8.77 billion,
US$6.33 billion, and US$3.62 billion, respectively. A further breakdown of non-
oil inflow showed a receipt of US$8.78 billion as foreign exchange purchases;
banks cash receipts, US$5.50 billion; government debt proceeds, US$5.37
billion; unutilised funds from foreign exchange transactions, US$2.06 billion;
and returned payments (wired/cash), US$1.50 billion. Interest earnings on
reserves and investments, and return of unutilised International Money
Transfer operators funds were US$0.77 billion and US$1.52 billion, respectively.
2
DRAFT

Central Bank of Nigeria Annual Report—2018
48
Inflow through autonomous sources increased by 29.8 per cent to US$63.36
billion, compared with US$48.83 billion in 2017. A breakdown showed that
invisible transactions was US$58.98 billion; non-oil export receipts by banks,
US$4.33 billion; and external account purchases, US$0.04 billion, constituting
93.1, 6.8 and 0.1 per cent, respectively, of the total. Of the invisibles, over-the-
counter (OTC) purchases and domiciliary account were US$39.85 billion
(67.6%) and US$19.13 billion (32.4%), respectively. A further breakdown of OTC
purchases showed that: capital importation stood at US$16.60 billion; other
OTC purchases, US$21.07 billion; oil companies, US$0.43 billion; and home
remittances, US$1.76 billion.
Aggregate foreign exchange outflow from the economy during the review
period rose by 80.9 per cent to US$60.92 billion, compared with US$33.68
billion in the preceding year. Of this, outflow through the CBN constituted 92.5
per cent of the total, while autonomous sources accounted for the balance
of 7.5 per cent. Foreign exchange outflow, through the CBN, rose by 84.4 per
cent to US$56.33 billion, compared with US$30.55 billion in the preceding
year. The development was due, largely, to increased intervention by the
CBN in the foreign exchange market and other official payments. Foreign
exchange supply to the market amounted to US$38.14 billion of which: inter-
bank forwards, US$12.90 billion; inter-bank sales, US$5.90 billion; BDC sales,
US$8.83 billion; matured swaps contract, US$4.58 billion and I&E sales, US$5.93
billion.
A further breakdown of foreign exchange outflow, through the Bank, showed
that other official payments rose by 86.4 per cent to US$10.12 billion,
compared with US$5.43 billion in 2017. This was attributed to 142.3 and 22.2
per cent increase in miscellaneous payment and Joint Venture Company
(JVC) cash calls to US$7.23 billion and US$2.70 billion, respectively, compared
with the levels in the preceding year. However, estacode payments fell by
21.0 per cent to US$0.18 billion, compared with US$0.23 billion in 2017. External
debt service was US$1.45 billion, 3rd party MDA transfers, US$5.49 billion; and
drawings on letters of credit, US$0.41 billion, indicating increases of 243.2,
104.0 and 15.2 per cent, over their respective levels in 2017. Funds returned to
2
DRAFT
Central Bank of Nigeria Annual Report—2018
49
remitters was US$0.41 billion; foreign exchange special payment, US$0.26
billion; Bank and SDR charges, US$0.03 billion; and National Priority Projects,
US$0.01 billion.
Outflow through autonomous sources rose to US$4.58 billion, indicating an
increase of 46.6 per cent, over the level in 2017. Payments for invisibles
amounted to US$3.65 billion, representing 79.7 per cent of the total
autonomous outflow, while import, at US$0.93 billion, accounted for the
balance of 20.3 per cent.
Overall, the economy in 2018 recorded a net inflow of US$59.25 billion,
compared with US$57.32 billion in 2017, of which that of the CBN was US$2.91
billion, compared with US$11.62 billion in 2017.
2
DRAFT
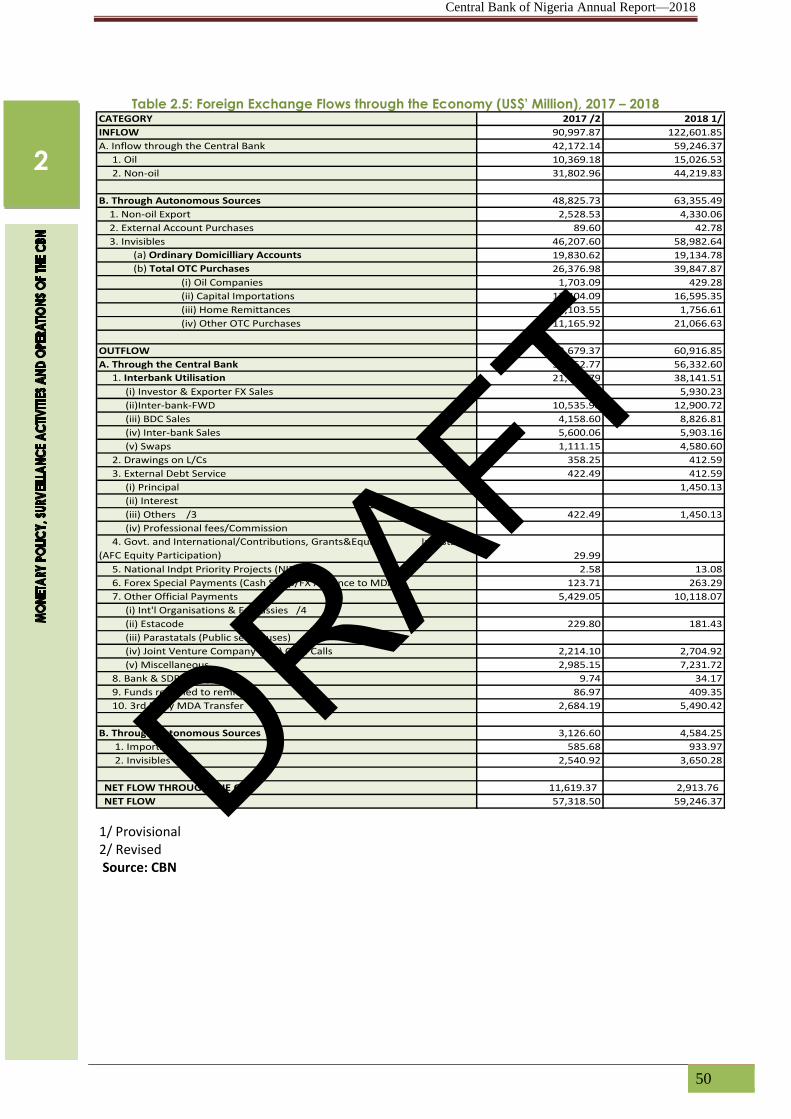
Central Bank of Nigeria Annual Report—2018
50
Table 2.5: Foreign Exchange Flows through the Economy (US$’ Million), 2017 – 2018 CATEGORY 2017 /2 2018 1/
INFLOW 90,997.87 122,601.85
A. Inflow through the Central Bank 42,172.14 59,246.37
1. Oil 10,369.18 15,026.53
2. Non-oil 31,802.96 44,219.83
B. Through Autonomous Sources 48,825.73 63,355.49
1. Non-oil Export 2,528.53 4,330.06
2. External Account Purchases 89.60 42.78
3. Invisibles 46,207.60 58,982.64
(a) Ordinary Domicilliary Accounts 19,830.62 19,134.78
(b) Total OTC Purchases 26,376.98 39,847.87
(i) Oil Companies 1,703.09 429.28
(ii) Capital Importations 12,404.09 16,595.35
(iii) Home Remittances 1,103.55 1,756.61
(iv) Other OTC Purchases 11,165.92 21,066.63
OUTFLOW 33,679.37 60,916.85
A. Through the Central Bank 30,552.77 56,332.60
1. Interbank Utilisation 21,405.79 38,141.51
(i) Investor & Exporter FX Sales - 5,930.23
(ii)Inter-bank-FWD 10,535.98 12,900.72
(iii) BDC Sales 4,158.60 8,826.81
(iv) Inter-bank Sales 5,600.06 5,903.16
(v) Swaps 1,111.15 4,580.60
2. Drawings on L/Cs 358.25 412.59
3. External Debt Service 422.49 412.59
(i) Principal 1,450.13
(ii) Interest
(iii) Others /3 422.49 1,450.13
(iv) Professional fees/Commission
4. Govt. and International/Contributions, Grants&Equity Invests.
(AFC Equity Participation) 29.99
5. National Indpt Priority Projects (NIPP) 2.58 13.08
6. Forex Special Payments (Cash Swap/FX Advance to MDAs) 123.71 263.29
7. Other Official Payments 5,429.05 10,118.07
(i) Int'l Organisations & Embassies /4
(ii) Estacode 229.80 181.43
(iii) Parastatals (Public sector uses)
(iv) Joint Venture Company (JVC) Cash Calls 2,214.10 2,704.92
(v) Miscellaneous 2,985.15 7,231.72
8. Bank & SDR Charges 9.74 34.17
9. Funds returned to remitters 86.97 409.35
10. 3rd Party MDA Transfer 2,684.19 5,490.42
B. Through Autonomous Sources 3,126.60 4,584.25
1. Imports 585.68 933.97
2. Invisibles 2,540.92 3,650.28
NET FLOW THROUGH THE CBN 11,619.37 2,913.76
NET FLOW 57,318.50 59,246.37
1/ Provisional 2/ Revised Source: CBN
2
DRAFT
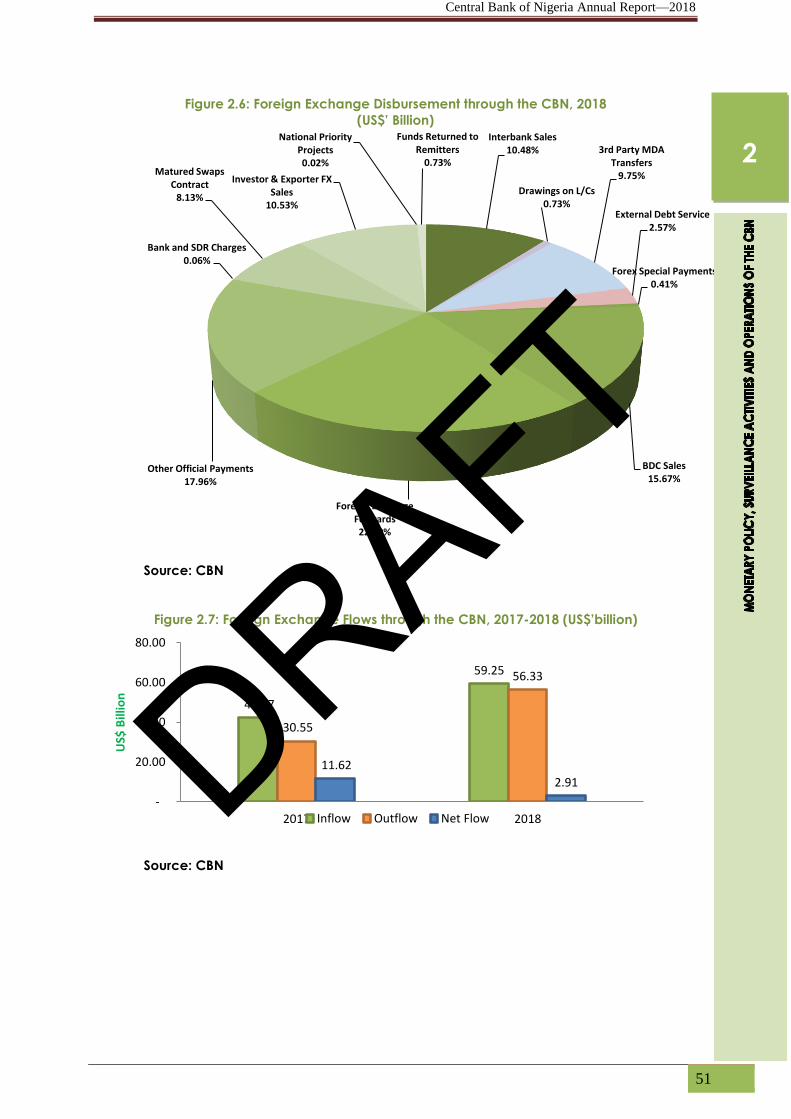
Central Bank of Nigeria Annual Report—2018
51
Figure 2.6: Foreign Exchange Disbursement through the CBN, 2018
(US$’ Billion)
Source: CBN
Figure 2.7: Foreign Exchange Flows through the CBN, 2017-2018 (US$’billion)
Source: CBN
Interbank Sales 10.48%
Drawings on L/Cs 0.73%
3rd Party MDA Transfers
9.75%
External Debt Service 2.57%
Forex Special Payments 0.41%
BDC Sales 15.67%
Foreign Exchange Forwards 22.90%
Other Official Payments 17.96%
Bank and SDR Charges 0.06%
Matured Swaps Contract
8.13%
Investor & Exporter FX Sales
10.53%
National Priority Projects 0.02%
Funds Returned to Remitters
0.73%
42.17
59.25
30.55
56.33
11.62
2.91
-
20.00
40.00
60.00
80.00
2017 2018
US$
Bill
ion
Inflow Outflow Net Flow
2
DRAFT

Central Bank of Nigeria Annual Report—2018
52
2.3.3 Developments in the Foreign Exchange Market
The foreign exchange market was relatively stable in the first half of 2018 on
account of the robust foreign exchange supply and measures adopted by
the Bank. In the second half of 2018, the market, however, witnessed
renewed demand pressure, due mainly to capital flow reversal, induced by
the normalisation of interest rates in the US and perceived political risk ahead
of the 2019 general elections. Consequently, the Bank sustained intervention
in the market and adopted other policy measures, to boost liquidity and
restore the relative stability in the market.
The amount of foreign exchange disbursed for payments of matured
forwards contracts increased to US$12.9 billion, compared with US$10.54
billion in 2017. Similarly, sales to BDC operators and interbank rose to US$8.83
billion and US$5.90 billion in 2018, above their respective levels of US$4.16
billion and US$5.6 billion in 2017. Matured swaps contract increased
significantly by 312.2 per cent to US$4.58 billion, compared with US$1.11 billion
in 2017. Furthermore, the Bank sold US$5.93 billion at the I&E window in 2018.
Thus, the total supply of foreign exchange by the Bank increased by 78.2 per
cent to US$38.14 billion, compared with US$21.41 billion in 2017. The
development boosted liquidity and stabilised the naira exchange rate during
the period.
2.3.4 Sectoral Utilisation of Foreign Exchange
Aggregate sectoral utilisation of foreign exchange increased by 48.0 per
cent to US$40.91 billion in 2018, compared with US$27.64 billion in 2017. A
disaggregation of foreign exchange utilisation showed that invisible trade
rose by 100.0 per cent to US$24.96 billion, representing 61.0 per cent of the
total, compared with US$12.48 billion in 2017. The value of visible import also
increased by 5.2 per cent to US$15.94 billion, from US$15.16 billion in 2017, and
accounted for 39.0 per cent of the total.
A disaggregation of visible imports showed that foreign exchange utilisation
in the industrial, food products, manufacturing, transport and mineral sub-
sectors rose by 4.1, 53.4, 58.6, 16.0 and 100.6 per cent, to US$7.26 billion,
2
DRAFT
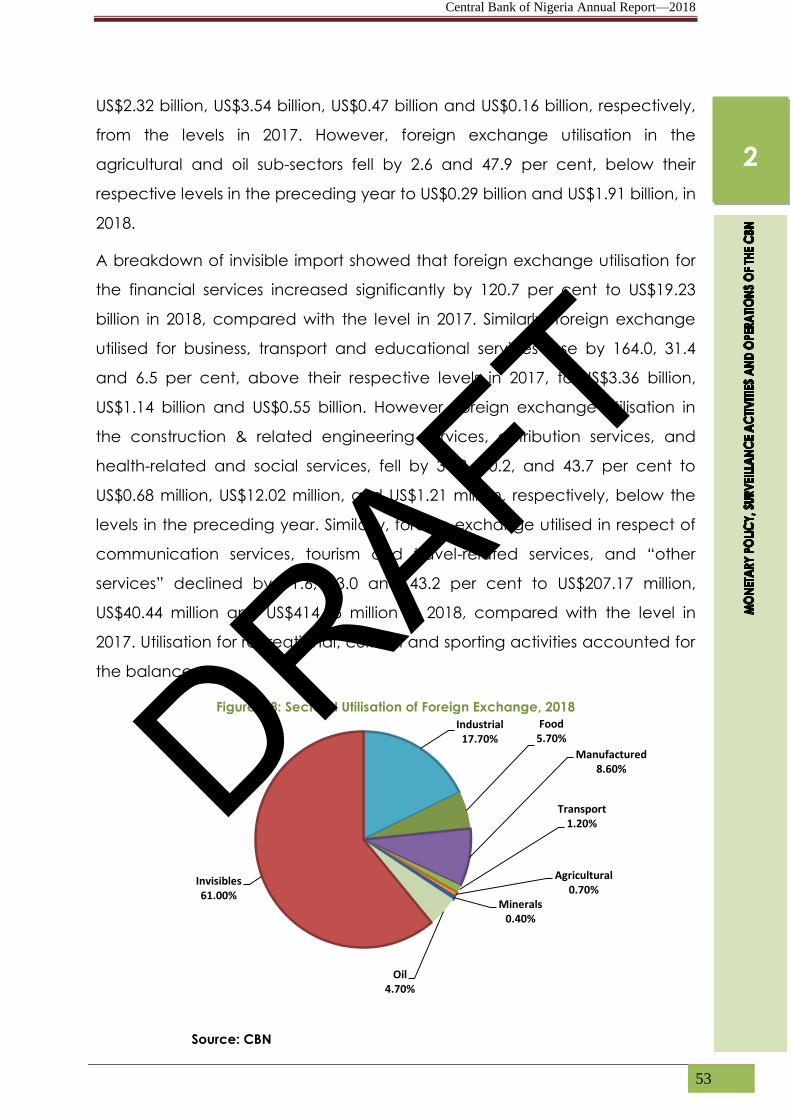
Central Bank of Nigeria Annual Report—2018
53
US$2.32 billion, US$3.54 billion, US$0.47 billion and US$0.16 billion, respectively,
from the levels in 2017. However, foreign exchange utilisation in the
agricultural and oil sub-sectors fell by 2.6 and 47.9 per cent, below their
respective levels in the preceding year to US$0.29 billion and US$1.91 billion, in
2018.
A breakdown of invisible import showed that foreign exchange utilisation for
the financial services increased significantly by 120.7 per cent to US$19.23
billion in 2018, compared with the level in 2017. Similarly, foreign exchange
utilised for business, transport and educational services rose by 164.0, 31.4
and 6.5 per cent, above their respective levels in 2017, to US$3.36 billion,
US$1.14 billion and US$0.55 billion. However, foreign exchange utilisation in
the construction & related engineering services, distribution services, and
health-related and social services, fell by 31.8, 60.2, and 43.7 per cent to
US$0.68 million, US$12.02 million, and US$1.21 million, respectively, below the
levels in the preceding year. Similarly, foreign exchange utilised in respect of
communication services, tourism and travel-related services, and “other
services” declined by 11.6, 63.0 and 43.2 per cent to US$207.17 million,
US$40.44 million and US$414.55 million in 2018, compared with the level in
2017. Utilisation for recreational, cultural and sporting activities accounted for
the balance.
Figure 2.8: Sectoral Utilisation of Foreign Exchange, 2018
Source: CBN
Industrial 17.70%
Food 5.70%
Manufactured 8.60%
Transport 1.20%
Agricultural 0.70%
Minerals 0.40%
Oil 4.70%
Invisibles 61.00%
2
DRAFT

Central Bank of Nigeria Annual Report—2018
54
2.3.5 External Reserves
External reserves at end-December 2018 stood at US$42.59 billion, showing
an increase of 8.2 per cent, compared with US$39.35 billion at end-
December 2017. This was due, largely, to increase in oil-related revenues,
foreign exchange purchases, TSA and third party receipts, interbank swaps
and proceeds from government external borrowing.
Figure 2.9: Gross External Reserves Position and Months of Import Cover, 2014 – 2018
Source: CBN
A disaggregation of external reserves by ownership at end-December 2018
showed that the share of the CBN, Federal Government and Federation
stood at US$35.32 billion, US$6.79 billion and US$0.48 billion, respectively,
representing 82.9, 15.9 and 1.2 per cent of the total. The external reserves
could finance 13.0 months of import (goods only) or 7.5 months of import
(goods and services) at end-December 2018, compared with 14.5 months of
import (goods) or 9.3 months of import (goods and services) at end-
December 2017.
0
2
4
6
8
10
12
14
16
0
5
10
15
20
25
30
35
40
45
2014 2015 2016 2017 2018
Mo
nth
s o
f Im
po
rt c
ove
r
US
$ b
illio
n
External Reserves(LHS) Months of Import Cover(RHS)
2
DRAFT

Central Bank of Nigeria Annual Report—2018
55
Figure 2.10: Holdings of External Reserves at end-December, 2018, (Per cent)
Source: CBN
Figure 2.11: External Reserves Position and Crude Oil Price, 2015-2018
0.00
10.00
20.00
30.00
40.00
50.00
60.00
70.00
0.00
20.00
40.00
60.00
80.00
100.00
120.00
140.00
160.00
US$
Bill
ion
$/b
arre
l
Bonny Light Crude Foreign Reserves
Source: CBN
The Net Asset Value of the entire fixed income portfolio managed by the
external asset managers stood at US$6.99 billion. The portfolio yielded an
absolute return of about US$581 million, since inception to December, 2018. It
however, recorded an aggregate underperformance of 3 bps below the
composite benchmark.
Aggregate earnings from the management of external reserves in 2018
amounted to N257.96 billion (US$845 million), an increase of 231.8 per cent,
82.9%
1.2%
15.9%
CBN Federation FGN
2
DRAFT

Central Bank of Nigeria Annual Report—2018
56
above N77.74 billion in 2017. This also represented an increase of N181.93
billion or 239.3 per cent over the budgeted amount of N76.02 billion in the
review year. The increase was due, largely, to reserves accretion and the
sustained rise in interest rates in the US.
The Bank maintained all the previous performance measures of its bonds in
2018. The performance of the World Bank US Treasury Bonds portfolio was
measured against the Bank of America Merrill Lynch 1-3 years US Treasury
Index. The Global Government Bonds Short-Duration (USD Hedged) portfolio
was measured against the Bank of America Merrill Lynch Global Government
Bond G7 1-3 year Index, ex-Italy 100% hedged into USD. The CNH portfolio
was measured against the Citigroup DIM Sum off-shore CNY index. The World
Bank MBS portfolio was measured against Barclays US MBS Index.
2 .4 SURVEILLANCE OF THE ACTIVITIES OF FINANCIAL INSTITUTIONS
2.4.1 Banking Supervision
The Bank continued its supervisory and surveillance activities in 2018, with a
view to ensuring the safety and soundness of banking institutions, as well as,
promoting public confidence in the Nigerian banking system. In this regard, it
maintained the risk-based supervision (RBS) approach.
The Nigerian Banking Industry began the implementation of IFRS 9 in January
2018. This was in accordance with the final version of IFRS 9 standard on
Financial Instruments by the International Accounting Standards Board (IASB).
A joint CBN/NDIC IFRS 9 Implementation
Project Team was constituted to pilot the
implementation process. Under the new
standard, credit losses are computed based
on Expected Credit Losses (ECL) criteria,
rather than the incurred loss (IL) model of IAS 39. It also introduced
requirements for the classification and measurement of financial instruments,
albeit with special focus on impairment requirements. Upon implementation
of the standard in January 2018, the CBN carried out a detailed impact
assessment of IFRS 9 Expected Credit Loss (ECL) model on the banking
2
The Bank sustained initiatives to ensure the safety, soundness and stability of banking institutions, as well as promote public confidence in the Nigerian banking system.
DRAFT

Central Bank of Nigeria Annual Report—2018
57
industry. To cushion against the likely “capital shock” in the implementation of
this model, and in line with global policy response, a Transitional
Arrangements Circular –“Treatment of IFRS 9 Expected Credit Loss for
Regulatory Purposes by Banks in Nigeria” was issued in October 2018. The
transitional arrangement requires banks to amortise the “Adjusted Day One
Impact” over four (4) years. This being the excess of the ECL provisions over
IAS 39 provisions after having adjusted for the balances in the Regulatory Risk
Reserve (RRR) as at the transition date of January 1, 2018. The amortisation
would be done using Static approach on a straight-line basis over the four-
year transition period by writing back to the Tier 1 capital. The transitional
period will terminate by December 31, 2021.
The electronic line card scheme, codenamed Credit Assessment Analysis
System (CAAS) was deployed in 2018, as a technological approach in the
evaluation of banks’ credit and all examinations involving risk assets
appraisal. Continuous upgrades were carried out on the software to reflect
changes in standards.
In addition, the CBN continued to monitor the implementation of the Basel
II/III standards to ensure regular update and improvement in its regulatory
and supervisory framework to ensure that:
Regulatory capital assessment was in line with the prescribed standards
by reviewing monthly returns by banks on capital adequacy ratio (CAR)
to ensure that the minimum regulatory capital reported by banks is
consistent and captured all the relevant risks;
Banks’ risk management framework could assess all the risks not
captured in the pillar 1 capital assessment by reviewing banks’ Internal
Capital Adequacy Assessment Process (ICAAP) report, to assess their
strategies for taking on risk and ensure that the related capital needs are
sufficient, now and into the future;
The Supervisory Review and Evaluation Process (SREP) of the Internal
Capital Adequacy Assessment Process (ICAAP) of banks was carried out
during the year. The process was to enhance market discipline and to
2
DRAFT

Central Bank of Nigeria Annual Report—2018
58
provide an independent evaluation of the quantitative and qualitative
aspects of the banks’ risk management practices, especially with regard
to identification and assessment of material risks and adequacy of
capital; and
Pillar 2 risk capital assessment was carried out in a robust and
comprehensive manner, and to improve the overall quality of the
ICAAP, the CBN commenced the process of development of five (5)
Pillar 2 risk guidelines on “Interest Rate Risk in the Banking Book, Credit
Concentration Risk, Banks’ Business Models, Reputational Risk and Stress
Testing”. The exposure draft was released to the industry for comments in
the second half of 2018.
In the other financial institutions (OFIs) sub-sector, the on-boarding of
microfinance banks (MFBs) on the National Association of Microfinance Banks
Unified Information Technology (NAMBUIT) platform continued, with the
selection of 111 MFBs, consisting of 1 National, 10 States and 100 Units. The list
of selected MFBs was submitted to Inlaks Computers for the pilot phase. At
end-December 2018, the implementation team had successfully deployed
NAMBUIT in 10 MFBs, comprising 1 National and 9 Unit MFBs.
In addition, following the extended deadline of December 31, 2017 for the
BVN enrollment for customers of OFIs, the CBN granted financial assistance to
MFBs to purchase Data Capturing Machines (DCM) for the enrollment. At
end-December 2018, a total subsidy of N49.2 million for the purchase of 246
DCMs at the cost of N200,000 each, was paid to the National Association of
Microfinance Banks (NAMB) for disbursement to the beneficiary MFBs.
However, there were challenges, which included: low turnout amongst MFB
customers who only turned up when they required credit facilities; some
banking software providers did not upgrade their platform to include BVN
module as a mandatory field; and difficulties faced by NIBSS in creating and
assigning roles to users. At end-December 2018, 376 out of 879 MFBs had
submitted their BVN enrolment to the CBN, totaling 1.5 million and
representing 19.1 per cent of the 8.2 million active customers.
2
DRAFT
Central Bank of Nigeria Annual Report—2018
59
To facilitate data exchange between OFIs and credit bureaux, the CBN
organised training sessions on credit reporting for software vendors,
compliance officers, managing directors and chairmen of Board Credit
Committees of OFIs. Participants were exposed to the responsibilities of
compliance officers in OFIs, with regard to disclosure of insider-related
facilities and other credit information. The CBN, also, paid the sign-up fees of
MFBs for connection to two (2) credit bureaux to fast-track integration into
the credit reporting scheme.
In a related development, the 18th and 19th Meetings of Committee of
Microfinance Banks in Nigeria (COMBIN) were held in Lagos, Abuja, and
Owerri in 2018. The meetings were attended by the representatives of the
CBN, the Nigeria Deposit Insurance Corporation (NDIC) and the Managing
Directors of MFBs. The discussions focused on the ways to improve credit
administration in the MFBs, with a view to reducing the sub-sector portfolio-at-
risk (PAR) and compliance with other regulatory requirements. The highlights
of the meetings were as follows:
The comprehensive review of the regulatory guidelines and
liberalisation of the current regulatory requirements to ease the burden
on MFBs, such as the provisioning requirement, qualification criteria for
management appointments, among others;
The call for the introduction of a liquidity support facility similar to the
CBN Discount Window for MFBs;
The need for the establishment of an interbank market for MFBs;
The imperative to accelerate the completion and implementation of
the re-designed CRMS for OFIs to engender a good credit culture and
reduce the average PAR in the industry;
The urgency for implementation of an effective sanction regime (zero
tolerance for infractions); and
The need to accelerate the completion and implementation of the
NAMBUIT and Integrated Regulatory Solution (IRS) as long-term solutions
to address the challenge of data integrity and reliability.
2.4.2 Credit Risk Management System
2
DRAFT

Central Bank of Nigeria Annual Report—2018
60
The CBN continued to monitor banks’ compliance with the requirements of
the Redesigned Credit Risk Management System (CRMS), which enables
early identification of predatory borrowers and ensure transparency,
credibility and efficient debt profiling of the banking industry. Also, a pilot run
for on-boarding Non-Interest Banks (NIBs) to the CRMS was concluded during
the review year. In addition, the phased deployment of the re-designed
CRMS to OFIs and the pilot run on Development Finance Institutions (DFIs)
commenced. An interface for NDIC to manage credit records in respect of
loans of banks in liquidation was created. Accordingly, the new CRMS
continued to serve as a platform for the management of credit information in
the banking industry.
At end-December 2018, the total number of credit facilities reported on the
database rose significantly by 84.8 per cent to 4,976,292, from 2,692,403 in
2017. This consisted of 4,453,336 and 522,956 facilities granted to individuals
and corporates, respectively, compared with 2,263,109 and 429,294 in 2017.
Thus, the number of borrowers, with outstanding facilities rose by 31.6 per
cent to 1,866,468 in 2018, from 1,418,081 in 2017. The significant increase
reflected the back-filing of previously unreported credit following
compliance status checks by the Bank and creation of new loans by
participating financial institutions.
Table 2.6: Borrowers from the Banking Sector (Commercial and Merchant Banks)
Description 2017 2018
Absolute
Change
%
Change
Total No. of Credit/facilities
reported on the CRMS: 2,692,403 4,976,292 2,283,889 84.8
Individuals 2,263,109 4,453,336
Corporates 429,294 522,956
Total No. of Outstanding Credit
facilities on the CRMS: 1,418,081 1,866,468 448,387 31.6
Individuals 1,322,076 1,763,960
Corporates 96,005 102,508
Source: CBN CRMS
The number of licenced Private Credit Bureaux (PCBs) remained three (3) at
end-December 2018, though the industry continued to record remarkable
growth through increased awareness and acceptance. The capital base of
the three (3) Credit Bureaux were above the minimum capital requirement of
2
DRAFT
Central Bank of Nigeria Annual Report—2018
61
N500.0 million. At end-December 2018, the average number of records, in the
database of the PCBs, was 92.3 million in 2018, reflecting 95.6 per cent
increase over the 47.2 million in 2017. The number of borrowers and value of
outstanding credit also increased from 15.3 million and N23.9 trillion in 2017,
respectively, to 50.0 million and N63.4 trillion in 2018. The cumulative number
of institutional subscribers to the three (3) PCBs stood at 2,695, compared with
1,752 in 2017. The development during the review year reflected increased
credit activities and compliance, following the passage of the Credit
Reporting Act in 2017.
The foremost challenge in the industry remained the integrity and quality of
data provided by the subscriber institutions. To resolve this challenge, the
CBN is working with the bureaux and the financial institutions towards
achieving uniformity in reporting with the common data template.
2.4.3 Prudential Review and Examination
A review of banks’ prudential ratios showed that the industry average capital
adequacy ratio (CAR) rose to 15.3 per cent at end-December 2018,
compared with 10.2 per cent at the end of December 2017 and 8.0 per cent
stipulated minimum requirement for International banks under the Basel
capital accord, respectively. The Industry Non-Performing Loans (NPL) ratio,
at 11.4 per cent, showed an improvement from the 14.8 per cent recorded at
end-December 2017. At this level, the industry NPL ratio remained significantly
above the maximum regulatory threshold of 5.0 per cent. Similarly, the
industry average liquidity ratio (LR), at 51.7 per cent in December 2018,
compared with 45.6 per cent at end-December 2017, remained above the
regulatory minimum of 30.0 per cent by 21.7 percentage points.
2.4.4 Corporate Governance in the Nigerian Financial Services Industry
To ensure adherence to the provisions of the Code of Corporate
Governance for Banks, the CBN sustained the implementation of various
initiatives for monitoring and assessment of compliance. In this regard, the
Code of Corporate Governance Scorecard was launched in March 2017
and formed the basis for a pilot compliance examination of 18 banks,
2
DRAFT

Central Bank of Nigeria Annual Report—2018
62
covering all categories of licences. Highlights of the findings from the exercise
were:
Three (3) banks did not have an approved strategy document, while
those for some banks were not robust and comprehensive;
Failure to assign responsibility for the implementation of approved
strategy document;
Failure by two banks to comply with the requirements of the Code on
composition of the board, board meetings, subsidiary cross directorship,
holding company, succession planning, remuneration policy, limits of
authority and risk management;
All banks complied with the requirements of the Code on size of the
board, separation of duties and disclosure and transparency; and
Nine (9) banks did not comply with the requirements on ethics and
professionalism, as well as, rights of other stakeholders.
In addition, banks commenced rendering reports on dud cheques on the
CRMS platform in 2017, in line with the circular, titled “Need to Implement
Measures to Dissuade the Issuance of Dud Cheques in the Nigerian Banking
System”. This would facilitate the collation and analysis of data on serial dud
cheque issuers, to enable the CBN take more stringent actions against them.
2.4.5 Financial Crimes Surveillance/Anti-Money Laundering
The CBN continued to follow-up with banks on the level of implementation of
the recommendations of the money laundering and financing of terrorism
(ML/FT) national risk assessment (NRA). In compliance with the Financial
Action Task Force (FATF) recommendation on collaboration, the CBN
attended the FATF plenary held in Paris, France in July 2018. During the year,
the Bank also participated in the plenaries of the Inter-Governmental Action
Group against Money Laundering in West Africa (GIABA), which provided
opportunities for member countries to discuss threats and challenges
associated with AML/CFT within member states and to address issues that
require concerted and harmonised efforts to resolve.
2
DRAFT

Central Bank of Nigeria Annual Report—2018
63
Furthermore, the CBN sustained the collaboration with the AML/CFT
stakeholder agencies in the country on information sharing. As the Secretariat
of the stakeholders Consultative Forum, the CBN hosted quarterly meetings of
the Forum during the year. To ensure a more dissuasive and effective
sanction regime, the CBN, in collaboration with the Office of the Attorney
General of the Federation, developed and gazzetted the AML/CFT
Administrative Sanction Regulation 2018. Further to the circular issued to
banks and OFIs, as well as a cautionary notice to the public drawing their
attention on money laundering and terrorism financing risks associated with
virtual currency (VC), the CBN continued to monitor developments in the
virtual currency space with a view to formulating substantive regulations to
deal with the phenomenon.
The Bank conducted AML/CFT compliance examination of banks for the
period April 1, 2017 to March 31, 2018. The objective of the exercise was to
ascertain the level of compliance with the statutory thresholds for cash
deposits of foreign and local currencies, as well as treatment of suspicious
transactions. The examination also reviewed banks’ compliance with CBN’s
directive on Dud cheques. The examination showed an overall improvement
in the AML/CFT regime of many banks, as evidenced by the general
reduction in infractions.
As in previous years, the examination was conducted alongside the annual
foreign exchange examination, which has proven to be an efficient strategy
for the management of time and resources. The AML/CFT examinations were
guided strictly by statutory provisions of the Money Laundering Prohibition
Act, 2011 (as amended) and the CBN’s AML/CFT Regulations 2013.
2.4.6 Routine, Special and Target Examinations
The CBN/NDIC Joint Risk Assets Assessment of all the banks was conducted to
determine the quality of banks’ assets and the adequacy of loan loss-
provisioning, required for “no objection” for the publication of banks’ 2017
audited annual financial statements. The first tranche of the CBN/NDIC Joint
Risk Based Examination, covering fifteen (15) banks with a Composite Risk
Rating (CRR) of “High” and “Above Average” was carried out in July 2018,
2
DRAFT

Central Bank of Nigeria Annual Report—2018
64
while the examination of the three (3) financial holding companies also
commenced in the same period. Following the conclusion of the exercise,
two (2) banks were upgraded from risk ratings of “Above Average” to
“Moderate” risk and one (1) bank’s rating improved from “High” risk to
“Above Average”.
The risk based examination of eleven (11) banks with Composite Risk Ratings
(CRR) of “Moderate” and “Low” for the period ended 30th September, 2018
was conducted between October and November 2018. The Risk Based
Examinations (Monitoring and Routine) of the three (3) Credit Bureaux and
AMCON was also conducted within the period under review. The operations
of the credit bureaux and AMCON were reviewed to ensure the continued
compliance with extant laws and regulations, including the CBN’s regulations
on credit reporting and the AMCON Act 2010 (as amended). The AMCON
examination also reviewed the level of performance of its acquired assets,
including recoveries made during the year. Appropriate remedial actions
were identified for implementation by the examined institutions.
The maiden examination of Nova Merchant Bank Nigeria Limited, after six (6)
months in operation, was conducted during the year. The examination
revealed that the bank had in place appropriate governance structures and
was operating in line with the conditions of its licence. With respect to Non-
Interest Banks, a total of three (3) examinations; two (2) routine examinations
(of the NIB and NIB Window) and the Risk Asset examination of Jaiz Bank Plc,
were carried out in 2018. At the conclusion of the exercise, the banks were
required to further strengthen their credit administration and control functions
to improve the quality of risk assets.
2.4.7 Cross Border Supervisory Activities
The CBN, under its cross border supervisory activities, hosted the following
events in 2018:
A study tour by staff of Bank of Uganda from May 21 - June 8, 2018.
The CBN provided the technical assistance (TA) in the area of Risk
Based AML/CFT examination procedures for financial institutions. The TA
2
DRAFT

Central Bank of Nigeria Annual Report—2018
65
was part of the CBN effort to increase supervisory collaboration and
cooperation in sub-Saharan Africa;
Seminar on “Risk Based Supervision’ held in Chelsea Hotel, Abuja from
May 7 - 11, 2018 on behalf of the Committee of Bank Supervisors of
Central and West Africa; and
Seminar on Basel II/III Implementation in Nigeria from May 14 -18, 2018.
Both seminars provided supervisors with the opportunity to analyse issues that
border on managing crises from systemically important financial institutions.
Issues on micro-prudential supervision, macro-prudential analysis, financial
stability and effective resolution of problem banks were also discussed.
The Bank also participated in the following meetings and engagements with
other regulatory authorities:
The 13th BCBS-FSI High Level Meeting for Africa on “Strengthening
Financial Sector Supervision and Current Regulatory Priorities” was held
in Cape Town, South Africa from January 25 - 26, 2018. Discussions at
the meeting were on the main supervisory challenges facing the sub-
Saharan region, including the risk posed by the reduction in the
number of correspondent banking relations. Other issues discussed
included: financial deepening and inclusion; issues related to cross-
border banking; non-performing loans; the role of state owned banks;
consolidation of the banking industry; and the need to increase
capacity building;
The Community of African Banking Supervisors Meeting in Cape Town
South Africa from June 25 - 26, 2018. The Meeting discussed issues of
proportionality in banking regulation and supervision and the
implications of expected credit loss provisioning for banks and
supervisors. Further discussions were held on the use of working groups
to ensure continued supervisory collaboration in sub-Sahara Africa;
2
DRAFT

Central Bank of Nigeria Annual Report—2018
66
The Meeting of the College of Supervisors of Standard Chartered Bank
in London, UK, held from July 19 - 20, 2018, to discuss issues on Cyber
Risk, Group Liquidity Culture and the Enterprise Wide Risk Framework;
The 4th Meeting of the College of Supervisors of Ecobank Transnational
Incorporated in Abidjan, Cote d’Ivoire held from October 29 - 30, 2018,
to review activities and risk profile of ETI (parent company of Ecobank
Nigeria Ltd); and
Four (4) meetings of the College of Supervisors for the West African
Monetary Zone (CSWAMZ) were held in 2018, hosted by the Bank of
Ghana in February, May, and November and by the Central Bank of
Nigeria in September. The following were some of the major issues
discussed: joint examination of Nigerian bank subsidiaries; the
implementation of RBS, Basel II/III and IFRS/IFRS 9; update on problem
bank subsidiaries; developments in cyber security in member states;
progress report by WAMI on the study on “Reduction in Correspondent
Banking Relationship in the West African Monetary Zone (WAMZ)”;
recent developments in AML/CFT compliance; and update on the
review of CSWAMZ Charter, among others.
2.4.8 Examination of Foreign Subsidiaries
The Bank conducted five (5) offshore joint examinations of Nigerian banks’
foreign subsidiaries in 2018. The CBN also conducted three (3) onsite maiden
risk focused examinations jointly with the Central Bank of The Gambia in a bid
to facilitate the latter’s transition to RBS under the subsisting MoU on
supervisory collaboration. Furthermore, as a special arrangement and to
follow up on the RBS training, the Bank of Sierra Leone invited the CBN for a
joint RBS examination as a capacity building initiative. The onsite examination
of a Nigerian bank subsidiary in Ghana was a follow up to a previous
examination. The examination report indicated that the risk profile of the
subsidiary remained moderate. The onsite examinations conducted in the
review year, were part of the continuing effort at ensuring supervisory
collaboration under the auspices of the WAMZ.
1
DRAFT

Central Bank of Nigeria Annual Report—2018
67
2.4.9 Foreign Exchange Monitoring/Examination
The Bank conducted a review of the foreign exchange activities of 26 banks
in April 2018 to ascertain compliance with extant laws and regulations. The
exercise covered foreign exchange activities for the period April 1, 2017 to
March 31, 2018. Major Infractions detected included: failure of Authorised
Dealers (ADs) to comply with regulations; non-repatriation of export proceeds
within regulated time; and dealing in high valued foreign exchange
transactions with corporate customers who were not on-boarded to the
FMDQ advised trading and surveillance system. There were also observed
instances of incorrect rendition of returns, non-compliance with approved
Net Foreign Currency Trading Positions, and varied foreign trade
documentation lapses. Appropriate penalties were imposed on the erring
banks, where applicable, in line with prevailing foreign exchange laws and
regulations. The Bank also conducted a review to ascertain compliance with
the CBN directive on the establishment of Foreign Exchange Teller-points in
bank branches across Nigeria. The review covered operations for the period
April 1, 2018 to September 30, 2018. The exercise revealed that there was a
high level of compliance by banks.
2.4.10 Domestic Systemically Important Banks
The CBN continued to subject the domestic systemically-important banks (D-
SIBs) to enhanced supervision in line with the regulatory and supervisory
framework for this category of banks. In the review period, seven (7) banks
maintained their status as D-SIBs, following the conclusion of the six-monthly
assessment. At end-December 2018, the DSIBs accounted for N22.39 trillion or
63.8 per cent of industry total assets of N35.10 trillion, N14.17 trillion or 65.4 per
cent of total industry deposits of N21.67 trillion and N7.90 trillion or 64.4 per
cent of industry gross loans of N12.27 trillion.
During the review period, Diamond Bank commenced merger arrangement
with Access Bank, which is expected to result in a single entity under the
Access Bank name. Also, the D-SIBs submitted their Recovery and Resolution
Plans (RRPs) in compliance with the D-SIB supervisory Framework and in line
with the “Minimum Content for Recovery Plans and Requirements for
2
1
DRAFT

Central Bank of Nigeria Annual Report—2018
68
Resolution Planning” guideline issued in November 2016, to ensure
standardisation of banks’ submissions. The purpose of the RRP is to serve as a
“playbook” for both the management of banks and the CBN in times of
financial stress.
2.4.11 Banking Sector Soundness
The health of the banks improved despite the challenging business
environment in 2018. The industry average capital adequacy ratio (CAR) rose
to 15.3 per cent at end-December 2018, compared with 10.28 per cent in
2017, and the 10.0 and 15.0 per cent benchmarks for banks with national,
international authorisation, respectively. The level of CAR was also above the
8.0 per cent stipulated minimum requirement for international banks under
the Basel capital accord. The increase was due, largely, to the increase in
total qualifying capital and decrease in risk weighted assets. Similarly, asset
quality, measured by the ratio of non-performing loans to industry total,
improved to 11.4 per cent at end-December 2018, from 14.8 per cent in
December 2017, although it was above the benchmark of 5.0 per cent. This
was attributed to sales and write-offs during the year. Consequently, banks
were required to intensify debt recovery, realise collateral for bad debts and
strengthen risk management. The average industry liquidity ratio (LR), at 51.7
per cent in 2018, was higher than 45.6 per cent in 2017 and above the
regulatory minimum of 30.0 per cent. One (1) bank did not meet the
minimum liquidity ratio at end-December 2018, compared with four (4) in the
preceding year.
2.4.12 Macro-prudential Surveillance and Regulation
The CBN sustained the conduct of top-down solvency and liquidity
assessment of the banking industry in the review period. Accordingly, the
Bank carried out banking industry stress tests on twenty one (21) commercial
and five (5) merchant banks to assess their resilience to systemic risks, while
the banks conducted bottom-up solvency and liquidity stress tests in line with
ICAAP provisions. In addition, the CBN continued the regular review of its
stress test model to enhance its analytical capabilities and efficiency, in line
with advancement in modelling processes.
2
DRAFT
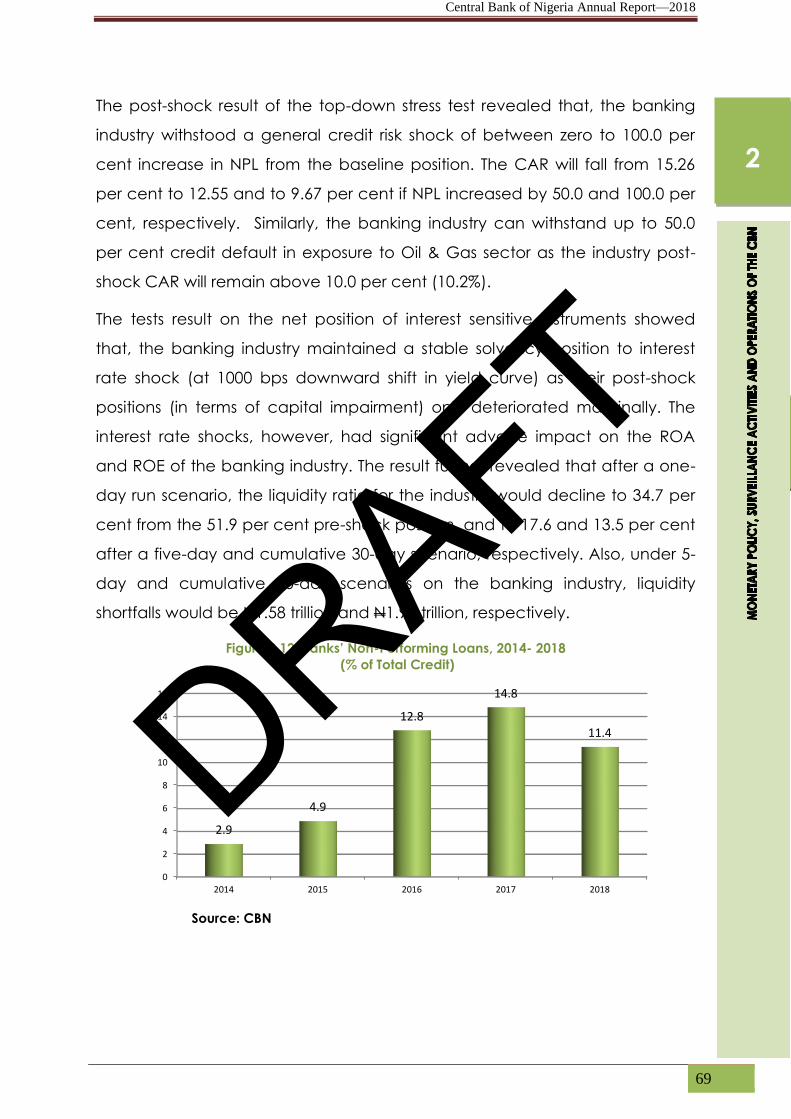
Central Bank of Nigeria Annual Report—2018
69
The post-shock result of the top-down stress test revealed that, the banking
industry withstood a general credit risk shock of between zero to 100.0 per
cent increase in NPL from the baseline position. The CAR will fall from 15.26
per cent to 12.55 and to 9.67 per cent if NPL increased by 50.0 and 100.0 per
cent, respectively. Similarly, the banking industry can withstand up to 50.0
per cent credit default in exposure to Oil & Gas sector as the industry post-
shock CAR will remain above 10.0 per cent (10.2%).
The tests result on the net position of interest sensitive instruments showed
that, the banking industry maintained a stable solvency position to interest
rate shock (at 1000 bps downward shift in yield curve) as their post-shock
positions (in terms of capital impairment) only deteriorated marginally. The
interest rate shocks, however, had significant adverse impact on the ROA
and ROE of the banking industry. The result further revealed that after a one-
day run scenario, the liquidity ratio for the industry would decline to 34.7 per
cent from the 51.9 per cent pre-shock position, and to 17.6 and 13.5 per cent
after a five-day and cumulative 30-day scenario, respectively. Also, under 5-
day and cumulative 30-day scenarios on the banking industry, liquidity
shortfalls would be N1.58 trillion and N1.98 trillion, respectively.
Figure 2.12: Banks’ Non-Performing Loans, 2014- 2018
(% of Total Credit)
Source: CBN
0
2
4
6
8
10
12
14
16
2014 2015 2016 2017 2018
2.9
4.9
12.8
14.8
11.4
2
2
DRAFT

Central Bank of Nigeria Annual Report—2018
70
2.4.13 Examination of Other Financial Institutions
The Bank conducted on-site examination of 902 OFIs in 2018, compared with
969, in the preceding year. The exercise involved routine risk-based
supervision of six (6) development finance institution (DFIs), 30 primary
mortgage banks (PMBs), 490 microfinance banks (MFBs) and 52 finance
companies (FCs). Target examination was also conducted on 224 MFBs and
100 BDCs in the review period.
The routine risk-based examination of six (6) of the seven (7) existing DFIs
revealed that the composite risk rating of four (4) of the institutions were
“High”, while one (1) was “Above Average” and one (1) was “Low”. Earnings
of three (3) institutions were rated “Acceptable”, and the remaining three (3)
were rated “Weak”, arising from significant deterioration in asset quality and
high provisions for loan losses. The capital ratings for one (1) of the institutions
was “Strong”; for two (2) “Acceptable”; while the remaining three (3) were
“Weak”. Similarly, prudential and soundness analysis of the DFIs revealed that
three (3) out of the five (5) retail DFIs met the minimum regulatory capital of
N10 billion. The Wholesale DFI and the Mortgage Refinancing Company also
met the regulatory minimum capital of N100 billion and N5.0 billion,
respectively. Three (3) of the DFIs had Capital Adequacy Ratio (CAR) above
the regulatory minimum of 10 per cent, while the remaining three (3)
institutions failed to satisfy the minimum CAR. Two (2) of the DFIs had all its
credit facilities performing, one (1) had 5.02 per cent, marginally above the
5.0 per cent regulatory threshold, while the remaining four (4) institutions had
non-performing loans ratio far above the regulatory threshold.
The routine and target examination of 714 MFBs revealed that the average
capital adequacy ratio of the sub-sector rose to 41.8 per cent in 2018, from
32.6 per cent in 2017. Similarly, average portfolio-at-risk increased to 23.1 per
cent at end-December 2018, from 21.2 per cent at end-December 2017,
indicating a deterioration in the quality of risk assets. Industry average return
on assets (ROA) declined to 1.2 per cent from 3.9 per cent at end-December
2017, while return on equity (ROE) increased to 16.5 per cent at end-
December 2018, compared with 7.6 per cent at end-December 2017. The
2
DRAFT

Central Bank of Nigeria Annual Report—2018
71
average liquidity ratio, which increased to 89.8 per cent at end-December
2017, declined to 82.8 per cent at end-December 2018.
Other highlights of the examination reports were:
546 MFBs met the required minimum liquidity ratio of 20.0 per cent;
573 MFBs met the required minimum capital adequacy ratio of 10.0 per
cent; and
180 MFBs satisfied the 5.0 per cent stipulated maximum portfolio-at-risk
(PAR).
Some of the regulatory interventions to address the challenges included:
Stipulated deadlines for the recovery of non-performing insider-related
credit;
Directives for the injection of additional fresh capital;
Interim prohibition on opening of new branches; and
Enhanced supervision in addition to the implementation of the Bank’s
zero tolerance for infractions through a stiff sanction regime to instill
market discipline.
The industry average CAR and LR were well above the regulatory minimum of
10.0 and 20.0 per cent, respectively. As the economy continues to improve,
the ROA and LR are likely to improve on account of expected reduction in
portfolio-at-risk (PAR) due to improved loan repayments.
The composite risk ratings of the 30 PMBs, examined in the review year, were
“High” for sixteen (16), “Above Average” for seven (7) and “Moderate” for
seven (7). The average CAR of the sub-sector increased from 34.1 per cent in
2017 to 41.0 per cent at end-December 2018. With the exception of one (1),
all PMBs met the minimum CAR of 10.0 per cent. The asset quality of the
industry deteriorated as the average non-performing loan ratio weakened
from 34.8 per cent in 2017 to 59.6 per cent in 2018. Similarly, the sub-sector
recorded a decline in the average liquidity ratio from 47.2 per cent in 2017 to
38.0 per cent at end-December 2018. The industry average ROA fell to 0.09
per cent at end-December 2018, from 0.15 per cent in 2017, while the ROE
2
DRAFT
Central Bank of Nigeria Annual Report—2018
72
rose to 0.46 per cent at end-December 2018, compared with 0.14 per cent in
2017.
Routine examination of 52 finance companies (FCs) was conducted in 2018.
The examination reports were being analysed to determine the Composite
Risk Rating of the institutions with a view to ascertaining the safety and
soundness of the sub-sector with regard to the quality of assets and capital.
The Bank conducted on-site examination of 100 BDCs during the review
period. The examination revealed that many of the BDCs exhibited lapses
that included:
Failure to maintain basic accounting records for the preparation of
financial statements, purchases and sales of foreign exchange;
Non-submission of Annual Audited Accounts to the CBN;
Poor AML/CFT compliance;
Non-rendition of periodic returns by the BDCs;
Relocation of business address without CBN’s prior approval; and
Use of the same international passport number and visa by two or more
customers.
Various sanctions and monetary penalties were imposed on the errant BDCs
for sundry infractions.
During the review period, the Nigeria Financial Intelligence Unit (NFIU)
conducted spot check on selected BDCs to ascertain compliance with the
AML/CFT Law. The CBN held meetings with the Association of Bureaux-de-
Change Operators of Nigeria (ABCON) to discuss issues and challenges
highlighted in the NFIU report. The NFIU became an independent agency
during the review period.
2.4.14 Financial Literacy and Education
In the review year, the Bank sustained the implementation of various
initiatives and coordination of stakeholders’ activities to promote financial
literacy and inclusion in Nigeria. In this regard, the CBN developed and
distributed 62,000 copies of consumer financial education materials across
various segments of the Nigerian population. The materials were distributed to
2
DRAFT

Central Bank of Nigeria Annual Report—2018
73
consumers through six (6) branches of the Bank namely, Awka, Bauchi, Yola,
Ibadan, Calabar and Port Harcourt. Also, the Bank delivered education
materials for the Financial Inclusion State Steering Committee (FISSCO)
awareness campaign organised by Financial Inclusion Secretariat at Uyo,
Akwa Ibom State.
In addition, the Bank coordinated the commemoration of the 2018 Global
Money Week (GMW) with the theme “Money Matters, Matter”. The school
mentoring programme was held on March 15, 2018 in the following states:
Akwa Ibom; Ebonyi; Kogi; Jigawa; Osun; Taraba; and the Federal Capital
Territory, Abuja, which directly imparted a total number of 729 students/
school children from eight (8) public schools. Similarly, the Bank collaborated
with the Bankers’ Committee sub-committee on financial literacy and public
enlightenment to implement the school mentoring programme in the 36
states and the FCT. A total number of 523 schools were visited nationwide
and 74,168 students (35,268 Male and 38,900 Female) benefited. As a fallout
of the event, 4,867 new bank accounts were opened on behalf of the
students.
Furthermore, the Bank in collaboration with stakeholders, joined with the rest
of the world to commemorate the 2018 World Savings Day (WSD)
celebrations on October 31, 2018. The essence of the WSD is to create
awareness on the importance of savings for individuals and the economies.
Nigeria has been a part of this global movement through a mentoring
programme for the young population both within and outside the formal
educational system. The mentoring programme for the young population
event is used to sensitise the targeted groups on the importance of savings,
investment, creating employment as well as entrepreneurship for personal
and national development. To commemorate the event, a mentoring
programme was conducted in 12 secondary schools from 12 states across
the six (6) geopolitical zones. A total number of 960 students directly
benefitted from the programme. The Bankers’ Committee also conducted
the mentoring program in secondary schools nationwide, where 57,084
students benefitted.
2
DRAFT

Central Bank of Nigeria Annual Report—2018
74
In furtherance of the Bank’s activities to promote financial literacy, the Bank
under the auspices of the Nigeria Educational Research and Development
Council (NERDC), conducted a training/workshop for some selected basic
and secondary school teachers. The purpose of the training was to expose
the teachers to the implementation of the pilot phase to the Financial
Education Curriculum (FEC) and the Teacher’s Guide. The training took place
in two locations, namely, Lagos from June 25 - 26, 2018 and Katsina from July
4 - 5, 2018. Two workshops on planning and writing, critique and editorial
were held from September 24 - 29, 2018 to develop instruments that would be
administered during the pilot testing of the FEC. The Pilot Testing Instruments
would be used to assess the effectiveness of the FEC, and the Teachers
Guide feedback from the teachers and students/pupils.
The Bank conducted trainings under the Targeted Financial Education
Programme for Micro, Small, and Medium Enterprises (MSMEs) and Farmers in
four (4) States, namely, Delta, Ebonyi, Niger and Osun States from February 12
- 16, 2018. A total of 136 participants, drawn from different groups in the
states, were trained as trainers (ToT). Similarly, training was conducted for staff
of the Federal Ministry of Women Affairs & Social Development in FCT, Abuja
from July 30 - August 3, 2018 with a total of 25 participants trained as trainers
during the programme. The ToT programme held from March 13 - 17, 2018
was conducted at the instance of the International Institute of Islamic
Banking and Finance (IIIBF) in collaboration with the Centre for Gender
Studies, Bayero University, Kano. A total of 35 participants were trained as
master trainers, including academic staff from various relevant Departments
and students.
Also, the Bank and the German Development Corporation (GIZ) hosted
participants from the Federal Ministry of Youth and Sports Development
(FMYSD) and the National Youth Service Corps (NYSC) at a workshop to
review and evaluate the content and strategy of the National Peer Group
Educator Programme (NAPGEP). The NAPGEP initiative is a collaborative
effort between CBN, FMYSD and other stakeholders to drive financial literacy
to the grassroots by leveraging on the NYSC programme. The implementation
2
1
DRAFT

Central Bank of Nigeria Annual Report—2018
75
strategy for this Initiative was being reviewed to reflect the outcome of the
workshop.
To deepen consumers’ financial education, the Bank intensified nationwide
sensitisation programme tagged “CBN Fair” held at various times in Bauchi,
Delta, Gombe, Imo, Kaduna, Katsina, Kebbi, Ondo, Oyo, and Sokoto States.
The critical components of the CBN Fair were creating awareness to
consumers/participants on the financial literacy and consumer protection
programmes of the Bank. Consumers were educated on their rights and
responsibilities in dealing with financial institutions, the channels available to
them for resolving issues and how to lodge complaints, among others.
The Bank participated in a workshop organised by the GIZ for members of the
Financial Literacy Working Group (FLWG) and other stakeholders to develop
modalities for the deployment of an e-learning platform. The platform is
expected to serve as an avenue where consumers can access financial
education either as trainers or end beneficiaries. Participants at the workshop
included financial services providers, banks, development partners and other
regulators in the financial system. The Bank and the GIZ also hosted other
stakeholders at a content review session during which various financial
education materials were reviewed in preparation for the development of
the e-learning platform.
Other financial literacy activities involving the Bank included:
Participation at the 11th Annual Banking & Finance Conference of the
Chartered Institute of Bankers’ of Nigeria (CIBN);
Presentation of the paper titled “Financial Inclusion through Credit
Reporting: Role of the Banking Supervision Department” at a
workshop/training on credit bureau supervision;
Presentation of the paper titled “Consumer Protection and Financial
Literacy” at a knowledge exchange programme of the West African
Economic Monetary Union (WAEMU);
Participation at a seminar organised by the Chartered Institute of Bankers
(CIBN), the National Judicial Institute (NJI) and other stakeholders
2
DRAFT

Central Bank of Nigeria Annual Report—2018
76
convening the 18th edition of the annual seminar for judges on banking
and allied matters; and
Participation at the Financial Inclusion Working Groups and Technical
Committee meetings from November 14 - 15, 2018.
2.4.15 Consumer Protection
The Bank commenced the development of the implementation guideline on
nine (9) principles of the Consumer Protection Framework in the review year.
Consequently, three (3) sets of guidelines were developed, namely:
“Complaints Handling & Redress”; “Guidelines on Fair Treatment of
Consumers”; and “Disclosure and Transparency”.
To ensure compliance by banks with consumer protection regulations,
particularly the provisions of the Guide to Bank Charges (GBC), compliance
examination was conducted in April 2018 on twenty one (21) banks covering
the period October 2017 to March 2018. In addition to compliance with
directives issued after previous examinations and resolution of outstanding
complaints, which are generic areas, the April 2018 examination focused on
the following major areas, observed to pose greater risk to consumers:
Outward Telegraphic/Swift and Related Charges;
SMS Notification Charges;
Current Account Maintenance Fee Charged on Savings Account; and
Compliance with Interest Rate Contained in the Offer Letter.
Overall, compliance levels in the aforementioned examination areas were for
directives issued after previous examinations (90.0%), the resolution of
outstanding complaints (22.6%), outward telegraphic Transfer Fees and
Related Charges (100.0%), SMS notification charges (52.4%), application of
account maintenance fees on savings account (100.0%), and compliance
with interest rates disclosed in loan offer letters (95.3%).
The number of complaints received from consumers against financial
institutions rose by 702 or 29.9 per cent, from 2,349 in 2017 to 3,051 in 2018. Of
this number, complaints against banks and other financial institutions (OFIs)
accounted for 3,032 (99.4%) and 19 (0.6%), respectively, compared with 97.2
2
DRAFT

Central Bank of Nigeria Annual Report—2018
77
per cent and 2.8 per cent in 2017. The complaints included ATM dispense
errors, excess charges, account management issues, card related and
international trade/ guarantees.
Following mediation meetings and other measures by the Bank to resolving
the complaints, 6,219 cases were resolved and closed in 2018, indicating an
increase of 3,709 or 147.8 per cent, compared with 2,510 in 2017.
Accordingly, refunds based on resolved complaints amounted to N28.44
billion, US$1.93 million, €32.82 and £2,889.98 in 2018, compared with N5.98
billion, US$2.55 million and €6,940.00 in 2017. Refunds based on directives and
recommendations from compliance examination was N9.88 billion, US$1.84
million, €26,319.44 and £2,889.98 in 2018, compared with N7.86 billion in 2017.
Also, the Bank imposed sanctions, on 10 banks for failure to comply with
specific regulatory directives in 2018, compared with 7 banks in 2017.
Figure 2.13: Consumer Complaints by Category, 2018
Source: CBN
2.5 DEVELOPMENTAL FUNCTIONS OF THE CBN
The Bank sustained its developmental activities, in response to increasing
demand for economic diversification and sustainable development in 2018.
To improve the flow of affordable credit to the real sector and stimulate
growth, it introduced new interventions while sustaining the implementation
of existing initiatives. The interventions were expected to create new jobs,
facilitate the development of micro, small and medium enterprises (MSMEs),
and promote financial inclusion.
381
528
21
123
383
502
12
136
21
141
26
324
413
40
0
100
200
300
400
500
600
ATM
Cas
hDispen
se…
Frau
d
Bo
nd
s,Guaran
tees…
Loan
s
Fun
ds
Tran
sfer/Re…
Exce
ssC
har
ges
Staf
f M
atte
rs
Oth
ers
Inte
rnat
ion
alTr
ade Car
ds
Ten
ure
dIn
vest
men
t
Acc
ou
nt
Man
age
me
nt
E-C
han
nel
s
Un
auth
ori
zed
Ch
arge
s
Nu
mb
er
2
DRAFT

Central Bank of Nigeria Annual Report—2018
78
2.5.1 The Agricultural Credit Guarantee Scheme (ACGS)
A total of 30,612 loans, amounting to N4.38 billion, were guaranteed in 2018,
compared with 41,341 loans, valued at N5.85 billion in 2017. This represented
25.9 per cent and 25.2 per cent decrease in volume and value of loans
guaranteed, respectively. A breakdown of the guaranteed loans showed
that 30,594 loans (99.9%), valued at N4.36 billion (99.7%), were granted by
microfinance banks (MFBs) and 18 loans (0.1%), valued at N0.02 billion (0.3%),
were granted by commercial banks.
Further breakdown of volume of loans guaranteed by category of borrowers
showed that 29,796 loans (97.3%) were granted to individuals; 345 loans
(1.1%) to self-help or informal groups; 447 loans (1.5%) to cooperatives; and 24
loans (0.1%) to companies. In value terms, the distribution of loans
guaranteed showed that N4.26 billion (97.4%) was granted to individuals;
N470.0 million (1.1%) to self-help groups; N470.0 million (1.1%) to cooperatives;
and N16.0 million (0.4%) to companies.
The distribution of loans guaranteed by purpose indicated that food crops
dominated with 18,233 loans (59.6%), followed by mixed farming, 5,647 loans
(18.4%); cash crop, 2,689 loans (8.8%); livestock, 2,484 loans (8.1%); fisheries,
1,099 loans (3.6%); and others, 460 loans (1.5%). In terms of value of loans
guaranteed, food crops accounted for N2.42 billion (55.3%); livestock, N0.63
billion (14.4%); mixed farming, N0.49 billion (11.2%); cash crop, N0.45 billion
(10.5%); fisheries, N0.30 billion (6.8%); and others; N0.08 billion (1.8%)
2
DRAFT

Central Bank of Nigeria Annual Report—2018
79
Figure 2.14: Volume and Value of Loans Guaranteed by Purpose under the ACGS, 2018
(Per cent)
Source: CBN
Cumulatively, the volume and value of loans guaranteed, under the
Scheme, since inception in 1977 to end-December 2018 stood at 1,313,180
and N114.24 billion, respectively.
The number of loans fully repaid in the review year was 30,372, valued at
N5.48 billion. This represented 26.1 and 8.0 per cent decrease in volume and
value of loans fully repaid, respectively, compared with 41,075 loans, valued
at N5.95 billion, in 2017.
A breakdown of volume of loans fully repaid by state indicated that Sokoto
State had the highest with 1,987, followed by Kwara and Bauchi States with
1,906 and 1,823, respectively. The distribution of loans fully repaid showed
that the largest amount was recorded in the following states: Nasarawa
(N519.00 million), Osun (N407.00 million) and Bauchi (N349.00 million).
Total, repayments under the ACGS stood at N86.94 billion for 889,268 loans,
since inception to end-December 2018.
The total value of default claims settled in 2018 was N7.17 million, in respect of
373 loans. This brought the cumulative claims settled since inception in 1977
to end-December 2018 to 17,757, valued at N652.29 million.
2.5.2 The Interest Drawback Programme (IDP)
Livestock 8.1%
Fisheries 3.6%
Mixed Farming 18.4%
Food Crops 59.6%
Cash Crops 8.8%
Others 1.5%
Volume
Livestock 13% Fisheries
6.9%
Mixed Farming 11.2%
Food Crops 55.3%
Cash Crops 10.4%
Others 1.8%
Value (N'billion)
2
DRAFT

Central Bank of Nigeria Annual Report—2018
80
A total of 14,811 Interest Drawback Programme (IDP) claims, valued at
N196.74 million, were settled in the review year, compared with 22,035,
valued at N199.15 million, in 2017. This represented a decline of 11.9 and 25.1
per cent in volume and value, respectively, below the levels in 2017.
Cumulatively, 351,540 IDP claims, valued at N3.11 billion, had been settled
since inception of the Programme in 2003.
2.5.3 Anchor Borrowers’ Programme (ABP)
The sum of N118.96 billion was disbursed in 2018, through 19 participating
financial institutions (PFIs), to 646,213 smallholder farmers, who cultivated
640,422 hectares of land. The farmers were represented by 194 anchors in the
36 states and FCT. The Northern part of the country had 581,336 beneficiaries,
who cultivated rice, maize and sorghum, while in the South, 64,877 farmers
participated in the production of fish, oil palm, poultry and cassava.
Participating financial institutions, under the Programme, increased to 19 in
2018, compared with 17 in 2017.
The number of commodities financed under the ABP also increased to 16 in
2018 from 9 in 2017. The new commodities were castor seed, cocoa, ginger,
oil palm, sesame seed, tomato and cattle fattening. Fifty-four (54) anchor
companies expressed interest to participate in the 2018/2019 dry season
farming under the Programme at end-December 2018.
From inception in 2015 to end-December 2018, a cumulative sum of N174.48
billion had been disbursed, under the Programme, to finance 902,518 farmers.
In addition, 2,807,775 and 8,423,325 direct and indirect jobs, respectively, had
been created under the ABP.
2
DRAFT

Central Bank of Nigeria Annual Report—2018
81
Table 2.7: Funds Disbursement under the ABP by Anchor (2015 – 2018)
Anchors Number of
Anchors
Number of
Farmers
Number of
Hectares
Total Disbursements (N’
Billion)
State
Governments 14 184,354 197,817 39.77
Private 177 239,299 310,117 56.97
Commodity
Associations 3 478,865 427,991 77.74
TOTAL 194 902,518 935,925 174.48
Source: CBN
Total repayment stood at N3.39 billion at end-December, 2018, bringing the
cumulative repayment of N21.41 billion, since inception of the Programme in
2015.
2.5.4 Commercial Agriculture Credit Scheme (CACS)
The sum of N79.71 billion was released to 12 banks, in respect of 40 projects, in
the review year. This comprised 35 private projects, valued at N57.12 billion,
and 5 state government-sponsored projects, valued at N22.60 billion. Thus,
indicating 23.1 and 31.7 per cent decrease in the volume and value of loans
disbursed, respectively, compared with N116.75 billion released to 52 projects
in 2017.
Analysis of funds released under CACS by value chain activity in 2018 showed
that production, processing, input supplies and storage accounted for 45.1,
31.1, 12.5 and 11.3 per cent, respectively. There were no applications for
funding from the marketing segment of the value chain in the review year.
Table 2.8: Funds Disbursement under CACS by Value Chain Activity (2018)
Category Number Percentage Value
(N ’billion)
Percentage
Production 18 45.0 35.97 45.1
Processing 16 40.0 24.74 31.1
Marketing 0 0.0 0.00 0.0
Storage 3 7.5 9.00 11.3
Input Supplies 3 7.5 10.00 12.5
Total 40 100.00 79.71 100.00
Source: CBN
2
DRAFT
Central Bank of Nigeria Annual Report—2018
82
From inception in 2009 to end-December 2018, the sum of N603.29 billion had
been disbursed to 589 projects, under the Scheme, as follows: N273.35 billion
for 315 projects from the CACS Receivables Account; and N329.94 billion for
274 projects from the CACS Repayment Account.
Repayments amounting to N54.69 billion were received from 17 banks in the
review year, compared with N48.61 billion from 17 banks in 2017. The
repayments in 2018 showed an increase of 12.5 per cent, above the level in
2017. Cumulative repayments, since inception of the Scheme in 2009 to end-
December 2018, stood at N328.31 billion for 547 projects, representing steady
repayments for 263 projects and full repayments for 284 projects.
During the year, the CACS Guidelines were amended to include a non-
interest window, which aimed at facilitating the participation of Non-Interest
Financial Institutions (NIFIs) under the Scheme. The amended CACS
Guidelines became operational on February 16, 2018 and two (2) projects
(Tiamim Rice Limited and Alhamsad Rice Limited), valued at N2.0 billion, were
financed through the Jaiz Bank Plc, under the non-interest window.
2.5.4.1 The Paddy Aggregation Scheme (PAS)
The Paddy Aggregation Scheme (PAS) was approved in 2017, as a working
capital facility under CACS, for integrated rice millers. Disbursements under
the first phase of the PAS were concluded in November 2018, with the sum of
N30.40 billion released to 4 banks to finance 8 integrated rice millers in the
review year.
The second phase of the PAS was approved in November 2018, with the
sum of N53.00 billion to six (6) large integrated rice millers for a tenor of 24
months and interest rate of 5.0 per cent. The modalities for the
implementation of the Rice Distributors Facility (RDF) initiative, under the
PAS, were also approved to enable medium- and large-scale rice
distributors purchase locally milled rice from integrated rice millers across
the country.
2
DRAFT

Central Bank of Nigeria Annual Report—2018
83
The sum of N14.00 billion was disbursed to two (2) lending banks (First Bank &
Zenith Bank), in respect of two (2) integrated rice millers (Wacot Rice &
Hillcrest Agro Allied Industries), under the PAS Phase 2 in 2018.
2.5.5 The Agri-Business/Small and Medium Enterprises Investment Scheme
(AGSMEIS)
At end-December 2018, the sum of ₦33.94 billion was received from 23
banks, compared with ₦26.86 billion from 21 banks at end-December 2017.
Cumulatively, the sum of ₦60.80 billion had been aggregated under the
Scheme for on-lending to MSMEs across the country. The sum of ₦414.93
million was disbursed to 509 beneficiaries, through 14 banks, in 2018. This
comprised ₦205.97 million for equipment acquisition and ₦208.96 million for
working capital.
2.5.6 The Accelerated Agriculture Development Scheme (AADS)
The Bank launched the Accelerated Agricultural Development Scheme
(AADS) in October 2017, with an annual target of engaging at least 370,000
youth farmers across the agricultural value chain. The Scheme provides credit
at 9.0 per cent per annum, with maximum tenor of five years, depending on
the gestation period of the enterprise.
As part of their contribution, the state governments are to provide logistic
support such as land development, infrastructure and services, including
farmer training and extension. Under the Scheme, there is a window for state
governments to access funds for land development, provided they expressed
acceptable level of commitment by initiating a pilot model of the Scheme in
their respective states, with at least 1,000 farmers.
2.5.7 The Non-Oil Export Stimulation Facility and the Export Development
Facility (EDF)
The Non-Oil Exports Stimulation Facility (NESF) was sustained in 2018. The
Facility was introduced to deepen the non-oil sector by facilitating access to
affordable financing by export-oriented firms and reposition the sector for
greater competitiveness and foreign exchange earnings. The sum of ₦25.4
billion was disbursed, under the NESF, in 2018, to eight (8) obligors who
2
DRAFT

Central Bank of Nigeria Annual Report—2018
84
exported agricultural commodities such as cashew, sesame seeds, among
others.
The Export Development Facility (EDF), managed by the Nigerian Export and
Import Bank (NEXIM), had the objective of financing State Export
Development Initiatives in the 36 states and FCT; promoting value chain
development in shea, cashew and jute/kenaf; encouraging women and
youth participation across the value chains; and supporting projects of
national economic importance and proven export potentials that require
loan restructuring. Under the EDF, the sum of ₦10.18 billion was disbursed to 17
projects engaged in agriculture, manufacturing and solid minerals during the
review year.
2.5.8 The Micro, Small and Medium Enterprises Development Fund (MSMEDF)
A total of N6.37 billion was disbursed under the wholesale funding and
grant components of the Micro, Small and Medium Enterprises
Development Fund (MSMEDF). This represented an increase of N2.11
billion or 49.5 per cent, compared with N4.26 billion disbursed in 2017.
An analysis of disbursements under the wholesale component indicated
that N4.50 billion (70.6%) was disbursed to state government;
microfinance banks, N1.15 billion (18.1%); Non-Governmental
Organisation – Microfinance Institutions (NGO-MFIs), N93.00 million (1.4%);
banks, N57.00 million (0.9%); while financial cooperatives accessed no
funds in the review year. The sum of N570.00 million or 9.0 per cent of
disbursements in 2018, was released as grants, compared with N101.00
million in 2017.
The cumulative disbursement to MSMEs from inception, in 2013, to 2018
was N83.36 billion, comprising N57.62 billion (69.1%) through state
governments; commercial banks, N12.67 billion (15.2%) and microfinance
banks, N11.35 billion (13.6%). Others were NGO-MFIs, N0.59 billion (0.7%),
cooperatives, N0.42 billion (0.5%), and development finance institutions
(DFIs), N10.00 million (0.01%); while grants accounted for N0.70 billion
(0.9%).
2
DRAFT

Central Bank of Nigeria Annual Report—2018
85
The sum of N5.83 billion was repaid in 2018, representing a decrease of 41.2
per cent below the N8.23 billion repaid in 2017. Cumulative repayment,
under the intervention since inception, stood at N19.21 billion at end-
December 2018.
Table 2.9: Funds Uptake and Repayment under the MSMEDF (2014-2018)
CLASS DISBURSEMENT (N billion) REPAYMENT (N billion)
State governments 57.62 7.32
DMBs 12.67 6.01
MFBs 11.35 5.35
DFIs 0.01 0.00
Coop 0.42 0.17
NGO-MFIs 0.59 0.36
GRANT 0.70 N/A
TOTAL 83.36 19.21
Source: CBN
2.5.9 The Nigeria Electricity Market Stabilisation Facility (NEMSF)
The sum of N62.88 billion was disbursed to 37 projects in the power sector in
2018, under the Nigeria Electricity Market Stabilisation Facility (NEMSF). This
brought the cumulative disbursement since inception in 2014 to N183.09
billion.
Table 2.10: Funds Uptake under the NEMSF (2017 – 2018)
Description
January -
December (2017)
January -
December (2018)
Total (from
inception)
DisCos No of Beneficiaries 1 7
Amount (N billion) 0.11 0.16 49.88
GenCos No of Beneficiaries 1 18
Amount (N billion) 5.23 32.04 86.33
GasCos No of Beneficiaries 1 6
Amount (N billion) 0.13 12.58 28.31
Service No of beneficiaries 0 6
2
DRAFT

Central Bank of Nigeria Annual Report—2018
86
Source: CBN Note: DisCos - Electricity Distribution Companies
GenCos - Electricity Generating Companies
GasCos - Gas Supplying Companies
The total of N14.89 billion was repaid by 11 DisCos during the review year,
bringing the cumulative repayment since inception to N30.46 billion. The
achievements under the facility included:
1. Significant capital expenditure (Capex) in the industry, leading to
recovery of generating capacity of more than 1200MW in both hydro and
thermal plants through the overhaul of turbines.
Execution of capacity recovery programme was carried out in three
hydro power stations as follows: Intake under water repair project,
overhaul of Unit 4 and compliant metering/supplementary
protection at Shiroro Dam; overhaul of 2G6 at Jebba Hydro; and
rehabilitation of 3 units at Kainji Dam.
Rehabilitation of 10 gas turbines at major thermal power plants,
including Geregu, Transcorp Ughelli, and Ibom Power Plants
2. Enabling Electricity Distribution Companies (DisCos) to carry out
projected Capex, through issuance of letters of credit (LCs) for the
purchase of over 704,928 meters (Maximum Demand, 3-phase and
Single phase Smart meters); Rehabilitation of over 332 kms of 11KV lines
and 130km of 0.45KV lines; 511 transformers purchased and installed;
and construction of 56 new distribution sub-stations and acquisition of 1
mobile injection sub-station.
2.5.10 Power and Airline Intervention Fund (PAIF)
The sum of N21.99 billion was released to the Bank of Industry (BOI) for five
power projects under the Power and Airline Intervention Facility (PAIF). These
were: the Kano Hydro Power Project (N3.01 billion); Ashaka Cement Limited
(N6.75 billion and N3.25 billion); Azura Power Project (N4.93 billion); and Para
Energy and Natural Resources Development Limited (N4.05 billion).
Providers Amount (N billion) 0.00 18.10 18.564
Total (N billion) 5.47 62.88 183.09
2
DRAFT

Central Bank of Nigeria Annual Report—2018
87
By end-December 2018, the cumulative amount released to the Bank of
Industry (BOI), under the intervention, stood at N301.37 billion, out of which
N180.61 billion was disbursed for 45 power projects and N120.76 billion to 24
airline projects.
Repayments in the review year stood at N25.69 billion, comprised N10.19
billion from airline projects and N15.50 billion from power projects. Cumulative
repayment from inception in 2010 was N145.52 billion: comprising N71.13
billion for airline and N74.39 billion for power projects.
By end-December 2018, the achievements of PAIF included:
Power
A total of 1,398.8 MW of power was financed under the Scheme.
Industries Serviced: Fast Moving Consumer Goods (4.4%); Steel
Production (10.4%); Cement (27.9%); packaging (12.0%); Agro Allied
(0.7%); Independent Power Projects (41.9%); and wood products
(2.0%);
The Fund also financed the construction of 120 – kilometre natural gas
pipeline from Ikpe Anang in Akwa –Ibom State to Mfamosing in Cross
River State;
Created a cash flow for recurrent expenditure through the interest
differential brought about by the average interest rate gap of over 11
per cent (average lending rate of 18 per cent to a maximum ceiling of
9 per cent);
Provided seed capital that leveraged additional private sector
investments into the Nigerian power sector with the private-sector
investors providing 30 per cent of the project cost, while the initiative
provided the remaining 70 per cent; and
Provided long-term facilities to banks with tenor up to 15 years, suitable
for financing infrastructure projects.
2
DRAFT

Central Bank of Nigeria Annual Report—2018
88
2.5.11 The Nigeria Bulk Electricity Trading-Payment Assurance Facility (NBET-
PAF)
The Federal Government introduced the N701 billion Payment Assurance
Facility for the Nigeria Bulk Electricity Trading (NBET) Plc., as a bridging facility.
Through this Facility, NBET-PAF provides a minimum level of payment to
GenCos to enable them meet their obligations to gas suppliers (GasCos). The
aim of the facility is to support increase in the level of power generation in the
country.
A total of ₦424.49 billion was paid for invoices in the review year. This
comprised N183.17 billion paid to GasCos; GenCos, N234.59 billion;
equipment suppliers, N132.33 million; and withholding tax, N6.60 billion.
Cumulatively, the sum of N534.18 billion had been paid, under the
intervention, since its inception.
2.5.12 The Small and Medium Enterprises Refinancing and Restructuring
Facility (SMERRF) and the Real Sector Support Facility (RSSF)
The Small and Medium Enterprises Refinancing and Restructuring Facility
(SME-RRF) was discontinued in 2014, and replaced with the Real Sector
Support Facility (RSSF), with a different strategic focus.
Cumulatively, the sum of N381.99 billion was disbursed to 604 projects, under
the SME-RRF, since inception to end-December 2014, when the Facility was
discontinued. Repayments, under the Facility, stood at N25.20 billion in 2018,
which was N1.69 billion or 6.3 per cent below the N26.89 billion repaid in 2017.
This brought the total amount repaid, since its inception to end-December
2018, to N105.34 billion.
The Scheme had sustained the operations of 604 companies, 340 were in
operation before benefitting from the Facility, while the remaining 264
obligors accessed the Facility to complete/ resuscitate their projects.
2
DRAFT

Central Bank of Nigeria Annual Report—2018
89
Table 2.12: Sectoral Distribution of Loans under SME-RRF
S/N Sector Number of
projects
Value (N’ billion)
1 Agro allied 69 22.92
2 Chemicals & Plastics 156 147.00
3 Engineering & Construction 92 56.81
4 Food & Beverages 102 72.55
5 Hotel & Tourism 2 0.53
6 Information and Communication
Technology (ICT)
20 14.12
7 Oil & Gas 21 8.23
8 Paper & Allied Products 57 26.17
9 Pharmaceuticals 37 11.61
10 Solid Minerals 18 6.90
11 Textile & Leather 18 8.52
12 Transportation 12 6.63
TOTAL 604 381.99
Source: CBN
The Real Sector Support Facility (RSSF) was established in November 2014 to
provide a long-term, low-interest financing solution to Nigerian SMEs with
financing needs of up to a maximum of N10.0 billion. The objective of the
Facility was to close the short-term and high-interest financing gap for SME/
manufacturing and start-ups, as well as, create jobs through the real sector of
the Nigerian economy.
The sum of N63.50 billion was disbursed to 10 projects under the RSSF in the
review year. Cumulatively, the sum of N115.51 billion had been disbursed to
23 projects since its inception to end-December 2018. Repayments under the
Facility, which started in 2017, stood at N6.64 billion.
As a window under the RSSF, guidelines on the modalities for accessing funds
through the Differentiated Cash Reserve Requirement (DCRR) and Corporate
Bonds (CBs) options were released in August 2018. Under the RSSF-DCRR
window, the sum of N6.16 billion was disbursed to 4 projects in the review
year.
2
DRAFT

Central Bank of Nigeria Annual Report—2018
90
2.5.12.1 The National Food Security Programme (NFSP)
The Bank approved the National Food Security Programme (NFSP) as a
special funding window under the RSSF in November 2016, to encourage the
commercial or large-scale production and processing of grains such as rice,
maize, sorghum and millet. This was designed to support the Federal
Government’s Strategic Grain Reserves and boost national food security.
There was no disbursement, under the Programme, in 2018. Thus, the
cumulative disbursement from inception to end-December 2018 remained at
N38.96 billion. Also, all the facilities are still under moratorium.
2.5.12.2 The Presidential Fertilizer Initiative (PFI)
In the review year, the Bank released N25.00 billion to fertilizer blending plants
for the procurement of raw materials, under the initiative. The facilities were
disbursed from the RSSF and are under moratorium. In addition, 65,000MT
(over 1.3 million 50kg bags) were blended in the 2018 farming season, and
over 20,000 direct and indirect jobs created at the blending plants and
across the value chain.
2.5.13 The Textile Sector Intervention Facility (TSIF)
Under the Textile Sector Intervention Facility (TSIF), managed by the Bank of
Industry (BOI), the sum of N30.38 billion was disbursed to 2 obligors in 2018,
compared with N11.47 billion disbursed to 20 obligors in 2017. Cumulatively,
the sum of N55.77 billion had been disbursed to 33 obligors since the
inception of the Facility.
2.5.14 The National Collateral Registry (NCR)
At end-December 2018, 456 financial institutions, comprising 411
microfinance banks, 34 finance companies and 11 non-bank financial
institutions were registered on the NCR portal. This brought the cumulative
number of financial institutions registered to 628, comprising 21 commercial
banks, 551 microfinance banks, 4 merchant banks, 4 development finance
institutions, 1 specialised (non-interest) bank, 34 finance companies and 13
non-bank financial institutions.
2
DRAFT

Central Bank of Nigeria Annual Report—2018
91
Of this number, 70 financial institutions registered their priority interests in
movable assets pledged by 51,258 borrowers, valued at N718.00 billion,
US$1.10 billion and €23,000, through 17,042 financing statements. The naira
value of financing statement in 2018 was 47.4 per cent higher than the
corresponding value of N487.30 billion in 2017. Similarly, the value of the US
dollar registered was significantly above than the corresponding value of
US$20.00 million in 2017.
Table 2.13: Number and Value of Financing Statements at end-December 2018
Debtor type Number of financing
statements
Currency Value of financing statements
(N ‘million)
2018 Cumulative 2018 Cumulative
Individual 46,973 146,778 NGN 91,874.27 129,981.96
USD 0.64 0.64
Large Business 283 687 NGN 576,322.67 843,168.21
USD 1,118.50 1,138.50
EUR Nil 6.06
Medium Business 438 2,169 NGN 23,755.05 210,998.55
USD 3.13 3.13
Micro Business 160 3,416 NGN 904.30 5,528
Small Business 323 1,777 NGN 5,146.56 19,705.20
USD 0.12 0.12
EUR 0.02 0.02
Total 48,177 154,827 NGN 698,001.84 1,209,381.01
USD 1,122.39 1,142.39
EUR 0.02 6.08
Source: CBN
2
DRAFT
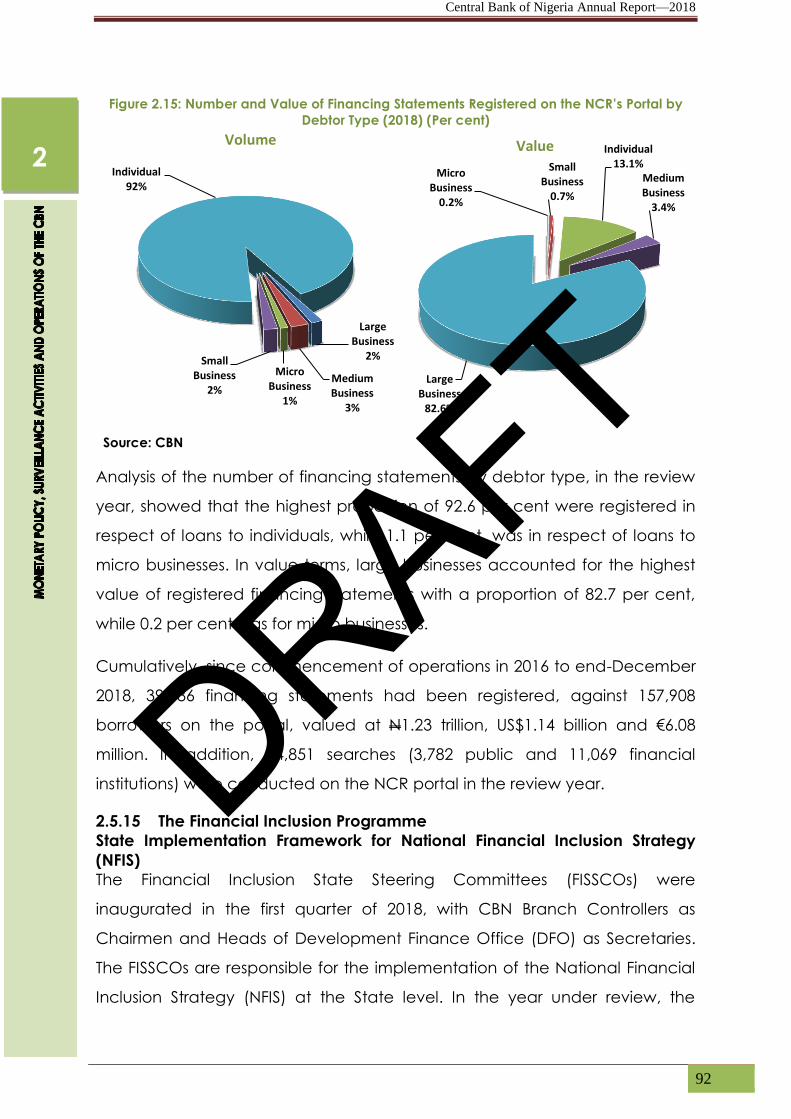
Central Bank of Nigeria Annual Report—2018
92
Figure 2.15: Number and Value of Financing Statements Registered on the NCR’s Portal by
Debtor Type (2018) (Per cent)
Source: CBN
Analysis of the number of financing statements by debtor type, in the review
year, showed that the highest proportion of 92.6 per cent were registered in
respect of loans to individuals, while 1.1 per cent, was in respect of loans to
micro businesses. In value terms, large businesses accounted for the highest
value of registered financing statements with a proportion of 82.7 per cent,
while 0.2 per cent was for micro businesses.
Cumulatively, since commencement of operations in 2016 to end-December
2018, 39,786 financing statements had been registered, against 157,908
borrowers on the portal, valued at N1.23 trillion, US$1.14 billion and €6.08
million. In addition, 14,851 searches (3,782 public and 11,069 financial
institutions) were conducted on the NCR portal in the review year.
2.5.15 The Financial Inclusion Programme
State Implementation Framework for National Financial Inclusion Strategy
(NFIS)
The Financial Inclusion State Steering Committees (FISSCOs) were
inaugurated in the first quarter of 2018, with CBN Branch Controllers as
Chairmen and Heads of Development Finance Office (DFO) as Secretaries.
The FISSCOs are responsible for the implementation of the National Financial
Inclusion Strategy (NFIS) at the State level. In the year under review, the
Large Business
2%
Medium Business
3%
Micro Business
1%
Small Business
2%
Individual 92%
Volume
Micro Business
0.2%
Small Business
0.7%
Individual 13.1%
Medium Business
3.4%
Large Business
82.6%
Value
2
DRAFT

Central Bank of Nigeria Annual Report—2018
93
FISSCOs across the federation held their quarterly meetings during which they
deliberated on strategies for implementation in the various states.
Review of the National Financial Inclusion Strategy
The review of NFIS was completed in the review year. The revised strategy
identified women, rural areas, youth, SMEs and the Northern geo-political
zones as the most financially excluded and recommended the following key
strategies to address the exclusion challenges:
a) Creation of appropriate regulatory and policy environment;
b) Massive roll out of agent networks;
c) Simplification/harmonisation of identity and know your customer
requirements;
d) Digitisation of financial transactions; and
e) Development of ecosystems that support digital and electronic
transactions.
Stakeholders were engaged to create a level playing regulatory field for
operators and concentrate on areas where they have the most comparative
advantage in their implementation plans and activities.
Status of Financial Inclusion at end-December 2018
Findings from the 2018 edition of the biennial Access to Financial Services
Nigeria Survey conducted by the Enhancing Financial Innovation and Access
(EFInA) revealed an increase in the percentage of adult Nigerians that were
included in financial services from 58.4 in 2016 to 63.2 per cent in 2018 (4.8
percentage points). The percentage of banked adult Nigerians increased
from 38.3 in 2016 to 39.7 per cent within the same period. Four (4) geo-
political zones recorded increased inclusion between 2016 and 2018 as
follows: North West from 30.0 to 38.0 per cent, North East from 38.0 to 45.0 per
cent, North Central from 61.0 to 69.0 per cent and South South from 69.0 to
77.0 per cent.
2
DRAFT

Central Bank of Nigeria Annual Report—2018
94
Two (2) geo-political zones, however, recorded marginal decrease in
financial inclusion rates: South West from 82.0 to 81.0 per cent; and South East
from 72.0 to 71.0 per cent.
Table 2.14: Channels for Financial Services
Classification Baseline
20101 Actual 2017* Actual 2018* Target 2018 Target 2020
Number of DMB
branches per
100,000 adults
6.8
(5,797
branches)
4.9
(5,049
branches)
4.8
(5,062
branches)
7.4
(7,662
branches)
7.6
(8,398
branches)
Number of MFB
branches per
100,000 adults
2.9
(2,456
branches)
2.3
(2,197
branches)2
2.4
(2,367
branches)2
4.7
(4,662
branches)
5.0
(5,525
branches)
Number of ATMs
per 100,000 adults 11.8
(9,958 ATMs)
18.0
(18,028 ATMs)
17.7
(17,512
ATMs)
49.6
(49,115 ATMs)
59.6 (65,859
ATMs)
Number of POS
terminals per
100,000 adults
13.2
(11,223 POS)
130.7
(136,016
POS)
126.8
(138,914
POS)
606.7
(606,606 POS)
850.0
(939,267
POS)
Number of Agents
per 100,000 adults 0.0
10.7
(11,104
agents)4
17.9
(18,594
agents)
38.0
(37,552
agents)
62.0
(68,511
agents)
Source: CBN
1National Financial Inclusion Strategy, 2012; Value for MFB branches approximate based on EFInA (2010); 2Data for
12/2017 based on 57% of all licensed MFBs, while data for 12/2017(provisional) is based on 64% of all licensed MFBs
only; 4815 bank agents and 14,330 mobile money agents; Data for mobile money agents is based on only 13 out of
22 MMOs who had already uploaded data on CBN’s Agent Banking Database as at June 30, 2018.*Provisional
figure.
2
DRAFT

Central Bank of Nigeria Annual Report—2018
95
Fintech for Financial Inclusion
Nigeria joined the other members of the Alliance for Financial Inclusion (AFI)
Network to issue the Sochi Accord on “Fintech for Financial Inclusion” at the
2018 Global Policy Forum held in Sochi, Russia in September 2018. The
Accord requires member countries to leverage Fintechs to accelerate
financial inclusion. AFI members resolved to acknowledge, recognise,
encourage, commend, welcome, harness and identify that innovative,
technology-based financial services hold more promises towards advancing
financial inclusion, especially among vulnerable segments of the society.
Member-countries were expected to:
Demonstrate through examples and case studies that Fintech
advances financial inclusion and includes vulnerable segments of the
society, as well as the MSMEs.
Build and reinforce institutional capacity and talent to clearly
understand technological complexities and business model innovations
to come up with appropriate regulatory interventions.
Create and participate in platforms for systematic dialogue and
partnership among regulators, policy makers, Fintech companies,
technology providers, standard-setting bodies and academic
researchers on the issue of Fintech for Financial Inclusion.
Promote a culture of innovation within the regulatory bodies, as well as,
within the broader ecosystem.
Commit to identify, understand improve or develop new approaches
to regulation and policy making, along with the use of technology, to
balance the benefits of financial services innovation and financial
stability, as well as, consumer protection mandates.
Concur to work towards developing Maya Declaration commitments
with quantified targets on Fintech for Financial Inclusion and call upon
AFI to support members in formulating these commitments and
delivering on them.
Strive to learn not only from peers in developing and emerging
countries, but also advanced economies, reflecting their international
2
DRAFT

Central Bank of Nigeria Annual Report—2018
96
experiences in Fintech development and implementation of innovative
or proportionate regulatory approaches through the AFI’s joint learning
platform.
Leverage Fintech solutions to mitigate the impact of de-risking in
developing and emerging countries.
Call on financial institutions and private sector stakeholders to use
Fintech solutions to break gender specific barriers to financial inclusion
and reduce the gender gap.
Share their knowledge and practices on Fintech solutions among
members of the network and beyond, especially those that help in
bridging gender-specific barriers to financial inclusion and reduce the
gender gap, mitigate climate change risks and building resilience, and
contribute to inclusion of forcibly displaced persons.
During the year, the Bank commenced engagement with stakeholders on
how to domesticate the Accord in Nigeria.
2.5.16 The Youth Entrepreneurship Development Programme (YEDP)
In 2018, the sum of N33.00 million was released to Sterling Bank Plc in favour of
11 projects, under the Youth Entrepreneurship Development Programme
(YEDP). This brought the total sum released to Sterling Bank Plc, since
inception under the Programme, to N109.66 million for 42 projects.
Cumulatively, disbursement, under the YEDP, from inception in 2016 to end-
December 2018 stood at N194.42 million for 74 projects.
2.5.17 Other Development Finance Support Activities
Other channels used by the Bank to enhance credit delivery to the real
sector, build capacity of institutions and contribute to the growth of the
Nigerian economy in 2018 included:
2.5.17.1 Entrepreneurship Development
Following the exit of the Bank from the operations of five (5) parent
Entrepreneurship Development Centres (EDCs) and one (1) outreach centre,
terminal audit exercise was conducted on the Centres and major audit
2
DRAFT

Central Bank of Nigeria Annual Report—2018
97
findings communicated to the Implementing Agencies (IA) of the centres.
The findings included:
Non-compliance with the e-payment policy of the Federal
Government;
Outstanding training fees yet to be refunded to applicants who paid
for but did not participate in trainings;
No comprehensive insurance coverage by the EDC; and
Appointment of contractors without following competitive process.
The South East EDC, Umuahia, Abia State, which commenced operations in
April 2016 continued its entrepreneurship development activities in the year,
whilst the South South outreach centre, Vocational EDC located at Agbor,
Delta State commenced operations in May 2018.
2.5.17.2 Microfinance Management
Rural Finance Outreach Coordinating Committee (ROCC)
The Rural Finance Outreach Coordinating Committee (ROCC) held
two meetings in the year under review. The Bank, in collaboration with
RUFIN, established the Rural Finance Outreach Coordinating
Committees (ROCCs) in the RUFIN states. Rural Finance Institution
Building Programme (RUFIN) supports the Bank to organise ROCCs as a
veritable platform for stakeholders to share experiences and jointly
address challenges confronting the microfinance sub-sector at the
state level. Membership of ROCC comprises representatives of the CBN
(DFOs), state governments, NAMB, ANMFIN, RUFIN, Federal Department
of Co-operatives (State Offices), SMEDAN, NASME, RUFIN MFIs and
BOA. The establishment of the Committee has enhanced
synergy in microfinance delivery among the various stakeholders at the
state level.
2
DRAFT

Central Bank of Nigeria Annual Report—2018
98
Management/Monitoring of Non-Bank Microfinance Institutions (NB-
MFIs) Database
A database to capture the NB-MFIs at branch levels was hosted on the
banknet. The application provides information on the activities of NB-
MFIs that have attained the threshold of transforming to regulated
microfinance institutions as enshrined in the National Microfinance
Policy, Regulatory and Supervisory Framework. The application allows
NB-MFIs to render financial returns to the Bank on a timely basis.
2
DRAFT

Central Bank of Nigeria Annual Report—2018
99
lobal economy weakened to 3.7 per cent in 2018 from 3.8 per cent in 2017, owing to a
number of key developments. These included: trade policy uncertainty, owing to the
trade tensions between the US and China; intensified Brexit-related uncertainty; weak
financial market sentiment; as well as geopolitical tensions. Thus, consumer and business
confidence weakened, slowing activities in the global financial market. In addition, most
currencies depreciated against the US dollar, owing primarily to increased investors’ appetite
for dollar-denominated assets. These developments weakened activities in the global capital
market in 2018, with stocks generally bearish. Global inflation generally increased, reflecting
recovery in oil prices. Accordingly, central banks in the advanced economies adopted a
broadly accommodative monetary policy stance to lift inflation to targets. In the emerging
market and developing economies, central banks raised their policy rates to attract capital
inflow and rein-in inflationary pressures.
3.1 OUTPUT GROWTH
In 2018, global growth weakened to 3.7 per cent, from 3.8 per cent in 2017,
due to the interplay of several forces, notably, trade policy uncertainty,
occasioned by trade tensions between the US and China and intensified
BREXIT-related uncertainty. Also financial market sentiment reflected in the
sharp re-pricing of assets amidst elevated debt burdens, as well as, pockets
of geopolitical tensions helped to dampen growth. These factors were,
however, moderated by the signing of the US-Mexico-Canada free trade
Agreement (USMCA) which replaced the North Atlantic Free Trade
Agreement (NAFTA), announcement of a 90-day truce on tariff increases in
the US-China trade debacle, as well as a reduction in Chinese tariffs on US
car imports.
Accordingly, growth in advanced economies was 2.3 per cent in 2018,
slightly lower than the 2.4 per cent in 2017. The less-than-expected growth
was caused by slower export growth in the euro area and higher energy
prices, which dampened demand. Growth in the United States, however,
strengthened to 2.9 per cent in 2018, compared with 2.2 per cent in 2017,
G
CHAPTER THREE
THE GLOBAL ECONOMY
DRAFT

Central Bank of Nigeria Annual Report—2018
100
supported by sizable fiscal stimulus and relatively loose financial conditions,
despite the Fed’s ongoing monetary policy normalisation. Growth slowed to
1.8 per cent in the euro area in 2018, compared with 2.4 per cent in 2017,
reflecting weaker-than-projected performance in the first half of 2018. The
development was driven by higher energy prices, which dampened
demand, political uncertainty and industrial actions.
In the United Kingdom, growth moderated to 1.4 per cent in 2018, from 1.8
per cent in 2017. The slowdown was driven by weak growth in the first quarter
of 2018, partly due to weather-related factors and the negative effects of
prolonged BREXIT-related uncertainty. Japan’s growth dipped to 0.9 per cent
in 2018, down from the strong growth of 1.9 per cent in 2017. The softening
reflected the contraction in the first quarter of 2018, owing, largely, to effect
of natural disaster.
Growth in emerging market and developing economies moderated to 4.6
per cent in 2018, from 4.7 per cent in 2017. Emerging and developing Asia’s
growth remained at 6.5 per cent in 2018, supported by a domestic demand-
led momentum in the Indian economy, despite the slowdown of the Chinese
economy.
In China, growth slowed to 6.6 per cent in 2018, from 6.9 per cent in 2017,
reflecting slowing external demand, impact of trade disputes with the United
States, as well as, the tight regulatory oversight of the property sector and
shadow banking activities. Conversely, India’s growth strengthened to 7.3 per
cent in 2018, compared with 6.7 per cent in 2017. The development reflected
the strengthening in investment and robust private consumption, reversing
the transitory shocks due to the currency exchange initiative and
implementation of the Goods and Services Tax (GST).
Similarly, the Russian economy grew by 1.7 per cent in 2018, up from 1.5 per
cent in 2017, supported by higher oil prices and recovering domestic
demand. The drag on the country’s growth prospects arising from the weaker
oil price outlook, however, remained.
3
DRAFT

Central Bank of Nigeria Annual Report—2018
101
In the Middle East and North Africa (MENA) region, growth improved to 2.4
per cent in 2018, from 2.2 per cent in 2017 due, largely, to a pick-up in oil
prices. In Saudi Arabia, output picked-up sharply to 2.2 per cent in 2018, in
contrast to the 0.9 per cent contraction in 2017. The development was driven
by the expansion in non-oil economic activity and projected increase in
crude oil production in line with the revised Organisation of the Petroleum
Exporting Countries Plus agreement. The Egyptian economy grew by 5.3 per
cent in 2018, up from 4.2 per cent in 2017, mirroring the recovery in tourism,
rising natural gas production, and improvement in business and consumer
confidence due to the IMF- supported reform programme.
In sub-Saharan Africa, growth remained strong at 2.9 per cent in 2018, same
as in 2017, reflecting a more supportive external environment, including
higher oil prices and still-loose global financial conditions. Growth
performance, however, varied significantly across countries in the region.
Among the major economies of the region, growth in Nigeria strengthened to
1.9 per cent in 2018, from 0.8 per cent in 2017. The improvement reflected the
combined effects of recovery in oil prices, stronger non-oil sector
performance as well as stability of the domestic prices. In South Africa,
growth moderated to 0.8 per cent in 2018, from 1.3 per cent in 2017, amid
uncertainty in the run-up to the country’s general elections in 2019. In Angola,
the contraction in real output moderated by 0.1 per cent in 2018, compared
with the contraction of 2.5 per cent in 2017.
3
DRAFT
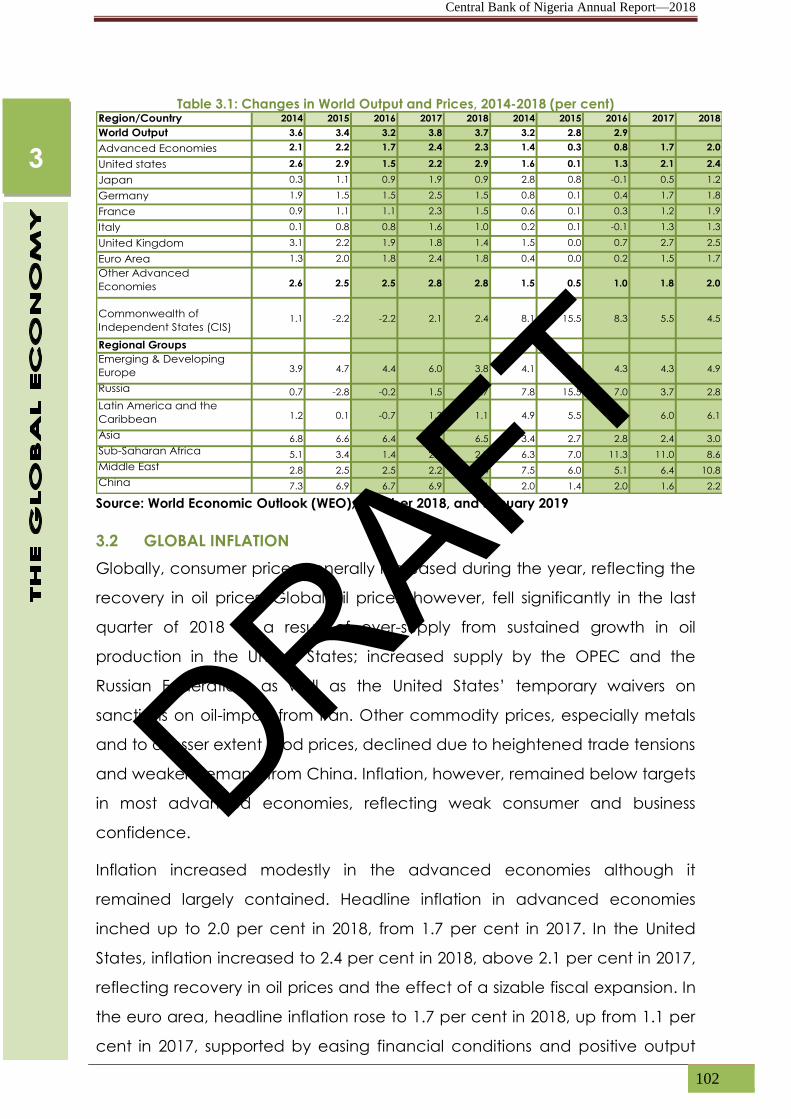
Central Bank of Nigeria Annual Report—2018
102
Table 3.1: Changes in World Output and Prices, 2014-2018 (per cent) Region/Country 2014 2015 2016 2017 2018 2014 2015 2016 2017 2018
World Output 3.6 3.4 3.2 3.8 3.7 3.2 2.8 2.9
Advanced Economies 2.1 2.2 1.7 2.4 2.3 1.4 0.3 0.8 1.7 2.0
United states 2.6 2.9 1.5 2.2 2.9 1.6 0.1 1.3 2.1 2.4
Japan 0.3 1.1 0.9 1.9 0.9 2.8 0.8 -0.1 0.5 1.2
Germany 1.9 1.5 1.5 2.5 1.5 0.8 0.1 0.4 1.7 1.8
France 0.9 1.1 1.1 2.3 1.5 0.6 0.1 0.3 1.2 1.9
Italy 0.1 0.8 0.8 1.6 1.0 0.2 0.1 -0.1 1.3 1.3
United Kingdom 3.1 2.2 1.9 1.8 1.4 1.5 0.0 0.7 2.7 2.5
Euro Area 1.3 2.0 1.8 2.4 1.8 0.4 0.0 0.2 1.5 1.7
Other Advanced
Economies 2.6 2.5 2.5 2.8 2.8 1.5 0.5 1.0 1.8 2.0
Commonwealth of
Independent States (CIS)1.1 -2.2 -2.2 2.1 2.4 8.1 15.5 8.3 5.5 4.5
Regional Groups
Emerging & Developing
Europe 3.9 4.7 4.4 6.0 3.8 4.1 3.2 4.3 4.3 4.9
Russia 0.7 -2.8 -0.2 1.5 1.7 7.8 15.5 7.0 3.7 2.8
Latin America and the
Caribbean 1.2 0.1 -0.7 1.3 1.1 4.9 5.5 5.6 6.0 6.1
Asia 6.8 6.6 6.4 6.5 6.5 3.4 2.7 2.8 2.4 3.0
Sub-Saharan Africa 5.1 3.4 1.4 2.9 2.9 6.3 7.0 11.3 11.0 8.6
Middle East 2.8 2.5 2.5 2.2 2.4 7.5 6.0 5.1 6.4 10.8
China 7.3 6.9 6.7 6.9 6.6 2.0 1.4 2.0 1.6 2.2
Source: World Economic Outlook (WEO), October 2018, and January 2019
3.2 GLOBAL INFLATION
Globally, consumer prices generally increased during the year, reflecting the
recovery in oil prices. Global oil prices, however, fell significantly in the last
quarter of 2018 as a result of over-supply from sustained growth in oil
production in the United States; increased supply by the OPEC and the
Russian Federation; as well as the United States’ temporary waivers on
sanctions on oil-import from Iran. Other commodity prices, especially metals
and to a lesser extent food prices, declined due to heightened trade tensions
and weaker demand from China. Inflation, however, remained below targets
in most advanced economies, reflecting weak consumer and business
confidence.
Inflation increased modestly in the advanced economies although it
remained largely contained. Headline inflation in advanced economies
inched up to 2.0 per cent in 2018, from 1.7 per cent in 2017. In the United
States, inflation increased to 2.4 per cent in 2018, above 2.1 per cent in 2017,
reflecting recovery in oil prices and the effect of a sizable fiscal expansion. In
the euro area, headline inflation rose to 1.7 per cent in 2018, up from 1.1 per
cent in 2017, supported by easing financial conditions and positive output
3
DRAFT

Central Bank of Nigeria Annual Report—2018
103
gaps. In Japan, headline inflation increased to 1.2 per cent in 2018, from 0.5
per cent in 2017, following rising energy prices, on the back of weak wage
growth and stickiness in inflation expectations. In the United Kingdom,
inflation, however, moderated to 2.1 per cent in 2018, from 2.4 per cent in
2017, as the pass-through effects of the currency’s depreciation waned.
In emerging market and developing economies, headline inflation also
increased to 5.0 per cent in 2018 (excluding Venezuela), above 4.3 per cent
in 2017, owing to the impact of currency depreciations and rising energy
prices.
In China, headline inflation accelerated to 2.2 per cent in 2018, up from 1.6
per cent in 2017, driven by higher food and energy prices. Inflation in India
rose to 4.7 per cent in 2018, from 3.6 per cent in 2017, due to pressures from
rising demand and fuel prices. Inflation rose in Brazil to 3.7 per cent in 2018,
from 3.4 per cent in 2017, as monetary policy remained supportive against
the backdrop of slowly recovering food prices, after a significant drop
caused by a bumper harvest in 2017.
In sub-Saharan Africa, inflationary pressures broadly softened. Headline
inflation dropped to 8.6 per cent in 2018, from 11.0 per cent in 2017. In South
Africa, inflation moderated to 4.8 per cent in 2018, from 5.3 per cent in 2017,
as the effects of drought on agricultural production waned. In Nigeria,
headline inflation tapered to 12.4 per cent in 2018, from 16.5 per cent in 2017,
on account of sustained non-expansionary monetary policy and moderation
in food prices.
3.3 GLOBAL COMMODITY DEMAND AND PRICES
Global commodity prices generally softened in 2018, on account of weak
global economic activity. The slow growth in China and the tepid business
and consumer confidence in the face of the ongoing trade tensions
between the US and China weakened global trade and commodity prices.
In particular, prices of metals and agricultural commodities softened since
August, partly due to subdued demand from China. Global crude oil prices,
however, generally recovered before declining later in the year, due to
3
DRAFT

Central Bank of Nigeria Annual Report—2018
104
excess supply, caused by sustained growth in shale oil production in the
United States, and increase in supply by the OPEC and the Russian
Federation, as well as, the United States temporary waivers of sanctions on
oil-import from Iran.
The IMF Energy Price Index (comprised of crude oil, natural gas and coal
price indices) increased significantly to 131.5 from 100.6 points in 2017, due
mainly to commodity-specific supply constraints, including the OPEC plus
Agreement, rising US interest rates and appreciation of the US dollar. Coal
and natural gas prices were propped up by the increased demand for
electricity in Europe and Asia arising from unusually hot weather during the
year.
The Food and Agriculture Organisation’s (FAO) Food Price Index (FPI)
averaged 168.5 points, lower by 6.1 points (3.5%) from 174.6 points in 2017,
due to the dampening effect of trade tensions on commodity prices. The
only year-on-year increase was recorded by cereals (9.1%). On the other
hand, sugar price index decreased by 49.8 points (21.9%), followed by
vegetable oils (14.7%), dairy (4.6%), and meat (2.2%) on a year-on-year basis
during the review period.
The FAO Cereal Price Index averaged 165.3 points, representing an increase
of 13.7 points (9.1%), from 151.6 points in 2017. The increase was driven,
largely, by weather-related concerns over wheat harvests in Argentina and
reduced export supplies, coupled with poor weather conditions in the
southern hemisphere which affected maize supplies.
The FAO Dairy Price Index decreased by 9.3 points (4.6%) to 192.9 points, from
202.2 points in 2017. The development was attributed to competition, market
conditions and declining dairy demand in some parts of the US.
The FAO Vegetable Oil Price Index averaged 144.0 points, representing a
decrease of 24.8 points (14.7%), below the 168.8 points in 2017. The marginal
decline reflected reduced demand by India and depreciation of the rupee,
which led to a fall in the international prices of edible oils.
3
DRAFT

Central Bank of Nigeria Annual Report—2018
105
The FAO Sugar Price Index averaged 177.5 points, representing a significant
decrease of 49.8 points (21.9%) from 227.3 in 2017. The downward pressure on
sugar price was traceable to a global supply glut which led to a second
consecutive annual price decline. The sugar market was stagnant as rising
output from India has replaced Brazil as the largest global sugar producer.
The FAO Meat Price Index decreased by 2.2 per cent to 166.4 points, from
170.1 in 2017, reflecting increased US meat export production that was
affected by tariffs from trading partners.
3.4 WORLD TRADE
Global trade slowed in 2018, reversing the rebound experienced in 2017,
reflecting economic and non-economic developments. These included: the
general uncertainty in the global environment due to trade disputes
between the US and China; the reduction in global industrial production,
following weaker capital spending and investment by firms; slowdown in the
Chinese economy; as well as increased political risks and policy uncertainty
across a number of countries. Others were: the intensified Brexit-related
uncertainty, worsened by a stronger possibility of a “no deal”; as well as a
faster-pace of policy normalisation in the advanced economies. As a
consequence, trade volumes deteriorated in both advanced and emerging
market and developing economies.
World trade growth slowed to 4.2 per cent in 2018, compared with 5.4 per
cent in 2017. In the advanced economies, aggregate import grew by 3.7 per
cent, while export grew by 3.4 per cent in 2018. Accordingly, terms of trade in
the advanced economies deteriorated by 0.1 per cent, compared with 0.4
per cent in 2017. In the emerging market and developing economies, the
volumes of import and export grew by 6.0 and 4.7 per cent, respectively. In
contrast, the terms of trade in the emerging market and developing
countries, improved by 1.6 per cent in 2018, compared with 0.6 per cent in
2017.
3
DRAFT
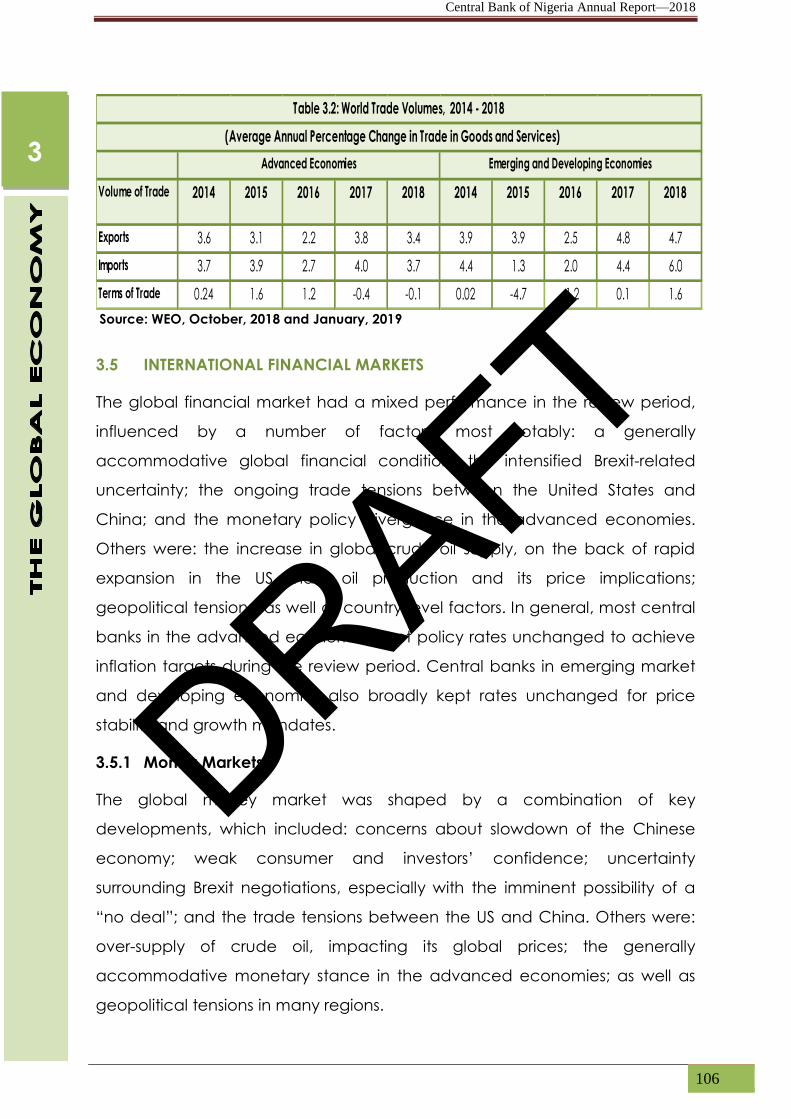
Central Bank of Nigeria Annual Report—2018
106
(Average Annual Percentage Change in Trade in Goods and Services)
Volume of Trade 2014 2015 2016 2017 2018 2014 2015 2016 2017 2018
Exports 3.6 3.1 2.2 3.8 3.4 3.9 3.9 2.5 4.8 4.7
Imports 3.7 3.9 2.7 4.0 3.7 4.4 1.3 2.0 4.4 6.0
Terms of Trade 0.24 1.6 1.2 -0.4 -0.1 0.02 -4.7 -1.2 0.1 1.6
Table 3.2: World Trade Volumes, 2014 - 2018
Advanced Economies Emerging and Developing Economies
Source: WEO, October, 2018 and January, 2019
3.5 INTERNATIONAL FINANCIAL MARKETS
The global financial market had a mixed performance in the review period,
influenced by a number of factors, most notably: a generally
accommodative global financial condition; the intensified Brexit-related
uncertainty; the ongoing trade tensions between the United States and
China; and the monetary policy divergence in the advanced economies.
Others were: the increase in global crude oil supply, on the back of rapid
expansion in the US shale oil production and its price implications;
geopolitical tensions; as well as country-level factors. In general, most central
banks in the advanced economies kept policy rates unchanged to achieve
inflation targets during the review period. Central banks in emerging market
and developing economies also broadly kept rates unchanged for price
stability and growth mandates.
3.5.1 Money Markets
The global money market was shaped by a combination of key
developments, which included: concerns about slowdown of the Chinese
economy; weak consumer and investors’ confidence; uncertainty
surrounding Brexit negotiations, especially with the imminent possibility of a
“no deal”; and the trade tensions between the US and China. Others were:
over-supply of crude oil, impacting its global prices; the generally
accommodative monetary stance in the advanced economies; as well as
geopolitical tensions in many regions.
3
DRAFT

Central Bank of Nigeria Annual Report—2018
107
The remarkable improvement in macroeconomic conditions in the United
States increased investors’ appetite for dollar-denominated assets and
strengthened business investment. This development, along with the US
inward-looking policy, affected the economies of its trading partners.
Consequently, capital inflow to emerging market and developing economies
was strained, with implications for their external reserves. In commodity-
exporting emerging markets and developing economies, however, there was
a pickup in their reserves, on account of improved crude oil prices earlier in
the year.
In general, the reactions of monetary authorities to these developments were
varied. The advanced economies broadly adopted monetary easing stance,
while the emerging market and developing economies generally retained
monetary tightening stances to rein-in inflationary pressures, build external
reserves and strengthen domestic currencies.
3.5.2 Capital Markets
Global stock markets were generally bearish. In advanced economies, stock
markets performed poorly, stoked by weak investors’ confidence caused by
the US and China trade disputes. In the euro area, Brexit-related uncertainty
intensified, weighing on the EU economy, particularly its and its stock markets,
despite the ECB’s monetary accommodation stance, easing financial
conditions. In the emerging market and developing economies, equity
markets also lost ground, due to the diminished capital inflow, owing to
increased investors’ appetite for dollar-denominated assets.
Accordingly, the global stock markets were mostly bearish in 2018. In North
America, the US S&P 500, the Canadian S&P/TSX Composite and Mexican
Bolsa indices decreased by 6.24, 11.64 and 15.63 per cent, respectively. In
South America, the Brazilian Bovespa and the Argentine Merval indices
increased by 19.12 and 3.43 per cent, respectively, while the Colombian
COLCAP index decreased by 11.95 per cent. In Europe, the FTSE 100, French
CAC 40 and the German DAX indices decreased by 12.48, 10.95 and 18.10
per cent, respectively, in 2018.
3
DRAFT

Central Bank of Nigeria Annual Report—2018
108
In Asia, Japan’s Nikkei 225 and China’s Shanghai Stock Exchange-A indices
decreased by 12.08 and 25.47 per cent, respectively, while India’s BSE Sensex
index increased by 5.91 per cent.
In Africa, the Nigerian NSE ASI, the Egyptian EGX CASE 30, the Ghanaian GSE,
South African JSE All-Share, and the Kenyan Nairobi NSE 20 indices decreased
by 17.81, 11.37, 23.66, 13.21 and 11.6 per cent, respectively. The Nigerian
equities market was, however, supported by increased capital inflow and
recovery in crude oil prices earlier in the year, thereby boosting external
reserves and strengthening the domestic currency.
Country Index 29-Dec-17 29-Mar-18 29-Jun-18 28-Sep-18 31-Dec-18% Change b/w
(a) and (e )
AFRICA (a) (b) (c) (d) (e) (f)
Nigeria NSE All-Share Index 38,243.19 41,504.51 38,278.55 32,766.37 31,430.50 -17.81
South AfricaJSE All-Share Index 59,504.67 55,474.52 57,610.98 55,708.47 52,736.86 -11.37
Kenya Nairobi NSE 20 Share index 3,711.94 3,845.34 3,285.73 2,875.51 2,833.84 -23.66
Egypt EGX CASE 30 15,019.14 17,595.88 16,348.55 14,616.47 13,035.77 -13.21
Ghana GSE All-Share Index 2,579.72 3,366.86 2,878.66 2,882.87 2,499.33 -3.12
NORTH AMERICA
US S&P 500 2,673.61 2,640.87 2,718.36 2,913.98 2,506.85 -6.24
Canada S&P/TSX Composite 16,209.13 15,367.29 16,277.73 16,073.14 14,322.86 -11.64
Mexico Bolsa 49,354.42 46,124.85 47,663.20 49,504.16 41,640.27 -15.63
SOUTH AMERICA
Brazil Bovespa Stock 76,402.08 85,365.56 72,762.51 79,342.42 91,012.31 19.12
Argentina Merval 30,065.61 31,114.93 26,037.01 33,461.77 31,096.63 3.43
Columbia COLCAP 1,513.65 1,455.52 1,577.01 1,506.07 1,332.80 -11.95
EUROPE
UK FTSE 100 7,687.77 7,056.61 7,636.93 7,510.20 6,728.13 -12.48
France CAC 40 5,312.56 5,167.30 5,323.33 5,493.49 4,730.69 -10.95
Germany DAX 12,917.64 12,096.73 12,306.00 12,246.73 10,580.19 -18.10
ASIA
Japan NIKKEI 225 22,764.94 21,454.30 22,304.51 24,120.04 20,014.77 -12.08
China Shanghai SE A 3,463.48 3,318.71 2,982.00 2,821.35 2,581.37 -25.47
India BSE Sensex 34,056.83 32,968.68 35,423.48 36,227.14 36,068.33 5.91
Table 3.3: Selected International Stock Markets Indices as at Dec 31, 2018
Source: Bloomberg
3.5.3 The International Foreign Exchange Market
Major global currencies depreciated against the U.S. dollar during the review
period, due to a number of developments. These included: sustained
3
DRAFT
Central Bank of Nigeria Annual Report—2018
109
normalisation of US monetary policy; weak global activity, as well as,
investors’ appetite for dollar-denominated assets. Others were Brexit-related
uncertainty, and, geopolitical tensions. These developments negatively
impacted portfolio inflow and external reserves, thereby weakening many
currencies.
In advanced economies, all major currencies depreciated against the U.S.
dollar. The major European currencies: the British pound, the euro and the
Russian ruble, depreciated against the US dollar by 5.13, 4.60 and 17.25 per
cent, respectively. In North America, the Canadian dollar depreciated by
7.35 per cent against the US dollar. In Asia, the Japanese yen, however,
appreciated against the US dollar by 2.43 per cent.
In emerging market and developing economies, most currencies also
depreciated against the US dollar. In Asia, the Chinese yuan and the Indian
rupee depreciated by 5.38 and 8.46 per cent, respectively. In South America,
the Brazilian real, Argentine peso and the Colombian peso depreciated by
14.69, 50.57 and 8.18 per cent, respectively, against the US dollar. In North
America, the Mexican peso appreciated marginally by 0.15 per cent against
the US dollar.
Comparatively, the Nigerian naira, South African rand, the Egyptian pound
and the Ghanaian cedi depreciated against the US dollar by 0.33, 12.24, 0.67
and 8.54 per cent, respectively, while the Kenyan shilling appreciated
marginally by 1.23 per cent.
In general, the Nigerian naira was the least depreciated among the
currencies surveyed, while the Japanese yen was the most appreciated in
the review period.
3
DRAFT

Central Bank of Nigeria Annual Report—2018
110
Table 3.4 Exchange Rates of Selected Countries (Value in currency units to US$) Currency 31-Dec-16 29-Dec-17 31-Dec-18 % Change
(31Dec16/30
Dec17)
% Change
(31 Dec17/31
Dec18)
AFRICA MTM% App/Dep YTD % App/Dep
Nigeria Nigeria Naira 305.00 306.00 307.00 -0.33 -0.33
South Africa South Africa
Rand 13.74 12.62 14.38 8.87 -12.24
Kenya Kenya Shilling 102.51 103.10 101.85 -0.57 1.23
Egypt Egypt Pound 18.14 17.81 17.93 1.85 -0.67
Ghana Ghana Cedi 4.24 4.50 4.92 -5.78 -8.54
NORTH
AMERICA
Canada Canada Dollar 1.38 1.26 1.36 9.52 -7.35
Mexico Mexico Peso 17.21 19.66 19.63 -12.36 0.15
SOUTH
AMERICA
Brazil Brazil Real 3.96 3.31 3.88 19.64 -14.69
Argentina Argentina Peso 12.93 18.62 37.67 -30.56 -50.57
Colombia Colombia Peso 3174.50 2986.84 3253.00 6.28 -8.18
EUROPE
UK UK Pound 0.68 0.74 0.78 -8.11 -5.13
Euro Area Euro Area Euro 0.92 0.83 0.87 10.84 -4.60
Russia Russia Ruble 72.85 57.63 69.64 26.41 -17.25
ASIA
Japan Japan Yen 120.20 112.69 110.02 6.66 2.43
China China Yuan 6.49 6.51 6.68 -0.31 -5.38
India India Rupee 66.15 63.87 69.77 3.57 -8.46
Source: Bloomberg, 2019
MTM – Month-to-Month
YTD = Year to Date
3.5.4 Central Bank Policy Rates
Most central banks adopted a cautious approach in 2018. In advanced
economies, central banks broadly adopted a monetary easing stance to
achieve inflation targets and respond to global and domestic developments.
The developments included: trade tensions between the US and China;
recovery of crude oil prices; weak global economic activity; investors’
appetite for dollar-denominated assets and declining investors’ optimism on
the back of trade tensions. In general, headline inflation still remained largely
weak in most advanced economies, justifying data-dependent and cautious
normalisation policy. However, central banks in emerging market and
developing economies tightened to rein-in inflationary pressure and capital
inflow.
3
DRAFT
Central Bank of Nigeria Annual Report—2018
111
In advanced economies, central banks adopted mixed monetary policy
stance. The Federal Reserve raised its policy rate four (4) times in 2018, within
the range of 1.00 to 2.50 per cent. It also signaled a more gradual pace of
rate hikes in future. The Bank of England (BoE) raised its policy rate from 0.50
to 0.75 per cent in August 2018. The European Central Bank, retained zero per
cent interest rate in 2018, in pursuance of its amply accommodative
monetary policy.
In emerging market and developing economies, monetary policy stance was
also mixed. Most central banks raised rates in 2018 due to concerns about
inflationary pressures from earlier oil price increases, closing output gaps and
pass-through from currency depreciations. Some central banks lowered rates
to address growth concerns, while others maintained rates on hold and
acted to ease domestic financial conditions.
The Central Bank of Brazil lowered its policy rate two (2) times, to 6.75 per
cent in February and to 6.5 per cent in March to stimulate growth. The South
African Reserve Bank reduced its policy rate from 6.75 per cent to 6.50 per
cent in March and raised it back to 6.75 per cent in November. In Ghana,
policy rate was reduced twice from 20.00 per cent to 17.00 per cent to
strengthen domestic currency.
In India, policy rate was increased twice from 6.25 to 6.75 per cent in 2018.
The Peoples Bank of China retained its policy rate at 4.35 per cent throughout
2018. The Central Bank of Nigeria (CBN) also retained monetary policy rate
(MPR) at 14.0 per cent throughout 2018, mainly to moderate inflationary
pressure and encourage foreign capital inflow.
3
DRAFT

Central Bank of Nigeria Annual Report—2018
112
Ghana S. Africa Kenya Nigeria Brazil Chile USA Euro Area India Russia China UK Indonesia
Oct-17 10 6.75 10 14 7.5 2.5 1-1.25 0 6.25 8.25 4.35 0.25 4.25
Nov-17 10 6.75 10 14 7.5 2.5 1-1.25 0 6.25 8.25 4.35 0.50 4.25
Dec-17 10 6.75 10 14 7 2.5 1.25-1.5 0 6.25 7.75 4.35 0.5 4.25
2018
Jan-18 20 6.75 10 14 7 2.5 1.25-1.5 0 6.25 7.5 4.35 0.5 4.25
Feb-18 20 6.75 10 14 6.75 2.5 1.25-1.5 0 6.25 7.5 4.35 0.5 4.25
Mar-18 18 6.5 9.5 14 6.5 2.5 1.5-1.75 0 6.25 7.25 4.35 0.5 4.25
Apr-18 18 6.5 9.5 14 6.5 2.5 1.5-1.75 0 6.25 7.25 4.35 0.5 4.25
May-18 17 6.5 9.5 14 6.5 2.5 1.5-1.75 0 6.25 7.25 4.35 0.5 4.75
Jun-18 17 6.5 9.5 14 6.5 2.5 1.75-2 0 6.5 7.25 4.35 0.5 5.25
Jul-18 17 6.5 9 14 6.5 2.5 1.75-2 0 6.5 7.25 4.35 0.5 5.25
Aug-18 17 6.5 9 14 6.5 2.5 1.75-2 0 6.75 7.25 4.35 0.75 5.5
Sep-18 17 6.5 9 14 6.5 2.5 3-2.25 0 6.75 7.5 4.35 0.75 5.75
Oct-18 17 6.5 9 14 6.5 2.75 2-2.25 0 6.75 7.5 4.35 0.75 5.75
Nov-18 17 6.75 9 14 6.5 2.75 2-2.25 0 6.75 7.5 4.35 0.75 6
Dec-18 17 6.75 9 14 6.5 2.75 2.25-2.5 0 6.75 7.5 4.35 0.75 6
Table 3.5: Monetary Policy Rates of Selected Countries, 2017-2018
Source: Bloomberg
3.6 THE IMPACT OF GLOBAL ECONOMIC DEVELOPMENTS ON NIGERIA’S
ECONOMY
In the review period, the Nigerian economy was shaped by a confluence of
global developments. The key developments included: weak financial
market sentiment; a broadly accommodative global financial condition;
trade policy uncertainty; a pickup in crude oil prices, as well as, the monetary
policy normalisation in the advanced economies. Others were: concerns
about China’s growth outlook; the increase in global crude oil supply, on the
back of rapid expansion in the US shale oil production and its price
implications; geopolitical tensions; as well as country-idiosyncratic factors.
The Nigerian financial market was significantly impacted by these global
economic and financial developments. The developments led to improved
foreign investors’ optimism earlier in the year, encouraging capital inflow,
supported by modest recovery in crude oil prices. The external reserves
improved significantly, thereby strengthening the domestic currency. The
domestic currency generally stabilised in 2018. Consequently, inflation
assumed a downward trajectory during the review period, owing to the
Bank’s non-expansionary monetary policy. Despite these favourable
3
DRAFT

Central Bank of Nigeria Annual Report—2018
113
developments, capital outflow intensified in the last half of the year, due to
uncertainty surrounding the 2019 general elections.
Accordingly, the domestic capital market suffered significant losses as the
Nigeria All-Share Index (ASI) fell by 17.81 per cent to 31,430.50 at end-
December 2018, from 38,243.19 at end-December 2017. Overall, however,
global developments, including increased capital inflow and a recovery in
crude oil prices boosted external reserves and fiscal receipts, encouraging
investments in non-oil sector and infrastructure, which stimulated economic
activity.
3
DRAFT

Central Bank of Nigeria Annual Report—2018
114
DRAFT

Central Bank of Nigeria Annual Report—2018
115
he Bank maintained a non-expansionary monetary policy stance to rein-in inflation and
stabilise the foreign exchange market in 2018. The monetary policy rate (MPR) and cash
reserve ratio (CRR) were retained at 14.00 per cent and 22.50 per cent, respectively,
during the year. Also, the asymmetric corridor around the MPR remained at +200 and -500
basis points and liquidity ratio (LR) retained at 30.0 per cent. Growth in major monetary
aggregates was mostly below the targets for fiscal 2018.
Indicators of financial sector development were mixed in 2018. There was improvement in
the systemic relevance of the banking sector, with the ratio of M3 to GDP at 26.2 per cent,
0.9 basis point above the level at end-December 2017. Similarly, financial savings increased
in 2018; and there was an improvement in intermediation efficiency indicator, measured by
the ratio of currency outside banks to broad money supply, which stood at 5.7 per cent,
compared with 6.2 per cent at end-December 2017. There was, however, a decline in
financing condition with the aggregate credit to GDP ratio at 21.6 per cent, down from 22.8
per cent in 2017. Also, the ratio of private sector credit to GDP fell to 17.8 per cent from 19.6
per cent in 2017. The banking system assets/GDP ratio fell to 42.6 per cent at end-December
2018, from 45.2 per cent at end-December 2017. Total money market assets outstanding fell
by 1.9 per cent below the level at end-December 2017, due largely, to the decrease in the
bankers’ acceptances and Nigerian treasury bills outstanding.
The structure of Nigerian banking sector was unchanged in the review period as the number
of licensed banks stood at 27, as in the preceding year. Activities on the Nigerian Stock
Exchange were bearish in 2018, as most market indices trended downward. Total market
capitalisation of listed securities and the All-Share Index fell by 41.6 and 42.3 per cent,
respectively. Aggregate volume rose by 0.8 per cent, while the value of traded securities fell
by 6.2 per cent.
4.1 INSTITUTIONAL DEVELOPMENTS
4.1.1 Growth and Structural Changes
The structure of the Nigerian banking sector was unchanged in the review
period as the number of licensed banks stood at 27, same as in the
preceding year. The licensed banks comprised 21 commercial banks, five (5)
merchant banks and one (1) non-interest bank. Ten (10) commercial banks
had international authorisation, while nine (9) and two (2) had national and
regional authorisation, respectively. The five (5) licensed merchant banks had
national authorisation. The number of bank branches, increased to 5,462 from
5,450 in 2017.
T
CHAPTER FOUR
FINANCIAL SECTOR DEVELOPMENTS
DRAFT

Central Bank of Nigeria Annual Report—2018
116
Figure 4.1: Banks’ Branch Network, 2014 – 2018
Source: CBN
The number of offshore subsidiaries of Nigerian banks stood at fifty-eight at
end-December 2018, compared with fifty five in 2017. The number of
representative offices, affiliates and international branches of Nigerian banks
also remained six (6), one (1) and two (2), respectively, bringing the total
number of offshore entities to sixty-seven in 2018.
In the other financial institutions (OFIs) sub-sector, there were 5,488 licensed
institutions at end-December 2018, compared with 4,870 institutions in 2017.
The total number of OFIs comprised seven (7) DFIs, 35 PMBs, 885 MFBs, 69 FCs
and 4,492 BDCs. The increase was as a result of newly licensed OFIs (752
BDCs, 31 MFBs and 18 FCs). Also, the licences of 154 MFBs, 22 FCs and six (6)
PMBs were revoked during the year. Sixty two (62) of the MFBs had closed
shop, 74 insolvent, and 12 were terminally distressed, while six (6) voluntarily
liquidated. Out of the 22 FCs, eight (8) voluntarily liquidated, 13 failed to
recapitalise, while one (1) became insolvent. Also, out of the six (6) PMBs, two
(2) failed to recapitalise, three (3) voluntarily closed shop and one (1) was
insolvent.
4.1.2 Cheques
The volume and value of cheques cleared nationwide fell by 16.7 and 7.4 per
cent to 9.0 million and N5.0 trillion, respectively, compared with 10.8 million
and N5.4 trillion in 2017. This was attributed to increased adoption of e-
payment channels.
5,670.0 5,634.0
5,571.0
5,450.0 5,462.0
5000
5100
5200
5300
5400
5500
5600
5700
2014 2015 2016 2017 2018
4
4
DRAFT
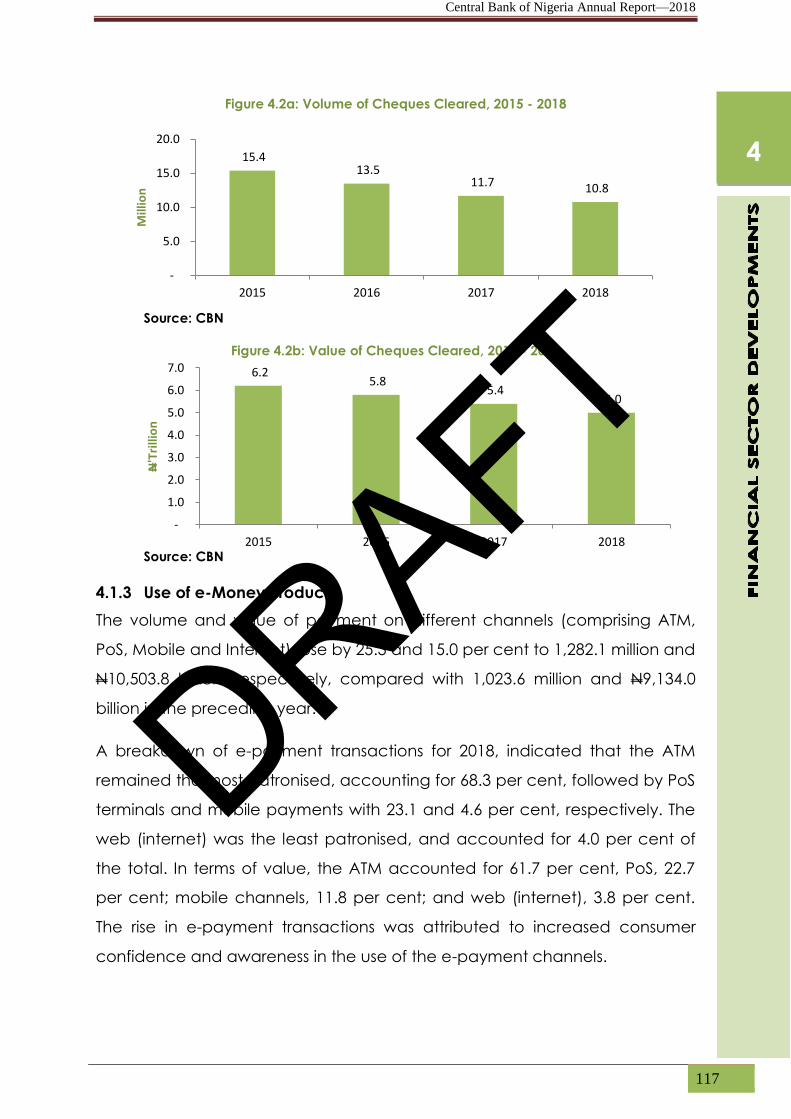
Central Bank of Nigeria Annual Report—2018
117
Figure 4.2a: Volume of Cheques Cleared, 2015 - 2018
Source: CBN
Figure 4.2b: Value of Cheques Cleared, 2015 - 2018
Source: CBN
4.1.3 Use of e-Money Products
The volume and value of payment on different channels (comprising ATM,
PoS, Mobile and Internet) rose by 25.3 and 15.0 per cent to 1,282.1 million and
N10,503.8 billion, respectively, compared with 1,023.6 million and N9,134.0
billion in the preceding year.
A breakdown of e-payment transactions for 2018, indicated that the ATM
remained the most patronised, accounting for 68.3 per cent, followed by PoS
terminals and mobile payments with 23.1 and 4.6 per cent, respectively. The
web (internet) was the least patronised, and accounted for 4.0 per cent of
the total. In terms of value, the ATM accounted for 61.7 per cent, PoS, 22.7
per cent; mobile channels, 11.8 per cent; and web (internet), 3.8 per cent.
The rise in e-payment transactions was attributed to increased consumer
confidence and awareness in the use of the e-payment channels.
15.4 13.5
11.7 10.8
-
5.0
10.0
15.0
20.0
2015 2016 2017 2018
Mill
ion
6.2 5.8
5.4 5.0
-
1.0
2.0
3.0
4.0
5.0
6.0
7.0
2015 2016 2017 2018
N'T
rilli
on
4
DRAFT

Central Bank of Nigeria Annual Report—2018
118
Figure 4.3a: Classification of e-Money Products by Volume, 2018, (Per cent)
Source: CBN
Figure 4.3b: Classification of e-Money Products by Value, 2018, (Per cent)
Source: CBN
Figure 4.4a: Volume of Electronic Payments (Million), 2016 - 2018
Source: CBN
ATM
68.3%
PoS
23.1%
Internet
4.0%
Mobile
4.6%
ATM
61.7%
PoS
22.7% Internet
3.8%
Mobile
11.8%
715.1
1,023.6
1,282.1
-
200.0
400.0
600.0
800.0
1,000.0
1,200.0
1,400.0
2016 2017 2018
Mill
ion
4
DRAFT

Central Bank of Nigeria Annual Report—2018
119
Figure 4.4b: Value of Electronic Payments (N’ Billion), 2016 - 2018
Source: CBN
4.1.3.1 Automated Teller Machine (ATM) Transactions
The number of ATMs deployed stood at 18,615 at end-December 2018,
indicating an increase of 6.7 per cent, compared with the 17,449 at end-
December 2017. ATM transactions increased in both volume and value by 9.4
and 0.7 per cent, to 875.5 million and N6,480.1 billion, respectively, at end-
December 2018, compared with 800.5 million and N6,437.6 billion at end-
December 2017.
Figure 4.5a: Volume of ATM Transactions, 2016 – 2018, (Million)
Source: CBN
Figure 4.5b: Value of ATM Transactions, 2016 – 2018, (N’ Billion)
Source: CBN
6,636.4
9,134.0
10,503.8
-
2,000.0
4,000.0
6,000.0
8,000.0
10,000.0
12,000.0
2016 2017 2018
N' B
illio
n
590.2
800.6 875.5
-
200.0
400.0
600.0
800.0
1,000.0
2016 2017 2018
Mill
ion
4,988.1
6,437.6 6,480.1
-
2,000.0
4,000.0
6,000.0
8,000.0
2016 2017 2018
N' B
illio
n
4
DRAFT

Central Bank of Nigeria Annual Report—2018
120
4.1.3.2 Web Transactions
During the review year, the volume and value of transactions on the web
increased by 75.2 and 119.2 per cent to 50.8 million and N404.6 billion,
respectively, at end-December 2018, compared with 29.0 million and N184.6
billion at end-December 2017. The significant rise in internet payments
platform was attributed to increased consumer acceptance.
Figure 4.6a: Volume of Web Transactions, 2016 – 2018
(Million)
Source: CBN
Figure 4.6b: Value of Web Transactions, 2016 – 2018
(N’ Billion)
Source: CBN
4.1.3.3 Point-of-Sale (PoS) Transactions
The volume and value of PoS transactions increased by 102.3 and 69.0 per
cent to 295.9 million and N2,383.1 billion, respectively, at end-December
2018, compared with 146.3 million and N1,409.8 billion in 2017. The rise was
attributed to increased public confidence in the use of the terminal.
14.0
29.0
50.8
-
10.0
20.0
30.0
40.0
50.0
60.0
2016 2017 2018
Mill
ion
132.4
184.6
404.6
-
50.0
100.0
150.0
200.0
250.0
300.0
350.0
400.0
450.0
2016 2017 2018
N'B
illio
n
4
DRAFT

Central Bank of Nigeria Annual Report—2018
121
Figure 4.7a: Volume of PoS Transactions, 2016 – 2018 (Million)
Source: CBN
Figure 4.7b: Value of PoS Transactions, 2016 – 2018 (N’ Billion)
Source: CBN
4.1.3.4 Mobile Payments
Mobile payments increased in both volume and value by 25.3 and 12.2 per
cent in 2018 to 59.9 million and N1,236.1 billion, respectively, compared with
47.8 million and N1,102.0 billion in 2017. The increase in both volume and
value of transactions was attributed to increased awareness and confidence
in the usage of this channel.
63.7
146.3
295.9
-
50.0
100.0
150.0
200.0
250.0
300.0
350.0
2016 2017 2018
Mill
ion
759.0
1,409.8
2,383.1
-
500.0
1,000.0
1,500.0
2,000.0
2,500.0
3,000.0
2016 2017 2018
N'B
illio
n
4
DRAFT

Central Bank of Nigeria Annual Report—2018
122
Figure 4.8a: Volume of Mobile Transactions, 2016 – 2018 (Million)
Source: CBN
Figure 4.8b: Value of Mobile Transactions, 2016 – 2018 (N’ Billion)
Source: CBN
4.1.4 The Wholesale Payments System
4.1.4.1 The Real Time Gross Settlement (RTGS) System
The volume and value of inter-bank fund transfers through the CBN RTGS
System decreased by 8.3 per cent a piece to 1.1 million and N383,960.1
billion, respectively, at end-December 2018, compared with 1.2 million and
N418,645.11 billion in the preceding year, due largely to the availability of
alternative channels for large value payments.
47.1 47.8
59.9
-
10.0
20.0
30.0
40.0
50.0
60.0
70.0
2016 2017 2018
Mill
ion
756.9
1,102.0
1,236.1
-
200.0
400.0
600.0
800.0
1,000.0
1,200.0
1,400.0
2016 2017 2018
N'B
illio
n
4
DRAFT

Central Bank of Nigeria Annual Report—2018
123
Figure 4.9a: Volume of RTGS Transactions, 2016 – 2018
Source: CBN
Figure 4.9b: Value of RTGS Transactions, 2016 – 2018 (N’ Billion)
Source: CBN
4.1.4.2 NIBSS Instant Payment (NIP) Transactions
The volume and value of the NIBSS Instant Payment transactions increased by
78.8 and 43.2 per cent to 663.1 million and N80,423.0 billion, respectively,
compared with 370.8 million and N56,165.7 billion in 2017. The rise in the use of
the channel was attributed to increased consumer awareness and
confidence.
Figure 4.10a: Volume of NIP Transactions, 2016 – 2018 (Million)
Source: CBN
1.2 1.2
1.1
1.1
1.1
1.2
1.2
1.3
2016 2017 2018
Bill
ion
371,638.4
418,645.1
383,960.1
340,000.0
350,000.0
360,000.0
370,000.0
380,000.0
390,000.0
400,000.0
410,000.0
420,000.0
430,000.0
2016 2017 2018
N'B
illio
n
153.6
370.8
663.1
-
100.0
200.0
300.0
400.0
500.0
600.0
700.0
2016 2017 2018
Mill
ion
4
DRAFT
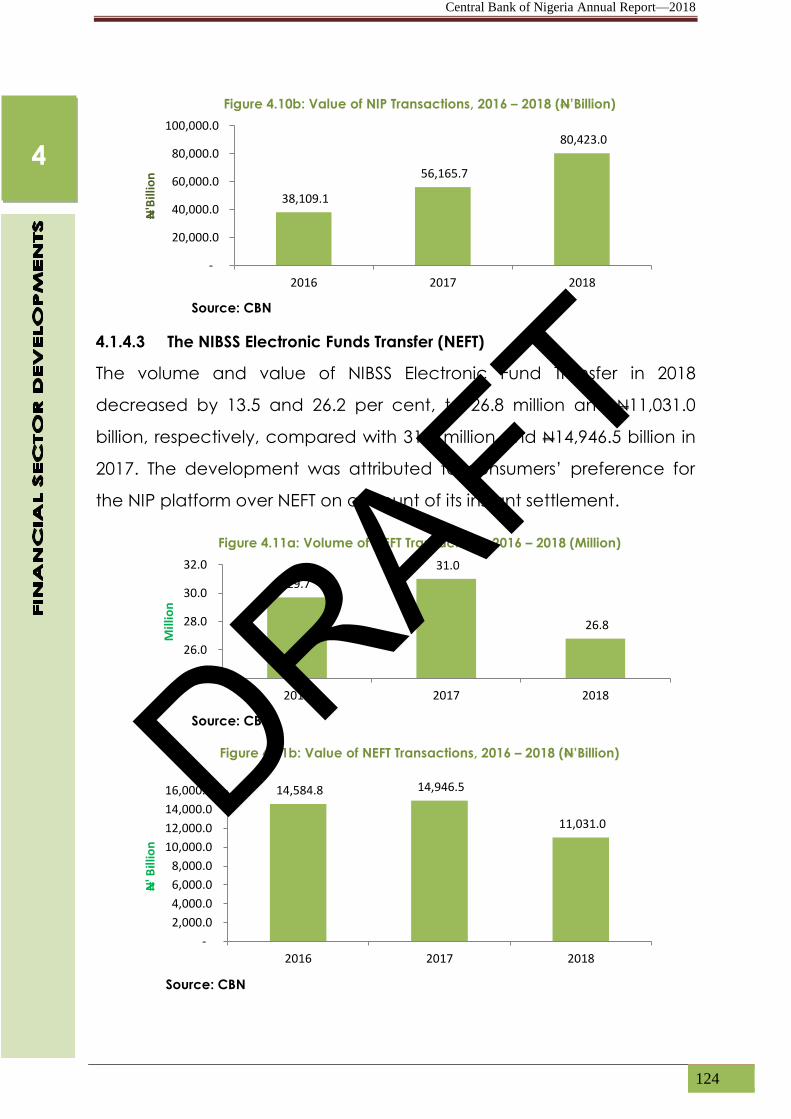
Central Bank of Nigeria Annual Report—2018
124
Figure 4.10b: Value of NIP Transactions, 2016 – 2018 (N’Billion)
Source: CBN
4.1.4.3 The NIBSS Electronic Funds Transfer (NEFT)
The volume and value of NIBSS Electronic Fund Transfer in 2018
decreased by 13.5 and 26.2 per cent, to 26.8 million and N11,031.0
billion, respectively, compared with 31.0 million and N14,946.5 billion in
2017. The development was attributed to consumers’ preference for
the NIP platform over NEFT on account of its instant settlement.
Figure 4.11a: Volume of NEFT Transactions, 2016 – 2018 (Million)
Source: CBN
Figure 4.11b: Value of NEFT Transactions, 2016 – 2018 (N’Billion)
Source: CBN
38,109.1
56,165.7
80,423.0
-
20,000.0
40,000.0
60,000.0
80,000.0
100,000.0
2016 2017 2018
N'B
illio
n
29.7
31.0
26.8
24.0
26.0
28.0
30.0
32.0
2016 2017 2018
Mill
ion
14,584.8 14,946.5
11,031.0
-
2,000.0
4,000.0
6,000.0
8,000.0
10,000.0
12,000.0
14,000.0
16,000.0
2016 2017 2018
N' B
illio
n
4
DRAFT

Central Bank of Nigeria Annual Report—2018
125
4.1.4.4 Institutional Savings
Aggregate financial savings rose by N2,167.2 billion to N15,583.3 billion,
compared with the level in 2017. The ratio of financial savings to GDP was
12.2 per cent, compared with 11.8 per cent in 2017. Banks remained the
dominant depository institutions in the financial system, accounting for 95.2
per cent of total financial savings, compared with 95.3 per cent in the
preceding year. Other savings institutions, namely, PMBs, insurance
companies, pension fund custodians, the Nigerian Social Insurance Trust Fund
(NSITF) and microfinance banks, accounted for the balance of 4.8 per cent.
4.2 MONETARY AND CREDIT DEVELOPMENTS
4.2.1 Reserve Money (RM)
Reserve money (RM) grew by 10.1 per cent to N7,135.7 billion at the end of
the review period. The level of reserve money was, however, higher than the
programmed level of N6, 703.8 billion for fiscal 2018. Sources of growth in RM
were net foreign assets of the CBN, which grew by 20.1 per cent, and
domestic assets of the CBN, which rose by 40.8 per cent at end-December
2018. Growth in net foreign assets was due largely, to the accumulation of
foreign currency by the CBN, arising from monetisation of export receipts and
foreign loans. The growth in net domestic assets reflected significant increase
holdings of claims on the Federal government and the 49.0 per cent growth
in claims on the private sector.
The corresponding upward movement in monetary liabilities reflected the
growth in currency-in-circulation and bank reserves by 8.0 and 11.2 per cent,
respectively, at end-December 2018.
Table 4.1: Reserve Money (N’ Billion)
Dec-14 Dec-15 Dec-16 Dec-17 Dec-18
Sources
Net Foreign Assets
6,244.72 5,545.32
8,790.70
15,134.62 18,181.45
Net Domestic Assets
466.01 1,090.96
(1,854.00)
(5,415.95) (7,62.96)
Other Items Net (779.78) (823.54) (1,088.70) (3,236.41) (3,419.76)
Reserve Money 5,930.95 5,812.74 5,847.92 6,482.26 7,135.73
Uses
Currency-in-Circulation 2,179.17 2,329.71
4
DRAFT
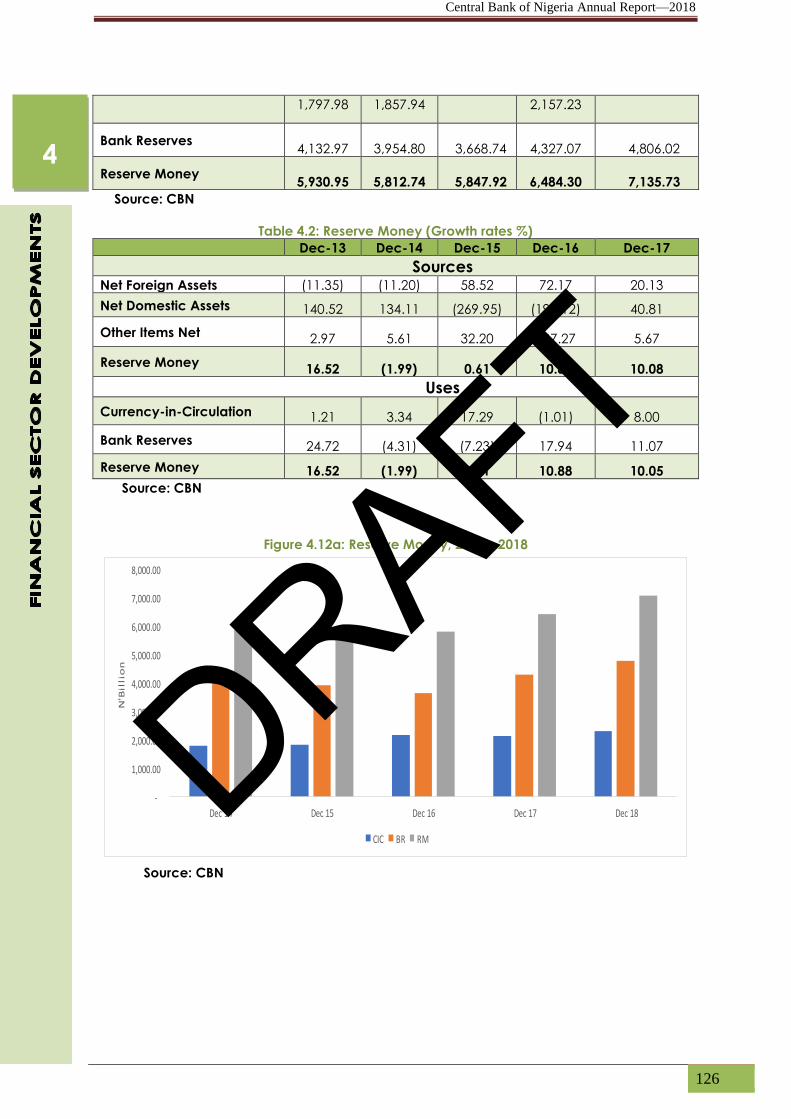
Central Bank of Nigeria Annual Report—2018
126
1,797.98 1,857.94 2,157.23
Bank Reserves
4,132.97
3,954.80 3,668.74
4,327.07 4,806.02
Reserve Money
5,930.95
5,812.74 5,847.92
6,484.30 7,135.73
Source: CBN
Table 4.2: Reserve Money (Growth rates %)
Dec-13 Dec-14 Dec-15 Dec-16 Dec-17
Sources Net Foreign Assets (11.35) (11.20) 58.52 72.17 20.13
Net Domestic Assets 140.52 134.11 (269.95) (192.12) 40.81
Other Items Net 2.97 5.61 32.20 197.27 5.67
Reserve Money 16.52 (1.99) 0.61 10.85 10.08
Uses
Currency-in-Circulation 1.21 3.34 17.29 (1.01) 8.00
Bank Reserves 24.72 (4.31) (7.23) 17.94 11.07
Reserve Money 16.52 (1.99) 0.61 10.88 10.05
Source: CBN
Figure 4.12a: Reserve Money, 2014 - 2018
-
1,000.00
2,000.00
3,000.00
4,000.00
5,000.00
6,000.00
7,000.00
8,000.00
Dec 14 Dec 15 Dec 16 Dec 17 Dec 18
N'B
illi
on
CIC BR RM
Source: CBN
4
DRAFT

Central Bank of Nigeria Annual Report—2018
127
Figure 4.12b: Reserve Money Targets and Outcomes, 2014 - 2018
Source: CBN
4.2.2 Narrow Money (M1)
Narrow money supply (M1) grew by 5.2 per cent at end-December 2018 to
N11,752.6 billion, in contrast to the 0.9 per cent decline at end-December
2017. The development was due to the 7.3 and 4.7 per cent growth in
currency outside banks and demand deposits, respectively.
Figure 4.13: Components of Narrow Money (M1) (Per cent), 2014 - 2018
Source: CBN
4.2.3 Quasi-Money
Quasi-money rose by 18.2 per cent to N15, 316.0 billion at end-December
2018, compared with the growth of 5.2 per cent at end-December 2017. The
development was due to the growth in aggregate savings (savings and time
deposit) in commercial, merchant, mortgage and microfinance banks, of
which foreign currency deposits (FCD) constituted 36.4 per cent and grew by
28.1 per cent to N5,574.7 billion at end-December 2018, in contrast to the
decline of 5.0 per cent at end-December 2017.
0.00
2,000.00
4,000.00
6,000.00
8,000.00
2014 2015 2016 2017 2018
N' B
illio
n
Target Actual
(10.00)
-
10.00
20.00
30.00
40.00
Dec 2014 Dec 2015 Dec 2016 Dec 2017 Dec 2018
Pe
r ce
nt
M1 COB DD
4
DRAFT

Central Bank of Nigeria Annual Report—2018
128
Figure 4.14: Growth in Monetary Aggregates, 2014 – 2018, (Per cent)
Source: CBN
4.2.4 Broad Money Supply
4.2.4.1 Broad Money Supply (M2)
Growth in broad measures of money supply, M2 accelerated in the review
period, despite the restrictive monetary policy stance of the Bank. Growth of
broad money (M2) stood at 12.1 per cent at end–December 2018, compared
with 0.6 per cent recorded at end-December 2017, and the 11.9 per cent
indicative target for fiscal 2018. The development was due to the 18.5, 6.4
and 1.7 per cent increase in net foreign assets, domestic credit (net) and
other assets (net) of the banking system, respectively.
4.2.4.2 Broad money supply (M3)
Growth in M3 stood at 16.4 per cent at the end of the review period, resulting
from the 38.9 per cent growth in the holdings of CBN bills by the non- bank
public.
Figure 4.15: Growth in the Components of Broad Money (M3), 2014 – 2018, (Per cent)
Source: CBN
(10.00)
-
10.00
20.00
30.00
40.00
Dec 14 Dec 15 Dec 16 Dec 17 Dec 18
Pe
r ce
nt
M1 M2 M3
-10
10
30
Dec 2014 Dec 2015 Dec 2016 Dec 2017 Dec 2018
Pe
r ce
nt
Quasi-Money Currency Outside Banks
Demand Deposits CBN Bills Held by Non-Bank Sectors
4
DRAFT

Central Bank of Nigeria Annual Report—2018
129
4.2.5 Drivers of Broad Money Supply
4.2.5.1 Net Foreign Assets (NFAs)
Net foreign assets of the banking system rose by 18.5 per cent to N18,397.82
billion at the end of the review period, compared with 69.6 per cent at end-
December 2017. The growth in NFA was due wholly, to the growth in foreign
assets of the CBN. Consequently, the share of NFA in M3 rose to 55.2 per cent
at end-December 2018, above 54.1 per cent at end-December 2017.
Similarly, the contribution of NFA to the growth of M3 was 10.0 percentage
points at end-December 2018, against 22.4 percentage points at end-
December 2017.
4.2.5.2 Net Domestic Credit (NDC)
Aggregate credit to the domestic economy (net) stood at N27,574.3 billion at
end-December 2018, representing a 6.4 per cent increase above the level at
end-December 2017. The growth, however, contrasted with the decline of
3.5 per cent at the end of the preceding period, and was also lower than the
indicative benchmark of 14.6 per cent for fiscal 2018. The development at
end-December 2018, was attributed to the 33.8 and 2.0 per cent increase in
net claims on the Federal Government and claims on the private sector,
respectively. Consequently, the NDC contributed 5.7 percentage points to
the growth in M3 at end-December 2018, in contrast to the negative
contribution of 3.3 percentage points recorded at end-December 2017.
4.2.5.2.1 Net Credit to Government (NCG)
Net claims on the Federal Government increased by 33.8 per cent to
N4,867.6 billion at end-December 2018, in contrast to the decline of 25.4 per
cent at end-December 2017. The development reflected growth in holdings
of government securities (NT bills and FGN bonds) by the banking system
amounting to N6,608.3 billion, a 7.4 per cent growth over the level at end-
December 2017. The contribution of claims on the Federal Government to
the growth in M3 was 4.3 percentage points, in contrast to the negative
contribution of 4.3 per cent at the end of the preceding period.
4
DRAFT

Central Bank of Nigeria Annual Report—2018
130
Figure 4.16: Growth in Broad Money Supply (M3), 2014 – 2018, (per cent)
Source: CBN
Figure 4.17: Share of NFA, NDC and OAN in M3, 2014 – 2018, (Per cent)
Source: CBN
Table 4.3 Contribution to the Growth in M2 2014-2018 (%)
2014 2015 2016 2017 2018
Net foreign Assets -7.88 -6.48 12.92 21 10.04
Net domestic Credit 21.89 11.65 19.38 -3.06 5.74
Other Assets net -3.62 -2.82 -7.23 -17.38 0.59
Broad Money 10.39 2.35 25.06 0.55 16.36
Narrow Money -0.59 8.3 9.97 -0.34 2.01
Quasi Money 15.49 -2.74 3.18 2.13 8.2
CBN Bills -4.5 -3.21 11.9 -1.26 6.14
Broad Money 10.39 2.35 25.06 0.55 16.36
Source: CBN
-110
-90
-70
-50
-30
-10
10
30
50
70
Dec 2014 Dec 2015 Dec 2016 Dec 2017 Dec 2018
Pe
r ce
nt
NDC OAN M3 NFA
-60
-10
40
90
2014 2015 2016 2017 2018
Pe
r ce
nt
NDC/M3 NFA/M3 OAN/M3
4
DRAFT

Central Bank of Nigeria Annual Report—2018
131
4.2.5.2.2 Credit to the Private Sector (CP)
Banking system claims on the private sector (including states, local
governments, and non-financial public enterprises) grew by 1.9 per cent to
N22,708.2 billion at end-December 2018, compared with the growth of 1.4
per cent at end-December 2017. Of this total, claims on states and local
governments grew by 12.0 per cent, while credit to the core private sector
rose by 1.9 per cent. Private sector credit contributed 1.5 percentage points
to the growth in broad money supply.
Figure 4.18: Growth in Net Domestic Credit, 2014 – 2018 (Per cent)
Source: CBN
4.2.5.2.2.1 Outstanding Consumer Credit
Outstanding consumer credit declined by 4.8 per cent to N650.7 billion at
end-December 2018, but constituted 3.1 per cent of banks’ outstanding
claims on the core private sector at the end of the review period, same as in
2017.
Figure 4.19: Consumer Credit, 2014 - 2018
Source: CBN
(140.00)
(40.00)
60.00
160.00
Dec 2014 Dec 2015 Dec 2016 Dec 2017 Dec 2018
Pe
r ce
nt
Aggregate Credit (Net) Claims on the FG (Net) Claims on Private Sector
Claims on Other (core) Private Sector Claims on State and LG
0
1
2
3
4
5
6
0
200
400
600
800
1000
Dec 2014 Dec 2015 Dec 2016 Dec 2017 Dec 2018
Rat
io (
%)
N' B
illio
n
Consumer credit Ratio of credit to core private sector (rhs)
4
DRAFT

Central Bank of Nigeria Annual Report—2018
132
4.2.5.3 Other Assets (Net) (OAN)
Other Assets (net) of the banking system grew by 1.3 per cent, in contrast to
the decline of 70.3 per cent at end-December 2017. The contribution of OAN
to the growth of M3 was 0.7 percentage point at end-December 2018, in
contrast to negative 18.5 percentage points in 2017.
Table 4.4: Composition of Total Monetary Aggregates (M3), 2014 - 2018
(Per cent)
2014 2015 2016 2017 2018
Net Domestic credit 101.9 99.51 94.23 90.44 82.56
Claims on Federal Government (Net) 6.1 13.32 17.11 12.69 14.56
Credit on Private Sector 95.8 86.19 77.13 77.75 68.07
Claims on Other (core) Private Sector 92.9 83.38 73.56 72.27 63.22
Foreign Assets (Net) 36.8 26.03 32.10 54.14 55.15
Other Assets (Net) -26.3 -25.54 -26.33 -44.58 -37.81
Total Monetary Assets 100.00 100.00 100.00 100.00 100.00
Money Supply (M1) 36.5 39.47 39.55 38.98 35.23
Currency Outside Banks 6.70 6.70 6.39 6.22 5.72
Demand Deposit 28.90 32.76 33.16 32.76 29.50
Quasi Money 63.49 52.76 43.23 45.22 45.91
Total Monetary Liabilities (M3) 100.0 100.0 100.0 100.0 100.00
Source: CBN
4.2.6 Maturity Structure of Banks’ Loans and Advances, and Deposit Liabilities
As in the preceding year, short-term maturities remained dominant in banks’
outstanding credit and deposits. Outstanding loans and advances maturing
one year and earlier accounted for 47.1 per cent of the total, compared with
43.7 per cent at end-December 2017. The share of medium-term (above 1
year but less than 3 years) loans, fell to 17.5 per cent, from 18.0 per cent.
Similarly, long-term (3 years and longer) fell to 35.4 per cent from 38.4 per
cent at end-December 2017.
Deposit liabilities showed a similar trend, with short-term deposits constituting
88.1 per cent of the total at end-December 2018, compared with 95.9 per
cent at end-December 2017. Deposits of less than 30-day maturity
constituted 72.9 per cent, while the share of medium and long-term deposits
stood at 3.8 and 8.1 per cent, respectively, compared with 1.3 and 2.8 per
4
4
DRAFT

Central Bank of Nigeria Annual Report—2018
133
cent at end-December 2017. The structure of banks’ deposit liabilities
explained their preference for short-term claims on the economy.
Source: CBN
Figure 4.20a: Maturity Structure of DMBs’ Loans and Advances at end-December, 2018
(Per cent)
Source: CBN
Source: CBN
Figure 4.20b: Maturity Structure of DMBs’ Deposits at end-December, 2018
(Per cent)
Source: CBN
4.2.7 Sectoral Distribution of Credit
Of the total banks’ claims on the core private sector in the review year, credit
to the priority sectors, such as agriculture, services and construction,
Table 4.6: Maturity Structure of DMBs’ Loans and Advances, and Deposit Liabilities,
2016 - 2018
Tenor Loans (%) Deposits (%)
2016 2017 2018 2016 2017 2018
0-30 days 27.3 25.6 25.2 75.9 74.4 72.92
31-90 days 6.8 7.8 9.3 11.8 12.9 10.06
91-180 days 7.2 5.3 4.4 4.4 4.8 3.22
181-365 days 5.1 5.0 8.3 3.5 3.7 1.86
Short-term 46.4 43.7 47.1 95.6 95.9 88.06
Medium-term - (above 1 year and
below 3 Years) 20.7 18.0 17.5 1.2 1.3 3.83
Long-term (3 years and Above) 32.9 38.4 35.4 3.2 2.8 8.11
Short-term 47.1%
Medium-term 17.4%
Long-term 35.4%
Short-term 88.1%
Long term 3.8%
Medium-term 8.1%
4
DRAFT

Central Bank of Nigeria Annual Report—2018
134
constituted 4.0, 34.8 and 4.1 per cent, respectively, compared with 3.4, 37.6
and 4.2 per cent at end-December 2017. The industry sector accounted for
the largest share of 41.0 per cent of total sectoral credit utilisation at end-
December 2018, of which the manufacturing and oil & gas sub-sectors
constituted 14.7 and 23.5 per cent, respectively, compared with 13.8 and
22.7 per cent at end-December 2017.
Table 4.6: Share in Outstanding Credit to the Core Private Sector, 2017 – 2018 (per cent)
Source: CBN
4.2.8 Financial/Banking System Developments
Indicators of financial sector development were mixed in 2018. Systemic
relevance of the banking sector, measured by the ratio of M3 to GDP, stood
at 26.2 per cent, 0.9 percentage points above the level at end-December
2017. Similarly, a slight increase in financial savings was observed in 2018, with
the ratio of quasi-money to GDP at 12.0 per cent, compared with 11.4 per
ITEM
Dec 17 Dec 2018 Percentage
Share in Total
% Change Between
N’ Billion N’ Billion Dec 17 Dec 18
1 2 3 4 (1) &(2)
[a] Agriculture 528.2 610.15 3.4 4.0 15.5
[b] Industry 6,226.9 6,203.19 39.6 41.0 -0.4
Mining & Quarrying 25.3 20.69 0.2 0.1 -18.1
Manufacturing 2,171.4 2,230.15 13.8 14.7 2.7
Oil & Gas 3,576.3 3,548.97 22.7 23.5 -0.8
of which Downstream, Natural Gas and 3,576.3 3,548.97 2.9 23.5 -0.8
Crude Oil Refining
Power and Energy 453.9 403.38 2.94.2 2.7 -11.1
of which IPP and Power Generation 453.9 403.38 6.5 2.7 -11.1
[c] Construction 657.1 614.51 8.8 4.1 -6.5
[d] Trade/General Commerce 1,023.8 1,076.72 37.6 7.1 5.2
[e] Government 1,391.4 1,302.58 4.8 9.0 -2.1
[f] Services 5,913.3 5,267.04 7.2 34 -10.9
Real Estate 753.7 622.78 0.5 4.1 -17.4
Finance, Insurance and Capital Market 1,125.9 1,106.42 7.4 7.3 -1.7
Education 72.5 57.25 7.4 0.4 -21.1
Oil & Gas 1,161.1 1,096.55 1.9 7.2 -5.6
of which Upstream and Oil & Gas Services 1,161.1 1,096.55 1.9 7.2 -5.6
Power and Energy 301.1 309.12 15.9 2.0 2.7
of which Power Transmission and Distribution 301.1 309.12 6.6 2.0 2.7
Others 2,499.0 2,074.93 4.9 13.7 -17.0
of which: i. General 1,037.7 899.85 2.1 5.9 -13.3
ii. Information & Communication 774.4 545.50 100.0 3.6 -29.6
iii. Transportation & Storage 332.1 289.85 1.9 -12.7
TOTAL PRIVATE SECTOR CREDIT 15,740.6 15,134.20
100.0 100.0 -3.9
4
DRAFT

Central Bank of Nigeria Annual Report—2018
135
cent recorded in 2017. Furthermore, there was an improvement in
intermediation efficiency indicator, measured by the ratio of currency
outside banks to broad money supply, which stood at 5.7 per cent, from 6.2
per cent at end-December 2017. However, the capacity of the banking
system to finance the economy declined, with the aggregate credit to GDP
ratio at 21.6 per cent, from the 22.8 per cent in 2017. The ratio of private
sector credit to GDP fell to 17.8 per cent, from 19.6 per cent in 2017. Similarly,
the banking system assets/GDP ratio fell to 42.6 per cent at end-December
2018, from 45.17 per cent at end-December 2017.
Table 4.7: Indicators of Financial Developments, 2014 – 2018 (per cent)
2014 2015 2016 2017 2018
M3/GDP 21.2 23.1 28.1 25.2 26.2
COB/M3 7.6 6.70 6.39 6.22 5.72
QM/GDP 63.5 52.76 43.23 45.22 45.91
NDC/GDP 21.6 23.0 26.5 22.8 21.6
CP/GDP 20.4 19.88 21.66 19.60 17.77
Cp (core)/GDP 19.7 19.24 20.66 18.22 16.52 Banking System’s
Assets/GDP 47.5 47.71 47.51 45.17 42.57
Figure 4.21: Ratio of Banking System’s Total Assets to GDP, 2014 - 2018
Source: CBN
4.2.9 Money Multiplier and Velocity of Money
The broad money multiplier stood at 5.51, an increase of 1.09 above the level
at end-December 2017, suggesting a faster rate of monetary expansion in
the review period. Currency deposit ratio decreased to 0.28 below the ratio
of 0.50 in 2017, following the cash less policy initiatives of the Bank. Also,
0.0
50.0
100.0
150.0
2014 2015 2016 2017 2018
Pe
r ce
nt
Banks' Assets/GDP CBN's Assets/GDP Banking System's Assets/GDP
4
DRAFT

Central Bank of Nigeria Annual Report—2018
136
reserve ratio rose to 0.28, above the level of 0.19 in 2017, consistent with the
rate of monetary expansion in the review period. The velocity of broad
money, M2 and M3, stood at 4.72 and 3.83, compared with 4.71 and 3.97 in
2017. The slight increase in M2 velocity suggested increased economic
activities during the review period, while the decline in M3 velocity suggested
significant growth in the non-bank holdings of CBN bills in the review period.
Table 4.8: Money Multiplier and Velocity of M2, 2014 - 2018
2014 2015 2016 2017 2018
Currency Ratio 0.44 0.47 0.47 0.50 0.27
Reserve Ratio 0.24 0.21 0.17 0.19 0.28
M3 Multiplier 3.19 3.74 4.96 4.42 5.51
Velocity of M2 4.71 4.7 4.30 4.71 4.72
Velocity of M3 4.71 4.33 3.56 3.97 3.83
Source: CBN
Figure 4.22: Money Multiplier, Currency Ratio and Reserve Ratio, 2014 - 2018
0
0.1
0.2
0.3
0.4
0.5
0.6
0
1
2
3
4
5
6
2014 2015 2016 2017 2018
cash
rese
rvea
nd cu
rren
cy ra
tio
Mul
tiplie
r
Currency Ratio Reserve Ratio M3 Multiplier
Source: CBN
Figure 4.23: Velocity of Broad Money, 2014 - 2018
4.71 4.70
4.30
4.71 4.72
0.00
0.50
1.00
1.50
2.00
2.50
3.00
3.50
4.00
4.50
5.00
2014 2015 2016 2017 2018
Velocity of M2 Velocity of M3
Source: CBN
FINANC
IAL
SECTOR
DEVELO
PMENTS
4
DRAFT

Central Bank of Nigeria Annual Report—2018
137
4.3 MONEY MARKET DEVELOPMENTS
Money market activities responded to the trends in liquidity in the banking
system, influenced, largely, by statutory revenue flows, foreign exchange
intervention and open market operations (OMO). The activities at the inter-
bank market showed preference for collateralised transactions by market
players, reflecting their risk aversion. Interest rates at all segments of the
market mirrored the level of liquidity in the banking system and generally fell
below their levels in 2017. The trend of activities at the discount window,
remained as in 2017, with request for Standing Lending Facility (SLF) being
more dominant than Standing Deposit Facility (SDF).
4.3.1 The Inter-bank Funds Market
At the interbank funds market, the total value of transactions decreased
sharply to N1,661.81 billion in 2018, a 94.6 per cent fall, below N32,910.37
billion in 2017. The value of OBB transactions amounted to N1,601.15 billion or
96.4 per cent of the total, while transactions at the unsecured inter-bank
segment, accounted for the balance of N60.66 billion or 3.7 per cent of total
in 2018, compared with 94.8 and 5.2 per cent, respectively in 2017. This
represented decrease of 94.9 and 96.4 per cent in OBB and unsecured
transactions, below their respective levels in 2017.
Figure 4.24: Value of Interbank Funds Market Transactions, 2014 – 2018 (N’billion)
Source: CBN
7242.79 6611.4 5343.22
32910.37
5000
15000
25000
35000
45000
2014 2015 2016 2017 2018
N' B
illio
n
4
DRAFT

Central Bank of Nigeria Annual Report—2018
138
Figure 4.25: Share of Interbank Funds Market Transactions, 2018 (Per cent)
Source: CBN
4.3.2 Money Market Assets Outstanding
Total money market assets outstanding at end-December 2018 stood at
N11,893.14 billion, representing a decrease of 1.9 per cent from N12,122.02
billion at end-December 2017. The
development was attributed to the
decrease in the Bankers’ Acceptances and
NTBs outstanding, due to lower expected
yield in the market. Government securities
constituted 99.8 per cent of the total money market assets outstanding, while
private sector securities (Commercial Paper and Bankers’ Acceptances)
accounted for the balance.
Figure 4.26: Money Market Assets Outstanding, 2014 – 2018 (N’ billion)
0
2
4
6
8
10
12
0
1000
2000
3000
4000
5000
6000
7000
8000
9000
10000
2014 2015 2016 2017 2018
Nbi
llion
Nbi
llion
FGN Bonds BA CD TBills CP (rhs)
Source: CBN
0
5000
10000
15000
20000
25000
30000
35000
2017 2018
31207.68
1601.15 1702.69 60.66
OBB Inter-bank call+Tenored
Government securities accounted for 99.8
per cent of the total money market assets
outstanding at end-December 2018.
4
DRAFT

Central Bank of Nigeria Annual Report—2018
139
Figure 4.27: Growth Rates of Money Market Assets Outstanding, 2018 (Per cent)
Source: CBN
Table 4.9: Composition of Money Market Assets Outstanding, 2017 and 2018
Asset Share in total (%) in 2017 Share in total (%) in 2018
FGN Bonds 70.25 76.80
Treasury Bills 29.53 23.00
Bankers’ Acceptance 0.22 0.10
Commercial Paper 0.004 0.091
Certificate of Deposit 0.00 0.00
Total 100 100
Source: CBN
4.3.2.1 Nigerian Treasury Bills (NTBs)
Nigerian Treasury Bills (NTBs) worth N3,342.39 billion were offered and allotted
in 2018, representing a decrease of N1,153.08 billion or 25.7 per cent, below
the N4,495.5 billion in 2017. The reduction in NTBs holdings reflected the lower
NTB issues, coupled with the redemption of treasury bills worth N78.05 billion in
December 2018. Total public subscription stood at N6,713.78 billion, a
decrease of N464.6 billion or 6.5 per cent, compared with N7,178.38 billion in
the preceding year. The tenors were 91-, 182- and 364-day. The low public
subscription was attributed to the high frequency of OMO auctions, which
constrained banking system liquidity and the non-issuance of NTBs in
December as maturing obligations were fully redeemed.
The bid rates ranged from 10.00 to 12.55 per cent for the 91-day, 10.30 to
13.93 per cent for the 182-day and 10.70 to 14.45 per cent for the 364-day
tenors. In comparison, the bid rates in 2017 were higher at 12.95 to 14.00 per
76.80
23.00
0.1910 0.00
20.00
40.00
60.00
80.00
100.00
FGN Bonds TBills CP &BA
4
DRAFT

Central Bank of Nigeria Annual Report—2018
140
cent for the 91-day, 15.00 to 17.50 per cent for the 182-day and between
15.57 to 18.98 per cent for the 364-day tenors.
Figure 4.28: NTB Issues, Subscriptions and Allotments, 2014 - 2018
Source: CBN
Figure 4.29: Nigerian Treasury Bills Outstanding, 2014-2018
Source: CBN
The structure of allotment of the instrument indicates that banks took up N
1,832.20 billion or 54.9 per cent, mandate and internal funds customers N
1,332.46 billion or 39.9 per cent, while CBN branches and CBN take-up
amounted to N175.72 billion or 5.3 per cent in the period under review.
0
1000
2000
3000
4000
5000
6000
7000
8000
9000
2014 2015 2016 2017 2018
N' B
illio
n
Offer Subscription Allotment
3,879.5 3,845.3
4,555.5 4,495.5
3,342.4
1,000.0
1,500.0
2,000.0
2,500.0
3,000.0
3,500.0
4,000.0
4,500.0
5,000.0
2014 2015 2016 2017 2018
N' B
illio
n
4
DRAFT

Central Bank of Nigeria Annual Report—2018
141
Source: CBN 1Bid-cover ratio equals Subscription divided by Allotments
2Net Flow equals Repayments minus Allotments
Figure 4.30: Nigerian Treasury Bills: Breakdown of Allotments, 2018 (Per cent)
54.88
39.86
5.26
0.000.00
10.00
20.00
30.00
40.00
50.00
60.00
COM& M/BANK CBN BRANCHES MAND./INT.ACCTS CBN TAKE-UP
per
cent
Source: CBN
The sum of N4,108.17 billion was repaid in the review year, resulting in a net
inflow of N765.78 billion from the banking system, as against a net outflow of
N62.52 billion in the preceding year.
Table 4.11: Liquidity Flows, 2017 - 2018
Period NTBs Allotted (Nbn) NTBs repaid((Nbn) Net flow (Nbn)
2018 3,342.39 4,108.17 765.78
2017 4,495.47 4,432.95 -62.52
Table 4.10: NTB Issues, Subscription, Allotments and Repayments, 2014-2018
(N’ billion)
2014 2015 2016 2017 2018
Offer Amount (N’bn) 3,879.47 3,845.32 4,555.50 4,495.46 3,342.39
Total Subscription (N’bn) 8,043.56 9,302.32 8,677.69 7,178.38 6,713.78
Allotment (N’bn) 3,879.47 3,845.32 4,555.50 4,495.46 3,342.39
Commercial & MBs 2,213.95 2,765.62 2,633.04 2,550.04 1,834.20
Mandate and Internal Fund 1,483.94 999.50 1,609.71 1,698.22 1,332.46
CBN branches/CBN take-up 181.58 80.20 312.75 120.02 175.72
Average Range of Successful
Bid Rates (%) 8.00 -15.99 3.63 -15.90
6.34 -
17.40 14.52-16.83
10.00-
14.45
Bid-Cover Ratio1 2.07 2.42 1.90 1.60 2.01
Repayments 1,690.05 3,875.12 3,936.12 4,432.95 4,108.17
Net Flows2 -2,189.43 29.8 -619.38 -62.52 765.78
4
DRAFT
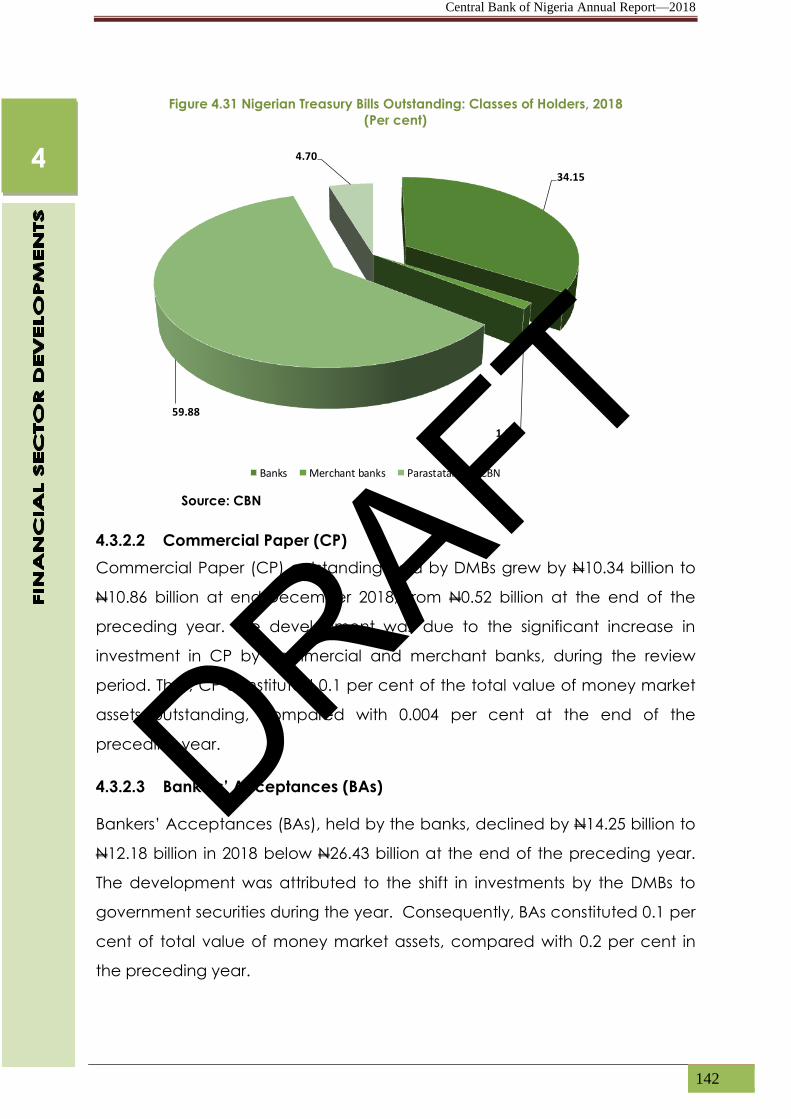
Central Bank of Nigeria Annual Report—2018
142
Figure 4.31 Nigerian Treasury Bills Outstanding: Classes of Holders, 2018
(Per cent)
34.15
1.27
59.88
4.70
Banks Merchant banks Parastatals CBN
Source: CBN
4.3.2.2 Commercial Paper (CP)
Commercial Paper (CP) outstanding held by DMBs grew by N10.34 billion to
N10.86 billion at end-December 2018, from N0.52 billion at the end of the
preceding year. The development was due to the significant increase in
investment in CP by commercial and merchant banks, during the review
period. Thus, CP constituted 0.1 per cent of the total value of money market
assets outstanding, compared with 0.004 per cent at the end of the
preceding year.
4.3.2.3 Bankers’ Acceptances (BAs)
Bankers’ Acceptances (BAs), held by the banks, declined by N14.25 billion to
N12.18 billion in 2018 below N26.43 billion at the end of the preceding year.
The development was attributed to the shift in investments by the DMBs to
government securities during the year. Consequently, BAs constituted 0.1 per
cent of total value of money market assets, compared with 0.2 per cent in
the preceding year.
4
DRAFT

Central Bank of Nigeria Annual Report—2018
143
4.3.2.4 Federal Republic of Nigeria Treasury Bonds
There was no new issue of the Federal Republic of Nigeria Treasury Bonds
(FRNTBs) in 2018, as the Federal Government relied on FGN Bonds to raise
funds. Therefore, the outstanding stock of the instrument at end-December
2018 stood at N150.99 billion, compared with N175.99 billion at end-
December 2017. The decline in the amount outstanding was due to the
redemption of N25.00 billion at the end of 2018. A breakdown of the amount
outstanding showed that the CBN held N42.55 billion, while N108.44 billion
was held in the Sinking Fund, compared with N57.64 billion and N118.35
billion, respectively, in 2017.
4.3.2.5 Federal Government of Nigeria (FGN) Bonds
New issues and re-openings of the FGN Bonds series 1, 2, 3 and 6 were
auctioned in 2018. Total FGN Bonds offered for sale was N1,070.0 billion, while
public subscription and sale stood at N1,506.0 billion and N762.0 billion,
respectively. These were lower than N1,490.0 billion, N2,377.4 billion and
N1,520.7 billion, issued, subscribed to and alloted in 2017, respectively. The
lower subscription was attributed to a lower offer amount and preference for
euro bonds.
Figure 4.32: Outstanding FGN Bonds, 2018
Source: CBN
Total value of the FGN Bonds outstanding at end-December 2018 was
N9,814.6 billion, compared with N9,195.61 billion at end-December 2017,
representing an increase of N618.92 billion or 6.7 per cent. The structure of
4
1,070.00
1,506.03
762.04
1,490.00
2,377.38
1,520.67
0.00
500.00
1,000.00
1,500.00
2,000.00
2,500.00
Issue Subscription Allotment
N b
illio
n
2018 2017
DRAFT

Central Bank of Nigeria Annual Report—2018
144
holdings in 2018 was: banks, N3,716.09 billion (37.9 %); brokers, N991.68 billion
(10.1 %); pension funds, N1,545.27 billion (15.7 %); corporate bodies, N568.46
billion (5.8 %); parastatals, N740.63 billion (7.6 %); CBN, N1,622.46 billion (16.5
%), while others accounted for the balance of N630.03 billion (6.0 %).
Figure 4.33: FGN Bonds by Holder, 2018 (Per cent)
37.9
10.1
15.7
7.65.8
16.5
6.0
0.0
5.0
10.0
15.0
20.0
25.0
30.0
35.0
40.0
Banks Brokers Pension Fund Parastatals Corporate
Bodies
CBN Others
Per
cent
Source: CBN
4.3.2.6 Federal Government of Nigeria Savings Bonds
A total of N3.59 billion was allotted during the review period, indicating a
decrease of N3.61 billion or 50.2 per cent, compared with N7.20 billion at
end-December 2017. The decrease was attributed to lower amount allotted
and the preference for foreign borrowing in the period under review. The
new issues were: 2 and 3 Years with the coupon rate applied ranging from
9.48 to 12.40 per cent and 10.48 to 13.40 per cent, respectively. The
applicable coupon rates for the 2 and 3 years in the previous year ranged
from 11.74 to 13.82 per cent and 12.74 to 14.82 per cent, respectively.
Consequently, total value of FGN Savings Bonds outstanding at end-
December 2018 was N10.75 billion.
4.3.2.7 Federal Government of Nigeria Green Bonds
There was no new issue of FGN Green Bonds in the review period.
Consequently, the total value outstanding at end-December 2018 remained
at N10.69 billion.
4
DRAFT
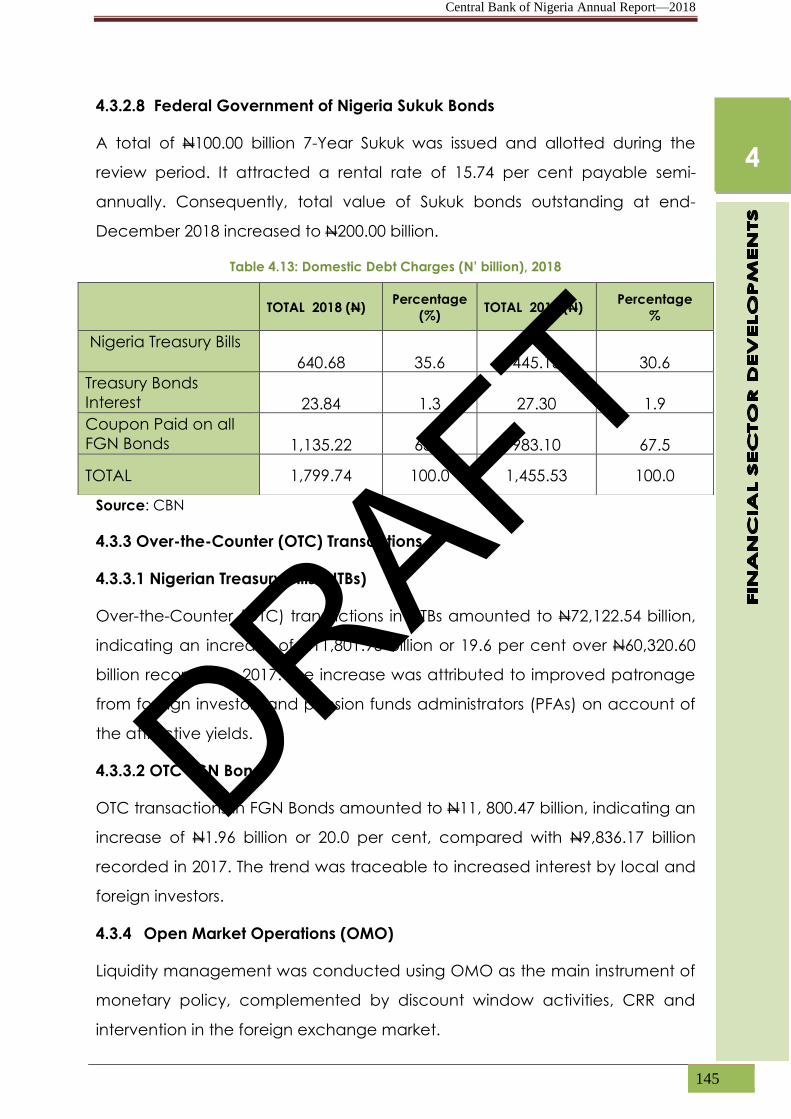
Central Bank of Nigeria Annual Report—2018
145
4.3.2.8 Federal Government of Nigeria Sukuk Bonds
A total of N100.00 billion 7-Year Sukuk was issued and allotted during the
review period. It attracted a rental rate of 15.74 per cent payable semi-
annually. Consequently, total value of Sukuk bonds outstanding at end-
December 2018 increased to N200.00 billion.
Table 4.13: Domestic Debt Charges (N’ billion), 2018
Source: CBN
4.3.3 Over-the-Counter (OTC) Transactions
4.3.3.1 Nigerian Treasury Bills (NTBs)
Over-the-Counter (OTC) transactions in NTBs amounted to N72,122.54 billion,
indicating an increase of N11,801.93 billion or 19.6 per cent over N60,320.60
billion recorded in 2017. The increase was attributed to improved patronage
from foreign investors and pension funds administrators (PFAs) on account of
the attractive yields.
4.3.3.2 OTC FGN Bonds
OTC transactions in FGN Bonds amounted to N11, 800.47 billion, indicating an
increase of N1.96 billion or 20.0 per cent, compared with N9,836.17 billion
recorded in 2017. The trend was traceable to increased interest by local and
foreign investors.
4.3.4 Open Market Operations (OMO)
Liquidity management was conducted using OMO as the main instrument of
monetary policy, complemented by discount window activities, CRR and
intervention in the foreign exchange market.
TOTAL 2018 (N)
Percentage
(%) TOTAL 2017 (N)
Percentage
%
Nigeria Treasury Bills
640.68 35.6 445.13 30.6
Treasury Bonds
Interest 23.84 1.3 27.30 1.9
Coupon Paid on all
FGN Bonds 1,135.22 63.1 983.10 67.5
TOTAL 1,799.74 100.0 1,455.53 100.0
4
DRAFT

Central Bank of Nigeria Annual Report—2018
146
4.3.4.1 OMO Auctions
Total CBN Bills offered at the OMO was N34,610.06 billion, while public
subscription and sale amounted to N24,916.29 billion and N22,350.16 billion,
respectively, compared with N12,860.09 billion, N12,230.49 billion and
N11,145.83 billion offered, subscribed and sold, respectively, in 2017.
Figure 4.34: OMO Issues and Sales, 2014 - 2018
Source: CBN
4.3.4.2 CBN Promisory Notes
There was no issuance of promissory notes in 2018, as in 2017, due to the
absence of new claims on the acquired banks.
4.3.4.3 Repurchase Transactions (Repo)
The total request for repo transactions was N966.06 billion, while the interest
rates ranged from 18.50 to 19.50 per cent for 4 to 90-day tenors.
Consequently, the total interest earned on repo was N23.55 billion. In the
preceding year, request for repo was N1,105.96 billion at the same rate of
interest for similar tenors. Total interest earned on repo was N32.65 billion.
4.3.5 Discount Window Operations
4.3.5.1 CBN Standing Facilities
Banks resorted to the standing facilities to square-up their daily positions
during the review period. The trend of activities at the window showed a
reduction in the participation at the SLF segment, when compared to 2017.
Applicable rates for SLF and SDF were 16.00 and 9.00 per cent in the review
period, same as the previous year. The rates were anchored on the Monetary
Policy Rate (MPR).
11
,39
2.1
6
7,9
14
.47
10
,29
4.4
1
12
,23
0.4
9
24
,91
6.2
9
8,1
49
.13
5,6
42
.04
7,8
59
.62
11
,14
5.8
3
22
,35
0.1
6
0.00
2,000.00
4,000.00
6,000.00
8,000.00
10,000.00
12,000.00
14,000.00
16,000.00
18,000.00
20,000.00
22,000.00
24,000.00
2014 2015 2016 2017 2018
N' B
illio
n
Bids Sales
4
DRAFT

Central Bank of Nigeria Annual Report—2018
147
4.3.5.1.1 The Standing Deposit Facility (SDF)
Patronage at the SDF window increased and averaged N103.50 billion in
2018. In the 246 transaction days within the period, the average daily deposits
from January to December was N84.27 billion, compared with N41.90 billion in
the previous year, while average interest earned during the year was N30.51
million compared with N14.86 million in the previous year.
4.3.5.1.2 The Standing Lending Facility (SLF)
In the 234 transaction days within the period, the average monthly request for
SLF was N48.44 billion. The average monthly interest earned was N78.12
million. In the previous year, the average monthly request for SLF was N216.34
billion, resulting in an average monthly interest earned of N159.96 million.
4.3.5.2 Rediscounting Transactions
Banks did not access the rediscounting window in the review period,
compared with N27.29 billion (CBN bills) in the corresponding period of 2017
to soften the liquidity needs of some banks. The tenor of the bills ranged from
6 to 129 days, effected at rates that ranged from 18.00 to 19.10 per cent.
Consequently, total interest earned was N0.67 billion in 2018.
4.4 OTHER FINANCIAL INSTITUTIONS
The total assets of other financial institutions (OFIs) excluding the BDCs, rose
by 35.7 per cent to N2,987.87 billion at end-December 2018, compared with
N2,201.64 billion at end-December 2017. Similarly, the aggregate net loans
and advances of the sub-sector rose by 15.0 per cent to N1,422.19 billion at
end-December 2018, compared with N1,237.14 billion at end-December
2017. Also, the total deposits increased by 28.7 per cent to N683.98 billion,
while the shareholders’ funds declined by 5.9 per cent to N458.74 billion at
end-December 2018, compared with N531.35 billion and N487.61 billion,
respectively, at end-December 2017. The increase in deposit was attributed,
to the rise in deposits for mortgages by PMBs customers and mandatory
deposits by MFBs customers, while the decline in shareholders’ funds
reflected negative reserves by the Federal Mortgage Bank of Nigeria (FMBN),
and the Bank of Agriculture (BOA).
4
DRAFT
Central Bank of Nigeria Annual Report—2018
148
4.4.1 Development Finance Institutions (DFIs)
The total assets of the seven (7) DFIs increased significantly by 47.1 per cent,
to N1,939.29 billion, at end-December 2018. Analysis of the asset base by
institution indicated that the Bank of Industry (BOI), the DBN, the FMBN, the
BOA, the Nigerian Export-Import Bank (NEXIM), the Nigeria Mortgage
Refinancing Company (NMRC) and The Infrastructure Bank (TIB) accounted
for 56.1, 14.4, 12.0, 7.6, 6.1, 3.6 and 0.3 per cent, respectively, of total assets.
Similarly, the paid-up capital of the sub-sector increased by 0.8 per cent, to
N238.78 billion, at end-December 2018.
The net loans and advances of the institutions also increased by 32.4 per
cent, to N918.47 billion in 2018, compared with N693.75 billion in 2017. The
proportion of the industry net loans and advances attributed to each
institution were: BOI (69.4%); FMBN (16.2%); BOA (5.1%); NEXIM (4.4%); DBN
(3.1%); and NMRC (1.9%). The shareholders’ funds increased to N248.88 billion
in 2018, from N247.31 billion in 2017 due to the increase in paid up capital
and reserves of DBN, which issued new shares and successfully raised its
capital to N100.0 billion at end December 2018, compared with N40.0 billion
at end-December 2017.
4.4.2 The Asset Management Corporation of Nigeria (AMCON)
The net carrying value of AMCON’s outstanding liabilities increased from
N4.53 trillion at end-December 2017 to N5.43 trillion at end-December 2018,
arising from the Corporation’s investment of N898.45 billion in Polaris Bank Ltd.
The carrying value of its assets, net of impairment, also rose to N769.87 billion,
from N769.75 billion in 2017. The gap between AMCON’s assets and its
liabilities was expected to be recovered from the Banking Sector Resolution
Cost Trust Fund (BSRCTF), credit recoveries and asset sales by the
Corporation. The investment in Polaris Bank Ltd would be redeemed through
a Sinking Fund to be called “Intervention Reserve Fund” which the bank
would maintain with the CBN. The bank would make an annual contribution
of 10 per cent of its annual gross earnings for the next twenty five years into
the Fund, towards the redemption of the Face Value of the Corporation’s
investment at maturity.
4
DRAFT

Central Bank of Nigeria Annual Report—2018
149
Total recoveries from inception stood at N759.05 billion at end-December
2018, and comprised cash (N366.85 billion), shares forfeiture (N128.47 billion)
and property forfeiture (N263.73 billion). The sum of N260.39 billion was
realised in 2018 from the BSRCTF and recoveries by the AMCON towards the
redemption of its outstanding bonds, compared with N263.04 billion in 2017.
The CBN makes an annual contribution of N50.0 billion to the BSRCTF, while
the contributions of the participating banks was determined based on 50
basis points of their on-balance sheet assets and contingent liabilities. The
recoveries generated by AMCON as well as the contributions to the BSRCTF
were used to repay the Corporation’s debt obligations, which fell due for
payment in December 2018.
4.4.3 The Nigeria Mortgage Refinance Company (NMRC)
The total assets of the Nigeria Mortgage Refinance Company (NMRC) stood
at N69.46 billion at end-December 2018, compared with N42.26 billion at
end-December 2017. The development was due, largely, to increase in
borrowings and other liabilities. Similarly, refinanced mortgages increased by
N8.98 billion to N17.13 billion in 2018, compared with N8.15 billion in 2017,
reflecting the creation of additional mortgages. The adjusted capital of
N11.49 billion was higher than both the N9.69 billion recorded in 2017 and the
minimum capital requirement of N5.0 billion for the Company. Similarly, the
capital adequacy ratio (CAR) and adjusted capital to net credit were 79.51
per cent and 1:0.84, respectively, at end-December 2018, compared with
139.83 per cent and 1:1.84 at end-December 2017. The reduction in CAR
and adjusted capital to net credit were attributed to increases in refinanced
mortgagaes and investment in quoted shares. The NMRC also complied with
the regulatory minimum and maximum CAR of 10.0 per cent and 1:10,
respectively.
The Composite Risk Rating, Earnings and Capital of the Company all of which
remain unchanged, were ‘Moderate’, ‘Acceptable’ and ‘Strong’,
respectively. Similarly, all the credit facilities of the Institution remained
‘Performing’. The Company’s profit before tax (PBT) was N1.81 billion for the
4
DRAFT

Central Bank of Nigeria Annual Report—2018
150
period ended December 2018, compared with N1.43 billion for the period
ended September 2017.
4.4.4 Microfinance Banks (MFBs)
The number of microfinance banks (MFBs) stood at 885 at end-December
2018, compared with 1,008 MFBs at end-December 2017. This comprised
eight (8) National, 135 State and 742 Unit MFBs. Provisional data revealed that
total assets/liabilities of MFBs was N421.95 billion at end-December 2018,
compared with N352.36 billion at end-December 2017. The paid-up capital
and shareholders’ funds increased by 9.1 per cent and 17.7 per cent to
N68.82 billion and N97.63 billion, respectively, compared with the levels at
end-December 2017. The development was attributed to modest capital
injection, increase in operating profits and revocation of operating licences
of 153 MFBs during the review period. Net loans and advances increased by
14.4 per cent to N220.95 billion at end-December 2018, compared with
N193.16 billion at end-December 2017. Deposit liabilities rose by 31.3 per cent
to N213.25 billion. Reserves also increased by 45.1 per cent, to N28.81 billion
at end-December 2018, compared with N19.86 billion at end-December
2017.
Overall, the average capital adequacy ratio (CAR) of the sub-sector rose to
41.75 per cent in 2018, compared with 34.64 per cent in 2017. Also, the
average portfolio-at-risk (PAR) increased to 23.1 per cent at end-December
2018, from 21.2 per cent at end-December 2017, indicating a further
deterioration in the quality of risk assets. Industry average return on assets
(ROA) declined to 1.2 per cent at end-December 2018, from 3.9 per cent at
end-December 2017, while return on equity (ROE) increased to 16.46 per
cent at end-December 2018, compared with 7.6 per cent at end-December
2017. Average liquidity ratio fell to 82.8 per cent at end-December 2018,
below 91.7 per cent at end-December 2017. At that level, liquidity ratio was
62.8 percentage points above the stipulated minimum ratio of 20.0 per cent.
Investible funds, available to the sub-sector in the review year, amounted to
N70.45 billion, compared with N28.8 billion in 2017. The funds were sourced
from increased deposits (N50.78 billion), draw-down on reserves (N8.95
4
DRAFT

Central Bank of Nigeria Annual Report—2018
151
billion), increase in paid up capital (N5.70 billion), as well as, long-term loans
(N2.04 billion). The funds were used to increase placements with other banks
(N30.87 billion), net loans and advances (N27.80 billion), and bank balances
(N7.73 billion).
4.4.4.1 The Maturity Structure of Microfinance Banks (MFBs) Loans &
Advances and Deposit Liabilities
Short-term credit remained dominant with microfinance banks (MFBs) in the
review year, driven, largely, by the short-term structure of deposits collected
by institutions in the sub-sector. Accordingly, at end-December 2018, short-
term loans (with maturity less than one year), accounted for 82.9 per cent of
the aggregate loans and advances, indicating 3.4 percentage points below
the 86.3 per cent in the preceding year. Loans with long-term maturity (over
360 days) accounted for 17.1 per cent of the total, compared with 13.7 per
cent at end-December 2017. Similarly, analysis of the deposit structure
showed that short-term deposit liabilities (less than one year maturity)
remained dominant, constituting 89.3 per cent of total deposit liabilities,
indicating 0.8 percentage point increase, above 88.5 per cent in 2017.
Deposits of long-term maturity (above 1 year) accounted for 10.7 per cent at
end-December 2018, compared with 11.5 per cent in 2017.
Table 4.14: Maturity Structure of Assets and Liabilities of Microfinance
Banks (MFBs), 2017 - 2018
(Per cent)
2017 2018 Tenor/Period Loans and
Advances Deposits
Loans and
Advances Deposits
0-30 days 24.8 44.7 24.8 44.7
31-60 days 8.3 10.7 8.3 10.7
61-90 days 10.8 12.2 10.8 12.2
91-180 days 22.0 12.1 22.0 12.1
181-360 days 20.4 8.8 20.4 8.8
Short-Term 86.3 88.5 86.3 88.5
Above 360 days 13.7 11.5 13.7 11.5
Total 100.0 100.0 100.0 100.0
Source: Central Bank of Nigeria
4.4.5 Finance Companies (FCs)
The total assets/liabilities of the FCs increased by 25.4 per cent to N174.69
billion, compared with N139.36 billion in the preceding year. Similarly, loans
and advances increased by 30.0 per cent to N53.16 billion at end-December
4
DRAFT

Central Bank of Nigeria Annual Report—2018
152
2018, compared with N40.90 billion in 2017. Investments also increased by 6.8
per cent to N13.00 billion at end-December 2018, from N12.17 billion at end-
December 2017. The development reflected increase in borrowings by 29.0
per cent to N103.82 billion at end-December 2018 from N80.47 billion at end-
December 2017. The shareholders’ funds, increased by 9.6 per cent to N29.25
billion at end-December 2018, compared with N26.69 billion at end-
December 2017. This was as a result of the injection of additional capital and
asset revaluation surplus occasioned by the newly licensed FCs and the
adoption of the IFRS by majority of the institutions.
4.4.6 Primary Mortgage Banks (PMBs)
There were 352 licensed PMBs at end-December 2018, compared with 34
PMBs at end-December 2017. These comprised 12 National and 23 State
PMBs. The total assets/liabilities of the PMBs increased, marginally, by 1.4 per
cent to N451.95 billion, compared with N445.70 billion in 2017. This reflected
the 18.2 per cent decrease in the shareholders’ funds, which stood at N82.99
billion in 2018, compared with N101.43 billion in 2017. Loans and advances
and placement with banks increased to N229.60 billion and N41.03 billion,
respectively, compared with N222.96 billion and N36.77 billion in 2017. Non-
current assets held for sale decreased to N62.12 billion at end-December
2018, compared with N74.25 billion at end-December 2017.
Investible funds available to the PMBs, amounted to N42.98 billion. The funds
were sourced, mainly, from increased long-term loans (N13.24 billion),
investments/non-current assets held for sale (N12.13 billion) and other
liabilities (N9.21 billion). Additional funds were sourced from decrease in
placement with banks (N1.59 billion), and increase in short-term investment
(N3.19 billion). The funds were utilised, mainly, to increase reserves (N18.97
billion), other assets (N9.84 billion), as well as, loans and advances (N6.64
billion).
2 Due to an inconclusive merger arrangement, 1 PMB that was earlier delisted was recognised.
4
DRAFT

Central Bank of Nigeria Annual Report—2018
153
4.4.7 Bureaux-de-Change (BDCs)
The number of licensed BDCs increased to 4,492 at end-December 2018,
compared with 3,740 at end-December 2017. The increase was as a result of
the licensing of 752 new BDCs during the review period.
4.5 CAPITAL MARKET DEVELOPMENTS
4.5.1 Developments in the Nigerian Capital Market
The Securities and Exchange Commission (SEC) sustained its activities aimed
at strenghtening regulation and ensuring the efficient functioning of the
Nigerian capital market, in line with the stipulated recommendations
contained in the Nigerian Capital Market Master Plan (2015 - 2025). To this
end, the Commission continued the implementation of the exisiting initiatives
and developed new ones as follows:
Inauguration of a Market-wide Fintech Committee in November 2018
to facilitate the development of the Fintech Road Map for the Nigerian
capital market;
Development of a framework to ensure viable commodity market in
Nigeria, via the implementation of the Commodities Ecosystem Report.
In addition, relevant adjustments and improvements were made within
the Commission’s structure to facilitate the attainment of the
Commodity ecosystem road map;
Collaboration with the Nigerian Educational and Research
Development Council (NERDC) to introduce capital market studies into
the curriculum of basic and senior secondary schools, as part of efforts
to boost the level of financial literacy in the country. The Commision
also sustained its routine nationwide enlightenment campaigns and
capital market clinics;
Approval of the Rules on Green Bonds to ensure that debt instruments
were offered for the purpose of financing or re-financing projects
which yielded positive environmental impact. In addition to the
general requirements for the registration of debt instruments and
reporting obligations of issuers, the rules provide a guideline for the
4
DRAFT
Central Bank of Nigeria Annual Report—2018
154
management of issues proceeds and a process for refinancing
environmental friendly projects;
Participation in a flagship Pan-African programme designed to
strengthen Africa’s capital markets. The SEC was the first capital market
regulator to participate in the programmes which seeks to unlock
capital and build investor confidence through the implementation of
stong regulations and international standards. The Programme, which
was expected to run over a three-year period, will see FSD Africa, a UK
Aid funded non-profit company, provide funding to build the capacity
of the Commission, as well as provide world-class technical assistance
to encourage closer collaboration among regulators. The funding
would also cover conduct of research to support the development of
new policies and regulations;
Extension of the forebearance window by another year from the
previously communicated deadline of December 31, 2018, to enable
investors take advantage of the opportunity to claim their dividends
and bonuses; and
Introduction of electronic distribution of annual reports and accounts
to shareholders by public companies, to reduce costs and ensure a
seamless distribution.
4.5.2 The Nigerian Stock Exchange (NSE)
In line with the advent of the 4th industrial revolution, the NSE introduced a
new corporate strategic road map for the 2018 - 2021 period. The road map
is focused on three primary areas: enhancing customer focus; reorganising
for optimisation; and capitalising on “Big Bang” opportunities, including big
data analytics and blockchain technology. The organisation was also
restructured to establish departments, such as the Enterprise Innovation,
Retail Coverage and State Owned Enterprises (SOE) departments to boost
retail investors’ activity and position the body to favourably compete with its
international counterparts.
Furthermore, the Exchange achieved significant strides on key initiatives,
including Demutualisation and Exchange Traded Derivatives (ETDs). The
4
DRAFT

Central Bank of Nigeria Annual Report—2018
155
Demutualisation Bill was successfully approved and signed into law during the
review year. Work was ongoing on finalising later stages of the process, which
includes engagement with key stakeholders. On the derivatives initiative, the
Exchange enhanced its technology infrastructure to support the trading of
ETDs, as well as, created an ETD rule book. As at end-December 2018, the rule
book was undergoing the approval process, alongside on-boarding of
dealing members.
The Exchange also accomplished significant feats across the core areas of
business development, corporate citizenship, market development and
investor protection. Some of these included: the launch of the Corporate
Governance Index to track the performance of companies that meet certain
stringent corporate governance criteria; migration of four (4) companies to
the Premium Board of the Exchange; and redesign of the NSE website to
boost analytics and for ease of navigation. Others were: deployment of X-
pay, an online payment platform for all products and services offered;
deployment of XBot, an artificial intelligence powered chat-bot to improve
customer engagement and satisfaction; secured approval from the SEC for
Sustainability Disclosure Guidelines for all listed companies; and implemented
a new equity market structure to dampen volatility and enable pricing
efficiency during the open & close auctions, among others.
Capital importation to Nigeria increased by 48.5 per cent at end-December
2018, from the level in the preceding year. However, monetary policy
normalisation in the US, and subsequent risk averse sentiments for emerging
and frontier markets, as well as political uncertainties due to the upcoming
elections in Nigeria, led to the steady decline of foreign portfolio investment
(FPI) flows during the year. Although, the Nigerian economy marginally
recovered during the year, the decline observed in the Nigerian capital
market mirrored the negative sentiments observed in global capital markets
in 2018.
4.5.2.1 The Secondary Market
Activities in the secondary segment of the Nigerian capital market in 2018
were bearish, as major market indicators, with the exception of the market
4
DRAFT

Central Bank of Nigeria Annual Report—2018
156
turnover volume, trended downward. This was on account of perceived
political risks, volatility in oil prices and rising global yields which resulted in
negative sentiments in the market.
At end-December 2018, the cumulative volume and value of traded
securities were 101.15 billion shares and N1.19 trillion, respectively, in 1,048,776
deals. The total volume of traded securities rose
by 0.8 per cent, while the total value of traded
securities fell by 6.2 per cent, from the
preceding year’s level of 100.31 billion shares
and N1.27 trillion in 837,421 deals, respectively. The bulk of the transactions
were in equities, which accounted for 99.9 per cent of the turnover volume
and value of traded securities apiece, compared with 99.9 per cent and 99.8
per cent, respectively, in 2017. The average daily volume and value of
traded equities were 409.0 million shares and N4.8 billion, respectively,
compared with 406.7 million shares and N5.1billion, in 2017.
Transactions in the financial services sector accounted for the bulk of
activities, with volume of traded stocks at 75.0 billion shares (74.2%), valued at
N776.2 billion (65.0%) in 619,493 deals, compared with 66.2 billion shares
(66.0%), valued at N488.7 billion (38.4%) in 508,042 deals in the preceding
year. The banking sub-sector remained the most active (by volume) with
……. billion traded securities worth N……. billion, in …….. deals in 2018,
compared with 39.3 billion traded securities worth N412.4 billion, in 338,954
deals in 2017.
The aggregate market capitalisation of the 286 listed securities fell by 3.6 per
cent to N21.90 trillion, compared with the level in 2017. This reflected the
decline in the value of securities across different asset classes (equities and
ETF). Similarly, market capitalisation of the 169 listed equities fell by 13.9 per
cent, compared with the level in 2017, to N11.73 trillion at end-December
2018. The equities segment constituted 53.6 per cent of aggregate market
capitalisation, compared with 59.4 per cent in 2017. There were 6 banks in
the top twenty (20) most-capitalised stocks on the Exchange, same as in
The secondary market segment of the NSE was bearish and bulk of the transactions remained in equities.
4
DRAFT

Central Bank of Nigeria Annual Report—2018
157
2017. The banks accounted for 22.3 per cent of the market capitalisation,
below the level of 25.7 per cent reported in 2017.
Total market capitalisation, as a percentage of the nominal GDP, was 17.1
per cent, compared with 20.1 per cent at end-December 2017. Similarly, the
ratio of the value of traded stocks to GDP was 0.9 per cent, compared with
1.1 per cent recorded at end-December 2017.
Figure 4.35: Trends in Market Capitalisation and NSE Value Index, 2014-2018
Source: NSE
The debt securities component of the market capitalisation, included Federal
Government Bonds (N9.4 trillion or 42.9%), sub-national and supra-national
Bonds (N523.4 billion or 2.4%) and Corporate Bonds/Debentures (N256.6
billion or 1.2%), and the Exchange Traded Funds (ETFs) accounted for the
balance (N6.1 billion or 0.03%).
At end-December 2018, the number of listed securities rose to 286 from 261 at
end-December 2017, while the number of listed companies fell to 164 from
167 at end-December 2017. The number of listed bonds rose significantly to
108 from 80 recorded at the end of preceding year, while the number of
Exchange Traded Funds (ETF) remain unchanged at 9, at end-December
2018. The number of listed equities fell to 170 from 172 at end-December
2017.
0
5
10
15
20
25
30
35
40
45
0.0
5.0
10.0
15.0
20.0
25.0
2014 2015 2016 2017 2018
Ind
ex (
19
84
=10
0)
N' T
rilli
on
Market Capitalisation (left axis) Banking Sector Market Capitalisation
Index (right axis)
4
DRAFT

Central Bank of Nigeria Annual Report—2018
158
Figure 4.36: Aggregate Market Capitalisation (Per cent)
Source: SEC
Foreign portfolio investment flows was higher than domestic portfolio
investment flows in eight out of twelve months in 2018. Accordingly, the share
of foreign portfolio investors, in total transactions, was 50.9 per cent, while the
domestic transactions accounted for 49.1 per cent of total transactions,
compared with 47.5 per cent and 52.5 per cent, respectively, in 2017.
Figure 4.37: Share of Banks in the 20 Most Capitalised Stocks in the NSE, 2014 – 2018
Source: Securities and Exchange Commission
Corporate bonds
and ETF 1.2% Sub-National
Bonds, 2.3%
Equities, 53.6%
Federal
Government
Bonds, 42.9 %
0
5
10
15
20
25
30
2014 2015 2016 2017 2018
30
20 22.5
25.7
22.3
4
DRAFT

Central Bank of Nigeria Annual Report—2018
159
2014 2015 2016 2017 2018
Number of Listed Securities 253.00 257.00 247.00 261.00 286.00
Volume of Stocks Traded (Turnover Volume) (Billion) 108.47 92.90 95.80 100.30 101.20
Value of Stocks Traded (Turnover Value) (Billion Naira) 1338.60 952.80 575.70 1273.20 1194.30
Value of Stocks Traded/GDP (%) 1.50 1.00 0.60 21904.30
Total Market Capitalisation (Billion Naira) 16875.10 17003.40 16185.70 22917.90 2405.80
Of which: Banking Sector (Billion Naira) 2367.00 1888.80 1905.70 3292.20
Total Market Capitalisation/GDP (%) 19.00 18.00 16.00 20.12
Of which: Banking Sector/GDP (%) 2.70 2.00 1.90 2.90
Banking Sec. Cap./Market Cap. (%) 14.00 8.50 11.80 14.40 11.00
Annual Turnover Volume/Value of Stock (%) 8.10 9.80 16.60 7.90 8.50
Annual Turnover Value/ Total Market Capitalisation (%) 7.90 5.60 3.50 5.60 5.50
NSE Value Index (1984=100) 34657.20 28642.30 26874.60 38243.20 31430.50
Growth (In per cent)
Number of Listed Securities -0.40 1.60 -3.90 5.70 9.60
Volume of Stocks -59.40 14.40 3.20 4.70 0.90
Value of Stocks -43.10 -29.00 -39.60 121.20 -6.20
Total Market Capitalisation -11.50 0.80 -4.80 41.60 -4.40
Of which: Banking Sector -19.50 -20.20 0.90 72.80 -26.90
Annual Turnover Value 0.00 -29.00 -39.60 4.70 -1.80
NSE Value Index -16.10 -17.40 -6.20 42.30 -17.80
Share of Banks in the 20 Most Capitalised Stocks in the NSE (%) 30.00 20.90 22.50 25.70 28.91
Table 4.15: Indicators of Capital Market Developments in the Nigerian Stock Exchange (NSE), 2014 - 2018
Source: Securities and Exchange Commission
4.5.2.2 The NSE Value Index
Although market indices opened 2018 against the backdrop of gains made
in 2017, the value index generally trended downwards at end-December
2018. The development was attributed, mainly, to interest rates normalisation
in the USA, which led to capital flow reversals, as well as negative market
sentiments. Consequently, the NSE All-Share Index, which is a key indicator on
the Exchange, closed at 31,430.5 at end-December 2018, representing 17.8
per cent decrease below the 38,243.19 recorded at end-December 2017.
Furthermore, all twelve (12) sector indices of the NSE recorded negative
growth at end-December 2018. The NSE-Oil/Gas index outperformed all other
indices, declining by 8.2 per cent, other indices also declined by: NSE 30
(18.8%); NSE Consumer Goods (23.4%); NSE Banking (16.1%); NSE Insurance
(10.0%); NSE Lotus Islamic (12.9%); NSE Industrial (37.5%); NSE-ASeM (25.9%);
NSE Pension (12.8%); NSE Main Board (16.0%); NSE Premium (14.4%); and NSE
CG (26.1%), relative to the levels at the end of the preceding year.
4
FINANC
IAL
SECTOR
DEVELO
PMENTS
4
DRAFT

Central Bank of Nigeria Annual Report—2018
160
4.5.2.3 The New Issues Market
Activities in the primary segment of the market improved in 2018. There were
62 new securities issuance, worth N1.31 trillion, in the review year, compared
with 54 securities, worth N1.98 trillion in 2017. In addition, there were
supplementary listings, new issuances and one Initial Public Offering (IPO)
during the review period. A total of five (5) equity rights issues, worth N141.0
billion, were approved by the Commission.
Notore Chemicals Industries Plc was listed by introduction on the Exchange,
while four (4) companies were delisted voluntarily. Consequently, the number
of listed equities declined from 172 in 2017 to 169 in 2018. In the debt
securities category, sixteen (16) corporate bonds, amounting to N180.69
billion, and thirty-four (34) FGN bonds, worth N918.94 billion were issued. The
total new issues approved by the SEC, amounted to N535.68 billion.
Furthermore, there were 33 new bonds, issued by the DMO, worth N1.55
trillion. Consequently, the number of listed bonds and Exchange Traded
Funds were 108 and 9, respectively, at end-December 2018.
Figure 4.38: New Issues by Sector 2018 (Per cent)
FGN Bonds, 70.1%
Equity, 16.1%
Corporate Bonds, 13.8%
FGN Bonds Equity Sub-national Bonds Corporate Bonds
Source: SEC
4
DRAFT
Central Bank of Nigeria Annual Report—2018
161
igeria’s fiscal policy thrust in 2018 was aimed at consolidating on the achievements
of the reflationary policies of the Government in the past two years. Actual federally-
collected revenue (gross) was N9,551.6 billion or 7.3 per cent of GDP, indicating a
rise of 28.3 per cent over the amount realised in fiscal 2017. The development was
attributed to the increased earnings from both oil and non-oil revenue due to
improved security, continued stability in the foreign exchange market, increase in crude oil
production and prices, broadening of the tax base as well as identifying and plugging
revenue leakages.
The sum of N6,635.0 billion was transferred to the Federation Account, reflecting an increase
of 51.8 per cent above the level in fiscal 2017.
The Excess Crude Account (ECA), however, fell from US$2.45 billion at end-December 2017 to
US$0.48 billion at end-December 2018, owing to significant draw-down to bridge the
financing gap of the three-tiers of government.
Federal Government retained revenue in 2018, at N4,185.6 billion, rose by 47.0 per cent
above the level in fiscal 2017, while aggregate expenditure, at N7,813.7 billion, increased by
21.0 per cent above the level in 2017. Consequently, the fiscal operations of the Federal
Government resulted in an overall deficit of N3,628.1 billion, or 2.8 per cent of GDP, financed
through domestic and external sources.
Provisional data on state governments and the FCT finances indicated an overall deficit of
N706.2 billion, or 0.6 per cent of GDP, while the local governments recorded a deficit of N0.2
billion.
The consolidated debt stock of the Federal Government stood at N18,901.4 billion, or 14.8
per cent of GDP, at end-September 2018, compared with N18,377.0 billion, or 16.2 per cent
of GDP, at end-December 2017. External debt stock rose by 14.2 per cent to US$21.6 billion,
following additional commercial loans that were secured to finance maturing Nigeria
Treasury Bills and critical infrastructure. However, domestic debt fell by 2.4 per cent to
N12,286.8 billion as a result of the redemption of maturing NTBs as well as reduction in the net
issuance of Nigerian Treasury Bills (NTBs) and Treasury Bonds.
5.1 THE FISCAL POLICY THRUST
The 2018 Budget, “Budget of Consolidation”, was aimed at leveraging the
achievements of previous Budgets and delivering on the objectives of
Nigeria’s Economic Recovery and Growth Plan (ERGP) 2018–2020. Hence, the
2018 Budget was committed to investing in critical infrastructure capable of
creating jobs and spurring economic growth, thereby sustaining the
reflationary policies of these Budgets.
N
CHAPTER FIVE
FISCAL POLICY AND GOVERNMENT
FINANCE
DRAFT

Central Bank of Nigeria Annual Report—2018
162
The specific objectives of the 2018 budget were to:
Provide adequate counterpart funding obligations;
Complete all ongoing projects and carry forward all strategic
uncompleted projects from previous Budgets;
Pursue a gender-sensitive, pro-poor programme, including catering for
the most vulnerable;
Implement the Conditional Cash Transfer (CCT) programme as well as
continue the National Home-Grown School Feeding programme;
Reduce violent crime across the country; and
Commit to the security of life and property.
The key assumptions of the budget were: benchmark oil price of US$45 per
barrel (pb); crude oil production of 2.3 million barrels per day (mbpd); and
exchange rate of N305/US$. In line with these assumptions, the budget
projected a distributable revenue (net) of N12.0 trillion, with oil revenue
constituting N6.4 trillion or 53.3 per cent of the total; and non-oil revenue,
accounting for the balance of N5.6 trillion or 46.7 per cent. Of the
distributable revenue, the shares of the Federal and sub-national
governments were projected at N5.0 trillion and N4.2 trillion, respectively.
Also, the Federal Government was allocated N0.8 trillion and N1.9 trillion from
independent revenue and other miscellaneous sources, respectively,
bringing FGN retained revenue to N7.7 trillion.
The budget envisaged an aggregate expenditure of N8.6 trillion, comprising
statutory transfers, N0.5 trillion; debt service (including provision for Sinking
Fund), N2.2 trillion; non-debt recurrent expenditure, N3.5 trillion; and capital
expenditure, N2.4 trillion. Thus, resulting in an overall deficit of N2.0 trillion or
1.8 per cent of GDP. The deficit was expected to be financed from external
and domestic sources.
5
DRAFT

Central Bank of Nigeria Annual Report—2018
163
5.2 FEDERATION ACCOUNT OPERATIONS
5.2.1 Federally-collected Revenue
Total federally-collected revenue (gross) rose by 28.3 per cent to N9,551.6
billion in 2018, constituting 7.3 per cent of GDP. The development was
attributed to improved receipts from both oil and non-oil sources. The
enhanced revenue from oil was as a result of
the improvement in crude oil production and
prices at the international market, while the
expansion of the tax base as a result of the
Executive Order on Voluntary Assets and
Income Declaration Scheme (VAIDS), contributed to the increase in non-oil
revenue.
Figure 5.1: Oil and Non-oil Revenue (per cent of GDP), 2014 - 2018
Sources: Computed based on data from the Federal Ministry of Finance (FMF) and the Office
of the Accountant General of the Federation (OAGF)
5.2.1.1 Oil Revenue
Oil revenue (gross) was N5,545.6 billion or 4.3 per cent of GDP, representing
58.1 per cent of total federally-collected revenue. This indicated an increase
of 34.9 per cent above the level in 2017. A breakdown of oil revenue showed
that petroleum profit tax (PPT)/royalties rose by 106.8 per cent to N3,726.1
billion, attributed, largely, to improvement in crude oil prices and subsisting
peace deal in the Niger Delta. The average price of crude oil in the
7.5
4.0
2.7 3.6
4.3 3.4 3.1 2.7 2.9 3.0
-
2.0
4.0
6.0
8.0
2014 2015 2016 2017 2018
Per
cen
t
Oil Revenue Non-oil Revenue
5
Total federally-collected revenue rose by 28.3
per cent to N9,551.6 billion in 2018 and
constituted 7.3 per cent of GDP.
DRAFT

Central Bank of Nigeria Annual Report—2018
164
international market increased by 32.0 per cent to US$72.6 pb in 2018, above
the level in 2017. Also, average crude oil production and export increased by
9.3 and 12.6 per cent to 1.88 mbpd and 1.43 mbpd, respectively in 2018,
above the levels in 2017.
Of the gross oil revenue, N539.0 billion was deducted for the Joint Venture
Cash (JVC) calls, N309.5 billion for excess crude/PPT/royalty proceeds and
N79.4 billion for “others”3, leaving a balance of N4,617.7 billion for distribution
to the three-tiers of government.
Figure 5.2: Federation Account: Composition of Revenue (Naira Billion), 2014 – 2018
Sources: Computed based on data from the FMF and the OAGF
5.2.1.2 Non-oil Revenue
Non-oil revenue (gross), at N4,006.0 billion, or 3.0 per cent of GDP, accounted
for 41.9 per cent of total revenue, indicating a 20.1 per cent increase above
the level in 2017. The rise in non-oil revenue reflected improvement in
economic activities in the non-oil sector, increased receipts by revenue
collecting agencies and expansion of the tax base. A breakdown of non-oil
revenue (gross) indicated that corporate tax (CT), VAT, customs & excise
duties, FG Independent Revenue and “others”4, rose by 18.5, 13.4, 12.3, 39.5
and 51.3 per cent to N1,429.9 billion, N1,097.4 billion, N705.5 billion, N395.2
billion and N378.0 billion, respectively. This was attributed to the introduction
of VAIDS, which brought more companies and individuals into the tax net.
3 Include Lagos State 13% derivation, Pre-Export Financing cost and DPR cost of collection.
4 Include Education Tax, Customs Special Levies (Federation and Non-Federation Accounts) and the National Information
Technology Development Fund (NITDF)
6,7
93
.8
3,8
30
.1
2,6
93
.9
4,1
09
.8
5,5
45
.6
3,2
75
.0
3,0
82
.4
2,9
22
.5
3,3
35
.2
4,0
06
.0
-
1,000.0
2,000.0
3,000.0
4,000.0
5,000.0
6,000.0
7,000.0
8,000.0
2014 2015 2016 2017 2018
N' B
illio
n
Oil Revenue Non-oil Revenue
5
DRAFT
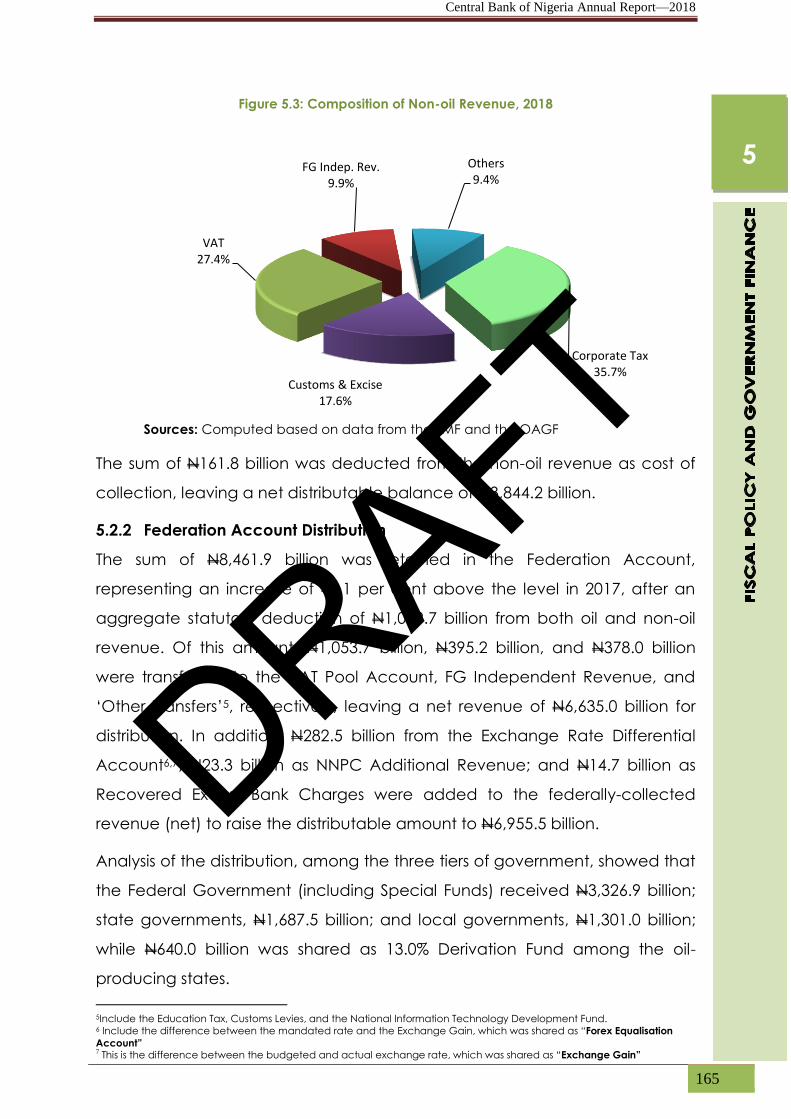
Central Bank of Nigeria Annual Report—2018
165
Figure 5.3: Composition of Non-oil Revenue, 2018
Sources: Computed based on data from the FMF and the OAGF
The sum of N161.8 billion was deducted from the non-oil revenue as cost of
collection, leaving a net distributable balance of N3,844.2 billion.
5.2.2 Federation Account Distribution
The sum of N8,461.9 billion was retained in the Federation Account,
representing an increase of 45.1 per cent above the level in 2017, after an
aggregate statutory deduction of N1,089.7 billion from both oil and non-oil
revenue. Of this amount, N1,053.7 billion, N395.2 billion, and N378.0 billion
were transferred to the VAT Pool Account, FG Independent Revenue, and
‘Other Transfers’5, respectively, leaving a net revenue of N6,635.0 billion for
distribution. In addition, N282.5 billion from the Exchange Rate Differential
Account6,7; N23.3 billion as NNPC Additional Revenue; and N14.7 billion as
Recovered Excess Bank Charges were added to the federally-collected
revenue (net) to raise the distributable amount to N6,955.5 billion.
Analysis of the distribution, among the three tiers of government, showed that
the Federal Government (including Special Funds) received N3,326.9 billion;
state governments, N1,687.5 billion; and local governments, N1,301.0 billion;
while N640.0 billion was shared as 13.0% Derivation Fund among the oil-
producing states.
5Include the Education Tax, Customs Levies, and the National Information Technology Development Fund. 6 Include the difference between the mandated rate and the Exchange Gain, which was shared as “Forex Equalisation
Account” 7 This is the difference between the budgeted and actual exchange rate, which was shared as “Exchange Gain”
Corporate Tax 35.7%
Customs & Excise 17.6%
VAT 27.4%
FG Indep. Rev. 9.9%
Others 9.4%
5
DRAFT

Central Bank of Nigeria Annual Report—2018
166
5.2.3 VAT Pool Account Distribution
The sum of N1,046.5 billion was transferred to the VAT Pool Account,
representing an increase of 12.7 per cent above the level in 2017. Analysis of
the distribution among the three-tiers of government, showed that the
Federal Government (including the FCT) received N157.0 billion (15.0%); and
state and local governments, N523.3 billion (50.0%) and N366.3 billion (35.0%),
respectively.
5.2.4 Cumulative Distribution
Cumulatively, the three-tiers of government and the 13.0% Derivation Fund,
shared the sum of N8,001.9 billion from statutory revenue and VAT in fiscal
2018. This was above the preceding year’s level of N5,926.0 billion by 35.0 per
cent, but below the fiscal 2018 target of N11,609.1 billion by 31.1 per cent.
Figure 5.4: Cumulative Distribution of Statutory Revenue & VAT, 2018 (Naira Billion)
Sources: Computed based on data from the FMF and the OAGF
5.3 GENERAL GOVERNMENT FINANCES
5.3.1 Aggregate Revenue
Provisional data showed that at N9,573.6 billion or 7.5 per cent of GDP, the
aggregate revenue of general government in 2018, comprised: the
Federation Account, N6,634.9 billion; VAT Pool Account, N1,046.5 billion;
Exchange Gain8, N282.5 billion; Recovered Excess Bank Charges, N14.7
billion; and NNPC Refunds, N23.3 billion9. Revenue exclusive to the Federal
Government consisted of: Federal Government Independent Revenue,
8 Includes revenue from Forex Equalisation Account 7 Includes additional NNPC Payment to the three-tiers of Government.
3,3
26
.9
1,6
87
.5
1,3
01
.0
64
0.0
157.0
523.3 366.3
-
500.0
1,000.0
1,500.0
2,000.0
2,500.0
3,000.0
3,500.0
Federal Government State Government Local Government 13% Derivation Fund
N' B
illio
n
Statuory VAT
5
DRAFT

Central Bank of Nigeria Annual Report—2018
167
N395.2 billion; and “Others10”, N306.6 billion. In addition, revenue exclusive to
the sub-national (state and local) governments included: N772.1 billion; N77.4
billion; N1.0 billion; N16.1 billion; and N3.3 billion, from Internally-Generated
Revenue, Grants, Stabilisation, State allocations to local governments and
“Others”, respectively.
FG's Share FCT Sub-Total States 13% Sub-Total
Statutory Allocation 3,118.6 60.3 3,178.9 1,612.4 600.4 2,212.9 1,243.1 6,634.9
Share from Excess PPT Revenue 0.0 0.0 0.0 0.0 0.0 0.0 0.0 -
Exchange Gain 127.0 2.5 129.5 65.7 36.7 102.4 50.6 282.5
NNPC Refunds 10.5 0.2 10.7 5.4 3.0 8.4 4.2 23.3
Share of Excess Non-Oil Revenue 0.0 0.0 0.0 0.0 0.0 0.0 0.0 -
Solid Mineral Revenue Distribution 0.0 0.0 0.0 0.0 0.0 0.0 0.0 -
Recovered Excess Bank Charges 7.6 0.1 7.8 3.9 0.0 3.9 3.0 14.7
Share of VAT 146.5 10.5 157.0 523.3 0.0 523.3 366.3 1,046.5
FG Independent Revenue 395.2 0.0 395.2 0.0 0.0 0.0 0.0 395.2
Privatization Proceeds 0.0 0.0 0.0 0.0 0.0 0.0 0.0 -
Internally-Generated Revenue 0.0 0.0 0.0 755.7 0.0 755.7 32.5 788.2
Less State Allocation to LG 0.0 0.0 0.0 16.1 0.0 16.1 0.0 16.1
Net Internally-Generated Revenue 0.0 0.0 0.0 739.6 0.0 739.6 32.5 772.1
Grants 0.0 0.0 0.0 71.8 0.0 71.8 5.6 77.4
Share of Stabilization Fund 0.0 0.0 0.0 1.0 0.0 1.0 0.0 1.0
State Allocation to LG 0.0 0.0 0.0 0.0 0.0 0.0 16.1 16.1
Others 306.6 0.0 306.6 0.0 0.0 0.0 3.3 309.8
TOTAL 4,112.0 73.6 4,185.6 3,039.2 640.1 3,679.4 1,724.7 9,573.6
Table 5.1: Sources of Funds for the Three-Tiers of Government 2018 (Naira Billion)
SourceFederal Government State Governments Local
Governmen
ts
Grand Total
1/Includes Distribution of US$30.0 billion from Forex Equalisation Account Sources: FMF, OAGF, and CBN Sub-National Governments Fiscal Survey.
5.3.2 Aggregate Expenditure
At N13,967.0 billion, aggregate expenditure of the general government
increased by 21.5 per cent, from the level in 2017. This was attributed to the
increase all its components. As a proportion of GDP, it represented 3.4 per
cent, compared with 3.2 per cent in 2017. A
breakdown showed that recurrent
expenditure, which stood at N9,686.7 billion
(7.6% of GDP), accounted for 69.3 per cent
of the total; while capital expenditure at
10 Include Revenues from Special Accounts.
At N13,967.0 billion, aggregate expenditure
of general government increased by 21.5 per
cent, above the level in 2017.
5
DRAFT

Central Bank of Nigeria Annual Report—2018
168
N3,209.2 billion (2.5% of GDP); and transfers, N1,017.0 billion (0.8% of GDP);
represented 23.0 and 7.7 per cent of the total, respectively.
Figure 5.5: Composition of General Government Expenditure, 2018
Sources: Computed based on data from the FMF & the OAGF
5.3.3 Consolidated Fiscal Balance and Financing
The fiscal operations of the general government resulted in primary and
overall deficits of N2,130.6 billion (1.7% of GDP), and N4,393.3 billion (3.4% of
GDP), compared with deficits of N2,477.7 billion (2.2% of GDP) and N4,388.6
billion (3.9% of GDP), respectively, in 2017. The overall deficit was financed,
largely from domestic sources, especially borrowings from the non-bank
public and draw-down on special accounts.
5.3.4 Consolidated Expenditure on Primary Welfare Sectors11
Consolidated general government spending on the primary welfare sectors
indicated that expenditure on education,
health as well as agriculture and natural
resources rose by 11.0, 10.6 and 23.0 per
cent to N1,299.9 billion, N646.8 billion and
N330.6 billion, respectively, over the level in
2017. Aggregate expenditure on the primary welfare sectors amounted to
N2,277.4 billion or 1.8 per cent of GDP, and accounted for 16.3 per cent of
aggregate expenditure of the general government.
11 Classification for identifying poverty-reducing expenditures
Recurrent 69.3%
Capital 23.0%
Transfers 7.7%
Aggregate general government expenditure
on primary welfare sectors amounted to
N2,277.4 billion, or 1.8 per cent of GDP, and
accounted for 16.3 per cent of the total.
5
DRAFT

Central Bank of Nigeria Annual Report—2018
169
5.4 FEDERAL GOVERNMENT FINANCES
5.4.1 The Overall Fiscal Balance and Financing
The current balance in 2018 indicated a deficit of N1,489.5 billion, or 1.2 per
cent of GDP, compared with N1,932.7 billion or 1.7 per cent of GDP in fiscal
2017. Also, the primary balance recorded a
deficit of N1,466.7 billion, or 1.1 per cent of
GDP, compared with N1,785.5 billion, or 1.6
per cent of GDP in 2017. Furthermore, the
overall fiscal balance of the Federal
Government resulted in a deficit of N3,628.1
billion, or 2.8 per cent of GDP, compared with N3,609.4 billion, or 3.2 per cent
of GDP in fiscal 2017. The deficit was within both the Fiscal Responsibility Act
(FRA) threshold and the WAMZ primary convergence criterion of 3.0 per cent
of GDP apiece, and was financed from both external and domestic sources
constituting 29.6 and 70.4 per cent, respectively.
Figure 5.6: Federal Government Fiscal Deficit, 2014 - 2018 (per cent of GDP)
Sources: Computed based on data from the FMF and the OAGF
5.4.2 Federal Government Retained Revenue
The Federal Government retained revenue rose by 47.0 per cent to N4,185.6
billion, above N2,847.3 billion in 2017. This was attributed largely, to improved
allocation from the Federation Account. Analysis of the revenue showed that
the Federation Account contributed N3,179.0 billion or 76.0 per cent of the
total; FG Independent Revenue, N395.2 billion (9.4%); and the VAT Pool
-0.9
-1.6
-2.6
-3.2
-2.8
(3.5)
(3.0)
(2.5)
(2.0)
(1.5)
(1.0)
(0.5)
-
2014 2015 2016 2017 2018
5
5
The overall fiscal operations of the Federal
Government resulted in a notional deficit of
N3,628.1 billion, or 2.8 per cent of GDP,
compared with the deficit of N3,609.4 billion,
or 3.2 per cent of GDP, recorded in FY2017.
DRAFT

Central Bank of Nigeria Annual Report—2018
170
Account, N157.0 billion (3.8%). There were
also: Exchange Gain, N129.5 billion (3.1%);
NNPC Additional Revenue12, N18.4 billion
(0.4%); and ‘Others’’13, N306.6 billion (7.3%).
Figure 5.7: Composition of Federal Government Retained Revenue, 2018
(Per cent)
Sources: Computed based on data from the FMF and the OAGF
Figure 5.8: Federal Government Revenue and Expenditure, 2014 - 2018
(Per cent of GDP)
Sources: Computed based on data from the FMF and the OAGF
5.4.3 Total Expenditure of the Federal Government
Aggregate expenditure of the Federal Government increased by 21.0 per
cent to N7,813.7 billion in 2018. As a proportion of GDP, it rose to 6.1 per cent
over the 5.7 per cent in fiscal 2017. Non-debt expenditure rose by 22.0 per
cent to N5,652.4 billion above the level in 2017. Total debt service payment
12 Include Recovered excess bank charges (N7.7 billion) 13 Include FGN balance in special accounts and unspent balances from previous year.
Federation Account 76.0%
VAT Pool Account 3.8%
FG Independent Revenue
9.4%
Others 7.3%
NNPC Refund 0.4% Exchange Gain
3.1%
-
1.0
2.0
3.0
4.0
5.0
2014 2015 2016 2017 2018
4.2 3.6
3.1 2.5
3.3 3.8
4.0 4.1 4.2 4.4
0.9 0.9 0.6 1.1 1.3
Retained Revenue Recurrent Expenditure Capital Expenditure
The Federal Government retained revenue
rose to N4,185.6 billion, above N2,847.3 billion, in Fiscal 2017.
5
DRAFT

Central Bank of Nigeria Annual Report—2018
171
amounted to N2,161.4 billion, or 1.7 per cent of GDP, representing 27.7 per
cent of total expenditure and 51.6 per cent of total retained revenue.
Figure 5.9: Composition of Federal Government Expenditure, 2018
(Per cent)
Sources: Computed based on data from the FMF and the OAGF
5.4.3.1 Recurrent Expenditure
Recurrent expenditure, at N5,675.2 billion or 4.4 per cent of GDP, rose by 18.7
per cent above the level in 2017. This accounted for 72.6 per cent of the total
and reflected the significant increase in personnel cost. A disaggregation of
recurrent expenditure showed that interest
payment14 increased by 18.5 per cent to
N2,161.4 billion (38.1%) of the total,
compared with the level in 2017. Similarly,
the goods and services component rose by
16.4 per cent to N3,238.1 billion (57.1%) of the total, while transfers to the
special funds (FCT, stabilisation, development of natural resources and
ecological funds) and “others” rose by 58.7 per cent to N275.7 billion (4.9%).
Analysis of the goods and services component revealed that personnel cost
and pensions amounted to N2,288.1 billion (70.7%) and overhead cost was
N950.0 billion (29.3%). A breakdown of interest payments indicated that
N292.4 billion, external debt and N1,869.0 billion, domestic debt.
14 Include interest payments on Ways and Means Advances.
Recurrent Expenditure
72.6%
Capital Expenditure & Net Lending
21.5%
Transfers 5.8%
Recurrent expenditure increased to 4.4 per
cent of GDP, reflecting the substantial
increase in overhead cost in FY2018.
5
DRAFT

Central Bank of Nigeria Annual Report—2018
172
Figure 5.10: Economic Classification of FG Recurrent Expenditure, 2018 (Per cent)
Sources: Computed based on data from the FMF and the OAGF
Figure 5.11: Federal Government Recurrent Expenditure & Personnel Cost, 2014 - 2018
(Per cent of GDP)
Sources: Computed based on data from the FMF and the OAGF
A functional classification of recurrent expenditure indicated that outlay on
the economic sector at N372.5 billion, rose by 11.2 per cent and constituted
6.6 per cent of the total. Within the economic sector, roads and construction
accounted for 40.3 per cent, while agriculture and natural resources,
transport and communications and “others” were 14.5, 8.2, and 37.0 per cent
of the total, respectively. Similarly, expenditure on administration, and social
and community services at N1,584.1 billion (27.9%) of the total and N1,083.7
billion (19.1%), respectively, rose by 19.6 and 16.3 per cent above the levels in
2017. Transfers at N2,634.9 billion constituted 46.4 per cent of total recurrent
expenditure. Within the social and community services sector, education and
health constituted 42.9 and 27.4 per cent, respectively.
Goods & Services 57.1%
Interest Payments 38.1%
Transfers 4.8%
-
1.0
2.0
3.0
4.0
5.0
2014 2015 2016 2017 2018
3.8 4.0 4.1 4.2 4.4
1.8 2.0 1.6 1.6 1.6
Recurrent Expenditure Personnel Cost
5
DRAFT

Central Bank of Nigeria Annual Report—2018
173
Figure 5.12: Functional Classification of Federal Government Recurrent Expenditure, 2018
(Per cent)
Sources: Computed based on data from the FMF and the OAGF
5.4.3.2 Capital Expenditure
Capital expenditure rose by 35.4 per cent to N1,682.1 billion, above the level
in 2017 constituting 21.5 per cent of total expenditure. The significant increase
in capital spending was largely, due to the high rate of capital releases
during the period compared with 2017. As a percentage of GDP, capital
expenditure was 1.3 per cent, compared with
1.1 per cent in 2017. Analysis of capital
expenditure by function showed that outlays
in the economic and administration sectors
were N753.5 billion and N446.2 billion, or 44.8
and 26.5 per cent of the total, respectively, compared with 43.6 and 26.5 per
cent in 2017. Within the economic sector, roads and construction, and
agriculture and natural resources accounted for 36.0 and 17.0 per cent of
the total, respectively. Public investment in social and community services
constituted N203.4 billion or 12.1 per cent of total capital expenditure, while
transfers amounted to N278.9 billion or 16.6 per cent of the total. Within the
social and community services sector, education and health accounted for
35.8 and 34.7 per cent of the total, respectively. As ratios of capital spending,
expenditure on education and health at 4.3 and 4.2 per cent fell below the
4.5 and 4. 3 per cent, respectively in fiscal 2017.
Administration 27.9%
Economic Sector 6.6%
Social & Community
Services 19.1%
Transfers 46.4%
5
Capital expenditure rose by 35.4 per cent to
N1,682.1 billion and accounted for 21.5 and
1.3 per cent of total expenditure and GDP,
respectively. DRAFT

Central Bank of Nigeria Annual Report—2018
174
Analysis of total Federal Government spending on the primary welfare sectors
revealed that expenditure on agriculture and natural resources fell by 33.5
per cent to N182.3 billion relative to the level in 2017. Furthermore, outlay on
health, education and roads and construction
increased by 22.8, 17.1 and 39.8 per cent,
respectively, to N367.1 billion, N538.1 billion
and N421.6 billion, compared with the levels in
2017. Aggregate expenditure on the primary
welfare sectors amounted to N1,509.1 billion, or 1.2 per cent of GDP, and
constituted 19.3 per cent of total expenditure.
Figure 5.13: Federal Government’s Expenditure on Key Primary Welfare Sectors, 2018
(Per cent of Total and GDP)
Sources: Computed based on data from the FMF and the OAGF
5.5 STATE GOVERNMENTS AND FCT FINANCES15
5.5.1 The Overall Fiscal Balance and Financing
Provisional data on state governments (including the FCT) fiscal operations
indicated a deficit of N706.2 billion or 0.6 per
cent of GDP, compared with the deficit of
N710.4 billion or 0.6 per cent of GDP in 2017.
This was financed, largely, from domestic
borrowings (commercial bank loans,
restructured loans on FGN Bonds and new bond issues).
15The provisional data are from the CBN survey returns from 36 states and the FCT.
6.9
4.7 5.4
2.3
0.4 0.3 0.3 0.1
-
1.0
2.0
3.0
4.0
5.0
6.0
7.0
8.0
Education Health Roads & Construction Agriculture
Total GDP
Aggregate expenditure on primary welfare
sectors amounted to N1,509.1 billion, or
1.2 per cent of GDP, and constituted 19.3
per cent of total expenditure.
Provisional data on state governments
finances indicated a decrease in the overall
deficit to N706.2 billion, down from N710.4
billion in 2017.
5
DRAFT

Central Bank of Nigeria Annual Report—2018
175
5.5.2 Revenue
Total revenue of state governments grew by 24.7 per cent to N3,733.0 billion,
or 2.9 per cent of GDP, compared with N2,992.5 billion or 2.6 per cent of GDP
in 2017. Analysis of the sources of revenue
showed that allocation from the Federation
Account (including 13.0% Derivation Fund)
was N2,273.1 billion, or 60.9 per cent of the
total; VAT Pool Account, N533.7 billion
(14.3%); Exchange Gain16, N97.6 billion (2.6%); and “Grants and Others”
(including share of Stabilisation Fund), N72.8 billion (2.0%). In addition,
Internally-Generated Revenue (IGR) constituted N755.7 billion (20.2%),
indicating a decline of 1.2 per cent below the level in 2017.
Figure 5.14: State Governments’ and FCT’s Revenue, 2018
(Naira Billion)
Sources: Computed based on data from the FMF and the OAGF
Analysis of the state tax effort proxied by the ratio of IGR to total revenue
showed that Lagos State ranked highest with 62.6 per cent, followed by Rivers
and Kwara states with 36.2 and 28.5 per cent, respectively, while Bayelsa
State ranked the least with 3.9 per cent. Overall, state governments tax effort
in 2018 deteriorated by 4.8 percentage point relative to 2017.
16
Include NNPC Additional Distribution of N8.6 billion, Forex Equalisation Account and Recovered Excess Bank charges
Federation Account 60.9%
Exchange Gain 2.6%
Value Added Tax 14.3%
Internally Generated Revenue
20.2%
Grants/Others 2.0%
Total revenue of the state governments
grew by 24.7 per cent to N3,733.0 billion,
or 2.9 per cent of GDP.
5
DRAFT

Central Bank of Nigeria Annual Report—2018
176
2017 2018
Amount Amount
(N’ Billion) (N’ Billion)
Federation Account 2/ 1,462.3 48.9 2,273.1 60.9 1.3 1.8
Excess Crude Rev enue 3/ 217.9 7.3 97.6 2.6 0.2 0.1
VAT 473.8 15.8 533.7 14.3 0.4 0.4
Internally Generated Rev enue 765.0 25.6 755.7 20.2 0.7 0.6
Grants & Others 4/ 73.6 2.5 72.8 2.0 0.1 0.1
Total 2,992.5 100.0 3,733.0 100.0 2.6 2.9
Table 5.2: State Governments Revenue
State Governments Revenue Share in Overall GDP
Item
2017 1/ 2018 1/
Share (%) Share (%) % %
1/ Including FCT
2/ Include 13% Derivation Fund
3/ Include Exchange Gain, NLNG Distribution in 2016, NNPC Additional Distribution and Distribution from Forex
Equalisation Account in 2017 & 2018 and recovered excess bank charges.
4/ Include stabilisation fund.
Sources: FMF, OAGF and Fiscal Survey of Sub-National Governments
5.5.3 Expenditure
Estimated total expenditure of state governments increased by 19.9 per cent
to N4,439.2 billion or 3.4 per cent of GDP. A breakdown showed that, at
N3,231.9 billion or 2.5 per cent of GDP,
recurrent expenditure was 21.4 per cent
above the level in 2017, and accounted
for 72.8 per cent of the total. Capital
expenditure, at N1,207.4 billion or 0.9 per cent of GDP, was 16.1 per cent
above the level in 2017 and constituted 27.2 per cent of the total.
Figure 5.15: State Governments’ Expenditure, 2014 - 2018 (per cent of GDP)
Source: Computed from CBN’s Sub-national Governments’ Fiscal Survey
Analysis of spending on primary welfare sectors indicated that outlay on
education fell by 9.2 per cent to N277.7 billion, below the N305.8 billion
recorded in 2017, and represented 31.9 per cent of the total. Also,
2.4 2.4
2.0 2.3
2.5
2.1
1.3 1.2 0.9 0.9
4.5
3.7
3.2 3.2
3.4
-
0.5
1.0
1.5
2.0
2.5
3.0
3.5
4.0
4.5
5.0
2014 2015 2016 2017 2018
Pe
r ce
nt
Recurrent Expenditure Capital Expenditure Total Expenditure
The total expenditure of the state governments
rose by 19.9 per cent to N4,439.2 billion, or 3.4 per
cent of GDP.
5
DRAFT

Central Bank of Nigeria Annual Report—2018
177
expenditure on housing and health dropped by 13.0 and 6.7 per cent to
N49.6 billion and N247.2 billion, respectively,
relative to the levels in 2017. However,
expenditure on Water Supply and Agriculture
rose by 19.7 and 9.0 per cent to N66.7 billion
and N247.2 billion, respectively, relative to the
levels in 2017. Aggregate expenditure on
primary welfare sectors amounted to N775.4 billion, or 0.6 per cent of GDP,
and accounted for 17.5 per cent of total expenditure.
Figure 5.16: State Governments’ Expenditure in Key Primary Welfare Sectors, 2018
(Per cent of Total Expenditure)
Source: Computed from CBN’s Sub-national Governments’ Fiscal Survey
Figure 5.17: State Governments’ Expenditure in Key Primary Welfare Sectors, 2018
(Per cent of GDP)
Source: Computed from CBN’s Sub-national Governments’ Fiscal Survey
0.0
1.0
2.0
3.0
4.0
5.0
6.0
7.0
Education Health Agriculture Water Supply Housing
6.3
5.6
3.0
1.5 1.1
0.22 0.19
0.11
0.05 0.04
-
0.05
0.10
0.15
0.20
0.25
Education Health Agriculture Water Supply Housing
Per
cen
t
Aggregate expenditure on primary welfare
sectors amounted to N775.4 billion, or 0.6
per cent of GDP, and accounted for 17.5
per cent of total expenditure.
5
DRAFT

Central Bank of Nigeria Annual Report—2018
178
5.6 LOCAL GOVERNMENTS FINANCES
5.6.1 The Overall Fiscal Balance and Financing
Provisional data on the fiscal operations of local
governments indicated a deficit of N0.2 billion,
compared with N0.6 billion in 2017. This was
financed, largely, from domestic borrowings.
Figure 5.18: Local Governments’ Revenue & Overall Balance, 2014 - 2018
(Per cent of GDP)
Sources: Computed based on data from the FMF and CBN’s Sub-national
Government’s Fiscal Survey.
5.6.2 Revenue
Provisional data on total revenue of local governments, at N1,714.0 billion or
1.3 per cent of GDP, represented an increase of 28.1 per cent above the
level in 2017. The revenue comprised allocations from the Federation
Account, N1,243.1 billion (72.5%); and the
VAT Pool Account, N366.3 billion (21.4%).
Others included: Exchange Gain, N41.7
billion (2.4%); NNPC Additional Revenue,
N4.2 billion (0.2%); Recovered Excess Bank Charges, N2.9 billion (0.2%); State
Allocation, N14.2 billion (0.8%); Grants & others, N5.6 billion (0.3%), while
‘Others’ amounted to N3.3 billion (0.2%). In addition, IGR accounted for N32.5
billion (1.9%), indicating a 15.0 per cent decline below the level in 2017.
0.0010 (0.0007)
(0.0013)
(0.0005)
(0.0002)
0.04
0.03
0.04
0.03
0.03
1.79
1.31
1.06
1.18
1.34
-
0.20
0.40
0.60
0.80
1.00
1.20
1.40
1.60
1.80
2.00
(0.0050)
-
0.0050
0.0100
0.0150
0.0200
0.0250
0.0300
0.0350
0.0400
0.0450
2014 2015 2016 2017 2018
Pe
rce
nt
Pe
r ce
nt
5
The total provisional revenue of local
governments at N1,714.0 billion, rose by
28.1 per cent above the level in F2017
Provisional data on local governments
fiscal operations indicated a deficit of
N0.2 billion.
DRAFT

Central Bank of Nigeria Annual Report—2018
179
Analysis of the cumulative local governments IGR on a state by state basis
showed that Lagos State ranked highest with 14.1 per cent of the total, while
Kwara State ranked the least with 0.4 per cent of the total.
2017 2018
Amount Amount
(N’ Billion) (N’ Billion)
Federation Account 828.9 62.0 1,243.1 72.5 0.7 1.0
VAT 325.1 24.3 366.3 21.4 0.3 0.3
Internally Generated Rev enue 38.2 2.9 32.5 1.9 0.0 0.0
Non-Oil Excess/Recov ered Bank
Charges 0.2 0.0 2.9 0.2 0.0 0.0
Excess Crude/ PPT 37.2 2.8 - - 0.0 -
Exchange Gain 66.6 5.0 41.7 2.4 0.1 0.0
Budget Augmentation/ NNPC
Additional Rev enue - 4.2 0.2
NNPC Refund 5.4 0.4 -
Grants & Others 2/ 36.4 2.7 23.1 1.3 0.0 0.0
Total 1,338.0 100.0 1,713.8 100.0 1.2 1.3
Table 5.3: Local Governments Revenue
Local Governments Revenue Share in Overall GDP
Item
2017 2018 1/
Share (%) Share (%) % %
1/Provisional 2/Include State Allocation and other miscellaneous revenue Sources: FMF, OAGF, and Sub-National Governments’ Fiscal Survey.
5.6.3 Expenditure
At N1,714.0 billion, estimated total expenditure of local governments
exceeded the level in 2017 by 28.0 per cent
and represented 1.3 per cent of GDP. A
breakdown indicated that recurrent outlay
was N1,394.3 billion or 81.3 per cent of the
total, while capital expenditure amounted
to N319.8 billion or 18.7 per cent of the total.
Figure 5.19: Local Governments’ Expenditure, 2014 - 2018 (per cent of GDP)
Source: Computed based on data from the FMF and CBN’s Sub-national Governments’
Fiscal Survey
1.6
1.2
1.0 1.1 1.1
0.2 0.1 0.1 0.1
0.3
1.8
1.3
1.1 1.2
1.3
-
2.0
2014 2015 2016 2017 2018
pe
r ce
nt
Recurrent Expenditure Capital Expenditure Total Expenditure
5
The expenditure of the local governments
was 28.0 per cent above the level in 2017
and represented 1.3 per cent of the GDP.
5
DRAFT

Central Bank of Nigeria Annual Report—2018
180
A breakdown of recurrent expenditure showed that personnel cost was
N1,000.5 billion (71.8%) of the total, while overheads and consolidated
revenue fund charges & others amounted to N191.9 billion (13.8%) and
N201.8 billion, (14.5%), respectively. A disaggregation of capital expenditure
by functions revealed that the share of social and community services was
N93.9 billion (29.4%); economic services, N70.3 billion (22.0%); administration,
N119.2 billion (37.3 %), and transfers, N36.4 billion (11.4%).
Analysis of spending on primary welfare
sectors showed that expenditures on
housing, health, agriculture, water supply,
and education increased by 62.0, 53.4, 53.2,
37.6 and 19.1 per cent, respectively
compared with the levels in 2017. Overall, at N546.0 billion or 0.4 per cent of
GDP, aggregate expenditure on the primary welfare sectors increased by
22.2 per cent above the level in 2017, and accounted for 31.9 per cent of
total expenditure.
Figure 5.20: Local Governments’ Expenditure on Primary Welfare Sectors, 2018
(Per cent of Total Expenditure)
Sources: Computed based on CBN’s Sub-national Governments’ Fiscal
Survey.
0.0
5.0
10.0
15.0
20.0
25.0
30.0
Education Health Agriculture Housing Water Supply
28.2
1.9 0.8 0.7 0.2
Pe
r ce
nt
Aggregate expenditure on the primary
welfare sectors increased by 22.2 per cent
above the level in 2017 and accounted for
31.9 per cent of total expenditure.
5
DRAFT
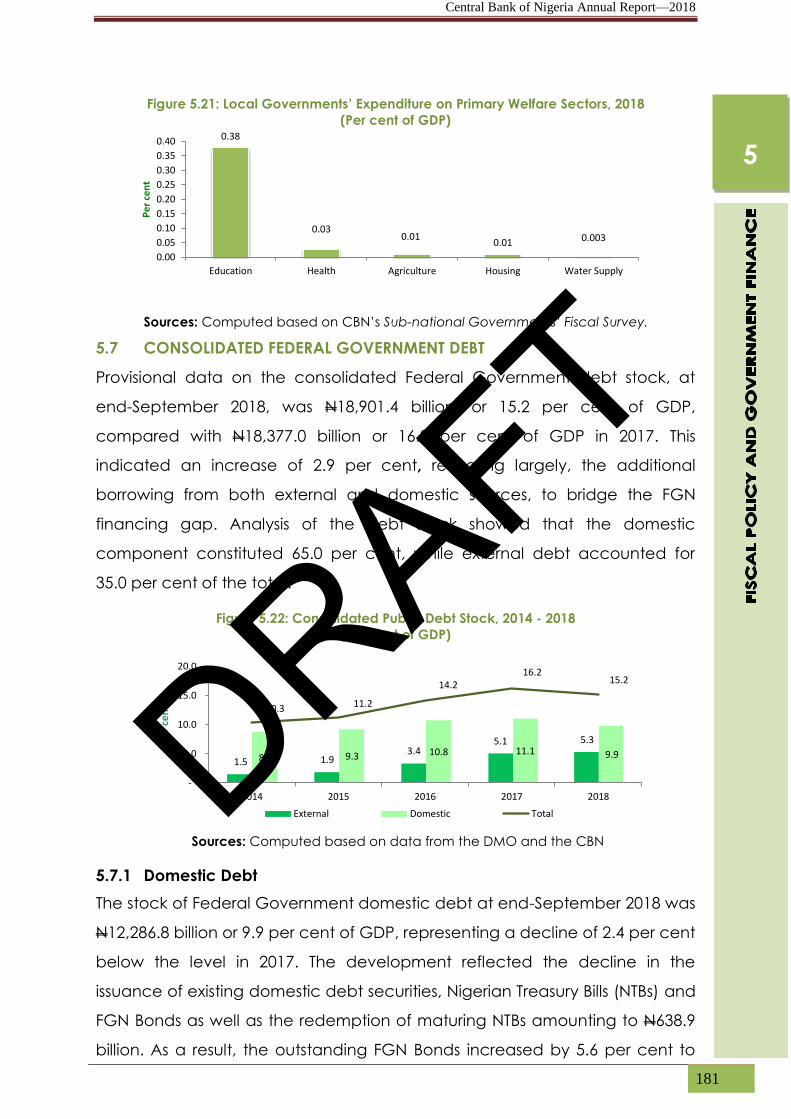
Central Bank of Nigeria Annual Report—2018
181
Figure 5.21: Local Governments’ Expenditure on Primary Welfare Sectors, 2018
(Per cent of GDP)
Sources: Computed based on CBN’s Sub-national Governments’ Fiscal Survey.
5.7 CONSOLIDATED FEDERAL GOVERNMENT DEBT
Provisional data on the consolidated Federal Government debt stock, at
end-September 2018, was N18,901.4 billion, or 15.2 per cent of GDP,
compared with N18,377.0 billion or 16.2 per cent of GDP in 2017. This
indicated an increase of 2.9 per cent, reflecting largely, the additional
borrowing from both external and domestic sources, to bridge the FGN
financing gap. Analysis of the debt stock showed that the domestic
component constituted 65.0 per cent, while external debt accounted for
35.0 per cent of the total.
Figure 5.22: Consolidated Public Debt Stock, 2014 - 2018
(Per cent of GDP)
Sources: Computed based on data from the DMO and the CBN
5.7.1 Domestic Debt
The stock of Federal Government domestic debt at end-September 2018 was
N12,286.8 billion or 9.9 per cent of GDP, representing a decline of 2.4 per cent
below the level in 2017. The development reflected the decline in the
issuance of existing domestic debt securities, Nigerian Treasury Bills (NTBs) and
FGN Bonds as well as the redemption of maturing NTBs amounting to N638.9
billion. As a result, the outstanding FGN Bonds increased by 5.6 per cent to
0.38
0.03 0.01
0.01 0.003
0.00
0.05
0.10
0.15
0.20
0.25
0.30
0.35
0.40
Education Health Agriculture Housing Water Supply
Pe
r ce
nt
1.5 1.9 3.4
5.1 5.3
8.8 9.3 10.8 11.1 9.9
10.3 11.2
14.2 16.2
15.2
-
5.0
10.0
15.0
20.0
2014 2015 2016 2017 2018
per
cen
t
External Domestic Total
5
DRAFT

Central Bank of Nigeria Annual Report—2018
182
N9,201.4 billion, while the Treasury Bills and
Treasury Bonds declined by 21.4 and 14.2
per cent to N2,814.0 billion and N151.0
billion, respectively, at end-September
2018, below the levels at end-December
2017. The banking system remained the dominant holder of outstanding
domestic debt with N6,508.4 billion or 53.0 per cent, while the non-bank
public accounted for the balance of N5,778.4 billion or 47.0 per cent. Thus,
the shares of the non-bank public and the banking system increased by 2.4
per cent apiece above the level in 2017. A disaggregation of the banking
system holdings showed that the banks held 83.9 per cent while the CBN and
the Sinking Fund accounted for the balance of 16.1 per cent.
Analysis of the maturity structure of domestic debt showed that long-term
instruments (tenors of over three years) accounted for N6,101.2 billion, or 49.7
per cent. Medium-term instruments (tenors of 1-3 years) amounted to
N1,424.9 billion or 11.6 per cent, while short-term instruments (tenors of below
one year) amounted to N4,760.7 billion, or 38.7 per cent.
Figure 5.23: Composition of Domestic Debt Stock by Holder, 2018
Source: Computed based on Data from the DMO
Non-bank Public 47.0%
Central Bank/Sinking Fund
8.5%
DMBs 44.5%
Banking System 53.0%
5
The stock of Federal Government domestic debt
outstanding at end-September 2018 stood at N12,286.6
billion, representing a decline of 2.4 per cent below the
level at end-December 2017.
DRAFT

Central Bank of Nigeria Annual Report—2018
183
5.7.2 External Debt
At US$21.6 billion or 5.3 per cent of GDP, Nigeria’s external debt at end-
September 2018 grew by 14.2 per cent over the level at end-December 2017.
The rise reflected largely, additional disbursements on commercial loans (Euro
and Diaspora bonds), for infrastructure funding and refinancing of matured
NTBs. This was in line with Nigeria’s Debt Management Strategy, aimed at
restructuring the outstanding debt portfolio and gradually, reducing the
share of the domestic component to 60.0 per cent. The Federal Government
thus, sought to switch the debt portfolio in favour of cheaper and longer
tenored foreign concessionary loans to reduce its debt service burden. As
part of the strategy, maturing NTBs were refinanced from commercial loans
(Eurobonds), thereby increasing the stock of Eurobonds from US$6.0 billion in
2017 to US$ 8.0 billion.
A breakdown of the debt portfolio showed that Debt to multilateral
institutions (concessional loans) was US$10.9 billion or 50.4 per cent of the
total, while commercial and bilateral debts, at US$8.3 billion and US$2.4
billion, respectively accounted for 38.4 and 11.1 per cent.
5.7.3 Debt Service
Total debt service17 was N1,965.4 billion, or 1.6 per cent of GDP, indicating an
increase of 21.5 per cent above the level in 2017. A disaggregation showed
that external debt component was N390.9 billion (US$1.3 billion) or 19.9 per
cent of the total, while domestic debt accounted for N1,574.6 billion or 80.1
per cent. External debt service consisted of interest payments of 46.9 per
cent and amortisation18 of 53.1 per cent. However, interest payments
constituted 100.0 per cent of the total domestic debt service.
17Represents actual debt service payments by the Debt Management Office which may differ from the figures in the
Federal Government finances table that indicates contributions to the external creditors’ fund. 18 Principal Repayment
5
DRAFT

Central Bank of Nigeria Annual Report—2018
184
DRAFT

Central Bank of Nigeria Annual Report—2018
185
he economy witnessed sustained growth in 2018. The real Gross Domestic Product
(GDP), measured at 2010 constant basic prices, grew by 1.9 per cent, compared with
the growth of 0.8 per cent in 2017. The development was attributed, largely to fiscal
stimulus due to increase in international price of crude oil, which led to increased
infrastructural spending following sustained implementation of the Economic
Recovery and Growth Plan (ERGP); sustained implementation of the Anchor Borrowers’
Programme; increased capital inflow arising from improved investor confidence in the
economy, improved access to foreign exchange; as well as, ameliorating inflationary
pressures. Oil and non-oil sectors output grew by 1.1 and 2.0 per cent, respectively. Analysis
by sector showed that services, construction, agriculture and industry grew by 3.1, 2.3, 2.1
and 1.7 per cent, respectively, while trade sector contracted by 0.6 per cent during the year.
The year-on-year headline inflation remained above the benchmark single-digit rate
throughout 2018. The development was attributed largely to sustained inflationary pressures
from the food CPI, pass-through effect of exchange rate to domestic prices, as well as,
structural rigidities which still pervade the economy.
6.1 DOMESTIC OUTPUT
Provisional data from the National Bureau
of Statistics (NBS) showed that the Gross
Domestic Product (GDP), measured at 2010
constant basic prices, was N69.80 trillion for
2018. This indicated a growth of 1.9 per
cent, compared with 0.8 per cent in 2017.
Figure 6.1 GDP Growth Rate, 2014-2018, (per cent)
Source: National Bureau of Statistics (NBS)
-15.0
-5.0
5.0
15.0
25.0
2014 2015 2016 2017 2018
per
cen
t
GDP Growth Rate Oil Non-oil
T
CHAPTER SIX
REAL SECTOR DEVELOPMENTS
The Gross Domestic Product (GDP), measured at 2010 constant basic prices was N69.8 trillion in 2018, indicating a growth of 1.9 per cent, compared with a growth of 0.8 per cent in 2017.
DRAFT
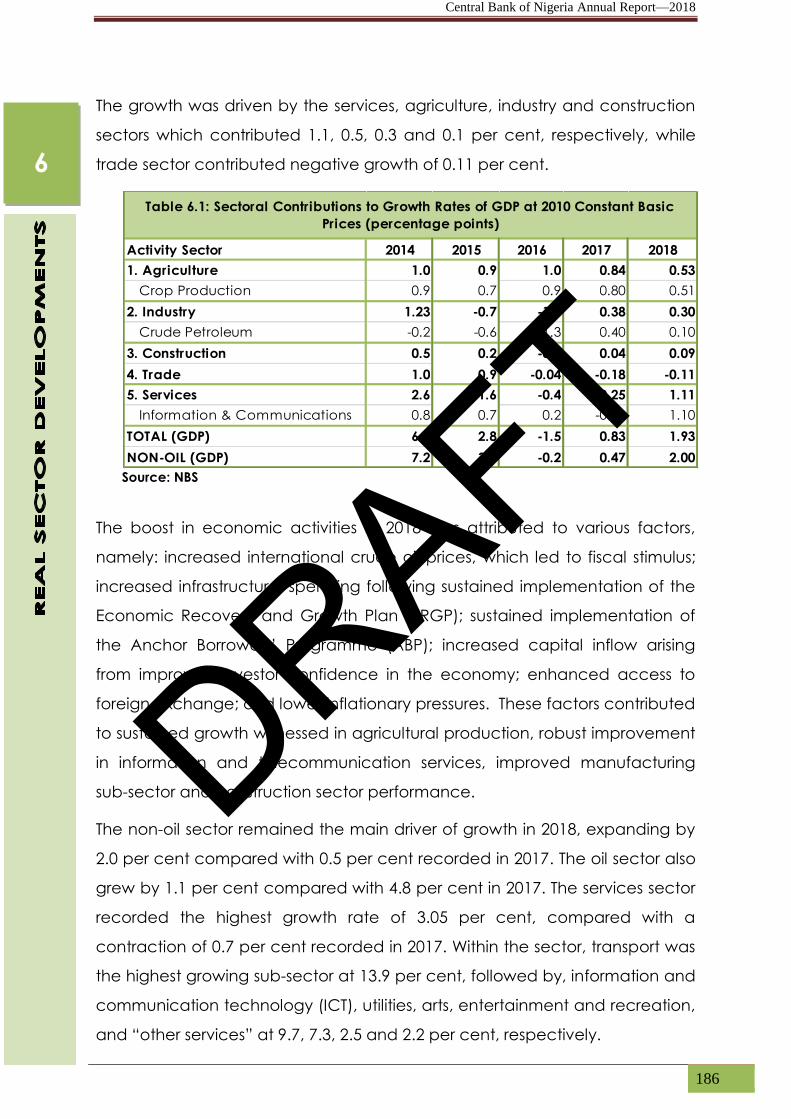
Central Bank of Nigeria Annual Report—2018
186
The growth was driven by the services, agriculture, industry and construction
sectors which contributed 1.1, 0.5, 0.3 and 0.1 per cent, respectively, while
trade sector contributed negative growth of 0.11 per cent.
Activity Sector 2014 2015 2016 2017 2018
1. Agriculture 1.0 0.9 1.0 0.84 0.53
Crop Production 0.9 0.7 0.9 0.80 0.51
2. Industry 1.23 -0.7 -1.7 0.38 0.30
Crude Petroleum -0.2 -0.6 -1.3 0.40 0.10
3. Construction 0.5 0.2 -0.2 0.04 0.09
4. Trade 1.0 0.9 -0.04 -0.18 -0.11
5. Services 2.6 1.6 -0.4 -0.25 1.11
Information & Communications 0.8 0.7 0.2 -0.12 1.10
TOTAL (GDP) 6.2 2.8 -1.5 0.83 1.93
NON-OIL (GDP) 7.2 3.8 -0.2 0.47 2.00
Table 6.1: Sectoral Contributions to Growth Rates of GDP at 2010 Constant Basic
Prices (percentage points)
Source: NBS
The boost in economic activities in 2018 was attributed to various factors,
namely: increased international crude oil prices, which led to fiscal stimulus;
increased infrastructural spending following sustained implementation of the
Economic Recovery and Growth Plan (ERGP); sustained implementation of
the Anchor Borrowers’ Programme (ABP); increased capital inflow arising
from improved investor confidence in the economy; enhanced access to
foreign exchange; and lower inflationary pressures. These factors contributed
to sustained growth witnessed in agricultural production, robust improvement
in information and telecommunication services, improved manufacturing
sub-sector and construction sector performance.
The non-oil sector remained the main driver of growth in 2018, expanding by
2.0 per cent compared with 0.5 per cent recorded in 2017. The oil sector also
grew by 1.1 per cent compared with 4.8 per cent in 2017. The services sector
recorded the highest growth rate of 3.05 per cent, compared with a
contraction of 0.7 per cent recorded in 2017. Within the sector, transport was
the highest growing sub-sector at 13.9 per cent, followed by, information and
communication technology (ICT), utilities, arts, entertainment and recreation,
and “other services” at 9.7, 7.3, 2.5 and 2.2 per cent, respectively.
6
DRAFT

Central Bank of Nigeria Annual Report—2018
187
Furthermore, construction, agriculture and industry sectors grew by 2.3, 2.1,
and 1.7 per cent, respectively, while trade sector contracted by 0.6 per cent
during the year.
Activity Sector 2014 2015 2016 2017 2018
1. Agriculture 4.3 3.7 4.1 3.45 2.12
Crop Production 4.1 3.5 4.3 3.64 2.26
Liv estock 5.4 6.0 2.9 1.61 0.33
Forestry 4.6 3.7 2.6 3.31 3.06
Fishing 6.7 5.9 -0.7 1.34 1.64
2. Industry 6.0 -3.4 -9.0 2.14 1.69
Crude Petroleum -1.3 -5.5 -13.7 4.79 1.14
Solid Minerals 14.9 7.7 -14.6 0.14 10.11
Manufacturing 14.7 -1.5 -4.3 -0.21 2.09
3. Construction 13.0 4.4 -6.0 1.00 2.33
4. Trade 5.9 5.1 -0.2 -1.05 -0.63
5. Services 7.1 4.5 -1.2 -0.67 3.05
Transport 4.4 4.5 0.4 3.86 13.91
Information & Communications 7.0 2.0 2.0 -1.04 9.65
Utilities -3.3 -4.0 -8.7 12.64 7.27
Accomodation & Food serv ices 18.3 2.3 -5.3 -1.61 1.76
Finance & Insurance 8.1 7.1 -4.5 1.26 2.03
Real Estate 5.1 2.1 -6.9 -4.27 -4.74
Human Health & Social Serv ices 10.5 2.5 -1.8 -0.31 -0.32
TOTAL (GDP) 6.2 2.8 -1.5 0.83 1.93
NON-OIL (GDP) 7.2 3.8 -0.2 0.47 2.00
Table 6.2: Sectoral Growth Rates of GDP at 2010 Constant Basic Prices
(Per cent)
Source: NBS
At 36.8 per cent of total real GDP in 2018, the services sector accounted for
the largest share compared with 36.4 per cent in 2017. Within the services
sub-sector, information and communications contributed 12.2 per cent of
total GDP, followed by real estate (6.4%), ‘other services’ (3.4%), professional
(3.6%), finance and insurance (3.0%), public administration (2.2%), education
(2.2%) and transport (1.4%). Furthermore, agriculture, industry, trade, and
construction contributed 25.1, 17.9, 16.4 and 3.7 per cent, respectively, to the
real GDP.
6
DRAFT

Central Bank of Nigeria Annual Report—2018
188
Figure 6.2: Sectoral Shares in GDP, 2014 - 2018
Source: NBS
Figure 6.3: Growth Rate of Major Sectors of Non-oil GDP, 2014 – 2018
(Per cent)
Source: NBS
Figure 6.4: Contributions to Growth Rate of Non-oil GDP, 2013 – 2017
(Per cent)
0
5
10
15
20
25
30
35
40
2014 2015 2016 2017 2018
per
cen
t
Agriculture Industry Construction Trade Services
-1.5
-1.0
-0.5
0.0
0.5
1.0
1.5
2.0
2.5
3.0
3.5
2014 2015 2016 2017 2018
Per
cen
t
Agriculture Industry Construction Trade Services
-15
-10
-5
0
5
10
15
20
2014 2015 2016 2017 2018
Per
cen
t
Agriculture Industry Trade Services
6
DRAFT

Central Bank of Nigeria Annual Report—2018
189
At N69,205.69 billion in 2017, data from the National Bureau of Statistics
revealed that real domestic demand, at 2010 purchasers’ price (GDP by
Expenditure), increased by 0.8 per cent relative to N68,652.43 billion in 2016.
Private consumption and government final consumption expenditure were
N41,029.53 billion and N2,844.05 billion, respectively, compared with
N41,424.07 billion and N3,641.42 billion, in 2016. Government final
consumption expenditure fell by 7.59 per cent, while private consumption
also declined by 0.95 per cent in 2017. Net export was N15,084.55 billion in
2017, representing an increase of 10.12 per cent above the level of
N13,698.84 billion in 2016. Real investment (gross fixed capital formation) was
N9,631.70 billion in the period under review, representing a decrease of 2.98
per cent over the level of N9,927.26 billion in the preceding year.
Figure 6.5: GDP (Expenditure Approach) at 2010 Purchasers’ Price, 2013 - 2017
Source: NBS
6.2 AGRICULTURE
6.2.1 Policy and Institutional Support
The Federal Government sustained the tempo of activities in the agricultural
sector with the main objectives of diversifying the economy, ensuring food
security and restoring robust economic growth. Consequently, several
policies and programmes were initiated.
The Nigerian Agricultural Quarantine Service (NAQS), during the review
period entered an agreement with the Europe-Africa-Caribbean-Pacific
Liaison Committee (COLEACP), to resolve the embargo placed on Nigerian
export to Europe. The Agreement would ensure the harmonisation of plants
and other agricultural produce to promote and regulate sanitary and
43
,04
8.2
9
43
,92
6.5
0
43
,91
6.8
8
41
,42
4.0
7
41
,02
9.5
3
4,4
44
.95
4,6
94
.78
3,6
41
.42
3,0
90
.98
2,8
44
.05
-
10,000.00
20,000.00
30,000.00
40,000.00
50,000.00
60,000.00
2013 2014 2015 2016 2017
Nai
ra B
illio
n
Private Consumption Expenditure Government Final Consumption Expenditure
6
DRAFT

Central Bank of Nigeria Annual Report—2018
190
phytosanitary measures in relation to the import and export of agricultural
products.
The Nigeria Incentive-Based Risk Sharing System for Agricultural Lending
(NIRSAL) signed a Memorandum of Understanding (MoU) with Syngenta
Agrochemical Company, a seed production and crop protection company
during the year. The MoU was aimed at supplying quality discounted inputs
and modern technology to farmers. The company would also build farmers’
capacity on the best use of farm inputs to achieve high yields up to 80.0 per
cent.
As part of efforts to empower rural farmers in the country, the British American
Tobacco Nigeria Foundation (BATN) unveiled a four-year Strategic Plan
(2018-2022) to promote wealth creation activities in the agricultural sector.
The sum of N700.00 million would be invested to support smallholder farmers,
young agric-preneurs and other related government interventions. The Plan
was aimed at empowering rural small holder farmers to move from
subsistence farming to commercial agriculture, create young agric-preneurs
by promoting a commercial mindset towards agriculture; ensure skills
development for the adoption of good agronomic practices; and provide
market access to promote viable and sustainable businesses.
The Cocoa Research Institute of Nigeria (CRIN) and the University of Ilorin
entered into a collaborative agreement to boost cashew production and
foreign exchange earnings. The goal of the partnership was to create a
viable and sustainable cultivation of cashew through mass production that
would improve the cashew value chain.
In addition, the United States African Development Foundation (USADF),
entered into a US$10.00 million agreement with Kebbi State Government to
promote agribusiness. The Agreement was aimed at providing seed capital
and technical assistance to local agribusinesses in the State. The USADF
would provide US$1.00 million a year in seed capital funding and technical
assistance through the Diamond Development Initiative (DDI) for a period of
five years.
6
DRAFT

Central Bank of Nigeria Annual Report—2018
191
The Federal Ministry of Science and Technology through the National Centre
for Genetic Resources and Biotechnology (NACGRAB), released 19 new high-
yield crop varieties to enhance agricultural production. The 19 crop varieties
included: one soybean variety (SC-SL01); five maize hybrids (P4226, P3966,
P4063, WE3205 and DKB350); and two maize varieties (AMANA-1 and AMANA
– 2). Others included: one sweet potato variety (Solo Gold); three groundnut
varieties (SAMNUT 27, SAMNUT 28 and SAMNUT 29); three sorghum varieties
(SAMSORG 47, SAMSORG 48 and SAMSORG 49); two cowpea varieties
(SAMPEA 18 and SAMPEA 19); and two transgenic hybrid cotton (MAYCO
C567 BGII and MAYCO C570 BGII). Also, the Alpha Chicken breed developed
by the Federal University of Agriculture Abeokuta (FUNAAB) was approved for
registration and release. The new chicken breed possesses performance
characteristics such as enhanced body weight, egg weight and survivability
surpassing those of existing Nigerian local chickens.
The United Nations Food and Agriculture Organisation (FAO), in collaboration
with the World Food Programme (WFP), launched the Livelihood Support
Programme (LSP) to supply seeds and fertilizers to Internal Displaced Persons
(IDP) farmers in Nothern Nigeria. Consequently, the (FAO) distributed farm
input to 100,000 beneficiaries in the North-East and trained 51 agricultural
workers under the Farmer Field School (FFS). The training would provide
farmers with extension services information, market access and financial
capital.
To curb the threat posed by forest degradation in the country, the Nigerian
Conservation Foundation (NCF), signed a collaborative agreement with the
International Institute of Tropical Agriculture (IITA) on tree planting. The
execution of the Agreement would aid the Federal Government’s Green
Recovery Initiative in managing and replanting felled trees in the mangrove
forest, thereby reversing the effects of climate change that had impacted
negatively on the environment and human lives.
6.2.2 Agricultural Production
The provisional aggregate index of agricultural production stood at 140.0
(2010=100), indicating an increase of 3.4 per cent, in 2018, compared with
6
DRAFT

Central Bank of Nigeria Annual Report—2018
192
135.4, in 2017. Crops, livestock, fishery and forestry sub-sectors increased by
3.7, 1.6, 1.4 and 3.4 per cent, respectively. The improved performance was
driven by Federal Government commitment to economic diversification
through agricultural transformation, sustained implementation of the
initiatives under the Agricultural Promotion Policy (APP) and the ERGP.
6.2.2.1 Crop Production
Provisional data showed that crop production increased by 3.7 per cent, in
2018, compared with 3.6 per cent, in the preceding year. Staples and ‘other
crops’ grew by 3.6 and 4.7 per cent, respectively, against 4.3 and 2.2 per
cent, in the corresponding period of 2017. Further analysis revealed that all
crops witnessed increase in output, varying from 1.6 to 13.4 per cent, for
wheat and palm produce, respectively. The development was attributable,
largely, to the commitment of the Government to diversify the economy and
revolutionise the agricultural sector through the ABP, good policies and
sustained institutional support during the review period.
Source: CBN Staff estimates based on NBS figures
6.2.2.2 Livestock
Estimated index of livestock production, at 130.2 (2010=100), grew by 1.6 per
cent in the review period. The rise in the index was attributed to increase in
the livestock production, ranging from 0.7 per cent in pork to 2.2 per cent in
beef. Also, improved vaccination and good disease control measures,
Crop 2017 2018 Crop 2017
2018
Wheat 3.4
1.6 Palm produce 8.3 10.9
Sorghum 2.9 2.3 Potatoes 4.1 6.9
Rice 18.7 11.3 Yam 3.3 3.2
Maize 2.6 2.5 Cassava 3.3 2.2
Millet 2.7 2.7 Rubber 7.0 6.6
Soya -Bean 0.8 3.3 Palm Oil 4.3 9.4
Beans 4.2 8.5 Cocoa 4.4 9.5
Table 6.3: Growth in Major Crop Production (per cent)
6
DRAFT

Central Bank of Nigeria Annual Report—2018
193
coupled with the sustained efforts of the Federal Government towards
livestock management contributed to the growth.
6.2.2.3 Fishery
At 143.5 (2010=100), the index of fish production recorded growth of 1.4 per
cent, compared with 1.3 per cent in 2017. Further analysis indicated that fish
farming catches from artisanal coastal and brackish water catches, artisanal
inland rivers/lakes and industrial (trawling) coastal fish and shrimps recorded
growth of 0.7, 2.2 and 2.7 per cent, respectively.
Fish output during the period increased by 0.8 per cent, compared with 2.8
per cent, in 2017. The development was attributed to improved knowledge
of fish farming and increased investment in the sub-sector.
6.2.2.4 Forestry
At 133.7 (2010=100), the index of forestry production grew by 3.4 per cent,
compared with 3.3 per cent, in 2017. The growth was as a result of the rise in
forestry activities due to the growing demand for construction works, and
other wood products such as paper, tissues, charcoal and other products.
Other reason responsible for the development was the sustained efforts by
various stakeholders in creating awareness of the dangers of deforestation
without corresponding re-planting of felled trees.
6.2.3 Agricultural Prices
The prices of major agricultural export commodities monitored showed mixed
developments in 2018. The aggregate agricultural index, in US dollar terms,
stood at 75.8 (2010=100), representing a decrease of 0.8 per cent, below the
level in 2017. The decline in the index was attributed to decline in the prices
of rubber, groundnut, coffee and palm oil by 21.6, 16.0, 13.0 and 8.0 per
cent, respectively. The development was due to excess supply from growing
regions on account of favourable weather conditions and low demand from
China.
6
DRAFT

Central Bank of Nigeria Annual Report—2018
194
The prices of wheat, cocoa, cotton, soyabean, and sorghum, however,
increased by 28.2, 13.0, 9.3, 6.6 and 3.4 per cent, respectively, as a result of
increased demand in the international spot market.
In naira terms, the all-commodities price index decreased by 0.7 per cent, to
151.9 (2010=100) in 2018. Rubber, groundnut, coffee and palm oil recorded
price decrease of 21.5, 16.0, 12.9 and 7.9 per cent, respectively, while the
price of cocoa, cotton, soyabean and sorghum increased by 28.3, 13.1, 9.4,
6.7 and 3.5 per cent, respectively.
Provisional data showed that prices of major selected cash crops rose in the
review period compared with their levels in 2017. The price increase of eight
out of the thirteen commodities monitored ranged from 2.0 per cent for tea
to 33.2 per cent for ginger. The development was attributed largely to
flooding and unfavourable weather condition which affected output during
the year. The price of palm kernel, cotton, wheat, coffee and cashew,
however, decreased by 20.3, 10.8, 10.7, 6.5 and 4.0 per cent, respectively
following increased supply in the market.
6.3 INDUSTRY
6.3.1 Industrial Policy and Institutional Support
The Federal Government during the year remain committed to restoring the
economy to a sustainable growth-path and building a globally competitive
industrial sector. To achieve this, several policies and programmes were put in
place to accelerate economic growth.
To improve stable supply of electricity, the Kano Hydro and Energy
Development Company (KHEDCO) was issued a Water Use Licence, for the
construction of two hydro power plants. The Plants comprised 10MW Tiga
Hydroelectric Power Plant and 6MW Challawa Hydroelectric Power Plant
located at Bebeji and Karaye, Kano State. When completed, the Project
would increase energy generation capacity in the country.
The Corporate Affairs Commission (CAC) introduced Company Registration
Portal (CPR) during the year to fast track company registration. With the
6
DRAFT

Central Bank of Nigeria Annual Report—2018
195
introduction of the CPR, business registration would be concluded within 48
hours, thereby improving the ease of doing business in the country.
To further increase ‘Made in Nigeria Export’, the Federal Ministry of Industry,
Trade and Investment and the Nigeria Export Processing Zone Authority
initiated the Project MINE (Made in Nigeria for Exports). The Initiative was
aimed at making the country the manufacturing hub in the sub-Saharan
Africa, serving both regional and global markets. The Project, which would be
private sector driven, focused on development of new and upgrading of
existing Special Economic Zones (SEZ). It would create 1.5 million new
manufacturing jobs and increase manufacturing exports to at least US$30.00
billion by 2025, as well as, create an enabling environment for SEZ businesses
by ensuring easy access to government approvals. The pilot phase of the
Initiative would commence in Abia, Katsina and Lagos to demonstrate proof
of concept and provide models for future SEZ development in the country.
The Nigerian National Petroleum Corporation (NNPC) signed a MoU with the
Kogi State Government for the development of ethanol fuel. The Project, an
integrated feedstock plantation and processing plants complex, comprised:
an ethanol processing plant with capacity to produce 84 million litres of bio-
fuel per year; a cane mill; and a raw and refined sugar plant with annual
output of 126,000 tonnes. Others included: Bagasse Co-generation Plant that
would generate 64 megawatts of power; as well as, a Carbon Dioxide
Recovery and Bottling Plant with capacity of 2,000 tonnes per year. The
Project would be located in Kabba/Bunu, Kogi State.
The Ministry of Industry, Trade and Investment and Shandong Ruyi Group,
China’s largest textile manufacturer, signed a MoU for the development of
cotton value chain in Nigeria. The Agreement, worth US$2.00 billion, included
the aggregation and off-take of cotton from farmers, development of cotton
value chain to textile manufacturing, and garment production. The
Investment would yield at least 300 million metres of African print, which
would serve both local and international markets. The Project would be
concentrated in Katsina, Kano, Abia and Lagos states
6
DRAFT

Central Bank of Nigeria Annual Report—2018
196
The Government during the year launched a cluster project to address the
problem of work space for micro, small and medium enterprises (MSMEs). The
Project, would convert six out of twenty three Industrial Development Centres
(IDCs) in the country to industrial clusters (ICs), at a cost of over N67.00 billion.
The six viable cluster models identified were in the areas of agriculture (grains,
spices and oil palm) and manufacturing (furniture, fast moving consumer
goods (FMCG), and petrochemicals). The states identified for the Project
include, Lagos (FMCG), Imo (oil palm), Sokoto (spices), Borno (grains), and
Rivers (petrochemical).
The Federal Government and Volkswagen Group signed a MoU aimed at
making the country “automotive hub” of West Africa. The Agreement
included plan to develop short, medium and long-term approaches
targeting growth in car manufacturing in Nigeria. The Agreement also
included building new plants in the country; developing a training academy,
in conjunction with the German government; and developing a
comprehensive Volkswagen vehicle and service network in the country
subject to commercial viability. The Nigerian Government, on the other hand,
pledged to “accelerate the passage of the Nigerian Automotive Policy Bill.
6.3.2 Industrial Production
The industrial production index at 109.9 (2010=100), rose by 1.5 per cent in
2018, above the level in 2017. The improved performance over the
preceding year was as a result of increased activities in all the sub-sectors,
particularly, electricity consumption, crude oil production and manufacturing
output. The indices of electricity, manufacturing and mining sub-sectors rose
by, 7.3, 2.1 and 0.7 per cent, respectively.
6
DRAFT

Central Bank of Nigeria Annual Report—2018
197
Figure 6.6: Index of Industrial Production, 2014 – 2018
(2010=100)
Source: Computed by Staff from NBS Data
6.3.2.1 Manufacturing
At 183.4 (2010=100), the index of manufacturing output, showed an increase
of 2.1 per cent, compared with the level in 2017. Similarly, the average
manufacturing capacity utilisation in 2018 rose by 3.0 percentage points to
55.0 per cent. The development was attributed to enhanced access to
foreign exchange, increased demand as shown by continued improvement
in new orders, as well as, moderating inflationary pressure.
Figure 6.7: Index of Manufacturing Production and Capacity Utilisation, 2014 - 2018
Source: Computed by Staff from NBS and Manufacturers Association of Nigeria Data
6.3.2.2 Electricity Generation
Total installed electricity generation capacity, stood at 13,502.8MW in 2018,
compared with 13,363MW in 2017, indicating a 1.1 per cent increase. The
marginal increase was due to the installation of new generating plants and
expansion in the capacity of the existing ones. A disaggregation of the
115.9 116.1
106.2
108.3
109.9
100.0
102.0
104.0
106.0
108.0
110.0
112.0
114.0
116.0
118.0
0.0
20.0
40.0
60.0
80.0
100.0
120.0
140.0
160.0
180.0
200.0
2014 2015 2016 2017 2018
Ind
ex
Ind
ex
Manufacturing Mining Electricity Industry (RHS)
40
43
46
49
52
55
58
61
64
0.0
25.0
50.0
75.0
100.0
125.0
2014 2015 2016 2017 2018
Cap
acity
Util
isat
ion
(%)
Inde
x of
Man
ufac
turin
g
Index of Manufacturing Capacity Utilisation
6
DRAFT

Central Bank of Nigeria Annual Report—2018
198
installed capacity showed that thermal power constituted 85.5 per cent of
generation capacity, while hydro-power accounted for the balance. Analysis
by holding showed that the Successor Companies accounted for 46.6 per
cent; National Integrated Power Plant, 36.1 per cent and Legacy
Independent Power Plant, 17.3 per cent.
Figure 6.8: Nigeria’s Power System: Composition in 2018 by Source
(Per cent)
Sources: The Federal Ministry of Works, Power & Housing and the Nigeria Electricity Regulatory
Commission
Figure 6.9: Nigeria’s Power System: Composition in 2018 by Holding
(Per cent)
Sources: The Federal Ministry of Works, Power & Housing and the Nigeria Electricity Regulatory
Commission
The average electricity generation in 2018, estimated at 3,713.2 MW/h,
showed an increase of 5.1 per cent, above the level in the preceding year.
46.6%
17.3%
36.1%
Successor Lagacy NIPP
Thermal, 85.5%
Hydro-power, 14.5%
6
DRAFT

Central Bank of Nigeria Annual Report—2018
199
The increase in power generation was attributed to improved gas supply to
the thermal plants.
Figure 6.10: Electricity Power Generation, 2014 – 2018
Source: The Ministry of Power, Works & Housing and Nigerian Electricity Regulatory
Commission
6.3.2.3 Energy Consumption
The estimated index of energy consumption for 2016 stood at 50.6
(2010=100), representing a fall of 1.0 per cent below the level in 2015. In
absolute terms, estimated aggregate energy consumed in 2016 was
84,182.53 million tonnes of coal equivalent (tce), compared with 100,696.53
million tce in the preceding year. The decline in energy consumption during
the review period was attributed to decrease in the consumption of gas and
petroleum products due to deregulation in the downstream sector.
6.3.2.3.1 Electricity Consumption
The estimated average electricity consumption in 2018 was 3,080.2 MW/h,
showing an increase of 6.7 per cent above the level in the preceding year.
This was attributed to the improvement in transmission infrastructure. Energy
loss was lower at 17.3 per cent, compared with 18.2 per cent in 2017.
2900
3000
3100
3200
3300
3400
3500
3600
3700
3800
2014 2015 2016 2017 2018
MW
/h
6
DRAFT
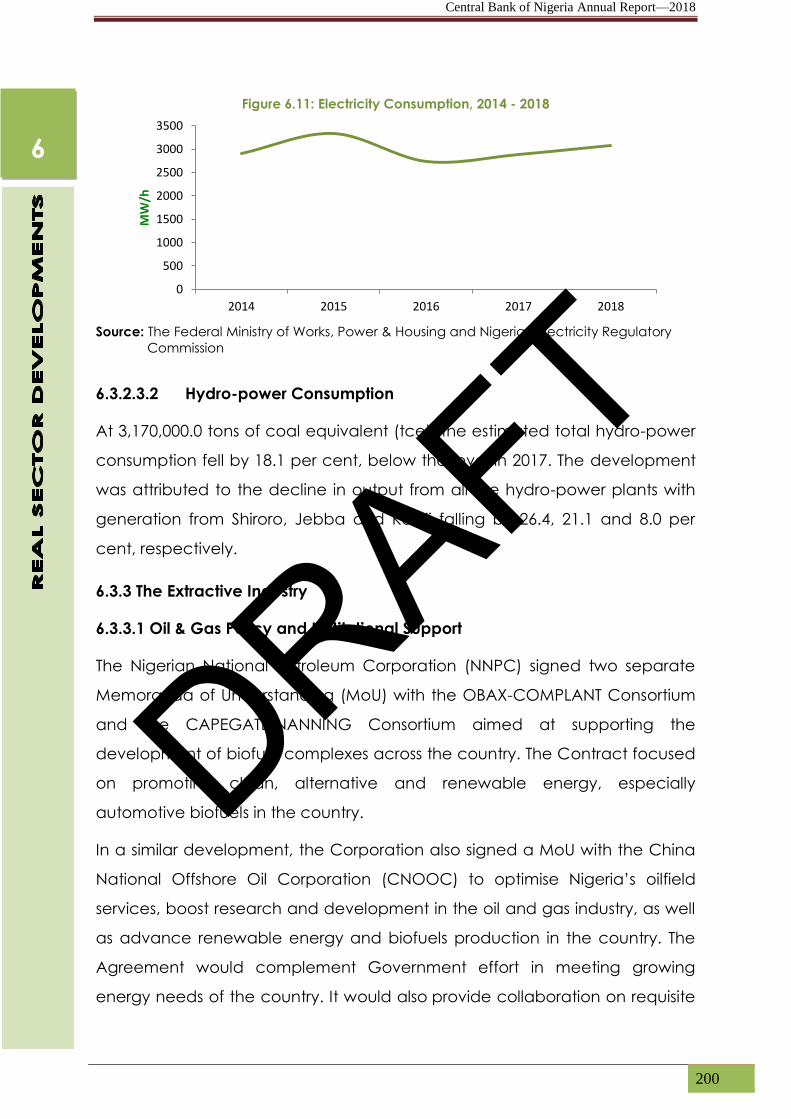
Central Bank of Nigeria Annual Report—2018
200
Figure 6.11: Electricity Consumption, 2014 - 2018
Source: The Federal Ministry of Works, Power & Housing and Nigerian Electricity Regulatory
Commission
6.3.2.3.2 Hydro-power Consumption
At 3,170,000.0 tons of coal equivalent (tce), the estimated total hydro-power
consumption fell by 18.1 per cent, below the level in 2017. The development
was attributed to the decline in output from all the hydro-power plants with
generation from Shiroro, Jebba and Kainji falling by 26.4, 21.1 and 8.0 per
cent, respectively.
6.3.3 The Extractive Industry
6.3.3.1 Oil & Gas Policy and Institutional Support
The Nigerian National Petroleum Corporation (NNPC) signed two separate
Memoranda of Understanding (MoU) with the OBAX-COMPLANT Consortium
and the CAPEGATE-NANNING Consortium aimed at supporting the
development of biofuel complexes across the country. The Contract focused
on promoting clean, alternative and renewable energy, especially
automotive biofuels in the country.
In a similar development, the Corporation also signed a MoU with the China
National Offshore Oil Corporation (CNOOC) to optimise Nigeria’s oilfield
services, boost research and development in the oil and gas industry, as well
as advance renewable energy and biofuels production in the country. The
Agreement would complement Government effort in meeting growing
energy needs of the country. It would also provide collaboration on requisite
0
500
1000
1500
2000
2500
3000
3500
2014 2015 2016 2017 2018
MW
/h
6
DRAFT

Central Bank of Nigeria Annual Report—2018
201
expertise for the advancement of oilfield services and its operatorship in the
country and beyond.
The NNPC also signed a contractual agreement with FIRST E&P and
Schlumberger for the development of Anyalu and Madu oilfields in the
review period. The Schlumberger under the Agreement would provide
US$724.14 million of the total project cost of US$1.08 billion while the balance
would be financed through the project cash flow. The Contract would
increase crude oil and gas production reserves and monetisation of the
nation’s enormous gas resources in a competitive manner. In addition, it
would generate US$5.60 billion taxes and royalties and US$1.32 billion net
cash flows after Schlumberger’s cost recovery and compensation.
The Bank of Industry (BOI) and the Export-Import Bank of China (CEXIM)
signed a MoU on a US$500 million financing support towards the
establishment of modular refineries and flare gas recovery programmes,
including financing the purchase of equipment and machinery. The
Programme would create over 100,000 jobs in Nigeria’s oil and gas sector.
a. Crude Oil Production, Refinery Utilisation, Petroleum Products and Prices
i. Crude Oil Production
Nigeria’s aggregate crude oil production, including condensates and natural
gas liquids, averaged 1.88 million barrels per day (mbd), or 686.20 million
barrels (mb) in 2018, compared with 1.72 mbd or 627.80 mb in the preceding
year, indicating to a 9.3 per cent increase. The increase in output was
attributed to gains from sustained peace deal between the Federal
Government and stakeholders in the Niger Delta region; the security
measures put in place to forestall production disruption and losses through
pipeline vandalism; as well as, the repairs and reopening of major oil
installations in the oil producing region.
ii. Refinery Utilisation
The estimated average capacity utilisation of the country’s three (3) refineries
stood at 22.9 per cent in 2018 from 20.9 per cent in 2017. A breakdown
showed that the average capacity utilisation of the Kaduna Refining and
6
DRAFT

Central Bank of Nigeria Annual Report—2018
202
Petrochemical Company (KRPC), the Warri Refining and Petrochemical
Company (WRPC), and the Port Harcourt Refining Company (PHRC) was
27.6, 10.4, and 24.7 per cent, respectively.
Aggregate production of petroleum products from the refineries was
estimated at 3.8 million metric tonnes in 2018, compared with 3.7 million
metric tonnes in 2017, representing to a 2.7 per cent increase. The
development was attributed to the improved efficiency of the refineries
which contributed to the increase in refined products following drive by
government to ramp up production and rely less on imported refined
products.
Analysis of products by refinery showed that the WRPC produced 0.38 million
metric tonnes, while the PHRC and the KRPC produced 1.96 and 0.53 million
metric tonnes, respectively. Of the total, Premium Motor Spirit (PMS)
accounted for the largest share at 31.3 per cent, while the shares of
Automotive Gas Oil (AGO), fuel oil, Dual Purpose Kerosene (DPK), fuel and
losses, Liquefied Petroleum Gas (LPG), and Asphalt were 23.7, 22.3, 14.6, 5.2,
2.8 and 0.1 per cent, respectively.
iii. Petroleum Products Consumption
The volume of petroleum products consumed in 2018 was estimated at 16.91
billion litres. This represented an increase of 6.6 per cent, compared with
15.87 billion litres in 2017. A breakdown by product showed that PMS had the
highest consumption, with 13.3 billion litres (83.9%); AGO, 1.29 billion litres
(8.2%); DPK, 0.65 billion litres (4.1%); ‘Others’, 0.31 billion litres (2.0%); and LPFO,
0.30 billion litres (1.9%).
iv. Prices
The average spot price of Nigeria’s reference crude, the Bonny Light (370API),
was US$72.53 per barrel in 2018, compared with the preceding year’s
average of US$54.90 per barrel, an increase of 32.1 per cent. The West Texas
Intermediate (WTI) recorded an average price of US$57.81 per barrel in 2018,
representing an increase of 14.7 per cent, relative to the level in the
preceding year. Also, the UK Brent and Forcados crude prices followed similar
6
DRAFT

Central Bank of Nigeria Annual Report—2018
203
trends increasing to US$71.17 and US$72.57 per barrel, respectively,
compared with the levels in the preceding year. The average price of the
OPEC basket of 15 crude streams also rose by 32.8 per cent to US$69.61 per
barrel in 2018.
The increase in oil price during the year was influenced by tension in the
Korean peninsula; U.S. withdrawal from the Iran deal; and agreement by
OPEC and its Russia-led allies to slash production by 1.2 million barrels per
day, among others.
A trend analysis indicated that average crude oil price, was US$70.83 per
barrel in January 2018. It, however, fell to US$67.20 per barrel in February 2018,
but remained above US$70 per barrel till October 2018. Thereafter, it ended
the year at US$58.16 per barrel.
Figure 6.12: Bonny Light Monthly Prices in 2017 and 2018 (US$)
Source: REUTERS
(b) Gas
i. Policy and Institutional Support
In furtherance of the pursuit of national sufficiency in energy, the NNPC
commenced the Seven Critical Gas Development Projects tagged 7CGDP.
The Project would deliver about 3.4 billion standard cubic feet of gas per day
(bscfd), hence, enabling the attainment of the target of generating 15
gigawatts (GW) of electricity by 2020. It would close the gap between
demand and supply in the domestic gas market. The 7CGDP Project
-
10.00
20.00
30.00
40.00
50.00
60.00
70.00
80.00
90.00
Jan Feb Mar Apr May Jun Jul Aug Sept Oct Nov Dec
US$
2017 2018
6
DRAFT

Central Bank of Nigeria Annual Report—2018
204
included: the development of the 4.3 trillion cubic feet (TCF) Assa North/Ohaji
South field; development of the 6.4 TCF Unitised Gas fields (Samabri-Biseni,
Akri-Oguta, Ubie-Oshi and Afuo-Ogbainbri); the development of 7TCF
NPDC’s OML 26, 30 and 42. Others included: 2.2 TCF Shell Petroleum
Development Company (SPDC) JV Gas Supply to Brass Fertilizer Company;
cluster development of 5 TCF OML 13 to facilitate the expansion of Seven
Energy Uquo Gas Plant; as well as, the cluster development of 10 TCF
Okpokunou/Tuomo West (OML 35& 62).
The Nigerian National Petroleum Corporation (NNPC) launched a Virtual Gas
Pipeline Network for power generation in collaboration with the private
sector. The Project was intended to leverage the growing proven gas
reserves of the country through the installation of Mini-LNG plants with
capacity to supply about 84 million standard cubic feet of gas per day
(mscf/d). The gas would be transported using customised cryogenic tankers
to areas not easily accessible through pipelines. In addition, it would supply
gas to manufacturing and housing sectors at affordable prices.
The Federal Government during the year unveiled the National Gas Flaring
Commercialisation Programme (NGCP) and approved the Flare Gas
(prevention of waste and pollution) Regulations 2018. The Programme sought
to end gas flaring, thereby reducing carbon emission and minimising the
effect of climate change. The NGCP would seek investors’ collaboration as
off-takers for currently flared gas by joint venture companies, an
arrangement that would save the country about US$800.00 million losses
annually.
As part of ongoing efforts by the government to boost gas production and
improve gas infrastructures, the Nigeria LNG signed a MoU with B7 JV
Consortium and the SCD JV Consortium. The Agreement aimed to increase in
the country’s gas production from 22 million metric tonnes to 30 million metric
tonnes annually.
The Nigerian National Petroleum Corporation (NNPC) signed contracts under
a 100 per cent contractor financing model with a consortium of indigenous
and Chinese companies for the engineering, procurement, construction,
6
DRAFT

Central Bank of Nigeria Annual Report—2018
205
commissioning and financing for Lots 1&3 of the 40 inch x 614km Ajaokuta -
Kaduna - Kano gas pipeline and stations. The gas pipeline was designed to
enable the industrialisation of the Eastern and Northern parts of Nigeria,
which would connect East, West and North. The participation of indigenous
companies was consistent with the local content policy.
i. Gas Production and Utilisation
The total estimated volume of gas produced in 2018 was 1,147.20 million
standard cubic feet (mscf), representing an increase of 17.1 per cent above
the level in 2017. Of the total gas produced, 86.3 per cent was utilised, while
13.7 per cent was flared. Of the volume utilised, 39.6 per cent was sold to
industries, including power, cement and steel companies; and 28.3 per cent
was re-injected. Gas sold to the Nigeria Liquefied Natural Gas (NLNG)
Company, utilised as fuel, and converted to natural gas liquid, accounted for
21.8, 8.5, and 1.8 per cent, respectively.
Figure 6.13: Gas Production and Utilisation, 2014 – 2018 (Billion mscf)
Source: NNPC
6.3.3.2 Solid Minerals
(a) Policy and Institutional Support
The Federal Government in conjunction with the China Geological Survey
(CGS) commenced the implementation of the Low Density Geochemical
Mapping Project. The Project focused on the low-density geochemical
mapping and the National-Geo-Information System; and geo-data sharing,
-
0.50
1.00
1.50
2.00
2.50
3.00
2012 2013 2014 2015 2016
Billio
n m
scf
Gas Produced Gas Utilised Gas Flared
6
DRAFT

Central Bank of Nigeria Annual Report—2018
206
which were essential for investment in the mining sector and for
environmental sustainability.
Furthermore, the Government awarded a mining contract worth N15.00
billion (over US$41.00 million) to five (5) exploration firms to diversify the
economy from oil. The Project was in line with the Ministry of Mines and Steel
Development’s Integrated Exploration Programme for the exploration of key
minerals like gold, lead, zinc, iron ore and rare earth metals. The Contract
offered the mining companies 3-5 years tax holiday, duty free on imported
equipment, as well as, full business ownership and easy profit repatriation.
(b) Solid Minerals Production
Aggregate production of solid minerals increased in 2018, relative to the level
in the preceding year. Provisional data showed that aggregate output rose
from 43.94 million tonnes in 2017 to 46.53 million tonnes in 2018, an increase of
5.9 per cent. The development was attributed to the increase in production
of principal minerals, such as columbite ore, limestone, iron ore, shale and
marble aggregates.
6.3.4 Industrial Financing
6.3.4.1 The Nigeria Export-Import Bank (NEXIM)
The total funding support provided to the non-oil export sector, under various
facilities of the NEXIM in 2018, was estimated at N131.80 million for 6 projects,
compared with N102.30 million disbursed in 2017 for 5 projects, representing
an increase of 28.8 per cent. The development was attributed to the
completion of the restructuring of the Bank’s funding model. A breakdown of
the disbursement by facility showed that 54.0 and 46.0 per cent were
disbursed under short-term and medium-term lending facilities, respectively.
6
DRAFT

Central Bank of Nigeria Annual Report—2018
207
Figure 6.14: Summary of NEXIM Disbursements by Facility, 2018 (per cent)
Source: NEXIM
A sectoral analysis of NEXIM disbursements showed that the agricultural
sector received N88.80 million, representing 67.0 per cent of the total. This
was followed by the manufacturing sector, with N33.0 million or 25.0 per cent;
and solid minerals, N10.40 million or 8.0 per cent of the total.
Figure 6.15: Summary of NEXIM Disbursements by Sector, 2018 (per cent)
Source: NEXIM
6.3.4.2 The Bank of Industry
The total credit disbursed to the industrial sector under the various BOI
facilities at end-June 2018 fell by 8.1 per cent, to N113.54 billion, compared
with N123.57 billion in the corresponding period of 2017.
Medium-term Direct Lending Facility
46%
Short-term Direct Lending Facility
54%
Column1
Manufacturing, 25%
Agriculture, 67%
Solid Minerals, 8.0%
6
DRAFT

Central Bank of Nigeria Annual Report—2018
208
A sectoral breakdown of the disbursements showed that the agro-processing
sector received N30.25 billion, representing 26.6 per cent of the total,
followed by the food processing sub-sector, with N25.76 billion or 23.0 per
cent. The sum of N18.74 billion or 16.5 per cent was disbursed through
intervention funds, while engineering and technology, health care, solid
minerals and metals and creativity industry received N11.80 billion or 10.4 per
cent, N11.37 billion or 10.0 per cent, N4.25 billion or 3.7 per cent and N4.05
billion or 3.6 per cent, respectively, of the total disbursement.
Disbursement on the basis of enterprises showed that, large enterprises
received N98.30 billion, representing 86.6 per cent, while small and medium
enterprises accessed N15.2 billion, indicating 13.4 per cent.
Figure 6.16: Summary of BOI Disbursements by Sector, 2017 (per cent)
Source: BOI
6.4 TRANSPORT AND COMMUNICATIONS
6.4.1 Road Transport
The Federal Government, during the review period, established the
Presidential Infrastructure Development Fund (PIDF). The PIDF, which would
be managed by the Nigerian Sovereign Investment Authority (NSIA), has an
initial seed fund of US$650 million. The Fund would be invested in critical road
and power projects across the country.
Gas & Petrochemicals
2%
Solid Minerals 4% Agro Processing
28%
Creative Industry 4%
Engineering & Technology
10%
Intervention Funds Group
18% Food Processing
24%
Healthcare 10%
6
DRAFT

Central Bank of Nigeria Annual Report—2018
209
6.4.2 Aviation Services
6.4.2.1 Policy and Airport Developments
To reduce the tax burden and improve the ease of doing business, the
Federal Government during the review period, issued an Executive Order
(Value Added Tax Act Modification Order) stopping the levy of VAT on all
forms of shared transportation. This would stimulate, particularly domestic air
transportation and reduce fares.
The Federal Government also inaugurated the new international terminals in
Abuja and Port-Harcourt airports. The airport terminals were designed to
improve the quality of air transport experienced by passengers in the country.
They were built with a US$500.00 million facility secured from the China EXIM
Bank.
6.4.2.2 Domestic Operations
At end-June 2018, a total of 5,990,411 passengers were airlifted by domestic
airlines. This represented a 37.2 per cent increase above the 4,365,140
passengers airlifted in the corresponding period of 2017. Similarly, total aircraft
movement was 116,400 at end-June, 2018, representing an increase of 30.4
per cent above the 89,268 in the corresponding period of 2017.
6.4.1.3 International Operations
The number of passengers airlifted by airlines on international routes at end-
June, 2018, increased by 9.8 per cent to 2,048,299 compared with 1,864,775
in 2017. Aircraft movement at the same period reduced by 6.3 per cent to
20,894 at end-June 2018, compared with 22,309 in the corresponding period.
Cargo movement at designated airports declined by 50.2 per cent to 83.1
million kg below 167 million kg in 2017. Mail movement also declined by 40.5
per cent to 17.6 million kg at end-June, 2018, compared with 29.6 million kg in
2017.
6.4.2 Railway Services
During the review period, the Nigeria Railway Corporation (NRC)
commissioned ten (10) additional Standard Gauge Coaches on the Abuja-
6
DRAFT

Central Bank of Nigeria Annual Report—2018
210
Kaduna rail service. Also, seven (7) similar coaches were delivered at Agbor
for the Itakpe-Ajaokuta-Warri line with test run carried out in November 2018.
In addition, the Abuja-Light Rail project was commissioned during the year.
The Project was financed by loan from China EXIM Bank at the cost of
US$500.00 million. It would reduce traffic congestion and improve
transportation of commuters.
The Federal Government signed an Interim Phase Agreement with General
Electric (GE) - led Consortium for the concessioning of the Narrow Gauge
line. Transnet International Holdings, however, took over from GE as the lead
consortium partner in a US$2.00 billion Nigerian Narrow-Gauge Railway
Concession. Transnet’s Consortium partners in the concession are APM
Terminals, a Dutch-based global port, terminal and intermodal inland services
provider, and SinoHydro, a Chinese state-owned hydropower engineering
and construction business. The concession would fund, rehabilitate and
operate Nigeria’s western and eastern narrow-gauge lines, connecting Lagos
in the South-West to Kano in the North-West and Port Harcourt in the South-
South to Maiduguri in the North-East.
At end-June 2018, a total of 1,478,634 passengers and 165,566 tonnes of
freight were moved by trains operated by the Nigeria Railway Corporation
compared with 2,593,744 passengers and 141,186 tonnes of freight moved
during the same period in 2017.
6.4.3 Maritime Services
The Federal Government commenced the construction of Lekki Deep Sea
Port in Lagos during the review year. The Port, located at the center of the
Lagos Free Trade Zone, would feature three container berths, one dry bulk
berth and three liquid berths, which would handle up to 2.7 million Twenty
Foot Equivalent Units (TEUs) annually. The Port channel would be developed
to a depth of about 16 meters to accommodate larger ships. The Project
worth US$1.50 billion would be completed in 2020.
The Maritime University, Okerenkoko, Delta State commenced academic
activities. The University was granted approval in early 2018 by the National
6
DRAFT

Central Bank of Nigeria Annual Report—2018
211
Universities Commission (NUC) to run undergraduate degree programmes in
three faculties namely: Transport; Engineering and Environmental
Management, with specialisations in Marine Engineering, Marine Economics,
Climate Change and Fisheries. To enhance the security on the nation’s
water way, the Federal Executive Council (FEC) approved US$23.00 million
(N7.14 billion) for the protection of six sections of the country’s coastal ways
by the Nigerian Maritime Administration and Safety Agency (NIMASA).
Data from the Nigerian Ports Authority (NPA) showed that at end-June, 2018,
a total of 9,289 ocean going vessels berthed at Nigerian ports, compared
with 1,540 in 2017. Cargo throughput stood at 96,603,396.94 metric tonnes in
the same period, compared with 73,628,546.62 metric tonnes in 2017,
representing an increase of 31.2 per cent.
6.4.4 Communication
Digital mobile lines continued to drive growth in the communications sector
during the review period. Data from the Nigerian Communications
Commission (NCC) showed that the number of active telephone lines was
172.9 million at end-December 2018, compared with 145.1 million at end-
December 2017. This represented an increase of 19.2 per cent. Teledensity
increased to 123.48 lines per 100 inhabitants at end-December 2018,
compared with 103.61 lines per 100 inhabitants at end-December 2017.
Teledensity in Nigeria remained above the International Telecommunication
Union (ITU) minimum standard of 1:100. In addition, the number of internet
users increased to 112.1 million at end-December 2018, compared with 98.7
million at end-December 2017.
6
DRAFT

Central Bank of Nigeria Annual Report—2018
212
Figure 70
Active Lines and Teledensity
Source: Nigerian Communication Commission (NCC)
Further analysis indicated that the wireless
Global System for Mobile (GSM)
communication segment accounted for
172.5 million lines in the telecoms sector,
representing 99.8 per cent of the total 172.9
million connected lines at end-December
2018. Mobile Telecommunications Network (MTN) had the largest share of the
market with 67.1 million subscribers, followed by Globacom with 45.3 million
subscribers, Airtel with 44.2 million subscribers and 9mobile, 15.9 million
subscribers.
In a related development, the 2018 broadband internet penetration target of
30 per cent for Nigeria was also achieved with 31.48 per cent broadband
penetration at end-December 2018, compared with 19.86 per cent at end-
December 2017. The broadband penetration met NCC National Broadband
Plan target minimum of 30 per cent penetration between 2013 and 2018.
6.5 CONSUMER PRICES
The year-on-year headline inflation remained above the CBN’s single-digit
benchmark. Inflation maintained a seven-month consistent decline ending
up to July 2018, after which a sustained uptick dominated the remaining
months of the year. Data obtained from the NBS indicated that the all-items
composite Consumer Price Index (CPI) stood at 274.6 (November 2009=100)
at end-December 2018, compared with 246.4 at end-December 2017. The
year-on-year headline inflation stood at 11.44 per cent at end-December
14
4.6
3
16
2.3
1
17
2.4
9 103.61
116.26 123.5 112,479
113,762 113,626
111,500
112,000
112,500
113,000
113,500
114,000
0
50
100
150
200
End-Dec. 2017 End-June 2018 End-Dec. 2018
Mill
ion
s
Mobile Phones (LHS) Teledensity (LHS) Fixed (RHS)
6
The year-on-year headline inflation stood at
11.44 per cent at end-December 2018,
indicating a decline of 3.99 percentage points
below the level at end-December 2017.
DRAFT

Central Bank of Nigeria Annual Report—2018
213
2018, indicating a decline of 3.99 percentage points, below the level at end-
December 2017.
Further analysis indicated that inflation decelerated consistently from 15.13
per cent at end-January to 11.14 per cent at end-July 2018. The trend,
however, reversed at end-August 2018 to 11.23 per cent, accelerating
consistently to 11.28 at end-September and 11.44 at end-December 2018.
The persistent decline in inflationary trend during the first seven months of the
year was attributed to declining prices in the food and core components of
the consumer price index. The increase in aggregate prices, however,
noticed in the remaining months of 2018, was attributed to upward
inflationary pressure in the food component of the basket.
The 12-month moving average headline inflation was 12.10 per cent at end-
December 2018, compared with the 16.50 per cent at end-December 2017.
Core inflation (all-items, less farm produce), decreased steadily from 12.10
per cent at end-January to 9.8 per cent at end-September and remain
unchanged at end-December 2018. The persistent decline in core inflation
was attributed partly to the effect of sustained interventions by the CBN in the
foreign exchange market which moderated the exchange rate of the naira,
thereby, reducing the pass-through effect on domestic prices.
Food inflation maintained a downward trend from 18.92 per cent at end-
January, for seven consecutive months of the year, to 12.85 per cent at end-
July. The declining trend was reversed at end-August 2018 when food
inflation rose to 13.16 per cent and maintained the upward trend to 13.56 per
cent at end-December 2018. The development was attributed largely to
shortages in the supply of food items, resulting from the incessant
herdsmen/farmers’ crises. This was exacerbated by the menace of flooding
that occurred in the third quarter, affecting 12 states and destroying various
crops such as rice, yam, cassava, tomatoes and sorghum.
6
DRAFT

Central Bank of Nigeria Annual Report—2018
214
Figure 6.19: Trends in Inflation, 2018
(Year-on-year, 12-Month Moving Average and Month-on-Month)
Source: NBS
Figure 6.20: Trends in Inflation, 2018
(Composite, Core and Food)
Source: NBS
Table 6.4: Headline Inflation (Year -on-Year) (Per cent)
2014 2015 2016 2017 2018
January 8.0 8.2 9.6 18.7 15.13
February 7.7 8.4 11.4 17.8 14.33
March 7.8 8.5 12.8 17.3 13.34
April 7.9 8.7 13.7 17.2 12.48
May 8.0 9.0 15.6 16.3 11.61
June 8.2 9.2 16.5 16.1 11.23
July 8.3 9.2 17.1 16.1 11.14
August 8.5 9.3 17.6 16.0 11.23
September 8.3 9.4 17.9 16.0 11.28
October 8.1 9.3 18.3 15.9 11.26
November 7.9 9.4 18.5 15.9 11.28
December 8.0 9.6 18.5 15.4 11.44
Source: NBS
0.0
0.2
0.4
0.6
0.8
1.0
1.2
1.4
0.02.04.06.08.0
10.012.014.016.018.0
Jan Feb Mar Apr May Jun Jul Aug Sept Oct Nov Dec
Rat
es (
per
cen
t)
Rat
es (p
er c
ent)
Year-on-Year (LHS) 12 MMA (LHS) Month-on-Month (RHS)
0.0
5.0
10.0
15.0
20.0
Jan Feb Mar Apr May Jun Jul Aug Sept Oct Nov Dec
Rat
es (p
er c
ent)
Composite Core Food
6
DRAFT

Central Bank of Nigeria Annual Report—2018
215
The urban headline inflation (year-on-year) decreased significantly to 11.73
per cent at end-December 2018, from 15.56 per cent at end-December
2017. Urban core also decreased to 10.09 per cent from 13.0 per cent at end-
December 2017. Similarly, urban food inflation fell to 14.19 per cent at end-
December 2018, from 19.89 per cent at end-December 2017.
Rural inflation (year-on-year) decreased to 11.18 per cent at end-December
2018, from 14.76 per cent at end-December 2017. Rural core inflation also
decreased to 9.50 per cent at end-December 2018, compared with 11.33
per cent in December 2017. Similarly, rural food inflation decreased to 13.02
per cent at end-December 2018, compared with 18.11 per cent at end-
December 2017.
6.6 THE SOCIAL SECTOR
6.6.1 Employment and Job Creation
The data from the National Bureau of Statistics showed that the economically
active or working age population (15 – 64 years of age) increased from
112.12 million in Q4 2017 to 115.49 million in Q3 2018, representing an increase
of 3.0 per cent. The labour force population, also increased from 86.54 million
in Q4 2017 to 90.47 million in Q3 2018, representing a 4.5 per cent increase.
The unemployment rate increased from 20.4 per cent in Q4 2017 to 23.1 per
cent in Q3 2018. The Urban and rural unemployment were 23.9 and 21.2 per
cent in Q3 2018, respectively.
Table 6.5 Labour Statistics, 2013-2017
2014 2015 2016 2017 2018
Total
Population(Million)
178.5 184.2 190.1 196.2 202.5
Labour Force (Million) 72.9 76.9 81.2 86.54 90.47*
Unemployment Rate
(%)
7.8 10.4 14.2 20.4 23.1*
Source: NBS
*as at Q3, 2018
6
DRAFT

Central Bank of Nigeria Annual Report—2018
216
6.6.2 Education
During the review period, the Federal Government approved N2.00 billion for
the establishment of the Nigerian Army University, Biu, Borno State. The
University would be tailored to meet the needs of the military and develop
the science and technology base of the nation. The institution would
enhance the capacity of the military to deal with insurgency and numerous
security challenges. Similarly, the Federal Government approved the
construction of US$50.00 million (N18.00 billion) Transportation University to be
located in Daura, Katsina State.
The Federal Government flagged off a National School Enrolment Drive
Campaign to improve primary school enrolment and completion rates.
Consequently, the Federal Government established the Community-Based
Early Childcare Centre (CBECC) in 16 states to reduce the incidences of out-
of-school children. To effectively accomplish the CBECC, Government
constructed 85 public primary schools across the country to increase the
carrying capacity of the schools. In addition, a guideline for enhancing
teaching proficiency was developed, and a total of 31,520 teachers across
27 states were trained.
The United Nations Children’s Fund (UNICEF) expanded access to quality
education for out-of-school-children in four states in the northern part of the
country under its Cash Transfer Programme (CTP). CTP was a direct transfer
payments to victims of humanitarian crises to assist them in situations where
opportunities for employment, income, livelihood, or economic production
are extremely limited. During the review period, the CTP was implemented in
Kebbi, Sokoto, Katsina and Zamfara States. The overall goal of the CTP was
expansion of access to quality basic education for 501,749 out-of-school
children by 2020 in the beneficiary states.
6.6.3 Health
The Federal Government, also signed into law the Bill establishing the Nigeria
Centre for Disease Control (NCDC). The Centre which was established in 2011
without legal backing, was to respond to the challenges of public health
emergencies and enhance the country’s preparedness for epidemics
6
DRAFT
Central Bank of Nigeria Annual Report—2018
217
through prevention, detection, and control of communicable diseases. The
Actl mandated the NCDC to detect, investigate, prevent and control
diseases of national and international public health importance.
To further improve the health status of the country, the Global Fund, an
international financing organization, approved a grant of US$660.00 million
during the review period to further tackle HIV/AIDS, Tuberculosis and Malaria
epidemics in Nigeria. Similarly, the Global Alliance for Vaccine Initiative
(GAVI) extended its support for immunization in the country till 2028. The
Federal Government would increase its domestic funding for immunisation by
10.0 per cent each year.
6.6.3.4 National Social Investment Programme (NSIP)
The National Social Investment Programme (NSIP) was established in 2016 to
empower vulnerable individual of the society, improve the quality of life,
provide affordable credit for Micro, Small and Medium Enterprises (MSMEs),
reduce inequality and wide disparities, as well as, increase access to
education and health services, among others. During the review period
about 9.76 million persons had benefited from the various programmes under
the NSIP which included Job Creation and Youth Empowerment (N-Power);
National Home Grown School Feeding Programme (NHGSFP); Government
Enterprise and Employment Programme (GEEP) and the National Cash
Transfer Programme (NCTP).
The School Feeding Programme, which was designed to target 5.5 million
school children, reached 8.2 million school children during the review period.
About N40.00 Billion had been spent on feeding of school children across 26
states in the country since inception in 2015.
6.7 Housing and Urban Development
The Federal Ministry of Power, Works and Housing in the review period,
commenced pilot projects for National Mass Housing programme in 34 states
of the Federation. The Programme was aimed at delivering 2,736 housing
units at affordable price to low income earners.
6
DRAFT

Central Bank of Nigeria Annual Report—2018
218
6.8 Activities of National Emergency Management Agency (NEMA)
The National Emergency Management Agency established Internally
Displaced Persons (IDP) camps in 12 states (Delta, Edo, Anambra, Kogi,
Bayelsa, Adamawa, Kebbi, Akwa Ibom, Cross River, Rivers, Kwara and
Taraba) affected by the flooding incidence in 2018. The IDP camps were
established in collaboration with each of the host state governments. An
estimated number of 441,250 people were affected, while, 141,400 people
were displaced by the flood.
6.9 Environment
To accelerate sustained economic growth, the Federal Ministry of
Environment and its sub-agencies in the review period, aligned its key
environmental policies and projects to the ERGP and Nationally Determined
Contributions (NDCs), as captured in the Climate Change Paris Agreement.
These policies and projects were the Great Green Wall (GGW), Nigeria
Erosion & Watershed Management Project (NEWMAP), Reducing Emissions
from Deforestation and Forest Degradation (REDD+), Ogoni Cleanup Project
and the Green bonds.
The National Agency for the Great Green Wall (NAGGW) established
shelterbelts across the hinterlands of Kebbi, Borno, Adamawa, Bauchi,
Gombe, Jigawa, Kano, Katsina, Sokoto, Yobe and Zamfara states through
provision of water facilities for irrigation, trees and shrubs. The shelterbelts
were intended to halt and reverse land degradation, prevent depletion of
biological diversity, as well as, promote grazing resources, agriculture and
other livestock farming in the states.
During the period under review, the Nigeria Erosion & Watershed
Management Project (NEWMAP) launched multi-sectoral projects to tackle
erosion menace and other environmental challenges associated with
climate change in Enugu State. The projects were designed to prevent and
reverse land degradation by curbing gully erosion in Enyazurum, Ohom Orba
and Onuiyi Nsukka that had been a threat to infrastructural development
and livelihood existence in the areas.
6
DRAFT

Central Bank of Nigeria Annual Report—2018
219
To ensure further protection of the Nigerian waterways from pollution, the
Federal Government agreed to enforce strict compliance with the
International Maritime Organisation regulation, which sets a maximum of 0.05
per cent sulphur cap on all fuel used by vessels by the year 2020. To ensure
compliance, NIMASA embarked on enlightenment and collaboration with
stakeholders in determining modalities of ensuring compliance in the Nigerian
waterways.
The clean-up activities of Ogoni land continued in 2018 with completion of
procurement process and the selection of 21 companies by the Hydrocarbon
Pollution Remediation Project (HYPREP) agency. To expedite the clean-up,
the Federal Government released the sum of US$177.00 million out of the
estimated US$1.00 billion required for the project. The estimated amount for
the clean-up would be funded over a period of five years through public-
private partnership.
6
DRAFT

Central Bank of Nigeria Annual Report—2018
220
DRAFT

Central Bank of Nigeria Annual Report—2018
221
he external sector remained strong in 2018, following favourable crude oil price at the
international market, stable crude oil production, and continued recovery in the
domestic economy, as well as, the sustained reforms in the foreign exchange market.
Consequently, an overall balance of payments surplus of ₦990.49 billion equivalent to 0.8 per
cent of GDP was recorded in the review period. Similarly, the current account recorded a
surplus of 2.3 per cent of GDP. The capital and financial account recorded a net financial
liability of 3.3 per cent of GDP as against a net financial asset of 1.2 per cent of GDP in 2017,
driven largely by higher inflow of portfolio investment and other investment liabilities. The
stock of external reserves at end-December 2018 was US$42.59 billion, higher than the
US$39.35 billion at end-December 2017. The level of external reserves could finance 13.0
months of current import commitments relative to 14.5 months in 2017. This was higher than
both the international benchmark and that of the West African Monetary Zone (WAMZ)
convergence criterion of three (3) months. External debt increased by 14.2 per cent, from
US$18.91 billion or 5.0 per cent of GDP at end-December 2017, to US$21.59 billion or 5.3 per
cent of GDP at end-September 2018, but remained within the international threshold of 40.0
per cent of GDP. The exchange rate remained relatively stable, supported by the CBN’s
exchange rate management policies. The international investment position (IIP) recorded a
net financial liability of US$71.02 billion in 2018, above US$57.80 billion in 2017, indicating an
increase of 22.9 per cent.
.
7.1 BALANCE OF PAYMENTS
7.1.1 Major Developments
The external account recorded an overall balance of payments surplus of
N990.49 billion, representing 0.8 per cent of GDP, compared with N3,737.37
billion or 3.3 per cent of GDP in 2017. This was as a result of favourable crude
oil prices, stable domestic crude oil production, and gradual domestic
economic recovery, as well as, the relative stability in the foreign exchange
market. The current account maintained a surplus position, equivalent to 2.3
per cent of GDP in the review period, though, lower than the 2.8 per cent of
GDP in 2017, driven, largely, by higher import bills, and widened deficits in
both the services and income accounts. The capital and financial account
recorded a net financial liability equivalent to 3.3 per cent of GDP in 2018, as
against a net financial asset of 1.2 per cent of GDP in 2017. This was
attributed, largely to higher inflow of other investment and foreign portfolio
T
CHAPTER SEVEN
EXTERNAL SECTOR DEVELOPMENTS
DRAFT

Central Bank of Nigeria Annual Report—2018
222
liabilities. The stock of external reserves at end-December 2018 was US$42.59
billion, indicating an increase of 8.2 per cent above the US$39.35 billion at
end-December 2017. The level could finance 13.0 months of import for goods
only, or 7.5 months of import of goods and services compared with 14.5
months, or 9.3 months, respectively, in 2017. The stock of external debt at
end-September 2018 increased by 14.2 per cent to US$21.59 billion,
representing 5.3 per cent of GDP, above the US$18.91 billion or 5.0 per cent
of GDP at end-December 2017. The level, however, remained within the
international threshold of 40.0 per cent of GDP.
Figure 7.1: Balance of Payments, 2014-2018
(Per cent of GDP)
Source: CBN
-5
0
5
10
15
20
25
30
2014 2015 2016 2017 2018
Per
cen
t
Current Account Balance Overall Balance Capital & Financial Account Balance
Export of Goods and Servces Import of Goods & Services
7
DRAFT

Central Bank of Nigeria Annual Report—2018
223
7.2 THE CURRENT ACCOUNT
Provisional data showed that in the review period, the current account
recorded a surplus of N2,868.88 billion, or 2.3 per cent of GDP, compared with
N3,174.43 billion or 2.8 per cent of GDP in 2017, indicating a decline of 9.6 per
cent. The development was due largely, to higher import bills and widening
deficits in both the services and income accounts, which overwhelmed the
substantial improvement in both oil and non-oil export; and increased inflow
of workers’ remittances. The goods account recorded a higher trade surplus
of N7,070.45 billion or 5.7 per cent of GDP, above the N4,013.95 billion,
equivalent to 3.5 per cent of GDP in 2017. This was as a result of higher
receipts from both oil and non-oil export. The deficit in the services account
widened, significantly, to N7,326.70 billion (5.9% of GDP) in the review period,
from N4, 040.24 billion (3.5% of GDP) in 2017. The development was due
largely, to increased payment in respect of other business services,
transportation, and travels, following the sustained access to foreign
exchange during the review period. Similarly, the deficit in the income
account widened to N4,703.43 billion (3.8% of GDP) in 2018, compared with
N3,514.22 billion (3.1% of GDP) in 2017, due largely, to higher repatriation of
dividends and other interest payments to non-resident investors. The
sustained inflow of remittances from Nigerians in the diaspora resulted in a
higher surplus of N7,828.57 billion or 6.3 per cent of GDP in the current
transfers account, compared with N6,714.94 billion, or 5.8 per cent of GDP, in
2017.
7.2.1 The Goods Account
The goods account recorded a higher surplus of N7,070.45 billion (5.7% of
GDP) in 2018, from N4,013.95 billion or 3.5 per cent of GDP in 2017, indicating
an increase of 76.2 per cent. This was due largely, to higher receipts from the
export of crude oil, gas and non-oil. Aggregate export, which represented
15.4 per cent of GDP, rose by 37.3 per cent to N19, 091.70 billion in 2018,
above the N13, 987.45 billion in 2017. A breakdown of total export showed
that crude oil and gas export remained dominant, accounting for 92.8 per
cent of the total, while non-oil export represented the balance. Similarly,
7
DRAFT
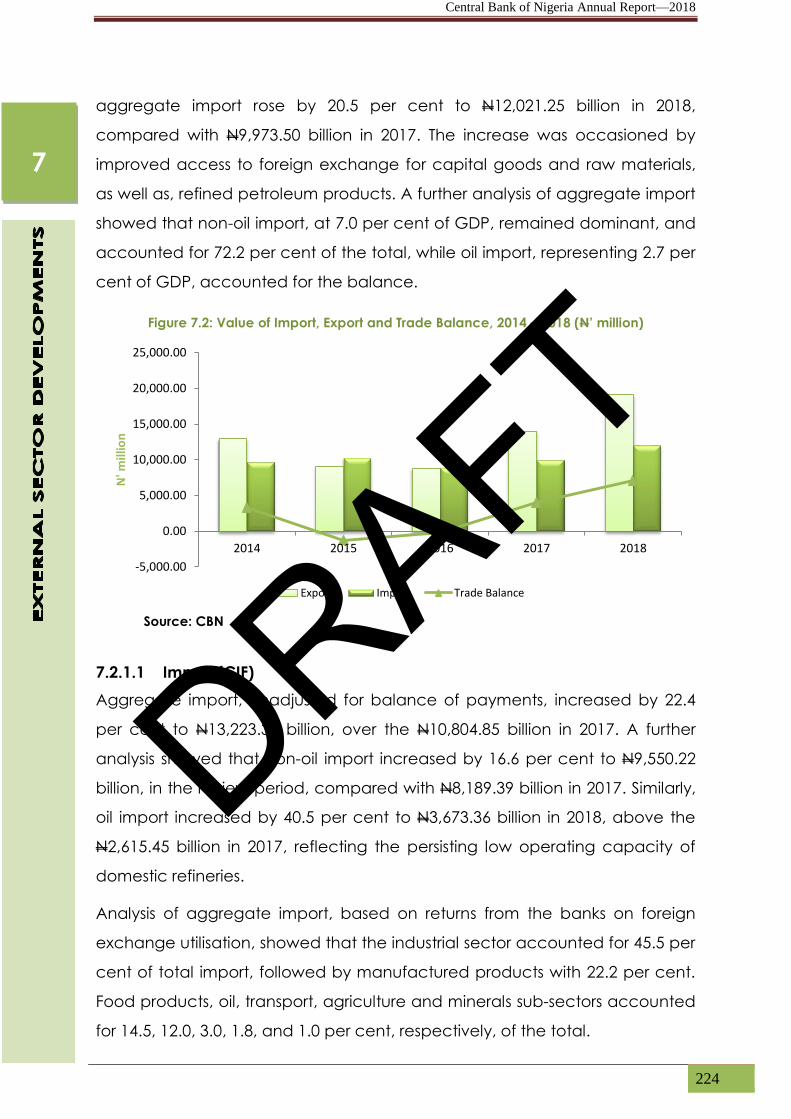
Central Bank of Nigeria Annual Report—2018
224
aggregate import rose by 20.5 per cent to N12,021.25 billion in 2018,
compared with N9,973.50 billion in 2017. The increase was occasioned by
improved access to foreign exchange for capital goods and raw materials,
as well as, refined petroleum products. A further analysis of aggregate import
showed that non-oil import, at 7.0 per cent of GDP, remained dominant, and
accounted for 72.2 per cent of the total, while oil import, representing 2.7 per
cent of GDP, accounted for the balance.
Figure 7.2: Value of Import, Export and Trade Balance, 2014 – 2018 (N’ million)
Source: CBN
7.2.1.1 Import (CIF)
Aggregate import, unadjusted for balance of payments, increased by 22.4
per cent to N13,223.38 billion, over the N10,804.85 billion in 2017. A further
analysis showed that non-oil import increased by 16.6 per cent to N9,550.22
billion, in the review period, compared with N8,189.39 billion in 2017. Similarly,
oil import increased by 40.5 per cent to N3,673.36 billion in 2018, above the
N2,615.45 billion in 2017, reflecting the persisting low operating capacity of
domestic refineries.
Analysis of aggregate import, based on returns from the banks on foreign
exchange utilisation, showed that the industrial sector accounted for 45.5 per
cent of total import, followed by manufactured products with 22.2 per cent.
Food products, oil, transport, agriculture and minerals sub-sectors accounted
for 14.5, 12.0, 3.0, 1.8, and 1.0 per cent, respectively, of the total.
-5,000.00
0.00
5,000.00
10,000.00
15,000.00
20,000.00
25,000.00
2014 2015 2016 2017 2018
N' m
illio
n
Export Import Trade Balance
7
DRAFT

Central Bank of Nigeria Annual Report—2018
225
(a) Import by Major Groups
A disaggregation of import by major groups showed the dominance of
consumer goods with a value of N7,144.74 billion or 54.0 per cent of the total,
compared with N5,575.49 billion or 51.6 per cent in 2017. The capital goods
and raw material category, which constituted 45.2 per cent of the total, rose
to N5,978.22 billion in 2018, while miscellaneous import, at N100.42 billion,
accounted for the balance. A further breakdown revealed that, under the
consumer goods category, importation of durable goods, valued at
N4,843.71 billion, accounted for 36.6 per cent of the total, while non-durable
goods, at N2,301.02 billion, represented 17.4 per cent of the total. In the
capital goods and raw material category, the former, dominated, with
N4,499.23 billion or 34.0 per cent of the total, while the latter, mainly industrial
chemicals, at N1,478.99 billion, constituted 11.2 per cent of the total.
Figure 7.3: Import by Major Groups, 2018 (Per cent)
Source: CBN
(b) Import by the Harmonised System (HS) Classification
Analysis of import by Harmonised System (HS) classification showed that
mineral products, at N3,821.56 billion, accounted for the largest share of 28.9
per cent of the total. This was followed by vehicles, aircrafts, vessels and
associated transport equipment category, at N2,446.33 billion or 18.5 per
cent. The value of machinery and mechanical appliances was N2,208.30
billion (16.7%); products of chemicals or allied, N1,071.09 billion (8.1%); base
metals and articles of base metal, N700.84 billion (5.3%); plastic and articles
thereof, N634.72 billion (4.8%); and vegetable products, N568.61 billion
Consumer Goods, 54.0%
Capital Goods and Raw Materials,
45.2%
Miscellaneous, 0.8%
7
DRAFT

Central Bank of Nigeria Annual Report—2018
226
(4.3%). A further analysis revealed that prepared foodstuffs, at, N515.71
billion, constituted 3.9 per cent of the total; live animals & animal products,
N409.92 billion (3.1%); and pulp of wood N238.02 billion (1.8%). Others
included: optical, photographic, cinematographic, measuring appliances,
N185.13 billion (1.4%); textile & textile articles, N171.90 billion (1.3%), while
other categories accounted for the balance.
(c) Non-oil Import by Country of Origin
A disaggregation of non-oil import to Nigeria by country of origin showed
China as dominant in 2018, accounting for 27.3 per cent of the total. This was
followed by the USA and India, with 13.2 and 7.0 per cent, respectively. Non-
oil import from United Kingdom was 4.4 per cent, while The Netherlands had
a share of 3.2 per cent of the total. Import from South Korea represented 2.7
per cent; Belgium, 2.6 per cent; and Italy, 2.4 per cent. Other countries
accounted for the balance.
Analysis of import by group showed that the share of Asia (excluding Japan)
increased to 41.2 per cent, compared with 39.6 per cent in 2017. The share of
industrialised countries also increased marginally to 31.8 per cent, compared
with 31.0 per cent in 2017, while that of “Other“ countries as a group,
decreased to 24.8 per cent in 2018, from 27.1 per cent in 2017. The share of
African countries as a group remained at 2.2 per cent of the total.
Figure 7.4: Non-oil Import by Country of Origin, 2014-2018
(Percentage share of total)
Source: CBN
34
.8
32
.7
31
.8
31
.0
31
.8
3.9
2.3
2.1
2.2
2.2
37
.1
40
.7
43
.3
39
.6
41
.2
24
.3
24
.3
22
.8
27
.1
24
.8
0.0
10.0
20.0
30.0
40.0
50.0
2014 2015 2016 2017 2018
% S
har
e o
f To
tal
Industrial Countries Africa Asia (excluding Japan) Other Countries
7
DRAFT

Central Bank of Nigeria Annual Report—2018
227
7.2.1.2 Export (FOB)
Aggregate merchandise export rose significantly by 36.5 per cent to
N19,091.70 billion, equivalent to 15.4 per cent of GDP in 2018, compared with
N13,987.45 billion or 12.2 per cent of GDP in 2017. The boost in merchandise
export was attributed to the increase in crude oil prices, improvement in
domestic crude production and higher non-oil receipts. The dominance of
crude oil export in total export was evident as it constituted 81.7 per cent of
the total. Gas sales accounted for 11.1 per cent, while non-oil export, made
up the balance.
A breakdown of export showed that crude oil receipts rose by 41.5 per cent
to N15,603.73 billion or 12.6 per cent of GDP in the review period, compared
with N11,026.70 billion or 9.6 per cent of GDP in 2017, attributed to
improvement in both price and production. The average price of Nigeria’s
reference crude, the Bonny Light, increased to US$72.53 per barrel in the
review period, compared with US$54.90 per barrel in 2017, following OPEC’s
extension of crude oil production cut deal and rising geopolitical tensions.
Similarly, crude oil production increased to an average of 1.88 mbpd in 2018,
from 1.72 mbpd in 2017. Gas export, including liquefied natural gas and
condensate, increased by 12.5 per cent to N2,121.46 billion or 1.7 per cent of
GDP, compared with N1,886.57 billion (1.7% of GDP) in 2017. The value of
non-oil export increased by 27.2 per cent, to N1,367.49 billion in the review
period, in comparison with N1,074.90 billion in 2017, reflecting steady
progress in the diversification drive of the Federal Government.
[a] Direction of Oil Export
In the review period, provisional data on the direction of Nigeria’s crude oil
export revealed that Europe, as a group, remained the major regional
destination for Nigeria’s crude oil export. This was followed by Asia and the
Far East, the Americas, and African countries, in that order. By country of
destination, India ranked highest, followed by the United States of America,
The Netherlands, Spain, France and Benin Republic.
Europe constituted 37.1 per cent of the total, with crude oil export of
N5,784.14 billion. Within the group, The Netherlands was the highest crude oil
7
DRAFT

Central Bank of Nigeria Annual Report—2018
228
export destination, with a share of 11.0 per cent of the total, followed by
Spain, 8.0 per cent; France, 5.6 per cent; the United Kingdom, 5.5 per cent;
Italy, 3.0 per cent; and Germany, 2.0 per cent. Within the Oceania/Pacific
region, Australia was the only destination of Nigeria’s crude oil with a value of
N12.48 billion, representing 0.1 per cent of the total.
Asia and the Far East, as a group, accounted for 28.3 per cent of the total,
with a value of N4,418.08 billion. Export to India dominated the group,
accounting for 21.0 per cent, followed by Indonesia with 5.0 per cent; China,
1.0 per cent; Thailand, 0.7 per cent; and Singapore, 0.4 per cent. Export to
the Americas, as a group, increased to N3,643.99 billion or 23.4 per cent, of
the total in 2018, compared with N2,496.21 billion or 22.6 per cent of the total
in 2017. Within the group, export to the United States of America accounted
for 13.0 per cent, followed by Canada, with 4.0 per cent; Brazil, 3.0 per cent;
Argentina and Peru, 0.6 per cent apiece; and Uruguay, 0.5 per cent. Other
countries in the group accounted for the balance.
The share of African countries was the least at 11.2 per cent of the total.
Benin Republic was the highest buyer with 4.0 per cent of the total, followed
by Cameroun, 2.6 per cent; South Africa, 1.8 per cent; Ghana, 1.2 per cent;
Côte d’Ivoire and Senegal, 0.7 per cent apiece; and ’other countries’, the
balance.
Figure 7.5: Direction of Crude Oil Exports, 2014 - 2018
Source: CBN
[b] Non-oil Export
Non-oil export increased by 27.2 per cent to N1,367.49 billion, or 1.1 per cent
of GDP, in 2018, compared with N1,074.80 billion or 0.9 per cent of GDP in
46
.9
45
.7
14
.9
34
.9
37
.1
15
.5
14
.1
23
.0
22
.6
23
.4
24
.9
26
.1
27
.9
27
.9
28
.3
10
.9
14
.1
14
.6
14
.5
11
.2
0.0
10.0
20.0
30.0
40.0
50.0
2014 2015 2016 2017 2018
% S
har
e o
f To
tal
Europe Americas Asia & Far East Africa
6
DRAFT

Central Bank of Nigeria Annual Report—2018
229
2017, reflecting the sustained diversification drive of the Federal Government
and improved repatriation of export proceeds by exporters.
A breakdown of non-oil export by product showed that agricultural produce
category, valued at N640.10 billion, constituted the highest share of 46.8 per
cent of the total. Within the category, export of cocoa beans, represented
15.7 per cent, followed by sesame seeds, 5.6 per cent; fish & crustaceans, 2.3
per cent; rubber, 2.1 per cent; cashew nuts, 0.9 per cent; and other
agricultural produce made up the balance.
The semi-manufactured products sub-category, at N214.38 billion, constituted
15.7 per cent, compared with N216.73 billion or 20.2 per cent in 2017. Within
the category, export of leather & processed skins recorded the highest
performance of 4.8 per cent, followed by aluminum products at 2.5 per cent.
Poly products constituted 2.3 per cent; lead, 1.8 per cent; steel/iron, 1.0 per
cent; cocoa products, and furniture/processed wood, 0.7 per cent apiece.
Other products within the sub-category accounted for the balance.
The manufactured goods category, which was N165.98 billion, accounted for
12.2 per cent of the total, out of which export of tobacco was 5.0 per cent.
Other manufactured products had 1.8 per cent; aluminum products, 1.4 per
cent; beer/beverages, 1.0 per cent; plastic, 0.8 per cent; soap and
detergent, 0.6 per cent; milk products, 0.4 per cent; and paper products, 0.2
per cent, while “others” accounted for the balance.
The minerals sub-category had N31.73 billion, accounting for 2.3 per cent of
the total. Lead constituted 0.7 per cent; zinc, 0.4 per cent; copper, 0.3 per
cent; while “other minerals” accounted for the balance.
The “other” export sub-category, at N314.83 billion, accounted for 23.0 per
cent of total non-oil export, of which urea constituted 9.1 per cent. Petroleum
products, and cement/lime products represented 7.5 and 3.2 per cent,
respectively, of the total.
6
DRAFT

Central Bank of Nigeria Annual Report—2018
230
Figure 7.6: Non-oil Export by Product, 2018 (Per cent)
Source: CBN
[c] Non-oil Export to the ECOWAS Sub-Region
Analysis of non-oil export to the ECOWAS sub-region increased, significantly,
by 25.5 per cent to US$464.72 million, compared with US$370.24 million in
2017. Among member-countries, export to Ghana dominated with US$189.13
million, or 40.7 per cent of the total. This was followed by Togo, US$188.01
million (40.5%); Niger, US$131.37 million (28.3%); Cote d’Ivoire, US$60.16 million
(12.9%); and Benin Republic, US$54.80 million (11.8%). At US$0.58 million,
export to Guinea Bissau was the least. The dominant export products to the
sub-region remained: tobacco; plastics; rubber; plastic footwear; soap and
detergents; and polybags.
[d] Activities of the Top 100 Non-oil Exporters
Aggregate export value of the top one hundred non-oil exporters increased
by 27.3 per cent to US$2.10 billion, compared with US$1.65 billion in 2017. The
increase was attributed to improved exporters’ confidence in the I&E
window, as an incentive to repatriate export proceeds. Olam Nigeria Limited
ranked 1st with proceeds of US$286.76 million from the export of premium
grade sesame seeds(DHS) and fermented cocoa bean seeds to Australia,
Greece, Turkey, The Netherlands and Syria. Indorama Eleme Fertilizer and
Petrochemicals Limited ranked 2nd with US$197.32 million from the export of
granular urea in bulk to Cote d’Ivoire, Brazil, Canada, the US, Senegal, Benin,
Cameroun and Argentina. The 3rd major exporter was NNPC/PPMC with
US$165.93 million from export of low pour fuel oil to the US, The Netherlands,
Spain and Togo.
Agric. Produce, 46.8
Minerals, 2.3 Semi-manufactured
Products, 15.7
Manufactured , 12.2
Other Exports, 23.0
7
DRAFT

Central Bank of Nigeria Annual Report—2018
231
In the 4th place was the British American Tobacco (BAT) Nigeria, with
US$101.57 million from the export of cigarettes to Liberia, Guinea, Ghana,
Cameroun, Cote d’Ivoire and Niger. In the 5th position was Wacot Limited
with US$87.87 million from the export of sesame seed and ginger to The
Netherlands, Italy, Poland, Turkey, Japan and India. Indorama Eleme
Petroleum Limited ranked 6th with receipt of US$75.59 million from the export
of petrochemical products to Ghana, India, Greece, Spain and Portugal.
Metal Recycling Industries Limited ranked 7th with proceeds of US$75.45
million, from the export of copper and aluminium ingots to Japan, China and
South Africa. Mamuda Industries (Nigeria) Limited and Dangote Cement PLC
ranked 8th and 9th with receipts valued at US$67.93 million and US$54.29
million, respectively. Mamuda Industries exported processed and finished
leather to Italy, India and Spain, while Dangote Cement exported Portland
lime cement to Niger Republic, Togo and Ghana.
Saro Agro Allied Limited and Flour Mills of Nigeria PLC ranked 24th and 33rd
with earnings of US$20.34 million and US$14.38 million, respectively, from the
export of cocoa beans to Estonia, The Netherlands, Malaysia and Spain; and
flour bags and wheat pellets to Benin, Mexico, the US, Morocco and Puerto
Rico. A further analysis showed that Crown Flour Mills Limited, GZ Industries
and West African Tannery Company Limited were in the 41st, 45th and 62nd
positions with values of US$11.33 million, US$9.31 million and US$4.91 million,
respectively, from the export of soya beans to Nepal; aluminum and silver
cans to Benin, South Africa and Togo; and goat and sheep leather to China,
Hong Kong, India and Italy.
Abvee Industries Limited ranked 86th and earned US$2.94 million through the
export of polyester film to Ghana, Bahrain and Cameroun. In the 90th position
was MINL Limited with export earnings of US$2.88 million from aluminium alloy
ingot to Japan, Thailand, India and Ghana. B&B Leather and Alkem Nigeria
Limited were in the 91st and 95th positions with proceeds of US$2.81 million,
and US$2.23 million, respectively, from the export of sheep leather to Spain;
and polyethylene terephthalate flakes to the US, India, Turkey and Germany.
7
DRAFT

Central Bank of Nigeria Annual Report—2018
232
Masvi & Sons (Nigeria) Limited placed 100th with earnings of US$1.94 million
from the export of timber to Vietnam.
7.2.2 The Services Account
The deficit in the services account widened, significantly by 81.3 per cent, to
N7, 326.70 billion (5.9% of GDP), compared with N4,040.24 billion (3.5% of
GDP) in 2017. This was as a result of increased out-payments, particularly in
respect of travel, transportation, and other business services, in the review
period.
A breakdown of the account showed that net-payment, in respect of travel
services, increased significantly, to N2,353.75 billion, compared with N991.62
billion in 2017. This was due, largely, to the improved access to foreign
exchange in respect of both personal (mainly education and health-related)
and business travels. Similarly, payments in respect of transportation services,
at N1,490.34 billion, increased by 45.9 per cent, as a result of higher payment
in respect of passenger and freight charges. Net payments in respect of
computer & information and other business services also increased to N91.07
billion and N3,307.53 billion, respectively, above N67.86 billion and N1,634.75
billion, in 2017. Insurance services, however, recorded a lower net payment of
N86.62 billion, compared with N227.04 billion in 2017.
On the other hand, communications and government services recorded
lower net surpluses of N18.39 billion and N64.32 billion, respectively,
compared with N21.98 billion and N67.10 billion in 2017. Financial services
recorded a net surplus of N13.92 billion, against a net deficit of N75.59 billion
in 2017.
In terms of their contributions to total net deficit, other business services
accounted for 45.1 per cent of the total, while travel services constituted 32.1
per cent, and transportation services, 20.3 per cent. Insurance services,
computer & information services, and royalties & licence fees, contributed 1.2
per cent apiece, and 1.1 per cent, respectively. Other categories
accounted for the balance.
7
DRAFT

Central Bank of Nigeria Annual Report—2018
233
Figure 7.7: Percentage Share of Major Invisible Services, 2014-2018
Source: CBN
Table: 7.2 Net Share of Major Invisible Transactions (Per cent), 2014 – 2018
Items 2014 2015 2016 2017 2018
Transportation 35.6 36.1 52.1 25.3 20.3
Travel 21.2 31.6 0.1 24.5 32.1
Insurance Services 1.4 1.8 7.5 5.6 1.2
Communication Services 3.7 3.9 1.0 (0.5) (0.3)
Construction Services 0.3 0.3 0.0 0.01 0.04
Financial Services 5.5 5.3 1.5 1.9 (0.2)
Computer and Information Services 3.1 2.1 1.8 1.7 1.2
Royalties and License Fees 1.1 1.5 3.1 1.9 1.1
Government Services 5.5 5.1 1.0 (1.7) (0.9)
Personal, Cultural & Recreational
Services 1.4 1.0 0.2 0.8 0.2
Other Business Services 21.2 11.4 31.7 40.5 45.3
Total 100 100 100 100 100
Source: CBN
7.2.3 The Income Account
In the review period, the deficit in the income account widened by 33.8 per
cent to N4,703.43 billion, equivalent to 3.8 per cent of GDP, compared with
N3,514.22 billion or 2.4 per cent of GDP in 2017. The development was
attributed, mainly, to higher deficit recorded in the investment income sub-
account, which rose by 33.3 per cent, to N4,777.34 billion, compared with
N3,584.10 billion in 2017. This was due to increased repatriation of dividends
and distributed branch profits by non-resident investors, as well as, interest
payments on portfolio investments. However, the “Other” investment income
sub-account, driven, largely, by interest earnings on external reserves,
-10
0
10
20
30
40
50
60
2014 2015 2016 2017 2018
Pe
r ce
nt
Transport Travels Government Services Other Businesses Insurance Services
7
DRAFT

Central Bank of Nigeria Annual Report—2018
234
maintained a surplus position, rising to N57.21 billion in 2018, compared with
N6.93 billion in 2017. Also, the surplus in the compensation of employees’ sub-
account increased by 5.8 per cent to N73.91 billion, compared with N69.88
billion in 2017.
7.2.4 Current Transfers
The surplus in the current transfers account increased by 16.6 per cent to
N7,828.57 billion, representing 6.3 per cent of GDP, compared with N6,714.94
billion or 5.8 per cent of GDP in 2017. This was attributed to higher inflow of
workers remittances from abroad. The surplus in the general government sub-
account, which comprised receipts from foreign embassies and international
organisations, declined to N131.58 billion in 2018, compared with N207.49
billion in the preceding year. On the other hand, the “Other” sectors sub-
account, driven, largely, by the inflow of workers’ remittances, increased by
17.3 per cent to N7,822.73 billion, compared with N6,666.7 billion in 2017. This
was as a result of 14.7 per cent increase in workers remittances to N7,635.36
billion in 2018, from N6,655.75 billion in 2017, driven by improved global
economic conditions.
Source: CBN
7.3 THE CAPITAL AND FINANCIAL ACCOUNT
The capital and financial account posted a net financial liability of N4,040.94
billion, equivalent to 3.3 per cent of GDP, as against a net financial asset of
Table 7.3: Current Transfers (Naira Billion), 2015 – 2017
2015 2016 2017
INFLOW (credit)
1.General government (Grants, ODA, Technical Assistance &
Gifts)
355.5 207.49 131.58
2. Other sector account (remittances and other transfers in kind) 4,936.5 6,666.70 7,822.73
OUTFLOW (debit)
1.General government (Payments to International Organizations
& other payments)
(1.9) - -
2. Other sector account (remittances and other transfers ) (264.3) (159.25) (125.74)
NET CURRENT TRANSFERS 5,025.8 6,714.94 7,828.57
7
DRAFT

Central Bank of Nigeria Annual Report—2018
235
N1,321.24 billion or 1.2 per cent of GDP in 2017. This was attributed to higher
inflow of portfolio investment and other investment liabilities, during the
review period.
A disaggregation of financial flows showed that financial assets, representing
financial outflows, declined marginally by 0.1 per cent to N6,785.88 billion or
5.5 per cent of GDP in the review period, compared with N6,791.72 billion or
5.9 per cent of GDP in 2017. Of the total financial assets, direct investment
abroad, driven by equity investments in foreign enterprises, increased by 7.5
per cent to N421.93 billion (0.3% of GDP), compared with N392.65 billion (0.3%
of GDP) in 2017. Portfolio investment assets, on the other hand, declined
further to N0.30 billion in 2018, compared with N2.21 billion in 2017, reflecting
the low risk appetite of resident investors and their preference for the
domestic financial instruments, due to higher returns. Other investment asset,
on the other hand, increased significantly to N5,373.16 billion, compared with
N2,659.49 billion in 2017, driven largely, by higher trade credits, and foreign
currency holdings by banks and the private sector.
Total financial liabilities, representing foreign financial inflows, increased
significantly in 2018 to N10,826.81 billion (8.7% of GDP), compared with
N5,470.47 billion (4.8% of GDP) in 2017. The development was due to
significant inflow of other investment liabilities and foreign portfolio
investment. A breakdown showed that, inflow of foreign direct investment
declined by 34.1 per cent to N704.40 billion (0.6% of GDP) in the review
period, compared with N1,069.42 billion (0.9% of GDP) in 2017. This was due
largely, to lower inflow of new equity capital, owing to uncertainties
surrounding the political environment, ahead of the 2019 general elections
and the lingering effect of the 2016-2017 economic recession. Inflow of
portfolio investment, on the other hand, increased by 50.3 per cent to
N3,914.43 billion (3.2% of GDP) in 2018, compared with N2,604.33 billion or 2.3
per cent of GDP in 2017. This was as a result of a huge inflow of capital for the
purchase of short-term government debt instruments, driven by high returns
on investment. Inflow for the purchase of equity securities declined by 20.6
per cent to N709.29 billion in the review period, compared with N892.74 billion
7
DRAFT

Central Bank of Nigeria Annual Report—2018
236
in 2017, reflecting the bearish performance of the Nigeria’s capital market.
Portfolio inflow in respect of debt securities (mainly government bonds and
money market instruments), increased by 87.0 per cent to N3,204.74 billion,
compared with the N1,711.59 billion in 2017, reflecting its attractiveness,
compared with other jurisdictions, particularly Europe. The ratio of external
reserves to portfolio investment was 360.9 per cent, which was lower than the
461.3 per cent in 2017, but was well above the benchmark of 100.0 per cent
short-term debt cover of the Greenspan-Guidotti measure of external
reserves adequacy.
Other investment liabilities, driven largely by loans, also increased to
N6,207.98 billion (5.0% of GDP), compared with N1,796.73 billion (1.6% of GDP)
in 2017. Drawdown on loans by the general government increased
significantly to N3,802.39 billion, compared with N1,595.46 billion in 2017.
Drawdown by the private sector amounted to N2,167.21billion in 2018, as
against a repayment of N517.57 billion in 2017. The banking sector, however,
repaid N26.07 billion in the review period, as against a drawdown of N184.03
billion in 2017. In terms of currency and deposits by non-residents in Nigerian
banks, a placement of N261.71 billion was recorded in the review period,
compared with N534.81 billion in the preceding year, indicating a decline of
51.1 per cent.
In terms of share of the components in total capital inflow, other investment
liabilities accounted for the largest share of 57.3 per cent; portfolio
investment accounted for 36.2 per cent; and foreign direct investment inflow,
6.5 per cent.
The stock of external reserves increased by 8.2 per cent, to US$42.59 billion at
end-December 2018, compared with US$39.35 billion at end-December 2017.
This could finance 13.0 months of current import of goods only or 7.5 months
of import of goods and services, compared with 14.5 and 9.3 months,
respectively, in 2017.
The external debt stock at end-September 2018 was US$21.59 billion, an
increase of 14.2 per cent above the US$18.91 billion at end-December 2017.
This was, due largely to the issuance of the Euro bonds during the year.
7
DRAFT

Central Bank of Nigeria Annual Report—2018
237
Multilateral borrowing, mainly from the World Bank and the African
Development Bank, stood at US$10.89 billion, constituting 50.4 per cent of
total external debt stock, while loans from commercial sources, in form of
Euro and Diaspora bonds, at US$8.30 billion, accounted for 38.4 per cent of
the total. Loans from bilateral sources, principally the China Exim Bank,
constituted the balance of 11.2 per cent of the total. At 5.3 per cent of GDP,
public sector external debt remained within the international threshold of 40.0
per cent of GDP.
7.4 CAPITAL IMPORTATION
7.4.1 Capital Importation by Nature of Investment
Returns from the commercial banks showed that aggregate new capital
injected into the economy was US$18.41 billion in 2018, compared with
US$12.40 billion in 2017, indicating an increase of 48.5 per cent. A
disaggregation of capital imported by type of investment showed that
portfolio investment, at US$12.97 billion, accounted for the largest share of
70.4 per cent of the total. Of this amount, money market instruments
amounted to US$9.34 billion; equity securities, US$2.61 billion and bonds,
US$1.02 billion. Others were: inflow of foreign direct investment equity, US$1.28
billion or 7.0 per cent of the total; and other investment inflow, US$4.16 billion
or 22.6 per cent of the total. A breakdown of other investment inflow showed
that loans was US$3.82 billion; other claims, US$0.32 billion; trade credits,
US$0.02 billion; and currency deposits, the balance.
7
DRAFT

Central Bank of Nigeria Annual Report—2018
238
Table 7.4: New Capital Inflows (US$’ Thousand)
NATURE OF CAPITAL 2014 2015 2016 2017 2018
Foreign Direct Investment –
Equity 2,292,466.20 1,469,093.20 1,043,142.80 1,038,697.63 1,277,160.48
Foreign Direct Investment -
Other capital 13,028.90 4,210.40 874.8 2,318.60
6,138.32
Sub-Total 2,305,495.10 1,473,303.60 1,044,017.60 1,041,016.22
1,283,298.80
Portfolio Investment –
Equity 11,448,161.00 4,691,540.40 859,053.60 3,593,989.34 2,607,990.86
Portfolio Investment –
Bonds 2,451,604.60 827,144.00 395,900.00 526,807.97 1,022,036.18
Portfolio Investment -
Money Market Instruments 1,025,018.40 571,955.30 557,917.90 3,309,508.90 9,337,510.56
Sub - Total 14,924,784.00 6,090,639.70 1,812,871.50 7,430,306.21 12,967,537.50
Other Investments - Trade
Credits 22,030.00 - 160 295,646.45 16,923.70
Other Investments - Loans 1,428,567.80 1,685,965.40 2,240,109.70 2,894,334.07 3,820,811.43
Other Investments -
Currency Deposits - 8,102.70 27.5 3,517.95 1,033.55
Other Investments - Other
Claims 2,120,050.00 527,581.10 26,940.80 739,598.56 318,294.82
Sub - Total 3,570,647.80 2,221,649.20 2,267,238.00 3,933,097.03 4,157,063.49
TOTAL 20,800,926.95 9,785,592.41 5,124,127.07 12,404,419.46 18,407,899.79
Source: CBN
7.4.2 Capital Importation by Country of Origin
A breakdown of capital importation by country of origin showed the United
Kingdom as the dominant source of capital with a value of US$6.89 billion or
37.4 per cent of total capital inflow, followed by the United States, US$3.52
billion or 19.1 per cent. Inflow from South Africa, US$1.23 billion (6.7%); United
Arab Emirates, US$1.08 billion (5.8%); Belgium, US$0.97 billion (5.2%); and
Singapore, US$0.96 billion (5.2%). Other countries accounted for the balance.
7
DRAFT
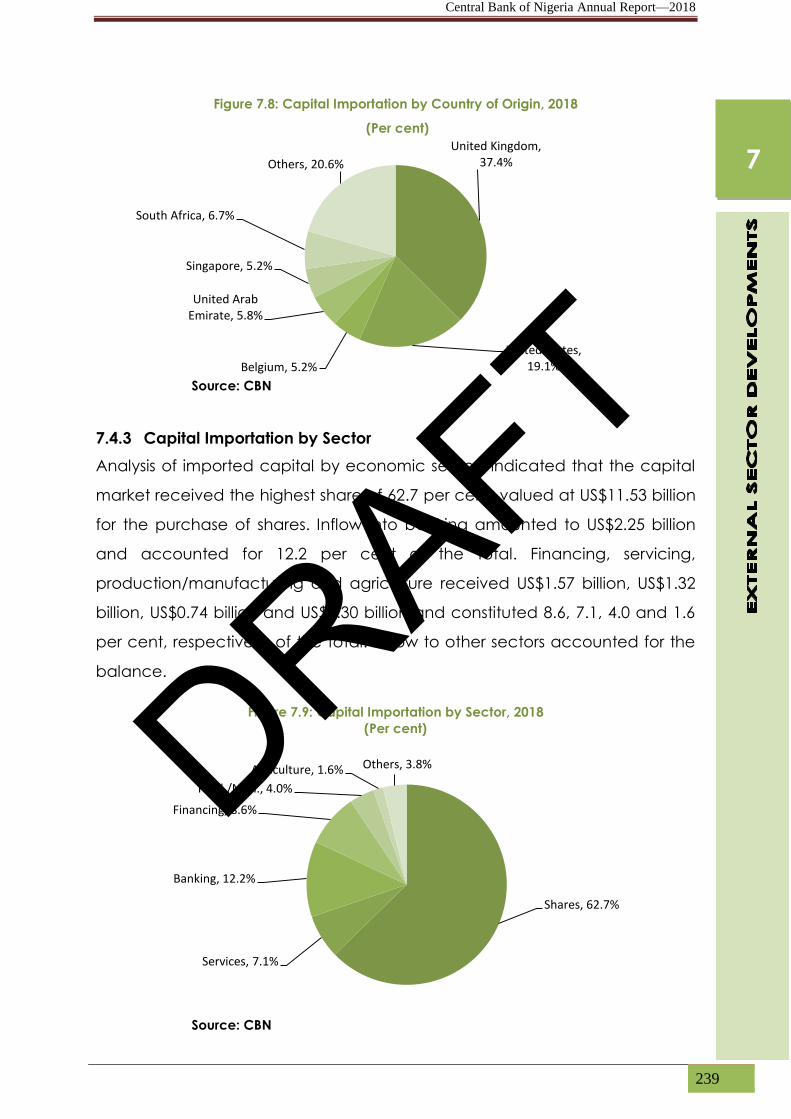
Central Bank of Nigeria Annual Report—2018
239
Figure 7.8: Capital Importation by Country of Origin, 2018
(Per cent)
Source: CBN
7.4.3 Capital Importation by Sector
Analysis of imported capital by economic sectors indicated that the capital
market received the highest share of 62.7 per cent, valued at US$11.53 billion
for the purchase of shares. Inflow into banking amounted to US$2.25 billion
and accounted for 12.2 per cent of the total. Financing, servicing,
production/manufacturing and agriculture received US$1.57 billion, US$1.32
billion, US$0.74 billion and US$0.30 billion and constituted 8.6, 7.1, 4.0 and 1.6
per cent, respectively, of the total. Inflow to other sectors accounted for the
balance.
Figure 7.9: Capital Importation by Sector, 2018
(Per cent)
Source: CBN
United Kingdom, 37.4%
United States, 19.1% Belgium, 5.2%
United Arab Emirate, 5.8%
Singapore, 5.2%
South Africa, 6.7%
Others, 20.6%
Shares, 62.7%
Services, 7.1%
Banking, 12.2%
Financing, 8.6%
Prod./Man., 4.0%
Agriculture, 1.6% Others, 3.8%
7
DRAFT

Central Bank of Nigeria Annual Report—2018
240
7.4.4 Capital Importation by Destination
In terms of the destination on state-by-state basis, Federal Capital Territory
(FCT) received the highest inflow, with 60.1 per cent, followed by Lagos State,
38.8 per cent. Akwa-Ibom State received 0.5 per cent, while Anambra,
Bauchi and Oyo states constituted 0.1 per cent, apiece. Other states
accounted for the balance.
Figure 7.10: Capital Importation by Destination States, 2018 (Per cent)
Source: CBN
Table 7.5: Capital Importation: Country and Sector Inflow (US$’ Million)
Country 2015 2016 2017 2018 Sector 2015 2016 2017 2018
United
Kingdom 3,913 2,132 4,969.1 6,890.94 Shares 5,780 1466
7,502.5 11,533.3
United
States 2,477 946 2301.5 3516.65 Banking 964 933 1061.7 2,251.6
Belgium - 79 1,025.3 965.62 Financing 866 95
439.3
1,574.3
Mauritius 557 129 718.7 674.58 Services 201 299
1,096.4
1,315.3
Singapore - 276 672.1 962.62 Prod./Man. 433 303
1003.3
744.1
South Africa 261 177 614.4 1,234.84 Agriculture - 22
159.4 298.4
Switzerland 119 272 415.9 415.9 Oil and Gas 32 720
331.9 137.4
United Arab
Emirates
(U.A.E)
62 51 358.9 1,076.43 Trading 175 125
81.9
136.9
The
Netherlands 1,152 517 246.3 246.3 Telecom 944 931
544.6
166.6
ABUJA (FCT) 60.1%
LAGOS 38.8%
AKWA-IBOM 0.5%
ANAMBRA 0.1%
BAUCHI 0.1%
OYO 0.1%
Others 0.3%
7
DRAFT

Central Bank of Nigeria Annual Report—2018
241
France - 77 153.1 153.1 Constructio
n 28 32
98.9
57.2
Luxembourg 48 139 117.0 117.0 Electrical - 125
13.4 37.4
China 11 17 50.7 50.7 Transport 10 5
3.0
15.4
Sweden 32 70 24.5 24.5 Breweries 9 54
27.2 6.1
Others 1,071 803 737.0 737.0 Others 342 287
40.9 134.05
Total 9,703.0 5,685.0
12,404.4 18,408.0
9,784.0
5,397.0
12,404.4 18,408.0
Source: CBN
7.5 THE INTERNATIONAL INVESTMENT POSITION (IIP)
Provisional data on International Investment Position (IIP) for Nigeria showed
that a higher net financial liability of US$71.02 billion was recorded in 2018,
compared with US$57.80 billion in 2017. The stock of financial assets increased
by 14.4 per cent to US$176.11 billion at end-December 2018, compared with
US$153.91 billion at end-December 2017, due largely, to accretion to external
reserves, increased foreign currency holdings of banks and the private sector,
as well as, higher trade credit.
A further breakdown showed that foreign direct investment increased by 9.7
per cent to US$15.67 billion, compared with US$14.29 billion at end-
December 2017. Portfolio investment assets, on the other hand, increased
marginally to US$25.20 billion at end-December 2018, compared with
US$25.19 billion at end-December 2017. Other investment assets increased by
23.4 per cent to US$92.66 billion, compared with US$75.08 billion at end-
December 2017, due largely, to the increase in trade credits, loans, and
foreign currency holdings. Aggregate trade credits increased to US$16.82
billion at end-December 2018, compared with US$7.53 billion at end-
December 2017. Similarly, the stock of loans increased by 4.5 per cent, to
US$14.94 billion at the end of the review year, relative to US$14.30 billion at
end-December, 2017. Total currency deposits, increased by 14.4 per cent to
US$60.89 billion at end-December 2018, compared with US$53.24 billion at
end-December 2017,as a result of the 45.1 and 14.5 per cent increase in
foreign currency holdings of the banks and private sector, respectively. The
stock of external reserves at end-December 2018 also increased by 8.2 per
cent to US$42.59 billion from US$39.35 billion at end-December 2017. As a
7
DRAFT

Central Bank of Nigeria Annual Report—2018
242
share of total stock of assets at end-December 2018, other investment assets
remained dominant at 52.6 per cent, followed by reserve assets, 24.2 per
cent; portfolio investment, 14.3 per cent; and direct investment accounted
for the balance.
The stock of financial liabilities increased by 16.7 per cent to US$247.14 billion
at end-December 2018, compared with US$211.71 billion at end-December
2017. A disaggregation of the stock showed that direct investment increased
by 2.4 per cent to US$99.99 billion at end-December 2018, compared with
US$97.69 billion at end-December 2017. Direct investment equity capital and
reinvested earnings increased marginally by 0.4 per cent to US$96.19 billion,
compared with US$95.82 billion at end-December 2017. Similarly, other FDI
capital increased to US$3.80 billion, compared with US$1.87 billion at the end
of the preceding year.
A further analysis revealed that portfolio investments increased by 17.7 per
cent to US$85.22 billion, compared with US$72.41billion, at end-December
2017. This was, due majorly, to the increase in both portfolio equity and debt
securities to US$32.86 billion and US$52.36 billion, respectively, at end-
December 2018, compared with US$30.53 billion and US$41.88 billion, at end-
December 2017. Other investment liabilities, which comprised loans and
foreign currency deposits, increased by 48.8 per cent to US$61.93 billion at
end-December 2018, compared with US$41.61 billion at end-December 2017.
The stock of loan liabilities, increased by 65.4 per cent to US$49.16 billion,
compared with US$29.71 billion at the end of the preceding year. A
breakdown showed that loans to general government and the private sector
increased by 81.1 and 92.4 per cent, to US$27.80 billion and US$14.77 billion,
respectively, while that of banks declined by 1.3 per cent to US$6.60 billion at
end-December 2018. The stock of currency & deposits increased by 7.3 per
cent to US$12.77 billion at the end of the review period, compared with
US$11.90 billion at end-December 2017.
The stock of FDI dominated total financial liabilities, accounting for 40.5 per
cent of the total, followed by portfolio investment, with a share of 34.5 per
cent and other investment liabilities accounted for the balance.
7
DRAFT
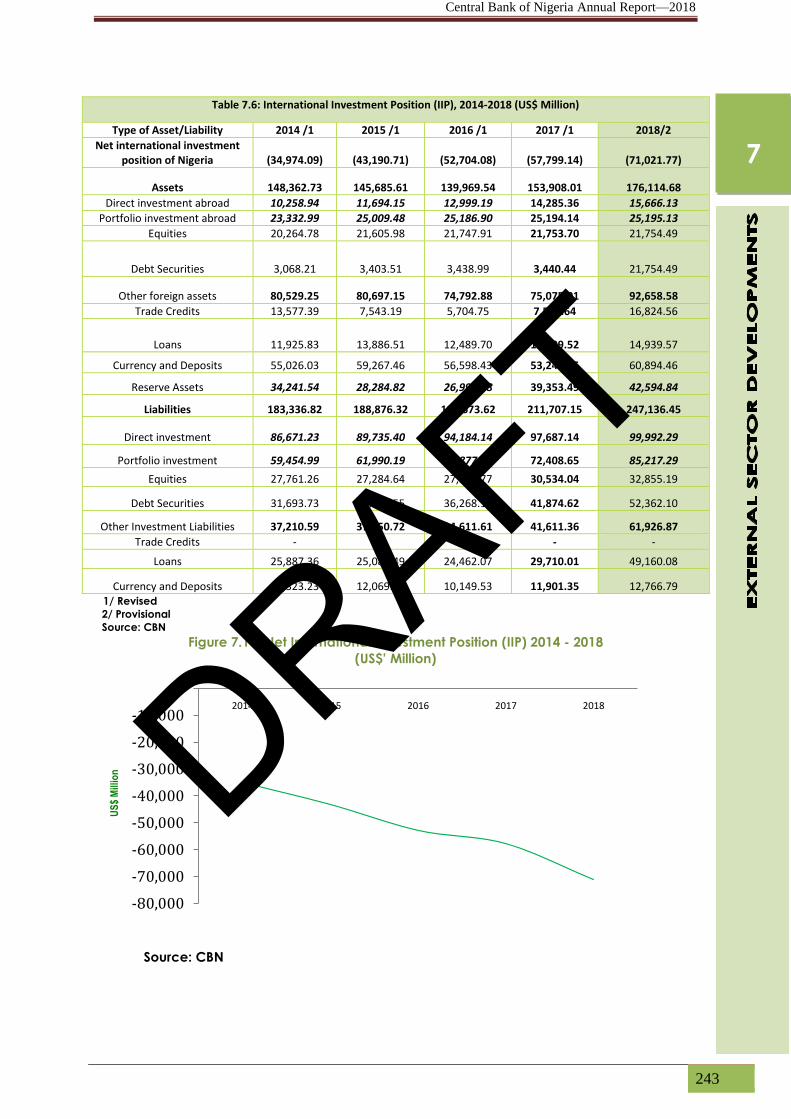
Central Bank of Nigeria Annual Report—2018
243
1/ Revised
2/ Provisional
Source: CBN
Figure 7.11: Net International Investment Position (IIP) 2014 - 2018
(US$’ Million)
Source: CBN
-80,000
-70,000
-60,000
-50,000
-40,000
-30,000
-20,000
-10,000
02014 2015 2016 2017 2018
US
$ M
illio
n
Table 7.6: International Investment Position (IIP), 2014-2018 (US$ Million)
Type of Asset/Liability 2014 /1 2015 /1 2016 /1 2017 /1 2018/2
Net international investment position of Nigeria (34,974.09) (43,190.71) (52,704.08) (57,799.14) (71,021.77)
Assets 148,362.73 145,685.61 139,969.54 153,908.01 176,114.68
Direct investment abroad 10,258.94 11,694.15 12,999.19 14,285.36 15,666.13
Portfolio investment abroad 23,332.99 25,009.48 25,186.90 25,194.14 25,195.13
Equities 20,264.78 21,605.98 21,747.91 21,753.70 21,754.49
Debt Securities 3,068.21 3,403.51 3,438.99 3,440.44 21,754.49
Other foreign assets 80,529.25 80,697.15 74,792.88 75,075.01 92,658.58
Trade Credits 13,577.39 7,543.19 5,704.75 7,531.64 16,824.56
Loans 11,925.83 13,886.51 12,489.70 14,299.52 14,939.57
Currency and Deposits 55,026.03 59,267.46 56,598.43 53,243.85 60,894.46
Reserve Assets 34,241.54 28,284.82 26,990.58 39,353.49 42,594.84
Liabilities 183,336.82 188,876.32 192,673.62 211,707.15 247,136.45
Direct investment 86,671.23 89,735.40 94,184.14 97,687.14 99,992.29
Portfolio investment 59,454.99 61,990.19 63,877.88 72,408.65 85,217.29
Equities 27,761.26 27,284.64 27,609.77 30,534.04 32,855.19
Debt Securities 31,693.73 34,705.55 36,268.11 41,874.62 52,362.10
Other Investment Liabilities 37,210.59 37,150.72 34,611.61 41,611.36 61,926.87
Trade Credits - - - - -
Loans 25,887.36 25,081.49 24,462.07 29,710.01 49,160.08
Currency and Deposits 11,323.23 12,069.24 10,149.53 11,901.35 12,766.79
7
DRAFT

Central Bank of Nigeria Annual Report—2018
244
7.6 EXCHANGE RATE MOVEMENTS
The exchange rate remained relatively stable in 2018, at both the BDC and
I&E window of the foreign exchange market, supported by the CBN’s
proactive exchange rate management policies.
The average exchange rate of the naira at the interbank segment of the
foreign exchange market, depreciated to N305.90/US$ in February 2018, from
N305.31/US$ in December 2017, but appreciated to N305.61/US$ in April 2018.
The naira, however, depreciated to an average of N306.06/US$, N306.50/US$,
and N306.92/US$ in August, October and December 2018, respectively. The
annual average exchange rate at the interbank market depreciated by 0.1
per cent to N306.08/US$ in 2018, compared with N305.79/US$ in 2017. The
end-period interbank exchange rate closed at N307.00/US$, a depreciation
of 0.3 per cent below the level in 2017.
At the BDC segment of the foreign exchange market, demand pressure
intensified at the beginning of 2018, leading to the depreciation of the naira
to N363.20/US$ in January 2018, from N362.83 in December 2017. The naira,
however, gradually appreciated and remained stable for most part of the
first three quarters, averaging N360.66/US$ and N359.00/US$, respectively, in
June and August 2018. The development was as a result of the downward
adjustment to the selling rate of foreign exchange to BDCs operators. A
renewed demand pressure emerged in the fourth quarter of 2018, due to
perceived political uncertainties in the wake of the 2019 general election.
Consequently, the naira depreciated to N360.74/US$, N362.82/US$, and
N363.46/US$, respectively, in October, November and December 2018. To
boost liquidity and dampen the pressure, the CBN increased its interventions
at the BDC segment to four times weekly. The annual average exchange
rate at the BDC segment in 2018, appreciated by 9.4 per cent to
N361.51/US$, compared with N395.42/US$ in 2017. The end-period exchange
rate also appreciated by 0.6 per cent to N361.00/US$ in 2018, relative to
N363.00/US$ in the preceding year.
7
DRAFT

Central Bank of Nigeria Annual Report—2018
245
At the “I & E” window, the exchange rate appreciated to N360.01/US$ in
March 2018, from N360.68/US$ in December 2017. However, it depreciated to
N361.06/US$ in June 2018 and further to N363.22/US$, N363.96US$ and
N364.76US$, respectively, in September, October and December 2018. The
development was, due mainly, to the capital flow reversal triggered by
monetary policy normalisation in the US. The annual average exchange rate
appreciated by 1.3 per cent to N361.96/US, compared with N366.58/US$ in
2017. The end-period exchange rate, however, depreciated by 1.0 per cent
to N364.00/US$ in 2018, compared with N360.33/US$ in 2017.
The premium between the average interbank and BDC rates narrowed to
18.1 per cent in 2018, from 29.3 per cent in 2017. Similarly, the premium
between the average I&E and BDC rates narrowed to 0.1 per cent in 2018,
from 7.9 per cent in 2017. The premium between the end-period interbank
and BDC exchange rates was 17.6 per cent in 2018 compared with 18.6 per
cent in 2017, while that between I&E and BDC rates was 0.8 per cent,
compared with 0.7 per cent in 2017.
Figure 7.12: Demand and Supply of Foreign Exchange, Interbank/BDC Rate Premium and
rDAS/BDC Rate Premium, 2014-2018
Source: CBN
-10.00
0.00
10.00
20.00
30.00
40.00
50.00
60.00
70.00
80.00
0.00
5,000.00
10,000.00
15,000.00
20,000.00
25,000.00
30,000.00
35,000.00
40,000.00
45,000.00
Jan
-14
Ap
r-1
4
Jul-
14
Oct
-14
Jan
-15
Ap
r-1
5
Jul-
15
Oct
-15
Jan
-16
Ap
r-1
6
Jul-
16
Oct
-16
Jan
-17
Ap
r-1
7
Jul-
17
Oct
-17
Jan
-18
Ap
r-1
8
Jul-
18
Oct
-18
Pre
miu
m
US$
Mill
ion
Total FX Supply (US$m) Total FX Demand (US$m) Interbank/BDC Premium I and E/BDC Premium
The I&E window was introduced in April 2017
7
DRAFT

Central Bank of Nigeria Annual Report—2018
246
Figure 7.13: Average Yearly Exchange Rate of the Naira per US Dollar, 2014 - 2018
Source: CBN
Figure 7.14: End-period Exchange Rate of the Naira per US Dollar, 2014 - 2018
Source: CBN
171.79
222.75
372.86 372.86 361.51
0.00
50.00
100.00
150.00
200.00
250.00
300.00
350.00
400.00
2014 2015 2016 2017 2018
N/U
S$
rDAS Interbank BDC I&E
rDAS segment closed in February 2015
0.00
100.00
200.00
300.00
400.00
500.00
600.00
2014 2015 2016 2017 2018
N/U
S$
rDAS Interbank BDC
rDAS segment closed in February
7
DRAFT

Central Bank of Nigeria Annual Report—2018
247
Figure 7.15: Quarterly Average Exchange Rate of the Naira
vis-à-vis US Dollar, 2014 - 2018
Source: CBN
7.7 THE NOMINAL AND REAL EFFECTIVE EXCHANGE RATES
The average 13-currency nominal effective exchange rate (NEER) index rose
by 18.0 per cent to 186.58, above the level in 2017, indicating depreciation in
the exchange rate. The average 13-currency real effective exchange rate
(REER) index, rose by 8.4 per cent to 92.65, above the level in 2017. In real
terms, the increase in REER implied higher inflation in the domestic economy,
thus, showing loss of external competitiveness. The REER index opened at
101.42 in January 2018 and closed at 87.42 in December 2018.
Figure 7.16: Nominal and Real Effective Exchange Rate Indices, 2014 - 2018
Source: CBN
-
50.00
100.00
150.00
200.00
250.00
300.00
350.00
400.00
- 50.00
100.00 150.00 200.00 250.00 300.00 350.00 400.00 450.00 500.00
wD
AS/
rDA
S(N
/US$
)
N/U
S$
Interbank BDC wDAS/rDAS I&E
wDAS/rDAS discontinued in February 2015
I&E window was introduced in April 2017
-
50.00
100.00
150.00
200.00
250.00
Jan
-20
14
Ap
r-2
014
Jul-
201
4
Oct
-20
14
Jan
-20
15
Ap
r-2
015
Jul-
201
5
Oct
-20
15
Jan
-20
16
Ap
r-2
016
Jul-
201
6
Oct
-20
16
Jan
-20
17
Ap
r-2
017
Jul-
201
7
Oct
-20
17
Jan
-20
18
Ap
r-2
018
Jul-
201
8
Oct
-20
18
Ind
ex
NEER REER
7
DRAFT

Central Bank of Nigeria Annual Report—2018
248
Table 7.7: Nominal and Real Effective Exchange Rate Indices (November 2009=100)
2017 2018 Percentage Change
Monthly
Index 1/
Annual
Average
Index 1/
Monthly
Index 2/
Annual
Average
Index 2/
Monthly
Index
Annual
Average
Index
EER 162.66 158.07 181.68 186.58
11.69 18.03
REER 84.68 85.49 87.14 92.65 2.91 8.37
Source: CBN
1/ Revised
2/ Provisional
7
DRAFT

Central Bank of Nigeria Annual Report—2018
249
he 2018 Spring and Annual Meetings of the Bretton Woods Institutions (BWIs) observed
that risks to global growth recovery had shifted to the downside, particularly in the
emerging market and developing economies, and suggested that advancing financial
and structural reforms was critical to lifting potential growth and employment. At the sidelines
of the Meetings, the G-24 Ministers called on the IMF and WBG to strengthen their support for
domestic resource mobilisation, combating illicit financial flows and mitigating the adverse
social and distributional impact of fiscal adjustment. At the continental level, the 41st
Ordinary Meeting of the Assembly of Governors of the Association of African Central Banks
(AACB) noted the progress report on the implementation of the African Monetary
Cooperation Programme (AMCP), and observed that 18 countries out of 52 (35.0%) met all
the primary convergence criteria in 2017, compared with none in 2016. At the regional level,
the African Caucus Meeting of the IMF/World Bank welcomed the World Bank Group’s
(WBG) new regional integration strategy for sub-Saharan Africa, and looked forward to
accelerating projects in the energy and agriculture sectors to promote industrialisation,
diversification, and competitive exports.
8.1 THE INTERNATIONAL MONETARY SYSTEM
8.1.1 The International Monetary Fund (IMF)/World Bank Spring and Annual
Meetings
The 2018 Spring and Annual Meetings of the Bretton Woods Institutions (BWIs)
were held in Washington D. C., USA from April 16 – 22, 2018 and October 8 –
14, 2018, respectively. The sideline meetings included those of the
International Monetary and Finance Committee (IMFC) of the Governors of
the International Monetary Fund (IMF), the Development Committee (DC) of
the World Bank Group, as well as the meetings of the Ministers and Governors
of the Inter-Governmental Group of Twenty Four (G-24).
The G-24 Ministers:
Noted that risks to global growth recovery had shifted to the downside,
particularly in the emerging market and developing economies
(EMDEs). They observed that G-24 members were managing the
impact of tightening financial conditions from the ongoing monetary
T
CHAPTER EIGHT
INTERNATIONAL AND REGIONAL
INSTITUTIONS
DRAFT

Central Bank of Nigeria Annual Report—2018
250
policy normalisation in advanced countries, especially in the US, and
that a rapid shift in financial market sentiment could undermine the
growth recovery. They were also concerned with the uncertainty from
the trade tensions and protectionist sentiments that further clouded the
growth outlook. They recognised the urgency of domestic policy
actions to strengthen resilience, but underscored that multilateral
actions were necessary to ensure financial stability and global growth;
Noted that digitalisation and technological change would create
additional opportunities and pose their challenges. They encouraged
the IMF, other IFIs, and financial standard-setters to assess the
implications of technological advances on the financial system,
including crypto assets and cyber-security, and support multilateral
responses;
Observed that technology offered new opportunities to accelerate
progress towards the twin goals of eradicating extreme poverty and
boosting shared prosperity. The new technologies introduced new risks,
including increased inequality within and between countries. They
supported the role the WBG can play in helping countries find new
pathways to sustainable, inclusive growth by building the foundations
of the digital economy;
Noted that strong fundamentals, sound policies, and a resilient
international monetary system (IMS) were essential to the stability of
exchange rates and sustainable growth, as well as, investment;
Noted that financial and structural reforms were critical to lifting
potential growth, employment, and strengthening resilience. They
further committed to monitor, tackle financial vulnerabilities and
emerging risks through continued regulatory cooperation;
Recognised the need for dialogue and actions to mitigate risks and
enhance confidence in international trade, including ways to improve
the WTO to address current and future challenges. They pledged to
continue to work for a globally fair and modern international tax
system;
8
DRAFT

Central Bank of Nigeria Annual Report—2018
251
Welcomed the fundamental reforms that were negotiated as part of
the proposed capital package that would allow the World Bank Group
(WBG) to effectively deliver development results in a financially
sustainable manner;
Welcomed the successful conclusion of the negotiations on the
financial and policy package contained in the Sustainable Financing
for Sustainable Development Report. The financial package includes a
US$13 billion paid-in capital increase, comprising US$7.5 billion for IBRD
and US$5.5 billion for IFC;
Recognised that excessive volatility or disorderly movements in
exchange rates could have adverse implications for economic and
financial stability. They pledged to refrain from competitive
devaluations;
Expressed concern with rising debt vulnerabilities, urging the
international financial community to strengthen its support of
developing countries’ effort to deal with the interrelated challenges of
debt and growth;
Called for international cooperation to foster a rule-based, open,
transparent, non-discriminatory and equitable multilateral trading
system, with the World Trade Organisation at its centre. They further
called for international policy coordination to reduce adverse spillovers
from domestic policies in advanced economies so as to limit the
recurring periods of instability that disrupt growth in EMDEs;
Called on the IMF and WBG to strengthen their support for domestic
resource mobilisation, combating illicit financial flows and mitigating
the adverse social and distributional impact of fiscal adjustment;
Urged the IMF and the WBG to continue to strengthen assistance to
improve domestic resource mobilisation. They stressed the importance
of international tax cooperation to develop fair rules, avert harmful tax
practices and competition, and enhance tax transparency. They
welcomed the progress to date of the Automatic Exchange of
Information Initiative and encouraged EMDEs to commit to the
international standards on tax transparency;
8
DRAFT

Central Bank of Nigeria Annual Report—2018
252
Urged for structural reforms to lift productivity, growth, and
employment, while effectively assisting those bearing the cost of
adjustment. It also stressed the importance of timely, full, and
consistent implementation and finalisation of the financial sector
reform agenda; and
Reaffirmed its commitment to a strong, quota-based, and adequately
resourced IMF to preserve its role at the centre of the Global Financial
Safety Net (GFSN). It expressed commitment to conclude the 15th
General Review of Quotas and agreed on a new quota formula as a
basis for a realignment of quota shares.
8.2 REGIONAL INSTITUTIONS
8.2.1 African Caucus Meeting of the IMF/World Bank
The African Caucus, comprising African Governors of the International
Monetary Fund and the World Bank Group, met in Sharm El Sheikh, the Arab
Republic of Egypt from August 4 – 6, 2018. The theme of the Meeting was
“Promoting Inclusive Growth through Private Investment and Access to
Finance”.
The Governors:
Welcomed the objectives of the G20 Compact Africa Initiative to
increase private sector investment in the continent;
Welcomed the commitment of the International Finance Committee
(IFC) to increase investment by 40.0 per cent in LICs and urged them to
materialise this commitment in Africa, especially through SME
financing;
Welcomed the WBG new regional integration strategy for sub-Saharan
Africa, and looked forward to accelerating and scaling up
transformational projects in the energy and agriculture sectors, to
promote industrialisation, diversification, and competitive exports;
Observed that digitalisation had emerged recently as an effective tool
to promote access to finance, including for women and small- and
medium-sized enterprises;
8
DRAFT

Central Bank of Nigeria Annual Report—2018
253
Emphasised the importance of sharing cross-country analysis and
lessons from experience, tailored policy advice and technical
assistance to support members in creating an appropriate set of fiscal
incentives for export promotion;
Reaffirmed that in addition to evaluating fiscal risks and putting in
place strong legal and institutional frameworks, projects should be
selected based on financial viability, competitive bidding, and
transparency and accountability;
Urged enhanced coordination between the WBG and country
authorities to maximise the use of Financing for Development, including
through the cascade approach to prioritise the financing of projects
with high developmental and social impact;
Called on the IMF and WBG to further support country efforts, including
through peer-to-peer experience sharing; identifying ways to fill gaps in
local capacity to optimally leverage the benefits of digitalisation, while
mitigating the associated risks; and
Reiterated the call for a third chair in the IMF Executive Board for sub-
Saharan Africa. Pledged to choose the most judicious and promising
policies to attract investment, including adjusting legal frameworks and
streamlining procedures.
8.2.2 The 51st Session of the Economic Commission for Africa and the Annual
Conference of African Ministers of Finance, Planning and Economic
Development
The 51st Session of the Economic Commission for Africa (ECA) and the Annual
Conference of African Ministers of Finance, Planning and Economic
Development was held in Addis Ababa, Ethiopia from May 11-15, 2018. The
session, which was preceded by a meeting of the Committee of Experts, was
themed “African Continental Free Trade Area (AfCFTA) and Fiscal Space for
Jobs and Economic Diversification”, took into account the launch of the
AfCFTA and the opportunities it presented for economic growth and job
creation in Africa. During the session, ECA’s revised strategic framework for
2018-2019 was endorsed by African Ministers of Finance, Planning and
Economic Development. The Framework contains the outcome of recent
8
DRAFT
Central Bank of Nigeria Annual Report—2018
254
ECA reforms, the vision, overall objectives and programmatic focus on five
strategic areas namely:
Advancing ECA’s position as a premier knowledge institution that
builds on its unique position and privilege to drive global solutions on
the continent;
Building sustainable development solutions to accelerate Africa’s
economic diversification and industrialisation;
Creating innovative solutions to finance sustainable infrastructure for
transforming Africa;
Contributing solutions to trans-boundary issues, with a focus on social
inclusion; and
Developing regional solutions as a contribution to global governance
issues, and building knowledge advocacy to manage Africa’s next-
generation challenges.
8.2.3 41st Ordinary Meeting of the Assembly of Governors of the Association
of African Central Banks (AACB)
The 41st Ordinary Meeting of the Assembly of Governors of the Association of
African Central Banks (AACB) was held in Sharm El Sheikh, Egypt on August 9,
2018. The Meeting was attended by thirty-five (35) central banks and the
African Union Commission (AUC). The Meeting also marked the accession of
Bank Al-Maghreb to the AACB after the re-admission of Morocco into the
African Union.
The Assembly of Governors:
Adopted the report of the AACB symposium, held on August 15, 2017,
in Pretoria, South Africa;
Adopted the report of the 40th Ordinary Meeting of the AACB Assembly
of Governors, held on August 16, 2017, in Pretoria, South Africa, as a fair
reflection of the deliberations of the Meeting;
Noted the list of decisions of the Bureau Meeting held in Dakar,
Senegal, on February 23, 2018;
Noted the presentation by the AUC commissioner regarding progress
report on the establishment of the African Central Bank (ACB) for which
a report was received after the conclusion of the Bureau Meeting;
8
DRAFT

Central Bank of Nigeria Annual Report—2018
255
Review the progress report on the implementation of the African
Monetary Cooperation Programme (AMCP) in 2017 and noted also,
that 18 countries out of 52 (35%) met all the primary convergence
criteria in 2017, compared with none in 2016, before the refinement of
the convergence criteria;
Approved the Report on the Monitoring Framework and a Peer Review
Mechanism for Macroeconomic Convergence;
Noted the activities of the Community of African Banking Supervisors
(CABS), including the activities of the working groups on “Cross-Border
Banking Supervision” and “Crisis Management and Bank Resolution”.
The Meeting also noted the handing-over of the CABS chairmanship to
the Central Bank of Egypt, and expressed appreciation to AACB
partners;
Requested that CABS gives attention to the issues of de-risking,
particularly the decline in correspondent banking, and made
proposals on options to be pursued at the continental level to address
the problem;
Approved the proposal to explore the Integration of the payments
systems on the continent;
Approved the theme for the 2019 symposium as “Rising African
Sovereign Debt: Implications for Monetary Policy and Financial
Stability”. The Assembly also selected the 2019 continental seminar
topic: “Renewed Protectionist Tendencies: Some Implications for
Macroeconomic Policy in Africa”; and approved that the event be
hosted by the Bank of Mauritius; and
Noted the transmission of a hand-over report on the status of AACB’s
activities by the outgoing chairperson to the incoming chairperson.
8.3 SUB-REGIONAL INSTITUTIONS
8.3.1 36th Meeting of the WAMZ Committee of Governors
The 36th Meeting of the Committee of Governors (CoG) of the West African
Monetary Zone (WAMZ) was held at Kairaba Beach Hotel, Banjul, The
Gambia, on February 8, 2018. The Meeting reviewed the status of
8
DRAFT

Central Bank of Nigeria Annual Report—2018
256
implementation of the WAMZ Work Programme, based on the report of the
Technical Committee of the WAMZ.
The CoG:
Reviewed the Report on Macroeconomic Developments and
Convergence in the WAMZ at end-June 2017 and urged Member
States to improve on their performance on the convergence criteria;
Urged Member States, in collaboration with the West African Monetary
Institute (WAMI), to make greater efforts towards statistical
harmonisation for improved data quality;
Directed the WAMI to coordinate the interlinking of the Payments
Systems Project, convene a meeting of the Zonal Payments System
Committee and collaborate with the Member States, to revive the
National Payments Systems Committees;
Directed WAMI to review and update the Exchange Rate Mechanism
(ERM) in view of the operationalisation of the Scheme on quoting and
trading in the Zone;
Directed WAMI to strengthen efforts and encourage member countries
to quote and trade in the WAMZ Member States’ currencies;
Urged the West African Securities Regulators Association (WASRA) to
approve phases I and II of the integration of the capital markets in
ECOWAS;
Approved and adopted the Internal Audit Charter of WAMI and the
requirement for the submission of report to the Chairman of the
Committee of Governors semi-annually; and
Approved WAMI’s Work Programme and Budget for 2018.
8.3.2 51st Meeting of Committee of Governors of ECOWAS Member Central
Banks
The 51st Ordinary Meeting of the Committee of Governors of Central Banks of
ECOWAS Member States was held at Kairaba Beach Hotel, Banjul, The
Gambia on February 9, 2018. The Meeting was preceded by the 32nd
8
DRAFT

Central Bank of Nigeria Annual Report—2018
257
Meeting of the Technical Committee held from February 1 - 3, 2018. The
Meeting was chaired by Mr. Bakary Jammeh, Governor, Central Bank of The
Gambia.
The CoG approved the:
Recommendations of the Report on the ECOWAS Monetary
Cooperation Programme for the First Half of 2017;
Recommendations of the Report on the Development of a Composite
Index of Financial Stability in ECOWAS Member States;
Report on Construction of a Macroeconomic Convergence Index for
ECOWAS Member States;
Recommendations of the Technical Committee on the Study:
“Estimation of Optimal Inflation Threshold for ECOWAS Member
Countries”;
WAMA Information Technology Policies and Procedures; and
WAMA 2018 Work Programme and Budget.
8.3.3 39th Meeting of the Convergence Council of Ministers and Governors of
Central Banks of the WAMZ
The 39th Meeting of the Convergence Council of Ministers and Governors of
the Central Banks of the West African Monetary Zone (WAMZ) was held at the
Kairaba Beach Hotel, Banjul, The Gambia, on February 9, 2018, to review the
status of implementation of the WAMZ Work Programme. The Report of the
36th Meeting of the Committee of Governors formed the basis for the
meeting. The Meeting was chaired by the Minister of Finance of The Gambia.
The report and recommendations of the Meeting of the Committee of
Governors of the WAMZ were considered and approved by the
Convergence Council.
8.3.4 The 5th Meeting of the Presidential Task Force on the ECOWAS Single
Currency Programme
The 5th Meeting of the Presidential Task Force on the ECOWAS Single
Currency Programme was held in Accra, Ghana from February 17 -21, 2018.
8
DRAFT

Central Bank of Nigeria Annual Report—2018
258
The Meeting was a follow-up on the 4th meeting of the Task Force, which
directed the Ministerial Committee to revise the new roadmap and propose
measures to fast-track the process of creating the ECOWAS single currency
by 2020.
The Meeting was chaired by the President of the Republic of Ghana, Nana
Addo Dankwa AKUFO-ADDO. The Republic of Niger, Cote d’Ivoire, Togo and
current President of the Conference of Heads of State and Government of
ECOWAS, and President of the Republic of Guinea also attended the
meeting. Mr. Godwin I. Emefiele, Governor, Central Bank of Nigeria,
represented the President of the Federal Republic of Nigeria.
The purpose of the Meeting was to review the revised draft roadmap for the
ECOWAS Single Currency Programme, as well as, the status of
implementation of the roadmap activities.
The Meeting:
Agreed that the Presidential Task Force on the ECOWAS Single
Currency Programme should hold quarterly meetings to assess the
progress made in the implementation of planned activities of the
roadmap;
8
DRAFT
Central Bank of Nigeria Annual Report—2018
259
Directed the ECOWAS Commission to submit detailed reports on
progress and challenges in the implementation of the Programme,
as well as, measures adopted for ensuring compliance with the 2020
deadline to the Authority of Heads of State and Government during
its biannual sessions; and
Directed the Ministerial Committee to hold a meeting within three
months to draft a proposal on the creation of a special fund to
ensure adequate funding for the implementation of the roadmap
activities, as well as, modalities for its replenishment. In addition, the
Committee would also prepare clear proposals on the measures to
strengthen the technical capacity of WAMA.
8.3.5 Regional Meeting of Monetary and Exchange Rate Policy Experts on
the Choice of a Single Monetary Policy Framework for the Future
ECOWAS Monetary Zone
A regional meeting of Monetary and Exchange Rate Policy Experts on the
choice of a single monetary policy framework and exchange rate regime for
the proposed ECOWAS monetary zone was held in Abuja, Nigeria from June
4-7, 2018. The Meeting was convened as part of the process of determining
the exchange rate regime and monetary policy framework for the
prospective ECOWAS single monetary zone. The Committee reviewed various
technical presentations and recommended:
The adoption of ERM for the sub-region should be preceded by the
delinking of CFA from the Euro and allowing reasonable time to
ascertain the vulnerability of the economies and their currencies to
external shocks and exchange rate pass through;
The CBN Management should also consider advocating for a flexible
exchange rate for the sub-region since it is consistent with Nigeria’s
current exchange rate regime and allows for the realignment of the
exchange rate with external changes in the macroeconomic
environment;
8
DRAFT

Central Bank of Nigeria Annual Report—2018
260
The need for monetary policy framework that is effective in absorbing
shocks in the economies of the sub-region, and suitable for a flexible
exchange rate mechanism; and
Monetary policy framework for the sub-region should also factor in the
imperative of ensuring price stability conducive to economic growth.
8.3.6 Sub-Committee on Monetary and Exchange Rate Policy
The Sub-committee meeting on Monetary and Exchange Rate Policy in
ECOWAS was held in Lome, Togo from July 10 – 12, 2018. The sub-committee
comprises the Central Bank of Nigeria, Central Bank of West African States
(BCEAO) and the West African Monetary Agency (WAMA). The Sub-
committee was tasked with the responsibility of determining the choice of an
appropriate monetary policy framework and exchange rate regime for the
future ECOWAS Central Bank. The Sub-committee examined the study on the
Choice of Exchange Rate Regime and the Macroeconomic and Structural
Characteristics of the ECOWAS Member States prepared by WAMA and
made the following recommendations to the Committee of Governors:
WAMA should evaluate the options for an exchange rate regime (fixed
peg to a single currency, peg to a basket of currencies, managed
floating), by conducting a more detailed study. The study would
outline the advantages and disadvantages of each regime, thresholds
that need to be achieved, the extent each country has achieved such
criteria and related issues; and
WAMA should make proposals on the type of central bank model to
be adopted for ECOWAS.
8.3.7 Afreximbank Annual Meeting
The Afreximbank Annual Meetings took place from July 11 – 14, 2018 at the
Transcorp Hilton in Abuja, Nigeria, with the theme: “Celebrating the Past:
Shaping the Future”. The event coincided with the 25th Anniversary of
AfreximBank in being at the forefront of promoting trade in Africa. The
8
DRAFT
Central Bank of Nigeria Annual Report—2018
261
Meeting discussed the future of trade and economic development across
the continent, including the anticipated impact of the recently announced.
The four-day event featured high-level strategic seminars and the discussions
centered on:
How Africa can work with development partners to harness innovation
and technology to achieve and accelerate trade, real growth, and
transformation;
How Africa can develop key options and strategies to propel the
continent on a sustainable development plan, given that the continent
is recovering well from the last commodities price shock; and
The opportunities derivable from the AfCFTA.
The series of events ended with the Annual Meeting of the Bank’s
shareholders as well as a meeting of Afreximbank Advisory Group on Trade
Finance and Export Development in Africa.
8.3.8 6th Meeting of the Presidential Task Force on the ECOWAS Single
Currency Programme
The 6th Meeting of the Presidential Task Force (PTF) on the ECOWAS Single
Currency Programme was held in Lome, Togo on July 30, 2018, at the sideline
of the Summit of the ECOWAS Heads of State and Government. The Meeting
was preceded by the 7th Meeting of the Preparatory Technical Committee
from July 18 – 19, 2018, and the 3rd Meeting of the Ministerial Committee in
Niamey, Niger, from July 20 - 21, 2018. The PTF reviewed the Report of the
Ministerial Committee on the following:
Status of implementation of the revised roadmap for the ECOWAS
Single Currency Programme;
Draft regulation establishing the special fund for financing the
implementation of activities of the revised roadmap for the ECOWAS
Single Currency Progamme;
8
DRAFT

Central Bank of Nigeria Annual Report—2018
262
Validation of the report of the study on: “The ECOWAS Single Currency:
Assessment of Achievements and Proposals of Criteria/Options of
Attaining the 2020 deadline”; and
ECOWAS Macroeconomic Convergence Report at end-December
2017.
8.3.9 The 2018 Mid-Year Statutory Meetings of the West African Monetary Zone
(WAMZ)
The 2018 Mid-Year Statutory Meetings of the WAMA and the WAIFEM was
held in Abuja, Nigeria from September 6 – 14, 2018. A sub-committee was
tasked by the Committee of Governors of ECOWAS Member States with the
responsibility of determining the choice of an appropriate monetary policy
framework and exchange rate regime for the proposed ECOWAS Central
Bank.
The CoG:
Reviewed various activities carried out by WAMA during the first half of
2018;
Reviewed developments in ECOWAS member states and made
recommendations;
Reviewed macroeconomic developments in the ECOWAS and
provided an update on the status of convergence in 2017;
Reviewed developments in the exchange rates of the major
international and national currencies of ECOWAS against the WAUA, as
well as, bilateral trends;
Provided an update on the status of financial sector developments
and stability in ECOWAS for 2017;
Reviewed the transformation of WAMA into the EcMI, based on the
various recommendations made by the Technical Committee at their
Extraordinary Meeting held in Freetown from May 7 – 9, 2018; and
Reviewed the Presentation made on the Articles of Agreement which
forms part of the requisite legal framework for the establishment of the
EcMI.
In addition, the following agencies presented reports:
8
DRAFT

Central Bank of Nigeria Annual Report—2018
263
External Auditors, KPMG Sierra Leone, presented the report of their
audit exercise on the Financial Statements for the year ended
December 31, 2017;
African Development Bank (AfDB) made a presentation on the
Regional Integration Strategic Framework (RISF) covering the period
2019 – 2025; and
Also, AfDB provided information on ongoing consultations with
stakeholders with the intention of collating technical and financial
needs to provide the basis for development of a comprehensive
programme that is expected to be rolled out by 2019.
8.4 BILATERAL RELATIONS
8.4.1 The 4th Session of the Nigeria-Botswana Joint Permanent Commission
for Cooperation
The 4th Session of the Nigeria-Botswana Joint Permanent Commission for
Cooperation (TPCC) was held at the Rotunda Hall, Ministry of Foreign Affairs,
Abuja, Nigeria, from October 15-17, 2018. The Meeting was co-chaired by the
Permanent Secretary, the Ministry of Foreign Affairs (MFA), and his
counterpart from the Republic of Botswana, the Deputy Permanent
Secretary, Ministry of International Affairs and Cooperation of Botswana. Both
countries acknowledged the existing bilateral relationship between the two
countries and the need to deepen cooperation on multiple fronts with
regards to economic, political, socio-cultural aspects of developments in
agreements with the principles of the African Union (AU).
The Meeting deliberated on a number of thematic issues which included the
following:
Political, diplomatic, legal and defence cooperation;
Economic cooperation; and
Socio-cultural cooperation.
Furthermore, the Meeting reviewed the economic partnership agreement
between the two countries, to align it with the current developmental needs
8
DRAFT

Central Bank of Nigeria Annual Report—2018
264
and priorities of the respective countries. They also acknowledged that the
scope of cooperation be broadened from the economic and technical to
include other areas such as socio-cultural, human resources and manpower
development, diplomatic, legal and defense cooperation.
The following resolutions were made:
That the Ministries of Foreign Affairs of both countries should ensure
biennial convening of the JPCC and its commitments;
The two countries agreed to enhance cooperation in the areas of
defense, trade and investment, agriculture, mutual legal assistance
and combating corruption;
Exchanges of experiences and expertise in mutual exploitation of
mineral resources, education, medicine and public health, tourism,
youth and sports development, women, children, persons with
disabilities and vulnerable groups.
The Meeting ended with the signing of a memorandum of understanding
(MoU) on cultural matters by both countries.
8.4.2 The 3rd Meeting of Philippines-Nigeria Joint Commission
The 3rd Meeting of the Philippines-Nigeria Joint Commission for Cooperation
was held in Manila, Philippines on August 15, 2018. In attendance were
delegations from Ministry of Foreign Affairs, Nigeria and Ministry of Foreign
Affairs, Philippines. The delegations welcomed the strengthening of bilateral
relations as demonstrated by the increased people-to-people exchanges
between the two countries in the last few years.
The Meeting:
Acknowledged the importance of convening regular consultations to
review all aspects of bilateral relations and discussed a broad range of
issues of mutual interest and concern;
Expressed readiness to explore other avenues of cooperation to
strengthen existing ties;
8
DRAFT

Central Bank of Nigeria Annual Report—2018
265
Acknowledged several initiatives for collaboration in various sectors
such as agriculture, aquaculture, trade, youth development, and
technical vocational training, among others;
Suggested breaking down the existing agreements into thematic areas
for ease of monitoring and implementation;
Noted Phillipines keen interest in engaging with Nigeria in aquaculture
and fisheries sector, particularly in acquiring pure genetic strains of
certain species;
Recognised that food security is a shared concern and, as such,
guaranteed to relay the Philippines proposal to concerned authorities;
The Nigerian delegation:
Informed the Meet6ing that the country was undertaking a
diversification of its economy, with agriculture being developed as a
key sector to address unemployment;
Suggested that the Nigerian embassy in Manila should visit the
Agricultural Training Institute of the Philippines to obtain more
information on livestock and fisheries extension training programmes;
Proposed cooperation in the field of education; including technical
and vocational training;
Recognised the need for increased engagement between the
business communities of the two countries by means of a business
forum; and
Suggested that the Philippines should consider buying/purchasing of
Nigerian crude oil;
The Filipino delegation:
Proposed opportunities to be explored in the area of tourism; with both
delegations expressing readiness to collaborate in medical sector; and
Expressed appreciation to the Nigerian Government for facilitating the
release of the five Filipino crew members of the MT Asteris, who were
sentenced to a five year imprisonment for oil bunkering in 2015.
8
DRAFT

Central Bank of Nigeria Annual Report—2018
266
Appendix A
FINANCIAL STATEMENTS
DRAFT

Central Bank of Nigeria Annual Report—2018
267
DRAFT

Central Bank of Nigeria Annual Report—2018
268
DRAFT

Central Bank of Nigeria Annual Report—2018
269
DRAFT

Central Bank of Nigeria Annual Report—2018
270
DRAFT

Central Bank of Nigeria Annual Report—2018
271
DRAFT

Central Bank of Nigeria Annual Report—2018
272
DRAFT

Central Bank of Nigeria Annual Report—2018
273
Appendix B
GLOSSARY OF SELECTED TERMS
Approval in Principle: This refers to the granting of an initial permit/permission to
any financial institution, pending the time it would meet the necessary
requirements for operations to qualify it for a formal licence.
Balance of Payments (BOP): These are records of economic transactions
between the residents of a country and the rest of the world during a given
period of time. The major components of a BOP are the current account, the
capital and financial account, and the official settlement balance. The current
account comprises transactions arising from the sale or purchase of goods and
services and unrequited transfers, while the capital and financial account is the
record of assets and financial transactions. The official settlement account is
used to equalise any imbalance that may exist in the current and capital
accounts, so that all the BOP accounts sum to zero.
Balance of Payments Position: see Foreign Exchange and Balance of Payments
Position
Bank Credit is a major determinant of the money supply and is the amount of
loans and advances given by the CBN, as well as deposit money banks to
economic agents. This is the banking system credit to the economy which can
be broken down into bank credit to government (net) and the private sector.
Capital Expenditure: Payment for non-financial assets used in the production
process for more than one year. Loan amortisation (capital repayment) is
included.
Cost of Capital is the cost incurred in securing funds or capital for productive
purposes. The cost includes interest rate, legal, administrative and information
search charges. This means that the cost of capital is likely to be greater than or
equal to interest rates on loans.
APPENDIX
B
DRAFT

Central Bank of Nigeria Annual Report—2018
274
Cost of Funds: This refers to net expenses incurred in raising funds, including a
reasonable profit margin. The expenses include the interest on deposits, reserve
requirements and other administrative expenses, as a proportion of total funds
borrowed.
Credit Risk: Credit risk arises from the potential that an obligor is either unwilling
to perform an obligation, or its ability to perform such an obligation is impaired,
resulting in a loss to the Bank. In addition to direct accounting loss, credit risk
should be viewed in the context of other economic exposures, including
opportunity costs, transaction costs, and expenses associated with non-
performing assets over and above the accounting loss.
Debentures are fixed interest-bearing securities. They are usually of two types,
debenture with a floating charge and debenture with a fixed charge.
Debenture holders are creditors to the company rather than owners.
Debt Stock/GDP: This measures the level of domestic indebtedness relative to
the country’s economic activity.
Discount House is a financial institution devoted to trading in government
instruments (treasury bills, bonds, certificates, and other eligible instruments).
Distressed Banks: These are banks with problems relating to illiquidity, poor
earnings, and non-performing assets. The extreme case of distress is referred to
as insolvency, which implies that a bank’s liabilities are more than its assets.
Dutch Auction System (DAS): This is a method of exchange rate determination,
through auction, where the bidders pay according to their bid rates. The ruling
rate is arrived at with the last bid rate that clears the market where the
authorities elect to operate a single exchange rate.
Equity Price Risk: Equity price risk is the risk to earnings or capital resulting from
adverse changes in the value of the equity-related portfolios of a financial
institution. The price risk could relate to changes in the overall level of equity
prices or price volatility that is determined by firm specific characteristics.
Exchange Rate: This is the price of one currency in terms of another.
APPENDIX
B
APPENDIX
B
DRAFT

Central Bank of Nigeria Annual Report—2018
275
External Assets: These are the reserves held by the monetary authorities, as well
as the banking and non-bank public, in foreign countries. Thus, external assets
comprise the external reserves and the private sector holdings of foreign
exchange.
External Reserves: These are portions of foreign exchange receipts saved by the
monetary authorities for the purpose of enhancing the creditworthiness of the
economy, protecting the international value of the domestic currency, and
financing temporary shocks in the balance of payments. Reserves are held in
the form of monetary gold, the reserve position at the International Monetary
Fund (IMF), Special Drawing Rights (SDRs), and foreign bank balances.
Federation Account: This is an account opened by the Federal Republic of
Nigeria into which all revenues of the Federation are paid for eventual
distribution to all tiers of government in Nigeria.
Fiscal Deficit refers to the excess of expenditure over revenue of government. It
is usually assessed by its size in relation to the nominal Gross Domestic Product
(GDP). The fiscal deficits may be financed in various ways – external borrowing
and internal borrowing (banking system and non-bank public). It is inflationary
when financed by the banking system, especially the central banks.
Fiscal Operations: This refers to government financial transactions involving the
collection, spending and borrowing of government for a given period.
DRAFT

Central Bank of Nigeria Annual Report—2018
276
Fixed Deposit Rate: When deposits are for a fixed period of time, say, 90 or 180
days, the interest rates paid are called fixed deposit rates. They normally attract
higher interest rates; early withdrawals may attract penalties in terms of forfeiture
of interest income.
Foreign Exchange: This is a means of international payments. It includes the
currencies of other countries that are freely acceptable in effecting
international transactions.
Foreign Exchange and Balance of Payments Position: The foreign exchange
position is the difference between foreign exchange receipts and foreign
exchange disbursements. If receipts are higher than disbursements, there is a
net inflow or an accretion to reserves. On the other hand, if receipts are lower,
there is a net outflow and the reserves would be depleted. The balance of
payments position is the difference between the receipts by the residents of one
economy from the rest of the world and the payments by these residents to the
rest of the world. An excess of receipts over payments shows a balance of
payments surplus, while the reverse represents a deficit. When foreign
exchange receipts and payments are adjusted for valuation changes in
reserves, the net position would be identical to the balance of payments
position.
Foreign Exchange Risk: Foreign exchange risk is the current or prospective risk to
earnings and capital arising from adverse movements in currency exchange
rates. Foreign exchange risk may also arise as a result of exposures of banks to
interest rate risk arising from the maturity mismatch of foreign currency positions.
Government Expenditure: Payment or flow of financial resources out of
government.
High-powered Money: see Monetary Base
Interbank Interest Rate: This is the rate that applies to transactions among banks,
mostly for overnight and other short-term funds.
APPENDIX
B
APPENDIX
B
DRAFT
Central Bank of Nigeria Annual Report—2018
277
Interest Rate is the price of money. It is the opportunity cost of holding money
and the return for parting with liquidity.
Interest Rate Risk: Interest rate risk arises when there is a mismatch between
positions, which are subject to interest rate adjustments within a specified
period. Interest rate risk is usually assessed from two perspectives: the earnings
perspective which focuses on the impact of variation in interest rate on accruals
or reported earnings, and the economic value perspective which reflects the
impact of fluctuations in interest rates on the economic value of a financial
institution.
Interest rate risk also includes risks associated with the term structure of interest
rates and basis risk. Basis risk is also known as spread risk and it arises when a
bank prices its assets and liabilities using different interest rate basis. On the
other hand, risks associated with the term structure of interest rates are also
known as the yield curve risk. The impact of shifts in the yield curve on earnings
is evaluated using stress tests.
Internal Balance: This refers to a state of convergence between domestic
output and absorption or expenditure. When output is identical with
expenditure, internal balance is considered to have been achieved and the
rate of inflation is expected to be stable. The achievement of the savings-
investment identity is also viewed as internal balance. Monetary and fiscal
policies and external debt management measures are usually applied to
achieve internal balance.
Key Risk Indicator: A key risk indicator is a risk item that has been assessed to be
important, given all relevant factors. This indicator is used to monitor exposure to
risks and could be quantitative or qualitative in nature. It should be forward-
looking in order to serve as an effective risk mitigant.
Liquidity Ratio: This ratio is defined as the ratio of total specified liquid assets to
total current liabilities and reflects the liquidity position of a bank.
APPENDIX
B
DRAFT

Central Bank of Nigeria Annual Report—2018
278
Liquidity Risk: Liquidity risk is the potential loss to a bank, arising from either its
inability to meet its obligations as they fall due or to fund increases in assets
without incurring unacceptable costs or losses. Liquidity risk should not be seen
in isolation, because financial risks are not mutually exclusive and liquidity risk is
often triggered by consequences of other bank risks, such as credit, market and
operational risks.
Market Capitalisation is the market value of a company’s issued share capital. It
is the product of the current quoted price of shares and the number of shares
outstanding. The term is also used as a performance indicator of the capital
market.
Maximum Lending Rate: This refers to the rate charged by banks for lending to
customers with a low credit rating.
Minimum Rediscount Rate: This refers to the amount that is charged by the CBN
for lending to banks in the performance of its function of lender-of-last resort and
also as a signal of the desired direction of monetary policy.
Monetary Base (or High-powered Money or Reserve Money) comprises certain
liabilities of the CBN and includes currency-in-circulation and total bank
reserves. The main sources of monetary base are the net foreign assets of the
CBN, net claims on government, claims on deposit money banks, and other
assets (net) of the CBN.
Money Supply (or Money Stock) refers to the total value of money in the
economy and this consists of currency outside banks with the non-bank public
(notes and coins) and deposits with the deposit money banks (DMBs). For
purposes of policy, there are two variants of money supply in Nigeria – M1 and
M2. M1 is the narrow measure of money supply which includes currency outside
banks with the non-bank public and demand deposits (current accounts) at the
deposit money banks. M2 is the broad measure of money supply and includes
M1 and savings and time deposits and foreign currency deposits at the DMBs.
Savings and time deposits and foreign currency deposits are also called quasi-
DRAFT

Central Bank of Nigeria Annual Report—2018
279
money. M2 measures total liquidity in the economy. Excess liquidity is the
amount of liquidity over and above the optimum level of liquidity, determined
by the levels of output and prices.
Net Foreign Assets (NFA) constitute the foreign exchange holdings of the CBN
and the deposit money banks, after netting out the claims of foreigners.
Changes in NFA should reflect developments in the balance of payments. A
deficit in the balance of payments would lead to a decrease in foreign asset
holdings and, ultimately, the money stock. A surplus in the balance of payments
produces the opposite effect.
New Issues are securities raised in the primary market for the first time.
Nominal Exchange Rate: The nominal exchange rate is the price of one
currency relative to another.
Nominal Interest Rate: This is the actual rental value paid for the use of money or
credit. It includes the effects of inflation and uncertainty.
Offer for Sale is an offer by shareholders to sell existing shares to the public. The
sale is effected usually through stockbrokers and does not affect the capital
base of a company.
Offer for Subscription is an invitation by a company to the public to subscribe to
new issues. This increases the capital base of the company.
Open Market Operations involve the discretionary power of the CBN to
purchase or sell securities in the financial markets in order to influence the
volume of liquidity and levels of interest rates which, ultimately, would affect
money supply. When the CBN sells financial instruments, the liquidity (excess
reserves) of the banking system reduces. This restricts the capacity of banks to
extend credit or induce monetary expansion. On the other hand, when the
CBN purchases such instruments, it injects money into the system and banks’
ability to expand credit is enhanced.
DRAFT

Central Bank of Nigeria Annual Report—2018
280
Operational Risk: Operational risk is the risk of loss resulting from inadequate or
failed internal processes, people and systems, or from external events.
Operational risk is present in virtually all banking transactions and activities.
Other Assets (net) means the other assets of the CBN and deposit money banks
less (their) other liabilities.
Preference Shares are shares of companies on which dividends must be paid
before any other shares.
Prime Lending Rate: This is the interest rate applied to loans made to customers
with the highest rating. For each bank, this rate also represents the minimum
lending rate.
Prudential Guidelines: These are guidelines and practices which all licensed
banks are required to adhere to in reviewing and reporting their performance,
particularly in the areas of credit portfolio classification and disclosure; the
provision for non-performing facilities and interest accrual; the classification of
other assets; and off-balance sheet engagements.
Real Exchange Rate: This is the nominal exchange rate deflated by change in
relative prices. See also Nominal Exchange Rate
Real Interest Rate: This is the nominal interest rate adjusted for expected
inflation. In order to encourage savings, real interest rate is expected to be
positive.
Recurrent Expenditure: Expenditure on goods and services (other than capital
assets) used in the process of production within one year. Interest on loans is
included.
Required Reserves are a fraction of commercial and merchant banks’ money
held for the purpose of backing up their deposit operations and partly to control
the level of liquidity in the economy. They are made up of cash reserves and
liquid assets and specified in the form of ratios. The cash reserves ratio is the
percentage of deposit money banks’ cash deposits with the CBN in relation to
DRAFT

Central Bank of Nigeria Annual Report—2018
281
their total demand, savings and time deposits liabilities. The liquidity ratio is the
percentage of banks’ liquid assets to their total deposit liabilities.
Reserve Money: see Monetary Base
Reserve Requirement refers to the proportion of total deposit liabilities which the
deposit money banks are expected to keep as cash in vaults and deposits with
the CBN. The CBN can control the money stock by varying the requirement as
desirable. Usually, banks keep reserves over and above the legal requirement
for safety. The cash ratio requires the deposit banks to keep a certain
proportion of their total deposit liabilities as cash balances with the CBN, while
the liquidity ratio stipulates the proportion of total deposits to be kept in
specified liquid assets, mainly to safeguard the ability of banks to meet
depositors’ cash withdrawals and ensure confidence in the banking system. The
CBN also has powers to call for special deposits from banks for the purpose of
controlling liquidity.
Rights Issues are shares offered to companies’ existing shareholders in
proportion to the number of shares held and usually at below the market price
to make the offer attractive.
Savings Deposit Rate: The savings deposit rate is the amount paid by banks for
funds withdrawable after giving seven days’ notice. This restriction is, however,
seldomly applied.
Total Reserves: This is the sum of required reserves and excess reserves.
Vault Cash: Deposit money banks keep “petty cash” in their vaults for
emergency transactions before they can access their accounts with the CBN.
The amount so kept is called vault cash.
Ways and Means Advances constitute a portion of credit by the CBN to
government. These are temporary loans to government to bridge shortfalls in
revenue. Statutorily, the CBN must not give more than 5.0 per cent of
government’s current revenue.
DRAFT

Central Bank of Nigeria Annual Report—2018
282
Yield Curve: Shows the relationship between the rate of interest and the time to
maturity of different financial assets.
DRAFT