central florida expressway authority · central florida expressway authority presentation agenda 1....
TRANSCRIPT

CENTRAL FLORIDA EXPRESSWAY AUTHORITY
Rating Agency Presentation
May 2015 1

CENTRAL FLORIDA EXPRESSWAY AUTHORITY
PRESENTATION AGENDA
1. Organizational Background
2. Central Florida Expressway Authority Service Area
3. Operating and Financial Results
4. Traffic & Revenue
5. Five-Year Work Plan
6. Wekiva Parkway Update
7. Debt Management
8. Plan of Finance
9. Conclusion
2
CENTRAL FLORIDA EXPRESSWAY AUTHORITY
CENTRAL FLORIDA EXPRESSWAY
AUTHORITY ATTRIBUTES
• Strong economic base with increased tourism and theme park expansions; service area continues to diversify with growth in healthcare and education
• Excellent condition of the System; competitive toll rates with limited competition
• Positive revenue growth and financial flexibility with fixed rate debt at 80.4% and variable rate debt at 19.6% of total
• Forward looking toll structure indexed to the FL Consumer Price Index (CPI) with an annual 3 percent floor beginning on July 1, 2012 and every five years thereafter
• Proactive management efforts to contain costs and reduce variable rate debt & counterparty risk
• Conservative approach towards defining work program, future debt needs, and financial projections
• Strong debt service coverage and liquidity position provides significant bondholder protections
• Healthy reserve levels
• Low cost of toll collections
3
CENTRAL FLORIDA EXPRESSWAY AUTHORITY
0
50
100
150
200
250
300
350
1996 1997 1998 1999 2000 2001 2002 2003 2004 2005 2006 2007 2008 2009 2010 2011 2012 2013 2014
Mill
ion
s
Toll System Revenues Less E-PASS Discount
Toll Revenues
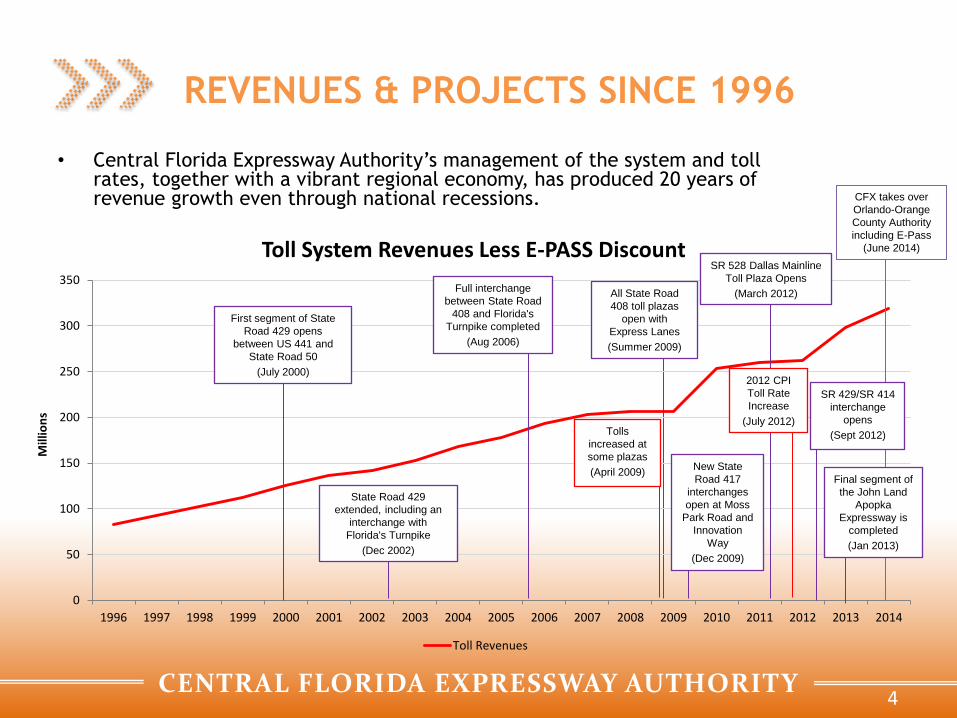
REVENUES & PROJECTS SINCE 1996
• Central Florida Expressway Authority’s management of the system and toll rates, together with a vibrant regional economy, has produced 20 years of revenue growth even through national recessions.
First segment of State
Road 429 opens
between US 441 and
State Road 50
(July 2000)
State Road 429
extended, including an
interchange with
Florida's Turnpike
(Dec 2002)
Full interchange
between State Road
408 and Florida's
Turnpike completed
(Aug 2006)
Tolls
increased at
some plazas
(April 2009)
SR 528 Dallas Mainline
Toll Plaza Opens
(March 2012)
SR 429/SR 414
interchange
opens
(Sept 2012)
Final segment of
the John Land
Apopka
Expressway is
completed
(Jan 2013)
2012 CPI
Toll Rate
Increase
(July 2012)
New State
Road 417
interchanges
open at Moss
Park Road and
Innovation
Way
(Dec 2009)
All State Road
408 toll plazas
open with
Express Lanes
(Summer 2009)
CFX takes over
Orlando-Orange
County Authority
including E-Pass
(June 2014)
4

CENTRAL FLORIDA EXPRESSWAY AUTHORITY
FISCAL YEAR TO DATE TOLL REVENUE
GROWTH OVER PREVIOUS FISCAL YEAR
4.99%
2.84%
7.72%
13.34%
6.54%
5.68%
6.97%
10.93%
15.52%
8.62%
0.00%
2.00%
4.00%
6.00%
8.00%
10.00%
12.00%
14.00%
16.00%
18.00%
SR 408 Beachline Eastern Beltway Western Beltway Total System
March 2014
March 2015
5

CENTRAL FLORIDA EXPRESSWAY AUTHORITY
Organizational Background

CENTRAL FLORIDA EXPRESSWAY AUTHORITY
ORGANIZATIONAL HIGHLIGHTS
• Experienced & tenured staff of senior professionals
• Commenced Completion of Orlando Beltway (Wekiva Parkway Project)
– On March 25, 2015, CFX closed a $196.3MM TIFIA loan
• Currently updating five-year work plan & beginning stages of 2040 Master
Plan
• Updates on toll rate increases and traffic
• Conservative risk management in debt portfolio and strategic planning
7

CENTRAL FLORIDA EXPRESSWAY AUTHORITY
CENTRAL FLORIDA EXPRESSWAY AUTHORITY
SYSTEM IS MODERN, MATURE & GROWING
• Established 1963 – over 50 Years Old
• Operates a limited-access highway network
• Comprised of 109 centerline miles of expressways
– 741 Lane Miles
– 14 Mainline Toll Plazas
– 64 Ramp Plazas
– 301 Toll Collection Lanes
8

CENTRAL FLORIDA EXPRESSWAY AUTHORITY
CENTRAL FLORIDA EXPRESSWAY
AUTHORITY ORGANIZATIONAL CHART
Authority Board
Laura Kelley Deputy Executive Director
Administration
Lisa Lumbard Interim Chief Financial
Officer
Claude Miller Director of Procurement
Joann Chizlett Director of Information
Technology
Joseph Berenis, P.E. Deputy Executive Director Engineering
& Operations
Ben Dreiling, P.E. Director of Construction and
Maintenance
Glenn Pressimone, P.E. Director of Engineering
Corey Quinn Director of Expressway
Operations
Joseph Passiatore General Counsel
Joseph Berenis, P.E. Acting Executive Director
Protiviti, Inc. Internal Auditor
Michelle Maikisch Director of Public Affairs
and Communication
Iranetta Dennis Director of Business
Development
David Wynne Director of Toll Operations
9

CENTRAL FLORIDA EXPRESSWAY AUTHORITY
Central Florida Expressway
Authority Service Area

CENTRAL FLORIDA EXPRESSWAY AUTHORITY
CENTRAL FLORIDA EXPRESSWAY AUTHORITY IS
A VITAL COMPONENT OF CENTRAL FLORIDA’S
TRANSPORTATION SYSTEM
11

CENTRAL FLORIDA EXPRESSWAY AUTHORITY
CENTRAL FLORIDA WITHOUT TOLL ROADS
Orlando
Ora
ng
e C
o.
Lake
Co
.
Lake Co.
Polk Co.
Ora
ng
e C
o.
Lake
Co
.
Lake Apopka
East Lake Tohopekaliga
Orange Co.
Orlando Co.
Seminole Co.
Orange Co.
12
CENTRAL FLORIDA EXPRESSWAY AUTHORITY
CENTRAL FLORIDA WITH TOLL ROADS
Orange Co.
Orlando Co.
Ora
ng
e C
o.
Lake
Co
.
Lake Co.
Polk Co.
Ora
ng
e C
o.
Lake
Co
.
Lake Apopka
East Lake Tohopekaliga
408
528
417
429
Western Beltway C
Osceola Parkway
Western Beltway A
417
414
414
429
429
Orlando
Central Florida
Greeneway
East-West Expressway
Beachline Expressway
Wekiva Parkway
John Land Apopka
Expressway
Seminole Co.
Orange Co.
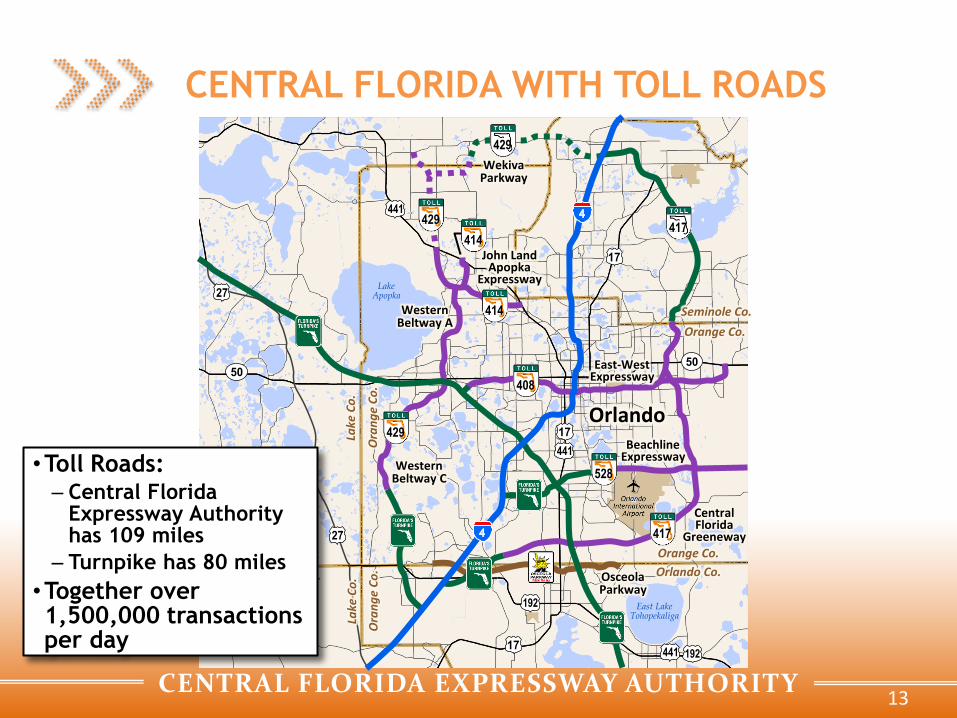
•Toll Roads: – Central Florida
Expressway Authority has 109 miles
– Turnpike has 80 miles
•Together over 1,500,000 transactions per day
13

CENTRAL FLORIDA EXPRESSWAY AUTHORITY
CENTRAL FLORIDA IS VITAL WITH MAJOR
DESTINATIONS CONNECTED BY CFX
• The system provides critical transportation links between the region’s residential
areas, major employment centers and the area’s major tourist attractions
– University of Central Florida – 2nd largest university in the country with Fall 2014
enrollment of 60,810 students1
– Valencia College – Winner of coveted Aspen Prize 2011; 59,958 credit seeking
students in 20132
– Orlando International Airport – nearly 18 million enplanements and 18,000 airport
employees3
– Lake Nona Medical City – Estimated to create up to 30,000 jobs over the next
decade4
– Walt Disney World Resort – 29 hotels5, 30,469 rooms6 and 180,000 Employees7
14
1 https://ikm.ucf.edu/enrollment-graduation/enrollment-statistics/2014-15-enrollment/ 2 http://valenciacollege.edu/aboutus/facts.cfm 3 http://www.orlandoairports.net/statistics/monthly/trfccy2014.pdfAuthority 4 Arduin, Laffer & Moore Econometrics 5 https://disneyworld.disney.go.com/faq/resorts/resort-hotel-list/ 6 http://touringplans.com/walt-disney-world/hotels/number-rooms# 7 http://thewaltdisneycompany.com/sites/default/files/reports/fy14-form-10k.pdf

CENTRAL FLORIDA EXPRESSWAY AUTHORITY
CENTRAL FLORIDA IS HOME TO 7 OF THE
TOP 20 THEME PARKS IN THE WORLD
Theme Park Attendance Statistics
15
Theme Parks 2013
Magic Kingdom 18,588,000
Epcot Center 17,214,000
Disney's Animal Kingdom 10,198,000
Disney's Hollywood Studios 10,110,000
Islands of Adventure at Universal Orlando 8,141,000
Universal Studios at Universal Orlando 7,062,000
SeaWorld Orlando 5,090,000
Busch Gardens Tampa Bay 4,087,000
Water Parks
Typhoon Lagoon 2,142,000
Blizzard Beach 1,968,000
Aquatica 1,553,000
Wet 'n Wild 1,259,000 Source: Themed Entertainment Association (TEA) and AECOM. All figures are estimates.

CENTRAL FLORIDA EXPRESSWAY AUTHORITY
RECENT DEVELOPMENTS AT DISNEY WORLD
WILL PRODUCE ECONOMIC GROWTH
Disney World – Fantasy Land Expansion
– Largest expansion in the history of the
Magic Kingdom park
– 2 new themed areas opened in 2012,
the start of Fantasyland Expansion
– Seven Dwarfs Mine Coaster opened in
2014, completing New Fantasyland
Expansion
– Cost exceeded $600 million
Disney World – Avatar Land
– Construction began 1/10/2014
– Project scheduled to open in early
2017
– Located in the Animal Kingdom
theme park
16
CENTRAL FLORIDA EXPRESSWAY AUTHORITY
5.53 5.93 6.04 6.2 7.06
4.63 5.95
7.67 7.98 8.14
0
2
4
6
8
10
12
14
16
2009 2010 2011 2012 2013
Att
end
ance
(m
illio
ns)
Universal Orlando Attendance
Universal Studios Islands of Adventure
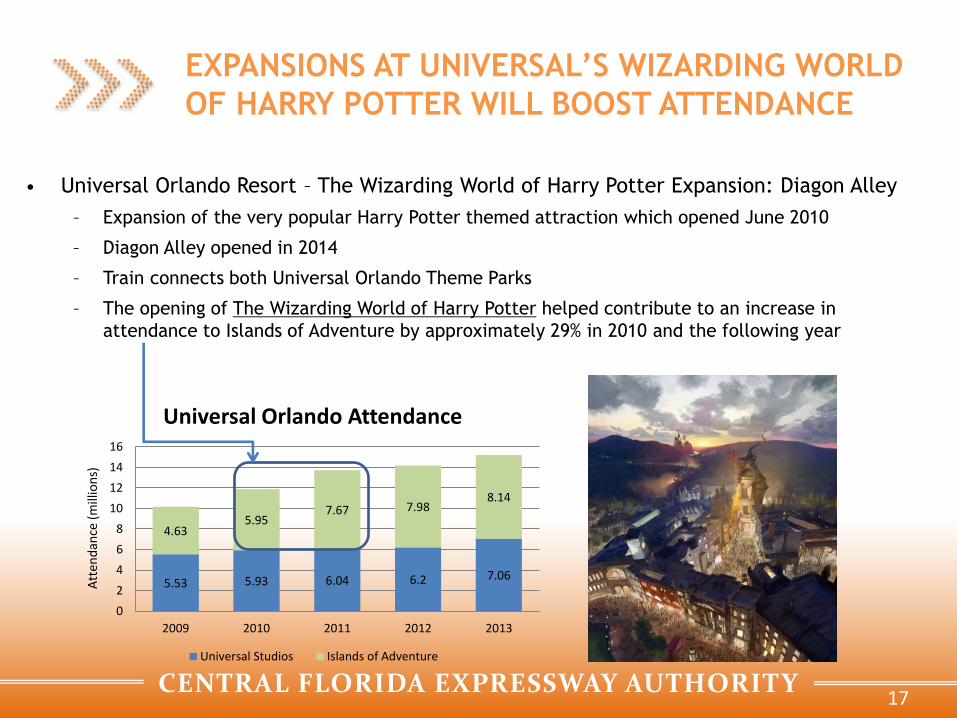
• Universal Orlando Resort – The Wizarding World of Harry Potter Expansion: Diagon Alley
– Expansion of the very popular Harry Potter themed attraction which opened June 2010
– Diagon Alley opened in 2014
– Train connects both Universal Orlando Theme Parks
– The opening of The Wizarding World of Harry Potter helped contribute to an increase in
attendance to Islands of Adventure by approximately 29% in 2010 and the following year
EXPANSIONS AT UNIVERSAL’S WIZARDING WORLD
OF HARRY POTTER WILL BOOST ATTENDANCE
17

CENTRAL FLORIDA EXPRESSWAY AUTHORITY
ECONOMIC DEVELOPMENT – WINTER
GARDEN
2006 2015
18

CENTRAL FLORIDA EXPRESSWAY AUTHORITY
ECONOMIC DEVELOPMENT – MEDICAL
CITY
2006 2015
19
CENTRAL FLORIDA EXPRESSWAY AUTHORITY
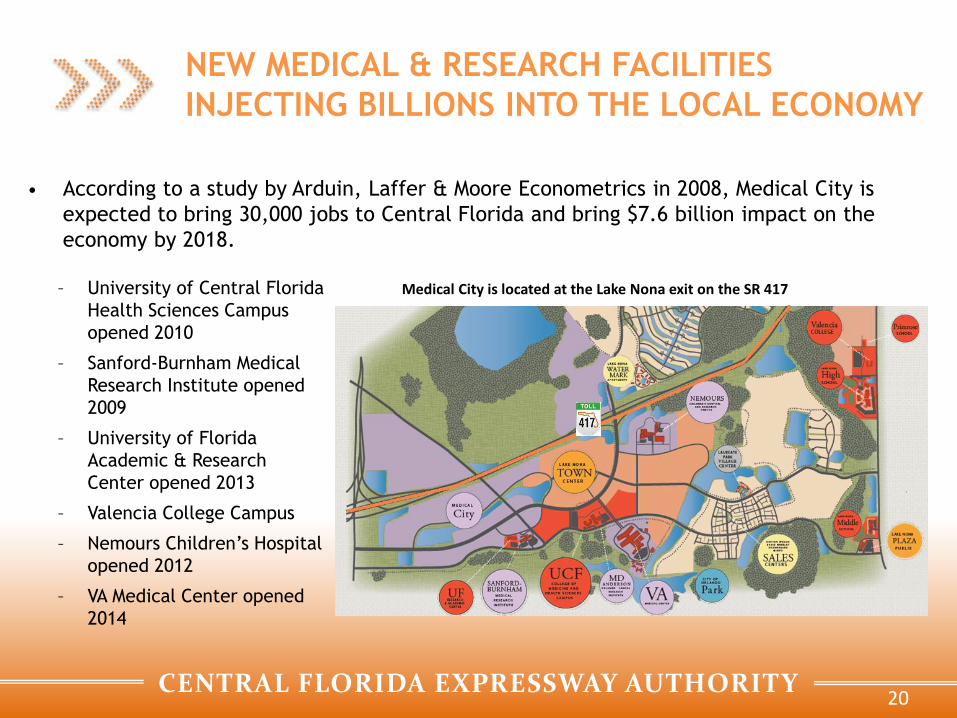
NEW MEDICAL & RESEARCH FACILITIES
INJECTING BILLIONS INTO THE LOCAL ECONOMY
• According to a study by Arduin, Laffer & Moore Econometrics in 2008, Medical City is
expected to bring 30,000 jobs to Central Florida and bring $7.6 billion impact on the
economy by 2018.
– University of Central Florida
Health Sciences Campus
opened 2010
– Sanford-Burnham Medical
Research Institute opened
2009
– University of Florida
Academic & Research
Center opened 2013
– Valencia College Campus
– Nemours Children’s Hospital
opened 2012
– VA Medical Center opened
2014
Medical City is located at the Lake Nona exit on the SR 417
20
CENTRAL FLORIDA EXPRESSWAY AUTHORITY
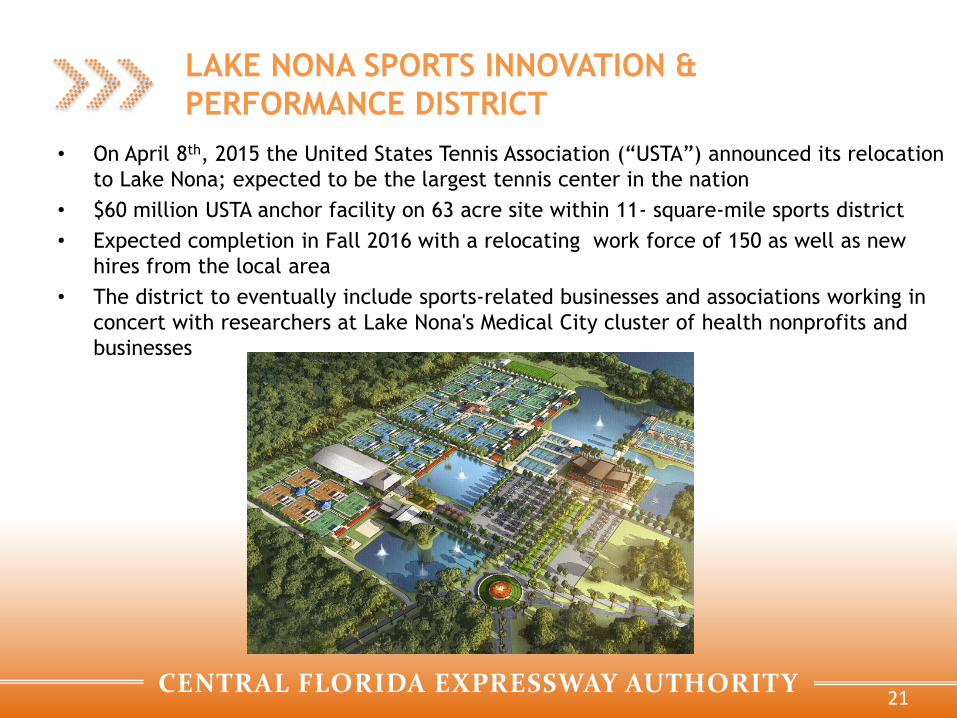
LAKE NONA SPORTS INNOVATION &
PERFORMANCE DISTRICT
• On April 8th, 2015 the United States Tennis Association (“USTA”) announced its relocation
to Lake Nona; expected to be the largest tennis center in the nation
• $60 million USTA anchor facility on 63 acre site within 11- square-mile sports district
• Expected completion in Fall 2016 with a relocating work force of 150 as well as new
hires from the local area
• The district to eventually include sports-related businesses and associations working in
concert with researchers at Lake Nona's Medical City cluster of health nonprofits and
businesses
21
CENTRAL FLORIDA EXPRESSWAY AUTHORITY
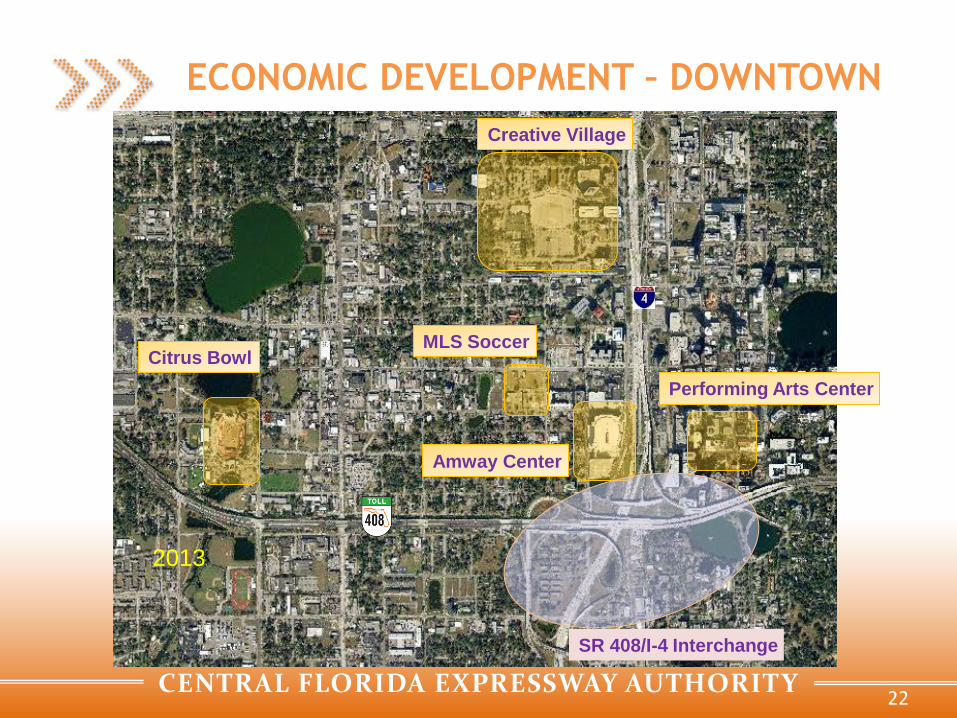
ECONOMIC DEVELOPMENT – DOWNTOWN
2013
2013
Creative Village
Performing Arts Center
Amway Center
Citrus Bowl
SR 408/I-4 Interchange
MLS Soccer
22

CENTRAL FLORIDA EXPRESSWAY AUTHORITY
CENTRAL FLORIDA VENUES
23
Dr. Phillips Center for Performing Arts Amway Center
Citrus Bowl MLS Soccer Stadium
CENTRAL FLORIDA EXPRESSWAY AUTHORITY
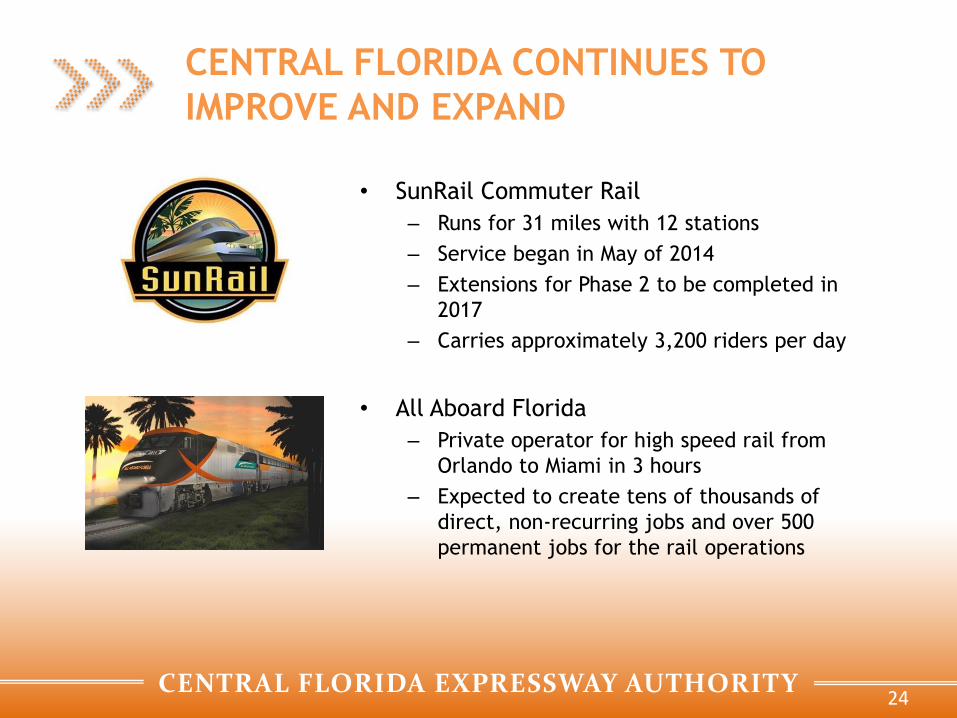
CENTRAL FLORIDA CONTINUES TO
IMPROVE AND EXPAND
• SunRail Commuter Rail
– Runs for 31 miles with 12 stations
– Service began in May of 2014
– Extensions for Phase 2 to be completed in
2017
– Carries approximately 3,200 riders per day
• All Aboard Florida
– Private operator for high speed rail from
Orlando to Miami in 3 hours
– Expected to create tens of thousands of
direct, non-recurring jobs and over 500
permanent jobs for the rail operations
24
CENTRAL FLORIDA EXPRESSWAY AUTHORITY
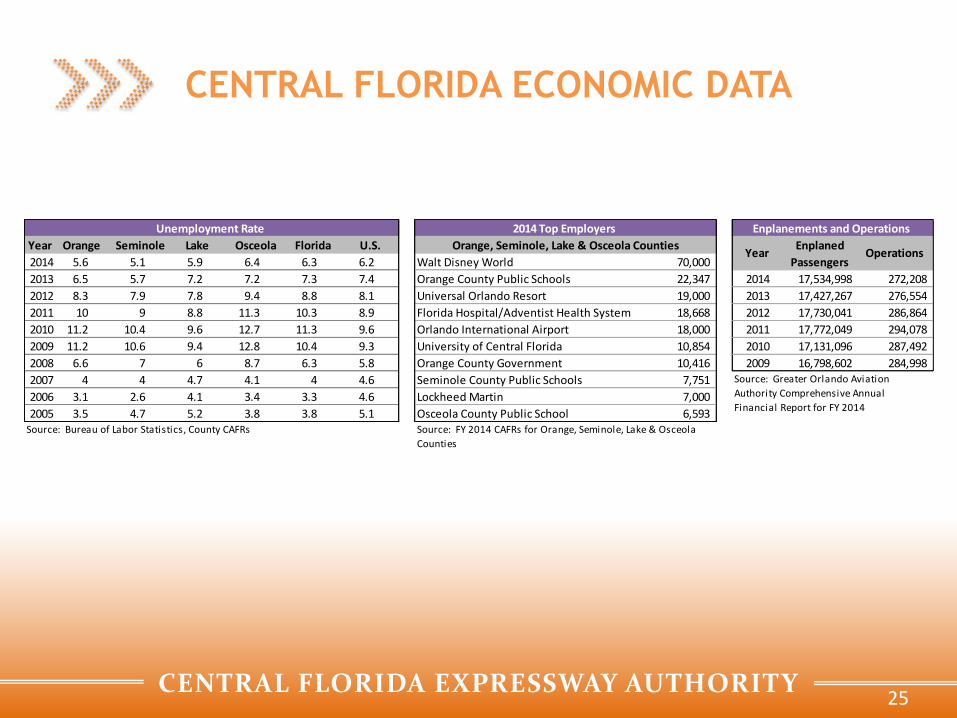
CENTRAL FLORIDA ECONOMIC DATA
25
Year Orange Seminole Lake Osceola Florida U.S. Enplaned
2014 5.6 5.1 5.9 6.4 6.3 6.2 Walt Disney World 70,000 Passengers
2013 6.5 5.7 7.2 7.2 7.3 7.4 Orange County Public Schools 22,347 2014 17,534,998 272,208
2012 8.3 7.9 7.8 9.4 8.8 8.1 Universal Orlando Resort 19,000 2013 17,427,267 276,554
2011 10 9 8.8 11.3 10.3 8.9 Florida Hospital/Adventist Health System 18,668 2012 17,730,041 286,864
2010 11.2 10.4 9.6 12.7 11.3 9.6 Orlando International Airport 18,000 2011 17,772,049 294,078
2009 11.2 10.6 9.4 12.8 10.4 9.3 University of Central Florida 10,854 2010 17,131,096 287,492
2008 6.6 7 6 8.7 6.3 5.8 Orange County Government 10,416 2009 16,798,602 284,998
2007 4 4 4.7 4.1 4 4.6 Seminole County Public Schools 7,751
2006 3.1 2.6 4.1 3.4 3.3 4.6 Lockheed Martin 7,000
2005 3.5 4.7 5.2 3.8 3.8 5.1 Osceola County Public School 6,593 Source: Bureau of Labor Statistics, County CAFRs
Source: Greater Orlando Aviation
Authority Comprehensive Annual
Financial Report for FY 2014
Source: FY 2014 CAFRs for Orange, Seminole, Lake & Osceola
Counties
Unemployment Rate 2014 Top Employers
Orange, Seminole, Lake & Osceola CountiesYear Operations
Enplanements and Operations

CENTRAL FLORIDA EXPRESSWAY AUTHORITY
Operational and Financial
Results
CENTRAL FLORIDA EXPRESSWAY AUTHORITY
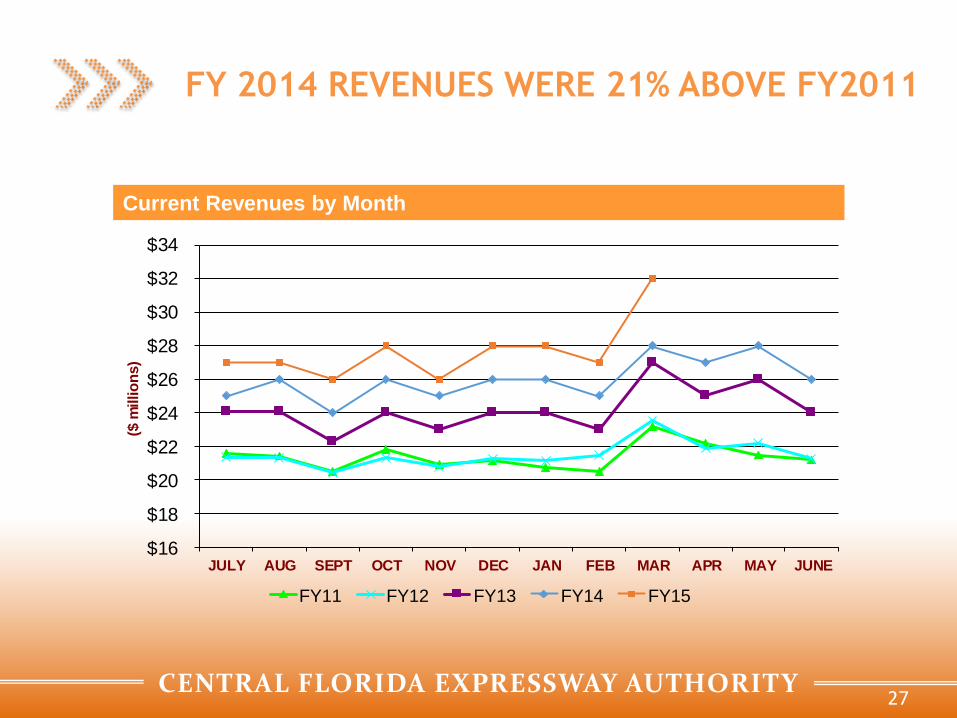
FY 2014 REVENUES WERE 21% ABOVE FY2011
Current Revenues by Month
27
$16
$18
$20
$22
$24
$26
$28
$30
$32
$34
JULY AUG SEPT OCT NOV DEC JAN FEB MAR APR MAY JUNE
($ m
illio
ns)
FY11 FY12 FY13 FY14 FY15

CENTRAL FLORIDA EXPRESSWAY AUTHORITY
20
22
24
26
28
30
32
34
JULY AUG SEPT OCT NOV DEC JAN FEB MAR APR MAY JUNE
($ m
illio
ns)
FY11 FY12 FY13 FY14 FY15
TRANSACTION COUNTS WERE UP 12%
FROM 2011 TO 2014
Current Traffic by Month
28

CENTRAL FLORIDA EXPRESSWAY AUTHORITY
$20
$22
$24
$26
$28
$30
$32
$34
JULY AUG SEPT OCT NOV DEC JAN FEB MAR APR MAY JUNE
($ m
illio
ns)
Actual Projections
REVENUES ARE 6.3% ABOVE PROJECTIONS
THROUGH MARCH FOR THE FISCAL YEAR
Revenue vs. Projections by Month for FY2014
29

CENTRAL FLORIDA EXPRESSWAY AUTHORITY
FY 2014 TOLL REVENUE
SR 408 39%
SR 528 17%
Beltway (417/429
/414) 44%
30

CENTRAL FLORIDA EXPRESSWAY AUTHORITY
% OF ELECTRONIC TRANSACTIONS INCREASED
BY 38% IN PAST 10 YEARS, IMPROVING
EFFICIENCY
Toll Transactions (000s)
31
0
50,000
100,000
150,000
200,000
250,000
300,000
350,000
400,000
2005 2006 2007 2008 2009 2010 2011 2012 2013 2014Fiscal Year
ETC Transactions
Total Transact ions

CENTRAL FLORIDA EXPRESSWAY AUTHORITY
HOW REVENUE IS SPENT (PROJECTED FY 2016)
14%
5%
2%
46%
7%
26%
Operations
Maintenance
Administration
Debt Service
Renewal and Replacement
Available for Projects
32

CENTRAL FLORIDA EXPRESSWAY AUTHORITY
UNPAID TOLL NOTICE (UTN) PROGRAM
CONTINUES TO GROW
33
$1,819,895
$4,216,428
$6,006,815
$8,750,508
$11,150,481
$0.00
$2,000,000.00
$4,000,000.00
$6,000,000.00
$8,000,000.00
$10,000,000.00
$12,000,000.00
UTN Rev FY 2010 UTN Rev FY 2011 UTN Rev FY 2012 UTN Rev FY 2013 UTN Rev FY 2014
* Neither unpaid UTNs nor transactions converted to AVI are included.
CENTRAL FLORIDA EXPRESSWAY AUTHORITY
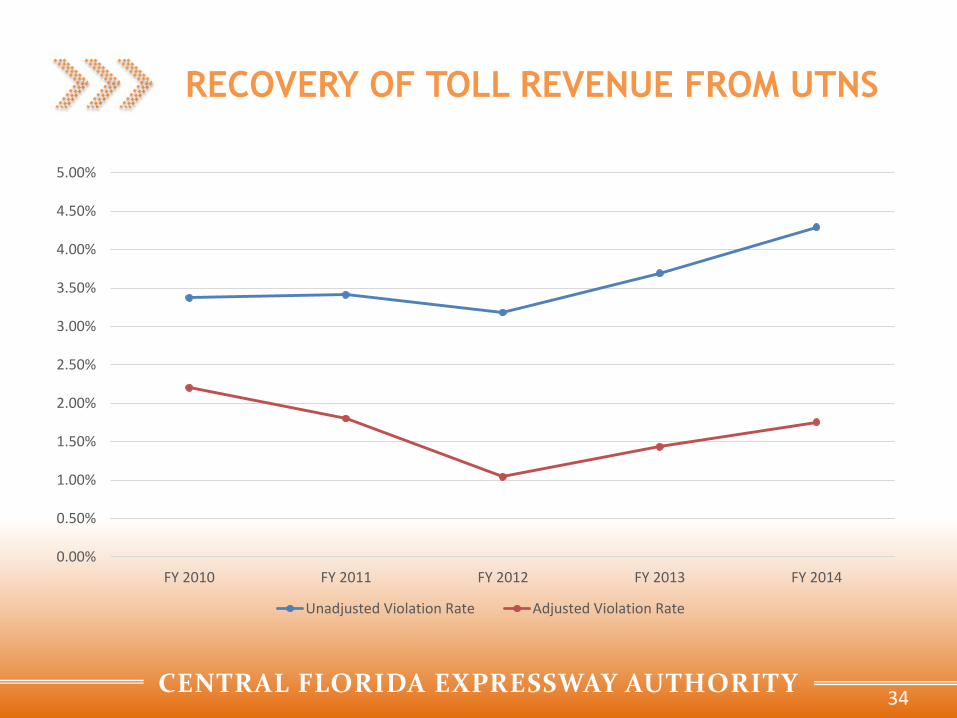
RECOVERY OF TOLL REVENUE FROM UTNS
34
0.00%
0.50%
1.00%
1.50%
2.00%
2.50%
3.00%
3.50%
4.00%
4.50%
5.00%
FY 2010 FY 2011 FY 2012 FY 2013 FY 2014
Unadjusted Violation Rate Adjusted Violation Rate
CENTRAL FLORIDA EXPRESSWAY AUTHORITY
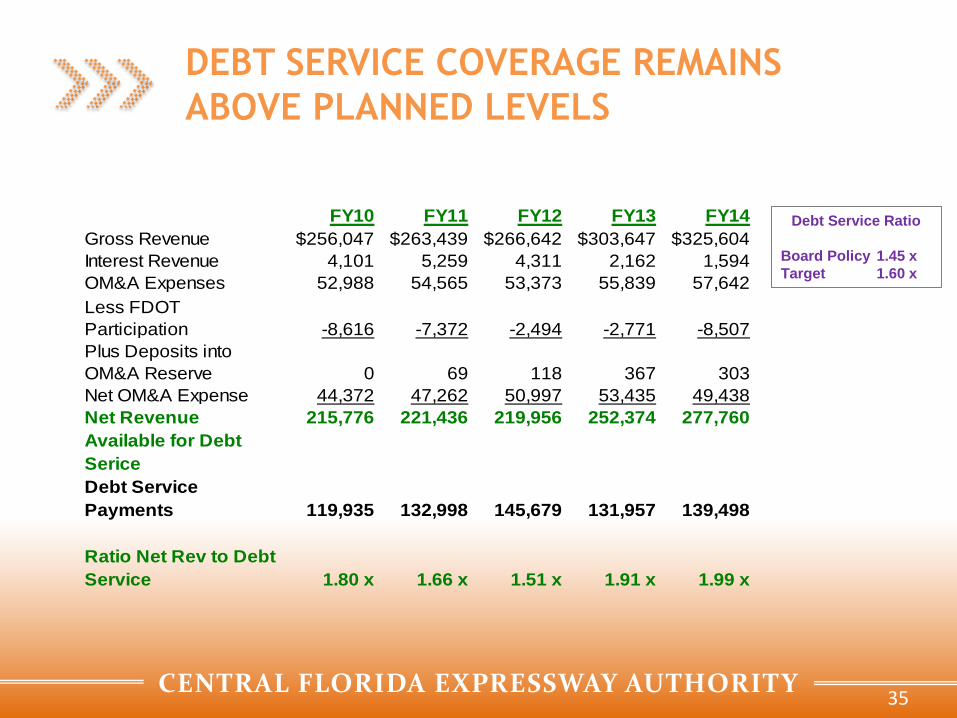
DEBT SERVICE COVERAGE REMAINS
ABOVE PLANNED LEVELS
Debt Service Ratio
Board Policy 1.45 x
Target 1.60 x
35
FY10 FY11 FY12 FY13 FY14
Gross Revenue $256,047 $263,439 $266,642 $303,647 $325,604
Interest Revenue 4,101 5,259 4,311 2,162 1,594
OM&A Expenses 52,988 54,565 53,373 55,839 57,642
Less FDOT
Participation -8,616 -7,372 -2,494 -2,771 -8,507
Plus Deposits into
OM&A Reserve 0 69 118 367 303
Net OM&A Expense 44,372 47,262 50,997 53,435 49,438
Net Revenue
Available for Debt
Serice
215,776 221,436 219,956 252,374 277,760
Debt Service
Payments 119,935 132,998 145,679 131,957 139,498
Ratio Net Rev to Debt
Service
1.80 x
1.66 x
1.51 x 1.91 x 1.99 x

CENTRAL FLORIDA EXPRESSWAY AUTHORITY
CFX HAS A STRONG LIQUIDITY POSITION
• Reserves (as of 3/31/15)
– OM&A $ 7,928,946
– Renewal and Replacement 18,720,183
– Reserve for Swaps 162,545,110
– Unrestricted cash for projects
and operations 295,625,738
$ 484,819,977
36
CENTRAL FLORIDA EXPRESSWAY AUTHORITY
Traffic and Revenue

CENTRAL FLORIDA EXPRESSWAY AUTHORITY
CFX SYSTEM
38
CENTRAL FLORIDA EXPRESSWAY AUTHORITY
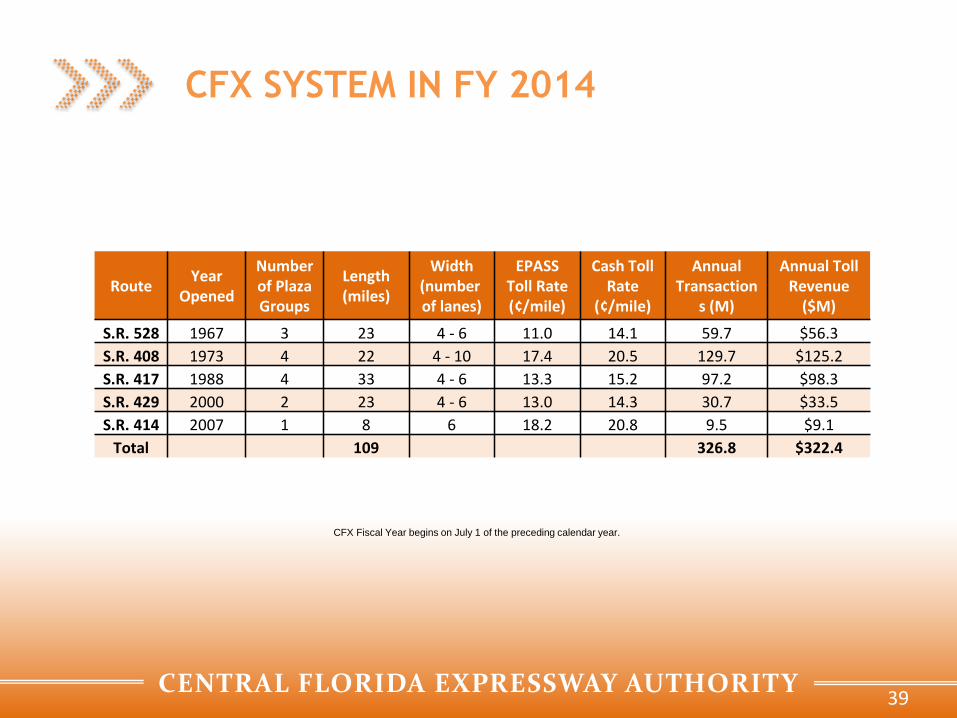
CFX Fiscal Year begins on July 1 of the preceding calendar year.
CFX SYSTEM IN FY 2014
39
RouteYear
Opened
Number of Plaza Groups
Length (miles)
Width (numberof lanes)
EPASS Toll Rate (¢/mile)
Cash Toll Rate
(¢/mile)
Annual Transaction
s (M)
Annual Toll Revenue
($M)
S.R. 528 1967 3 23 4 - 6 11.0 14.1 59.7 $56.3
S.R. 408 1973 4 22 4 - 10 17.4 20.5 129.7 $125.2
S.R. 417 1988 4 33 4 - 6 13.3 15.2 97.2 $98.3
S.R. 429 2000 2 23 4 - 6 13.0 14.3 30.7 $33.5
S.R. 414 2007 1 8 6 18.2 20.8 9.5 $9.1
Total 109 326.8 $322.4
CENTRAL FLORIDA EXPRESSWAY AUTHORITY
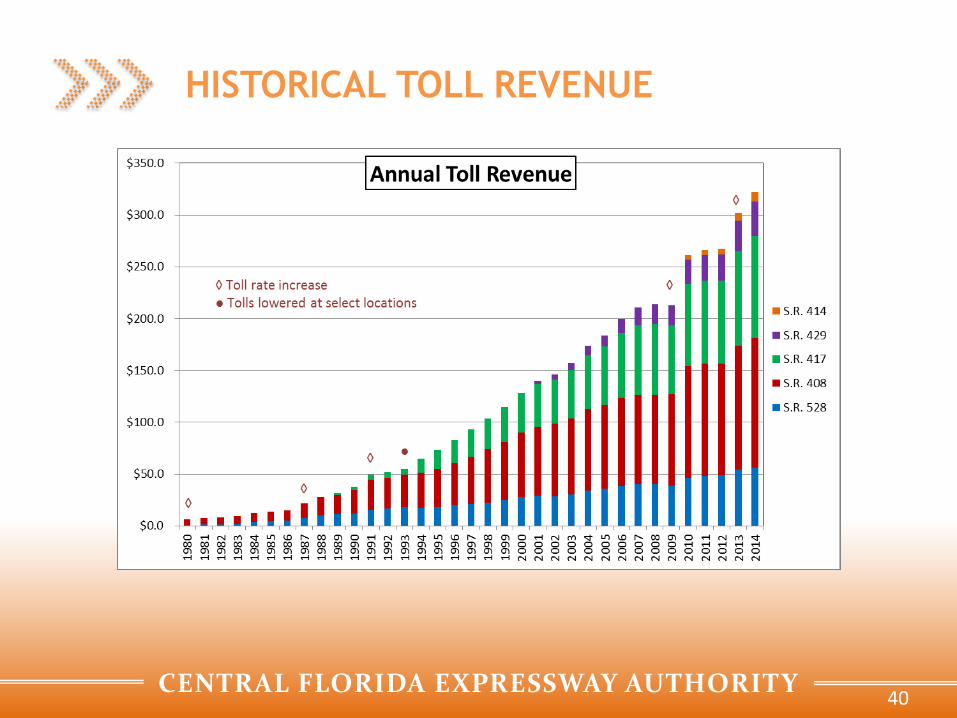
HISTORICAL TOLL REVENUE
40
CENTRAL FLORIDA EXPRESSWAY AUTHORITY
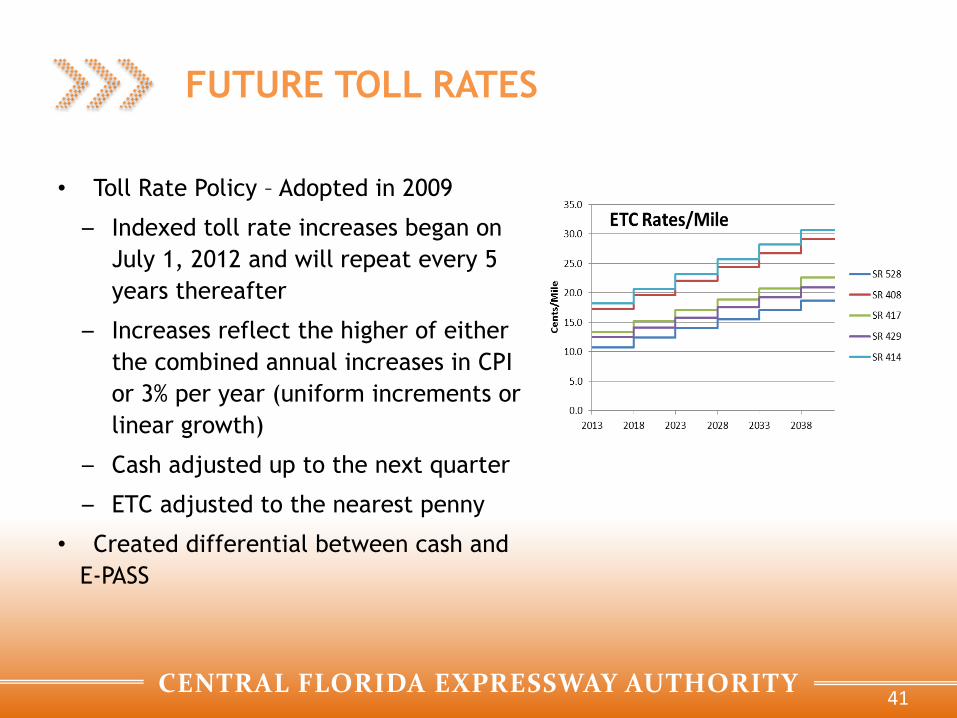
FUTURE TOLL RATES
• Toll Rate Policy – Adopted in 2009
– Indexed toll rate increases began on
July 1, 2012 and will repeat every 5
years thereafter
– Increases reflect the higher of either
the combined annual increases in CPI
or 3% per year (uniform increments or
linear growth)
– Cash adjusted up to the next quarter
– ETC adjusted to the nearest penny
• Created differential between cash and
E-PASS
41
CENTRAL FLORIDA EXPRESSWAY AUTHORITY
DISCOUNT PROGRAMS
• E-PASS transactions receive a volume discount (applied at end of month)
– 5% discount on all transaction is monthly total is between 40 to 80
transactions
– 10% discount on all transactions if the monthly total is more than 80
transactions
– In FY 2014 discount was $11.7 million
• E-PASS transactions on the beltway (SR 417, SR 429 and SR 414) will receive the
I-4 Ultimate Commuter discount
– Additional 5% discount on beltway transactions if the monthly total is 20 or
more transactions
– Limited in duration to six years beginning in FY 2016
– Constrained by overall system performance
– Applies if, and only if, System revenues for the month exceed the forecast
by 2%
42

CENTRAL FLORIDA EXPRESSWAY AUTHORITY
• July 2012 – first indexed toll rate increase – ETC toll rates increased 9% ($0.03 – $0.12)
– Cash toll rates increased $0.25
• Created toll rate differential for E-PASS customers
• E-PASS participation went up 3.4%
• With a 14% increase in toll, S.R. 408 and S.R. 417 had less than 2% reductions in traffic and 12% increases in toll revenue
• S.R. 528 had a change in the toll collection plan, i.e., a new plaza Dallas Main
• S.R. 429 and S.R. 414 had more traffic and revenue (extended to the north)
Toll
Facility Increase Impact Elasticity Impact Elasticity
SR 528 11% 1.3% N/A 12.5% N/A
SR 408 13% -1.8% -0.14 10.8% 0.83
SR 417 14% -1.9% -0.14 12.1% 0.86
SR 429 15% 0.7% N/A 15.3% N/A
SR 414 17% 13.7% N/A 33.6% N/A
Traffic Revenue
2013 TOLL RATE INCREASE
43
CENTRAL FLORIDA EXPRESSWAY AUTHORITY
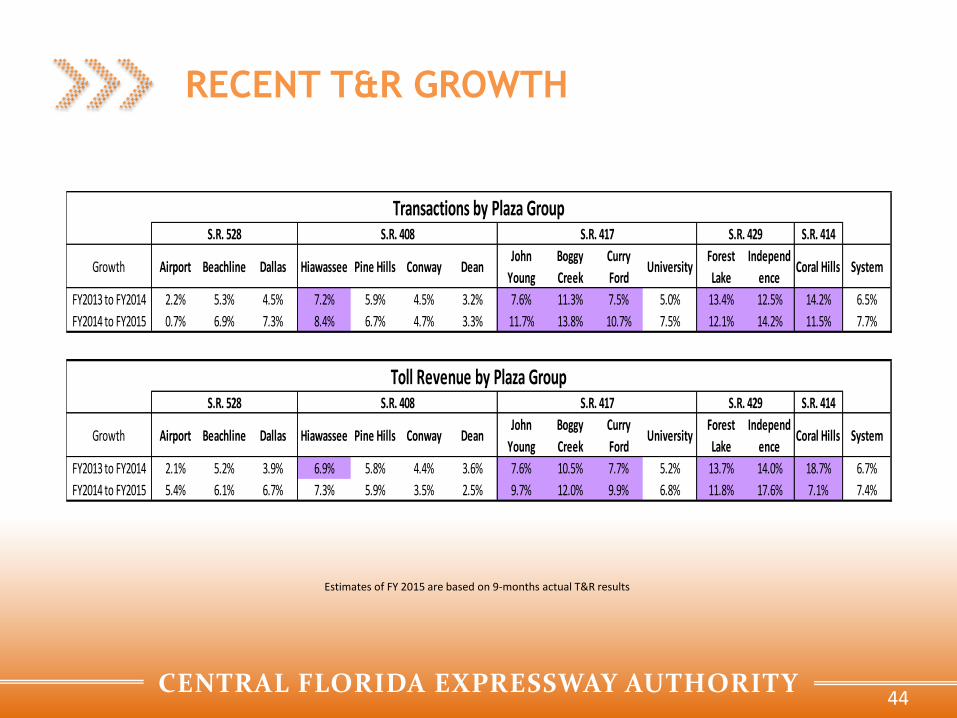
Transactions by Plaza GroupS.R. 528 S.R. 408 S.R. 417 S.R. 429 S.R. 414
Growth Airport Beachline Dallas Hiawassee Pine Hills Conway DeanJohn
Young
Boggy
Creek
Curry
FordUniversity
Forest
Lake
Independ
enceCoral Hills System
FY2013 to FY2014 2.2% 5.3% 4.5% 7.2% 5.9% 4.5% 3.2% 7.6% 11.3% 7.5% 5.0% 13.4% 12.5% 14.2% 6.5%
FY2014 to FY2015 0.7% 6.9% 7.3% 8.4% 6.7% 4.7% 3.3% 11.7% 13.8% 10.7% 7.5% 12.1% 14.2% 11.5% 7.7%
Toll Revenue by Plaza GroupS.R. 528 S.R. 408 S.R. 417 S.R. 429 S.R. 414
Growth Airport Beachline Dallas Hiawassee Pine Hills Conway DeanJohn
Young
Boggy
Creek
Curry
FordUniversity
Forest
Lake
Independ
enceCoral Hills System
FY2013 to FY2014 2.1% 5.2% 3.9% 6.9% 5.8% 4.4% 3.6% 7.6% 10.5% 7.7% 5.2% 13.7% 14.0% 18.7% 6.7%
FY2014 to FY2015 5.4% 6.1% 6.7% 7.3% 5.9% 3.5% 2.5% 9.7% 12.0% 9.9% 6.8% 11.8% 17.6% 7.1% 7.4%
Estimates of FY 2015 are based on 9-months actual T&R results
RECENT T&R GROWTH
44
CENTRAL FLORIDA EXPRESSWAY AUTHORITY
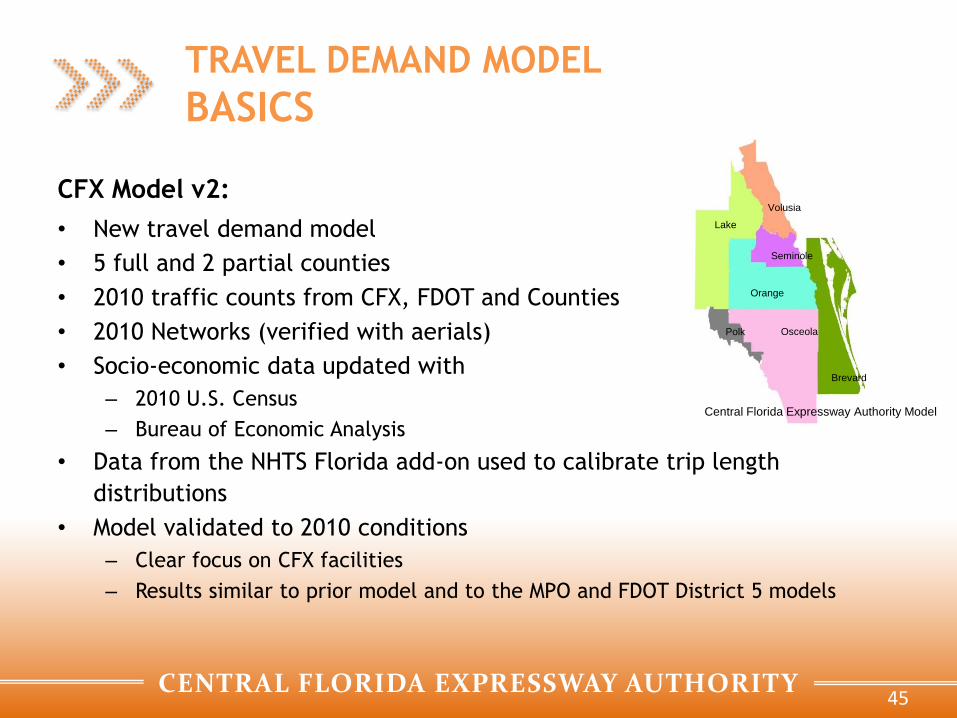
CFX Model v2:
• New travel demand model
• 5 full and 2 partial counties
• 2010 traffic counts from CFX, FDOT and Counties
• 2010 Networks (verified with aerials)
• Socio-economic data updated with
– 2010 U.S. Census
– Bureau of Economic Analysis
• Data from the NHTS Florida add-on used to calibrate trip length
distributions
• Model validated to 2010 conditions
– Clear focus on CFX facilities
– Results similar to prior model and to the MPO and FDOT District 5 models
Orange
Seminole
Brevard
Polk Osceola
Lake
Volusia
Central Florida Expressway Authority Model
TRAVEL DEMAND MODEL
BASICS
45
CENTRAL FLORIDA EXPRESSWAY AUTHORITY
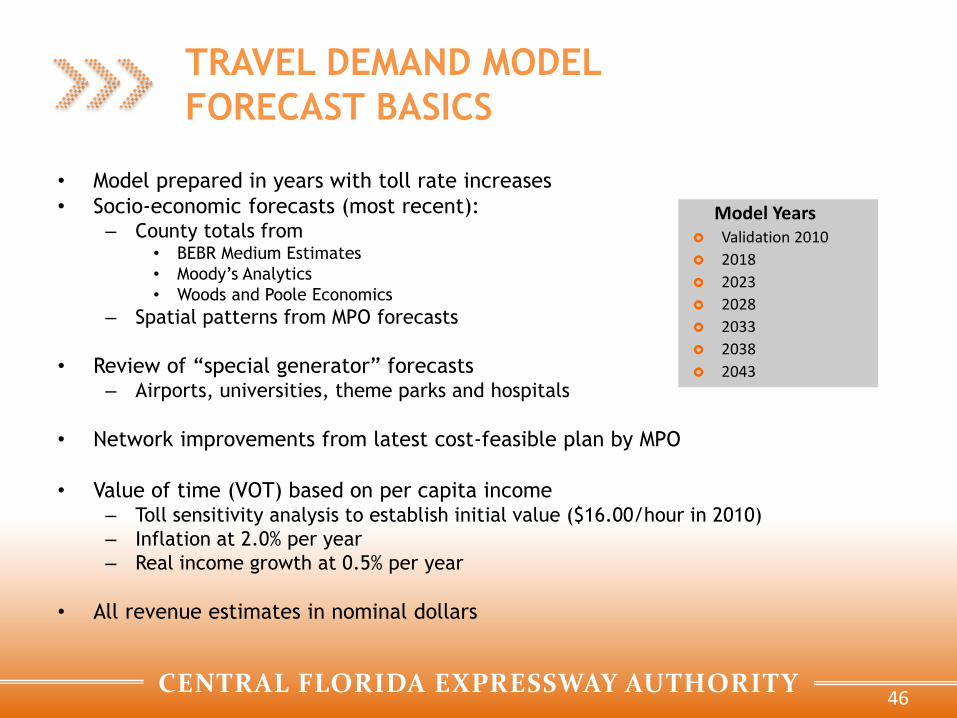
• Model prepared in years with toll rate increases
• Socio-economic forecasts (most recent): – County totals from
• BEBR Medium Estimates
• Moody’s Analytics
• Woods and Poole Economics
– Spatial patterns from MPO forecasts
• Review of “special generator” forecasts – Airports, universities, theme parks and hospitals
• Network improvements from latest cost-feasible plan by MPO
• Value of time (VOT) based on per capita income – Toll sensitivity analysis to establish initial value ($16.00/hour in 2010)
– Inflation at 2.0% per year
– Real income growth at 0.5% per year
• All revenue estimates in nominal dollars
Model Years Validation 2010
2018
2023
2028
2033
2038
2043
TRAVEL DEMAND MODEL
FORECAST BASICS
46

CENTRAL FLORIDA EXPRESSWAY AUTHORITY
REVENUE MODEL FORECAST BASICS
• Revenue model produces annual T&R estimates from
traffic volume estimates out of the travel demand
model
• Revenue model contains a series of adjustment factors
to duplicate transactions by plaza and revenue by
plaza group – Based on 2010 T&R data
– Results are “expected” T&R with violations/leakage excluded
from the start
– Impacts of the revenue recovered from UTNs and the discount
programs are handled separately as a last step in this model
• Taken together: – Travel demand model provides estimates of growth from
changes in the network, land-use and toll rates
– Revenue model ensures the forecast stream is connected to
recent history
47
CENTRAL FLORIDA EXPRESSWAY AUTHORITY
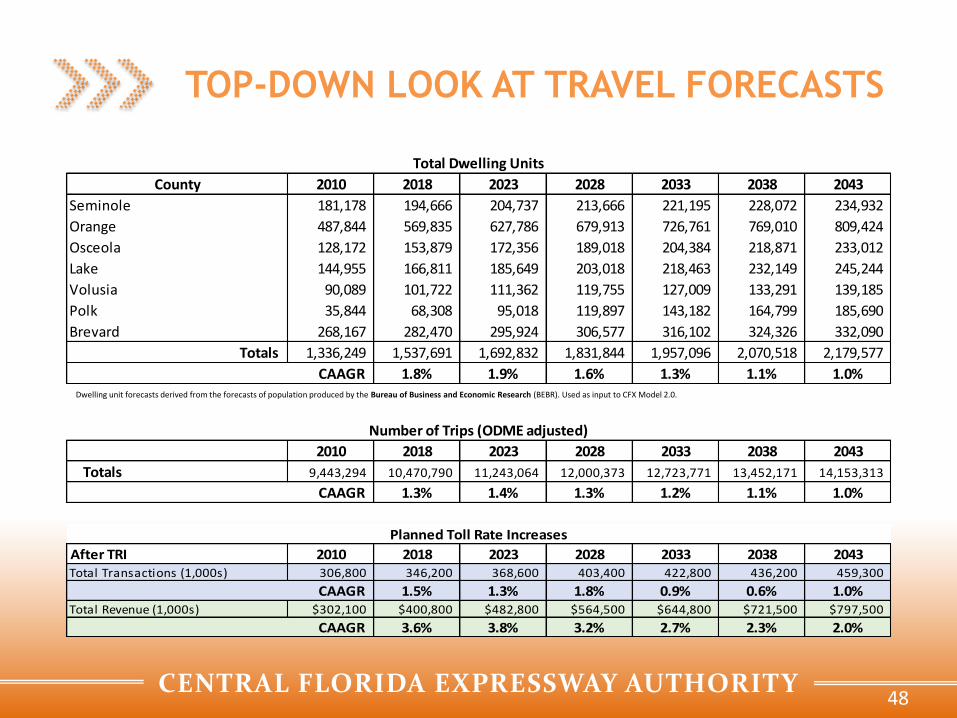
Dwelling unit forecasts derived from the forecasts of population produced by the Bureau of Business and Economic Research (BEBR). Used as input to CFX Model 2.0.
Total Dwelling Units
2010 2018 2023 2028 2033 2038 2043
181,178 194,666 204,737 213,666 221,195 228,072 234,932
487,844 569,835 627,786 679,913 726,761 769,010 809,424
128,172 153,879 172,356 189,018 204,384 218,871 233,012
144,955 166,811 185,649 203,018 218,463 232,149 245,244
90,089 101,722 111,362 119,755 127,009 133,291 139,185
35,844 68,308 95,018 119,897 143,182 164,799 185,690
268,167 282,470 295,924 306,577 316,102 324,326 332,090
1,336,249 1,537,691 1,692,832 1,831,844 1,957,096 2,070,518 2,179,577
1.8% 1.9% 1.6% 1.3% 1.1% 1.0%CAAGR
Volusia
Polk
Brevard
Totals
County
Seminole
Orange
Osceola
Lake
Number of Trips (ODME adjusted)
2010 2018 2023 2028 2033 2038 2043
Totals 9,443,294 10,470,790 11,243,064 12,000,373 12,723,771 13,452,171 14,153,313
1.3% 1.4% 1.3% 1.2% 1.1% 1.0%CAAGR
Planned Toll Rate Increases
After TRI 2010 2018 2023 2028 2033 2038 2043Total Transactions (1,000s) 306,800 346,200 368,600 403,400 422,800 436,200 459,300
CAAGR 1.5% 1.3% 1.8% 0.9% 0.6% 1.0%Total Revenue (1,000s) $302,100 $400,800 $482,800 $564,500 $644,800 $721,500 $797,500
CAAGR 3.6% 3.8% 3.2% 2.7% 2.3% 2.0%
TOP-DOWN LOOK AT TRAVEL FORECASTS
48

CENTRAL FLORIDA EXPRESSWAY AUTHORITY
WEKIVA PARKWAY
49
Development Schedule
Sections 1A and 1BUS 441 through KPROpen 7/1/2017
Sections 2A, 2B and 2CKPR to US 46 and to FDOTOpen 1/1/2018
CENTRAL FLORIDA EXPRESSWAY AUTHORITY
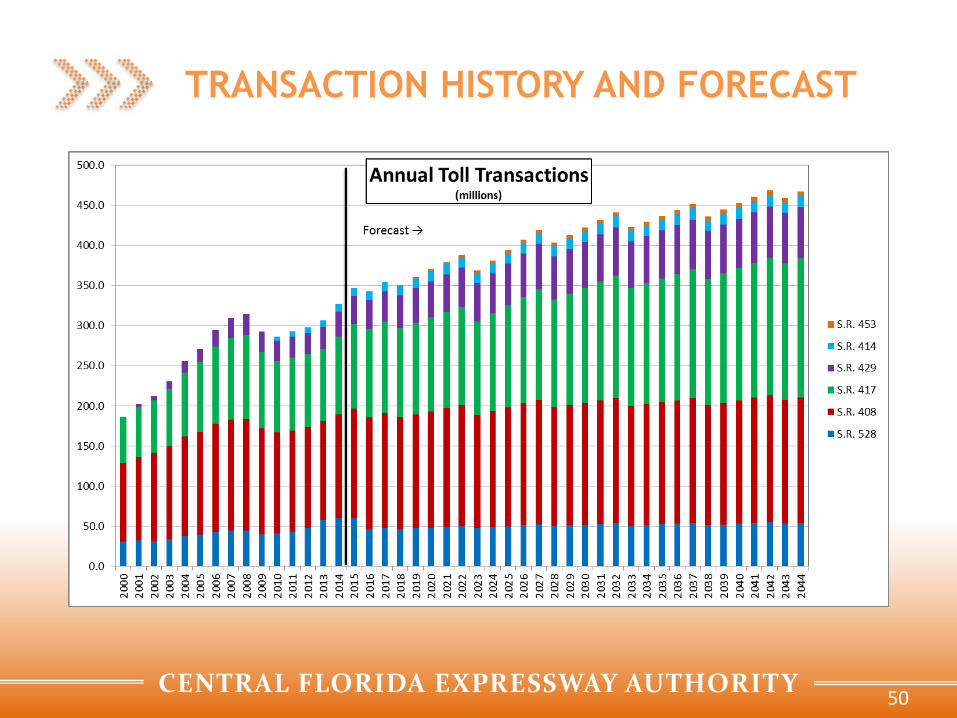
TRANSACTION HISTORY AND FORECAST
50
CENTRAL FLORIDA EXPRESSWAY AUTHORITY
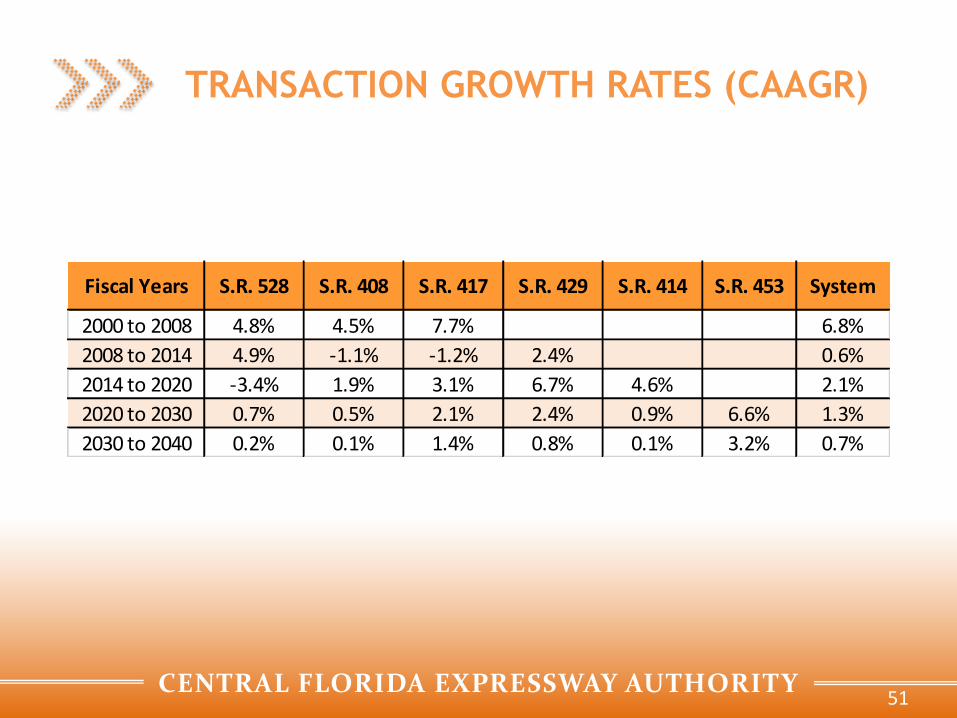
TRANSACTION GROWTH RATES (CAAGR)
51
Fiscal Years S.R. 528 S.R. 408 S.R. 417 S.R. 429 S.R. 414 S.R. 453 System
2000 to 2008 4.8% 4.5% 7.7% 6.8%
2008 to 2014 4.9% -1.1% -1.2% 2.4% 0.6%
2014 to 2020 -3.4% 1.9% 3.1% 6.7% 4.6% 2.1%
2020 to 2030 0.7% 0.5% 2.1% 2.4% 0.9% 6.6% 1.3%
2030 to 2040 0.2% 0.1% 1.4% 0.8% 0.1% 3.2% 0.7%

CENTRAL FLORIDA EXPRESSWAY AUTHORITY
TOLL REVENUE HISTORY AND FORECAST
52

CENTRAL FLORIDA EXPRESSWAY AUTHORITY
TOLL REVENUE GROWTH RATES (CAAGR)
53
Fiscal Years S.R. 528 S.R. 408 S.R. 417 S.R. 429 S.R. 414 S.R. 453 System
2000 to 2008 4.7% 4.1% 7.5% 6.6%
2008 to 2014 5.8% 6.4% 6.2% 9.9% 7.1%
2014 to 2020 5.1% 3.6% 4.6% 8.4% 4.4% 4.8%
2020 to 2030 2.7% 2.6% 3.8% 4.5% 4.1% 9.9% 3.3%
2030 to 2040 2.4% 1.9% 2.8% 2.7% 2.0% 5.4% 2.4%
CENTRAL FLORIDA EXPRESSWAY AUTHORITY
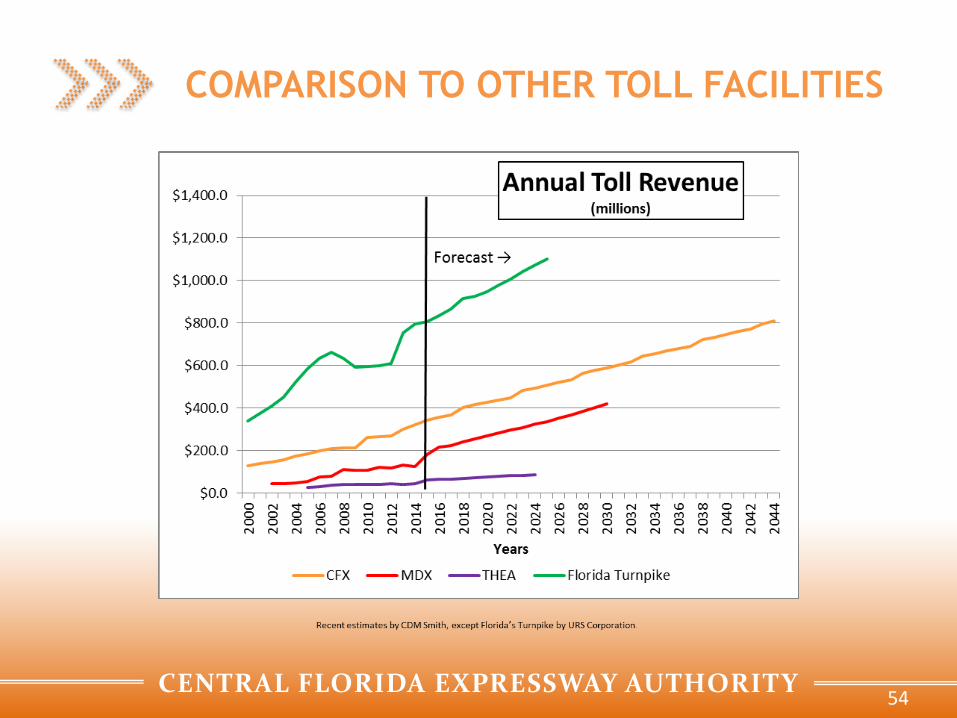
COMPARISON TO OTHER TOLL FACILITIES
54

CENTRAL FLORIDA EXPRESSWAY AUTHORITY
Five-Year Work Plan
CENTRAL FLORIDA EXPRESSWAY AUTHORITY
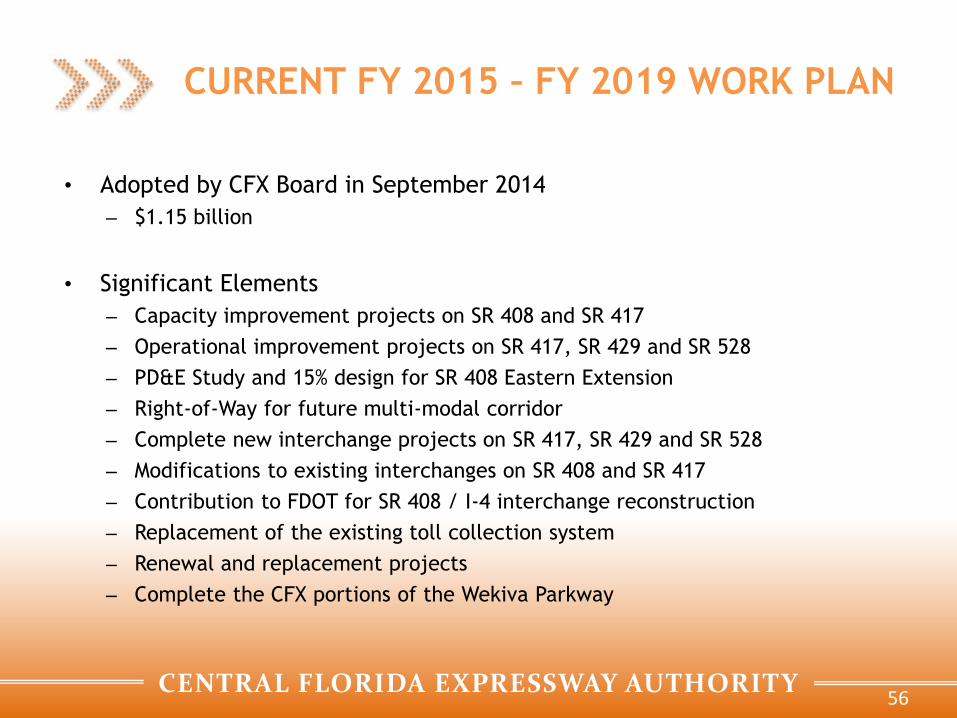
CURRENT FY 2015 – FY 2019 WORK PLAN
• Adopted by CFX Board in September 2014
– $1.15 billion
• Significant Elements
– Capacity improvement projects on SR 408 and SR 417
– Operational improvement projects on SR 417, SR 429 and SR 528
– PD&E Study and 15% design for SR 408 Eastern Extension
– Right-of-Way for future multi-modal corridor
– Complete new interchange projects on SR 417, SR 429 and SR 528
– Modifications to existing interchanges on SR 408 and SR 417
– Contribution to FDOT for SR 408 / I-4 interchange reconstruction
– Replacement of the existing toll collection system
– Renewal and replacement projects
– Complete the CFX portions of the Wekiva Parkway
56

CENTRAL FLORIDA EXPRESSWAY AUTHORITY
CENTRAL FLORIDA EXPRESSWAY
AUTHORITY WORK PLAN PROCESS
Renewal & Replacement Projects
Does Not Meet
Criteria
Intelligent Transportation Systems Projects
Updated Revenue Projections
2030 Master Plan Projects
Draft Five-Year Work Plan
Financial Analysis
Final Five-Year Work Plan
Board Adopts Work Plan
57

CENTRAL FLORIDA EXPRESSWAY AUTHORITY
CURRENT FY 2015 – FY 2019 WORK PLAN
FY 2015 - FY 2019 Work Plan₁
in $ thousands
Project FY 2015 FY 2016 FY 2017 FY 2018 FY 2019 Total
Existing System Improvements 12,706 14,061 12,188 811 18,183 57,949
System Expansion Projects 115,323 115,212 42,773 107,593 153,222 534,123
Interchange Projects 84,205 81,575 2,051 75,500 75,500 318,831
Toll Facilities Projects 22,399 32,643 27,930 29,738 8,891 121,601
Intelligent Transportation Systems Projects 6,752 5,458 2,579 171 513 15,473
Renewal and Replacement 26,085 28,438 2,538 3,572 49,310 109,943
Signing and Pavement Marking Projects 7,107 4,749 3,007 1,247 2,289 18,399
Landscaping Projects 1,266 720 750 750 800 4,286
Non-System Project 4,353 - 1,002 - 5,355
Sub - Total 280,196 282,856 93,816 220,384 308,708 1,185,960
Expected Credits2 (30,250) (30,250)
Work Plan Total 249,946 282,856 93,816 220,384 308,708 1,155,710
Notes:
1. Five-Year Work Plan FY 2015 - FY 2019; dated September 11, 2014.
2. Credits for SR 528 / Innovation Way Interchange. Expected credit of $12 million from AAF contribution. Received credits of $11.75 million
from SLR and $6.5 million from Orange County.
58
CENTRAL FLORIDA EXPRESSWAY AUTHORITY
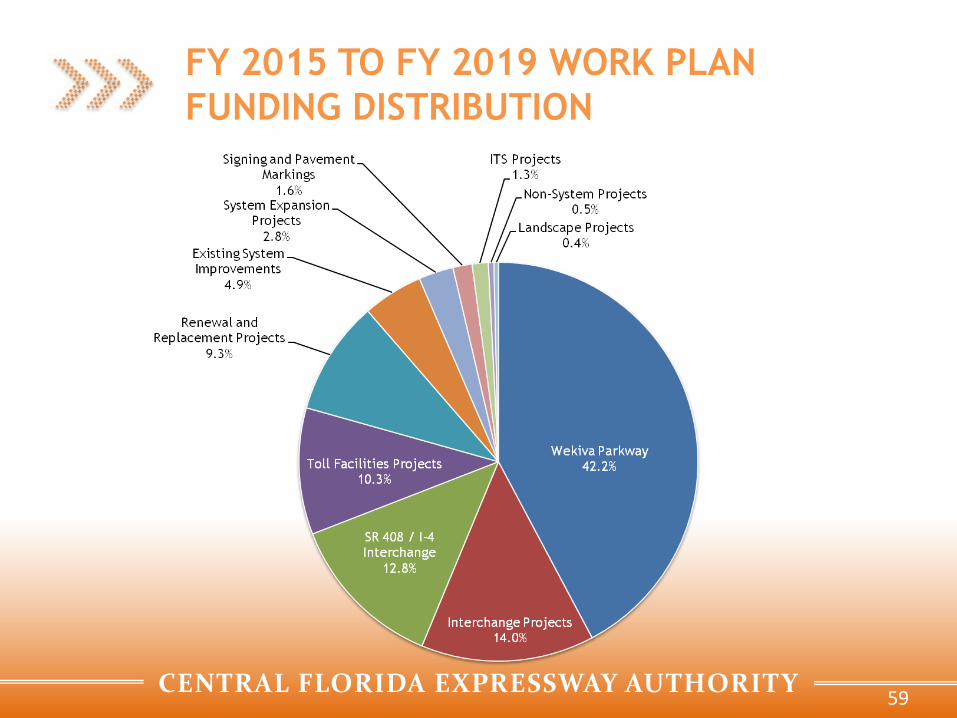
FY 2015 TO FY 2019 WORK PLAN
FUNDING DISTRIBUTION
59
CENTRAL FLORIDA EXPRESSWAY AUTHORITY
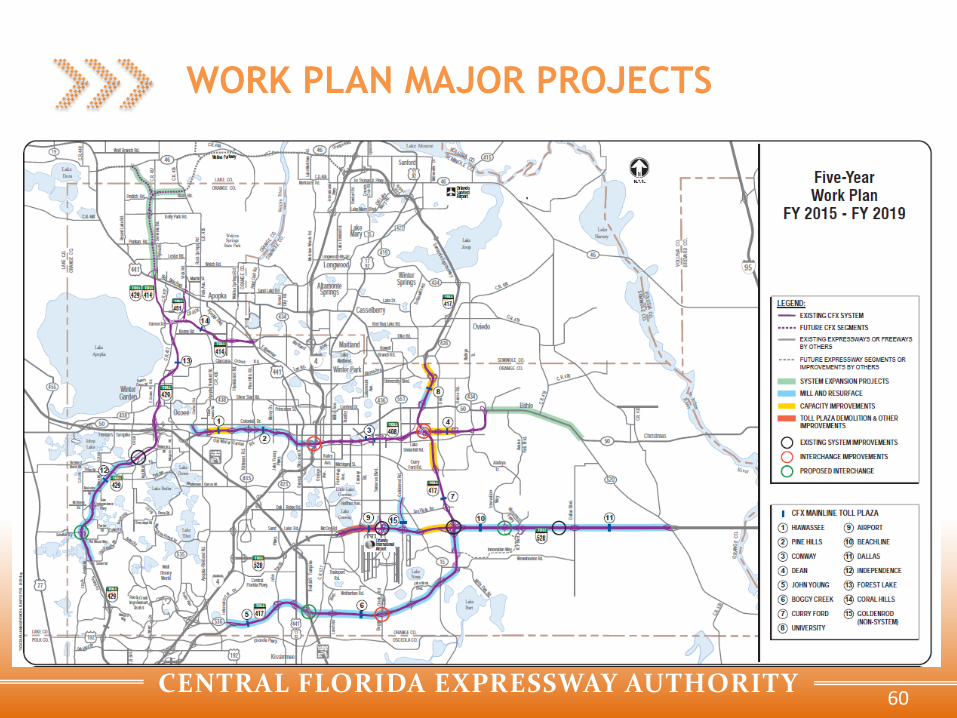
WORK PLAN MAJOR PROJECTS
60

CENTRAL FLORIDA EXPRESSWAY AUTHORITY
PLANNED PROJECTS BEYOND FY 2019
($371 MILLION THRU FY 2024)
• SR 408 / I-4 Interchange
– Critical transportation project
– Central Florida Expressway Authority
contribution for FDOT led project
– $75.5 million in FY 2018
– $75.5 million in FY 2019
– $80.25 million in FY 2020
• SR 408, SR 417 and SR 528 capacity
improvements
• Renewal and Replacement program
61

CENTRAL FLORIDA EXPRESSWAY AUTHORITY
Wekiva Parkway Update
CENTRAL FLORIDA EXPRESSWAY AUTHORITY
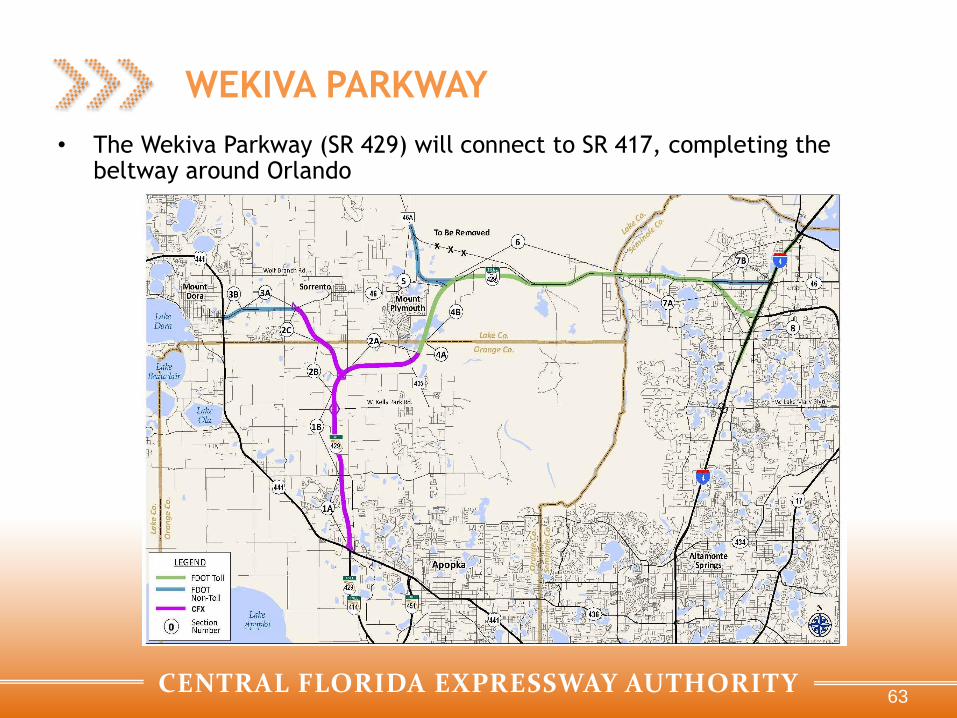
WEKIVA PARKWAY
• The Wekiva Parkway (SR 429) will connect to SR 417, completing the beltway around Orlando
63
CFX

CENTRAL FLORIDA EXPRESSWAY AUTHORITY
WEKIVA PARKWAY PROJECT OVERVIEW
• Estimated $1.6 billion project includes $500 million of non-toll road improvements including:
– Construction of SR 46 as a parallel service road in Lake and Seminole Counties
– Widening four (4) miles of SR 46
– Rebuilding the US 441 / SR 46 interchange in Mount Dora
– Realignment of three (3) miles of CR 46A out of the Seminole State Forest
• Authorized in 2004 by the Wekiva Parkway and Protection Act (Chapter 369, Part III, F.S.), this expressway has been heralded as an example for transportation planning through an environmentally sensitive area – the Wekiva River Basin.
– Development of the Wekiva Parkway has included setting aside more than 3,400 acres of land for conservation.
– The parkway also will include numerous wildlife bridges, and will be largely elevated to reduce accidents between vehicles and wildlife.
64

CENTRAL FLORIDA EXPRESSWAY AUTHORITY
WEKIVA – INTERLOCAL AGREEMENT
• Agreement between FDOT and CFX demonstrating strong project coordination between the parties
• Divides project into sections:
– CFX constructing approximately 10 miles of tolled expressway
– FDOT constructing approximately 17 miles of tolled expressway and non-tolled improvements
– Each agency will own, operate, maintain and collect tolls on their respective sections
– Requires CFX to reimburse FDOT for previous LPA advances in the amount of $20 million per year until final repayment in 2024
– Payments from FDOT of $22 million in 2014 and $6.5 million in both 2016 and 2017 for ROW
– Future bond issues will not enjoy LPA pledge
65

CENTRAL FLORIDA EXPRESSWAY AUTHORITY 66
CENTRAL FLORIDA EXPRESSWAY AUTHORITY
2040 Master Plan Update

CENTRAL FLORIDA EXPRESSWAY AUTHORITY
2040 MASTER PLAN UPDATE
• Establish policies for future decisions:
– Existing system improvements
– Revenue / tolling
– System expansion projects
– Multi-modal transportation role
• Data Collection
– Existing System Traffic
– Pavement Condition Report
– Operations
• Traffic Model Preparation
• Business Leaders, Community Groups and Partner Agency Outreach
68

CENTRAL FLORIDA EXPRESSWAY AUTHORITY
SETTING THE VISION
THEN NOW
Orange County
City of Orlando
Orange County
Lake County
Osceola County
Seminole County
City of Orlando
Limited-access expressway system Limited-access expressway system;
multimodal
109 miles 120 miles (with CFX sections of Wekiva Parkway)
Vision: Defines the optimal desired future state - the mental picture - of
what an organization wants to achieve over time.
69

CENTRAL FLORIDA EXPRESSWAY AUTHORITY
2015 / 2016
SCHEDULE
70
Activity Board Workshops
Documentation Draft Report Final Report
Data Collection / Existing System Needs
Community Outreach and Interviews
Expansion Projects & Multi-Modal Options
Traffic & Revenue and Tolling Analysis
Public Meeting
Identify
April May June July Aug Sept Oct Nov Dec Jan Feb Mar
Evaluate
Draft Plan

CENTRAL FLORIDA EXPRESSWAY AUTHORITY
Debt Management
CENTRAL FLORIDA EXPRESSWAY AUTHORITY
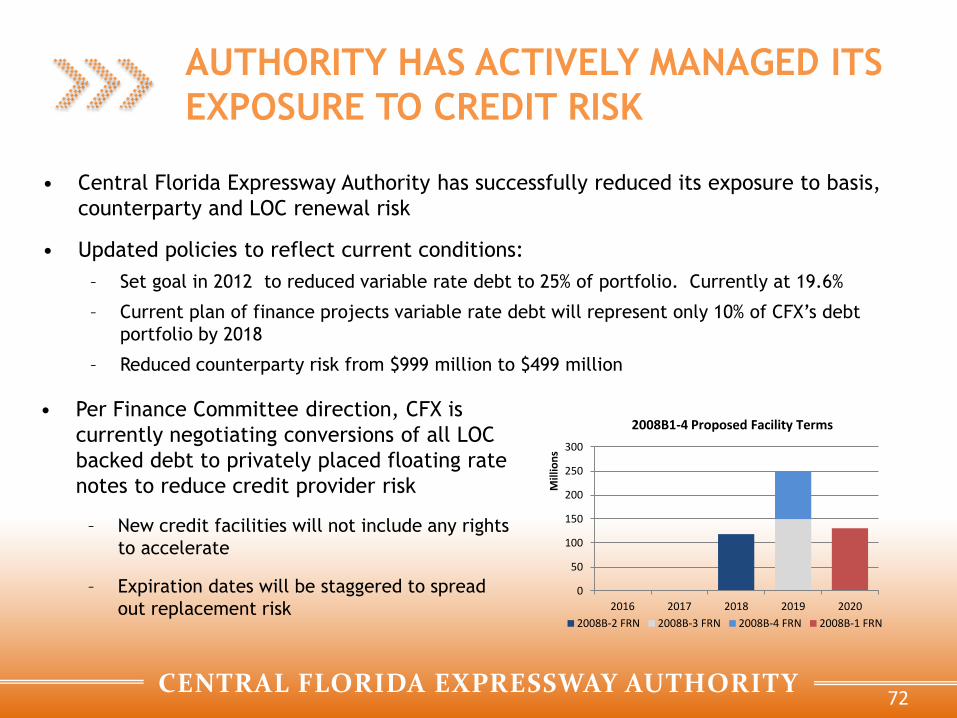
AUTHORITY HAS ACTIVELY MANAGED ITS
EXPOSURE TO CREDIT RISK
• Central Florida Expressway Authority has successfully reduced its exposure to basis,
counterparty and LOC renewal risk
• Updated policies to reflect current conditions:
– Set goal in 2012 to reduced variable rate debt to 25% of portfolio. Currently at 19.6%
– Current plan of finance projects variable rate debt will represent only 10% of CFX’s debt
portfolio by 2018
– Reduced counterparty risk from $999 million to $499 million
72
0
50
100
150
200
250
300
2016 2017 2018 2019 2020
Mill
ion
s
2008B1-4 Proposed Facility Terms
2008B-2 FRN 2008B-3 FRN 2008B-4 FRN 2008B-1 FRN
• Per Finance Committee direction, CFX is
currently negotiating conversions of all LOC
backed debt to privately placed floating rate
notes to reduce credit provider risk
– New credit facilities will not include any rights
to accelerate
– Expiration dates will be staggered to spread
out replacement risk

CENTRAL FLORIDA EXPRESSWAY AUTHORITY
CURRENT SWAP EXPOSURE
73
Snapshot Accrued Interest MTM Value
4/29/2015 ($1,837,288) ($196,985,244)
Bank CounterpartyUBS AG, Stamford
Branch
Citibank, N.A., New
York
Morgan Stanley Capital
Services LLCRoyal Bank of Canada
JPMorgan Chase Bank,
N.A.
Associated
BondsSeries 2008B-1 &
2008B-2
Series 2008B-1 &
2008B-2
Series 2008B-1 &
2008B-2Series 2008B-3 Series 2008B-4
Product Cancellable Swap Swap Swap Swap Swap
Client Pays 4.77530% 4.77530% 4.77530% 4.77530% 4.77530%
Client Receives SIFMA Swap Index SIFMA Swap Index SIFMA Swap Index SIFMA Swap Index SIFMA Swap Index
Trade Date 7/13/2004 7/13/2004 7/13/2004 7/13/2004 7/13/2004
Effective Date 3/1/2005 3/1/2005 3/1/2005 3/1/2005 3/1/2005
Maturity Date 7/1/2040 7/1/2040 7/1/2040 7/1/2040 7/1/2040
MTM Value ($76,392,679) ($60,304,797) ($40,196,816) ($10,045,476) ($10,045,476)
Initial Notional $199,642,000 $149,758,000 $99,821,000 $24,942,000 $24,942,000
Current Notional $199,430,000 $149,598,000 $99,715,000 $24,916,000 $24,916,000
Accrued Interest ($734,915) ($551,280) ($367,458) ($91,817) ($91,817)
Moody's A2 A2 Baa2 Aa3 Aa3
S&P A A A- AA- A+
Fitch A A A AA A+

CENTRAL FLORIDA EXPRESSWAY AUTHORITY
CURRENT OUTSTANDING DEBT
74
Outstanding Principal as of March 30, 2015
Outstanding
PrincipalFinal Maturity Type
Remaining
Coupon
Range/Swap
Rate
Remaining
Average
Coupon /
Swap Rate
LC/Liquidity/
FRN Rate
Fee (1)
Remarketing
FeeNet Rate (2)
Net Interest
Cost at
Issuance
Credit
Enhancement
1990 23,655,000 7/1/2016 Natural Fixed 6.00% - 8.25% 6.66% n/a n/a 6.66% 6.67% FGIC
2007A 425,000,000 7/1/2042 Natural Fixed 4.50% - 5.00% 4.90% n/a n/a 4.90% 4.83% FSA
2010A 334,565,000 7/1/2040 Natural Fixed 4.13% - 5.00% 4.98% n/a n/a 4.98% 4.94% uninsured
2010B 180,895,000 7/1/2029 Natural Fixed 3.50% - 5.00% 4.49% n/a n/a 4.53% 4.39% Assured
2010C 283,610,000 7/1/2040 Natural Fixed 4.00% - 5.00% 4.97% n/a n/a 4.97% 4.91% uninsured
2012 201,925,000 7/1/2025 Natural Fixed 3.00% - 5.00% 4.88% n/a n/a 4.88% 2.53% Assured(3)
2012A (sub) 59,060,000 7/1/2025 Natural Fixed 2.37% - 2.37% 2.37% n/a n/a 2.37% 2.37% uninsured
2013A 242,320,000 7/1/2032 Natural Fixed 5.00% - 5.00% 5.00% n/a n/a 5.00% 4.22% uninsured
2013B 173,775,000 7/1/2025 Natural Fixed 3.00% - 5.00% 4.95% n/a n/a 4.95% 2.62% Assured(4)
2013C 107,125,000 7/1/2032 Natural Fixed 3.60% - 3.60% 3.60% n/a n/a 3.60% 3.60% uninsured
SIB Loan (sub) 4,522,714 10/1/2017 Natural Fixed 1.25% 1.25% n/a n/a 1.25% 1.25% uninsured
2,036,452,714 % of Total Debt 80.33%
2008B-1 130,870,000 7/1/2040 Synthetic Fixed 4.78% 4.78% 0.65% 0.07% 5.50% 4.78% uninsured
2008B-2 118,335,000 7/1/2040 Synthetic Fixed 4.78% 4.78% 0.55% 0.07% 5.40% 4.78% uninsured
2008B-3 149,655,000 7/1/2040 Synthetic Fixed 4.78% 4.78% 0.675% 0.00% 5.45% 4.78% uninsured
2008B-4 99,715,000 7/1/2040 Synthetic Fixed 4.78% 4.78% 0.675% 0.00% 5.45% 4.78% uninsured
498,575,000 % of Total Debt 19.67%
TOTAL 2,535,027,714
(1) Does not include additional fee for interest component or day count method.
(2) Net rate is reflective of coupon and on-going fees only. Net rate does not take into account original issue yields.
(3) Assured insured $57,245,000 of the total bonds for maturities in 2024 and 2025.
(4)Assured insured $49,860,000 of the 2022 through 2025 maturities.
(5) CFX also has a contractual obligation through a lease purchase agreement with FDOT to pay $187 million.
Series
SUBTOTAL
SUBTOTAL
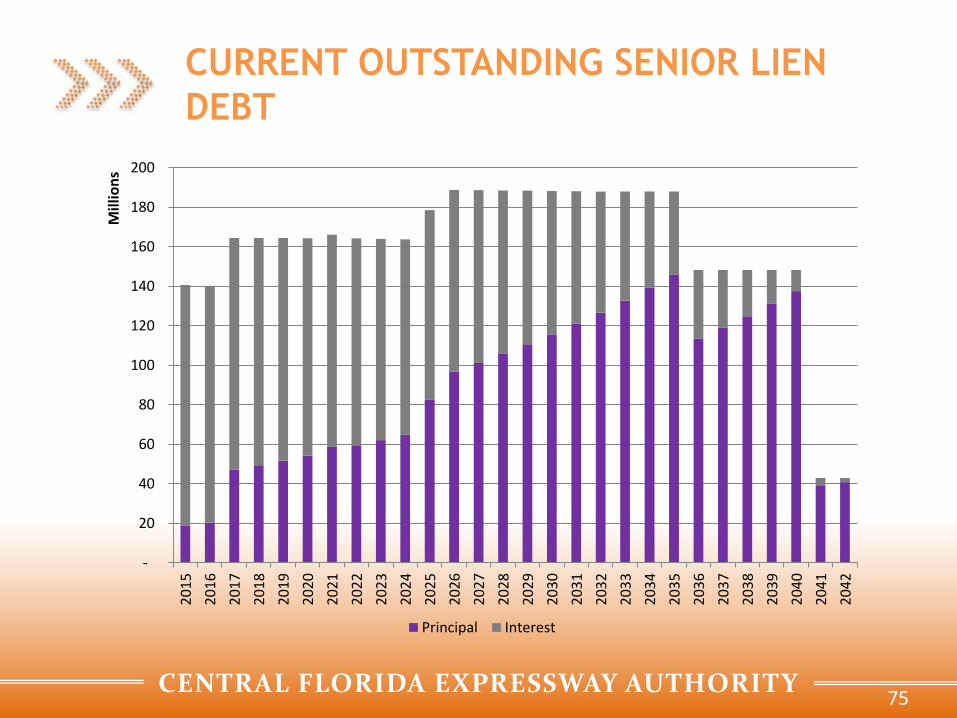
CENTRAL FLORIDA EXPRESSWAY AUTHORITY
CURRENT OUTSTANDING SENIOR LIEN
DEBT
75
-
20
40
60
80
100
120
140
160
180
2002
01
5
20
16
20
17
20
18
20
19
20
20
20
21
20
22
20
23
20
24
20
25
20
26
20
27
20
28
20
29
20
30
20
31
20
32
20
33
20
34
20
35
20
36
20
37
20
38
20
39
20
40
20
41
20
42
Mill
ion
s
Principal Interest

CENTRAL FLORIDA EXPRESSWAY AUTHORITY
Plan of Finance

CENTRAL FLORIDA EXPRESSWAY AUTHORITY
PLAN OF FINANCE
• CFX plans to fund its portions of the Wekiva Parkway along with the SR 408/I-4
Ultimate project through the issuance of $216 million senior lien revenue bonds
and a $193.6 million junior (2nd) lien TIFIA loan
– Senior lien BANs expected to be issued in July 2015 to fund $154 MM of project costs which
will be taken out in FY 2019 with the proceeds from a junior lien TIFIA loan
– Additional project costs will be funded by a FY 2017 senior lien bond issuance of $49
million and a FY 2019 senior lien bond issuance of $172 million.
– CFX will fund $307 million of Wekiva project costs from Pay-Go cash
• Senior lien coverage ratio is projected to be at or above 1.60x in all years and
second lien coverage is projected to be at or above 1.55x
• Reserve for Debt Management of $160 million
77
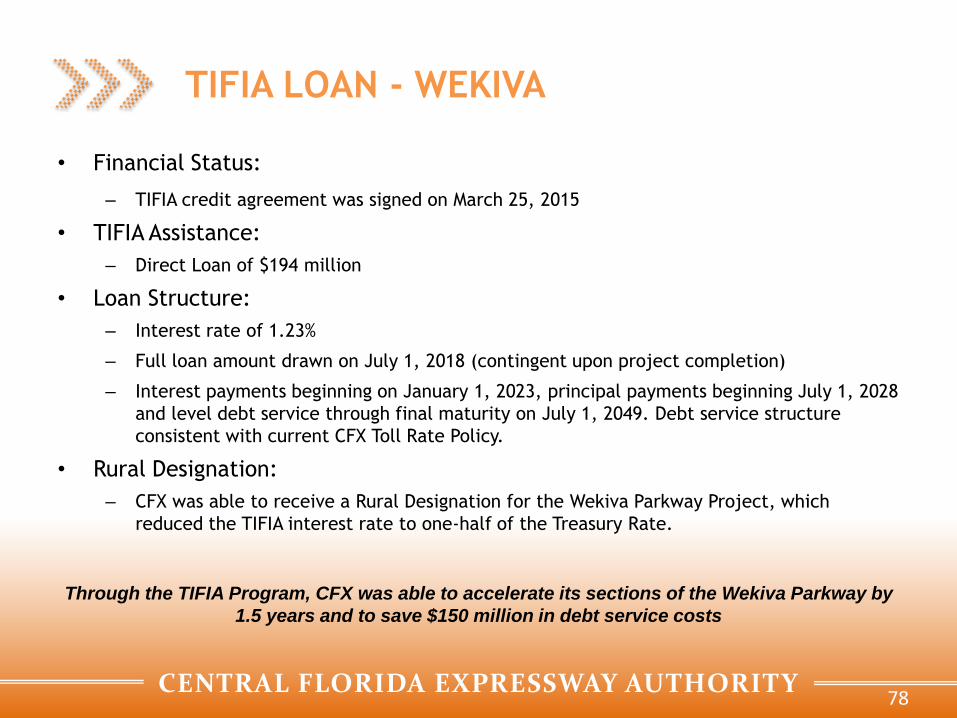
CENTRAL FLORIDA EXPRESSWAY AUTHORITY
TIFIA LOAN - WEKIVA
• Financial Status:
– TIFIA credit agreement was signed on March 25, 2015
• TIFIA Assistance:
– Direct Loan of $194 million
• Loan Structure:
– Interest rate of 1.23%
– Full loan amount drawn on July 1, 2018 (contingent upon project completion)
– Interest payments beginning on January 1, 2023, principal payments beginning July 1, 2028
and level debt service through final maturity on July 1, 2049. Debt service structure
consistent with current CFX Toll Rate Policy.
• Rural Designation:
– CFX was able to receive a Rural Designation for the Wekiva Parkway Project, which
reduced the TIFIA interest rate to one-half of the Treasury Rate.
Through the TIFIA Program, CFX was able to accelerate its sections of the Wekiva Parkway by
1.5 years and to save $150 million in debt service costs
78
CENTRAL FLORIDA EXPRESSWAY AUTHORITY
BOND ANTICIPATION NOTES
• Bond Anticipation Notes will be issued to provide interim financing prior to
TIFIA Loan draw in July 2018
• Series 2015 BANs will be secured by senior lien on system revenues
– Anticipated take out by TIFIA loan on or before maturity date
– Ability to issue traditional senior lien notes or bonds if delay
• BANs Structure:
– Estimated Par Amount: $193.6 million
– Single Maturity on January 1, 2019
– Callable without penalty on July 1, 2018
– Capitalized interest thru maturity
– Fully funded DSRF
• Sized to MADS on TIFIA loan
• Anticipated to transfer to TIFIA loan at takeout
79

CENTRAL FLORIDA EXPRESSWAY AUTHORITY
COVERAGE RATIOS REMAIN STRONG
• Senior Lien Planning Coverage Ratio target of 1.60x
• Senior Lien Policy Ratio is 1.45x
• Junior Lien Planning Coverage Ratio target of 1.50x
• CFX bond covenants require coverage of 1.20x
80
Debt Service and Debt Service Coverage Ratio
in $ thousands 2015 2016 2017 2018 2019 2020 2021 2022 2023 2024 2025 2026 2027
Existing System Revenues (CDMSmith FY2014 T&E April 2015) 338,000 345,800 356,000 389,400 400,500 410,600 420,600 439,500 471,700 483,500 495,300 507,100 518,900
Pledged Revenues 283,848 282,350 290,868 316,151 324,709 331,573 338,205 353,615 382,151 390,265 398,321 406,296 414,115
Net Debt Service 142,086 143,308 172,376 172,376 184,774 184,706 186,373 187,218 186,979 186,705 201,426 211,582 210,984
Net Senior Lien Debt Service 140,281 139,797 167,427 167,432 179,838 179,767 181,458 182,316 182,091 181,819 196,569 206,735 206,643
Net Second Lien Debt Service (SIB & TIFIA) 10,188 2,513 1,031 1,075 - - - - 2,501 2,501 11,187 2,501 2,501
General Reserve Fund Obligations 1,400 1,400 6,645 6,890 7,147 7,415 5,703 7,738 8,042 8,350 - - -
LPA Payments 20,000 20,000 20,000 20,000 20,000 20,000 20,000 20,000 20,000 7,000 - - -
Total Aggregate Debt Service 174,047 167,220 200,052 200,341 211,921 212,121 212,076 214,956 217,522 204,555 212,613 214,083 213,485
Resolution Coverage Ratio - Senior 2.02 2.02 1.74 1.89 1.81 1.84 1.86 1.94 2.10 2.15 2.03 1.97 2.00
Junior Lien Coverage Including TIFIA 1.86 1.93 1.67 1.82 1.75 1.79 1.81 1.88 2.01 2.06 1.95 1.89 1.94
Total Debt Service Coverage Ratio (Incl. LPA) 1.63 1.69 1.45 1.58 1.53 1.56 1.59 1.65 1.76 1.91 1.87 1.90 1.94
in $ thousands 2028 2029 2030 2031 2032 2033 2034 2035 2036 2037 2038 2039 2040
Existing System Revenues (CDMSmith FY2014 T&E April 2015) 548,000 559,800 571,400 583,100 594,800 622,400 633,100 643,700 654,400 665,000 692,300 703,700 714,900
Pledged Revenues 439,074 446,586 453,724 460,779 467,642 490,207 495,694 500,861 505,899 510,676 531,903 537,002 541,631
Net Debt Service 210,368 209,639 209,303 208,943 208,582 208,377 208,138 207,879 167,926 167,676 167,379 167,066 166,737
Net Senior Lien Debt Service 206,550 206,413 206,275 206,122 205,973 206,005 206,007 206,002 166,313 166,349 166,348 166,347 166,345
Net Second Lien Debt Service (SIB & TIFIA) 10,605 10,605 10,605 10,605 10,605 10,605 10,605 10,605 10,605 10,605 10,605 10,605 10,605
General Reserve Fund Obligations - - - - - - - - - - - - -
LPA Payments - - - - - - - - - - - - -
Total Aggregate Debt Service 221,491 220,761 220,425 220,064 219,703 219,498 219,258 218,999 179,046 178,756 178,458 178,145 177,816
Resolution Coverage Ratio - Senior 2.13 2.16 2.20 2.24 2.27 2.38 2.41 2.43 3.04 3.07 3.20 3.23 3.26
Junior Lien Coverage Including TIFIA 1.98 2.02 2.06 2.09 2.13 2.23 2.26 2.29 2.83 2.86 2.98 3.01 3.05
Total Debt Service Coverage Ratio (Incl. LPA) 1.98 2.02 2.06 2.09 2.13 2.23 2.26 2.29 2.83 2.86 2.98 3.01 3.05

CENTRAL FLORIDA EXPRESSWAY AUTHORITY
CURRENT WORK PLAN DEBT SERVICE
81
-
100
200
300
400
500
600
700
800
900
20
15
20
16
20
17
20
18
20
19
20
20
20
21
20
22
20
23
20
24
20
25
20
26
20
27
20
28
20
29
20
30
20
31
20
32
20
33
20
34
20
35
20
36
20
37
20
38
20
39
20
40
20
41
20
42
20
43
20
44
20
45
20
46
20
47
20
48
20
49
Mill
ion
s
Senior Lien Debt Service Proposed Series 2016 Proposed Series 2018
Proposed Series 2021 Junior Lien TIFIA Loan Available System RevenuesCDMSmith FY2014 T&E April 2015

CENTRAL FLORIDA EXPRESSWAY AUTHORITY
Summary
CENTRAL FLORIDA EXPRESSWAY AUTHORITY
CENTRAL FLORIDA EXPRESSWAY
AUTHORITY KEY CREDIT DRIVERS • Strong economic base with increased tourism and theme park expansions; service area continues
to diversify with growth in healthcare and education
– Orange County Tourist Development Tax Revenue Bonds rated: AA- / A1 / A+
– Orange County Sales Tax Revenue Bonds rated: AA+ / Aa2 / AA
• Central Florida Expressway Authority’s management of the system and toll rates, together with a
vibrant regional economy, has produced 20 years of revenue growth even through national
recessions
• Excellent condition of the System; Conservative approach towards defining work program;
Competitive toll rates, indexed to inflation, with limited competition; Low cost of toll collections
• Significantly reduced swap exposure & Letter of Credit renewal risk
• Total projected additional senior lien revenue bonds issuance has been reduced due to savings
from the approval of a subordinate TIFIA loan of $193.6 million with no “springing lien”
• Strong debt service coverage and liquidity position provides significant bondholder protections
– As of 7-1-2018, Central Florida Expressway Authority forecasts combined reserve (senior lien DSRF, TIFIA
reserve, debt management reserve and general reserve) balances of $359 million
83