central wakefield strategic flood risk assessment
TRANSCRIPT

City of Wakefield Metropolitan
District Council
Central Wakefield Area
Action Plan
Strategic Flood Risk Assessment
January 2009
FINAL REPORT
JBA Consulting The Brew House Wilderspool Park Greenhall's Avenue WARRINGTON WA4 6HL UK t: +44 (0)1925 437 020 f: +44 (0)1925 437 029 www.jbaconsulting.co.uk
City of Wakefield MDC Newton Bar Leeds Road
Wakefield West Yorkshire
WF1 2TX United Kingdom
City of Wakefield Metropolitan District Council Central Wakefield Area Action Plan Strategic Flood Risk Assessment
JBA Consulting www.jbaconsulting.co.uk N:\2008\Projects\2008s3024 - City Of Wakefield Metropolitan District Council - Wakefield Town Centre Regeneration Strategic Flood Risk Assessment\Reports\Final Report Jan 2009\CWAAP SFRA Report v1_6_Final.doc: 28/01/2009 i
REVISION HISTORY
Revision Ref./ Date Issued
Amendments Issued to
Report Stage - Final Date of Report 16 May 2008
10 Hard copy to Martyn Clay 1 as PDF, and 1 CD
Report Stage - Final Date of Report 28 Jan 2009
Inclusion of comments from Sam Kipling (EA) 12.11.08
Digital copy to Martyn Clay & Sam Kipling
CONTRACT
This report describes work commissioned by Wakefield District Council by letter on 19 December 2007. Wakefield District Council’s representative for the contract was Martyn Clay. Jonathan Cooper and Christopher Isherwood of JBA Consulting carried out the work. Prepared by: .......................................Christopher Isherwood, BSc DipWEM Analyst Reviewed by: .......................................Jonathan Cooper, BEng MSc CEng MICE MICWEM MIoD Divisional Manager Approved by: .................................... Jonathan Cooper, BEng MSc CEng MICE MICWEM MIoD Divisional Manager PURPOSE
This document has been prepared solely as a Report for Wakefield District Council to support the Central Area Action Plan. JBA Consulting accepts no responsibility or liability for any use that is made of this document other than by the Client for the purposes for which it was originally commissioned and prepared. ACKNOWLEDGMENTS
The provision of EA data on flood risk arising from the JBA’s NE Broadscale modelling project was instrumental in the initial assessment, and provision of the current ISIS model for central Wakefield allowed more detailed assessments to be undertaken. Andrew Newton, Gary Cliff and Sam Kipling of the EA were extremely helpful.

City of Wakefield Metropolitan District Council Central Wakefield Area Action Plan Strategic Flood Risk Assessment
JBA Consulting www.jbaconsulting.co.uk N:\2008\Projects\2008s3024 - City Of Wakefield Metropolitan District Council - Wakefield Town Centre Regeneration Strategic Flood Risk Assessment\Reports\Final Report Jan 2009\CWAAP SFRA Report v1_6_Final.doc: 28/01/2009 ii
This page is intentionally left blank.
City of Wakefield Metropolitan District Council Central Wakefield Area Action Plan Strategic Flood Risk Assessment
JBA Consulting www.jbaconsulting.co.uk N:\2008\Projects\2008s3024 - City Of Wakefield Metropolitan District Council - Wakefield Town Centre Regeneration Strategic Flood Risk Assessment\Reports\Final Report Jan 2009\CWAAP SFRA Report v1_6_Final.doc: 28/01/2009 iii
EXECUTIVE SUMMARY
Flood risk in central Wakefield is a complicated issue and arises from many potential sources. It is, rightly, a constraint to development, but development could be integrated into the flood risk management options for this area. Great care needs to be taken over the type and form of new development in these flood risk areas. Whilst the PPS25 flood zone maps produced in the Calder Valley Level 1 SFRA cover the majority of the urban area, the spatial distribution of risk is very different in each flood cell.
The River Calder and Ings Beck provide the greatest risk to central Wakefield, whilst surface water flooding also has the potential to be significant in the area. The potential for surface water flooding is due to both Ings Beck being heavily culverted and a number of important flow routes into the central Wakefield area from surrounding urban areas.
The River Calder and Ings Beck are defended. The River Calder to a 1 in 100 year standard and a varying standard along Ings Beck. Whereas continued works will provide a uniform standard of protection (SoP) of 1 in 100 years across central Wakefield; residual risks are still present. These risks are linked to the exceedence or failure of the current flood risk management measures, such as the Wakefield flood defence scheme, during lower probability events.
The Calder Valley Level 1 Strategic Flood Risk Assessment, published in November 2008, provided the detail for Wakefield District Council to apply the Sequential Test to its development allocations as set out in PPS25. However it did not provide the understanding and the level of detail required to carry out the Exceptions Test.
This document was therefore produced as an extension to the Level 1 SFRA to gain a greater understanding of the flood mechanisms in central Wakefield. This will provide the evidence base needed to carry out the Exceptions Test on Five Special Policy Areas and to support the Central Wakefield Area Action Plan.
In order to achieve this, a detailed 1D-2D modelling of the River Calder and central Wakefield was developed to assess the residual risks. Two main scenarios investigated included defence overtopping during the extreme 1000 year event and the possibility of defence gates being left open or failing during the 100 year event.
A suite of indicators were adopted that allowed for a holistic overview of the constraints to development in the central Wakefield area, and how flood risk could be integrated into the regeneration of central Wakefield. In some circumstances higher vulnerable land uses, such as residential development is not preferred sequentially and is recommended to be replaced with a lower vulnerability use.
The main findings of the investigation with reference to each Special Policy Area included:
The Waterfront Special Policy Area – The Waterfront area has been sub-divided into seven policy areas however there are two very different areas vulnerable to flood risk. The area south of the canal is mainly at risk during the 1000 year event. Whilst the area is constrained by the canal to the north and higher ground to the south, flood depths do not reach over 0.6m, however, the high ground also provides excellent access and egress routes. To the north of the canal flood risk is very different. Flood depths have the potential to reach over 1.5m. This is mainly due to the low lying topography of the area as well as overtopping water pooling behind the defences. Development throughout both areas will have to be carefully planned, taking a sequential approach to site layout, improving the defences already present as well as allowing crucial flow paths to remain. Residential development is not recommended to be included in any future development brief to replace existing uses in the area to the north of the canal.
Ings Road Special Policy Area – Ings Road, whilst at low risk of fluvial flooding from the River Calder, is mainly at risk from surface water flooding. Ings Beck is heavily culverted throughout its reach into central Wakefield. Any surface water flooding which occurs further upstream will find it difficult to
City of Wakefield Metropolitan District Council Central Wakefield Area Action Plan Strategic Flood Risk Assessment
JBA Consulting www.jbaconsulting.co.uk N:\2008\Projects\2008s3024 - City Of Wakefield Metropolitan District Council - Wakefield Town Centre Regeneration Strategic Flood Risk Assessment\Reports\Final Report Jan 2009\CWAAP SFRA Report v1_6_Final.doc: 28/01/2009 iv
enter into the channel if the Beck reaches its capacity and surface water drains become exceeded. Flow routes occur along Ings Road and the Trading Estate causing wide spread ponding and deep water flooding of over 0.5m. Only part of the area is affected and flood depths are modest. A mix of uses is appropriate.
Thornes Wharf Special Policy Area – Flood risk in the Thornes area is a complex. The area is currently defended to a 100 year standard, however there are a number of defence gates which could fail or be left open during times of flood, resulting in flood depths of over 1.5m in some areas. The flood defences also overtop in the extreme 1000 year event again with depths reaching over 1.5m but this deeper flooding is more wide spread.
Flooding in this area is also exacerbated by the presence of flood waters entering the area from further upstream where a washland exceeds its capacity and floods the housing estate to the north. Flood waters also become trapped behind defences and the railway viaduct, causing increased depths. The limited access and egress routes and their potential to become flooded increases the vulnerability to the people living or working in this area.
The risk of flooding in this area will be too great for residential development. Carefully planned comprehensive development could reduce risk to the housing estate to the west, however the flood risk in both areas are connected by an important flow route through Thornes Lane. Sequentially the flood risks are such that only low vulnerability land uses should be proposed.
Kirgate Special Policy Area - Whilst the area of Kirkgate is only partly within the Environment Agency Flood Maps, the greatest risk of flooding comes from surface water. Major flow routes down Kirkgate, Marsh Way and Brunswick Street collect at the roundabout outside the Government Offices and could potentially cause flood depths of over 0.5m.
As the main roads surrounding the site are at flood risk themselves, minor roads to the north of Ings Road, will be required for access and egress routes.
Calder Vale Special Policy Area – The majority of this area is defended to a 100 year standard, however low flood banks downstream of Stennard Island places Calder Vale at risk of flooding in the extreme 1000 year event. The majority of flood depths throughout the site are below 1.5m however, depths reach over 2m around Stennard Island as flooding become trapped behind the defences.
Calder Vale has also only one main road in and out of the area increasing the vulnerability of the people working in the area to flood risk. No increase in the vulnerability of development is recommended.
City of Wakefield Metropolitan District Council Central Wakefield Area Action Plan Strategic Flood Risk Assessment
JBA Consulting www.jbaconsulting.co.uk N:\2008\Projects\2008s3024 - City Of Wakefield Metropolitan District Council - Wakefield Town Centre Regeneration Strategic Flood Risk Assessment\Reports\Final Report Jan 2009\CWAAP SFRA Report v1_6_Final.doc: 28/01/2009 v
This page is intentionally left blank.
City of Wakefield Metropolitan District Council Central Wakefield Area Action Plan Strategic Flood Risk Assessment
JBA Consulting www.jbaconsulting.co.uk N:\2008\Projects\2008s3024 - City Of Wakefield Metropolitan District Council - Wakefield Town Centre Regeneration Strategic Flood Risk Assessment\Reports\Final Report Jan 2009\CWAAP SFRA Report v1_6_Final.doc: 28/01/2009 vi
CONTENTS
Page REVISION HISTORY i CONTRACT i PURPOSE i ACKNOWLEDGEMENTS i EXECUTIVE SUMMARY iii CONTENTS vi
1� INTRODUCTION ---------------------------------------------------------------------------------- 1�1.1� Purpose and Scope of the Study .................................................................................................. 1�1.2� Flood Risk in Central Wakefield – An Overview .......................................................................... 2�1.3� Sequential Approach ...................................................................................................................... 3�
2� CURRENT AND RESIDUAL RISK IN CENTRAL WAKEFIELD ---------------------------------------- 5�2.1� Current Risk ........................................................................................................................................ 5�2.2� Residual Risk ....................................................................................................................................... 5�
3� FLOOD RISK DATA AND ITS ASSESSMENT ------------------------------------------------------- 8�3.1� Risk Data ............................................................................................................................................. 8�3.2� EA ISIS hydraulic model used in Wakefield FAS .......................................................................... 8�3.3� 1D – 2D (ISIS-TUFLOW) Linked Flood Modelling ......................................................................... 10�3.4� ISIS-TUFLOW Results for Central Wakefield ................................................................................. 12�3.5� Residual Risk on Ings Beck ............................................................................................................. 14�3.6� Surface Water ................................................................................................................................. 14�
4� SUMMARY OF FLOOD RISK IN CENTRAL WAKEFIELD POLICY AREAS ------------------------ 17�4.1� Flood Risk .......................................................................................................................................... 17�4.2� Waterfront Special Policy Area .................................................................................................... 17�4.3� Ings Road Special Policy Area ..................................................................................................... 17�4.4� Thornes Wharf Special Policy Area.............................................................................................. 18�4.5� Kirkgate Special Policy Area ........................................................................................................ 19�4.6� Calder Vale Special Policy Area ................................................................................................. 19�
5� FLOOD MANAGEMENT OPTIONS AND LAND USE -------------------------------------------- 20�5.1� Exception Testing ............................................................................................................................ 20�
6� FRA RECOMENDATIONS ----------------------------------------------------------------------- 25�6.1� Introduction ..................................................................................................................................... 25�6.2� Assessment of Fluvial Risk .............................................................................................................. 25�6.3� Surface Water Assessments .......................................................................................................... 26�6.4� Emergency Planning ...................................................................................................................... 26�
7� CONCLUSION ---------------------------------------------------------------------------------- 28�7.1� Conclusion ....................................................................................................................................... 28�
FIGURES
City of Wakefield Metropolitan District Council Central Wakefield Area Action Plan Strategic Flood Risk Assessment
JBA Consulting www.jbaconsulting.co.uk N:\2008\Projects\2008s3024 - City Of Wakefield Metropolitan District Council - Wakefield Town Centre Regeneration Strategic Flood Risk Assessment\Reports\Final Report Jan 2009\CWAAP SFRA Report v1_6_Final.doc: 28/01/2009 vii
LIST OF FIGURES
Figure 1-1: CWAAP Special Policy Areas and EA Flood Zones ...................................................................... 2�
Figure 2-1: Flood Defence Locations in Central Wakefield ........................................................................... 6�
Figure 3-1: 1D–2D Linked Hydraulic Model Configuration ........................................................................... 10�
Figure 3-2: Wakefield TUFLOW Edited DEM ..................................................................................................... 11�
Figure 3-3: TUFLOW Q100 Flood Depths & Possible Gate Failure (See back of report) .......................... 12�
Figure 3-4: TUFLOW Q1000 Flood Depths without Freeboard (See back of report) ................................ 13�
Figure 3-5: Residual Risk on Ings Beck (See back of report) ........................................................................ 14�
Figure 3-6a: Surface Modelling Output for North West Central Wakefield (See back of report)......... 15�
Figure 3-6b: Surface Modelling Output for North West Central Wakefield (See back of report) ........15
LIST OF TABLES
Table 2-1: Flood Defence Components in Central Wakefield ...................................................................... 7�
Table 3-1: Flood Peak Flows (m3/s) for a Range of Return Periods in Wakefield ...................................... 9�
Table 3-2: Peak Water Levels (mAOD) in Central Wakefield from updated Environment Agency ISIS
1D hydraulic model ............................................................................................................................................... 9�
Table 5-1: Sequential approach to proposed land use and strategy for flood risk management ..... 22�
Table 5-2: Key to scoring system used in review of acceptability .............................................................. 24�
ABBREVIATIONS AAP Area Action Plan CWAAP Central Wakefield Area Action Plan COWS Critical Ordinary Watercourses IDD Internal Drainage Districts LDF Local Development Framework LPA Local Planning Authority PPS25 Planning Policy Statement 25 SFRA Strategic Flood Risk Assessment SoP Standard of Protection
City of Wakefield Metropolitan District Council Central Wakefield Area Action Plan Strategic Flood Risk Assessment
JBA Consulting www.jbaconsulting.co.uk N:\2008\Projects\2008s3024 - City Of Wakefield Metropolitan District Council - Wakefield Town Centre Regeneration Strategic Flood Risk Assessment\Reports\Final Report Jan 2009\CWAAP SFRA Report v1_6_Final.doc: 28/01/2009 1
1 INTRODUCTION
1.1 Purpose and Scope of the Study
The purpose of this investigation is to provide a spatial assessment of flood risk within central Wakefield, to develop on the detail included in the Level 1 Strategic Flood Risk Assessment (SFRA) for the Calder Valley1 and to provide the required information to support the Central Wakefield Area Action Plan (CWAAP). Together these sources will assist the Local Development Framework (LDF) and the policies and proposals produced for the development and use of land within central Wakefield.
The Council’s objectives for central Wakefield is to create an area that is at the economic heart of the Wakefield District, bringing regeneration to, and enhancing the quality of life of, existing communities. Central Wakefield will be the focal point for new investment and employment, leisure and tourism development. In addition, promoting and celebrating urban living by providing new sustainable residential communities.
All new development will be urban in form with a strong mix of uses, high levels of connectivity, high quality and high density development forms that capitalise on public transport opportunities and offer a rich and active public realm.
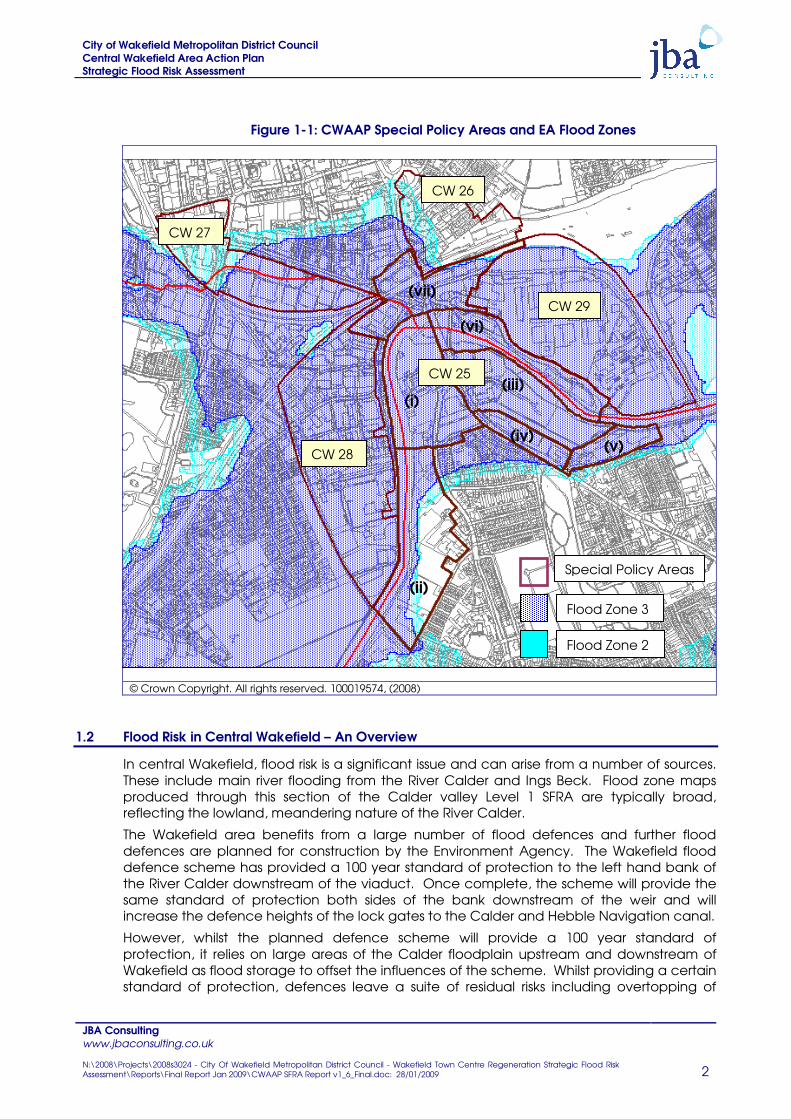
Due to the geographic location of central Wakefield along the River Calder, there are a number of opportunities and constraints which will influence the type and location of development, one of which is flood risk. The CWAAP includes five Special Policy Areas that fall with Flood Zone 2 and 3 outlined in Figure 1-1, which are the focus for this investigation. These include:
1. CW 25 – The Waterfront (sub-divided into)
I. The Waterfront Core Area
II. South of Wakefield Lock
III. Evans Halshaw Site / Fall Ings
IV. Doncaster Road
V. South of Fall Ings
VI. Stennard Island
VII. North of Chantry Road Bridge
2. CW 26 – Kirkgate
3. CW 27 – South of Ings Road
4. CW 28 – Thornes Whalf
5. CW 29 – Calder Vale
This strategic assessment applies the sequential approach from PPS25 to demonstrate how appropriate land uses can be delivered in the policy areas of Central Wakefield. It provides the background data for both the Sequential Test and Exception Test. These have been applied by City of Wakefield spatial planners and written up separately.
1 The Calder Valley SFRA update to PPS25 published in November 2008.
City of Wakefield Metropolitan District Council Central Wakefield Area Action Plan Strategic Flood Risk Assessment
JBA Consulting www.jbaconsulting.co.uk N:\2008\Projects\2008s3024 - City Of Wakefield Metropolitan District Council - Wakefield Town Centre Regeneration Strategic Flood Risk Assessment\Reports\Final Report Jan 2009\CWAAP SFRA Report v1_6_Final.doc: 28/01/2009 2
Figure 1-1: CWAAP Special Policy Areas and EA Flood Zones
© Crown Copyright. All rights reserved. 100019574, (2008)
1.2 Flood Risk in Central Wakefield – An Overview
In central Wakefield, flood risk is a significant issue and can arise from a number of sources. These include main river flooding from the River Calder and Ings Beck. Flood zone maps produced through this section of the Calder valley Level 1 SFRA are typically broad, reflecting the lowland, meandering nature of the River Calder.
The Wakefield area benefits from a large number of flood defences and further flood defences are planned for construction by the Environment Agency. The Wakefield flood defence scheme has provided a 100 year standard of protection to the left hand bank of the River Calder downstream of the viaduct. Once complete, the scheme will provide the same standard of protection both sides of the bank downstream of the weir and will increase the defence heights of the lock gates to the Calder and Hebble Navigation canal.
However, whilst the planned defence scheme will provide a 100 year standard of protection, it relies on large areas of the Calder floodplain upstream and downstream of Wakefield as flood storage to offset the influences of the scheme. Whilst providing a certain standard of protection, defences leave a suite of residual risks including overtopping of
Special Policy Areas
Flood Zone 3
Flood Zone 2
CW 27
CW 26
CW 28
CW 29
(i)
(ii)
(iv) (v)
(iii)
(vi)
(vii)
CW 25
City of Wakefield Metropolitan District Council Central Wakefield Area Action Plan Strategic Flood Risk Assessment
JBA Consulting www.jbaconsulting.co.uk N:\2008\Projects\2008s3024 - City Of Wakefield Metropolitan District Council - Wakefield Town Centre Regeneration Strategic Flood Risk Assessment\Reports\Final Report Jan 2009\CWAAP SFRA Report v1_6_Final.doc: 28/01/2009 3
defences or failure of the flood gates or exceedance of culvert capacities. These should be considered in any flood risk assessment, and are critically important in spatial planning over the long term.
In addition to main river flooding, local surface water runoff from surrounding rural/greenfield and urban areas can become trapped behind defences, pool in low lying areas, or as a result of pumping station failure can produce additional sources of flooding. The topography of the Ings Beck catchment also lends itself to significant flood risks, as surface water that does not discharge into Ings Beck, can travel some distance into central Wakefield.
Whilst the flood zone maps show the centre of Wakefield potentially at risk, the scale, type and spatial variation of these risks are evidently very different. The priority of this investigation is therefore to take a step forward from the Level 1 SFRA and the assessments of Environment Agency Flood Maps and investigate the different sources of flooding in central Wakefield, identifying the risks they pose and the impacts they have on the spatial development of central Wakefield. This then allows a sequential match of flood risk and vulnerability of the intended land use to be prepared.
1.3 Sequential Approach
Planning Policy Statement 25: Development and Flood Risk2 sets out the desired approach of avoidance of development in flood risk areas. If on grounds of wider sustainable development, in what has tended to be historic or industrial areas adjacent to the rivers, PPS25 guides any new investment to have the lowest flood vulnerable land use and as a means of last resort to include mitigation measures within or around that development.
It is rare that this choice is straightforward and the Environment Agency Flood Map is too simplistic when considering the regeneration within existing flood risk areas. A greater understanding of the scale and nature of the flood risks are required. To help achieve this, more detailed modelling of a range of extreme storm events and failure of flood management operational features has been undertaken (discussed in Section 3).
The ability to manage flood risk for new development must consider a wide range of issues, which includes how any evacuation of the occupants would be handled, how the new development fits in with the existing flood management provision and, should there be an event, how quickly the wider area would recover and return to normal. Some areas, either through natural or artificial topography, are easier to integrate flood management measures into the new development, without causing a significant alteration in its design and its place setting. These measures can have the potential to cause an alteration to the flood risk to adjacent property or in flood cells on the opposite bank.
The application of the Sequential Test is primarily concerned with avoidance by finding alternative sites. However, it is clear that many existing uses remain at flood risk in central Wakefield, and the area is in need of appropriate schemes of regeneration. The majority of the proposed AAP is in Flood 2 or 3, and the appropriate uses planned are either permitted under PPS25 or require further testing via the Exception Test. Therefore avoidance of the flood risk by relocation of development to lower risk sites is not practicable and has been considered in the CWAAP Sequential Test. This strategic assessment has started on the basis that the planning justification is sound and that designing an appropriate mix of development is critical.
Whilst the Exception Test process makes it possible to strategically plan the type and form of the development in the CWAAP, it must not been seen as an opportunity to place
2 Communities and Local Government. 2006 Planning Policy Statement 25: Development and Flood Risk. December 2006. pg7. http://www.communities.gov.uk/pub/955/PlanningPolicyStatement25DevelopmentandFloodRisk_id1504955.pdf
City of Wakefield Metropolitan District Council Central Wakefield Area Action Plan Strategic Flood Risk Assessment
JBA Consulting www.jbaconsulting.co.uk N:\2008\Projects\2008s3024 - City Of Wakefield Metropolitan District Council - Wakefield Town Centre Regeneration Strategic Flood Risk Assessment\Reports\Final Report Jan 2009\CWAAP SFRA Report v1_6_Final.doc: 28/01/2009 4
inappropriate development in flood risk areas. It is a useful planning tool that can justify the acceptability of the residual risks remaining after the mitigation measures have been applied. It is an important evidence base upon which to rely in order to justify where sequentially preferable land uses should be located. This strategic assessment takes a holistic approach to the long term challenges of integrating flood risk management and land use planning. The sequential approach looks at a broader set of flood risk indicators and supports policies and land uses that is intended to resist piecemeal development in flood risk areas. The latter pattern of development inevitably compromises the successful delivery of a managed flood risk regime in central Wakefield, and would be increasingly difficult to satisfy the Environment Agency and the LPA.
City of Wakefield Metropolitan District Council Central Wakefield Area Action Plan Strategic Flood Risk Assessment
JBA Consulting www.jbaconsulting.co.uk N:\2008\Projects\2008s3024 - City Of Wakefield Metropolitan District Council - Wakefield Town Centre Regeneration Strategic Flood Risk Assessment\Reports\Final Report Jan 2009\CWAAP SFRA Report v1_6_Final.doc: 28/01/2009 5
2 CURRENT AND RESIDUAL RISK IN CENTRAL WAKEFIELD
2.1 Current Risk
As discussed in Section 1.2 central Wakefield is currently at flood risk from a number of sources identified with the Calder Valley Level 1 SFRA, which include river flooding and surface water flooding.
Flood zone maps produced in the Level 1 SFRA show that the majority of central Wakefield is at risk from fluvial flooding. Due to the low lying nature of its floodplain, Flood Zone 2 and 3 are constrained by topography producing similar wide outlines. Whilst these outlines show central Wakefield to be at risk, central Wakefield also benefits from a large number of flood defences. These consist of main flood embankments along the River Calder and culverts along Ings Beck as well as raised flood banks or walls on Ings Beck and at the rear of the washlands on the River Calder. When complete, the scheme will deliver a standard of protection of 100 year (1% AEP) along the River Calder and Ings Beck.
2.2 Residual Risk
Residual risks are the risks that remain after all risk avoidance, substitution and mitigation measures have been taken. The residual risks in central Wakefield are therefore related to the occurrence of events of low probability, such as extreme flood events greater than the design capacity of the constrained river system or failure of these flood defences.
In the case of central Wakefield, the quality of the new river defences is high and the probability of flooding is low. However the consequences of flooding are very large. The topography of the land behind defences, flow routes, land use and access and egress are all key factors in identifying these higher flood risk areas. Areas directly adjacent to the defences can be subject to high flow velocities should the defence overtop or fail, known as rapid inundation zones, whilst low lying areas further away from the defences are at risk from the sheer depth of flooding. Residual risks were introduced and discussed in greater detail within the Calder Valley Level 1 SFRA (See Section 7)
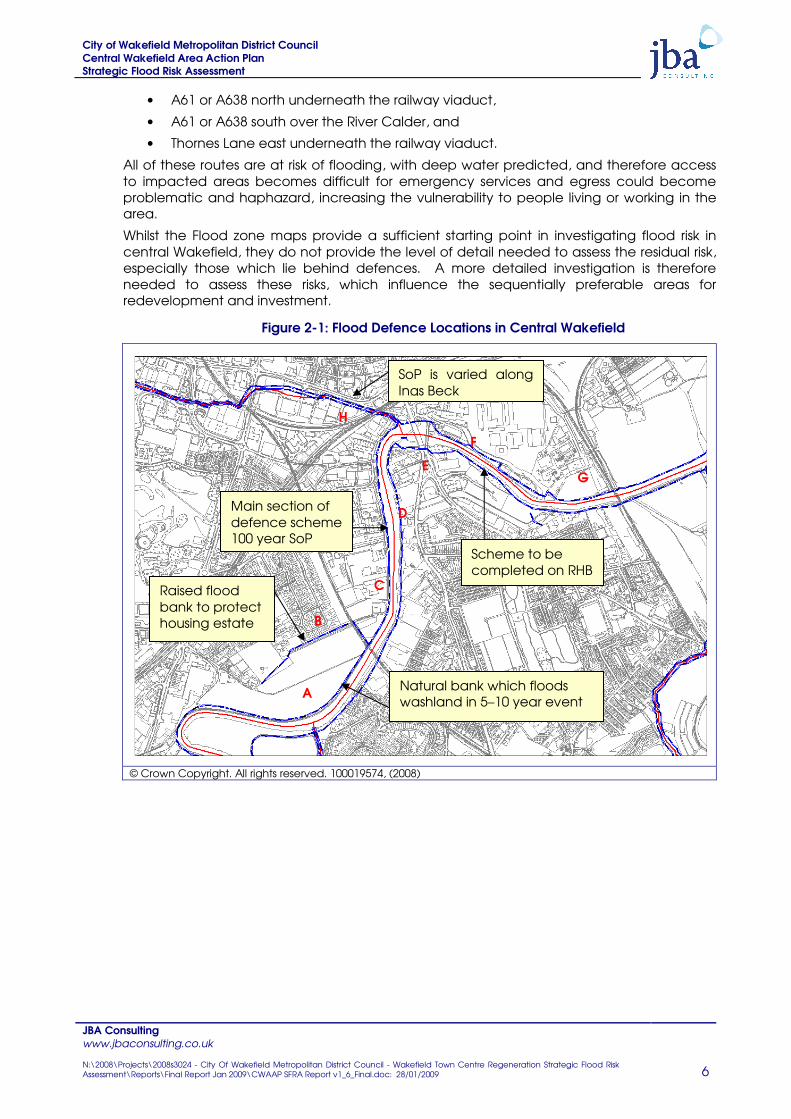
Figure 2-1 and Table 2-1 shows the location and known Standard of Protection (SoP) of defences throughout central Wakefield.
The planned Wakefield scheme will deliver a 100 year (1% AEP) standard of flood protection to central Wakefield. However, there are a number of defence gates along the left hand bank and the canal locks on the right hand bank, which allows access to the river. Whilst these can be closed, they are not automated and they depend entirely on sufficient warning time and human intervention, allowing for the possibility of the gates being left open during a flood or the failure of gate itself. These add an additional component of risk that should be considered in any flood risk assessment.
The defences have also been designed to a set level (100 year event plus freeboard), and there is always the possibility of a larger event occurring and overtopping the defence, which must be investigated.
Whilst the majority of existing development in central Wakefield has been categorised as a lower vulnerability to flooding under PPS25, i.e. industrial or retail, there are potential issues with the number of possible access and egress routes from the area, increasing the risk to people occupying the buildings. Currently the majority of the area is either enclosed by the River Calder that meanders through its centre or by the railway viaducts which boarder the area on three sides (west, north and east). Therefore there are only a number of possible routes in and out of the central area, including:
City of Wakefield Metropolitan District Council Central Wakefield Area Action Plan Strategic Flood Risk Assessment
JBA Consulting www.jbaconsulting.co.uk N:\2008\Projects\2008s3024 - City Of Wakefield Metropolitan District Council - Wakefield Town Centre Regeneration Strategic Flood Risk Assessment\Reports\Final Report Jan 2009\CWAAP SFRA Report v1_6_Final.doc: 28/01/2009 6
• A61 or A638 north underneath the railway viaduct,
• A61 or A638 south over the River Calder, and
• Thornes Lane east underneath the railway viaduct.
All of these routes are at risk of flooding, with deep water predicted, and therefore access to impacted areas becomes difficult for emergency services and egress could become problematic and haphazard, increasing the vulnerability to people living or working in the area.
Whilst the Flood zone maps provide a sufficient starting point in investigating flood risk in central Wakefield, they do not provide the level of detail needed to assess the residual risk, especially those which lie behind defences. A more detailed investigation is therefore needed to assess these risks, which influence the sequentially preferable areas for redevelopment and investment.
Figure 2-1: Flood Defence Locations in Central Wakefield
© Crown Copyright. All rights reserved. 100019574, (2008)
Main section of defence scheme 100 year SoP
SoP is varied along Ings Beck
Natural bank which floods washland in 5–10 year event
Scheme to be completed on RHB
Raised flood bank to protect housing estate
A
B
C
D
E
F
G
H
City of Wakefield Metropolitan District Council Central Wakefield Area Action Plan Strategic Flood Risk Assessment
JBA Consulting www.jbaconsulting.co.uk N:\2008\Projects\2008s3024 - City Of Wakefield Metropolitan District Council - Wakefield Town Centre Regeneration Strategic Flood Risk Assessment\Reports\Final Report Jan 2009\CWAAP SFRA Report v1_6_Final.doc: 28/01/2009 7
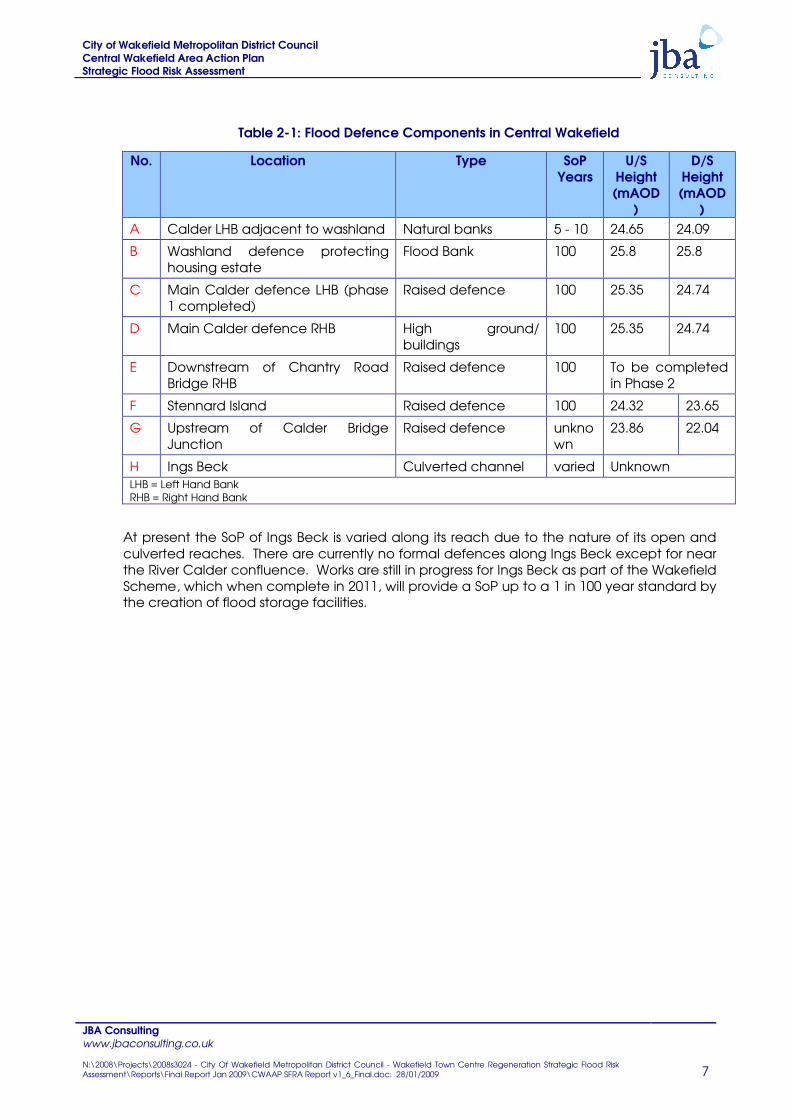
Table 2-1: Flood Defence Components in Central Wakefield
No. Location Type
SoP Years
U/S Height (mAOD
)
D/S Height (mAOD
) A Calder LHB adjacent to washland Natural banks 5 - 10 24.65 24.09
B Washland defence protecting housing estate
Flood Bank 100 25.8 25.8
C Main Calder defence LHB (phase 1 completed)
Raised defence 100 25.35 24.74
D Main Calder defence RHB High ground/ buildings
100 25.35 24.74
E Downstream of Chantry Road Bridge RHB
Raised defence 100 To be completed in Phase 2
F Stennard Island Raised defence 100 24.32 23.65
G Upstream of Calder Bridge Junction
Raised defence unknown
23.86 22.04
H Ings Beck Culverted channel varied Unknown LHB = Left Hand Bank RHB = Right Hand Bank
At present the SoP of Ings Beck is varied along its reach due to the nature of its open and culverted reaches. There are currently no formal defences along Ings Beck except for near the River Calder confluence. Works are still in progress for Ings Beck as part of the Wakefield Scheme, which when complete in 2011, will provide a SoP up to a 1 in 100 year standard by the creation of flood storage facilities.
City of Wakefield Metropolitan District Council Central Wakefield Area Action Plan Strategic Flood Risk Assessment
JBA Consulting www.jbaconsulting.co.uk N:\2008\Projects\2008s3024 - City Of Wakefield Metropolitan District Council - Wakefield Town Centre Regeneration Strategic Flood Risk Assessment\Reports\Final Report Jan 2009\CWAAP SFRA Report v1_6_Final.doc: 28/01/2009 8
3 FLOOD RISK DATA AND ITS ASSESSMENT
3.1 Risk Data
The Calder Valley Level 1 SFRA has provided sufficient data and information to enable Wakefield District Council to apply to Sequential Test. This information included:
• PPS25 Flood zone maps
• Designation of Functional Floodplain
• Fluvial Flood Extent and Depths
• Climate Change Sensitivity
• Areas Vulnerable to Surface Water Flooding
• Identification of Former COWS and IDD
The Level 1 SFRA demonstrated that central Wakefield is at high risk of flooding, and while it allowed Wakefield MDC to apply to Sequential Test at a district level, it has also demonstrated the potential need to apply the Exception Test in central Wakefield.
Due to the location of central Wakefield and the presence flood risk management measures such as the Wakefield flood defence scheme, a detailed Level 2 SFRA investigation into flood risk is required into the residual risks. This will further collate the evidence base in central Wakefield to facilitate the application of the Exception Test, and also inform the sequential approach to site layout and the design possible mitigation measures.
The approach taken is to ensure that key factors of the scale of the residual risks are understood and the flood inundation pathways are assimilated into any development layout. The main part of this investigation will therefore include detailed 1D-2D modelling of Wakefield defences, analysing the residual risk of the area using a number of scenarios including:
• Defence flood gate failure during the 100 year event
• Overtopping during the extreme 1000 year event
It should be noted that failure of any defences in central Wakefield has not been considered as following the completion of the flood alleviation scheme the risk of a structural failure will be very low. Also it is recommended that a climate change allowance is added to the extreme event. However, this would be a substantial increase in the volume entering the floodplain, and as such does not allow the differentiation in flood risk that would inform the exception test. Therefore the 0.1% event has been run without the freeboard allowance for the defences.
A further detailed analysis into surface water flooding will also be required as well as an investigation into residual flood risk along Ings Beck, utilising data produced in the Level 1 SFRA.
3.2 EA ISIS hydraulic model used in Wakefield FAS
The River Calder had previously been modelled by HALCROW using ISIS as part of the scheme design. However the model does not explicitly represent the defences, and there is limited understanding of the out of bank pathways used in extreme events. As part of this strategic assessment the ISIS model has been updated to include the presence of the Wakefield flood defence scheme.
City of Wakefield Metropolitan District Council Central Wakefield Area Action Plan Strategic Flood Risk Assessment
JBA Consulting www.jbaconsulting.co.uk N:\2008\Projects\2008s3024 - City Of Wakefield Metropolitan District Council - Wakefield Town Centre Regeneration Strategic Flood Risk Assessment\Reports\Final Report Jan 2009\CWAAP SFRA Report v1_6_Final.doc: 28/01/2009 9
Only one flood event was supplied with the Environment Agency ISIS model. As this study was more concerned with the impacts of climate change and more extreme events that would overtop the defences a revised set of inflows were required. The flows used to generate flood events in Wakefield were extracted from the River Calder CFMP shown in Table 3-1. The effect of climate change was also investigated for the 100 year event by increasing flows by 20%.
Table 3-1: Flood Peak Flows (m3/s) for a Range of Return Periods in Wakefield
Location 100 yr 100 yr + CC 1000 yr Calder at Dewsbury Gauge (Model upstream extent)
573.66 688.39 743.51
Calder at Wakefield 549.17 659.00 730.42 Inflows obtained from Calder CFMP
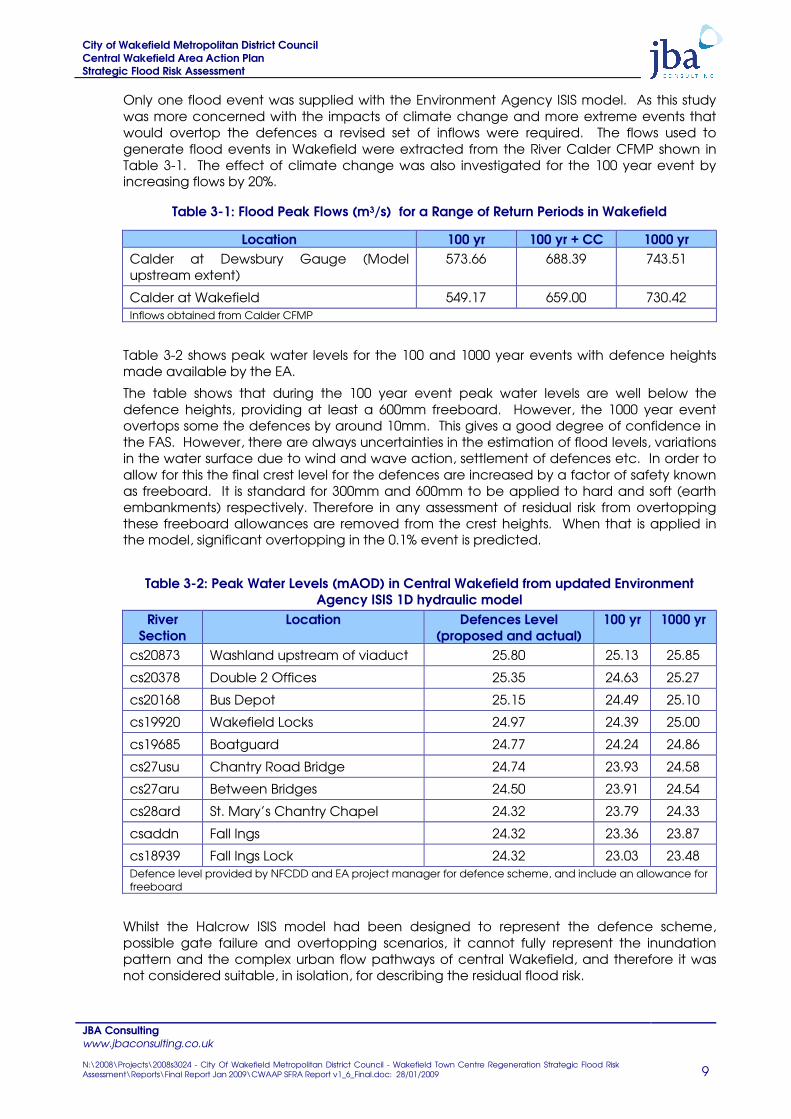
Table 3-2 shows peak water levels for the 100 and 1000 year events with defence heights made available by the EA.
The table shows that during the 100 year event peak water levels are well below the defence heights, providing at least a 600mm freeboard. However, the 1000 year event overtops some the defences by around 10mm. This gives a good degree of confidence in the FAS. However, there are always uncertainties in the estimation of flood levels, variations in the water surface due to wind and wave action, settlement of defences etc. In order to allow for this the final crest level for the defences are increased by a factor of safety known as freeboard. It is standard for 300mm and 600mm to be applied to hard and soft (earth embankments) respectively. Therefore in any assessment of residual risk from overtopping these freeboard allowances are removed from the crest heights. When that is applied in the model, significant overtopping in the 0.1% event is predicted.
Table 3-2: Peak Water Levels (mAOD) in Central Wakefield from updated Environment Agency ISIS 1D hydraulic model
River Section
Location Defences Level (proposed and actual)
100 yr 1000 yr
cs20873 Washland upstream of viaduct 25.80 25.13 25.85
cs20378 Double 2 Offices 25.35 24.63 25.27
cs20168 Bus Depot 25.15 24.49 25.10
cs19920 Wakefield Locks 24.97 24.39 25.00
cs19685 Boatguard 24.77 24.24 24.86
cs27usu Chantry Road Bridge 24.74 23.93 24.58
cs27aru Between Bridges 24.50 23.91 24.54
cs28ard St. Mary’s Chantry Chapel 24.32 23.79 24.33
csaddn Fall Ings 24.32 23.36 23.87
cs18939 Fall Ings Lock 24.32 23.03 23.48 Defence level provided by NFCDD and EA project manager for defence scheme, and include an allowance for freeboard
Whilst the Halcrow ISIS model had been designed to represent the defence scheme, possible gate failure and overtopping scenarios, it cannot fully represent the inundation pattern and the complex urban flow pathways of central Wakefield, and therefore it was not considered suitable, in isolation, for describing the residual flood risk.
City of Wakefield Metropolitan District Council Central Wakefield Area Action Plan Strategic Flood Risk Assessment
JBA Consulting www.jbaconsulting.co.uk N:\2008\Projects\2008s3024 - City Of Wakefield Metropolitan District Council - Wakefield Town Centre Regeneration Strategic Flood Risk Assessment\Reports\Final Report Jan 2009\CWAAP SFRA Report v1_6_Final.doc: 28/01/2009 10
Utilising the 1D-2D linkage application in ISIS, the hydraulic model was linked to an appropriate 2D model built using TUFLOW (Two-dimensional Unsteady Flow), a software package developed jointly by WBM Pty Ltd and the University of Queensland, discussed below.
3.3 1D – 2D (ISIS-TUFLOW) Linked Flood Modelling
Flood outlines are normally derived from 1D models simply by extrapolating the predicted water level in the channel across the floodplain using topographical data to estimate those areas that will be inundated. Whilst this method is suitable to create the Environment Agency Flood Maps, as used within the Level 1 SFRA, this approach is not always appropriate in instances where there are likely to be complex flow patterns and where water levels in the floodplain may differ significantly from those in the watercourse. This approach is now also seen as crucial in urban areas, especially those which are defended (as discussed above), to simulate the conveyance of flood waters across the floodplain and to gain a more detailed understanding of the flood risk.
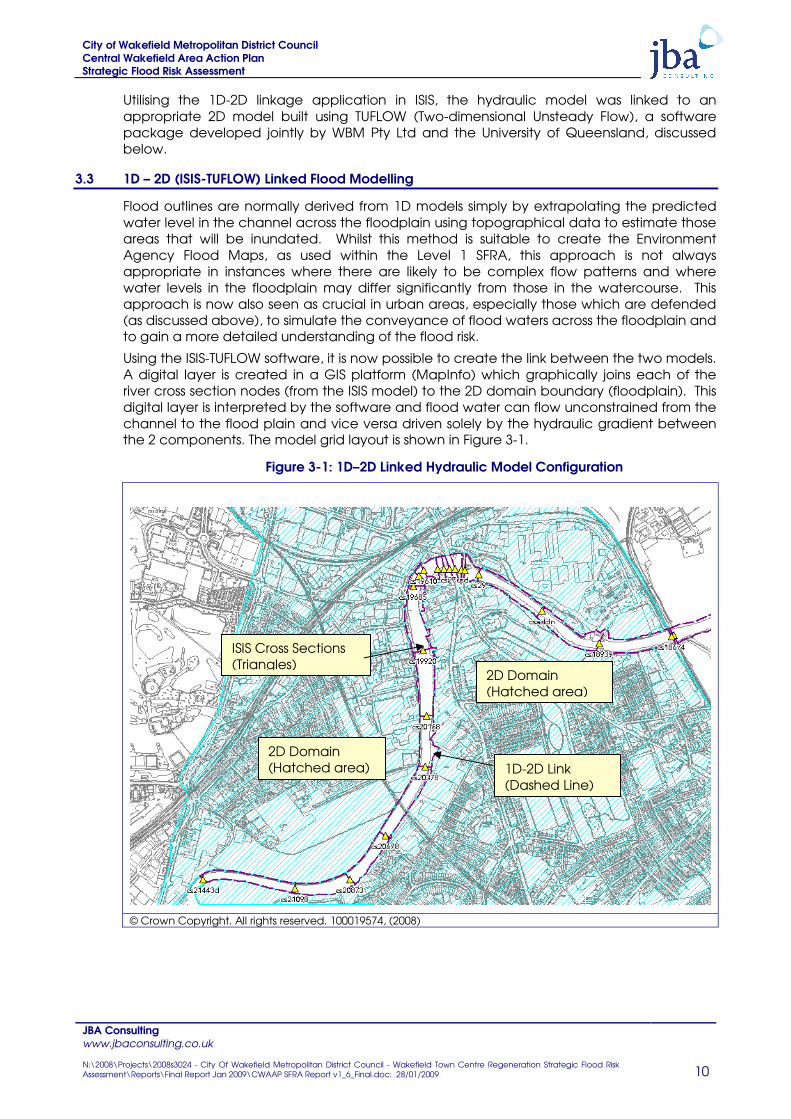
Using the ISIS-TUFLOW software, it is now possible to create the link between the two models. A digital layer is created in a GIS platform (MapInfo) which graphically joins each of the river cross section nodes (from the ISIS model) to the 2D domain boundary (floodplain). This digital layer is interpreted by the software and flood water can flow unconstrained from the channel to the flood plain and vice versa driven solely by the hydraulic gradient between the 2 components. The model grid layout is shown in Figure 3-1.
Figure 3-1: 1D–2D Linked Hydraulic Model Configuration
© Crown Copyright. All rights reserved. 100019574, (2008)
ISIS Cross Sections (Triangles)
1D-2D Link (Dashed Line)
2D Domain (Hatched area)
2D Domain (Hatched area)
City of Wakefield Metropolitan District Council Central Wakefield Area Action Plan Strategic Flood Risk Assessment
JBA Consulting www.jbaconsulting.co.uk N:\2008\Projects\2008s3024 - City Of Wakefield Metropolitan District Council - Wakefield Town Centre Regeneration Strategic Flood Risk Assessment\Reports\Final Report Jan 2009\CWAAP SFRA Report v1_6_Final.doc: 28/01/2009 11
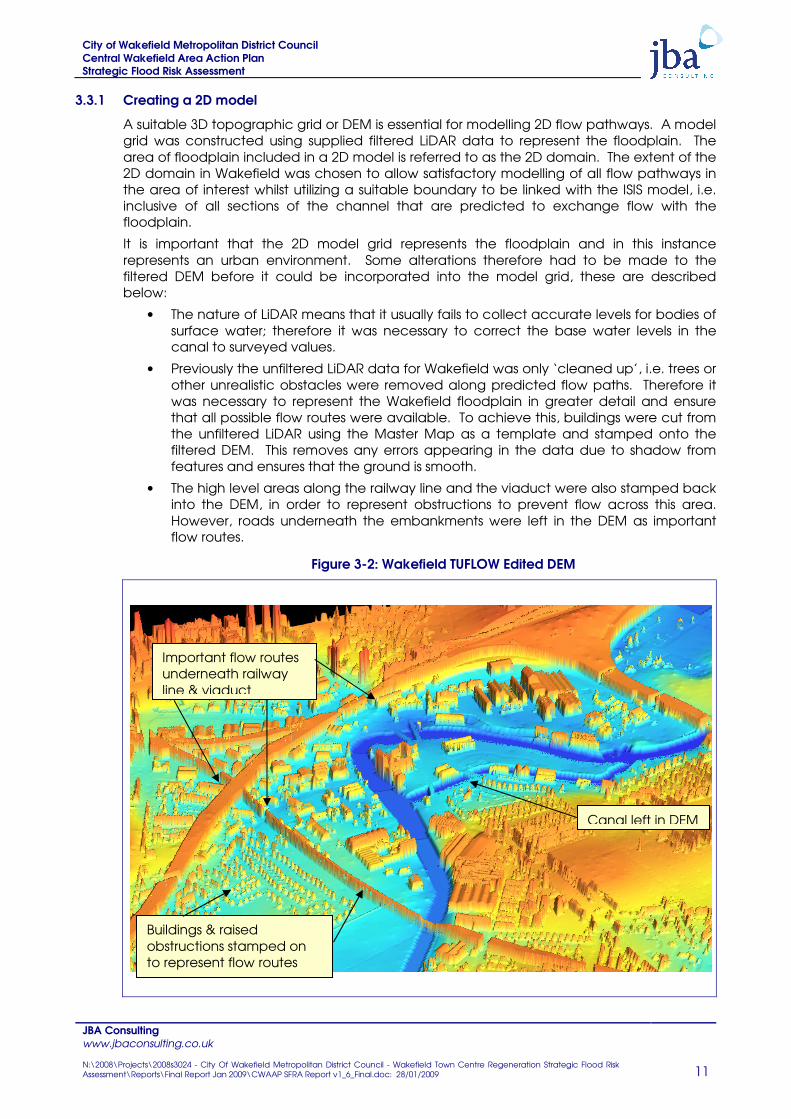
3.3.1 Creating a 2D model
A suitable 3D topographic grid or DEM is essential for modelling 2D flow pathways. A model grid was constructed using supplied filtered LiDAR data to represent the floodplain. The area of floodplain included in a 2D model is referred to as the 2D domain. The extent of the 2D domain in Wakefield was chosen to allow satisfactory modelling of all flow pathways in the area of interest whilst utilizing a suitable boundary to be linked with the ISIS model, i.e. inclusive of all sections of the channel that are predicted to exchange flow with the floodplain.
It is important that the 2D model grid represents the floodplain and in this instance represents an urban environment. Some alterations therefore had to be made to the filtered DEM before it could be incorporated into the model grid, these are described below:
• The nature of LiDAR means that it usually fails to collect accurate levels for bodies of surface water; therefore it was necessary to correct the base water levels in the canal to surveyed values.
• Previously the unfiltered LiDAR data for Wakefield was only ‘cleaned up’, i.e. trees or other unrealistic obstacles were removed along predicted flow paths. Therefore it was necessary to represent the Wakefield floodplain in greater detail and ensure that all possible flow routes were available. To achieve this, buildings were cut from the unfiltered LiDAR using the Master Map as a template and stamped onto the filtered DEM. This removes any errors appearing in the data due to shadow from features and ensures that the ground is smooth.
• The high level areas along the railway line and the viaduct were also stamped back into the DEM, in order to represent obstructions to prevent flow across this area. However, roads underneath the embankments were left in the DEM as important flow routes.
Figure 3-2: Wakefield TUFLOW Edited DEM
Important flow routes underneath railway line & viaduct
Canal left in DEM
Buildings & raised obstructions stamped on to represent flow routes
City of Wakefield Metropolitan District Council Central Wakefield Area Action Plan Strategic Flood Risk Assessment
JBA Consulting www.jbaconsulting.co.uk N:\2008\Projects\2008s3024 - City Of Wakefield Metropolitan District Council - Wakefield Town Centre Regeneration Strategic Flood Risk Assessment\Reports\Final Report Jan 2009\CWAAP SFRA Report v1_6_Final.doc: 28/01/2009 12
3.3.2 Manning’s Roughness
An average roughness value has been assumed across the majority of the 2D domain to reflect the local head losses along roads and open car parks and those around buildings or caused by blockages in the flow path that will inevitably occur. A Manning’s roughness value of 0.025, as suggested by the TUFLOW User Manual3 for footpaths and paved areas was applied to represent the primarily hard surfaced model domain.
Large open fields and long stretches of grass lands were also picked out, applying a Manning’s roughness value of 0.04.
The channel roughness used in the ISIS model was predominantly set to 0.033.
3.3.3 Representing Flood Defences
As mentioned previously, the impact of residual risk in central Wakefield is the focal point of this assessment. Therefore it was crucial that defences were properly represented within the 2D domain. Defence locations and heights were obtained from a number of sources, both from Environment Agency NFCDD data and from Andrew Newton, project manager at the Environment Agency for the Wakefield flood defence scheme. Scheme freeboard allowances were removed.
Both the lock gates, at the Calder and Hebble Canal and existing defences along the River Calder were included in the model as linear features superimposed upon the TUFLOW model grid. The location of defences are represented in Figure 2-1, while the elevations of defences represented in the model are based on the existing defences on the left hand bank as well as proposed defences heights on the right hand bank around Fall Ings. Defence heights have then been interpolated along the defence to represent a constant defence line.
When it came to assessing the impact of defence gate failure, an alternative TUFLOW defence line was created using gate locations and invert levels from the ISIS model.
3.4 ISIS-TUFLOW Results for Central Wakefield
The coupling of the ISIS model with the TUFLOW model combined with the higher resolution grid and improved DEMs serves to enable a much more detailed assessment and provide more accurate predictions of flow and water level. However the overall flood regime and level of risk predicted does not vary much from that predicted by the stand alone ISIS model. This provides further confidence that the assumptions made previously are valid.
The ISIS-TUFLOW model generally gave lower peak water level predictions in the floodplain and reduced flood extents for both scenarios compared with the stand alone ISIS model. This is because less flow overtopped the defences and flood water that did enter floodplain was able to return to the river more realistically. The overtopping hydraulics are now calculated with the full knowledge of the water levels immediately the other side of the flood wall. This tends to reduce the efficiency of the weir hydraulics assumed in the stand alone ISIS model.
3.4.1 Scenario 1: Defence Gate Failure
The maximum flood depths predicted by TUFLOW across central Wakefield (2D Domain) for the 100 year event and the presumption of gate failure is depicted in Figure 3-3.
Figure 3-3: TUFLOW Q100 Flood Depths & Possible Gate Failure (See back of report)
3 WBM. TUFLOW User Manual. June 2006. http://www.tuflow.com/Downloads/Manuals/TUFLOW%20Manual.2006-06-AA.Draft.doc.
City of Wakefield Metropolitan District Council Central Wakefield Area Action Plan Strategic Flood Risk Assessment
JBA Consulting www.jbaconsulting.co.uk N:\2008\Projects\2008s3024 - City Of Wakefield Metropolitan District Council - Wakefield Town Centre Regeneration Strategic Flood Risk Assessment\Reports\Final Report Jan 2009\CWAAP SFRA Report v1_6_Final.doc: 28/01/2009 13
While it has been predicted that the defences throughout central Wakefield have been designed to protect the area from a 100 year event, there is still the possibility of gate failure and flood waters originating either upstream or downstream of the defence scheme flowing towards higher vulnerable areas which are thought to be protected.
As expected Thornes Wharf and the northern area of the Waterfront receives the greatest impact with flood depth predicted to reach over 1.5m to those areas directly adjacent to the River Calder.
Flooding along Thornes Wharf is directly related to gate failure along the raised defences where water enters the flood cell and pools around the low lying area surrounding Commercial Street and Thornes Lane. There is also an important flow route east down Thornes Lane which transfers flood water into the residential estate behind the railway viaduct.
Whilst the washland is expected to flood during a 5–10 year event the flood bank is designed to protect the residential community behind it. However, floodwaters in an extreme event bypass the washland defences to the south west around Green End Land and onto the sports ground where it follows the defence line and into the housing estate. Flood waters then have the potential to travel north up Thornleigh Avenue and onto Thornes Lane where it places Thornes Wharf at risk. As the event increases, overtopping of the washland bank is predicted, along with other sections of the flood defence scheme
The probability of a 100 year event occurring in combination with gate failure or the gates being left open in times of flood is low, however, the TUFLOW results have identified that due to crucial flow routes along Thornes Lane, Thornes Wharf is potential at risk during more probable events.
The northern area of the Waterfront is also at risk during the event if Wakefield Locks are left open. While the majority of flood water will enter straight into the canal, lock gates underneath the road bridges and further downstream at Fall Ings Locks could increase water levels in the canal and forces flood waters into the urban area. If this occurs as identified within the TUFLOW model, the low lying area north of the canal is at the highest risk with water locked behind defences reaching depths of over 1m.
The Fall Ings area of the Waterfront is also at risk from rapid inundation around open green areas between the River Calder and the Canal. Whilst this area is undeveloped it has the potential to transfer flood waters upstream along the defence. Flood risk is expected to be reduced in phase 2 of the flood defences scheme; however land should be left open to store water in case of canal lock failure or overtopping.
Flooding in Calder Vale is directly related to the low lying river banks downstream of Stennard Island. While the risk here is expected to be reduced with further improvements to the current flood defences, the TUFLOW model has included future defence heights and results identify the area is still at risk.
3.4.2 Scenario 2: Defence Overtopping
The maximum flood depths predicted by TUFLOW across central Wakefield (2D Domain) for the 1000 year event, without freeboard, are depicted in Figure 3-4.
Figure 3-4: TUFLOW Q1000 Flood Depths without Freeboard (See back of report)
Both scenarios confirm that the Thornes area is at high risk from flooding during the extreme 1000 year event. The Thornes area becomes inundated with flood water with the majority of depths over 0.6m and up to 2.0m around Commercial Street and around the Double II offices.
However, whilst the figures from the TUFLOW modelling show the maximum flood depths throughout central Wakefield, the source or pattern of flooding is not identified. In both scenarios the Washland upstream of the viaduct is inundated first with water filling up behind the flood bank. The volume of the washland is quickly exceeded and flood bank is both overtopped and bypassed to the south west. Flood waters flow north up Thornleigh
City of Wakefield Metropolitan District Council Central Wakefield Area Action Plan Strategic Flood Risk Assessment
JBA Consulting www.jbaconsulting.co.uk N:\2008\Projects\2008s3024 - City Of Wakefield Metropolitan District Council - Wakefield Town Centre Regeneration Strategic Flood Risk Assessment\Reports\Final Report Jan 2009\CWAAP SFRA Report v1_6_Final.doc: 28/01/2009 14
Avenue and through the open land adjacent to the viaduct, where it collects on Thornes Lane and travels east underneath the viaduct and into Thornes Wharf.
Whilst the flood defence scheme does overtop, it is the combination of flood water originating from the washland which is the key to the deep flooding throughout the area.
There is also the potential for the Waterfront to become inundated; however this depends entirely on the closure of the Wakefield Locks and the possible flow routes downstream towards Chantry Road Bridge into the area. The deepest flood water is located to the north of the site towards the river as it becomes constrained by low lying land adjacent to the defences and the Calder and Hebble Canal to the south. Open green land around Fall Ings is again critical to flood flows throughout the northern area of the Waterfront, as it allows water to flow westerly from Fall Ings Locks towards the business park.
Calder Vale is also at risk in the extreme event; however this is mainly due to undefended stretches of the River Calder around Stennard Island. Depths are expected to reach over 2m in parts which could cause problems with access and egress as Calder Vale Road is the only road in and out of this area.
3.5 Residual Risk on Ings Beck
Previously, the only flood risk information along Ings Beck was the flood zone maps. However, in the Calder Valley Level 1 SFRA a range of fluvial flood extent and depth maps have been provided as a complementary suite of broad scale flood risk information.
The fluvial flood extent and depths maps created show the potential scale of flood inundation for overtopping of different standards of flood defence during a range of events. With specific interest in Ings Beck, which is known to have a varying SoP which is expected to increase to 1 in 100 year standard by 2011, this SFRA is able to utilise the information provided to gain a better understanding of actual risk along Ings Beck. In other words, whilst the flood zone maps provide undefended outlines for the 100yr (FZ3) and 1000yr events (FZ2), this mapping provides a basic understanding of the residual risks along Ings Beck as a result of the overtopping of defences or surcharging of the culvert system. This risk map is shown in Figure 3.5.
Figure 3-5: Residual Risk on Ings Beck (See back of report)
The majority of Ings Beck still has some form of residual risk; however the extent of flood risk is reduced over the entire area when comparing the defended to the undefended outlines produced by the Environment Agency. This is noticed around the area of New Brigton and Clayton Hill as well as Ings Road Trading Estate. Depths are also below 0.6m along its reach with deeper flooding appearing as water backs up against the railway viaduct, but the extent of these areas are relatively small.
The methods used to create the depths grids are similar to those used to create the original Flood Maps and while hydrology and digital elevation models have been edited to create an improved representation of flood risk, it still lacks sufficient detail of interaction between the river channel and the floodplain and the effect of culverts and bridges. However, it gives a good representation of the volume of water on the floodplain, and therefore realistic depths and important flow paths. It should be noted that flood waters from Ings Beck could migrate into the Thornes Wharf area, creating an additional source of risk in this area.
3.6 Surface Water
To gain a better understanding of other sources of flooding, the Calder Valley Level 1 SFRA has screened a number of areas which are naturally vulnerable to surface water flooding, one of which is central Wakefield.
The surface water modelling carried out in the Level 1 SFRA has been used to simulate a rain storm event to assess the risk of flash flooding during a high volume intense storm, which is normally associated with the summer months. As discussed in the Level 1 SFRA report, the

City of Wakefield Metropolitan District Council Central Wakefield Area Action Plan Strategic Flood Risk Assessment
JBA Consulting www.jbaconsulting.co.uk N:\2008\Projects\2008s3024 - City Of Wakefield Metropolitan District Council - Wakefield Town Centre Regeneration Strategic Flood Risk Assessment\Reports\Final Report Jan 2009\CWAAP SFRA Report v1_6_Final.doc: 28/01/2009 15
rainfall data is generated based on a hypothetical storm, using Flood Estimation Handbook calculations, and is based on a 1000 year event over a 6 hour period. The function of the local drainage system is simplistically represented by removing a fixed volume from the modelled rainfall input. It is assumed that the local drainage network has a capacity equivalent to a 10 year storm.
By placing the volume of water over a 3D representation of Wakefield, it is possible to generate depth data and a clear indication of how the flood progresses over the urban area. Probably the most important output from this modelling technique is identifying crucial flow paths and where flood waters are likely to pool in low lying areas or more importantly in central Wakefield behind defences.
Figure 3.6a and 3-6b show the outputs from the surface modelling in central Wakefield.
Figure 3-6a: Surface Modelling Output for North West Central Wakefield (See back of report)
Figure 3-6b: Surface Modelling Output for South West Central Wakefield (See back of report)
The surface water modelling outputs identify a number of issues in central Wakefield. Firstly, surface water flows towards either Ings Beck of directly to the River Calder which is expected. The flood outlines created match that of smaller tributaries on the Environment Agency Flood Maps reaffirming the presence of steep valleys and low lying floodplains, and areas at risk from deep flood water.
Secondly, the modelling identifies alternative flow paths which are not main river but are crucial in the surface water drainage of central Wakefield. Three areas can be identified from the mapping but are also discussed below.
3.6.1 Ings Beck and Ings Road Special Policy Area
The area surrounding Ings Beck and Ings Road Special Policy Area has been identified as a sensitive area to surface drainage flooding problems. Ings Beck was one of the areas impacted in summer 2007. The outlines produced are larger than that of the Environment Agency Flood Map identifying areas which are known to suffer from surface runoff including Westgate Common and those properties surrounding Dewsbury Road.
Ings Beck is also heavily culverted downstream of Westgate Retail and Leisure Park with only a few open stretches. Any surface runoff at this point which cannot directly enter the Beck due to it being culverted or drains at capacity will continue down the valley over the urban area impacting properties around Ings Road and towards Kirkgate. Surface water depths will be reduced by the operation of a pumping station at the Chantry Road Bridge. However, flood waters need to be conveyed to the station, either via the surface water sewers or overland and it should be noted that failure of the PS would have significant consequences on flood depths.
3.6.2 Kirkgate
The area of Kirkgate sits at the bottom end of high ground at East Moor and St Johns. The modelling shows that surface water runoff collects at the bottom of the valley before flowing south towards Kirkgate roundabout. Not only does this cause deep flooding around Kirkgate but will also cause access and egress problems for properties in this area as well as areas south of the railway viaduct which would also potentially be using this route in times of flooding.
3.6.3 Thornes
Two sources of surface water runoff places both north and south Thornes as risk from flooding. The modelling has confirmed an important flow route from Ings Beck down the A636 and Avondale Street into the north Thornes area. From here it has the potential to impact residential properties as well as flowing east into Thornes Wharf and collecting behind defences.
City of Wakefield Metropolitan District Council Central Wakefield Area Action Plan Strategic Flood Risk Assessment
JBA Consulting www.jbaconsulting.co.uk N:\2008\Projects\2008s3024 - City Of Wakefield Metropolitan District Council - Wakefield Town Centre Regeneration Strategic Flood Risk Assessment\Reports\Final Report Jan 2009\CWAAP SFRA Report v1_6_Final.doc: 28/01/2009 16
South Thornes is also at risk from surface water flooding which originates from the area surrounding Lupset, where surface runoff flows down Gill Sike drain and Thornes Road pooling around Thornes Common and into the main Thornes area. It is also at risk from surface water escaping from the Ings Beck network, as this water may flow south through the railway viaduct.

City of Wakefield Metropolitan District Council Central Wakefield Area Action Plan Strategic Flood Risk Assessment
JBA Consulting www.jbaconsulting.co.uk N:\2008\Projects\2008s3024 - City Of Wakefield Metropolitan District Council - Wakefield Town Centre Regeneration Strategic Flood Risk Assessment\Reports\Final Report Jan 2009\CWAAP SFRA Report v1_6_Final.doc: 28/01/2009 17
4 SUMMARY OF FLOOD RISK IN CENTRAL WAKEFIELD POLICY AREAS
4.1 Flood Risk
Flood risk in central Wakefield is a complicated issue. As discussed in the main SFRA report and investigated in detail above there are a number of sources and levels of flood risk. Flooding from the River Calder provides the highest risk, both in terms of gate failure and defences overtopping during larger events, while surface runoff is also an important issue throughout central Wakefield. Flood risk is discussed below with relevance to individual development areas identified with the Wakefield SFRA as requiring Exception Testing.
4.2 Waterfront Special Policy Area
The Waterfront Special Policy Area has been divided into seven sub areas; however there are mainly two very different areas vulnerable to flood risk, which are north and south of the Calder and Hebble Canal.
Firstly, the area south of the canal is known to be at risk in the more extreme events either from overtopping of the current defences and failure of the Wakefield locks. Flood depths in this area are relatively low below 0.6m, with the majority of flood waters entering the canal system.
Flooding here is minimal with current buildings acting as a secondary flood defence from the River Calder while flooding from the north is constrained by topography. Primary raised defences along this stretch of the River Calder have been constructed from a range of materials utilising natural high ground. Buildings currently act as a secondary defence; however redevelopment will allow buildings to be further set back from the primary defence allowing possible access and the use of open areas during extreme events.
The topography of south area of the site also proves a natural defence line as well as a number of access and egress routes along Bridge Street, Doncaster Road and Sugar Lane. These routes could increase the vulnerability of the area to surface water flooding.
Secondly, north of the canal, flood risk is heavily dependent of current and future flood defences. Currently, present flood defences overtop in the extreme 1000 year event and in combination with low lying topography, flood depths have the potential to be over 1.5m. Defences downstream of Stennard Island have been proposed in the second phase of the flood defence scheme but are currently not to the same standard as the left hand bank allowing flow paths around Fall Ings Locks to impact the area. While this area is open green land it may be suitable to leave undeveloped to allow storage in extreme events.
Since the area is low lying it is vulnerable to surface water flooding from the south which will become trapped behind the River Calder defences.
Access and egress is also an important issue to be considered in this area. Major access routes over Chantry Road Bridge will be blocked with deep flood water trapped behind the defences on both sides either in an overtopping scenario or due to surface water. The two bridges, Bridge Street and Doncaster Road, over the canal would proved the only natural route to higher ground but they could also be blocked with significant flood depths.
4.3 Ings Road Special Policy Area
Ings Road Special Policy Area according to the residual risk maps produced for this SFRA is at lower risk of flooding compared to the other sites, however, the mechanisms of flooding in this area are more complex and can occur from a number of sources.

City of Wakefield Metropolitan District Council Central Wakefield Area Action Plan Strategic Flood Risk Assessment
JBA Consulting www.jbaconsulting.co.uk N:\2008\Projects\2008s3024 - City Of Wakefield Metropolitan District Council - Wakefield Town Centre Regeneration Strategic Flood Risk Assessment\Reports\Final Report Jan 2009\CWAAP SFRA Report v1_6_Final.doc: 28/01/2009 18
The south east side of the area is susceptible from overtopping and gate failure from the River Calder; however flood depths are expected to be below 0.6m. The main source of flood risk in this area is therefore heavily dependent of flooding from Ings Beck rather than the River Calder and surface water flooding from further up the Ings valley.
Whilst the River Calder has the potential to increase flooding along Ings Beck due to a tidal locking effect during high flows, the precise SoP of Ings Beck varies until the scheme is complete. Ings Beck is also heavily culverted in this area with few openings, exacerbating flood risk further upstream due to culvert capacities which will have an inevitable knock-on effect downstream around the Trading Estate. Any out of bank flooding or surface water flooding will find it difficult to enter back into the Beck as depths would not reach defence heights causing widespread ponding in this area.
In this case surface water flooding originating from Alverthorpe and Flanshaw will flow south east along Ings Road and into the estate. This will also be exacerbated from surface water from the Pindersfield General Hospital area.
4.4 Thornes Wharf Special Policy Area
Whilst Thornes Wharf Special Policy Area is defended to a 100 year standard, the residual risk in the areas is significant due to the number of flooding sources as well as its close location behind defences.
The Thornes Wharf area is at immediate risk from both overtopping of defences in the extreme 1000 year event and from flood gates being left open or failing. Due to its location flooding is expected to be deep and fast flowing throughout the area. The area surrounding the Wakefield Shirt Company offices is at direct risk from overtopping of the defences and indirectly as water flows south and pools in this area during gates failure around the Sea Cadets building.
Flooding is expected to be deep around the intersection of Thornes Lane and Commercial Street, where depths could reach over 2m. Flood velocities are also expected to be high in this area due to its close location to a number of flood gates.
While this area is immediately at risk from the River Calder, it is also at risk from flooding which occurs upstream of the railway viaduct. The washland upstream of the viaduct has the potential to exceed its capacity as seen in both the 1000 and 100 year events. The housing estate behind the washland is most at risk from overtopping or breaching of the flood bank, however, due to significant flow paths along Thornleigh Avenue and open land adjacent to the viaduct, Thornes Wharf is also at risk.
Thornes Wharf is also vulnerable to surface water flooding originating from Lupset and Flanshaw, especially if Ings Beck exceeds its capacity. Surface water flooding will also build up behind the defences along the River Calder and again around the intersection of Thornes Lane and Commercial Street.
Currently the area has commercial use placing it in a lower vulnerability bracket due to potentially only being occupied during the day, however the lack of access and egress in this area increases the vulnerability of the people working in the area. Currently the site is enclosed on all sides by the railway viaduct to the west and the River Calder to the east. The only access to and from the site is Thornes Lane either underneath the viaduct or north towards Kirkgate, however, both of these areas have already been identified as at risk from deep flooding.
Due to the impact that flooding will have on this area and the significant flow paths along Thrones Lane, any development or mitigation measures will require careful consideration and planning as it will have an impact adjacent areas.
City of Wakefield Metropolitan District Council Central Wakefield Area Action Plan Strategic Flood Risk Assessment
JBA Consulting www.jbaconsulting.co.uk N:\2008\Projects\2008s3024 - City Of Wakefield Metropolitan District Council - Wakefield Town Centre Regeneration Strategic Flood Risk Assessment\Reports\Final Report Jan 2009\CWAAP SFRA Report v1_6_Final.doc: 28/01/2009 19
4.5 Kirkgate Special Policy Area
Kirkgate is only partially located within the Environment Agency Flood Maps, however from the detailed investigation above, the site has been identified as more vulnerable from surface water flooding than the overtopping of defences or gate failure.
Flooding from the River Calder during extreme events is expected to below 0.6m, while actual risk is lower from Ings Beck.
Flooding from surface water poses the highest threat to this site as it is located at the junction of two major flow paths south down Kirkgate and Marsh Way and from the east down Brunswick Street. Surface water ponds in this area, especially when flow in the River Calder is high or current infrastructure prevents continuous surface flows to occur.
Surface water flooding occurring around Ings Beck could also impact upon this area as it flows east down Ings Road and collecting around the A61.
As the main roads around this site act as the major flow routes for surface water, minor roads to the north of Ings Road and east of Kirkgate will be required for access and egress. This will be an important consideration during site layout and the placing of individual building entrances.
4.6 Calder Vale Special Policy Area
Downstream of Stennard Island the River Calder has low bank heights with minimal defences placing the area of Calder Vale at risk during both the 100 year and extreme 1000 year event. Crucial flow routes north of Stennard Island mean that Thornes Wharf is also at risk if flooding occurs here, however the majority of water will pool behind defences at Stennard Island and at the pumping station creating flood depths above 2m.
While the area is currently only used for employment purposes, evacuation during times of flood should be a consideration in allocating this land for development as there is only one route in and out of the site down Calder Vale Road. Careful mitigation solutions, such as flood warning systems, maybe suitable to reduce residual risks.
City of Wakefield Metropolitan District Council Central Wakefield Area Action Plan Strategic Flood Risk Assessment
JBA Consulting www.jbaconsulting.co.uk N:\2008\Projects\2008s3024 - City Of Wakefield Metropolitan District Council - Wakefield Town Centre Regeneration Strategic Flood Risk Assessment\Reports\Final Report Jan 2009\CWAAP SFRA Report v1_6_Final.doc: 28/01/2009 20
5 FLOOD MANAGEMENT OPTIONS AND LAND USE
5.1 Exception Testing
Strategic Flood Risk Assessments are undertaken in two levels. A scoping exercise is undertaken initially, and the original SFRA for the Calder Valley has collated where the major risk issues are. Where for reasons of sustainable development flood risk cannot be avoided by allocating in lower flood risk zones a more detailed strategic assessment is required. This is the purpose of this report.
Essentially these assessments are an outline flood risk assessment which looks at not just an individual plot but at the wider spatial issues into which development is planned. They are primarily focussing on
• Will the development be safe? Can all the risks be designed out and can the residual risks to people and property be managed by an emergency plan or by limiting the type of land use?
• Will the site be deliverable? This involves a review of economic and design aspects, together with an understanding of how complicated the assessment will need to be and how “exceptional” the development would need to be.
• How well does the development fit with the current mix of land uses and future provision of flood management measures? Can development within the policy area reduce flood risk to other areas; will it require further more expensive provision of flood defence infrastructure?
These are all elements that will need to be considered in the delivery of the Exception Test, but an SFRA needs to be suitably precautionary, applying a longer term holistic approach to ensuring development does not compromise future flood management measures and vice versa. The Exception Test is not black and white, and needs to assess the acceptability of the residual risks. Where the residual risks are significant it is unlikely that further investment would exceptionally be justified, particularly if it introduces significantly more people into the flood risk area.
To provide this longer term view to spatial planning in flood risk areas a number of indicators were developed to allow a comparison of the appropriate land uses in each policy area and how they would fare within the PPS25 Exception Test. These indicators are as follows:
• Development is within existing flood risk area – existing flood warning and evacuation in place. Importantly how easily will the area recover following an event. New development may lose local services for 12months if an event occurs.
• Residual risk measures are easily applied and within a norm – Low depths of flooding can be easily designed out by modest alteration of ground or floor levels. 1st floor accommodation has implications for the urban design and place setting of the development.
• Egress and access. Impact on emergency planning provision and whether development would be safe – This is a key issue and prime test in the PPS25 Exception Test. Access routes need to be natural and accessible in a flood to the emergency services
• Change in the number of people at risk as result of development – Introduction of more people will put a greater strain on the emergency services in an event. Whilst they may be accommodated at high elevation they will require support very quickly even after the inundation has stopped.
• Change in number of properties at risk in 1% and 0.1% event before and after.
City of Wakefield Metropolitan District Council Central Wakefield Area Action Plan Strategic Flood Risk Assessment
JBA Consulting www.jbaconsulting.co.uk N:\2008\Projects\2008s3024 - City Of Wakefield Metropolitan District Council - Wakefield Town Centre Regeneration Strategic Flood Risk Assessment\Reports\Final Report Jan 2009\CWAAP SFRA Report v1_6_Final.doc: 28/01/2009 21
Assumes mitigation measures put in place – From an economic viewpoint development can replace existing property with lower vulnerability land uses and also development that is designed to be flood resistant or resilient. A reduction in economic risk can be achieved.
• Scale and nature of flood risks – The residual risk maps indicate likely depths and flow routes. From running the surface water screening assessment the scale and extent of the surface water flood risks can be considered.
• Impact of mitigation measure on other areas d/s and adjacent – The Wakefield FAS has assumed that removal of the flood cells in central Wakefield has been compensated by enhancement of the washlands upstream. Therefore the impact assessment needs only to be undertaken within the flood cell as a result of significant land raising or alteration or blockage of flow routes.
These indicators have been used to qualitatively assess each key type of vulnerable land use proposed in each of the policy areas in central Wakefield.
This simple assessment allows a sequential approach to be delivered against flood risk criteria and a hierarchy of recommended land uses delivered. This would support appropriate policies and land use allocations within the CWAAP. This would provide the evidence for the LPA in reviewing any subsequent planning applications that decide to use the Exception Test to justify the need for alternative land uses in these areas, and also will avoid the need for a Sequential Test for any of the recommended land uses in these Flood Zone areas in order to satisfy the LPA and EA.
It should be noted that a detailed flood risk assessment will always be required, but would need to follow the guidance in Section 6.
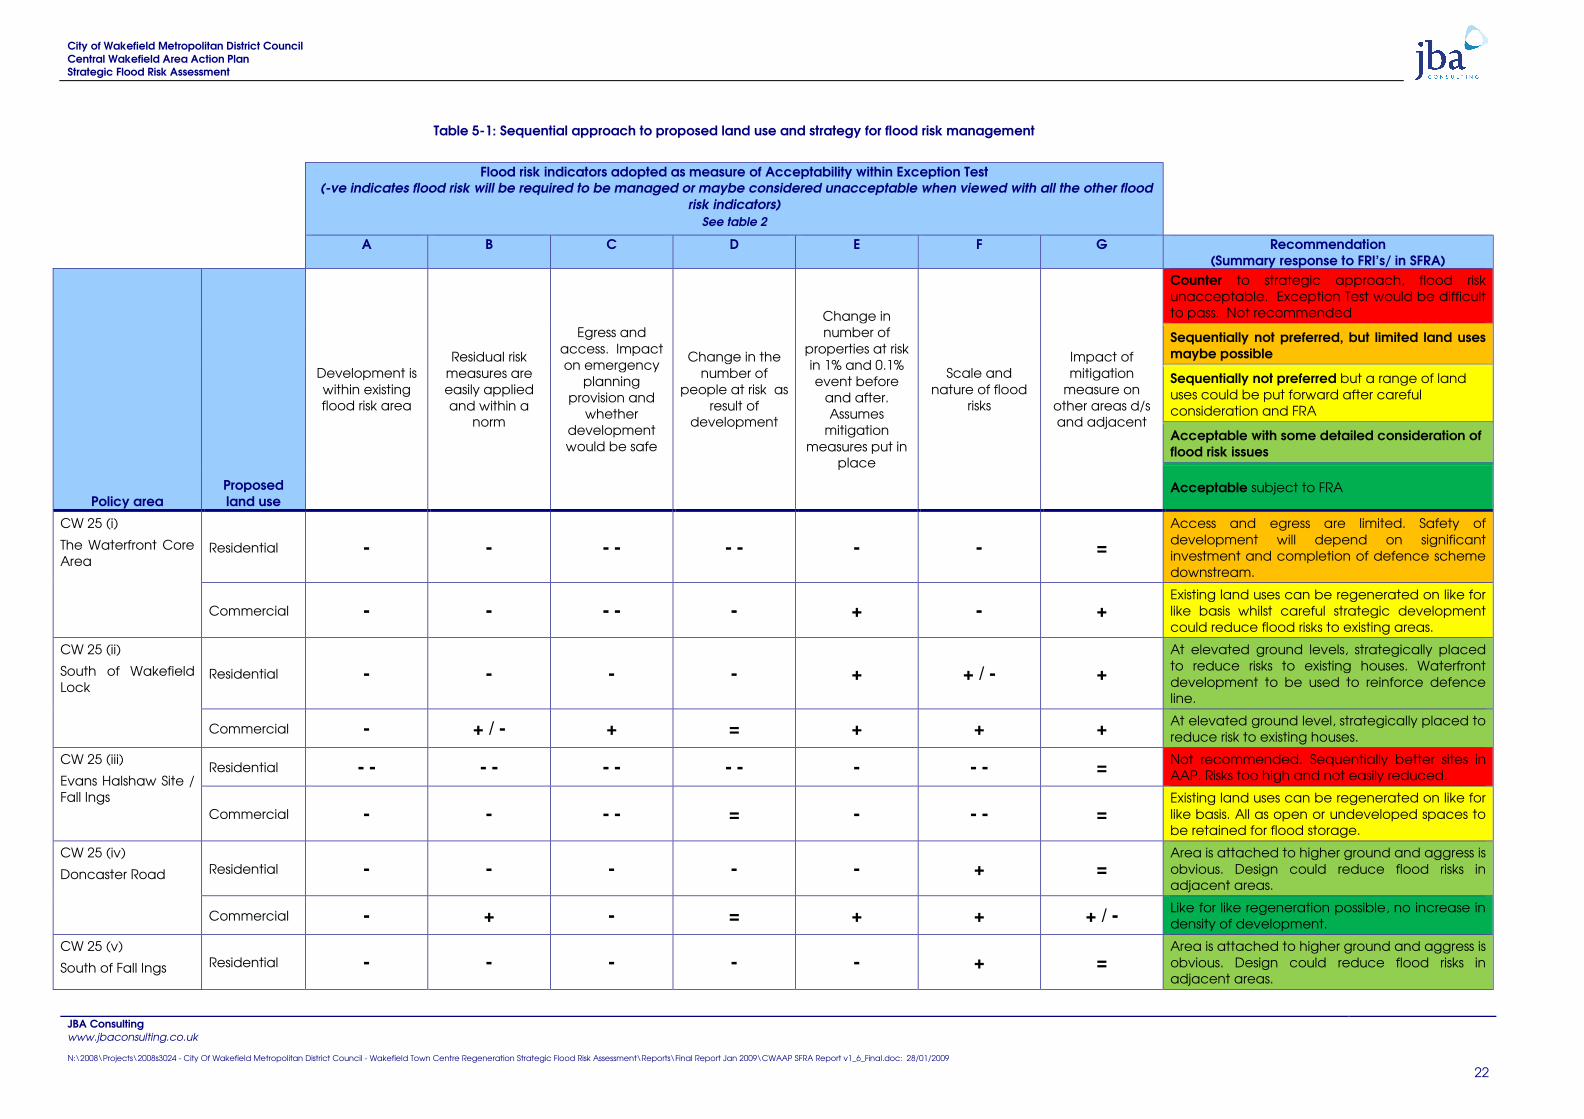
City of Wakefield Metropolitan District Council Central Wakefield Area Action Plan Strategic Flood Risk Assessment
JBA Consulting www.jbaconsulting.co.uk N:\2008\Projects\2008s3024 - City Of Wakefield Metropolitan District Council - Wakefield Town Centre Regeneration Strategic Flood Risk Assessment\Reports\Final Report Jan 2009\CWAAP SFRA Report v1_6_Final.doc: 28/01/2009
22
Table 5-1: Sequential approach to proposed land use and strategy for flood risk management
Flood risk indicators adopted as measure of Acceptability within Exception Test
(-ve indicates flood risk will be required to be managed or maybe considered unacceptable when viewed with all the other flood risk indicators)
See table 2
A B C D E F G Recommendation (Summary response to FRI’s/ in SFRA)
Policy area Proposed land use
Development is within existing flood risk area
Residual risk measures are easily applied and within a
norm
Egress and access. Impact on emergency
planning provision and
whether development would be safe
Change in the number of
people at risk as result of
development
Change in number of
properties at risk in 1% and 0.1% event before
and after. Assumes
mitigation measures put in
place
Scale and nature of flood
risks
Impact of mitigation
measure on other areas d/s and adjacent
Counter to strategic approach, flood risk unacceptable. Exception Test would be difficult to pass. Not recommended
Sequentially not preferred, but limited land uses maybe possible
Sequentially not preferred but a range of land uses could be put forward after careful consideration and FRA
Acceptable with some detailed consideration of flood risk issues
Acceptable subject to FRA
CW 25 (i)
The Waterfront Core Area
Residential - - - - - - - - = Access and egress are limited. Safety of development will depend on significant investment and completion of defence scheme downstream.
Commercial - - - - - + - + Existing land uses can be regenerated on like for like basis whilst careful strategic development could reduce flood risks to existing areas.
CW 25 (ii)
South of Wakefield Lock
Residential - - - - + + / - + At elevated ground levels, strategically placed to reduce risks to existing houses. Waterfront development to be used to reinforce defence line.
Commercial - + / - + = + + + At elevated ground level, strategically placed to reduce risk to existing houses.
CW 25 (iii)
Evans Halshaw Site / Fall Ings
Residential - - - - - - - - - - - = Not recommended. Sequentially better sites in AAP. Risks too high and not easily reduced.
Commercial - - - - = - - - = Existing land uses can be regenerated on like for like basis. All as open or undeveloped spaces to be retained for flood storage.
CW 25 (iv)
Doncaster Road Residential - - - - - + = Area is attached to higher ground and aggress is obvious. Design could reduce flood risks in adjacent areas.
Commercial - + - = + + + / - Like for like regeneration possible, no increase in density of development.
CW 25 (v)
South of Fall Ings Residential - - - - - + = Area is attached to higher ground and aggress is obvious. Design could reduce flood risks in adjacent areas.
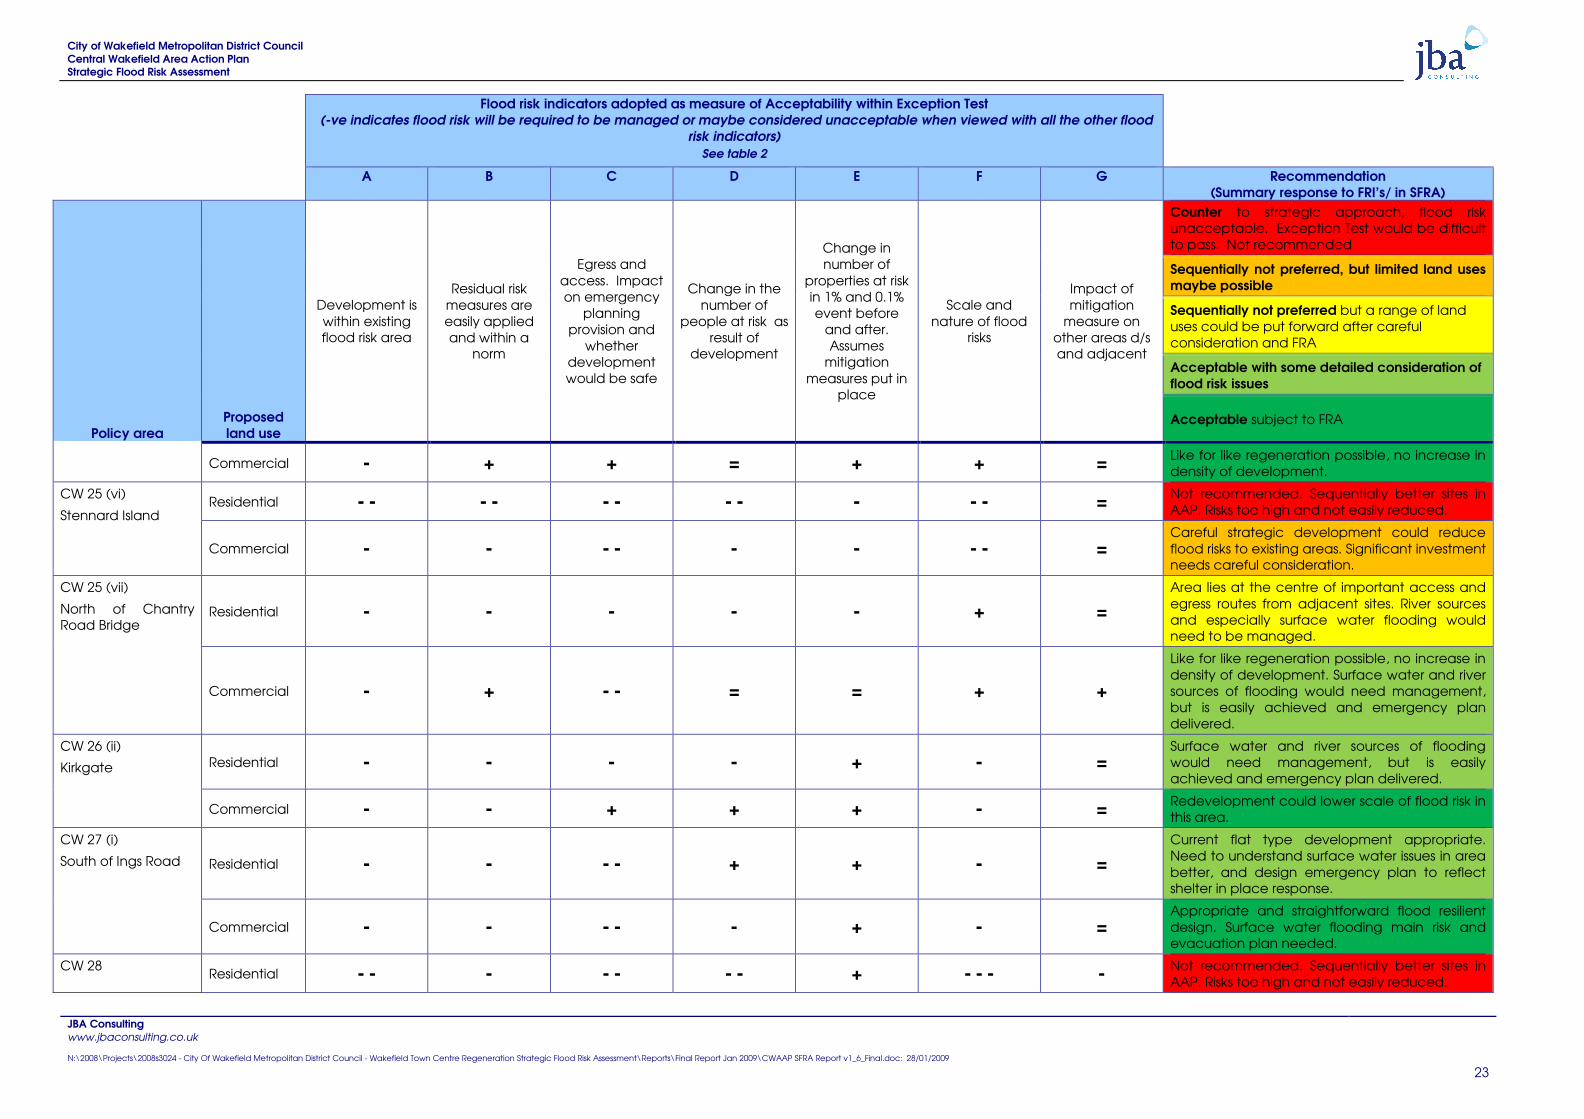
City of Wakefield Metropolitan District Council Central Wakefield Area Action Plan Strategic Flood Risk Assessment
JBA Consulting www.jbaconsulting.co.uk N:\2008\Projects\2008s3024 - City Of Wakefield Metropolitan District Council - Wakefield Town Centre Regeneration Strategic Flood Risk Assessment\Reports\Final Report Jan 2009\CWAAP SFRA Report v1_6_Final.doc: 28/01/2009
23
Flood risk indicators adopted as measure of Acceptability within Exception Test (-ve indicates flood risk will be required to be managed or maybe considered unacceptable when viewed with all the other flood
risk indicators) See table 2
A B C D E F G Recommendation (Summary response to FRI’s/ in SFRA)
Policy area Proposed land use
Development is within existing flood risk area
Residual risk measures are easily applied and within a
norm
Egress and access. Impact on emergency
planning provision and
whether development would be safe
Change in the number of
people at risk as result of
development
Change in number of
properties at risk in 1% and 0.1% event before
and after. Assumes
mitigation measures put in
place
Scale and nature of flood
risks
Impact of mitigation
measure on other areas d/s and adjacent
Counter to strategic approach, flood risk unacceptable. Exception Test would be difficult to pass. Not recommended
Sequentially not preferred, but limited land uses maybe possible
Sequentially not preferred but a range of land uses could be put forward after careful consideration and FRA
Acceptable with some detailed consideration of flood risk issues
Acceptable subject to FRA
Commercial - + + = + + = Like for like regeneration possible, no increase in density of development.
CW 25 (vi)
Stennard Island Residential - - - - - - - - - - - = Not recommended. Sequentially better sites in
AAP. Risks too high and not easily reduced.
Commercial - - - - - - - - = Careful strategic development could reduce flood risks to existing areas. Significant investment needs careful consideration.
CW 25 (vii)
North of Chantry Road Bridge
Residential - - - - - + = Area lies at the centre of important access and egress routes from adjacent sites. River sources and especially surface water flooding would need to be managed.
Commercial - + - - = = + +
Like for like regeneration possible, no increase in density of development. Surface water and river sources of flooding would need management, but is easily achieved and emergency plan delivered.
CW 26 (ii)
Kirkgate Residential - - - - + - = Surface water and river sources of flooding would need management, but is easily achieved and emergency plan delivered.
Commercial - - + + + - = Redevelopment could lower scale of flood risk in this area.
CW 27 (i)
South of Ings Road Residential - - - - + + - = Current flat type development appropriate. Need to understand surface water issues in area better, and design emergency plan to reflect shelter in place response.
Commercial - - - - - + - = Appropriate and straightforward flood resilient design. Surface water flooding main risk and evacuation plan needed.
CW 28 Residential - - - - - - - + - - - - Not recommended. Sequentially better sites in
AAP. Risks too high and not easily reduced.
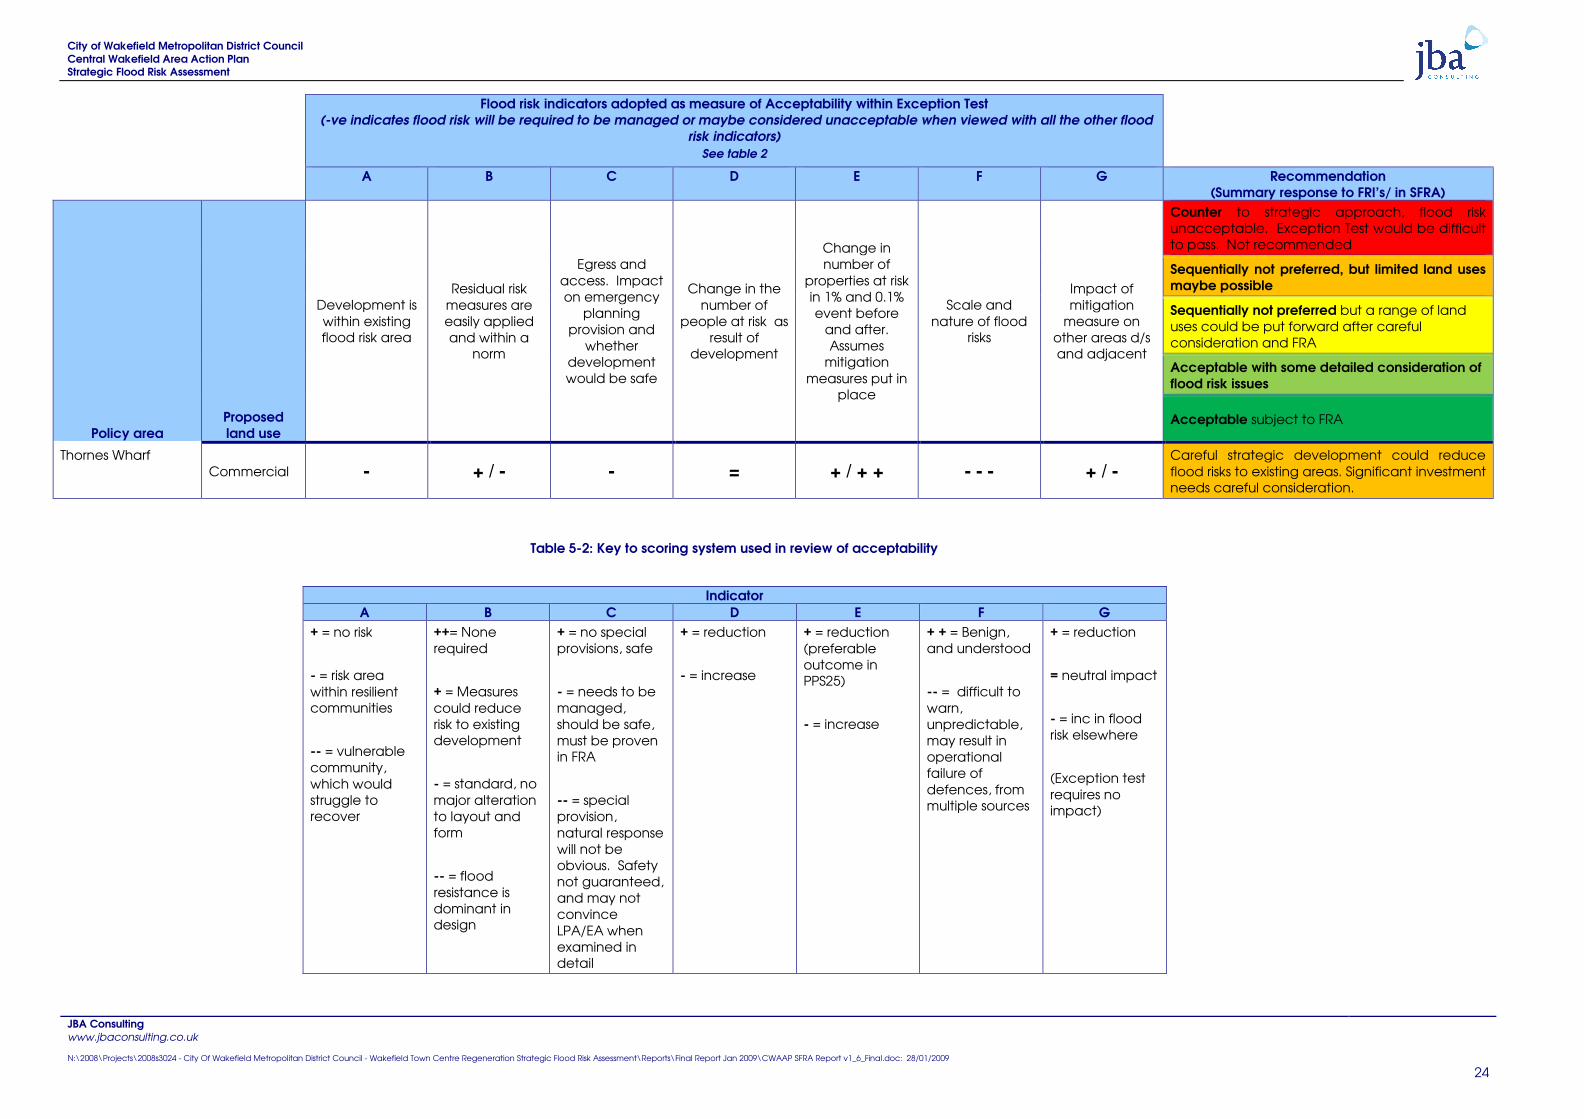
City of Wakefield Metropolitan District Council Central Wakefield Area Action Plan Strategic Flood Risk Assessment
JBA Consulting www.jbaconsulting.co.uk N:\2008\Projects\2008s3024 - City Of Wakefield Metropolitan District Council - Wakefield Town Centre Regeneration Strategic Flood Risk Assessment\Reports\Final Report Jan 2009\CWAAP SFRA Report v1_6_Final.doc: 28/01/2009
24
Flood risk indicators adopted as measure of Acceptability within Exception Test (-ve indicates flood risk will be required to be managed or maybe considered unacceptable when viewed with all the other flood
risk indicators) See table 2
A B C D E F G Recommendation (Summary response to FRI’s/ in SFRA)
Policy area Proposed land use
Development is within existing flood risk area
Residual risk measures are easily applied and within a
norm
Egress and access. Impact on emergency
planning provision and
whether development would be safe
Change in the number of
people at risk as result of
development
Change in number of
properties at risk in 1% and 0.1% event before
and after. Assumes
mitigation measures put in
place
Scale and nature of flood
risks
Impact of mitigation
measure on other areas d/s and adjacent
Counter to strategic approach, flood risk unacceptable. Exception Test would be difficult to pass. Not recommended
Sequentially not preferred, but limited land uses maybe possible
Sequentially not preferred but a range of land uses could be put forward after careful consideration and FRA
Acceptable with some detailed consideration of flood risk issues
Acceptable subject to FRA
Thornes Wharf Commercial - + / - - = + / + + - - - + / -
Careful strategic development could reduce flood risks to existing areas. Significant investment needs careful consideration.
Table 5-2: Key to scoring system used in review of acceptability
Indicator A B C D E F G
+ = no risk
- = risk area within resilient communities
-- = vulnerable community, which would struggle to recover
++= None required
+ = Measures could reduce risk to existing development
- = standard, no major alteration to layout and form
-- = flood resistance is dominant in design
+ = no special provisions, safe
- = needs to be managed, should be safe, must be proven in FRA
-- = special provision, natural response will not be obvious. Safety not guaranteed, and may not convince LPA/EA when examined in detail
+ = reduction
- = increase
+ = reduction (preferable outcome in PPS25)
- = increase
+ + = Benign, and understood
-- = difficult to warn, unpredictable, may result in operational failure of defences, from multiple sources
+ = reduction
= neutral impact
- = inc in flood risk elsewhere
(Exception test requires no impact)
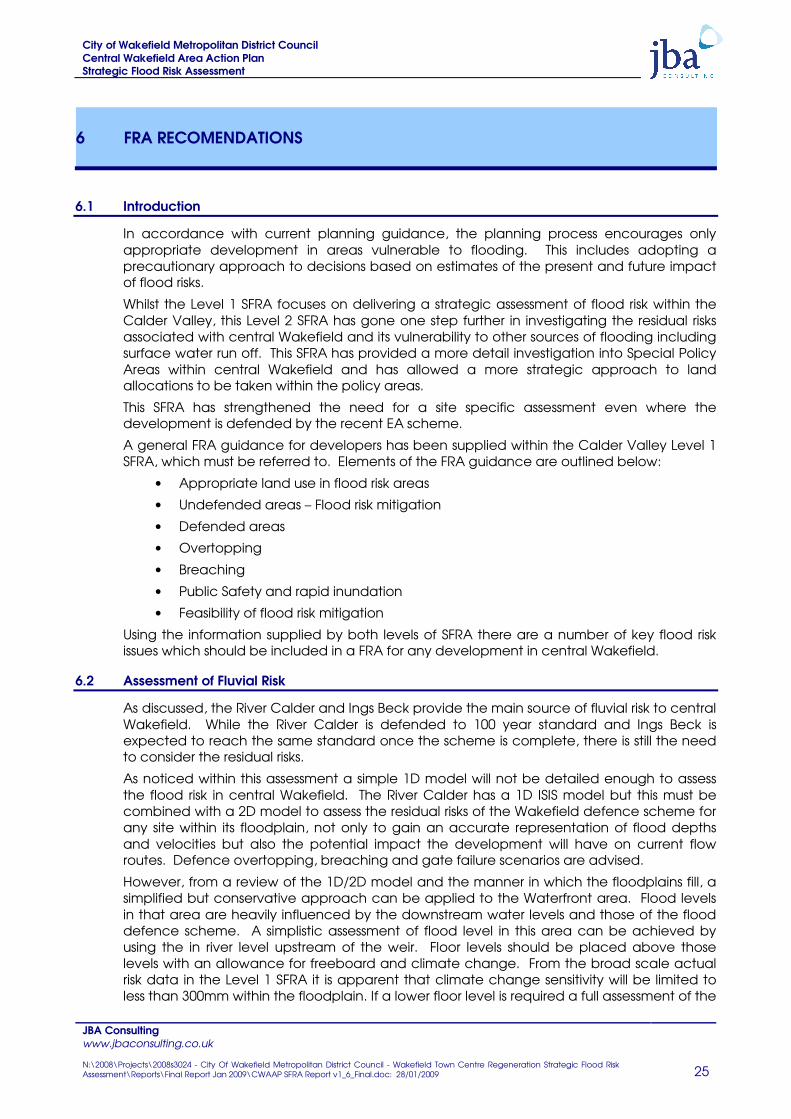
City of Wakefield Metropolitan District Council Central Wakefield Area Action Plan Strategic Flood Risk Assessment
JBA Consulting www.jbaconsulting.co.uk N:\2008\Projects\2008s3024 - City Of Wakefield Metropolitan District Council - Wakefield Town Centre Regeneration Strategic Flood Risk Assessment\Reports\Final Report Jan 2009\CWAAP SFRA Report v1_6_Final.doc: 28/01/2009 25
6 FRA RECOMENDATIONS
6.1 Introduction
In accordance with current planning guidance, the planning process encourages only appropriate development in areas vulnerable to flooding. This includes adopting a precautionary approach to decisions based on estimates of the present and future impact of flood risks.
Whilst the Level 1 SFRA focuses on delivering a strategic assessment of flood risk within the Calder Valley, this Level 2 SFRA has gone one step further in investigating the residual risks associated with central Wakefield and its vulnerability to other sources of flooding including surface water run off. This SFRA has provided a more detail investigation into Special Policy Areas within central Wakefield and has allowed a more strategic approach to land allocations to be taken within the policy areas.
This SFRA has strengthened the need for a site specific assessment even where the development is defended by the recent EA scheme.
A general FRA guidance for developers has been supplied within the Calder Valley Level 1 SFRA, which must be referred to. Elements of the FRA guidance are outlined below:
• Appropriate land use in flood risk areas
• Undefended areas – Flood risk mitigation
• Defended areas
• Overtopping
• Breaching
• Public Safety and rapid inundation
• Feasibility of flood risk mitigation
Using the information supplied by both levels of SFRA there are a number of key flood risk issues which should be included in a FRA for any development in central Wakefield.
6.2 Assessment of Fluvial Risk
As discussed, the River Calder and Ings Beck provide the main source of fluvial risk to central Wakefield. While the River Calder is defended to 100 year standard and Ings Beck is expected to reach the same standard once the scheme is complete, there is still the need to consider the residual risks.
As noticed within this assessment a simple 1D model will not be detailed enough to assess the flood risk in central Wakefield. The River Calder has a 1D ISIS model but this must be combined with a 2D model to assess the residual risks of the Wakefield defence scheme for any site within its floodplain, not only to gain an accurate representation of flood depths and velocities but also the potential impact the development will have on current flow routes. Defence overtopping, breaching and gate failure scenarios are advised.
However, from a review of the 1D/2D model and the manner in which the floodplains fill, a simplified but conservative approach can be applied to the Waterfront area. Flood levels in that area are heavily influenced by the downstream water levels and those of the flood defence scheme. A simplistic assessment of flood level in this area can be achieved by using the in river level upstream of the weir. Floor levels should be placed above those levels with an allowance for freeboard and climate change. From the broad scale actual risk data in the Level 1 SFRA it is apparent that climate change sensitivity will be limited to less than 300mm within the floodplain. If a lower floor level is required a full assessment of the
City of Wakefield Metropolitan District Council Central Wakefield Area Action Plan Strategic Flood Risk Assessment
JBA Consulting www.jbaconsulting.co.uk N:\2008\Projects\2008s3024 - City Of Wakefield Metropolitan District Council - Wakefield Town Centre Regeneration Strategic Flood Risk Assessment\Reports\Final Report Jan 2009\CWAAP SFRA Report v1_6_Final.doc: 28/01/2009 26
residual risks and how they would be managed in an extreme (0.1%) event should be presented in the FRA.
The same is true for Thornes Wharf and Kirkgate areas, in that a precautionary approach can be used to set floor levels by use of the in-river water levels. However some reduction in flood level can be found between the level in the Calder and the wider floodplain. Again modelling would need to be undertaken to justify any floor level that is lower than the defence level. In particular this model should be a 2D assessment of flow paths and the potential for new development to alter flow paths.
A 1D model is not available for Ings Beck. It is important that a coupled 1D-2D model is constructed to access culvert capacities and actual flow routes along Ings Road and the impact any development will have on surrounding areas.
An assessment of the hydrological regime of the Calder and Ings Beck will also be required, developing the data provided by the Calder CFMP. This should be undertaken using available gauged records, Flood Estimation Handbook (FEH) techniques and wherever possible models should be verified using historical records of flooding.
6.3 Surface Water Assessments
As outlined within the level 1 SFRA there are a number of important locations in Wakefield where surface water is a major source of flood risk. This SFRA has identified a number of key areas within central Wakefield where past events, the presence of defences, culverts and significant flows paths mean that surface water assessments will be a crucial part of a site specific FRA. In general it has been concluded from the screening exercise that the Flood Zone map is heavily indicative of the likelihood of surface water flooding. Flat floodplains adjacent to rivers are generally susceptible to many forms of flooding, and protection from the fluvial source does not reduce or remove the other as significant sources.
Whilst the general approach is to control the surface water originating on the development site, it has to be noted that where developments are located over identified flow paths such as Ings Beck, Thornes Wharf and Kirkgate, development proposals must also incorporate their impact on surface water originating further a field into their mitigation plans. Through this there is an opportunity to develop and Integrated Water or Drainage Management Strategy across the Special Policy Area which should be linked to Surface Water Management Plans (SWMP) where available. An integrated approach to controlled surface water drainage can also lead to a more efficient and reliable surface water management system as it enable a wider variety of potential flood mitigation options to be used. The Level 1 SFRA recommends a number of SWMPs and Wakefield is a priority area.
It should be noted that the Areas Vulnerable to Surface Water Flooding maps produce for the Level 1 SFRA were only produced as a strategic assessment, and whilst they help identify potential depths of flooding, drainage routes and ponding areas, they should not be used for site-specific flood risk assessments. The outputs of these assessments should only be used in circumstance where extreme caution is needed as in central Wakefield and they do not preclude the need for more detailed drainage assessment during site specific FRAs rather they identify the potential problems and where greater detail is needed.
6.4 Emergency Planning
Central Wakefield is heavily defended with further defences proposed by the Environment Agency. However, while the majority of central Wakefield is defended to a 100 year standard residual risks discussed in this assessment are still present. Defences heights are finite and there is always the risk that a large event will occur, stressing the importance of alternative solutions in reducing the risk to people and property lying behind them.
Central Wakefield is also unique due to the limited number of access and egress routes throughout the area. Areas such as Thornes Wharf or Calder Vale rely on one or two routes to provide people with an escape route or emergency services access during times of
City of Wakefield Metropolitan District Council Central Wakefield Area Action Plan Strategic Flood Risk Assessment
JBA Consulting www.jbaconsulting.co.uk N:\2008\Projects\2008s3024 - City Of Wakefield Metropolitan District Council - Wakefield Town Centre Regeneration Strategic Flood Risk Assessment\Reports\Final Report Jan 2009\CWAAP SFRA Report v1_6_Final.doc: 28/01/2009 27
flooding, however these routes have also been identified as flow routes if the floodplain becomes inundated.
In an area such as central Wakefield and the difficulties faced with access and egress, appropriate emergency planning must be incorporated in any flood management proposals as well as placing further development within the area. Emergency planning can be a crucial tool in reducing the residual risk to both people and property. Current flood response plans must be considered if development is going to place a greater number of people in areas of high risk whether the actual risk can be managed or not.
City of Wakefield Metropolitan District Council Central Wakefield Area Action Plan Strategic Flood Risk Assessment
JBA Consulting www.jbaconsulting.co.uk N:\2008\Projects\2008s3024 - City Of Wakefield Metropolitan District Council - Wakefield Town Centre Regeneration Strategic Flood Risk Assessment\Reports\Final Report Jan 2009\CWAAP SFRA Report v1_6_Final.doc: 28/01/2009 28
7 CONCLUSION
7.1 Conclusion
This document has been produced to support the Central Wakefield Area Action Plan (CWAAP) and the Calder Valley Level 1 Strategic Flood Risk Assessment by provided a detailing investigation into sources, pathways and receptors of flood risk in central Wakefield. Together, these documents will assist the Local Development Framework (LDF) and the policies and proposals produced for the development and use of land within central Wakefield.
Five Special Policy Areas identified within the CWAAP have been used to investigate flood risk in more detail. Due to the location of central Wakefield and the position of flood defences along the River Calder and Ings Beck it was important to assess the residual risks still present after current flood management measures have been taken.
To do this, detailed 1D-2D modelling was used to assess the impacts of both overtopping of the Wakefield flood defence scheme and the possible effect of gate failure on adjacent flood cells. Surface water modelling was also undertaken to assess the wider impacts of flash flooding on central Wakefield. This process has allowed the Level 2 SFRA to increase its scope and to identifying flood risk areas outside of the undefended Flood Zone Maps.
The general findings from this Level 2 SFRA are outlined below:
• Central Wakefield is at risk from flooding from a number of sources including defence overtopping and gate failure as well as being vulnerable to surface water flooding.
• While defences provide a 100 year standard of protection along the River Calder, Thornes Wharf and the Waterfront are especially at risk from deep fast flowing water during the overtopping of such defences in larger events.
• Thornes Wharf and the Waterfront are also at risk from gate failure along the left hand bank of the River Calder and through Wakefield Locks during smaller events. Whilst the canal does provide some sort of flood conveyance further restrictions along or adjacent to the canal through development could increase the risk of flooding to the northern side of the area.
• Thornes Wharf is also at risk from more probable events. This is due to the washland upstream of the railway viaduct exceeding its capacity and either overtopping or bypassing its flood bank. Also surface water from the local area, and also from Ings Beck adds another flood risk source, which could generate significant flood depths.
• Whilst the risk of fluvial flooding to Ings Road and Kirkgate are small, these areas are probably more susceptible to surface water flooding due to their position on low lying land and their location on important surface water flow paths.
• Access and egress increase the vulnerability and impact of flooding in central Wakefield due to limited number of routes available. Each route is also susceptible to flooding.
The findings of this Level 2 SFRA will provide the evidence base for the CWAAP to apply the Exception Test to the areas identified for development. It will also help the implementation of a sequential approach towards allocation and planning individual sites within the special policy areas. This has been assessed using a number of indicators that demonstrate where the most appropriate area to develop each major land use type and hence deliver the background for the Exception Test.
City of Wakefield Metropolitan District Council Central Wakefield Area Action Plan Strategic Flood Risk Assessment
JBA Consulting www.jbaconsulting.co.uk N:\2008\Projects\2008s3024 - City Of Wakefield Metropolitan District Council - Wakefield Town Centre Regeneration Strategic Flood Risk Assessment\Reports\Final Report Jan 2009\CWAAP SFRA Report v1_6_Final.doc: 28/01/2009 29
FIGURES