centralization, decentralization and conflict in the...
TRANSCRIPT
Policy ReseaRch WoRking PaPeR 4774
Centralization, Decentralization, and Conflict in the Middle East
and North Africa
Mehmet Serkan TosunSerdar Yilmaz
The World BankSustainable Development NetworkSocial Development DepartmentNovember 2008
WPS4774P
ublic
Dis
clos
ure
Aut
horiz
edP
ublic
Dis
clos
ure
Aut
horiz
edP
ublic
Dis
clos
ure
Aut
horiz
edP
ublic
Dis
clos
ure
Aut
horiz
edP
ublic
Dis
clos
ure
Aut
horiz
edP
ublic
Dis
clos
ure
Aut
horiz
edP
ublic
Dis
clos
ure
Aut
horiz
edP
ublic
Dis
clos
ure
Aut
horiz
ed
Produced by the Research Support Team
Abstract
The Policy Research Working Paper Series disseminates the findings of work in progress to encourage the exchange of ideas about development issues. An objective of the series is to get the findings out quickly, even if the presentations are less than fully polished. The papers carry the names of the authors and should be cited accordingly. The findings, interpretations, and conclusions expressed in this paper are entirely those of the authors. They do not necessarily represent the views of the International Bank for Reconstruction and Development/World Bank and its affiliated organizations, or those of the Executive Directors of the World Bank or the governments they represent.
Policy ReseaRch WoRking PaPeR 4774
This paper examines broadly the intergovernmental structure in the Middle East and North Africa region, which has one of the most centralized government structures in the world. The authors address the reasons behind this centralized structure by looking first at the history behind the tax systems of the region. They review the Ottoman taxation system, which has been predominantly influential as a model, and discuss its impact on current government structure. They also
This paper—a product of the Social Development Department, Sustainable Development Network—is part of a larger effort in the department to study local governance systems and decentralization in the client countries. Policy Research Working Papers are also posted on the Web at http://econ.worldbank.org. The author may be contacted at [email protected].
discuss the current intergovernmental structure by examining the type and degree of decentralization in five countries representative of the region: Egypt, Iran, West Bank/Gaza, Tunisia, and Yemen. Cross-country regression analysis using panel data for a broader set of countries leads to better understanding of the factors behind heavy centralization in the region. The findings show that external conflicts constitute a major roadblock to decentralization in the region.
Centralization, Decentralization, and Conflict in the Middle East and North Africa
Mehmet Serkan Tosun* University of Nevada, Reno
and
Serdar Yilmaz**
World Bank
JEL classification: H77, H87, N45, O53
Key words: Fiscal decentralization, intergovernmental relations, Middle East and North Africa
The authors thank Lyn Squire, Blanca Moreno-Dodson Jennifer Keller and Robert Beschel for helpful comments and suggestions, Dilek Uz and Omid Harraf for excellent research assistance. The findings, interpretations, and conclusions are entirely those of authors, and do not represent the views of the World Bank, its executive directors, or the countries they represent. Corresponding author: Serdar Yilmaz. * Department of Economics, College of Business Administration, University of Nevada-Reno, Reno, Mail Stop 0030. Nevada 89557; [email protected]; phone: +1-775-7846678. ** Social Development Department, World Bank, 1818 H Street, NW, Washington D.C. 20433; [email protected]; phone: +1-202-473-9350.
Centralization, Democracy, and Conflict in the Middle East and North Africa 1. Introduction
There have been significant decentralization efforts in developing countries in
recent decades. These efforts led to an extensive literature on the causes and
consequences of both centralization and decentralization. In this paper, we examine
decentralization and intergovernmental relations in the Middle East and North Africa
(MENA), a region that has lagged behind other developing regions in decentralization.
The MENA region has unique socio-economic and political characteristics. First,
there is economic dependency on oil revenues particularly in Gulf Cooperation Council
(GCC) countries. Second, the MENA region has one of the highest population growth
rates in the world. This demographic explosion has led to young population structures
throughout the region. Third, the region has been impacted by both internal and external
conflicts that have affected economic performance of the countries.
Despite these good reasons to study government structure in the MENA, there is
surprisingly sparse literature on the region. While recent studies followed a comparative
perspective and showed similarities and differences between the decentralization efforts
in a variety of developing countries, the MENA countries are left out of those
comparisons (Bardhan and Mookherjee, 2006). This is mainly due to lack of appropriate
data and information on decentralization in the countries of the region. Our goal in this
paper is to combine descriptive and empirical analyses to provide a comprehensive
picture of decentralization and the reasons behind its slow progress. We also discuss
some reform options.
2
The paper is structured as follows. In the next section we look at the history of
decentralization and centralization in the region by examining the taxation system of the
Ottoman Empire. We provide a comparative description of the intergovernmental
structure in five MENA countries, Iran, Egypt, Tunisia, West Bank/Gaza and Yemen in
Section 3. In Section 4 we explore the determinants of centralization and decentralization
in the region in a regression analysis. We discuss the intergovernmental reform options in
the final section.
2. Centralization in the MENA Countries: A Historical Perspective
MENA countries have relatively more centralized government structures
compared to other developing countries. It is argued that many MENA countries have
based their government organization on the administration structure of the Ottoman
Empire.
2.1. Ottoman Taxation System
Overall, the Ottoman taxation was a centralized system of taxation. Lewis (1979)
argues that Ottoman taxation included elements from Islamic taxation as well as from
taxation law and practices of Roman, Byzantine, Mongolian, Turkish and pre-Islamic
Persian civilizations. Cosgel (2005) examines the evolution of the tax system in the
Ottoman Empire as a clash between competition and rigidity in institutions. For example
he argues that while the Ottomans changed the tax system in the conquered lands to
collect revenue in the most efficient way, they were faced with local institutional
constraints. Hence, this explained the substantial regional variation in taxes throughout
the empire.
3
Lewis also asserts that Ottoman tax administration changed from a relatively
decentralized system with strong center to a weaker but more centralized system. This
change started around the end of the sixteenth century. There had been a consolidation of
tax collection after the sixteenth century, particularly during the eighteenth and
nineteenth centuries.1 While many argue that this coincides with the stagnation and
decline in the Empire, Barkey (2008) argues that this “adaptation was a sign of flexibility
and pragmatism, not a sign of decline.”2 In places such as Egypt more government
centralization took place in accordance with heavier European influence (Hanna, 1995).
In this centralization trend, we see a change from the Timar system (strong center with
decentralized military expenditures) to Iltizam or Tax-farming system (weaker center
with more centralization of military and more decentralization of other government
services at the province level) towards the end of the sixteenth century. Timar is a land-
tenure system where the land was allocated to Sipahis (feudal cavalry) in return for
military service in Ottoman provinces (Barkey, 1994: 36).3 In the Iltizam system the state
receives an initial monetary sum from private interests in return for rights to collect taxes
(Barkey, 2008: 229). Some of the reasons for the system change from Timar to Iltizam
were: Sipahi cavalry becoming less important due to introduction of new war
technologies, higher demand for full-time regular troops, changing patterns of trade,
influx of Spanish silver from America and subsequent inflation leading to a sharp
1 See Barkey (2008, Part 2) and Inalcik (1977) for excellent accounts of transformation in the Ottoman administration towards centralization in the eighteenth and nineteenth centuries. 2 Barkey, Empire of Difference: The Ottomans in Comparative Perspective, 194. 3 Inalcik (1994: 114-118) gives a detailed description of the Ottoman Timar system. As Inalcik notes, an interesting characteristic of the Ottoman Timar system was “the lack of inheritance rights on land and the frequent dismissal from timars” (Inalcik, 1994: 115). With the Timar system, Ottoman state was able to maintain provincial armies without direct centralized expenditures. In addition, the lack of inheritance rights prevented timar holders from forming land-based hereditary nobility that could become a threat to the central authority.
4
decrease in real income (Lewis 1979, Barkey 1994). Barkey (1994) argues that Ottoman
state was able to overcome (global) economic distress without any significant rebellions
throughout the empire. She explains that this was mainly due to success of the state in
aligning officials at different levels of government with the objectives and success of the
central government. Similarly, Hess (1977) describes what can be called Ottoman central
administration’s success in keeping the North African provinces of the empire in the
midst of decentralization in the eighteenth century.
There have been few sporadic efforts to change the centralized government
structure in the Ottoman Empire. For example, Saliba (1978) explains in detail efforts
and achievements of Midhat Pasha to decentralize political and fiscal powers when he
served as Governor of the Syrian province. Such efforts faced strong opposition from the
central government in Istanbul and were mainly approached with suspicion as the Empire
was experiencing significant loss of territories. Reform efforts during the Tanzimat or
Reorganization period in the nineteenth century aimed at creating a more centralized
government structure (Ortayli, 2006). This was thought to be a way to save the Empire
from total collapse.
McLure (2001) argues that tax assignment over different levels of government
depends on history, and has been subject to change through economic evolution. Hence,
he asserts there is no one-size-fits-all formula for tax assignment. Cosgel and Miceli
(2005) examine the tax assignment in the Ottoman Empire in the mid-sixteenth century.
They provide evidence that the tax assignment was done according to a transaction cost
hypothesis rather than risk hypothesis. They classify taxes into categories of fixed and
variable taxes. Fixed taxes category includes personal taxes based on marital and
5
economic status, input taxes based on production inputs such as land, trees and animals,
and enterprise taxes. These taxes are thought to be less risky due to absence of factors
that would cause variation and they also have lower transaction costs. Variable taxes
category includes trade taxes from market exchange of goods in towns and output taxes
such as taxes on grains, legumes and fibers. These taxes are riskier due to high variability
and also carry greater transaction costs for the same reason. Using data from Ottoman
tax registers (tahrir defterleri) the authors conduct an ordered probit analysis for the
influences on tax assignments and find that the proportion of variable taxes are negatively
associated with the higher levels of government lending support to the transaction cost
hypothesis which asserts that variable taxes can be more efficiently collected at the local
level due to lower transaction costs. The key underlying assumption here is that
transaction costs are higher for higher levels of government. The authors conclude that
transaction costs were more important in tax assignment in the Ottoman Empire.
However, they do not model fixed taxes specifically.
In summary, we see that the taxation system was not as centralized in the early
period (until the end of the sixteenth century) of the Ottoman Empire as it was in the later
period. Centralization gained momentum particularly during the Tanzimat
(Reorganization) period in the nineteenth century when the empire was declining rapidly
and consolidation of power at the center was seen as a solution to prevent total collapse.
Centralization that started in the sixteenth century is, by no means, unique to the Ottoman
Empire. In fact, Europe started its transformation from small, decentralized city-states to
large and centralized territorial states at the end of the fifteenth century.4 It was also
4 Alesina and Spolaore (2003) note that French invasion of Italy in 1494 marks the beginning of the period of absolutism in Europe. They argue that main reasons behind the centralization trend were the need for
6
argued that European influence in the Middle East and North Africa fueled more
government centralization (Hanna, 1995). Aside from few courageous attempts at
decentralization, the region inherited a heavily centralized system of taxation and public
administration from the Ottoman Empire and other European States.
3. Comparison of Intergovernmental Structure in Selected MENA Countries
In this section, we examine the intergovernmental structure in a selected number
of MENA countries to demonstrate the centralized features of local government systems
in the region. Our selection includes five countries representing both Maghreb and
Mashreq regions. These are Egypt, Iran, Tunisia, West Bank/Gaza and Yemen. The
central government in these countries is the senior partner in the intergovernmental
relationship. The share of subnational expenditures in GDP is very low compared to
OECD average of 17 percent5 (see Table 1). In many countries in the MENA region,
such as Yemen and Iran, a large share of the expenditures is disbursed through
subnational governments that act as agents of central government ministries and
departments. In these countries locally elected representatives have little decision-making
power over expenditures.
3.1. Deconcentration and Decentralization in MENA
Overall, local government systems in the MENA region can be characterized as a
form of deconcentration rather than one of devolved local self-government. In general,
the public administration system is highly centralized, equipped with an elaborate system
of deconcentrated field offices of line agencies. Decisions for the most part, especially
institutions and larger domestic markets caused by growing economies in Europe, and rising costs of war and public administration. 5 http://siteresources.worldbank.org/INTDSRE/Resources/WBFDISummaryNote17Aug2004.doc
7
service delivery decisions, are made by the central government and the role of
subnational authorities is largely confined to carrying these out.
In the region, the general trend is to have two distinct types of local government
units: deconcentrated and decentralized (municipal) units (See Table 2). The operations
of these two types of local governments are subject to totally different rules. In all
countries, the deconcentrated units of the central government provide a big chunk of
public services, including health and education, under strict guidance of the central
government. Whereas, decentralized units (generally municipalities) perform limited
number of functions such as street paving and maintenance, construction of local roads,
street lighting, garbage collection, library and park services, and issuing permits for
constructions.
Table 2 shows that our five selection countries differ in their deconcentrated
systems. While West Bank/Gaza and Tunisia have only provincial or governorate level
governments, Iran, Yemen and Egypt have a variety of sub-provincial level governments.
In all five countries, the central government and/or the President appoint the heads of
provincial governments. On the other hand, elected officials in all of them, except Egypt,
run municipalities. In Iran, representation of people is partial and indirect. First, there is
involvement of the Ministry of Interior (MOI) in both urban and rural municipalities.
Second, people elect city or village councils that in turn appoint mayors jointly with the
MOI.
3.2. Expenditure Assignment
Although the degree of centralization differs among MENA countries, they
generally have heavily centralized expenditure and revenue systems. In almost all
8
countries in the MENA region the assignment of expenditure responsibilities between
central and local governments does not conform to generally accepted principles for
setting the right incentives for efficient and equitable delivery of public services. In
contrast, intergovernmental expenditure responsibilities have been assigned largely
according to static bureaucratic and administrative considerations.
In the region, subnational deconcentrated governments have a very limited
number of “own” responsibilities. Most of the local expenditure responsibilities can be
classified as “delegated” expenditures as opposed to “own” expenditure responsibilities.6
Central government ministries make decisions on most services that are traditionally
provided by local governments in other countries (See Table 3).
Table 3 shows the expenditure assignments in five MENA countries and also
includes the worldwide practice. Expenditure assignments are indicated as central
government (C), provincial government (P), and municipal government (M).
Assignments are shown for Social Services, Transportation, Utility Services and Other
Services, and are also broken down by Macro Policy and Oversight, Financing, and
Provision. MENA countries have significantly more centralized expenditure functions
compared to the worldwide practice. To compare MENA countries among themselves,
we assigned points to central, provincial and municipal government involvement in
expenditures. Accordingly, we assigned 1 point to C, 2 points to P and 3 points to M.7
Total expenditure assignment scores and average scores are listed in Table 4. The average 6 Delegated responsibilities are those transferred to the deconcentrated branch units of the central government for delivery of services while the actual decisions on budgeting and financing are carried out at the central level. Some of the delegated responsibilities, such as primary education, health, and public security have high local public good characteristics and in many countries are not delivered by locally elected governments. 7 In addition we assigned 1.5 points to C, P; 2.5 points to P, M and 2 points to C, P, M. We gave 1 instead of 0 to central government assignments since the worldwide practice shows that some central government involvement is probably desirable to facilitate decentralization.
9

scores for countries across government services and government involvement show that
West Bank/Gaza has the most decentralized expenditure system among the group
followed, in order, by Egypt, Iran, Tunisia and Yemen.
3.3. Revenue Assignment
Table 5 shows revenue assignment characteristics in the region. West Bank/Gaza
is the only country with a truly decentralized revenue system. However, municipal
revenue autonomy in West Bank and Gaza is not something granted by the laws. Due to
the circumstances, municipalities invent their own ways of raising revenues and they
often find ways of rationalizing such practices (World Bank, 2006).
Other than West Bank/Gaza, all other countries in the region have largely an ad-
hoc local revenue system. The only exception might be property tax system in Iran. We
see a glimpse of autonomy in land-based taxation in Iran.
3.4. Intergovernmental Transfer Characteristics
Table 6 shows that allocation rules for transfers to local governments are also
mainly ad-hoc, except in Tunisia and West Bank/Gaza. In both countries, the transfer
system is based on a formula. In West Bank and Gaza municipalities have been
historically less dependent on central government transfers compared to other countries
in the region. Both due to historical reasons and current political and security problems,
West Bank and Gaza municipalities rely little on central government transfers in
providing services. In fact, this situation has not been affected significantly by the
Intifada period, as there is no difference today in the amount of central government
10
transfers as a share of total local revenues, which remains constant at about 5 percent8
(World Bank, 2006).
3.5. Discussion
In this section, we presented an overview of the deconcentration and
decentralization systems in selected MENA countries and compared these countries in
terms of three important aspect of decentralization: expenditure assignment, revenue
assignment and intergovernmental transfers. We also compared these countries to the
worldwide practice in expenditure assignments. First, we see a good potential for a rich
deconcentrated and decentralized government structure in MENA countries. Most of the
countries analyzed have a good number of lower tier governments such as governorates,
districts and a variety of municipalities (e.g. 1000 urban municipalities and 68,000 rural
municipalities in Iran). Second, MENA countries are significantly behind the worldwide
practice in decentralization regarding expenditure assignments. We see in Table 4 that
this is particularly true in social services, which is one of the most important government
expenditures that directly affect the welfare of residents. Third, West Bank/Gaza seems to
have the greatest degree of decentralization from the perspective of both expenditure and
revenue assignments. Among the countries analyzed, West Bank/Gaza gives the greatest
autonomy to its local governments. While this highlights West Bank/Gaza as an
interesting case to consider for other countries in the region, one should approach the
decentralization efforts cautiously as the observed decentralization seems to spring from
special political and security circumstances of that country. Finally, there is need for
improvement in intergovernmental relations in MENA countries. Intergovernmental
transfer rules are largely ad-hoc. Our comparative analysis leads us to conclude that 8 This is the average figure for West Bank and Gaza municipalities in the Intifada period.
11
MENA countries have highly centralized government fiscal structures. This is despite our
observation that there is a potentially rich deconcentrated and decentralized government
systems. In the next section, we will examine the reasons behind this heavy centralization
using different regression analyses.
4. Determinants of Centralization and Decentralization
4.1. Measurement Issues and Review of the Literature
Decentralization is difficult to measure. Despite the popularity of decentralization
as a research topic in recent literature, there are serious problems with the measurement
of decentralization. Ebel and Yilmaz (2003) note that this is mainly due to data
imperfections, particularly in the IMF’s Government Finance Statistics (GFS). Problems
with data availability and quality get worse in the case of the MENA countries. Hence an
empirical investigation of decentralization in the MENA region is difficult due to
aforementioned data problems. As so many other studies did before us, we started with
data from the GFS. We have realized however that data on conventional fiscal
decentralization measures such as share of local governments in total government
expenditures or revenues are simply nonexistent. That left us with using data on total
central government expenditures relative to an economic base such as gross domestic
product (GDP). Thus, we first used total budgetary central government expenditures as
share of GDP of the country. While this measure captures mainly the size of the central
government, it will also be closely related to the degree of delegation of central
government powers to lower levels of government. A reduction in the size of the central
government could be one avenue for decentralization. Indeed, we get a negative
correlation (-0.47) between the share of local government spending in GDP for the
12
countries shown in the first column of Table 1 and the average share of central
government expenditures from our panel dataset. In the absence of better government
finance data on fiscal decentralization, we use central government expenditures to get a
feel for the weight of central government in economic activity.
We also use a non-financial measure of decentralization, which is derived from
the World Bank’s Database of Political Institutions (DPI). This decentralization indicator
is created by taking the sum of three other indicator variables from DPI for local elections
in municipal governments (Muni), local elections in state/province governments (State)
and authority over taxing, spending or legislating in state/provinces (Author).9 Hence,
higher numbers in our decentralization indicator mean greater degree of decentralization.
There is considerable literature on the effects of fiscal decentralization on
economic growth. Determinants of fiscal decentralization received less attention. Two
recent papers provide theory and empirical evidence on the determinants of the
decentralization process in a wide variety of countries. Panizza (1999) builds on the work
by Alesina and Spolaore (1997) on the number and size of nations by introducing
different levels of government. Panizza’s theoretical model shows negative correlations
between fiscal centralization and country size, income per capita, taste differentiation and
level of democracy. He finds empirical evidence supporting these theoretical correlations.
Panizza also compares his results to two other cross-sectional or panel studies by Oates
(1972) and Wallis and Oates (1988) and finds similarities particularly in regards to
country size and income per capita. Arzaghi and Henderson (2005) examine the
determinants of fiscal decentralization using panel data on 48 countries over the period
9 Muni, State and Author are the names used in DPI under the sub-heading “Federalism.” See Beck et al. (2001) and Keefer (2007) for detailed descriptions of these variables. Higher numbers indicate greater degree of federalism, and thus decentralization of central government authority.
13
1960 to 1995. They show that the Middle East and North Africa region has the highest
share of central government and the lowest federalism index.10 They also show that the
Middle East and North Africa lags behind all other regions in the democracy index.
Arzaghi and Henderson follow Panizza’s approach to model decentralization first and
then empirically test hypotheses derived from the theoretical model. Their empirical
findings mainly confirm previous findings on the determinants of decentralization (or
centralization). They find that past colonial experience and initial constitutional
provisions matter in the decentralization process.
4.2. Empirical Analysis
We are using an unbalanced panel for fourteen countries with a study period
broadly from 1975 to 2004.11 As mentioned above, we are examining centralization and
decentralization in MENA in two parts. In the first set of regressions we use total
budgetary central government expenditures as share of GDP as our dependent variable,
which we see as a rough indicator of centralization. To address the shortcomings of this
variable as a measure of centralization (or decentralization), we run a second set of
regressions with a decentralization indicator derived from DPI as the dependent variable.
Given our key dependent variable measuring degrees of decentralization, which is
thus inherently ordered, our second set of regressions are based on the probabilistic
ordinal dependent variable regression model of the Logit type
( ) ( ) ( )1 ,j jP Y j X X Xμ β μ β−′= = Λ − −Λ − ′
10 Their evidence on MENA is based on only few countries in the region due to problems with available data on fiscal decentralization. 11 These fourteen countries are Bahrain, Djibouti, Egypt, Iran, Jordan, Kuwait, Lebanon, Libya, Morocco, Oman, Saudi Arabia, Syria, Tunisia and Yemen. We had to reduce our sample to nine countries in the regressions with central government expenditures due to lack of government expenditure data for Djibouti, Lebanon, Libya, Saudi Arabia and Yemen.
14
where ( XjYP = ) is the probability of observing { }Jj ,..,0∈ outcome of the
dependent variable Y conditional on the vector X of individual country characteristics, Λ
is the standard logistic distribution function, and β is the vector of regression
coefficients to be estimated by the Maximum Likelihood method. Denoting *Y the latent
variable driving the observed outcomes of Y and jμ the 1−J cutoff points such that
jj μμ <−1 , the model assumes that 0=Y if Y , 0* μ< jY = if , and
if .
jμ<jμ −1 Y <*
JY = μ *1 YJ <−
Our choice of explanatory variables is based mainly on the theoretical and
empirical analyses by Oates (1972), Wallis and Oates (1988), Panizza (1999), and
Arzaghi and Henderson (2005). We use GDP per capita, Population and Land Area to
capture the effects of the size of the economy and the size of the country. Oates (1972),
Panizza (1999) and Arzaghi and Henderson (2005) all found that these are negatively
correlated with centralization. If decentralization is a normal good, we would expect a
negative relationship between income per capita and centralization (Panizza, 1999).
Wallis and Oates (1988) argue that smaller states may benefit more from centralization as
economies of scale may not be exhausted due to small population size at decentralized
levels. Wallis and Oates also argue that population concentration in urban areas increase
the benefits from decentralization. Hence, we would expect a negative relationship
between urbanization and centralization. We use Share of Urban Population to find the
effect of population concentrations. Both Panizza (1999) and Arzaghi and Henderson
(2005) point to the importance of democracy and other institutional factors in
decentralization. In Panizza’s model level of democracy is inversely related with the
willingness of the central government to extract rent and ignore the preferences of the
15
median voter, which imply a negative correlation between democracy and centralization.
We use Democratic Environment and Quality of Governance as two types of institutional
variables. These come from the International Country Risk Guide (ICRG) published by
the PRS Group.12 Democratic Environment is the average of the following political risk
components law and order, democratic accountability, military in politics, and religion in
politics. Quality of Governance is the average of law and order, bureaucratic quality and
corruption.13 Finally, we add two other variables that were not specifically used by the
literature mentioned above. First, we have Trade Openness, traditionally defined as the
ratio of the sum of exports and imports to GDP. Rodrik (1998) argues that more open
countries have larger governments to stabilize the economy against external shocks. To
the extent that the stabilization role is undertaken by the central government we would
expect a positive relationship between openness and centralization. The second variable
we introduce is External Conflict. This may be an important factor in centralization
especially in the MENA region. Tosun and Sen (2007) show that the MENA countries
have more major conflicts such as war, on average, than other developing countries. They
find evidence of significant spatial spillovers from regional conflicts. Alesina and
Spolaore (2003) present a model with conflict and size of nations. They show that
external shocks give a strong incentive to form larger jurisdictions. We draw a parallel
and further argue that external shocks may legitimize greater central government budgets
since national defense is a function of government undertaken by the central government.
Alesina and Spolaore also address the interaction between democratization and conflicts,
12 Note that higher risk points correspond to an improvement in the institutional variable. 13 This was recently used as a measure of governance quality by Knack (2001). Components of these institutional variables, particularly corruption in government, were used in many other studies including Tanzi and Davoodi (2000), Mauro (1996) and Knack and Keefer (1995).
16
showing that democratization becomes a less important factor in reducing the size of
countries when there are major conflicts. We also examine how the impact of
democratization changes when external conflict is introduced into the empirical analysis.
Data on External Conflict also comes from the ICRG dataset. We adjusted this variable,
however, to have higher points representing worsening of conflicts.14 Finally, we use
GCC as a dummy variable for the Gulf Cooperation Council (GCC) countries to control
for the possible impact of heavy dependence on oil on the government structure of these
countries.15
4.3. Empirical Results
We provide the summary statistics on the variables described above in Table 7.
We start with the first set of regression results in Table 8. In addition to the explanatory
variables explained above, we also include country fixed effects in our Table 8
regressions. Hence, country characteristics such as land area, being an oil producer, and
all time invariant institutional factors are captured by the fixed effects estimation. We
also see that serial correlation of errors could be a serious problem in our data. We run
AR(1) fixed effects regressions to correct for the serial correlation problem.
We find that the coefficients of the size variables, GDP per capita and Population
have the expected negative sign but not statistically significant in all four regressions.
The coefficient of the Share of Urban Population is positive, significant and robust
across all regressions. This finding is counter to the argument by Wallis and Oates
(1988). We see in columns (1) and (2) that both institutional variables have the expected
14 We have also tried with a variable on internal conflicts but that didn’t turn out be a significant factor in any of the regressions. 15 We removed GCC and Land Area from the first set of regressions as these cause perfect multicollinearity in the fixed effects regressions.
17
negative sign and statistically significant with lower significance for the Quality of
Governance. Column (3) shows that External Conflict has a significant positive effect on
centralization, which is also expected as we argued above in section 4.2. When we
include both institutional variables and external conflict in the same regression in column
(4), we see that External Conflict still has a positive and significant effect while
democratic environment loses its significance and the coefficient of quality of
governance turns positive. Hence, external conflict is the only robust factor among the
institutional and conflict variables. Similar to the implications of the theoretical model of
Alesina and Spolaore (2003), we find that Democratic Environment loses its importance
when External Conflict is added to the analysis. Finally, Trade Openness is significant
only in regressions (3) and (4). With a positive and significant coefficient, results for
openness in columns (3) and (4) support Rodrik’s argument.
While results in Table 8 are interesting, these regressions are open to the criticism
that the dependent variable, central government expenditure as share of GDP, may just be
capturing the size of central government instead of centralization in the government
sector. To address this, we ran a second set of regressions with a decentralization
indicator derived from the World Bank’s Database of Political Institutions (DPI). Since
our new dependent variable is an indicator variable where higher numbers indicate
greater decentralization, ordered logit regressions are run as described in section 4.2.
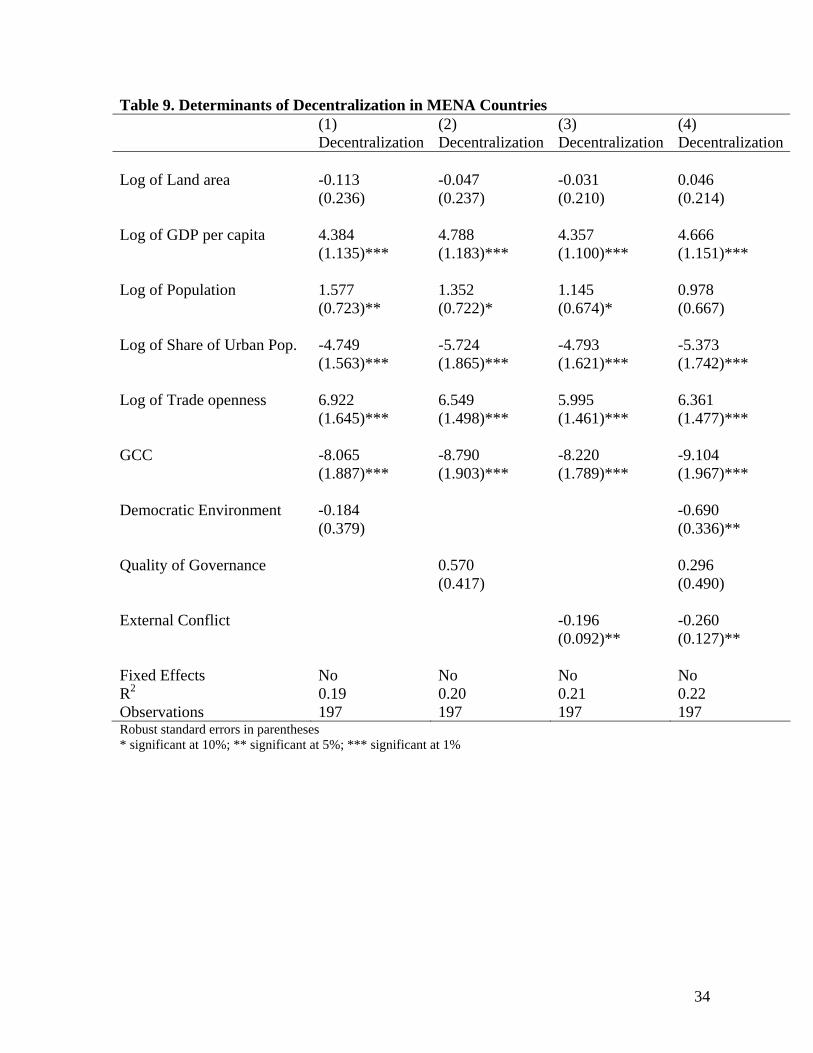
Results from those regressions are shown in Table 9. We get similar results to the ones in
Table 8. We find that the size variables, GDP per capita and Population have the
expected positive sign and they are statistically significant in most of the regressions. The
coefficient of the Share of Urban Population is negative and significant in all regressions,
18
which is counter to the argument that urbanization triggers decentralization. We now get
conflicting results from our institution variables in columns (1) and (2). While Quality of
Governance has the expected positive sign, it is not statistically significant. What is
surprising is that Democratic Environment has a negative sign indicating a negative effect
on decentralization. While this may seem puzzling, it may be pointing to a possible
nonlinear relationship between democratization and decentralization. It may be that it is
too early to see the decentralization outcome in MENA countries during the initial phase
of democratization. Results in column (3) shows that External Conflict still has the
expected negative effect on decentralization (or positive effect on centralization). When
we again include both institutional variables and External Conflict in the same regression
in column (4), we see that External Conflict still has a negative and significant effect on
decentralization. Hence, we repeat that External Conflict is the only robust factor among
the institutional and conflict variables. Finally, we see that GCC countries have
significantly lower level of decentralization compared to other MENA countries and
trade openness also has a positive and significant association with decentralization.
In summary, our main findings show that improvements in the institutional
variables have some negative effect on the centralization but these do not seem to be as
important as the strong negative (positive) decentralization (centralization) effect of
external conflicts. When we examine the marginal effect from external conflict in the
ordered logit regression in column (4) of Table 9, we compute that every one degree
improvement in external conflict increases the probability of moving from a zero score in
decentralization to a score of one by about 4%. This may look small but considering that
MENA countries, on average, had an external conflict score of 10 out of a maximum of
19
12 in 2003, they have a lot of room for improvement in external conflicts. For example, if
MENA countries manage to move to a zero score on external conflicts, which means no
external conflicts, this would increase the same probability by 40%.
5. Intergovernmental Reform Options and Conclusions
Our empirical analysis gives us interesting insights into determinants of the
central government’s role in the economy. The most striking result is the significant role
of external conflicts in centralization (or decentralization). It seems external conflicts set
a major obstacle in decentralization. This would lend itself to a recommendation that
countries in the region and other related countries should work together to remove this
obstacle. As Tosun and Sen (2007) suggest regional conflict prevention is an
international public good and a collective provision of this public good would ease the
burden on central governments of individual countries. This will, in turn, release
resources from the grasp of central governments that are currently charged wholly with
the provision of this public good and make it available to the local governments.
A precondition for transferring additional resources to local governments is fixing
intergovernmental fiscal systems. The most striking feature of the public management
system in the MENA region is the degree of centralization. All countries in the region
have a highly centralized administrative structure with very limited decision-making
power assigned to local governments. For a variety of reasons (e.g., tradition, history,
culture), responsibilities assigned to local governments have not been as extensive as
those in many other parts of the world. In their efforts to reform local government sector,
governments should recognize that decentralization requires sharing of fiscal roles and
responsibilities between central and local governments accompanied by a robust capacity
20

to deliver services both centrally and locally. The challenge is to determine how to sort-
out the responsibilities and financing among different types of local governments. It is
important for the decision makers in the region that decentralization reforms may be
asymmetric. They can set criteria to classify local governments into different categories
that have asymmetric taxing and spending responsibilities and borrowing privileges. This
would give impetus to decentralization reform process by which regional governments
(governorates) and local governments might be empowered with increased autonomy in
expenditure and revenue decisions. However, they should keep in mind that there is a
need for systematically reviewing legal and regulatory standards for “sorting out” rules
and responsibilities among different types and levels of governments.
Decentralization is a dynamic process where the intergovernmental relations
system needs constant adjustments. The governments in the region should consider
establishing a mechanism to (a) improve the design and gauge the direction, pace, and
extent of decentralization, and (b) disseminate information, provide training and directly
engage municipal governments in the decentralization process.
In the long run, the governments in the region need to devolve expenditure
responsibilities further to local governments while making them fully accountable before
their respective constituencies for policy results, in terms of their effectiveness and
efficiency in delivering quality public services. To this end, they should consider
strengthening local government accountability mechanisms by systemic collection,
analysis, and dissemination of information about local fiscal performance and compliance
with financial and policy goals. Such information is essential both to informed public
21
participation through political process and to the monitoring of municipal performance by
the central government.
An important issue in the MENA region is to increase local public expenditure
efficiency in areas of concurrent expenditure responsibilities and creating strong
incentives (financial and legal) to promote cooperative arrangements among local
governments for service delivery. In this context, outsourcing public service to the private
sector as well as private sector participation in both financing and delivery of public
services can be a way to improve overall efficiency of local government expenditures.
In reforming local government systems the most challenging task for the
governments in the region would be restructuring the overall revenue system in a manner
that provides local governments “fiscal space” to strengthen own revenue and
expenditure arrangements. The governments should first make sure that adequate steps
are taken to establish accountability mechanisms, then boost revenue autonomy by giving
local governments adequate decision-making powers on tax rates and the determination
of some tax bases in order to improve budgetary predictability. They should gradually lift
central government controls on local fees and taxes after making sure that local revenue
mobilization is maintained.
An important characteristic of intergovernmental fiscal systems in the region is
the use of ad hoc transfers. The governments should study rationalizing the transfer
system so as to make it more effective instrument for the implementation of policies of
national interest at the local level and reduce horizontal fiscal disparities. This would
include an examination of conditional and unconditional (e.g., equalization) transfer
systems alike. They should established transparent rule-base transfer system with explicit
22
formulas for equalization. They should explore ideas for a combination of unconditional
and matching open-ended type of grants that would to force municipal governments to
exploit their revenue bases. A related topic is to enforce hard budget constraints for local
governments. Governments in the region should credibly commit to a hard budget
constraint and avoid bailing out local governments that get into a financial mess.
23
References
Alesina, A., and E. Spolaore. 2003. The Size of Nations. Cambridge, MA: The MIT Press.
Alesina, A., and E. Spolaore. 1997. “On the Number and Size of Nations,” Quarterly Journal of Economics 112: 1027-1056.
Amin, Khalid and Robert Ebel. 2006. "Intergovernmental Relations and Fiscal Decentralization," Policy Note 8, Egypt Public Expenditure Review, Social and Economic Development Group, Middle East and North Africa Region, World Bank.
Amin, Khalid. 2005. "Fiscal Decentralization and Poverty: A Cross-Sectional Analysis with A Case Study of Egypt," Ph.D. Dissertation, New York University.
Arzhagi, Mohammad and J. Vernon Henderson. 2005. “Why Countries are Fiscally Decentralizing,” Journal of Public Economics 89: 1157-1189.
Bardhan, Pranab and Dilip Mookherjee. 2006. Decentralization and Local Governance in Developing Countries: A Comparative Perspective. Cambridge, MA: The MIT Press.
Barkey, Karen. 2008. Empire of Difference: The Ottomans in Comparative Perspective. New York, NY: Cambridge University Press.
Barkey, Karen. 1994. Bandits and Bureaucrats: The Ottoman Route to State Centralization. Ithaca: Cornell University Press.
Beck, T., G. Clarke, A. Groff, P. Keefer and P. Walsh. 2001. "New Tools in Comparative Political Economy: The Database of Political Institutions," The World Bank Economic Review, 15 (1): 165-176.
Cosgel, Metin M. 2006. “Taxes, Efficiency, and Redistribution: Discriminatory Taxation of Villages in Ottoman Palestine, Southern Syria, and Transjordan in the Sixteenth Century,” Explorations in Economic History 43: 332-356.
Cosgel, Metin M. 2005. “Efficiency and Continuity in Public Finance: The Ottoman System of Taxation,” International Journal of Middle Eastern Studies 37: 567-586.
Cosgel, Metin M. and T.J. Miceli. 2005. “Risk, Transaction Costs, and Tax Assignment: Government Finance in the Ottoman Empire,” The Journal of Economic History 65 (3): 806-821.
Ebel, Robert D. and Serdar Yilmaz. 2003. “On the Measurement and Impact of Decentralization,” in Jorge Martinez-Vazquez and James Alm, Public Finance in Developing and Transitional Countries: Essays in Honor of Richard Bird. Cheltenham, UK: Edward Elgar. Pp 101-119.
Hanna, Nelly. 1995. The State and its Servants: Administration in Egypt from Ottoman Times to the Present. Cairo, Egypt: The American University in Cairo Press.
Hess, Andrew C. 1977. “The Forgotten Frontier: The Ottoman North African Provinces During the Eighteenth Century,” in Studies in Eighteenth-Century Islamic History, ed. Thomas Naff and Roger Owen. Carbondale: Southern Illinois University Press, 74-87.
24
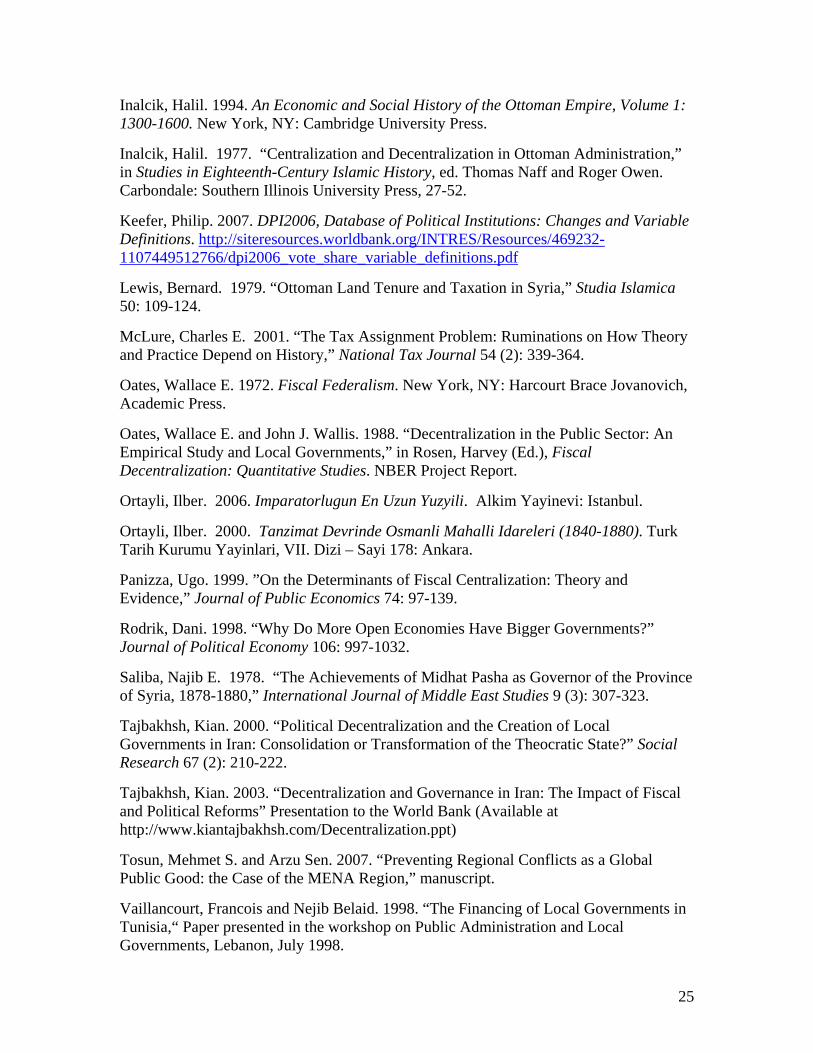
Inalcik, Halil. 1994. An Economic and Social History of the Ottoman Empire, Volume 1: 1300-1600. New York, NY: Cambridge University Press.
Inalcik, Halil. 1977. “Centralization and Decentralization in Ottoman Administration,” in Studies in Eighteenth-Century Islamic History, ed. Thomas Naff and Roger Owen. Carbondale: Southern Illinois University Press, 27-52.
Keefer, Philip. 2007. DPI2006, Database of Political Institutions: Changes and Variable Definitions. http://siteresources.worldbank.org/INTRES/Resources/469232-1107449512766/dpi2006_vote_share_variable_definitions.pdf
Lewis, Bernard. 1979. “Ottoman Land Tenure and Taxation in Syria,” Studia Islamica 50: 109-124.
McLure, Charles E. 2001. “The Tax Assignment Problem: Ruminations on How Theory and Practice Depend on History,” National Tax Journal 54 (2): 339-364.
Oates, Wallace E. 1972. Fiscal Federalism. New York, NY: Harcourt Brace Jovanovich, Academic Press.
Oates, Wallace E. and John J. Wallis. 1988. “Decentralization in the Public Sector: An Empirical Study and Local Governments,” in Rosen, Harvey (Ed.), Fiscal Decentralization: Quantitative Studies. NBER Project Report.
Ortayli, Ilber. 2006. Imparatorlugun En Uzun Yuzyili. Alkim Yayinevi: Istanbul.
Ortayli, Ilber. 2000. Tanzimat Devrinde Osmanli Mahalli Idareleri (1840-1880). Turk Tarih Kurumu Yayinlari, VII. Dizi – Sayi 178: Ankara.
Panizza, Ugo. 1999. ”On the Determinants of Fiscal Centralization: Theory and Evidence,” Journal of Public Economics 74: 97-139.
Rodrik, Dani. 1998. “Why Do More Open Economies Have Bigger Governments?” Journal of Political Economy 106: 997-1032.
Saliba, Najib E. 1978. “The Achievements of Midhat Pasha as Governor of the Province of Syria, 1878-1880,” International Journal of Middle East Studies 9 (3): 307-323.
Tajbakhsh, Kian. 2000. “Political Decentralization and the Creation of Local Governments in Iran: Consolidation or Transformation of the Theocratic State?” Social Research 67 (2): 210-222.
Tajbakhsh, Kian. 2003. “Decentralization and Governance in Iran: The Impact of Fiscal and Political Reforms” Presentation to the World Bank (Available at http://www.kiantajbakhsh.com/Decentralization.ppt)
Tosun, Mehmet S. and Arzu Sen. 2007. “Preventing Regional Conflicts as a Global Public Good: the Case of the MENA Region,” manuscript.
Vaillancourt, Francois and Nejib Belaid. 1998. “The Financing of Local Governments in Tunisia,“ Paper presented in the workshop on Public Administration and Local Governments, Lebanon, July 1998.
25

26
World Bank. 2006. “West Bank and Gaza: Intergovernmental Fiscal Relations and Municipal Finance Policy Note” Report Number. 36519-WBG, World Bank, Washington, DC.
United Nations Development Program (UNDP). 2004. “Support to Palestinian Local Government Reform Project.”
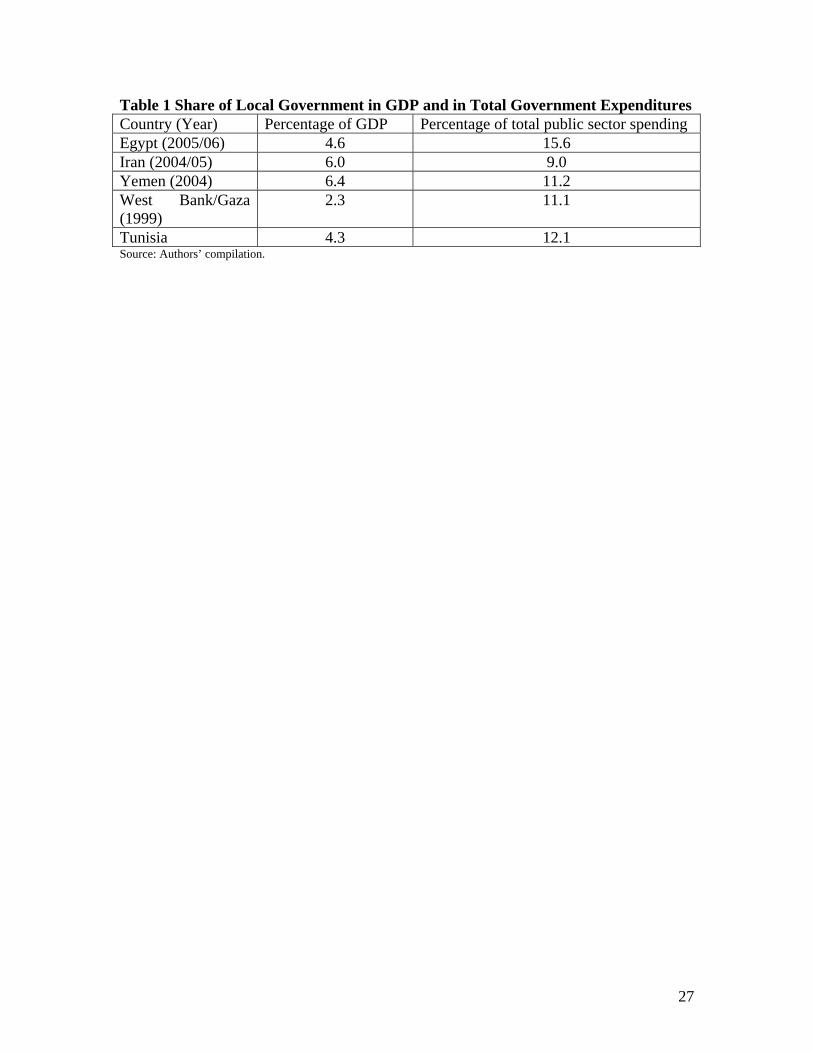
Table 1 Share of Local Government in GDP and in Total Government Expenditures Country (Year) Percentage of GDP Percentage of total public sector spending Egypt (2005/06) 4.6 15.6 Iran (2004/05) 6.0 9.0 Yemen (2004) 6.4 11.2 West Bank/Gaza (1999)
2.3 11.1
Tunisia 4.3 12.1 Source: Authors’ compilation.
27
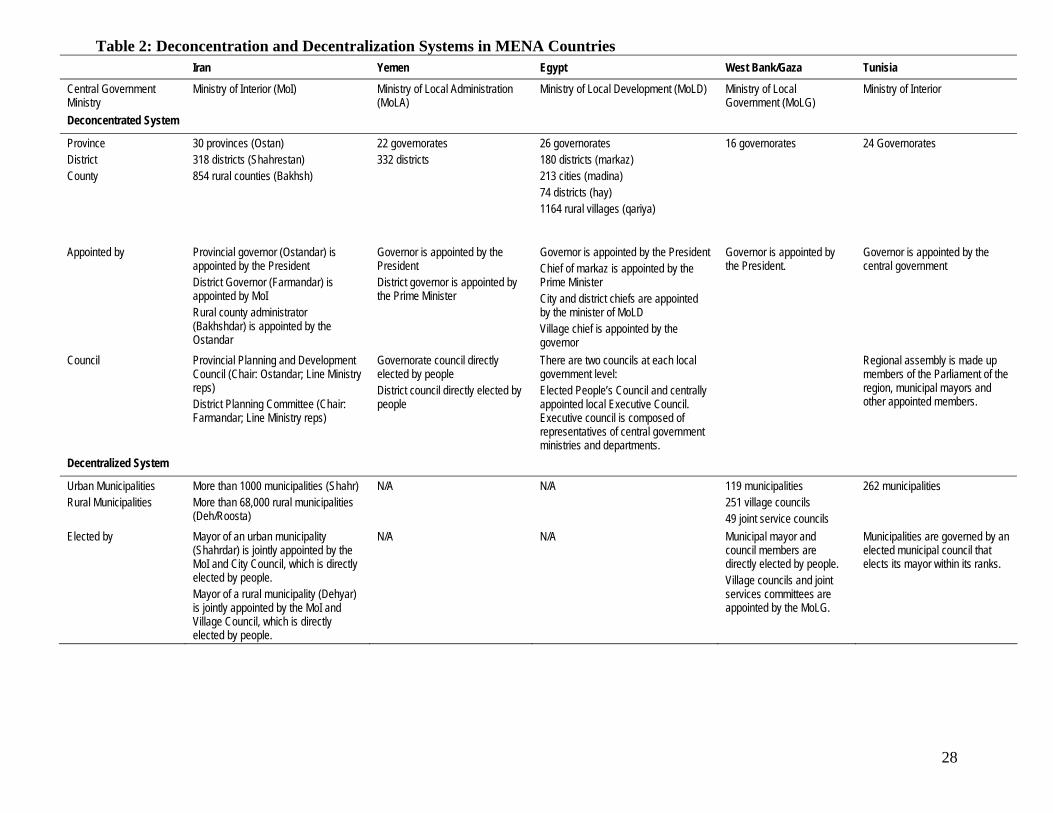
Table 2: Deconcentration and Decentralization Systems in MENA Countries Iran Yemen Egypt West Bank/Gaza Tunisia
Central Government Ministry
Ministry of Interior (MoI) Ministry of Local Administration (MoLA)
Ministry of Local Development (MoLD) Ministry of Local Government (MoLG)
Ministry of Interior
Deconcentrated System
Province District County
30 provinces (Ostan) 318 districts (Shahrestan) 854 rural counties (Bakhsh)
22 governorates 332 districts
26 governorates 180 districts (markaz) 213 cities (madina) 74 districts (hay) 1164 rural villages (qariya)
16 governorates 24 Governorates
Appointed by Provincial governor (Ostandar) is appointed by the President District Governor (Farmandar) is appointed by MoI Rural county administrator (Bakhshdar) is appointed by the Ostandar
Governor is appointed by the President District governor is appointed by the Prime Minister
Governor is appointed by the President Chief of markaz is appointed by the Prime Minister City and district chiefs are appointed by the minister of MoLD Village chief is appointed by the governor
Governor is appointed by the President.
Governor is appointed by the central government
Council Provincial Planning and Development Council (Chair: Ostandar; Line Ministry reps) District Planning Committee (Chair: Farmandar; Line Ministry reps)
Governorate council directly elected by people District council directly elected by people
There are two councils at each local government level: Elected People’s Council and centrally appointed local Executive Council. Executive council is composed of representatives of central government ministries and departments.
Regional assembly is made up members of the Parliament of the region, municipal mayors and other appointed members.
Decentralized System
Urban Municipalities Rural Municipalities
More than 1000 municipalities (Shahr) More than 68,000 rural municipalities (Deh/Roosta)
N/A N/A 119 municipalities 251 village councils 49 joint service councils
262 municipalities
Elected by Mayor of an urban municipality (Shahrdar) is jointly appointed by the MoI and City Council, which is directly elected by people. Mayor of a rural municipality (Dehyar) is jointly appointed by the MoI and Village Council, which is directly elected by people.
N/A N/A Municipal mayor and council members are directly elected by people. Village councils and joint services committees are appointed by the MoLG.
Municipalities are governed by an elected municipal council that elects its mayor within its ranks.
28
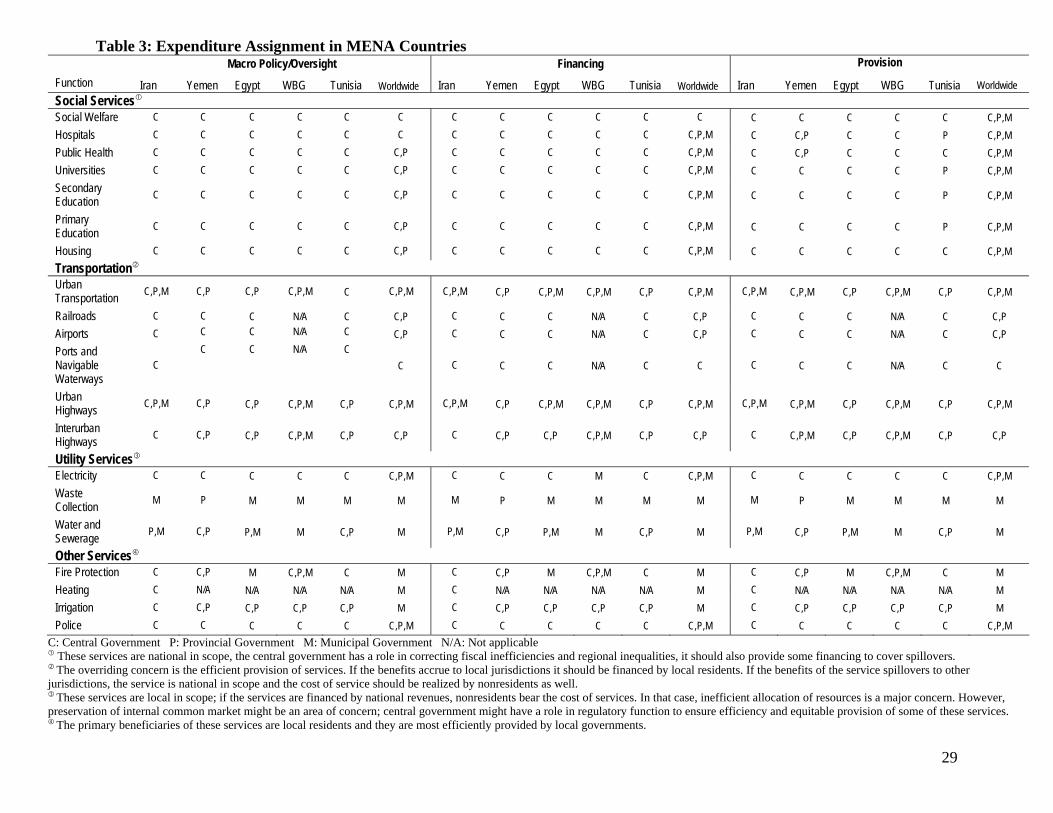
Table 3: Expenditure Assignment in MENA Countries Macro Policy/Oversight Financing Provision Function Iran Yemen Egypt WBG Tunisia Worldwide Iran Yemen Egypt WBG Tunisia Worldwide Iran Yemen Egypt WBG Tunisia Worldwide Social Services Social Welfare C C C C C C C C C C C C C C C C C C,P,M Hospitals C C C C C C C C C C C C,P,M C C,P C C P C,P,M Public Health C C C C C C,P C C C C C C,P,M C C,P C C C C,P,M Universities C C C C C C,P C C C C C C,P,M C C C C P C,P,M Secondary Education C C C C C C,P C C C C C C,P,M C C C C P C,P,M
Primary Education C C C C C C,P C C C C C C,P,M C C C C P C,P,M
Housing C C C C C C,P C C C C C C,P,M C C C C C C,P,M Transportation Urban Transportation C,P,M C,P C,P C,P,M C C,P,M C,P,M C,P C,P,M C,P,M C,P C,P,M C,P,M C,P,M C,P C,P,M C,P C,P,M
Railroads C C C N/A C C,P C C C N/A C C,P C C C N/A C C,P Airports C C C N/A C C,P C C C N/A C C,P C C C N/A C C,P Ports and Navigable Waterways
C C C N/A C
C C C C N/A C C C C C N/A C C
Urban Highways C,P,M C,P C,P C,P,M C,P C,P,M C,P,M C,P C,P,M C,P,M C,P C,P,M C,P,M C,P,M C,P C,P,M C,P C,P,M
Interurban Highways C C,P C,P C,P,M C,P C,P C C,P C,P C,P,M C,P C,P C C,P,M C,P C,P,M C,P C,P
Utility Services Electricity C C C C C C,P,M C C C M C C,P,M C C C C C C,P,M Waste Collection M P M M M M M P M M M M M P M M M M
Water and Sewerage P,M C,P P,M M C,P M P,M C,P P,M M C,P M P,M C,P P,M M C,P M
Other Services Fire Protection C C,P M C,P,M C M C C,P M C,P,M C M C C,P M C,P,M C M Heating C N/A N/A N/A N/A M C N/A N/A N/A N/A M C N/A N/A N/A N/A M Irrigation C C,P C,P C,P C,P M C C,P C,P C,P C,P M C C,P C,P C,P C,P M Police C C C C C C,P,M C C C C C C,P,M C C C C C C,P,M
C: Central Government P: Provincial Government M: Municipal Government N/A: Not applicable These services are national in scope, the central government has a role in correcting fiscal inefficiencies and regional inequalities, it should also provide some financing to cover spillovers. The overriding concern is the efficient provision of services. If the benefits accrue to local jurisdictions it should be financed by local residents. If the benefits of the service spillovers to other
jurisdictions, the service is national in scope and the cost of service should be realized by nonresidents as well. These services are local in scope; if the services are financed by national revenues, nonresidents bear the cost of services. In that case, inefficient allocation of resources is a major concern. However,
preservation of internal common market might be an area of concern; central government might have a role in regulatory function to ensure efficiency and equitable provision of some of these services. The primary beneficiaries of these services are local residents and they are most efficiently provided by local governments.
29
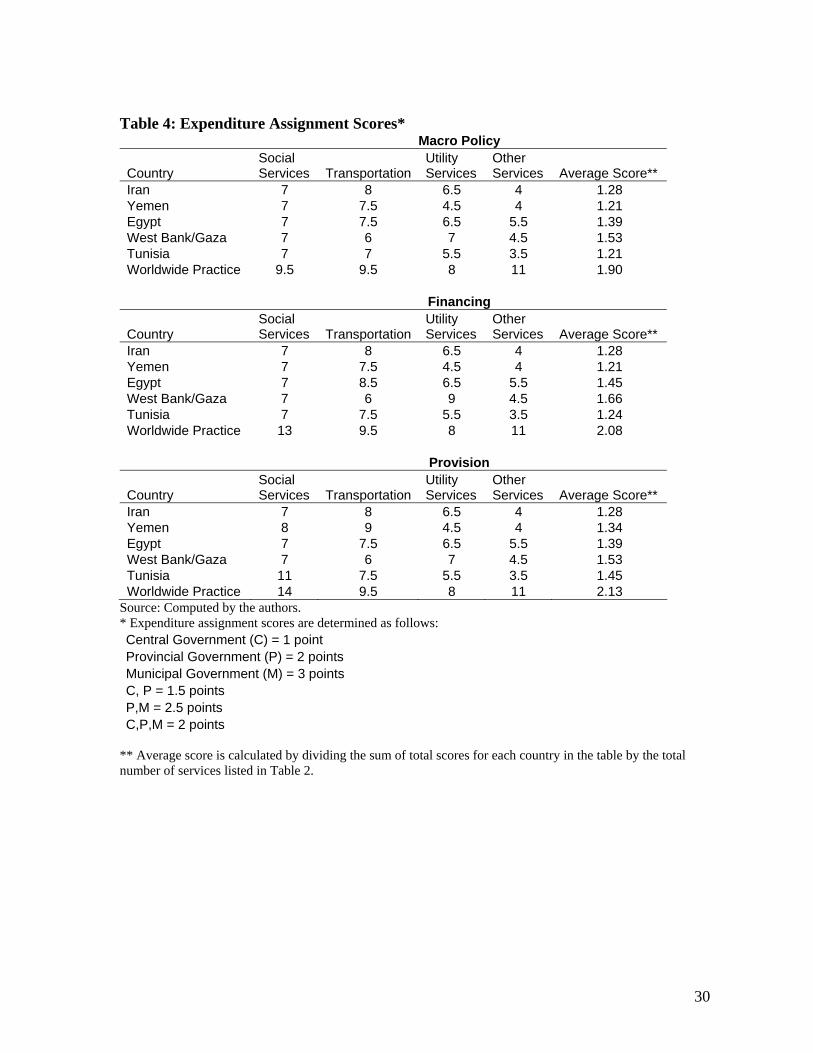
Table 4: Expenditure Assignment Scores* Macro Policy
Country Social Services Transportation
Utility Services
Other Services Average Score**
Iran 7 8 6.5 4 1.28 Yemen 7 7.5 4.5 4 1.21 Egypt 7 7.5 6.5 5.5 1.39 West Bank/Gaza 7 6 7 4.5 1.53 Tunisia 7 7 5.5 3.5 1.21 Worldwide Practice 9.5 9.5 8 11 1.90 Financing
Country Social Services Transportation
Utility Services
Other Services Average Score**
Iran 7 8 6.5 4 1.28 Yemen 7 7.5 4.5 4 1.21 Egypt 7 8.5 6.5 5.5 1.45 West Bank/Gaza 7 6 9 4.5 1.66 Tunisia 7 7.5 5.5 3.5 1.24 Worldwide Practice 13 9.5 8 11 2.08 Provision
Country Social Services Transportation
Utility Services
Other Services Average Score**
Iran 7 8 6.5 4 1.28 Yemen 8 9 4.5 4 1.34 Egypt 7 7.5 6.5 5.5 1.39 West Bank/Gaza 7 6 7 4.5 1.53 Tunisia 11 7.5 5.5 3.5 1.45 Worldwide Practice 14 9.5 8 11 2.13
Source: Computed by the authors. * Expenditure assignment scores are determined as follows: Central Government (C) = 1 point Provincial Government (P) = 2 points Municipal Government (M) = 3 points C, P = 1.5 points P,M = 2.5 points C,P,M = 2 points
** Average score is calculated by dividing the sum of total scores for each country in the table by the total number of services listed in Table 2.
30
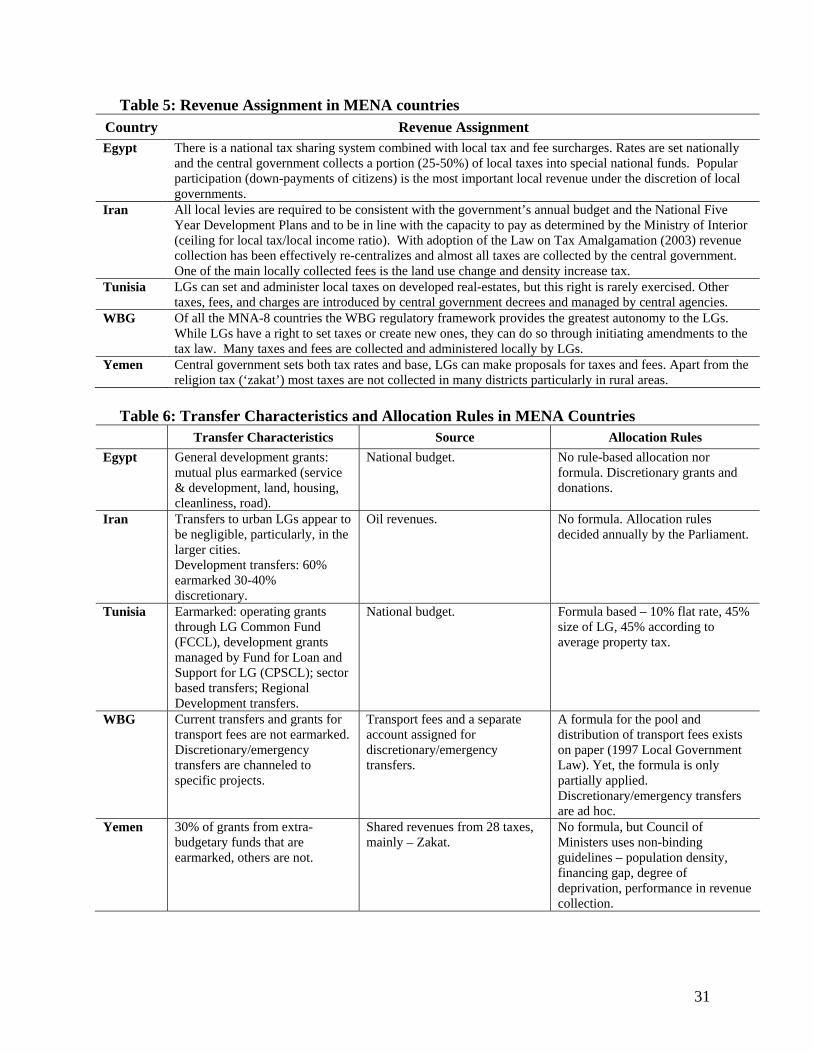
Table 5: Revenue Assignment in MENA countries Country Revenue Assignment Egypt There is a national tax sharing system combined with local tax and fee surcharges. Rates are set nationally
and the central government collects a portion (25-50%) of local taxes into special national funds. Popular participation (down-payments of citizens) is the most important local revenue under the discretion of local governments.
Iran All local levies are required to be consistent with the government’s annual budget and the National Five Year Development Plans and to be in line with the capacity to pay as determined by the Ministry of Interior (ceiling for local tax/local income ratio). With adoption of the Law on Tax Amalgamation (2003) revenue collection has been effectively re-centralizes and almost all taxes are collected by the central government. One of the main locally collected fees is the land use change and density increase tax.
Tunisia LGs can set and administer local taxes on developed real-estates, but this right is rarely exercised. Other taxes, fees, and charges are introduced by central government decrees and managed by central agencies.
WBG Of all the MNA-8 countries the WBG regulatory framework provides the greatest autonomy to the LGs. While LGs have a right to set taxes or create new ones, they can do so through initiating amendments to the tax law. Many taxes and fees are collected and administered locally by LGs.
Yemen Central government sets both tax rates and base, LGs can make proposals for taxes and fees. Apart from the religion tax (‘zakat’) most taxes are not collected in many districts particularly in rural areas.
Table 6: Transfer Characteristics and Allocation Rules in MENA Countries
Transfer Characteristics Source Allocation Rules Egypt General development grants:
mutual plus earmarked (service & development, land, housing, cleanliness, road).
National budget. No rule-based allocation nor formula. Discretionary grants and donations.
Iran Transfers to urban LGs appear to be negligible, particularly, in the larger cities. Development transfers: 60% earmarked 30-40% discretionary.
Oil revenues.
No formula. Allocation rules decided annually by the Parliament.
Tunisia Earmarked: operating grants through LG Common Fund (FCCL), development grants managed by Fund for Loan and Support for LG (CPSCL); sector based transfers; Regional Development transfers.
National budget. Formula based – 10% flat rate, 45% size of LG, 45% according to average property tax.
WBG Current transfers and grants for transport fees are not earmarked. Discretionary/emergency transfers are channeled to specific projects.
Transport fees and a separate account assigned for discretionary/emergency transfers.
A formula for the pool and distribution of transport fees exists on paper (1997 Local Government Law). Yet, the formula is only partially applied. Discretionary/emergency transfers are ad hoc.
Yemen 30% of grants from extra-budgetary funds that are earmarked, others are not.
Shared revenues from 28 taxes, mainly – Zakat.
No formula, but Council of Ministers uses non-binding guidelines – population density, financing gap, degree of deprivation, performance in revenue collection.
31
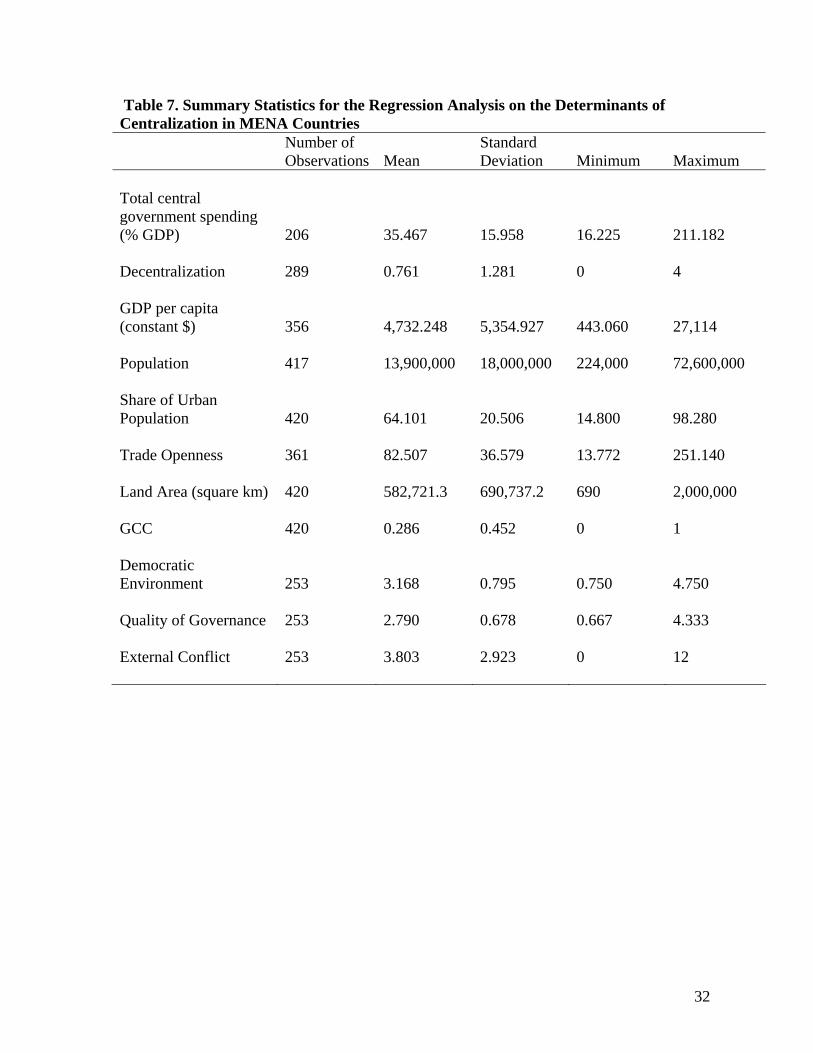
Table 7. Summary Statistics for the Regression Analysis on the Determinants of Centralization in MENA Countries Number of
Observations Mean
Standard Deviation
Minimum
Maximum
Total central government spending (% GDP) 206 35.467 15.958 16.225 211.182 Decentralization 289 0.761 1.281 0 4 GDP per capita (constant $) 356 4,732.248 5,354.927 443.060 27,114 Population 417 13,900,000 18,000,000 224,000 72,600,000 Share of Urban Population 420 64.101 20.506 14.800 98.280 Trade Openness 361 82.507 36.579 13.772 251.140 Land Area (square km) 420 582,721.3 690,737.2 690 2,000,000 GCC 420 0.286 0.452 0 1 Democratic Environment 253 3.168 0.795 0.750 4.750 Quality of Governance 253 2.790 0.678 0.667 4.333 External Conflict 253 3.803 2.923 0 12
32
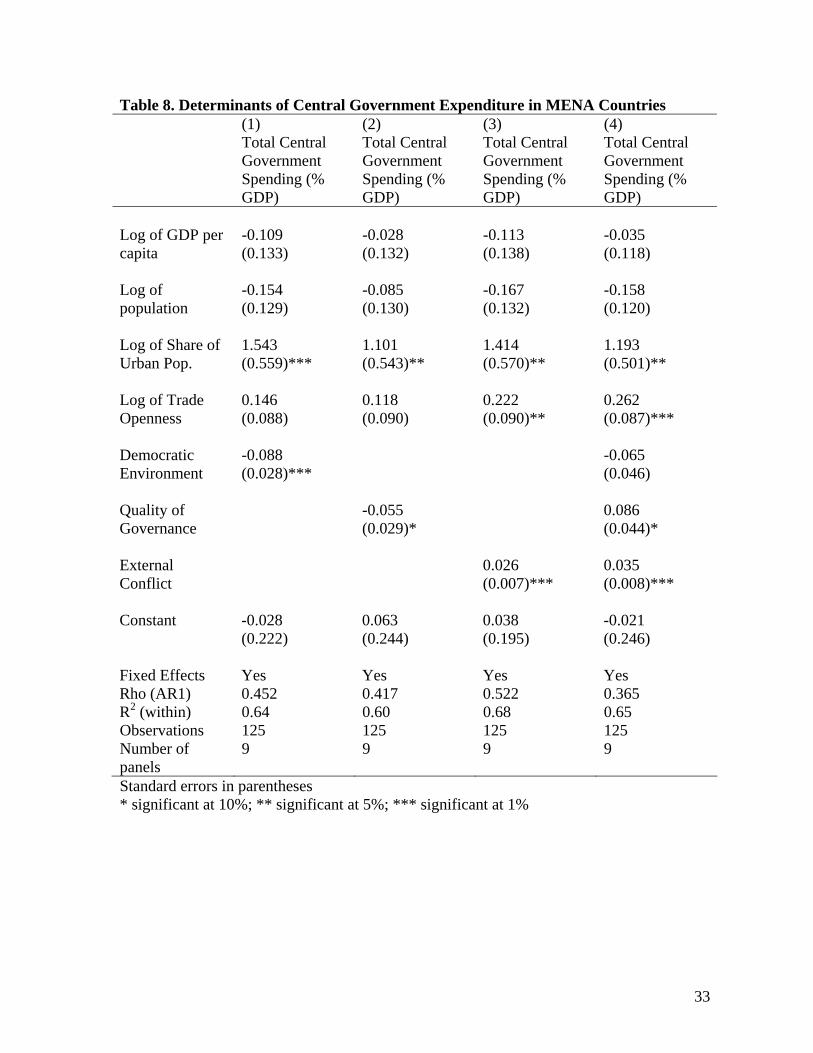
Table 8. Determinants of Central Government Expenditure in MENA Countries (1) (2) (3) (4) Total Central
Government Spending (% GDP)
Total Central Government Spending (% GDP)
Total Central Government Spending (% GDP)
Total Central Government Spending (% GDP)
Log of GDP per capita
-0.109 (0.133)
-0.028 (0.132)
-0.113 (0.138)
-0.035 (0.118)
Log of population
-0.154 (0.129)
-0.085 (0.130)
-0.167 (0.132)
-0.158 (0.120)
Log of Share of Urban Pop.
1.543 (0.559)***
1.101 (0.543)**
1.414 (0.570)**
1.193 (0.501)**
Log of Trade Openness
0.146 (0.088)
0.118 (0.090)
0.222 (0.090)**
0.262 (0.087)***
Democratic Environment
-0.088 (0.028)***
-0.065 (0.046)
Quality of Governance
-0.055 (0.029)*
0.086 (0.044)*
External Conflict
0.026 (0.007)***
0.035 (0.008)***
Constant -0.028 0.063 0.038 -0.021 (0.222) (0.244) (0.195) (0.246) Fixed Effects Yes Yes Yes Yes Rho (AR1) 0.452 0.417 0.522 0.365 R2 (within) 0.64 0.60 0.68 0.65 Observations 125 125 125 125 Number of panels
9 9 9 9
Standard errors in parentheses * significant at 10%; ** significant at 5%; *** significant at 1%
33
34
Table 9. Determinants of Decentralization in MENA Countries (1) (2) (3) (4) Decentralization Decentralization Decentralization Decentralization Log of Land area -0.113 -0.047 -0.031 0.046 (0.236) (0.237) (0.210) (0.214) Log of GDP per capita 4.384 4.788 4.357 4.666 (1.135)*** (1.183)*** (1.100)*** (1.151)*** Log of Population 1.577 1.352 1.145 0.978 (0.723)** (0.722)* (0.674)* (0.667) Log of Share of Urban Pop. -4.749 -5.724 -4.793 -5.373 (1.563)*** (1.865)*** (1.621)*** (1.742)*** Log of Trade openness 6.922 6.549 5.995 6.361 (1.645)*** (1.498)*** (1.461)*** (1.477)*** GCC -8.065 -8.790 -8.220 -9.104 (1.887)*** (1.903)*** (1.789)*** (1.967)*** Democratic Environment -0.184 -0.690 (0.379) (0.336)** Quality of Governance 0.570 0.296 (0.417) (0.490) External Conflict -0.196 -0.260 (0.092)** (0.127)** Fixed Effects No No No No R2 0.19 0.20 0.21 0.22 Observations 197 197 197 197 Robust standard errors in parentheses * significant at 10%; ** significant at 5%; *** significant at 1%
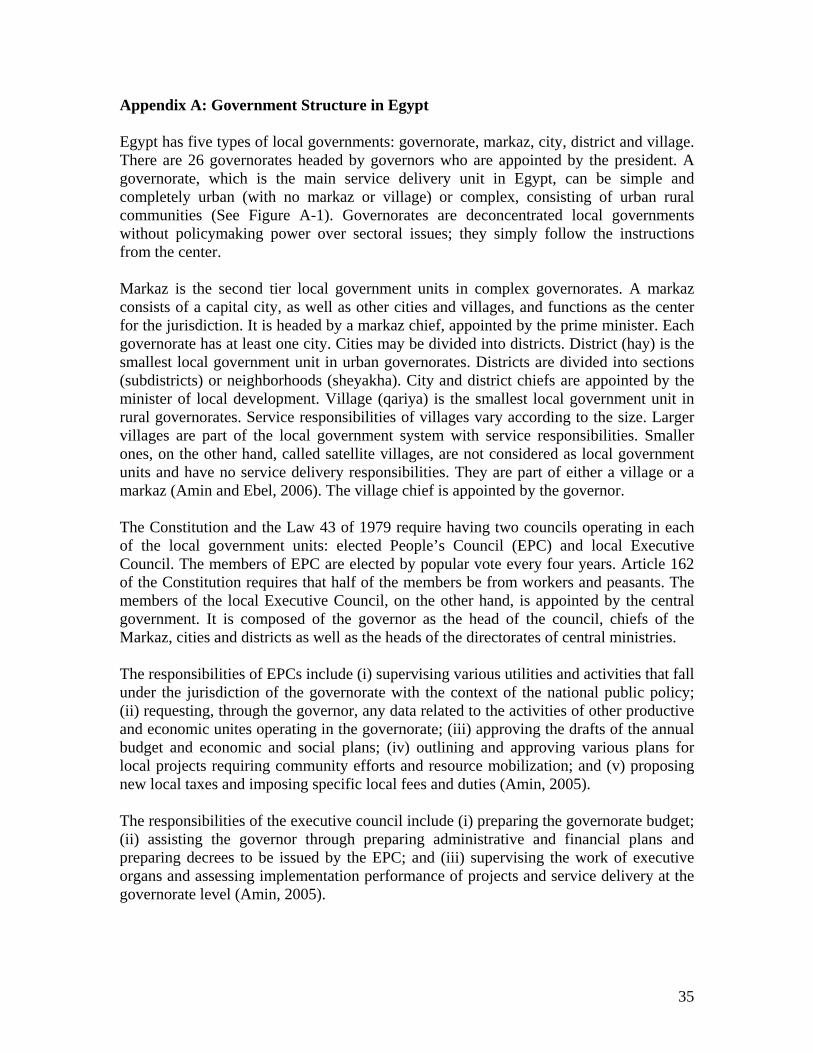
Appendix A: Government Structure in Egypt Egypt has five types of local governments: governorate, markaz, city, district and village. There are 26 governorates headed by governors who are appointed by the president. A governorate, which is the main service delivery unit in Egypt, can be simple and completely urban (with no markaz or village) or complex, consisting of urban rural communities (See Figure A-1). Governorates are deconcentrated local governments without policymaking power over sectoral issues; they simply follow the instructions from the center. Markaz is the second tier local government units in complex governorates. A markaz consists of a capital city, as well as other cities and villages, and functions as the center for the jurisdiction. It is headed by a markaz chief, appointed by the prime minister. Each governorate has at least one city. Cities may be divided into districts. District (hay) is the smallest local government unit in urban governorates. Districts are divided into sections (subdistricts) or neighborhoods (sheyakha). City and district chiefs are appointed by the minister of local development. Village (qariya) is the smallest local government unit in rural governorates. Service responsibilities of villages vary according to the size. Larger villages are part of the local government system with service responsibilities. Smaller ones, on the other hand, called satellite villages, are not considered as local government units and have no service delivery responsibilities. They are part of either a village or a markaz (Amin and Ebel, 2006). The village chief is appointed by the governor. The Constitution and the Law 43 of 1979 require having two councils operating in each of the local government units: elected People’s Council (EPC) and local Executive Council. The members of EPC are elected by popular vote every four years. Article 162 of the Constitution requires that half of the members be from workers and peasants. The members of the local Executive Council, on the other hand, is appointed by the central government. It is composed of the governor as the head of the council, chiefs of the Markaz, cities and districts as well as the heads of the directorates of central ministries. The responsibilities of EPCs include (i) supervising various utilities and activities that fall under the jurisdiction of the governorate with the context of the national public policy; (ii) requesting, through the governor, any data related to the activities of other productive and economic unites operating in the governorate; (iii) approving the drafts of the annual budget and economic and social plans; (iv) outlining and approving various plans for local projects requiring community efforts and resource mobilization; and (v) proposing new local taxes and imposing specific local fees and duties (Amin, 2005). The responsibilities of the executive council include (i) preparing the governorate budget; (ii) assisting the governor through preparing administrative and financial plans and preparing decrees to be issued by the EPC; and (iii) supervising the work of executive organs and assessing implementation performance of projects and service delivery at the governorate level (Amin, 2005).
35
Although the laws empower EPCs in overseeing the budget preparation and implementation as well as service delivery in their jurisdictions, in reality, EPCs are less powerful than the appointed executive council (Amin and Ebel, 2006). They have limited power to play “any meaningful role in the preparation of the budgets of the jurisdictions they represent” (Amin and Ebel, 2006; 16). Figure A-1: Egyptian Local Government System
Source: Amin, Khalid Z. and Robert D. Ebel. 2006. Intergovernmental Relations and Fiscal Decentralization: Egypt Public Expenditure Review. World Bank MENA Region Policy Note: 8.
Satellite Village (4623)Sections
Governorate (4) Simple/Completely Urban
Markaz (180)
Village (1164) City (209)
District (39)District (35)
City (4)
Governorate (22) Complex/ Rural and Urban
Central Authority
36
Appendix B: Government Structure in Iran
The Iranian public administration system is composed of the central government and two types of local government units—deconcentrated line agencies and the municipal authorities. The Constitution of Islamic Republic of Iran defines the deconcentrated local government units as governmental and municipalities as non-governmental units (see Table B-1):
1. Public, Governmental Sector (Umumi, Dowlati): The “public governmental” sector includes the line ministries and central government agencies with offices at sub-national levels. It consists of officials appointed by the central government. At the provincial level, deconcentrated service delivery is coordinated through planning bodies under the supervision of the Management and Planning Organization (MPO), the Ministry of Interior (MOI) and the Ministry of Housing and Urban Development (MHUD).
2. Public, non-governmental sector (Umumi Gheir-dowlati): The “public non-governmental” sector includes urban and rural municipalities, as well as the hierarchy of representative directly and indirectly elected councils. It consists of the representative bodies which include the directly elected urban and rural local councils (established in 1999) and the indirectly elected hierarchy of Islamic councils (established in 2002 and comprising of County Islamic Councils, District Islamic Councils, Provincial Islamic Councils, and the High Islamic Council of Provinces) as well as the administrative bodies of urban and rural municipalities at the city and village levels.
These two structures make up the sub-national administration framework in Iran. The first type—public, governmental Sector (Umumi, Dowlati)—is referred as the deconcentrated (provincial) local governments. Line ministries providing services, such as gas, electricity, transportation, education and health, are organized sectorally at the provincial level and are coordinated at all levels through the MPO and the Ministry of Economic Affairs and Finance (MEAF). The second type—public, non-governmental (Umumi Gheir-dowlati)—is referred as decentralized (municipal) local governments. The municipal sector is coordinated separately through Ministry of Interior’s Municipalities Organization (MO) and provides urban municipal services including public health, recreational services including parks, public safety including fire stations and local transportation including buses and taxis as well as rural municipal services.
The subnational administration in Iran is primarily organized at the provincial level. For administrative purposes the country is divided into 30 provinces (ostan). The populations of ostans vary considerably with more than eleven million inhabitants in Tehran and fewer than 600,000 in the smallest ostans such as Ilam and Semnan. The ostans have subdivisions called districts (shahrestan). Shahrestans also have subdivisions called rural county (bakhsh). Ostans, shahrestans and bakhsh are deconcentrated governmental units and cover the whole territory of Iran.
37
The head of osthan administration is Ostandar, who is an appointed by the central government. Expenditures at the osthan level are organized through line agencies and spending units. These units are responsible for provincial expenditures while national public services such as defense and those public goods with significant externalities are assigned to the central units.
An important component of the subnational administration system in Iran is the local councils. Iran has an elaborate local council structure (Tajbakhsh, 2000). There exists a hierarchically nested system of directly and indirectly elected councils.16 In addition to the directly elected city and village councils, there are intermediate representative councils at geographic and administrative levels. At the lowest level, representatives from a group of directly elected village councils constitute a rural county council (bakhsh). At the district level, representatives from rural county and urban councils within a district make up the members of the district council. At the ostan level, representatives from each district council within an ostan send representatives to the ostan level council. Finally, Higher Council of Provinces is comprised of one representative from each ostan council. However, while the councils are the only source of local legislation, and the mayor, as the local executive, is charged with carrying out these decisions, the areas in which the council can legislate and pass bills is restricted. In fact, in relation to the entire range of issues that impact local economic development, the council and municipality has a secondary or almost no role. The restricted interactions and limited role of elected councils constitute a major obstacle to increased inclusiveness and accountability (Tajbakhsh, 2000). This weak institutionalization, in conjunction with the enhanced role of the MO is among the factors that exacerbate Mayor-Council tense relations, primarily because mayors feel increasingly dependent upon Central Government and consequently less accountable to the Municipal Council (Tajbakhsh, 2000).
16 The city councils have a term of four years. The size of councils varies 5 to 11 people depending on the population of the locality. Tehran as the capital city has 15-member council.
38
39
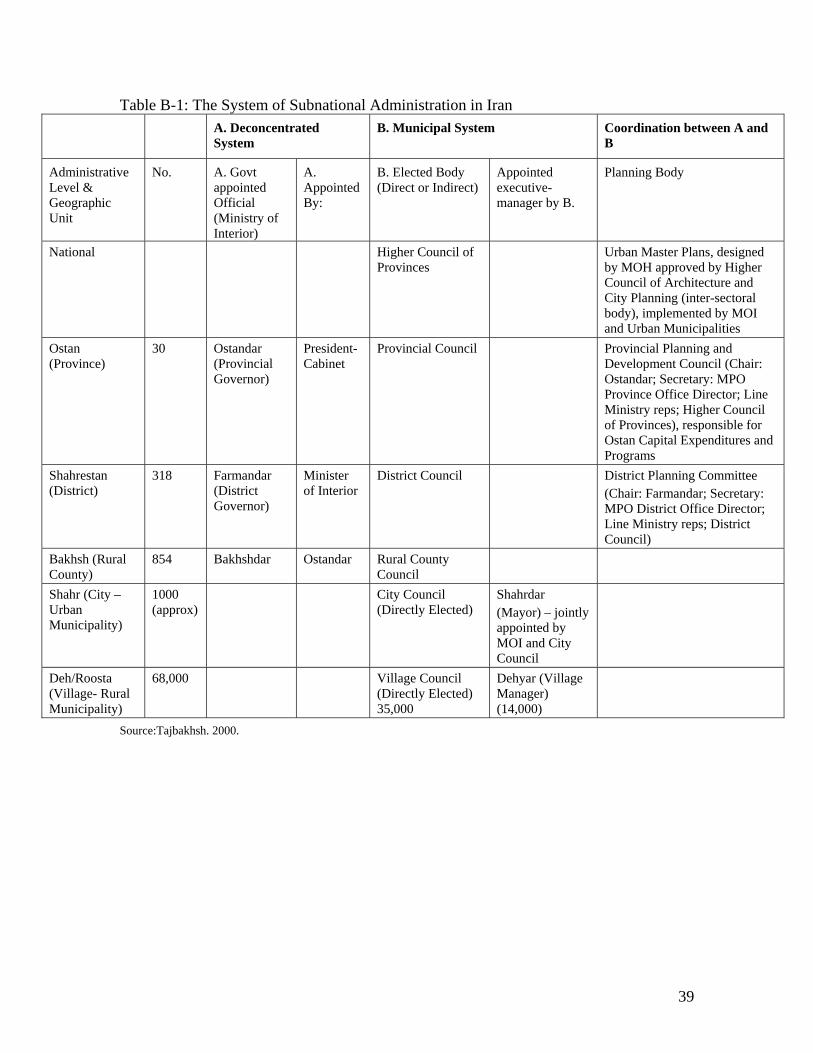
Table B-1: The System of Subnational Administration in Iran A. Deconcentrated
System B. Municipal System Coordination between A and
B
Administrative Level & Geographic Unit
No. A. Govt appointed Official (Ministry of Interior)
A. Appointed By:
B. Elected Body (Direct or Indirect)
Appointed executive-manager by B.
Planning Body
National Higher Council of Provinces
Urban Master Plans, designed by MOH approved by Higher Council of Architecture and City Planning (inter-sectoral body), implemented by MOI and Urban Municipalities
Ostan (Province)
30 Ostandar (Provincial Governor)
President-Cabinet
Provincial Council Provincial Planning and Development Council (Chair: Ostandar; Secretary: MPO Province Office Director; Line Ministry reps; Higher Council of Provinces), responsible for Ostan Capital Expenditures and Programs
Shahrestan (District)
318 Farmandar (District Governor)
Minister of Interior
District Council District Planning Committee (Chair: Farmandar; Secretary: MPO District Office Director; Line Ministry reps; District Council)
Bakhsh (Rural County)
854 Bakhshdar Ostandar Rural County Council
Shahr (City –Urban Municipality)
1000 (approx)
City Council (Directly Elected)
Shahrdar (Mayor) – jointly appointed by MOI and City Council
Deh/Roosta (Village- Rural Municipality)
68,000 Village Council (Directly Elected) 35,000
Dehyar (Village Manager) (14,000)
Source:Tajbakhsh. 2000.
Appendix C: Government Structure in Tunisia Tunisia has a two tier local government system. Governorates (conseils regionaux) are deconcentrated units representing state administration in a region. There are 24 governorates covering the whole territory of the country. Each governorate has a regional assembly headed by the governor. Governors are appointed by the central government. Both governorates and regional assemblies operate under the tutelage of the Ministry of Interior. Regional assembly is made up of deputies elected in the circumscriptions covered by the governorate, municipal mayors, rural councils’ presidents and other appointed members. Regional assemblies are charged with the management of regional affairs and elaboration on the regional development plans and town plans in non-urbanized areas. In addition, local councils of development were established by law in 1994 to discuss issues relative to local development. These consultative bodies are composed of municipalities’ and rural councils’ presidents, sectors’ chiefs, representatives of public institutions and representatives of exterior services of the administration. Regions are divided into urbanized (communalise) and non-urbanized (non communalise) territories. Urbanized territories, covering 63 percent of the population, are served by municipalities. There are 262 municipalities in urban areas and rural centers. Municipalities are governed by an elected municipal council that elects its mayor within its ranks.17 The rural areas in non-urbanized territories are served by the deconcentrated units (governorates and their subdivisions). Populations in non-urbanized territories are often regrouped in villages (agglomerations). Villages have consultative councils used as sounding boards by the region, but they have no formal recognition as local governments (Vaillancourt and Belaid, 1998). There are 185 appointed rural councils covering a small portion of the geography. They are created by the Ministry of Interior in the rural areas where basic public service facilities (i.e. schools, health clinics) exist.
17 Municipal councilors are elected for a 5 year term by direct universal suffrage by voters living in the municipal area. The number of councilors varies 10 to 60 based on the population size of the area. 20 percent of the seats are reserved for minorities.
40
Appendix D: Government Structure in West Bank/Gaza The local government system in West Bank and Gaza (WBG) reflects the realities of Israeli occupation. The overriding concerns in the design of local government system have always been providing emergency services and security through central control. As a result, laws, political system, administrative arrangements and development practices of local governments are geared towards these objectives rather than providing services to local communities. Prior to the 1994 Oslo Peace Accord, in the absence of a sovereign state, Palestinian local governments have had to fend for themselves in providing services to local communities. The Ministry of Local Governments (MOLG) established in 1994 to help build an effective local government system. However, the current legal framework in WBG assigns the central government strong formal controls over local governments (World Bank, 2006). The Law on Local Authorities of 1997 (LLA) provides the legal basis for the current local government system in WBG. There are three different levels of local government units:
16 governorates, representing the central government at the regional level; 120 municipalities, providing public services in urban areas; 251 village councils, providing public services in rural areas.
LLA draws heavily on other regional country legislative frameworks, particularly that of Jordan. LLA grants significant powers to the central government, primarily Ministry of Local Government in its role as the sector regulatory agency, including provisions for approvals of a wide range of activities of local governments and claw-back clauses where autonomy appears to be granted (World Bank, 2006). Governorates are deconcentrated local government units operating at the provincial level. There are sixteen governorates (eleven in the West Bank, five in Gaza). Governors appointed by the President of the Palestinian Authority head governorates. They are charged primarily with security and public safety functions (World Bank, 2006). Municipalities are decentralized local government units with elected mayors and council members. Municipalities are classified into four categories based on population criterion18 as well as location and date of establishment characteristics (See Table D-1). The LLA provides the legal basis for municipal expenditure responsibilities and revenue-raising authorities. However, a there is a significant mismatch between the legal assignments to municipalities and the reality on the ground (World Bank, 2006). The absence of an effective public administration system compels the larger municipalities
18 Population figured prominently as a criterion for classification when first defined in the LLA. As stated in the LLA, wherever a local population exceeds 5,000, there is a basis for establishing municipality. This basic criterion has not been applied consistently as many of the newly established municipalities have population less than 5,000 (World Bank, 2006).
41
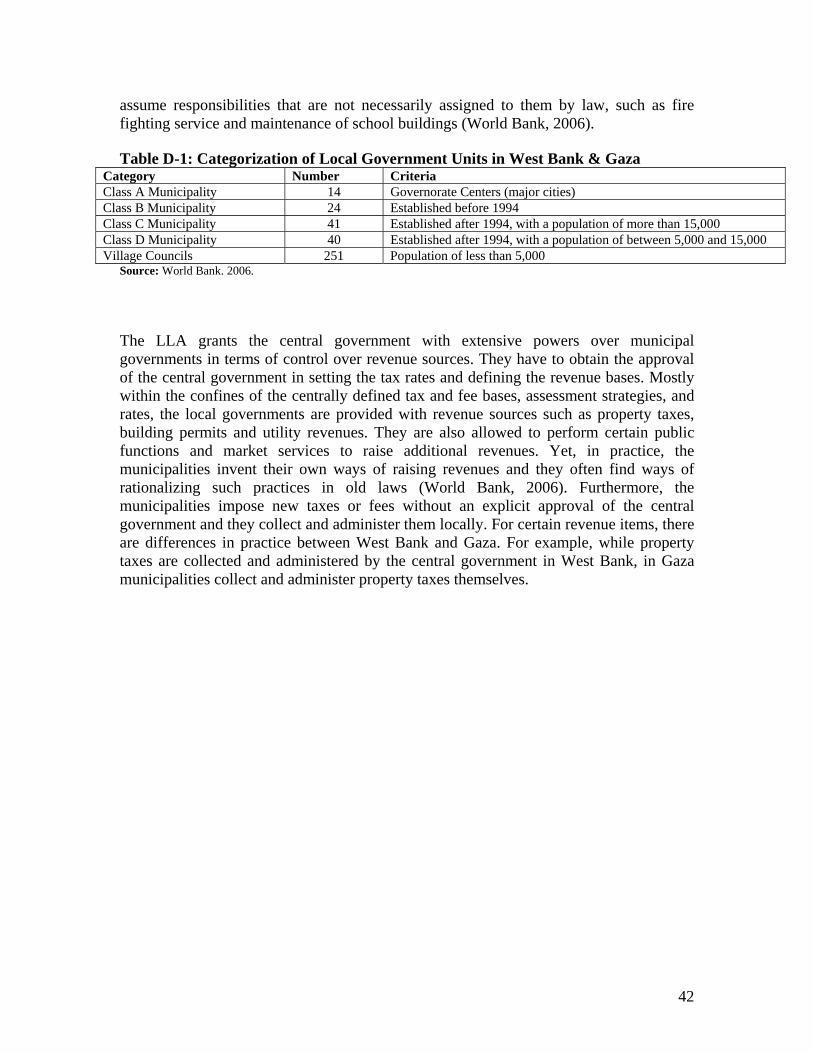
42
assume responsibilities that are not necessarily assigned to them by law, such as fire fighting service and maintenance of school buildings (World Bank, 2006). Table D-1: Categorization of Local Government Units in West Bank & Gaza
Category Number Criteria Class A Municipality 14 Governorate Centers (major cities) Class B Municipality 24 Established before 1994 Class C Municipality 41 Established after 1994, with a population of more than 15,000 Class D Municipality 40 Established after 1994, with a population of between 5,000 and 15,000 Village Councils 251 Population of less than 5,000
Source: World Bank. 2006. The LLA grants the central government with extensive powers over municipal governments in terms of control over revenue sources. They have to obtain the approval of the central government in setting the tax rates and defining the revenue bases. Mostly within the confines of the centrally defined tax and fee bases, assessment strategies, and rates, the local governments are provided with revenue sources such as property taxes, building permits and utility revenues. They are also allowed to perform certain public functions and market services to raise additional revenues. Yet, in practice, the municipalities invent their own ways of raising revenues and they often find ways of rationalizing such practices in old laws (World Bank, 2006). Furthermore, the municipalities impose new taxes or fees without an explicit approval of the central government and they collect and administer them locally. For certain revenue items, there are differences in practice between West Bank and Gaza. For example, while property taxes are collected and administered by the central government in West Bank, in Gaza municipalities collect and administer property taxes themselves.
Appendix E: Government Structure in Yemen In Yemen, there are 22 governorates and 332 districts both of which are called administrative units. Each administrative unit has its own local authority, which consists of the administrative head of the unit (either the governor at governorate level or the director at the district level19), the elected local council at both governorate and district levels, and the executive organs (branches office of the ministries and other government agencies). At the governorate level, there are 14 areas for which the local authority has responsibility for funding, managing and maintaining projects. These include building, equipment and maintenance of technical and skilled manpower schools and centers, high schools for teachers, general and specialist hospitals, medical drug and equipment warehouses and medical laboratories, medical schools, centers for the handicapped, orphan and senior care, water supply dams and reservoirs, agriculture, veterinary and fishing institutes, agriculture and fishing natural museums, administrative buildings for governorates and districts, bridges and tunnels, cult concerts, museums and libraries, art exhibitions, youth centers and sports stadiums. At the district level, there are 22 items for which the local authority is seen as responsible for funding, managing and maintaining. These include religious, primary and secondary schools, literacy centers, children day care centers, libraries, school teaching and handicraft workshops, health centers, motherhood centers, family planning centers, primary health care centers and rural health units, social development and subsidies for productive families, centers for agricultural and rural extension advice, husbandry for domestic animals and fish, veterinarian and agricultural services, seed preparation, nurseries and demonstration farms, agricultural dams, irrigation systems, electricity networks, children playgrounds and public parks, secondary highways and roads, bridges and parking, services and rest areas for public transportation users, slaughterhouses, public markets and toilets, cemeteries and public shelters, clearing land and planting trees environmental projects, local water supply and sewage systems, maintaining historic buildings and sites, beaches and tourists projects, local playgrounds, sports locations and swimming pools.
19 Until 2008, governors were appointed by the central government.
43