centralized governance and student outcomes: excellence
TRANSCRIPT
Centralized Governance and Student Outcomes:Excellence, Equity, and Academic Achievementin the U.S. States
Paul Manna
Are states with more centralized approaches to education governance more likely to have higher studentachievement and lower achievement gaps between poor and nonpoor students? This article addressesthat question by theorizing about the effects of political, administrative, and fiscal centralization onstudent outcomes. It tests competing hypotheses about the degree to which centralization across thesethree dimensions is associated with the promotion of academic excellence (higher achievement) andequity (narrower achievement gaps). The results demonstrate the virtue of studying academic perfor-mance through the lens of governance and more distal system-level variables rather than, as has beencommon in the literature, more narrow policy-oriented measures. The findings show that strongrelationships exist between student outcomes and the degree of political centralization and adminis-trative centralization in a state, yet there are no apparent associations with fiscal centralization. Theresults also illustrate that governing arrangements are not consistently related to the advancement ofexcellence and equity. In terms of administrative centralization, specifically, apparent trade-offs mayexist.
KEY WORDS: governance, centralization, states, education
Introduction
During the last two decades, institutional reforms that decentralize authority toground-level officials and citizens have gained much traction in the United Statesand around the world (Soss, Schram, Vartanian, & O’Brien, 2001; Treisman, 2007).Gerring and Thacker (2008, p. 2) summarize the reason for decentralization’s popu-larity by explaining that “Contemporary writers and commentators usually assumethat government works best when political institutions diffuse power broadlyamong multiple, independent bodies.” A related view embraces “polycentric gover-nance,” or arrangements where numerous governmental and nongovernmentalactors operate in overlapping jurisdictions and share authority (McGinnis, 1999).Authors writing from that perspective note that polycentric systems can cultivate ashared sense of responsibility for society’s well-being and, in practical terms, moretailored and nuanced service delivery.
bs_bs_banner
The Policy Studies Journal, Vol. 41, No. 4, 2013
682
0190-292X © 2013 Policy Studies OrganizationPublished by Wiley Periodicals, Inc., 350 Main Street, Malden, MA 02148, USA, and 9600 Garsington Road, Oxford, OX4 2DQ.
Despite the appeal of decentralizing reforms, support for them is not universal.Some scholars have noted that centralized or decentralized systems can deliver theresults that citizens crave while upholding core democratic principles (Treisman,2007). Others have presented national-level evidence showing that greater central-ization, existing in concert with mechanisms to foster political inclusion, is associ-ated with superior results across diverse sets of social and political indicators(Gerring & Thacker, 2008). At the community level, other work has shown thatflexible networked arrangements can promote valued social outcomes, such as deliv-ering mental health services, yet a centralizing force in those networks, prompted by“a powerful core agency” is important because it “facilitates both integration andcoordination and is relatively efficient” (Milward & Provan, 1998, p. 216).
Although disagreements exist over the merits of centralized or decentralizedapproaches to governance, one policy domain in the United States has exhibited agenerally consistent march toward greater centralization. That area is elementary andsecondary education, henceforth simply “education.” During the last severaldecades, state governments have wielded their powers to reshape the institutionsthat govern schools and execute education policy. The pace of these changes hasvaried across the states, providing a valuable arena for understanding the perfor-mance of reforms that centralize.
Interestingly, public policy scholars have yet to explore deeply how changes instate institutions that govern education may influence student outcomes. That gapexists despite calls from pioneers who encouraged the pursuit of these and otherrelated lines of inquiry (Campbell & Mazzoni, 1976; Masters, Salisbury, & Eliot,1964). Researchers have examined other dimensions of education governance instudies of public universities (Hicklin & Meier, 2008; Knott & Payne, 2004; Lowry,2001; Nicholson-Crotty & Meier, 2003); the impacts of local governance, in particularthe institutional pressures facing school superintendents (Hess, 1999) or schoolboards (Howell, 2005); the rise of mayoral control of urban schools (Henig, 2004);and markets (Chubb & Moe, 1990). That gap in the research represents a missedopportunity because variation in how states govern education can inform moregeneral debates about the relative benefits of centralized versus decentralized insti-tutional reforms.1
This article examines state education governance and addresses the followingresearch question: Are states with more centralized approaches to education gover-nance more likely to have higher student achievement and lower achievement gapsbetween poor and nonpoor students? The article makes two main contributions.Empirically, it is the first quantitative study of the relationship between state insti-tutions of education governance and student achievement. Theoretically, it considersmultiple dimensions of centralization and in so doing provides a robust test ofcontrasting theoretical claims about the relative merits of centralized versus decen-tralized governing approaches. The findings show that greater political centraliza-tion is strongly associated with more equitable outcomes via lower achievementgaps. In addition, strong relationships between achievement and the degree ofadministrative centralization exist, yet here factors associated with increasingachievement and promoting excellence also are associated with wider achievement
Manna: Centralized Governance and Student Outcomes 683
gaps, thus diminishing equity. Interestingly, although state-level debates aboutstudent funding have raged for decades, centralization of finances appears unrelatedto student performance.
Governance, Black Boxes, and Outcomes
Governance is a multifaceted concept in the political science and public policyliteratures (Lynn, Heinrich, & Hill, 2001; Manna & McGuinn, 2013). This articledelimits the topic by focusing on the role of government institutions whose primarypurpose is to make or implement state education policy. Scholars have sometimesdefined governance and institutions to involve the formal and informal rules orregimes of rules that attempt to alter behavior (Ostrom, 1986). The focus here is at theorganizational level, a higher level of abstraction.
So what do governance systems do, and why are they important to consider? Insimple terms a political unit’s governance system produces specific policies that areintended to improve real-world outcomes for ordinary people (Eller & Krutz, 2009;Meier & O’Toole, 2006). Researchers and pundits frequently consider how particulargoverning arrangements (e.g., divided political control of government) mightproduce certain policies, or whether certain policies (e.g., required student testing)are associated with outcomes. In each case, policy plays a central role in the discus-sion either as a dependent or an independent variable. In contrast, the analysis in thisarticle leaves the details of policy and its implementation in an unopened black box,as others studying centralization and decentralization have done in different con-texts (Chubb & Moe, 1990; Gerring & Thacker, 2008), to explore the relationshipbetween more distal features of governance and outcomes. Thus, in studying gov-erning institutions, the focus here departs from much of the education policy litera-ture that examines student outcomes by focusing on specific policy variables (Dee &Jacob, 2011; Gormley & Phillips, 2005; Hess & Leal, 1997).
Three main reasons motivate my focus on systemic features of governance ratherthan specific policies and implementation decisions. First, such an approach can helpestablish baseline relationships between these institutional arrangements and valuedoutcomes. Working from such a baseline, then, subsequent work can probe howspecific policies or the efforts of public managers might nudge those results frombaseline. For example, Meier and O’Toole’s (2006) model of governance posits thatpolicy outcomes emerge through the combined influence of structure, management,and environmental conditions.2 They note one advantage of the model is thatresearchers can focus on some narrower aspect of it depending on their particularinterests or the limits of available data.3 Work on representation in the policy processsometimes follows such a logic by considering how different rules for selectingrepresentatives—one aspect of structure in Meier and O’Toole’s (2006) model—areassociated with outcomes for different population groups (Marschall & Ruhil, 2007).Those studies focus on the institutional designs for choosing representatives andtheir relationship to outcomes, rather than the representatives’ policies and theimplementation decisions of bureaucracies.4
684 Policy Studies Journal, 41:4
Second, in education policy specifically, studying broader institutional arrange-ments can provide useful conceptual coherence in what can sometimes be an other-wise fragmented field. Theoretically, much education research posits potentialrelationships between specific policies and student outcomes, including studies ofstandards and accountability, teacher quality or teacher behavior, and the impact ofpreschool, just to name a few (Dee & Jacob, 2011; Gormley & Phillips, 2005; Hess &Leal, 1997). In reality, all those policies likely combine or interact to influence studentachievement in some way. By implication, then, every study relating an individualeducation policy lever to an outcome is subject to criticism because by definitionfocusing on a single area neglects the menu of other potential policies that mightcorrelate with valued outcomes. Two decades ago, John Chubb and Terry Moecriticized scholars studying education for a tendency to focus on narrow policyconcerns at the expense of considering broader theoretical perspectives. They notedthat “The literature is buried in variables—all of them relevant but without any clear,coherent, connection to one another” (Tweedie, Riley, Chubb, & Moe, 1990, p. 565). Ido not take Chubb and Moe’s complaint to mean that studies of individual policiesare never valuable. The main problem is that not enough studies in education havefocused on the institutions responsible for shaping the environments in which policyformation and implementation occurs.
Finally, popular political debates also advance theories about how certain insti-tutional designs can generate positive outcomes. Haggling over specific policiessometimes is less central in these arguments because the working assumption is thatgetting the institutions right is the most critical task. The framers of the U.S. Con-stitution adopted such an approach by focusing much effort on engineering a set ofgoverning arrangements organized around federalism and separation of powers thatthey believed would produce effective future policies. More recently in education,governors have advocated for greater control over state education policy, arguingthat a more coherent governance system, with governors serving as a primary andvisible point of accountability, will produce better results than systems with morefragmented governance (Shober, 2010). At the local level, mayors have made similarclaims about their own need for greater control versus other institutions, such aslocal school boards and district departments of education (Henig, 2004).
Three Dimensions of Centralization
Before discussing key components of state education governance, this sectiondefines centralization and decentralization. To keep the exposition clear, the articlewill use the term “centralization” and characterize states as relatively more or lesscentralized in how they govern education. Borrowing from Treisman’s (2007, p. 28)framework, there are three dimensions of governance on which a state might decideto centralize: political, administrative, and fiscal.5
Political centralization can include features of governance that define the locus ofdecision-making authority on public matters, paths to power for government offi-cials, and the degree of involvement by state and local officials in designing consti-tutional provisions. This article focuses on the second component by examining the
Manna: Centralized Governance and Student Outcomes 685

degree to which power over appointments to key positions in state government isrelatively centralized into the hands of fewer people. Variation in who is empoweredto select government officials creates different principal–agent relationships as wellas different networks, which can affect policy implementation and results (Lewis,2007; Meier & O’Toole, 2006).
Administrative centralization involves the degree to which a central authoritydevelops and uses bureaucracies to carry out public policy. As state legislatures andgovernors collaborate to create laws, for example, they must identify the combina-tions of state or local agencies (or nongovernmental groups) that should implementthem. Those administrative choices can have substantively important implicationsfor how policies operate in the field (Meier & O’Toole, 2006; Pressman & Wildavsky,1984; Wilson, 1989).
Finally, fiscal centralization concerns the allocation of responsibility across levelsof government for raising and spending public revenues. One could imagine severalprogram areas where either raising revenue or spending it, or both, might be rela-tively more centralized. In Treisman’s (2007) discussion, fiscal centralization is essen-tially a more specific subset of the broader category of political centralization that hedescribes, which includes policymaking power and federalism issues. He singles outfiscal centralization, though, given that the specific ability to raise and spend publicresources has such important governance implications. The golden rule of policynicely captures this idea: he who has the gold gets to make the rules.
State Education Governance
This section describes state education governance using the three dimensionsjust defined. The fact that state constitutions empower all states to establish andmaintain free systems of public education is why observers assign to states primaryresponsibility for the nation’s schools (Howell, 2005). Despite that commonality, thestates’ institutional choices about education governance have produced varyinglevels of political, administrative, and fiscal centralization.
Start with political centralization and the paths to power for two types of keystate officials who govern education. First are state education chiefs, who exist in allstates. Sometimes called state superintendents of schools or chief state school offi-cers, these people run state education agencies, the primary state-level bureaucraciesresponsible for implementing education policy. Their work involves administeringdozens of state and federal education programs and allocating federal and stateresources to fund local school district activities. Chief state school officers arepolicymakers because they help craft and enforce regulations that assist their agen-cies and localities in executing their duties. Second are members of state boards ofeducation. Presently, all but Wisconsin and Minnesota have these institutions.State boards are policymaking bodies whose responsibilities vary across the states.Generally speaking, they tend to play some role in setting academic standards,approving standardized tests, certifying test results, and setting high school gradu-ation requirements. By analogy, they are parallel to local school boards, but their
686 Policy Studies Journal, 41:4

decision-making authority is over the content of state policies, whereas local boardsaddress matters arising in their particular communities.
The selection methods for state chiefs and board members vary across the states.In 2012, for example, 13 states allowed governors to appoint the chief; 24 had thestate board appoint the chief; while the remaining 13 had voters select the chief instatewide elections. The selection of state board members also varied. In 33 states,governors appointed those members, in 6 states voters elected them, and varyingarrangements existed in the 11 other states, including boards with a combination ofelected and appointed members (National Association of State Boards of Education,2012). The most centralized states empower governors to select these officials. Othershave more fragmented or nuanced systems that leave the governor with less formalcontrol over appointments.
Consider administrative centralization next. Although state governments areresponsible for education, provision of schooling is generally considered a localfunction. That is because with extremely rare exceptions state governments do notrun schools and instead have delegated that task to local school districts. Despiteconjectures about local control of education, school districts exist as administrativeagents of the states and owe their existence, including their powers and geographicboundaries, to state governments (Howell, 2005). States often create school districtsto operate apart from cities or counties making them one of the most commonsingle-purpose governments in the country (Burns, 1994).
One way to assess the degree of administrative centralization in state educationgovernance is to consider how many school districts states have created to help themfulfill their constitutional responsibilities to provide education. In 2008–09, the mostrecent year for which data are available (U.S. Department of Education, 2011 ), therewere 13,809 school districts nationwide. Not surprisingly, the data show variation inthe degree of administrative centralization across the states. The interquartile rangefor that year varied from 89 to 362 districts per state. Interestingly, some relativelypopulous states operated few districts and some smaller states operated many. Forexample, Florida maintained only 67 districts, while Iowa had 362 and Oklahomahad 534.
Finally, fiscal centralization is a last dimension of state education governance.The focus here is on the allocation of responsibility for providing revenues foreducation. Considering 2008–09 again, the most recent school year with availabledata, shows how state responsibilities vary. In that school year, 30 states clusteredbetween providing 40 and 60 percent of the revenues for their public schools. Amongthe remaining states, 12 provided less than 40 percent and 8 provided more than 60percent (U.S. Department of Education, 2011).
Competing Hypotheses
Some state education reformers have argued that greater political, administra-tive, and fiscal centralization of education governance will promote academic excel-lence and equity. The arguments for greater centralization suggest that it will fosterprogram coherence, improved efficiency, clearer lines of accountability, and better
Manna: Centralized Governance and Student Outcomes 687
economies of scale that make it possible to offer students more advanced courses.Advocates for less centralization maintain that schools will operate better and stu-dents will enjoy as much or more academic success in states with less centralizedarrangements. That view posits that decentralized governance is likely to improveresponsiveness, create more proximate face-to-face accountability, and allow forcustomized learning to meet individual students’ needs. Because reasonable theo-retical arguments support both sides, and because no empirical studies have exam-ined the relationship between degrees of centralization in state education governanceand student outcomes, in this section I consider some of these competing argumentsover the merits of greater political, administrative, and fiscal centralization.
Proponents of greater political centralization typically make two broad argu-ments to justify empowering governors to name state education chiefs and stateboard members. Because governors are state chief executives, greater political cen-tralization is likely to foster coordination during policy implementation. Like presi-dents at the national level (Lewis, 2003), governors are the only state officials thathave incentives to manage the entire enterprise of government. That responsibilitycontrasts with legislators, whose committee assignments tend to narrow their con-cerns, or judges, who focus on interpreting laws and constitutions but not on guar-anteeing that bureaucracies can function well (Wilson, 1989). Governors possessingauthority to name the chief of the state’s education bureaucracy or members of thestate’s education board are much better positioned to influence and coordinateeducation policy than governors in states where these officials attain their officesthrough some other means. By analogy, at the local level Provan, Huang, andMilward (2009) reveal how such positioning matters in their study of health andhuman services networks. They find that organizations with high centrality canassert much influence over other network actors given the central player’s controlover “material resources, information, and social and political support (legitimacy)”(Provan et al., 2009, p. 877). Advocates of centralization would point to the gover-nor’s potentially high influence over similar factors. The quality of a governor’sinformation also may increase with gubernatorial appointments by enhancing pro-fessionalism or candor, or both, within a governor’s inner circle. Not having todevelop an independent political base to win elections to their positions, state chiefsand board members appointed by governors can be somewhat shielded from politi-cal attacks, and thus governors may receive more honest and timely advice fromthem.
Proponents of political centralization also argue that empowering governors toappoint state education chiefs or board members is likely to foster effective account-ability for results. In state politics, governors are the most visible and well-knownpolitical actors, commanding the greatest attention in state elections (Wattenberg,McAllister, & Salvanto, 2000). Chief executives at all levels of government, such aspresidents, governors, and mayors, are particularly attuned to accountability chal-lenges because citizens typically blame them for failures, even when these officialsmay lack the institutional authority or resources to succeed (Lewis, 2003).
Competing claims challenge the virtues of allowing governors to appoint stateeducation chiefs or board members. Greater coordination or accountability for results
688 Policy Studies Journal, 41:4
may ensue with enhanced gubernatorial power, but it is not guaranteed (Treisman,2007). Successful coordination depends upon governors possessing knowledgeabout and interest in education policy, which can help them select capable chiefs orboard members and develop a coordinated policy agenda. Critics of centralizationnote that because not all potential governors are skilled at these things, it is risky tocentralize power in their hands. As Ostrom (1999) cautions, unified authority doesnot necessarily result in greater responsibility. In fact, it may undercut efforts toimprove human welfare and, in the process, suggest to citizens that distant powers,not they themselves, play the most important role in holding their local publicauthorities to account.
Further, chief executives may not necessarily be more interested in effective,technically competent governance than in pleasing various constituencies thathelped them win office (Salmore & Salmore, 1996; Wayne, 2005). Governors serve aspolitical party leaders who, through appointments, can dispense patronage to partyloyalists. Seeing appointments through a strong partisan lens may dilute any poten-tial gains in professionalism that the pro-centralization arguments suggest. Also, ifthe goal is to shield state education chiefs from the political winds, for example, onecould more easily accomplish that goal by having the less visible state board ofeducation, rather than the governor, pick the chief. Finally, on certain issues gover-nors may be as vulnerable to interest group pressures as legislators. Given thestrength of state teacher unions (Rosenthal, 1998), the growing power of the businesscommunity in state education matters (Goertz, 1996), and the power of both groupsto influence state elections, effective governance of education policy may be difficultfor governors to achieve in practice.
Consider next the debates over administrative centralization. Advocates of thisapproach have argued that potential gains in efficiency and quality justify consoli-dating many smaller school districts into fewer larger ones (Strang, 1987). Largerdistricts can offer more diverse and challenging courses, including low-stress elec-tives but also substantively demanding ones, such as foreign language study inChinese or advanced science and mathematics. Also, these districts can more easilyemploy specialists to address the needs of students with disabilities and immi-grants who are still learning English. Small districts are especially disadvantagedin serving the former group given that appropriate accommodations for even asingle disabled student can cost a district several tens if not hundreds of thousandsof dollars per year. At the local level, administrative arrangements organizedaround larger school districts eliminate bureaucratic duplication as fewer superin-tendents and central offices are required. Due to improved economies of scale,larger districts can leverage their purchasing power to acquire supplies and equip-ment. State overseers of local school districts also see some advantages with greatercentralization. Fewer administrative agents in the field simplify state officials’responsibilities for monitoring, offering technical assistance, and coordinationbecause there are simply fewer agents to oversee. The existence of fewer districtscan attenuate the cognitive demands facing state officials and help them makebetter decisions as they use scarce resources to improve student results (Jones &Baumgartner, 2012).
Manna: Centralized Governance and Student Outcomes 689
Critics of administrative centralization counter that greater efficiencies andbetter performance can occur with less centralized approaches. The proliferationof smaller and more diverse school districts is likely to initiate local-levelcompetition that can spur innovation and a tailoring of local program offerings tobest educate a community’s students (Tiebout, 1956). Smaller districts are likelymore adaptable to local circumstances and rapidly changing conditions. Thatadaptability makes timely and tailored responses to individual students morelikely. Although large school districts may employ more specialists or offer morestudent assistance programs, students may encounter bureaucratic hurdles infinding and then accessing those resources. Further, the existence of many schooldistricts does nothing to preclude locally initiated consolidations of ideas orresources as needed. Such sharing can occur when local officials collaborate acrossdistrict boundaries through informal or sometimes formal networks (Meier& O’Toole, 2006), something that advocates of polycentric governance would findattractive (McGinnis, 1999). Those collaborations can create timely economiesof scale and allow local governments to exploit targets of opportunity withoutthe administrative overhead involved in maintaining larger more bureaucraticdistricts.
Finally, debates also exist over the merits of fiscal centralization. Those whosupport having schools rely more on nonlocal revenues suggest that more central-ized arrangements are likely to promote coordination and enhance equity. Treisman(2007, p. 15) calls suggestions for fiscal coordination, among the arguments forgreater centralization, perhaps “the most convincing.” Less centralization on fiscalmatters can create problems, he explains, because “When local or central govern-ments can independently tax the same base or are expected by voters to spend on thesame items, they may tend to overtax or underspend.” As a result, academic perfor-mance in a state may suffer given a less-than-optimal allocation of responsibility forraising revenues. Greater centralization of revenues also can produce more equitableeducational outcomes, given that central authorities are more able to redistributefunds to needy communities. Since the early 1970s, the equity impulse has been amajor assumption driving efforts to increase state control of education funding(Hanushek & Lindseth, 2009).
Appeals for less fiscal centralization in education governance extend some ofthe same arguments that support less administrative centralization. A functionalperspective holds that local school districts will be more adept at identifying theirparticular educational needs (Peterson, 1995). That view implies they will makewiser decisions on fiscal matters if they have the power to generate revenues to fundtheir own priorities, which might include reducing class sizes, providing after-school learning opportunities, or using variants of teacher merit pay. Admittedly,equity may suffer with more local control, but those losses may be attenuated by thewiser use of revenues to promote overall student success that local responsibilitywould cultivate. When distant, central authorities are more responsible for revenues,local communities have incentives to overstate their challenges to capture resourcesbeyond their actual needs. That rent-seeking behavior can create lost opportunitieswhen truly needy communities are shortchanged.
690 Policy Studies Journal, 41:4
Data and Methods
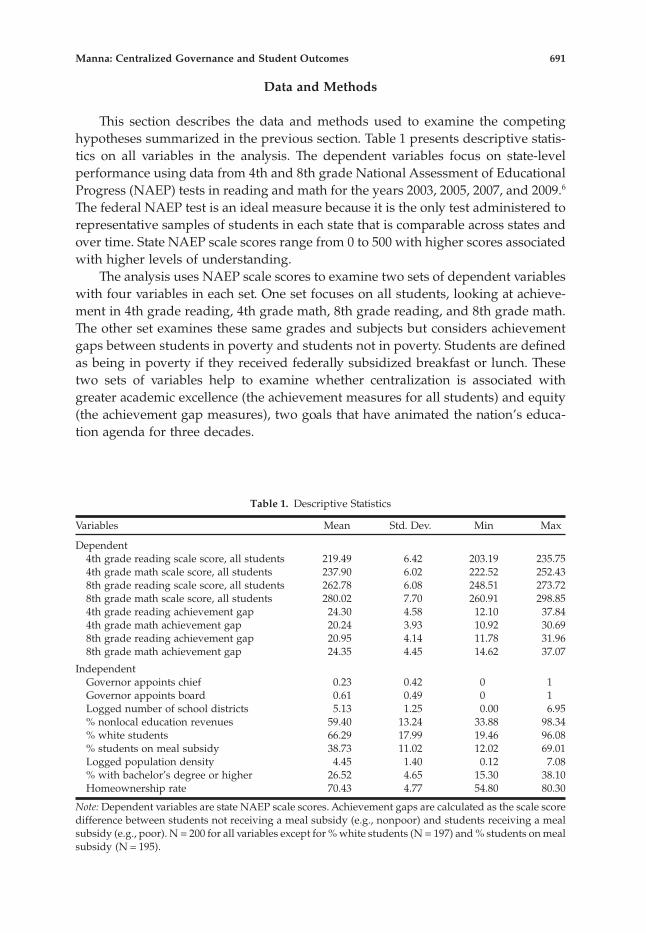
This section describes the data and methods used to examine the competinghypotheses summarized in the previous section. Table 1 presents descriptive statis-tics on all variables in the analysis. The dependent variables focus on state-levelperformance using data from 4th and 8th grade National Assessment of EducationalProgress (NAEP) tests in reading and math for the years 2003, 2005, 2007, and 2009.6
The federal NAEP test is an ideal measure because it is the only test administered torepresentative samples of students in each state that is comparable across states andover time. State NAEP scale scores range from 0 to 500 with higher scores associatedwith higher levels of understanding.
The analysis uses NAEP scale scores to examine two sets of dependent variableswith four variables in each set. One set focuses on all students, looking at achieve-ment in 4th grade reading, 4th grade math, 8th grade reading, and 8th grade math.The other set examines these same grades and subjects but considers achievementgaps between students in poverty and students not in poverty. Students are definedas being in poverty if they received federally subsidized breakfast or lunch. Thesetwo sets of variables help to examine whether centralization is associated withgreater academic excellence (the achievement measures for all students) and equity(the achievement gap measures), two goals that have animated the nation’s educa-tion agenda for three decades.
Table 1. Descriptive Statistics
Variables Mean Std. Dev. Min Max
Dependent4th grade reading scale score, all students 219.49 6.42 203.19 235.754th grade math scale score, all students 237.90 6.02 222.52 252.438th grade reading scale score, all students 262.78 6.08 248.51 273.728th grade math scale score, all students 280.02 7.70 260.91 298.854th grade reading achievement gap 24.30 4.58 12.10 37.844th grade math achievement gap 20.24 3.93 10.92 30.698th grade reading achievement gap 20.95 4.14 11.78 31.968th grade math achievement gap 24.35 4.45 14.62 37.07
IndependentGovernor appoints chief 0.23 0.42 0 1Governor appoints board 0.61 0.49 0 1Logged number of school districts 5.13 1.25 0.00 6.95% nonlocal education revenues 59.40 13.24 33.88 98.34% white students 66.29 17.99 19.46 96.08% students on meal subsidy 38.73 11.02 12.02 69.01Logged population density 4.45 1.40 0.12 7.08% with bachelor’s degree or higher 26.52 4.65 15.30 38.10Homeownership rate 70.43 4.77 54.80 80.30
Note: Dependent variables are state NAEP scale scores. Achievement gaps are calculated as the scale scoredifference between students not receiving a meal subsidy (e.g., nonpoor) and students receiving a mealsubsidy (e.g., poor). N = 200 for all variables except for % white students (N = 197) and % students on mealsubsidy (N = 195).
Manna: Centralized Governance and Student Outcomes 691

Four key independent variables capture the degree of political, administrative,and fiscal centralization in the states. Two variables tap political centralization andwere measured during the school year that a given NAEP test was administered(e.g., the 2007 NAEP was administered during the 2006–07 school year). The first iscoded 1 if the state’s governor has the power to appoint the chief state school officer,and 0 otherwise. The second also is a dummy variable coded 1 if the governorappoints all state board members, and 0 otherwise.7 As reviewers for this articlepointed out, the dummy variable approach presented here elides some of the nuancethat exists in the state processes for selecting chiefs and board members and thepowers that those officials wield. Still, the approach here is useful and reasonablegiven past research on other levels of government that has followed a similarapproach (Lewis, 2007). Empirically, it also is difficult to capture such nuance in aquantitative study, given that it would require loading up the article’s statisticalmodels with numerous dummy variables, including many that would not vary muchdue to the particulars of different state arrangements, to account for various sce-narios. Finally, this relatively straightforward issue of control over appointments hasanimated numerous state discussions about the proper balance of power betweengovernors and these other state institutions (Shober, 2010). Establishing a set ofbaseline results tied to the appointment powers of governors hopefully will promptfuture studies that incorporate more nuance.
The level of administrative centralization is measured as the logged number ofschool districts that existed during the school year that each NAEP test was admin-istered.8 For this variable, lower values, which denote fewer districts, are associatedwith greater centralization.
Finally, I operationalize fiscal centralization as the percent of revenues for edu-cation that came from nonlocal sources during the school year in which NAEP testswere administered. This measure combines funds coming from state and federalsources.9 The reason for distinguishing between nonlocal and local, rather thanfederal, state, and local, is that the federal government’s main education fundingsources, the Elementary and Secondary Education Act and the Individuals withDisabilities Education Act, are administered by state-level authorities. In fact, eachstate’s own policy choices and regulatory interpretations have a tremendous impacton how local school districts use federal funds (Manna & McGuinn, 2013). Inessence, federal dollars are handed off to the states and local districts, yet the statesthemselves are responsible for interpreting federal law as they help local schooldistricts manage how those funds are spent. Higher values on the measure ofnonlocal revenues indicate greater centralization.
The models also incorporate five variables to account for key environmentalfactors.10 Two consider the test-taking population. The first is the percent of studentswho are white and the second is the percent of students in poverty. The latter ismeasured as the percent of students receiving federally subsidized breakfast orlunch. Both are measured during the school year that NAEP tests were adminis-tered.11 These two measures recognize well-documented empirical findings thathave related achievement to student characteristics. Dozens of studies, includingthose analyzing NAEP data, have found that white students tend to outperform their
692 Policy Studies Journal, 41:4
peers who are racial minorities (U.S. Department of Education, 2007). Similarly,studies have found strong associations between economic disadvantage and lowerstudent achievement (Ladd, 2012). Studies also find that these income and demo-graphic features of states and schools are associated with the presence of achieve-ment gaps (Bali & Alvarez, 2004; Lee & Reves, 2012). The third variable, populationdensity, is a logged measure of population per square mile of land area in each state.12
This variable captures the additional educational challenges confronting more urbanstates, including the presence of larger non-English-speaking populations, that therace and poverty measures might not perfectly capture. The fourth and fifth mea-sures are designed to assess the degree to which a state’s citizens might demandexcellent schools. One measure is the percent of state residents at least 25 years oldwho have a bachelor’s degree or higher.13 A state with a more highly educatedpopulation is likely to demand a certain level of quality in its elementary andsecondary schools, which could translate into higher NAEP scores. The other is thehomeownership rate, a measure of owner households as a percentage of all house-holds in the state, which also is a useful measure capturing state wealth. Priorresearch has shown that homeownership is associated with better outcomes forstudents, and given that good schools improve home values, states with large per-centages of homeowners are likely to demand high quality schools (Haurin, Parcel, &Haurin, 2002).14
I analyze each dependent variable using ordinary least squares regressionwith robust standard errors clustered by state. This approach accounts fornonindependence across observations, given that each state appears in each modelmultiple times. Each model also contains individual dummy variables for the years2005, 2007, and 2009, with the omitted category being 2003. The dummy variablescontrol for potential unmeasured factors associated with each year that may berelated to student achievement.15 Finally, given the unique populations, geographies,and institutional features of Alaska and Hawaii, I present results including andomitting these two states, which produces 16 regression models in all to consider.16
Statistical Results
Proponents of greater centralization would expect higher achievement andlower achievement gaps in states where governors appoint state chiefs, governorsappoint state board members, the logged number of school districts is low, and thepercent of nonlocal spending is high. Advocates for less centralization would expectthe opposite for each of these variables. The results provide advocates on both sideswith some evidence to bolster their case, although greater centralization tends to bemore strongly associated with lower achievement gaps.
Full results from all regressions appear in Tables A1 and A2 in the appendix.Due to the large number of models in the analysis the discussion here focuses onkey results that appear visually in Figure 1. Each of the figure’s four parts consid-ers all 16 regressions but focuses on results for an individual governance variable.For example, part A considers the independent variable of whether the governorappoints the state chief. Within this part and the others, results are divided
Manna: Centralized Governance and Student Outcomes 693
A. Independent variable: Governor appoints state chief
4 read
4 math
8 read
8 math
4 read gap
4 math gap
8 read gap
8 math gap
−4 −2 0 2 4 −4 −2 0 2 4
All 50 states Omits Alaska & Hawaii
Dep
ende
nt v
aria
ble
Governor appoints state chief parameter estimate
B. Independent variable: Governor appoints state board
4 read
4 math
8 read
8 math
4 read gap
4 math gap
8 read gap
8 math gap
−2 0 2 −2 0 2
All 50 states Omits Alaska & Hawaii
Dep
ende
nt v
aria
ble
Governor appoints state board parameter estimate
C. Independent variable: Logged number of school districts
4 read
4 math
8 read
8 math
4 read gap
4 math gap
8 read gap
8 math gap
−1 0 1 2 −1 0 1 2
All 50 states Omits Alaska & Hawaii
Dep
ende
nt v
aria
ble
Logged number of school districts parameter estimate
D. Independent variable: % of nonlocal revenues for education
4 read
4 math
8 read
8 math
4 read gap
4 math gap
8 read gap
8 math gap
−0.1 0 0.1 −0.1 0 0.1
All 50 states Omits Alaska & Hawaii
Dep
ende
nt v
aria
ble
Percent of nonlocal revenues parameter estimate
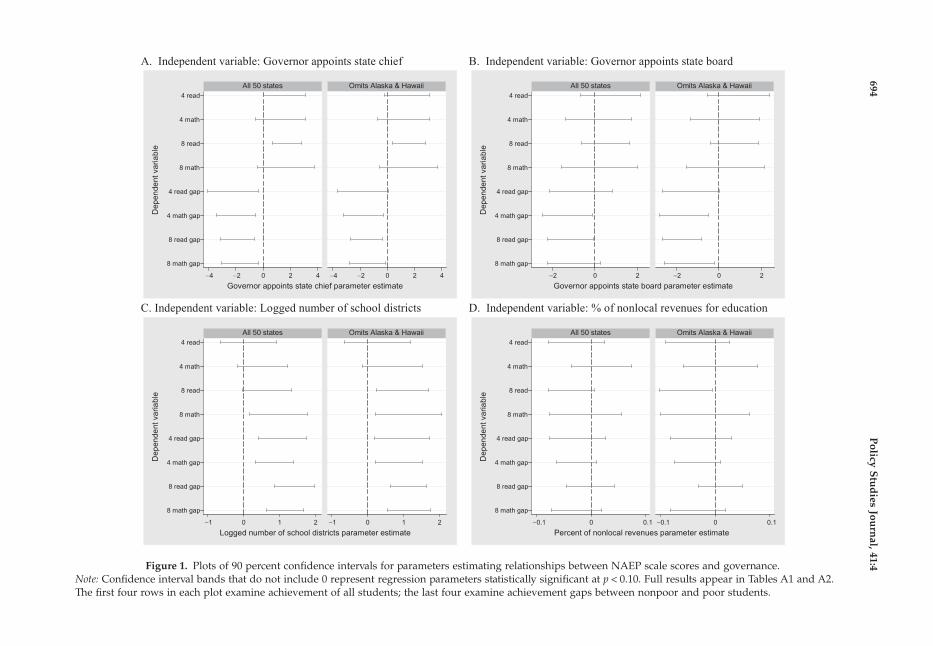
Figure 1. Plots of 90 percent confidence intervals for parameters estimating relationships between NAEP scale scores and governance.Note: Confidence interval bands that do not include 0 represent regression parameters statistically significant at p < 0.10. Full results appear in Tables A1 and A2.The first four rows in each plot examine achievement of all students; the last four examine achievement gaps between nonpoor and poor students.
694P
olicyS
tud
iesJou
rnal,41:4
between models including all states and those omitting Alaska and Hawaii. Thehorizontal axis represents different possible values for the regression coefficient. Inpart A, then, each capped range plot reports the 90 percent confidence intervalestimate for the governor appoints the state chief coefficient in an individualregression model, beginning with the 4th grade reading model and extendingdown to the model for achievement gaps in 8th grade math. The midpoint of eachrange plot is the point estimate for the coefficient. Range plots that overlap withthe dotted line, corresponding to a parameter value of 0, fall short of statisticalsignificance at p < 0.10.
Part A provides evidence to support the claim that more centralized gover-nance, here measured as allowing the governor to appoint the state chief, is asso-ciated with better outcomes. The point estimates, which appear in Tables A1 andA2, are all positive in 4th and 8th grade reading and math achievement, whereaspoint estimates for achievement gaps are all negative. In only two models onachievement is a parameter statistically significant, however, which is for the 8thgrade reading results for all 50 states and for the model that omits Alaska andHawaii. In contrast, the results are quite strong on the achievement gap models,where in seven of eight cases the coefficient is statistically significant. Substantively,the relationships are small but noticeable nevertheless. For example, for 8th gradereading, the model with all 50 states predicts states with a chief appointed by thegovernor to have higher achievement by 1.74 NAEP scale score points, or 0.29 of astandard deviation, compared with states without appointed chiefs.17 On theachievement gap models, the point estimates fall between −1.45 and −2.21 and havesubstantively larger relationships with the dependent measures. The parameterestimate of −2.21 from the 4th grade reading gap model with all 50 states showsthat states with chiefs appointed by the governor have lower achievement gaps byalmost half (0.48) of a standard deviation compared with other states, while the 4thgrade math model, with a parameter of −1.99, predicts gaps that are lower by 0.51of a standard deviation.
Part B considers the governor’s ability to appoint members of the state board. Theresults provide little or no evidence of an association between governor-appointedboards and student achievement in models with all 50 states and those omittingAlaska and Hawaii. Nearly all of the capped range plots in the upper half of part Bfall far from the p < 0.10 threshold. The results on achievement gaps are different,though, given that all point estimates are negative, and 5 of 8 are statistically signifi-cant at p < 0.10 (additionally, the p-value for the 4th grade reading gap model withoutAlaska and Hawaii rounds to 0.10). In contrast to the models that include all 50 states,those omitting Alaska and Hawaii reveal larger parameter estimates with strongerstatistical relationships and an overall similar pattern. Some of those results aresubstantively significant, as well. For example, in the 8th grade reading gap modelwith all 50 states, the point estimate is −1.14, which predicts states with governor-appointed boards to have narrower achievement gaps by 0.28 of a standard devia-tion. For that same grade and subject, in the model that omits Alaska and Hawaii theparameter estimate of −1.75 predicts a gap that is narrower by 0.42 of a standarddeviation.
Manna: Centralized Governance and Student Outcomes 695
The results in part C reveal compelling statistical and substantive results on thelogged school district variable, with both advocates and critics of centralizationfinding evidence to support their views. Regarding achievement, the point estimatesare all positively signed, suggesting that less centralization is associated with betterachievement across 4th and 8th grade reading and math. Interestingly, the results areonly statistically significant in the 8th grade achievement models. For that gradelevel, the substantive results are impressive, though. For example, in 8th grade math,the model using all 50 states predicts that a shift from the lowest to highest value onthis variable is associated with a substantively large increase in 8th grade mathachievement, equivalent to 0.88 of a standard deviation of the dependent variable.
The part C results focusing on achievement gaps reveal statistically and substan-tively strong relationships across all models, which, in contrast to the achievementresults, suggest advantages for more centralized approaches to governance. In otherwords, less centralization is associated with higher achievement (improved excel-lence), but also with greater disparities between nonpoor and poor students (dimin-ished equity) across grades and subjects. The school district coefficients on theachievement gap models all are positively signed and range from 0.86 to 1.41. All arestatistically significant at p < 0.05, and they are substantively important as well. Themodel with all 50 states for 8th grade reading gaps provides an illustration. Here ashift from the lowest to the highest value on the logged district measure is associatedwith a large 9.80 point widening of the achievement gap, equivalent to 2.17 standarddeviations on the dependent variable. Even when one omits Alaska and Hawaii, thelatter of which accentuates this result given that it has only 1 school district (for alogged value of 0 on the independent variable) and thus makes the shift from thelowest to highest value more extreme, the results are still substantively large. Con-sidering a minimum to maximum shift in the school districts variable from the 8thgrade reading gap model that omits Alaska and Hawaii still predicts a gap that iswider by 5.81 points, equal to 1.41 standard deviations.
Finally, part D of Figure 1 reports results on the independent variable measuringthe percent of nonlocal revenues. Other than the suggestive results for 8th gradereading achievement, which seem to be negatively associated with greater fundingcentralization, the parameter estimates generally fall well short of the p < 0.10 thresh-old. These statistically insignificant results are somewhat interesting nevertheless.Battles about the proper level of government to fund education have consumedmuch political energy in the states (Hanushek & Lindseth, 2009). Still, the resultshere suggest no relationship between achievement or achievement gaps and theamount of nonlocal revenues provided. Neither the advocates nor the critics ofgreater centralization gain much traction for their arguments based on theseresults.18
Discussion
Debates about the benefits of centralized versus decentralized governance havepersisted since the earliest days of the United States. At the nation’s founding,Hamiltonians and Jeffersonians challenged each other about the appropriate balance
696 Policy Studies Journal, 41:4

of power between national and state institutions. Today, such arguments continue inmany contexts, although political scientists have shown that much popular supportexists for the Jeffersonian view that less centralized governance is preferable. AsTreisman (2007, p. 1) notes, “Along with democracy, competitive markets, and therule of law, decentralized government has come to be seen as a cure for a remarkablerange of political and social ills.” By exploring state governance of education, a policyarea where centralization varies along multiple dimensions, this article helps con-tribute to the ongoing debate over the relative benefits of particular institutionalarrangements.
Theoretically, the results help bolster the view that one should consider central-ization a multidimensional concept (Treisman, 2007). Not all forms of centralizationbehave similarly when examined against measurable outcomes. In this analysis ofstate NAEP results, more political centralization, as measured by the governor’sability to appoint state education chiefs or state board members, revealed supportfor those who believe that greater centralization can attenuate achievement gapsbetween poor and nonpoor students. In contrast, the findings on fiscal centralization,a topic that prompts impassioned debates across the country, suggested essentiallyno relationship between the percent of nonlocal revenues for education and studentsuccess, measured either as academic achievement or achievement gaps betweennonpoor and poor students. Different governing arrangements can produce tensionsas well, as the results on administrative centralization illustrated. Having moreschool districts is associated with higher achievement in 8th grade but also largerachievement gaps in 4th and 8th grade, suggesting a possible trade-off betweenexcellence and equity.
Interestingly, the results also reveal that the association between centralizationand outcomes sometimes depends on the particular outcome in question. Forexample, while more decentralized administration, as measured by the loggednumber of school districts, was associated with higher achievement, the results weremore statistically significant for 8th graders than for 4th grade students. What mightaccount for this difference across grade levels? One potential explanation, whichopponents of centralization might advance, flows from the argument that smallerschool districts can offer more personal and less bureaucratic assistance to theirstudents, which can help them succeed. Such an advantage may not necessarily existat the elementary school level, where officials in large and small districts alike try tooperate schools on smaller scales with fewer students per teacher and a morehome-like atmosphere. But once students arrive in middle school or junior high,typically in 6th or 7th grade, the advantages of smaller districts may begin to mani-fest themselves. Students in that stage of education may be more likely to get lost inthe crowd in large districts with bigger middle schools. Smaller districts may be ableto continue offering a more personal touch to their middle schoolers, which couldhelp them excel academically or at least prevent them from slipping through thecracks. That kind of attention might be especially helpful for middle school studentsgiven the emotional and physical changes associated with the onset of puberty,which typically occurs at this time, along with their added need to become moreserious about academic work as they prepare for success in high school and beyond.
Manna: Centralized Governance and Student Outcomes 697
The results in the top four capped range plots in part C of Figure 1 may be revealingthe advantage of more decentralized administration in dealing with these emotional,physical, and academic demands.
Still, as the bottom four plots in part C show, it is crucial to consider gapsbetween students and not just the performance of all students. It could be that amore personal touch in middle school tends to benefit students already poised forhigh school success, thus accelerating their achievement and driving up overallaverages, but in the process widening gaps between students. Deeper study of thesedynamics seems warranted. If education is indeed the civil rights issue of the twenty-first century, as some politicians and activists have increasingly claimed, then anysystemic feature of governance that appears to diminish equity would merit closescrutiny.
The findings also help to shed valuable light on contemporary educationdebates. Because education has become a more salient and consequential policyarea, governors have clamored for more control over their state systems. As themost recognizable political figure in a state, governors have assured voters thatlocating accountability for education performance in the governor’s mansion willboost student achievement. To date, however, the governors’ claims have persisteddespite lacking hard evidence to back them. The results on the state chiefs and stateboards variables provide at least some suggestive evidence to support the gover-nors’ views. Subsequent research that probed more deeply the nuanced connectionsbetween governors, state boards, and state chiefs could further test the governors’arguments. For example, the power to appoint may matter more in states wheregovernors take an active rather than a hands-off approach to educationpolicymaking. Alternatively, a governor who is enthusiastic and knowledgeableabout education policy may be able to lead and coordinate regardless of theappointment powers that he or she possesses. Such nuances may produce addedinsights given that in the present analysis, in order to specify a tractable statisticalmodel, the state chief and state board measures have necessarily simplified thearrangements that exist. As reviewers pointed out, it is worth noting that additionalvariation is embedded in the cases coded “0” on these two measures. More quali-tative work that probed some of these nuances could generate added insights thatcould help inform future state-level debates about the proper way to connect gov-ernors, state chiefs, and state boards. Similarly, more detailed coding of the specificpowers that chiefs and boards possess—admittedly, a challenging task to accom-plish for all 50 states—could reveal the mechanisms by which these leaders exerciseinfluence. It could be that the specific menu of powers and responsibilities them-selves are more important than whether gubernatorial appointments are the path topower for these officials.
Finally, an important caveat is in order. Despite the relationships revealed in theanalysis, one should be cautious about the claims that an observational study such asthis one can support. Making descriptive inferences that show associations betweenvariables is different than showing that a causal relationship between those variablesexists. While policy advocates supporting centralization may wish to claim thatproviding governors with more enhanced appointment powers would cause
698 Policy Studies Journal, 41:4
achievement to increase or that consolidating school districts will produce narrowerachievement gaps, deeper analysis is required before reaching those conclusions.
Yet as the opening pages of this article noted, studying state governing arrange-ments rather than specific policies can help to identify baseline relationshipsbetween the systemic features of governance and valued outcomes. Subsequentresearch can explore these associations in more detail to uncover potential causalmechanisms at work. Knowing that the number of school districts is associated withcertain outcomes produces a nice launching pad for more work that could helpexplain why this association exists. In its conceptualization and approach, then, thisarticle has revealed that a focus on structural characteristics of states can servevaluable analytical purposes even though such structures are somewhat distant fromultimate outcomes than more proximate state or local policies that operate in class-rooms each day. Such an approach that focuses on governing institutions rather thanpolicy levers can help scholars assist policymakers as they assess the potential valueof different institutional designs.
If the evidence suggests that beneficial outcomes are associated with certaininstitutional arrangements, then digging deeper to understand the reasons why andthen potentially reforming the institutions themselves may prove promising and amore efficient way to create positive change. In short, a small number of majorinstitutional changes may end up being substantively more valuable than tinkeringwith many more narrow policy levers. Political scientists who explored state educa-tion governance several years ago recognized the potential value in considering stateinstitutions, and urged others to analyze such matters more deeply (Masters et al.,1964). This article has made some progress on that front, but clearly much potentialwork remains given the diverse governing arrangements in the states and the varietyof valued educational outcomes that scholars might consider.
Paul Manna is Associate Professor in the Department of Government and theThomas Jefferson Program in Public Policy at the College of William & Mary,Williamsburg, Virginia, USA.
Notes
I am pleased to acknowledge Diane O’Hara, Amanda Guthrie, K.C. Tydgat, Erica Parker, TimothyHarwood, Keenan Kelley, and Andrew Englehardt for outstanding research assistance. Kevin Smith andGeorge Krause provided great substantive comments on earlier drafts. The Spencer Foundation providedinvaluable financial support.
1. Some education policy scholars have published more recent accounts of state education governance(Conley, 2003), and applied reports are widely available (NASBE Study Group on EducationGovernance, 1996). Generally speaking, that work has been descriptive and lacked theoretical ground-ing. An exception is Shober (2010).
2. Meier and O’Toole (2006) use the word “outputs” not “outcomes,” but their discussion embraces bothideas. In this article, I draw on Wilson’s (1989) definitions of these concepts to preserve the distinction.I consider policy outputs to be specific policies that the governance system produces and policyoutcomes to be the results for people that ultimately emerge.
3. This study focuses on structural factors, while accounting for key environmental conditions.
Manna: Centralized Governance and Student Outcomes 699
4. A long tradition of research in public policy and political science has recognized the analytical valueof leaving policies and implementation decisions in black boxes to examine broader associationsbetween institutional arrangements and results. See, for example, Doyle (1986), Russett (1994),Coleman and Parker (2009), and Gerring and Thacker (2008).
5. Treisman (2007) frames his analysis by discussing degrees of “decentralization,” but the basic logic isthe same whether one uses that term or “centralization.”
6. The year 2003 was the first that the federal government required states to participate in NAEP as acondition of receiving federal Title I dollars. Before 2003, state participation was optional. NAEP datawere downloaded from the National Assessment of Educational Progress website located at http://nces.ed.gov/nationsreportcard/naepdata/dataset.aspx.
7. Data on paths to power for chiefs and board members come from the author’s coding and cross-checking of various primary source documents. Most sources are from either the Council of ChiefState School Officers, the National Association of State Boards of Education, or the Education Com-mission of the States. Additional sources were consulted for the small number of years when thesesources disagreed on a state’s arrangement.
8. School district data come from the U.S. Department of Education (at http://nces.ed.gov/Programs/digest/).
9. Revenues data come from the U.S. Department of Education (at http://nces.ed.gov/Programs/digest/).
10. A reviewer suggested that correlations between independent variables may have inducedmulticollinearity. Post-estimation VIF tests on all models never produced values higher than3.2, which is far below 10.0, the threshold at which multicollinearity might merit additionalattention.
11. Student race and poverty measures were downloaded from the U.S. Department of Education’sCommon Core of Data located at http://nces.ed.gov/ccd/bat/.
12. Measures of total population were downloaded from the U.S. Census Bureau at http://www.census.gov/popest/data/intercensal/state/state2010.html; total land area in the states came fromU.S. Census Bureau (at http://www.census.gov/compendia/statab/). These measures were used tocalculate population density.
13. State-level educational attainment was compiled from U.S. Census Bureau (at http://www.census.gov/compendia/statab/).
14. Berkman and Plutzer (2005) make a related argument by noting that under certain conditions seniorcitizens who own their homes may be induced to support higher school expenditures, given the linkbetween school quality and home values. Data on homeownership come from the U.S. Census Bureau(at http://www.census.gov/housing/hvs/data/ann11ind.html). Many thanks to the reviewer whosuggested this measure.
15. Given the relatively short time series involving only four time periods (T), I chose not to use othertime-series-cross-section (TSCS) methods, such as a random-effects specification or panel-correctedstandard errors, given the caution from Beck (2001, p. 274) that “one ought to be suspicious of TSCSmethods used for, say, T <10.”
16. Alaska and Hawaii are both geographically distant from the other states and contain unique disad-vantaged populations, comprised primarily of Native Americans (Alaska) or Pacific Islanders(Hawaii). In addition, Alaska is geographically vast and sparsely populated. Hawaii is institutionallyatypical given that it has a single school district. A comprehensive examination of bivariate relation-ships between each dependent variable with each independent variable, as well as plots of regressionresiduals with all states in the models, revealed these two states to be outliers in enough instances towarrant presenting results from models with and without them. Theoretically, that was better thanincluding a dummy variable (coded 1 if Alaska or Hawaii, and 0 otherwise) because such an approachwould consider these states to be two of the same kind, which is unwarranted because on mostmeasures they are outliers for very different reasons.
17. These predictions and others discussed in the article are made while holding other variables in themodels constant.
18. In response to a reviewer’s query, I also ran all models using just the percent of revenues from statesources, rather than the combined measure that looked at federal and state revenues. The results,
700 Policy Studies Journal, 41:4

available upon request, were nearly identical in terms of the size of the parameter estimates and themeasures that came up as statistically significant.
References
Bali, Valentina A., and R. Michael Alvarez. 2004. “The Race Gap in Student Achievement Scores: Longi-tudinal Evidence from a Racially Diverse School District.” Policy Studies Journal 32 (3): 393–415.
Beck, Nathaniel. 2001. “Time-Series—Cross-Section Data: What Have We Learned in the Past Few Years?”Annual Review of Political Science 4: 271–93.
Berkman, Michael B., and Eric Plutzer. 2005. Ten Thousand Democracies: Politics and Public Opinion inAmerica’s School Districts. Washington, DC: Georgetown University Press.
Burns, Nancy. 1994. The Formation of American Local Governments: Private Values in Public Institutions. NewYork: Oxford University Press.
Campbell, Roald F., and Tim L. Mazzoni, Jr. 1976. State Policy Making for the Public Schools. Berkeley, CA:McCutchan Publishing Corporation.
Chubb, John E., and Terry M. Moe. 1990. Politics, Markets, and America’s Schools. Washington, DC:Brookings Institution.
Coleman, John J., and David C. W. Parker. 2009. “The Consequences of Divided Government.” In TheOxford Handbook of the Presidency, eds. George C. Edwards III and William G. Howell. New York:Oxford University Press, 383–402.
Conley, David T. 2003. Who Governs Our Schools? Changing Roles and Responsibilities. New York: TeachersCollege Press.
Dee, Thomas S., and Brian A. Jacob. 2011. “The Impact of No Child Left Behind on Student Achievement.”Journal of Policy Analysis and Management 30 (3): 418–46.
Doyle, Michael W. 1986. “Liberalism and World Politics.” American Political Science Review 80 (4): 1151–69.
Eller, Warren, and Glen Krutz. 2009. “Policy Process, Scholarship, and the Road Ahead: An Introductionto the 2008 Policy Shootout!” Policy Studies Journal 37 (1): 1–4.
Gerring, John, and Strom C. Thacker. 2008. A Centripetal Theory of Democratic Governance. New York:Cambridge University Press.
Goertz, Margaret E. 1996. “State Education Policy in the 1990s.” In The State of the States, 3rd ed., ed. CarlE. Van Horn. Washington, DC: CQ Press, 179–208.
Gormley, William T., and Deborah Phillips. 2005. “The Effects of Universal Pre-K in Oklahoma: ResearchHighlights and Policy Implications.” Policy Studies Journal 33 (1): 65–82.
Hanushek, Eric A., and Alfred A. Lindseth. 2009. Schoolhouses, Courthouses, and Statehouses: Solving theFunding-Achievement Puzzle in America’s Public Schools. Princeton, NJ: Princeton University Press.
Haurin, Donald R., Toby L. Parcel, and R. Jean Haurin. 2002. “Does Homeownership Affect ChildOutcomes?” Real Estate Economics 30 (4): 635–66.
Henig, Jeffrey. 2004. Mayors in the Middle: Politics, Race, and Mayoral Control of Urban Schools. Princeton, NJ:Princeton University Press.
Hess, Frederick M. 1999. Spinning Wheels: The Politics of Urban School Reform. Washington, DC: BrookingsInstitution.
Hess, Frederick M., and David L. Leal. 1997. “Minority Teachers, Minority Students, and College Matricu-lation: A New Look at the Role-Modeling Hypothesis.” Policy Studies Journal 25 (2): 235–48.
Hicklin, Alisa, and Kenneth J. Meier. 2008. “Race, Structure, and State Governments: The Politics of HigherEducation Diversity.” Journal of Politics 70 (3): 851–60.
Howell, William G., ed. 2005. Besieged: School Boards and the Future of Education Politics. Washington, DC:Brookings Institution.
Jones, Bryan D., and Frank R. Baumgartner. 2012. “From There to Here: Punctuated Equilibrium to theGeneral Punctuation Thesis to a Theory of Government Information Processing.” Policy StudiesJournal 40 (1): 1–20.
Manna: Centralized Governance and Student Outcomes 701
Knott, Jack H., and A. Abigail Payne. 2004. “The Impact of State Governance Structures on Managementand Performance of Public Organizations: A Study of Higher Education Institutions.” Journal ofPolicy Analysis and Management 23 (1): 13–30.
Ladd, Helen F. 2012. “Presidential Address: Education and Poverty: Confronting the Evidence.” Journal ofPolicy Analysis and Management 31 (2): 203–27.
Lee, Jaekung, and Todd Reves. 2012. “Revisiting the Impact of NCLB High-Stakes School Accountability,Capacity, and Resources: State NAEP 1990–2009 Reading and Math Achievement Gaps and Trends.”Educational Evaluation and Policy Analysis 34 (2): 209–31.
Lewis, David E. 2003. Presidents and the Politics of Agency Design: Political Insulation of the United StatesGovernment Bureaucracy, 1946–1997. Stanford, CA: Stanford University Press.
———. 2007. “Testing Pendleton’s Premise: Do Political Appointees Make Worse Bureaucrats?” Journal ofPolitics 69 (4): 1073–88.
Lowry, Robert C. 2001. “Governmental Structure, Trustee Selection, and Public University Pricesand Spending: Multiple Means to Similar Ends.” American Journal of Political Science 45 (4): 845–61.
Lynn, Laurence E., Jr. Carolyn J. Heinrich, and Carolyn J. Hill, eds. 2001. Improving Governance: A New Logicfor Empirical Research. Washington, DC: Georgetown University Press.
Manna, Paul, and Patrick McGuinn, eds. 2013. Education Governance for the Twenty-First Century: Overcom-ing the Structural Barriers to School Reform. Washington, DC: Brookings Institution, with the ThomasB. Fordham Institute and the Center for American Progress.
Marschall, Melissa, and Anirudh Ruhil. 2007. “Substantive Symbols: The Attitudinal Dimensionof Black Political Incorporation in Local Government.” American Journal of Political Science 51 (1):17–33.
Masters, Nicholas A., Robert H. Salisbury, and Thomas H. Eliot. 1964. State Politics and the Public Schools:An Exploratory Analysis. New York: Alfred A. Knopf.
McGinnis, Michael D., ed. 1999. Polycentric Governance and Development: Readings from the Workshop inPolitical Theory and Policy Analysis. Ann Arbor, MI: University of Michigan Press.
Meier, Kenneth J., and Laurence J. O’Toole. 2006. Bureaucracy in a Democratic State: A Governance Perspec-tive. Baltimore, MD: Johns Hopkins University Press.
Milward, H. Brinton, and Keith G. Provan. 1998. “Principles for Controlling Agents: The Political Economyof Network Structure.” Journal of Public Administration Research and Theory 8 (2): 203–21.
NASBE Study Group on Education Governance. 1996. A Motion to Reconsider: Education Governance at aCrossroads. Alexandria, VA: National Association of State Boards of Education.
National Association of State Boards of Education. 2012. Governance Models Summary. Washington, DC:Author.
Nicholson-Crotty, Jill, and Kenneth J. Meier. 2003. “Politics, Structure, and Public Policy: The Case ofHigher Education.” Educational Policy 17 (1): 80–97.
Ostrom, Elinor. 1986. “An Agenda for the Study of Institutions.” Public Choice 48 (1): 3–25.
Ostrom, Vincent. 1999. “Artisanship and Artifact.” In Polycentric Governance and Development: Readingsfrom the Workshop in Political Theory and Policy Analysis, ed. Michael D. McGinnis. Ann Arbor:University of Michigan Press, 377–93.
Peterson, Paul E. 1995. The Price of Federalism. Washington, DC: Brookings Institution.
Pressman, Jeffrey L., and Aaron Wildavsky. 1984. Implementation, 3rd ed. Berkeley, CA: University ofCalifornia Press.
Provan, Keith G., Kun Huang, and H. Brinton Milward. 2009. “The Evolution of Structural Embeddednessand Organizational Social Outcomes in a Centrally Governed Health and Human ServicesNetwork.” Journal of Public Administration Research and Theory 19 (4): 873–93.
Rosenthal, Alan. 1998. The Decline of Representative Democracy: Process, Participation, and Power in StateLegislatures. Washington, DC: CQ Press.
Russett, Bruce. 1994. Grasping the Democratic Peace: Principles for a Post-Cold War World. Princeton, NJ:Princeton University Press.
702 Policy Studies Journal, 41:4
Salmore, Stephen A., and Barbara G. Salmore. 1996. “The Transformation of State Electoral Politics.” In TheState of the States, 3rd ed., ed. Carl E. Van Horn. Washington, DC: CQ Press, 51–76.
Shober, Arnold F. 2010. Splintered Accountability: State Governance and Education Reform. Albany, NY: SUNYPress.
Soss, Joe, Sanford F. Schram, Thomas P. Vartanian, and Erin O’Brien. 2001. “Setting the Terms of Relief:Explaining State Policy Choices in the Devolution Revolution.” American Journal of Political Science45 (2): 378–95.
Strang, David. 1987. “The Administrative Transformation of American Education: School District Consoli-dation, 1938–1980.” Administrative Science Quarterly 32 (3): 352–66.
Tiebout, Charles M. 1956. “A Pure Theory of Local Expenditures.” Journal of Political Economy 64 (5):416–24.
Treisman, Daniel. 2007. The Architecture of Government: Rethinking Political Centralization. New York:Cambridge University Press.
Tweedie, Jack, Dennis D. Riley, John E. Chubb, and Terry M. Moe. 1990. “Should Market Forces ControlEducational Decision Making?” American Political Science Review 84 (2): 549–67.
U.S. Department of Education. 2007. Status and Trends in the Education of Racial and Ethnic Minorities.Washington, DC: Author.
———. 2011. Digest of Education Statistics, 2010. Washington, DC: Author.
Wattenberg, Martin P., Ian McAllister, and Anthony Salvanto. 2000. “How Voting Is Like Taking an SATTest: An Analysis of American Voter Rolloff.” American Politics Research 28 (2): 234–50.
Wayne, Stephen J. 2005. “Presidential Elections and American Democracy.” In The Executive Branch, eds.Joel D. Aberbach and Mark A. Peterson. New York: Oxford University Press, 103–34.
Wilson, James Q. 1989. Bureaucracy: What Government Agencies Do and Why They Do It. New York: BasicBooks.
Manna: Centralized Governance and Student Outcomes 703
Appendix: Regression Tables
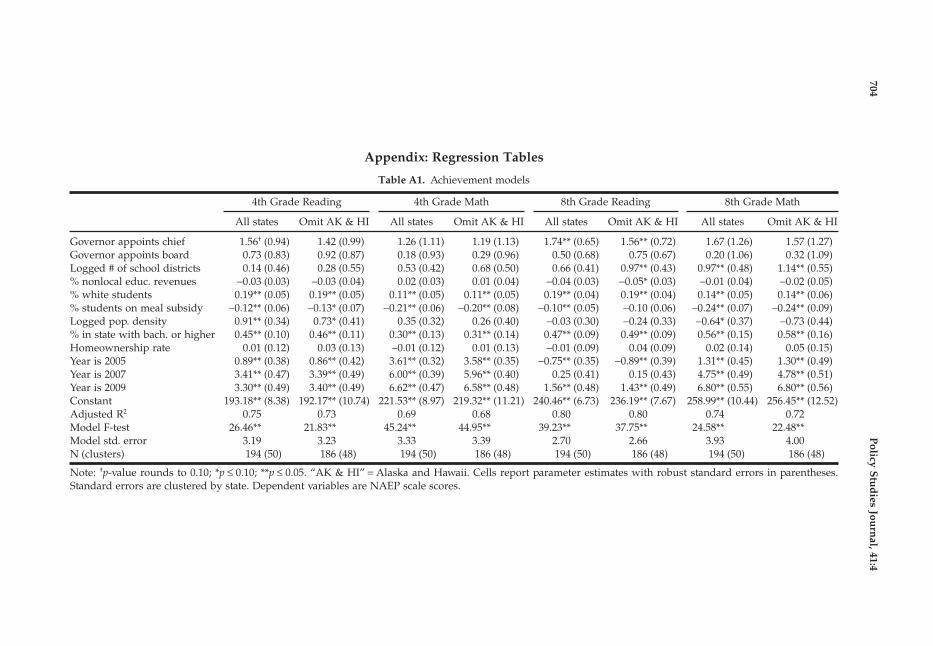
Table A1. Achievement models
4th Grade Reading 4th Grade Math 8th Grade Reading 8th Grade Math
All states Omit AK & HI All states Omit AK & HI All states Omit AK & HI All states Omit AK & HI
Governor appoints chief 1.56† (0.94) 1.42 (0.99) 1.26 (1.11) 1.19 (1.13) 1.74** (0.65) 1.56** (0.72) 1.67 (1.26) 1.57 (1.27)Governor appoints board 0.73 (0.83) 0.92 (0.87) 0.18 (0.93) 0.29 (0.96) 0.50 (0.68) 0.75 (0.67) 0.20 (1.06) 0.32 (1.09)Logged # of school districts 0.14 (0.46) 0.28 (0.55) 0.53 (0.42) 0.68 (0.50) 0.66 (0.41) 0.97** (0.43) 0.97** (0.48) 1.14** (0.55)% nonlocal educ. revenues −0.03 (0.03) −0.03 (0.04) 0.02 (0.03) 0.01 (0.04) −0.04 (0.03) −0.05* (0.03) −0.01 (0.04) −0.02 (0.05)% white students 0.19** (0.05) 0.19** (0.05) 0.11** (0.05) 0.11** (0.05) 0.19** (0.04) 0.19** (0.04) 0.14** (0.05) 0.14** (0.06)% students on meal subsidy −0.12** (0.06) −0.13* (0.07) −0.21** (0.06) −0.20** (0.08) −0.10** (0.05) −0.10 (0.06) −0.24** (0.07) −0.24** (0.09)Logged pop. density 0.91** (0.34) 0.73* (0.41) 0.35 (0.32) 0.26 (0.40) −0.03 (0.30) −0.24 (0.33) −0.64* (0.37) −0.73 (0.44)% in state with bach. or higher 0.45** (0.10) 0.46** (0.11) 0.30** (0.13) 0.31** (0.14) 0.47** (0.09) 0.49** (0.09) 0.56** (0.15) 0.58** (0.16)Homeownership rate 0.01 (0.12) 0.03 (0.13) −0.01 (0.12) 0.01 (0.13) −0.01 (0.09) 0.04 (0.09) 0.02 (0.14) 0.05 (0.15)Year is 2005 0.89** (0.38) 0.86** (0.42) 3.61** (0.32) 3.58** (0.35) −0.75** (0.35) −0.89** (0.39) 1.31** (0.45) 1.30** (0.49)Year is 2007 3.41** (0.47) 3.39** (0.49) 6.00** (0.39) 5.96** (0.40) 0.25 (0.41) 0.15 (0.43) 4.75** (0.49) 4.78** (0.51)Year is 2009 3.30** (0.49) 3.40** (0.49) 6.62** (0.47) 6.58** (0.48) 1.56** (0.48) 1.43** (0.49) 6.80** (0.55) 6.80** (0.56)Constant 193.18** (8.38) 192.17** (10.74) 221.53** (8.97) 219.32** (11.21) 240.46** (6.73) 236.19** (7.67) 258.99** (10.44) 256.45** (12.52)Adjusted R2 0.75 0.73 0.69 0.68 0.80 0.80 0.74 0.72Model F-test 26.46** 21.83** 45.24** 44.95** 39.23** 37.75** 24.58** 22.48**Model std. error 3.19 3.23 3.33 3.39 2.70 2.66 3.93 4.00N (clusters) 194 (50) 186 (48) 194 (50) 186 (48) 194 (50) 186 (48) 194 (50) 186 (48)
Note: †p-value rounds to 0.10; *p ≤ 0.10; **p ≤ 0.05. “AK & HI” = Alaska and Hawaii. Cells report parameter estimates with robust standard errors in parentheses.Standard errors are clustered by state. Dependent variables are NAEP scale scores.
704P
olicyS
tud
iesJou
rnal,41:4
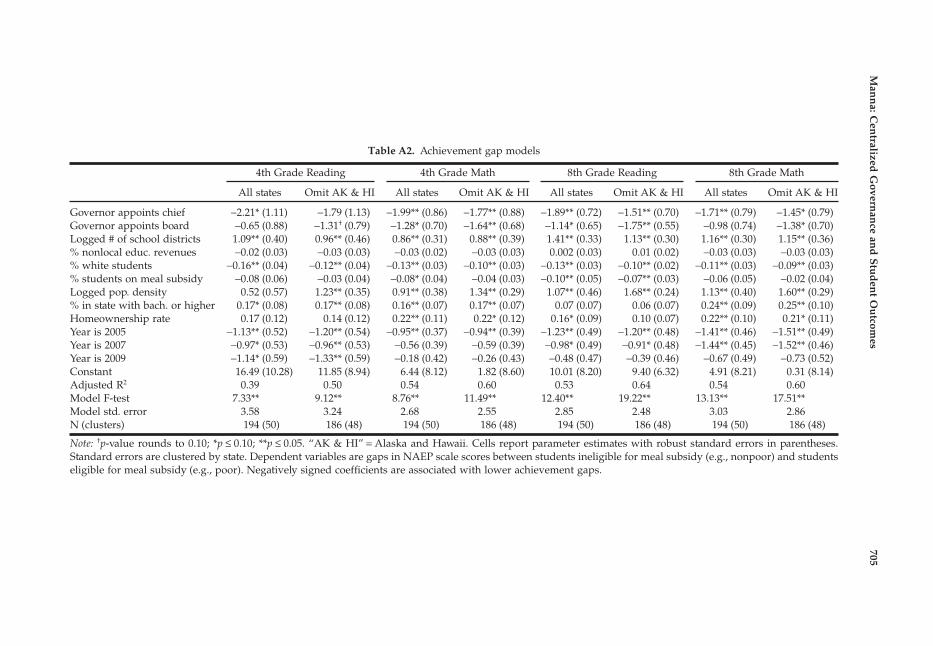
Table A2. Achievement gap models
4th Grade Reading 4th Grade Math 8th Grade Reading 8th Grade Math
All states Omit AK & HI All states Omit AK & HI All states Omit AK & HI All states Omit AK & HI
Governor appoints chief −2.21* (1.11) −1.79 (1.13) −1.99** (0.86) −1.77** (0.88) −1.89** (0.72) −1.51** (0.70) −1.71** (0.79) −1.45* (0.79)Governor appoints board −0.65 (0.88) −1.31† (0.79) −1.28* (0.70) −1.64** (0.68) −1.14* (0.65) −1.75** (0.55) −0.98 (0.74) −1.38* (0.70)Logged # of school districts 1.09** (0.40) 0.96** (0.46) 0.86** (0.31) 0.88** (0.39) 1.41** (0.33) 1.13** (0.30) 1.16** (0.30) 1.15** (0.36)% nonlocal educ. revenues −0.02 (0.03) −0.03 (0.03) −0.03 (0.02) −0.03 (0.03) 0.002 (0.03) 0.01 (0.02) −0.03 (0.03) −0.03 (0.03)% white students −0.16** (0.04) −0.12** (0.04) −0.13** (0.03) −0.10** (0.03) −0.13** (0.03) −0.10** (0.02) −0.11** (0.03) −0.09** (0.03)% students on meal subsidy −0.08 (0.06) −0.03 (0.04) −0.08* (0.04) −0.04 (0.03) −0.10** (0.05) −0.07** (0.03) −0.06 (0.05) −0.02 (0.04)Logged pop. density 0.52 (0.57) 1.23** (0.35) 0.91** (0.38) 1.34** (0.29) 1.07** (0.46) 1.68** (0.24) 1.13** (0.40) 1.60** (0.29)% in state with bach. or higher 0.17* (0.08) 0.17** (0.08) 0.16** (0.07) 0.17** (0.07) 0.07 (0.07) 0.06 (0.07) 0.24** (0.09) 0.25** (0.10)Homeownership rate 0.17 (0.12) 0.14 (0.12) 0.22** (0.11) 0.22* (0.12) 0.16* (0.09) 0.10 (0.07) 0.22** (0.10) 0.21* (0.11)Year is 2005 −1.13** (0.52) −1.20** (0.54) −0.95** (0.37) −0.94** (0.39) −1.23** (0.49) −1.20** (0.48) −1.41** (0.46) −1.51** (0.49)Year is 2007 −0.97* (0.53) −0.96** (0.53) −0.56 (0.39) −0.59 (0.39) −0.98* (0.49) −0.91* (0.48) −1.44** (0.45) −1.52** (0.46)Year is 2009 −1.14* (0.59) −1.33** (0.59) −0.18 (0.42) −0.26 (0.43) −0.48 (0.47) −0.39 (0.46) −0.67 (0.49) −0.73 (0.52)Constant 16.49 (10.28) 11.85 (8.94) 6.44 (8.12) 1.82 (8.60) 10.01 (8.20) 9.40 (6.32) 4.91 (8.21) 0.31 (8.14)Adjusted R2 0.39 0.50 0.54 0.60 0.53 0.64 0.54 0.60Model F-test 7.33** 9.12** 8.76** 11.49** 12.40** 19.22** 13.13** 17.51**Model std. error 3.58 3.24 2.68 2.55 2.85 2.48 3.03 2.86N (clusters) 194 (50) 186 (48) 194 (50) 186 (48) 194 (50) 186 (48) 194 (50) 186 (48)
Note: †p-value rounds to 0.10; *p ≤ 0.10; **p ≤ 0.05. “AK & HI” = Alaska and Hawaii. Cells report parameter estimates with robust standard errors in parentheses.Standard errors are clustered by state. Dependent variables are gaps in NAEP scale scores between students ineligible for meal subsidy (e.g., nonpoor) and studentseligible for meal subsidy (e.g., poor). Negatively signed coefficients are associated with lower achievement gaps.
Man
na:C
entralized
Govern
ance
and
Stu
den
tO
utcom
es705