drm centre ... briefness when referring to a combination of parameters in the rest of this document....
TRANSCRIPT

MACINTOSH HD:USERS:NIGELLAFLIN:DROPBOX:DIGITAL RADIO:DRM:BUG:ITU DOCS:R03-WP6E-C-0175!!MSW-E.DOC 30.06.2012 30.06.2012
Received: 16 March 2005
Subject: Question ITU-R 60/6
DRM
DIGITAL RADIO MONDIALE DRM DAYTIME MW TESTS
Abstract
This report presents the study on the performance and related propagation aspects of the DRM system developed after an extensive measurement campaign in the coverage area of an experimental network installed in Madrid (Spain). The study analyses the quality of service based on a set of static and mobile measurements done during the year 2004. The conclusions given in this report focus on received audio quality statistics, minimum field strength thresholds and the evaluation of available ITU-R recommendations in order to predict the expected field strength coverage from a DRM transmitter.
INTERNATIONAL TELECOMMUNICATION UNION
RADIOCOMMUNICATION STUDY GROUPS
Document 6E/175-E 18 March 2005 English only

- 2 - 6E/175-E
MACINTOSH HD:USERS:NIGELLAFLIN:DROPBOX:DIGITAL RADIO:DRM:BUG:ITU DOCS:R03-WP6E-C-0175!!MSW-E.DOC 30.06.2012 30.06.2012
CONTENTS Page
1 Motivation ........................................................................................................................ ........... 3
2 Objectives ......................................................................................................................... ........... 3
3 Experimental network ...................................................................................................... ........... 3
4 Measurement system and methodology ........................................................................... ........... 5 4.1 Measurement system ...................................................................................... ........... 5 4.2 Measurement methodology ............................................................................ ........... 7
5 Fixed reception ................................................................................................................. ........... 8 5.1 Global results: obtained service of quality ..................................................... ........... 9 5.2 Reception environment influence ................................................................... ......... 11 5.3 Critical factors for DRM MW reception ........................................................ ......... 12
6 Received field strength analysis ....................................................................................... ......... 13 6.1 Measurement data ........................................................................................... ......... 13 6.2 DRM coverage limits: field strength threshold values for static reception .... ......... 15
7 DRM medium wave prediction vs. measurement analysis .............................................. ......... 18 7.1 MW predictions using Rec. ITU-R P.368-7 ................................................... ......... 18 7.2 Conductivity and permittivity available data ................................................. ......... 21 7.3 Predicted and measured values using the mixed path (Millington) method ... ......... 25 7.4 Alternatives to Millington method ................................................................. ......... 30 7.5 Influence of terrain irregularities and reception environment ........................ ......... 33
8 Mobile reception .............................................................................................................. ......... 35
9 Conclusions ...................................................................................................................... ......... 39
10 Acknowledgements .......................................................................................................... ......... 40
11 References ........................................................................................................................ ......... 41

- 3 - 6E/175-E
MACINTOSH HD:USERS:NIGELLAFLIN:DROPBOX:DIGITAL RADIO:DRM:BUG:ITU DOCS:R03-WP6E-C-0175!!MSW-E.DOC 30.06.2012 30.06.2012
1 Motivation
During the last few years several studies have been carried out in some European countries in order to evaluate the Digital Radio Mondiale (DRM) [1] performance in the medium wave bands. Many of the available results have been based on laboratory measurements and measurement campaigns that did not provide the amount of data that is necessary to analyse all the aspects of DRM MW reception and coverage. This document is the result of several studies carried out after an extensive DRM measurement campaign in Madrid and surrounding regions of central Spain. This measurement campaign was a collaborative effort between the Spanish broadcaster RNE (Radio Nacional de España, S.A.), the transmitter manufacturer and distributor VIMESA, and the Signal Processing and Radiocommunications Research Group (TSR) at the University of the Basque Country. This document and the studies described have been developed by the TSR group. The aim of the participants in this project has been to search for more accurate parameter values in order to characterize the performance and future planning of DRM commercial MW networks.
2 Objectives
The main objective of this study has been the evaluation of the performance of Digital Radio Mondiale (DRM) system using the medium wave band. This objective has been based on an extensive measurement campaign that was planned and carried out in the central part of Spain around the city of Madrid.
This general objective has been divided into several “operational” targets: – study the overall audio quality over the coverage area of a DRM transmitter operating at
a lower power compared to the analogue AM transmitter it replaces; – estimate minimum field strength requirements in different reception environments based on
actual field measurements; – analyse the influence of the environment on static reception quality; – study the field strength distribution over the coverage area in order to compare the
measured values with the output of the currently used prediction method. The reference method should be the Recommendation ITU-R P.368-7 [2];
– study mobile reception within the expected coverage area and identify critical disturbances.
3 Experimental network
The DRM signal was broadcast from the transmitter station that RNE (Radio Nacional de España) uses in Arganda del Rey. This town is located at a distance 25 kilometres in the south-east of Madrid. This site is currently used to broadcast RNE’s regular analogue MW and SW signals. A summary of the features of this transmitting site can be found in Table 1 and Figure 1.

- 4 - 6E/175-E
MACINTOSH HD:USERS:NIGELLAFLIN:DROPBOX:DIGITAL RADIO:DRM:BUG:ITU DOCS:R03-WP6E-C-0175!!MSW-E.DOC 30.06.2012 30.06.2012
TABLE 1
Transmitting centre characteristics
Transmission centre Arganda del Rey (Madrid)
Broadcaster Radio Nacional de España (RNE)
Transmission centre coordinates 3º 30’ W ; 40º 19’ N
Frequency 1 359 kHz
Bandwidth 9 kHz
Radiating system Vertical Dipole
Transmission scheduling 8:30-14:00
FIGURE 1 Transmitting centre location
36 Km
Arganda Transmitting Centre
The radiating infrastructure is based on a vertical monopole, with a maximum gain of approximately 1 dB. The transmitter installed was the model TRAM10 from Telefunken Sendersysteme. This equipment was installed and adjusted to fulfil the Recommendation ITU-R BS.1615 [3] radiated spectrum mask requirements. The DRM output power was 4 kW.
The DRM standard [1] provides several configurable transmission parameters that allow for many different DRM transmission modes with adjustable robustness against noise, multipath and interference. The more robust the mode, the lower the achievable subjective audio quality (due to a lower available useful bit rate). In order to evaluate the influence of each parameter, the modes in Table 2 were chosen for the tests.

- 5 - 6E/175-E
MACINTOSH HD:USERS:NIGELLAFLIN:DROPBOX:DIGITAL RADIO:DRM:BUG:ITU DOCS:R03-WP6E-C-0175!!MSW-E.DOC 30.06.2012 30.06.2012
TABLE 2
Tested DRM modes
Name in Document OFDM MSC SDC Code rate Interleaver Bit rate:
kbps
A/64/16/0.78/S A 64 QAM 16 QAM 0.78 Short (S) 30.8
A/64/16/0.6/S A 64 QAM 16 QAM 0.60 Short (S) 23.5
B/64/16/0.5/L B 64 QAM 16 QAM 0.50 Long (L) 15.2
A/16/4/0.5/S A 16 QAM 4 QAM 0.50 Short (S) 13.0
The OFDM configurations A and B of the DRM standard are the only ones that fulfil the ITU constraints of medium-wave signal bandwidth in Spain [4][5]. A broader explanation of the number of carriers, guard interval, protection and interleaving algorithms and Main Service Channel (MSC) and Service Description Channel (SDC) modulations is out of the scope of this document and can be found in detail in [1]. The first column of Table 2 is a reference code included for the sake of briefness when referring to a combination of parameters in the rest of this document. The DRM modes in Table 2 are ordered in decreasing robustness, as can be deduced from the corresponding useful bit rates which decrease from the top to the bottom of the table.
4 Measurement system and methodology
4.1 Measurement system The measurement vehicle was equipped as shown in Figure 2, where three sections are distinguished: The acquisition and distribution system, the measurement system and the control system.

- 6 - 6E/175-E
MACINTOSH HD:USERS:NIGELLAFLIN:DROPBOX:DIGITAL RADIO:DRM:BUG:ITU DOCS:R03-WP6E-C-0175!!MSW-E.DOC 30.06.2012 30.06.2012
FIGURE 2
Measurement system
10BaseTAORSoundCardDRM Professional Rx
Wheel Trigger
Vector Signal
Analyzer
FieldMeterGPS
Antenna/ Distribution MeasurementEquipment Control
GPRSAntenna
Atennuator
Splitter
10BaseTAORSoundCardDRM Professional Rx
Wheel Trigger
Vector Signal
Analyzer
FieldMeterGPS
Antenna/ Distribution MeasurementEquipment Control
GPRSAntenna
Atennuator
Splitter
The acquisition system was composed of the fully characterized short monopole active antenna R&S HE010 mounted on top of the van with a specific ground plane. The DRM monitoring receiver was composed of an AOR7030 analogue front-end modified to be capable of tuning the received DRM signal and down-convert it to a 12 kHz IF channel. An SB Extigy sound card sampled this IF signal into a PC which ran the professional Windows-based Fraunhofer Software Radio DRM demodulator. The second measurement block was made up of a Vector Signal Analyser, which provided RF spectrum captures, and a Field Meter to measure the RF power level field strength in the DRM signal bandwidth.
The last section was based on a laptop computer, running a control software over a GNU/Linux platform which had the tasks of configuring and controlling the rest of the equipment as well as calculating some on-the-run statistics. A GPS receiver provided ancillary data such as information regarding time and vehicle position. A trigger system which was generated every wheel turn helped in synchronising the mobile measurements in relation to the wavelength.
The control section was completed with a GSM remote control system for the DRM modulator located in Arganda. It allowed the quick on-board changing of the DRM transmission mode via GSM data calls between two identical GSM modules, one located in the mobile measurement unit, and the other one on the transmitter site. This remote control system for the modulator allows for the analysis of all proposed DRM modes with the same propagation conditions and at the same reception location.
- 7 - 6E/175-E
MACINTOSH HD:USERS:NIGELLAFLIN:DROPBOX:DIGITAL RADIO:DRM:BUG:ITU DOCS:R03-WP6E-C-0175!!MSW-E.DOC 30.06.2012 30.06.2012
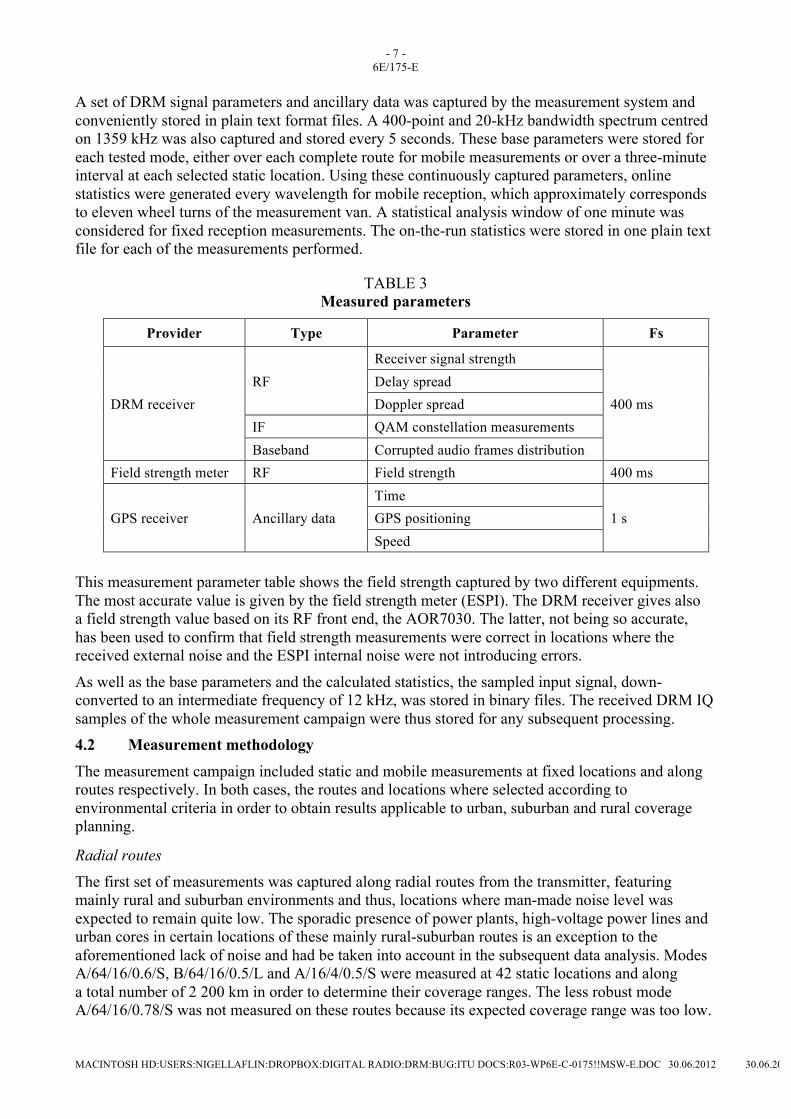
A set of DRM signal parameters and ancillary data was captured by the measurement system and conveniently stored in plain text format files. A 400-point and 20-kHz bandwidth spectrum centred on 1359 kHz was also captured and stored every 5 seconds. These base parameters were stored for each tested mode, either over each complete route for mobile measurements or over a three-minute interval at each selected static location. Using these continuously captured parameters, online statistics were generated every wavelength for mobile reception, which approximately corresponds to eleven wheel turns of the measurement van. A statistical analysis window of one minute was considered for fixed reception measurements. The on-the-run statistics were stored in one plain text file for each of the measurements performed.
TABLE 3 Measured parameters
Provider Type Parameter Fs
DRM receiver RF
Receiver signal strength
400 ms Delay spread Doppler spread
IF QAM constellation measurements Baseband Corrupted audio frames distribution
Field strength meter RF Field strength 400 ms
GPS receiver Ancillary data Time
1 s GPS positioning Speed
This measurement parameter table shows the field strength captured by two different equipments. The most accurate value is given by the field strength meter (ESPI). The DRM receiver gives also a field strength value based on its RF front end, the AOR7030. The latter, not being so accurate, has been used to confirm that field strength measurements were correct in locations where the received external noise and the ESPI internal noise were not introducing errors.
As well as the base parameters and the calculated statistics, the sampled input signal, down-converted to an intermediate frequency of 12 kHz, was stored in binary files. The received DRM IQ samples of the whole measurement campaign were thus stored for any subsequent processing. 4.2 Measurement methodology
The measurement campaign included static and mobile measurements at fixed locations and along routes respectively. In both cases, the routes and locations where selected according to environmental criteria in order to obtain results applicable to urban, suburban and rural coverage planning.
Radial routes
The first set of measurements was captured along radial routes from the transmitter, featuring mainly rural and suburban environments and thus, locations where man-made noise level was expected to remain quite low. The sporadic presence of power plants, high-voltage power lines and urban cores in certain locations of these mainly rural-suburban routes is an exception to the aforementioned lack of noise and had be taken into account in the subsequent data analysis. Modes A/64/16/0.6/S, B/64/16/0.5/L and A/16/4/0.5/S were measured at 42 static locations and along a total number of 2 200 km in order to determine their coverage ranges. The less robust mode A/64/16/0.78/S was not measured on these routes because its expected coverage range was too low.
- 8 - 6E/175-E
MACINTOSH HD:USERS:NIGELLAFLIN:DROPBOX:DIGITAL RADIO:DRM:BUG:ITU DOCS:R03-WP6E-C-0175!!MSW-E.DOC 30.06.2012 30.06.2012
Madrid routes
The second set of measurements was planned in the urban environment of Madrid. The routes and static locations were selected to have all kind of data, from wide avenues to the densest urban environments in Madrid. Distance from the transmitter and the direction of the route (radial and circular) with respect to the transmitter were also taken into account. Modes A/64/16/0.6/S, B/64/16/0.5/L and A/16/4/0.5/S were tested in 19 static locations, along 470 km overall. Mode A/64/16/0.78/S, which was not initially considered, was also measured along these routes and points in order to confirm that a code rate weaker than 0.6 (mode A/64/16/0.6/S) could not guarantee service availability either for static or mobile reception.
Urban, suburban and rural environment definition
This measurement campaign was carried out in different environments. These areas were classified into three types (rural, suburban and urban) according to predefined criteria at the time of measurement planning. The environment classification criteria are: Rural: Areas with scarce isolated buildings, open fields.
Suburban: Small towns; residential areas with low building density and buildings not higher than two stories; wide roads or streets between buildings.
Urban: Big to medium sized cities, residential areas with high density of buildings; areas where buildings are higher than two stories and close distances between them.
As mentioned in previous paragraphs, radial routes were typically chosen for rural and suburban environments whereas Madrid routes are urban ones.
5 Fixed reception This section describes the received audio quality results obtained in urban-suburban and rural locations for fixed reception. These tests have been carried out using several audio samples fed to the DRM audio coder so that the received objective quality was analysed in terms of correctly decoded audio frames. Specifically, the objective received audio quality has been measured using the parameter AudioQ which is defined:
100(%) ⋅=framesaudioreceivedofnumberTotal
errorswithoutreceivedframesaudioofNumberAudioQ (1)
This parameter was monitored over a three minute interval and it showed itself to be very stable during the measurement interval. This agrees with the stability expected from the ground-wave DRM signal.
This parameter gives the ratio of correct vs. incorrect audio frames after demodulation and error correction at the receiver. Given this parameter, the threshold of 98 % was considered to be the lower limit that ensures an audio quality free of audible errors for an average listener. Such threshold is a conservative value according to the subjective perception of the engineers that carried out the tests. The fact that the personnel can be considered as “trained listeners” reinforces the previous statement of good audio quality for an average listener.
The 98 % is equivalent to 1.2 seconds of accumulated audio dropouts in an interval of one minute. This threshold has been taken as the reference value for objective audio quality used in different tests within the DRM consortium.

- 9 - 6E/175-E
MACINTOSH HD:USERS:NIGELLAFLIN:DROPBOX:DIGITAL RADIO:DRM:BUG:ITU DOCS:R03-WP6E-C-0175!!MSW-E.DOC 30.06.2012 30.06.2012
5.1 Global results: obtained service of quality
The audio quality measured in static locations over the whole measurement campaign is shown in this subsection, as an indication of the general performance of the DRM system and the transmitting infrastructure. Some data parsing was done in order to identify fixed locations where measurements would not be representative of standard reception conditions, i.e., points where AM reception would not have been possible. These “special” locations would have an impact onto the system performance statistics that would lead to inaccurate conclusions. The description of this data parsing follows. Several rural and suburban measurement points were discarded: – one point was discarded due to the noise caused by a very close power transformation plant; – in another location, 120 km away from the transmitter site, an AM adjacent channel
interference at 1341 kHz had a much higher level than the DRM measured signal (See Figure 3);
– eight distant locations (more than 160 km away from the transmitter) were also eliminated due to the low received signal.
FIGURE 3 Lower adjacent channel interference. (Figure shows only the side band
of the analogue AM modulated signal)
-125
-120
-115
-110
-105
-100
-95
-90
-85
-80
1349 1351 1352 1354 1355 1357 1358 1360 1361 1363 1364 1366 1367 1369
Frecuency (kHz)
Spec
tral
Den
sity
(dB
m)
Regarding the urban environment, one measurement location was rejected also due to the very low field strength received. After this filtering, the results shown in Table 4 were obtained. They are shown for all DRM modes tested during this measurement campaign. A very good service quality is achieved for all modes in most locations.
- 10 - 6E/175-E
MACINTOSH HD:USERS:NIGELLAFLIN:DROPBOX:DIGITAL RADIO:DRM:BUG:ITU DOCS:R03-WP6E-C-0175!!MSW-E.DOC 30.06.2012 30.06.2012
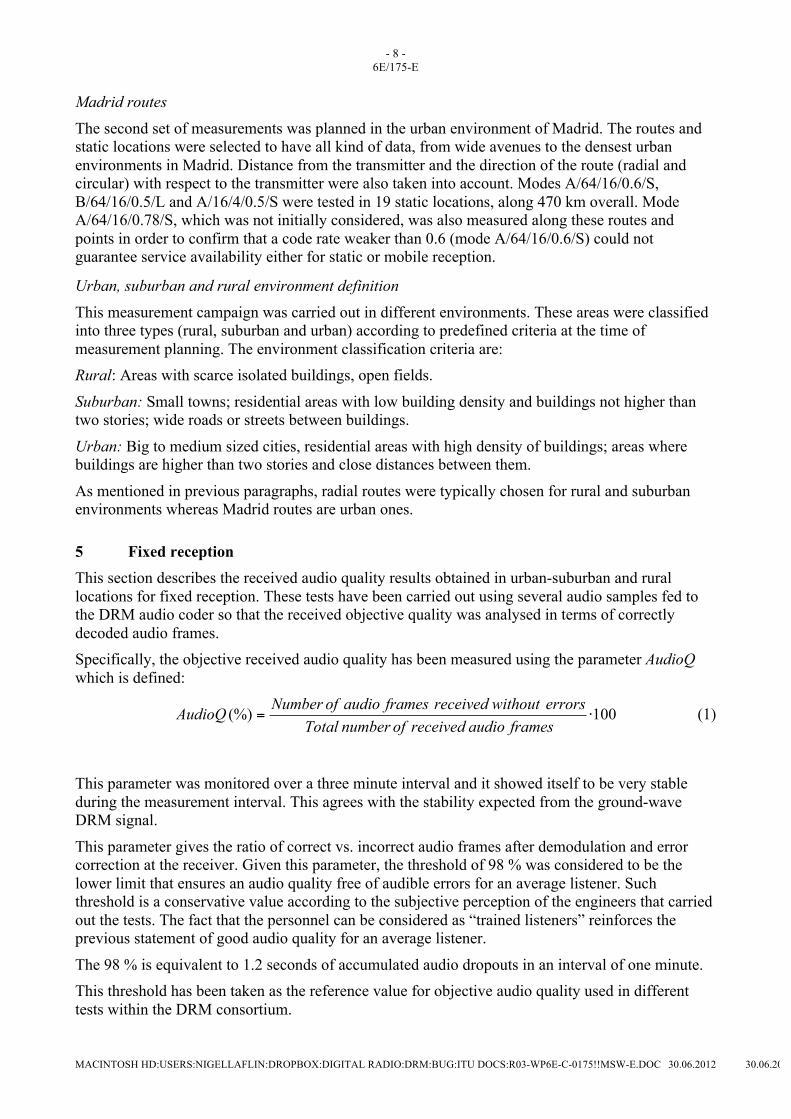
TABLE 4 Audio quality overall results
A/64/16/0.78/S A/64/16/0.6/S B/64/16/0.5/L A/16/4/0.5/S
Locations with audio quality > 98 % 15 48 49 50 Total number of tested locations 18 50 50 50 % of points with good reception 83.33 96.00 98.00 100
DRM Modes: A/0.78/S/MSC 64/SDC 16 – 30.8 kbps
A/0.60/S/MSC 64/SDC 16 – 23.5 kbps
B/0.5/L/MSC 64/SDC 16 – 15.2 kbps
A/0.5/S/MSC 16/SDC 4 – 13.0 kbps
As it can be observed in Table 4 the reception was unsuccessful in 6 locations. The receiving conditions at those locations were carefully studied and the cause of the failure was identified. Table 5 shows the encountered problems.
TABLE 5 Failure causes
Location Mode Failure cause
Madrid Point 2 Distance to Tx 20 km Dense Urban
A/64/16/0.78/S Not enough signal level. Objective audio quality = 97.4 %
Madrid Point 7 Distance to Tx 20 km Dense Urban
A/64/16/0.78/S Very low signal level and noise. Objective audio quality = 20 %
Madrid Point 16 Distance to Tx 20 km Dense Urban
A/64/16/0.78/S Noise and not enough signal level. Objective audio quality = 96.9 %
Madrid Point 7 Distance to Tx 20 km Dense Urban
A/64/16/0.6/S Not enough signal level and noise. Objective audio quality = 93.7 %
Radial 1 Point 6 Distance to Tx 128 km Rural
A/64/16/0.6/S AM adjacent channel interference. Objective audio quality = 85.1%
Madrid Point 7 Distance to Tx 20 km Dense Urban
B/64/16/0.5/L Not enough signal level and noise. Objective audio quality = 96.8 %

- 11 - 6E/175-E
MACINTOSH HD:USERS:NIGELLAFLIN:DROPBOX:DIGITAL RADIO:DRM:BUG:ITU DOCS:R03-WP6E-C-0175!!MSW-E.DOC 30.06.2012 30.06.2012
The failure causes can be categorized as: – low received field strength (under threshold limit for the corresponding DRM mode); – high man-made-noise (C/N under the threshold limit); – high level AM adjacent channel interference (location out of the expected service area). In order to analyse and give statistically meaningful results, these ones were grouped under several criteria. The result of this further analysis is shown in the next subsection, 5.2. Reception environment influence.
5.2 Reception environment influence In order to evaluate the influence of the environment, only locations within a 100 kilometre radius from the transmitter were analysed. The DRM transmitter installed for this measurement campaign was configured to output 4 kW which is much lower (about 11 dB) than the lowest power used by any AM transmitter in the Madrid area (50 kW). This power reduction is based on the expected digital system performance. Locations further than the mentioned distance would not be part of the target area of the tested service. The actual service area with an adequate AM quality can be considered to reach locations at a distance of about 100 km around Madrid. The radius was calculated according to the simulations given by Recommendation ITU-R P.368-7 [2], assuming an analogue transmitter with 18 dB kW that uses a vertical monopole radiating system. After these service area restrictions, results were divided into three environment type categories: – measurement locations in rural areas; – measurement locations in suburban environments; – measurement locations in urban areas. With this classification in mind, the performance in suburban and rural environments was found to be the same, as all the locations within a 100 km radius from the transmitter showed that 100 % of the received audio frames were free of errors. Two categories are presented for the rural and suburban locations: – locations within a radius of 50 km from the transmitter site (11 test points); – locations at distance between 50 to 100 km (22 test points).
TABLE 6 Received static measurements in rural-suburban and urban environments. Static reception
(% = percentage of locations with audio quality ≥ 98 %)
A/64/16/0.78/S A/64/16/0.6/S B/64/16/0.5/L A/16/4/0.5/S
Rural – Suburban ≤ 50 km n.a. 11/11 11/11 11/11
Rural – Suburban ≤ 100 km n.a 22/22 22/22 22/22 Urban 15/18 17/18 17/18 17/18
% Rural – Suburban ≤ 50 km n.a 100 100 100
% Rural – Suburban ≤ 100 km n.a 100 100 100 % Urban 83.33 94.44 94.44 100

- 12 - 6E/175-E
MACINTOSH HD:USERS:NIGELLAFLIN:DROPBOX:DIGITAL RADIO:DRM:BUG:ITU DOCS:R03-WP6E-C-0175!!MSW-E.DOC 30.06.2012 30.06.2012
The results in Table 6 show a perfect audio quality received within a radius of 50 km from the transmitter. Considering a 100 km radius, again a 100 % of locations show good quality values for the tested DRM modes. In these rural and suburban locations, 100 % of the audio frames are received without errors. Looking at urban reception, the analysed data show good reception behaviour in all locations except for one mode (modes A/64/16/0.6/S, B/64/16/0.5/L, A/16/4/0.5/S). Mode A/64/16/0.78/S failed in three urban locations due to a high level of man-made noise.
5.3 Critical factors for DRM MW reception Several factors have been found to affect the audio quality during this measurement campaign. According to experience gathered during these tests, two difficult receiving conditions have been identified: – Man made noise: The man made noise has been found (as it was expected) to be very high
in a dense urban environment. The environment with the highest number of difficult locations is the urban area of downtown Madrid. In this environment, the field strength attenuation due to buildings increases the problems caused by noise. Also, the power lines and power plants have been identified as critical noise sources for DRM reception. As a reference, reception failed at a distance of approximately 20 metres from the vertical plane of a high power line (see Figure 4). Further studies are necessary to determine the minimum distances to these noisy sources in order to have a good reception in areas where the received usable field strength is higher than the minimum thresholds stated by the ITU-R.
FIGURE 4
Effect of high power distribution lines on DRM reception

- 13 - 6E/175-E
MACINTOSH HD:USERS:NIGELLAFLIN:DROPBOX:DIGITAL RADIO:DRM:BUG:ITU DOCS:R03-WP6E-C-0175!!MSW-E.DOC 30.06.2012 30.06.2012
– Tunnels and Bridges. The received field strength inside short tunnels and under bridges presents a significant decrease if it is compared with the median value over the surrounding locations. This measurement campaign included mobile measurements that have shown dropouts in the received field strength as high as 20 dB when the vehicle undergoes a bridge (i.e. two roads crossing at different levels, pedestrian bridges, etc). This effect is well known in medium wave propagation and it is also suffered from by current analogue AM transmissions in this frequency range.
6 Received field strength analysis This section presents the field strength measurements and the analysis based upon this data. First, the measurement values are presented and afterwards, a comparison study between currently available prediction tools and models is given in order to identify possible deficiencies as well as to prepare future prediction tools to make them usable in DRM network planning within the medium wave (medium frequency) band.
6.1 Measurement data The field strength analysis has been performed using the captured data in rural and suburban environments. Urban measurements have not been considered for this analysis because the known prediction methods do not take into account the specific problems such as conductivity data, influence of buildings and other structures, etc. A reception environment classification was done prior to the measurement campaign at the planning stages of these trials. This classification was revised after the measurement campaign according to annotations and photographs made by the field personnel involved. Table 7 presents the list of measurement locations and the obtained values at each site. The distance from the transmitter to each reception location has also been included.
The field strength values shown correspond to the median of all field strength measurements collected within 3 minutes (400 ms update rate). Also, having tested several modes at each location, the measurement obtained for each mode is presented. The DRM mode parameter settings chosen for these trials should not affect the transmitted power so the possible field strength measurement uncertainties are even more reduced by using three different measurements of the received field strength. The values at each location are very similar irrespective of the DRM mode, just as expected.

- 14 - 6E/175-E
MACINTOSH HD:USERS:NIGELLAFLIN:DROPBOX:DIGITAL RADIO:DRM:BUG:ITU DOCS:R03-WP6E-C-0175!!MSW-E.DOC 30.06.2012 30.06.2012
TABLE 7 Measured field strength (Em) in rural and suburban locations
NOTE: Mode 1=A/64/16/0.6/S, Mode 2= B/64/16/0.5/L, Mode 3=A/16/4/0.5/S
Radial Location Distance Environment Em-Mode 1 Em- Mode 2 Em- Mode 3 Mean
1 1 13.97 Suburban 92.83 92.87 92.31 92.67 1 2 42.56 Rural 75.24 75.76 75.24 75.41 1 4 88.59 Rural 55.31 55.27 55.2 55.26 1 5 112.06 Rural 47.43 47.55 47.49 47.49 1 6 129.53 Rural 43.08 -- 43.15 43.12 1 7 140.9 Suburban 42.39 41.7 41.76 41.95
2 1 36.66 Suburban 71.48 71.48 71.42 71.46 2 2 66.54 Suburban 65 64.95 64.91 64.95 2 3 100.81 Rural 57.62 57.58 57.57 57.59 2 4 131.28 Suburban 52.3 52.2 52.2 52.23 2 5 149.26 Suburban 41.3 -- 43.99 42.65 2 6 170.11 Suburban 42.11 42.1 41.57 41.93 2 7 186.95 Suburban 39.23 39.29 39.3 39.27
3 1 10.34 Suburban 92.2 92.1 92.03 92.11 3 2 35.1 Rural 73.85 73.28 73.28 73.47 3 3 66.25 Rural 55.2 55.23 55.22 55.22 3 4 93.46 Suburban 52.54 52.55 52.75 52.61 3 5 103.06 Rural 48.18 48.36 48.03 48.19 3 6 134.88 Rural -- -- 43.14 43.14 3 7 143.14 Rural -- -- 40.41 40.41
4 1 9.15 Suburban 87.57 88.06 87.67 87.77 4 2 36.03 Suburban 76.9 77 76.8 76.9 4 3 73.64 Rural 57.36 57.38 57.45 57.4 4 4 100.4 Rural 42.41 42.45 42.29 42.38 4 5 117.5 Rural 50.44 50.69 50.46 50.53 4 6 132.27 Rural 45.23 45.36 45.34 45.31 4 7 146.09 Suburban 41.68 41.24 41.11 41.34 4 8 162.51 Rural 42.52 42.45 42.54 42.5 4 9 192.67 Suburban -- -- 41.42 41.42
5 1 49.51 Rural 61.82 61.74 61.68 61.75 5 2 69.55 Rural 61.83 61.79 61.4 61.67 5 3 72.6 Rural 50.43 50.48 51.36 50.76 5 4 111.39 Suburban 53.08 53.02 53.03 53.04 5 5 134.23 Rural 49.53 49.53 49.56 49.54 5 6 158.29 Rural 44.74 44.83 45.76 45.11 5 7 180.47 Suburban 43.67 43.68 43.68 43.68

- 15 - 6E/175-E
MACINTOSH HD:USERS:NIGELLAFLIN:DROPBOX:DIGITAL RADIO:DRM:BUG:ITU DOCS:R03-WP6E-C-0175!!MSW-E.DOC 30.06.2012 30.06.2012
6.2 DRM coverage limits: field strength threshold values for static reception
This subsection presents the results concerning the field strength threshold values that provide an error-free audio decoding for static reception. The results shown here are applicable on three conditions: – a correct reception is identified by the fact that 98 % of correct audio frames are received
out of the total received. This objective threshold leads to a subjective perception without noticeable artefacts and/or audio dropouts. This criterion is not exactly the same as the one used by the ITU-R in Recommendation ITU-R BS.1615 [3]. Consequently, the comparison made will help to provide orientation, although values correspond quite well;
– the environment where the receiver is located is rural or suburban according to the definitions given in former sections of this document, so the man-made noise is not a critical factor in such conditions;
– the key parameter that determines the minimum threshold is the combination of Code Rate and MSC-SDC carrier modulation schemes. Other parameters such as short/long interleaving and carrier separation (B or A OFDM modes) do not appear to have influence on the robustness of the signal. These assumptions are correct if the multipath and Doppler spreads are negligible. These conditions were fulfilled within the rural – suburban environments of this measurement campaign.
DRM Mode. OFDM Mode A, MSC 64 QAM, SDC 16 QAM, code rate 0.6. Interleaving short
According to the measurements on Figure 5, the first failure occurs at 44.8 dBµV/m. Nevertheless, there are several locations with lower values. If planning should be done for a high percentage of locations (i.e. 90-95) the threshold should be near 43-44 dB dBµV/m. This value is close to 43.2 dBµV/m recommended by Recommendation ITU-R BS.1615 [3].
TABLE 8
Minimum field strength estimation (1)
ITU-R value from Rec. (dBµV/m) Measured threshold (dBµV/m)
43.2 44-43

- 16 - 6E/175-E
MACINTOSH HD:USERS:NIGELLAFLIN:DROPBOX:DIGITAL RADIO:DRM:BUG:ITU DOCS:R03-WP6E-C-0175!!MSW-E.DOC 30.06.2012 30.06.2012
FIGURE 5
Received field strength vs. distance. Static measurements in rural and suburban locations. Mode A/64/16/0.6/S. Rec. ITU-R P.368-7 prediction is also depicted
30
36
42
48
54
60
66
72
78
84
90
96
0 20 40 60 80 100 120 140 160 180 200
Distance from the Transmitter (km)
Field
Stre
ngth
dBu
V/m
Locations with Audio Quality >= 98%
Rec. 368 Predicted Field Strength
Locations with Audio Quality < 98%
DRM Mode: OFDM Mode B, MSC 64 QAM, SDC 16 QAM, code rate 0.5. Interleaving long
According to the measurements on Figure 6, the first failure occurs at 43.7 dBµV/m and only one location under this threshold works properly. This value is higher that the 38.6 dBµV/m proposal done in Recommendation ITU-R BS.1615 [3]. It should be noted again that further tests are necessary to ensure the value proposed for this mode. The value given here is an estimation.
TABLE 9 Minimum field strength estimation (2)
ITU-R value from Rec. (dBµV/m) Measured threshold (dBµV/m)
38.6 43-42

- 17 - 6E/175-E
MACINTOSH HD:USERS:NIGELLAFLIN:DROPBOX:DIGITAL RADIO:DRM:BUG:ITU DOCS:R03-WP6E-C-0175!!MSW-E.DOC 30.06.2012 30.06.2012
FIGURE 6
Received field strength vs. distance. Static measurements in rural and suburban locations. Mode B/16/16/0.5/L. Rec. ITU-R P.368-7 prediction is also depicted
30
36
42
48
54
60
66
72
78
84
90
96
0 50 100 150 200 250 300
Distance from the Transmitter (Km)
Fie
ld S
tren
gth
dBuV
/m
Locations with Audio Quality >= 98%
Rec. 368 Predicted Field Strenght
Locations with Audio Quality < 98%
DRM Mode: OFDM Mode A, MSC 16 QAM, SDC 4 QAM, code rate 0.5. Interleaving short
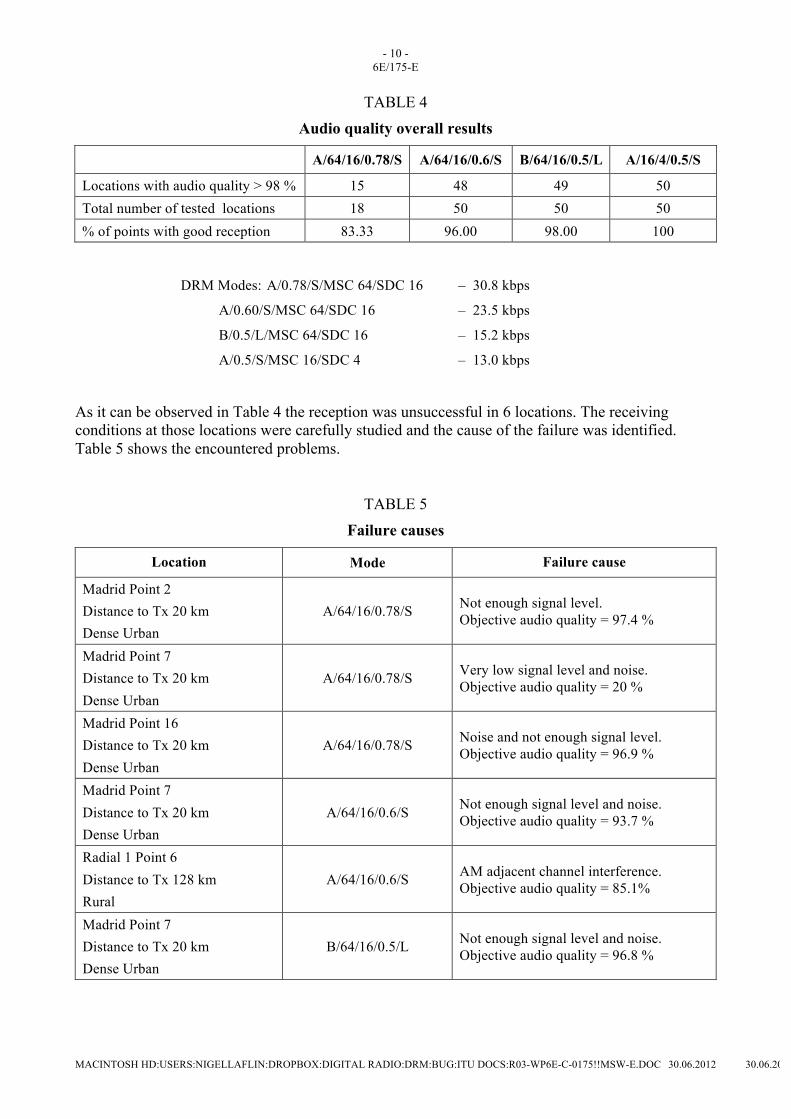
According to the measurements on Figure 7, the first failure occurs at 43.15 dBµV/m. There are several locations where the reception is correct with lower values (less than 39 dBµV/m). This value is higher that the 33.1 dBµV/m, proposal done in Recommendation ITU-R BS.1615 [3], but the available data do not allow giving a statistically reliable threshold. Nevertheless, according to the perception in this measurement campaign, the 33.1 dBµV/m value seems a little bit optimistic.
TABLE 10 Minimum field strength estimation (3)
ITU-R value from Rec. (dBµV/m) Measured threshold (dBµV/m)
33.1 < 39
- 18 - 6E/175-E
MACINTOSH HD:USERS:NIGELLAFLIN:DROPBOX:DIGITAL RADIO:DRM:BUG:ITU DOCS:R03-WP6E-C-0175!!MSW-E.DOC 30.06.2012 30.06.2012
FIGURE 7
Received field strength vs. distance. Static measurements in rural and suburban locations. Mode A/16/4/0.5/S. Rec. ITU-R P.368-7 prediction is also depicted
30
36
42
48
54
60
66
72
78
84
90
96
0 50 100 150 200 250 300
Distance from the Transmitter (km)
Fiel
d St
reng
htdB
uV/m
Locations with Audio Quality >= 98%
Rec. 368 Predicted Field Strength
Locations with Audio Quality< 98%
7 DRM medium wave prediction vs. measurement analysis This section presents a comparison study between the simulated and measured field strength within the coverage area of the transmitter used in these tests. These simulations have been performed using the methodology proposed by the Recommendation ITU-R P.368-7 [2]. First, a brief summary of the Recommendation ITU-R P.368-7 is given, emphasizing the key parameters that affect the prediction accuracy and possible shortcomings of this prediction method. Afterwards, considering that conductivity and permittivity values are two relevant factors for ground-wave propagation, a collection of available data from different sources is shown. Last, two subsections show the comparison results and analyse the influence and accuracy of the possible alternatives given in Recommendation ITU-R P.368-7.
7.1 MW predictions using Recommendation ITU-R P.368-7 The prediction of field strength for digital sound broadcasting systems is covered by Recommendation ITU-R P.1321 [6]. In this recommendation, the suggested ground-wave prediction method is the one explained in Recommendation ITU-R P.368-7 [2].
Recommendation ITU-R P.368-7 gives a set of curves to be used for the determination of ground-wave field strength at frequencies between 10 kHz and 30 MHz for a vertically polarized wave. These curves can be the base to determine field strength only when it is known that ionospheric reflections will be negligible in amplitude. These conditions are fulfilled by the measurements

- 19 - 6E/175-E
MACINTOSH HD:USERS:NIGELLAFLIN:DROPBOX:DIGITAL RADIO:DRM:BUG:ITU DOCS:R03-WP6E-C-0175!!MSW-E.DOC 30.06.2012 30.06.2012
carried out in Madrid. It has to be noticed that this data was collected during daytime so the ionospheric component of the signal can be considered negligible. Furthermore, this assumption was confirmed by the impulse response of the received signal in all the measurement locations.
Also, the curves are restricted to a certain range of transmitting antenna heights (if εr << 60 λσ, the curves may be used up to a height h = 1.2 σ1/2 λ3/2 ). In our case, the transmitting antenna is located at Arganda del Rey (Madrid) which is on the same average level as the terrain within the coverage area of the transmitter. This Recommendation proposes two different methods in order to predict the received field strength at a certain distance from the transmitter. These methods are the “homogeneous paths” and “mixed paths or Millington”.
Homogeneous Paths
This method is based on propagation curves assuming that the terrain profile of a certain transmitter-receiver path corresponds to a smooth homogeneous spherical Earth. Also, both the transmitting and the receiving antennas should be located at ground level. This model is applied when the radiating element is a short vertical monopole. Assuming such a vertical antenna to be on the surface of a perfectly conducting plane Earth, and excited so as to radiate 1 kW, the field strength at a distance of 1 km would be 300 mV/m; this corresponds to a cymomotive force of 300 V according to Recommendation ITU-R P.525-2 [7]. Simulations presented in this document consider curves properly adapted to increase the radiated power up to 4 kW. The application of these curves in a real network implies that the terrain has the same conductivity (siemens/m) and permittivity within the whole coverage area of the transmitter. The accuracy of this assumption, of course, depends on the nature of the terrain and the availability of reliable values for the mentioned two parameters. Sometimes, this first method could be considered to be used when the exact values of conductivity and permittivity are not known in detail and approximate values have to be used for the entire coverage area. In such a case, these values can be obtained from tables as Table 11:
TABLE 11 Standard terrain types
Type of terrain Conductivity (S/m) Permittivity
Sea water of average salt content 4 80 Fresh water (20ºC) 3E-3 80 Moist soil 1E-2 30 Medium soil 1E-3 15 Dry soil 1E-4 5 Very dry soil 1E-5 4

- 20 - 6E/175-E
MACINTOSH HD:USERS:NIGELLAFLIN:DROPBOX:DIGITAL RADIO:DRM:BUG:ITU DOCS:R03-WP6E-C-0175!!MSW-E.DOC 30.06.2012 30.06.2012
Mixed paths
The Mixed paths method is used for determining propagation over mixed paths, when the terrain profile can be considered non-homogeneous smooth Earth (i.e. different sections in the same path have different permittivity and conductivities). Such paths may be made up of sections S1, S2, S3, etc., of lengths d1, d2, d3, etc., having conductivity and permittivity σ1, ε1; σ2, ε2; σ3, ε3, etc., as depicted for three sections in Figure 8.
FIGURE 8
Mixed paths model for one profile with three homogeneous sections
This method for determining propagation over mixed paths is the most accurate available and satisfies the reciprocity condition. It assumes individually homogeneous curves, available for the different types of terrain corresponding to the sections S1, S2, S3, etc., and all drawn for the same source T defined, for instance, by a given inverse-distance curve. The values may then finally be scaled up for any other source.
For a given frequency, the curve appropriate to section S1 is then chosen and the field E1(d1) in dB(µV/m) at the distance d1 is noted. The curve for the section S2 is then used to find the fields E2(d1) and E2(d1 + d2) and, similarly, with the curve for the section S3, the fields E3(d1 + d2) and E3(d1 + d2 + d3) are found, and so on. A received field strength ER is then defined by: )()()()()( 32132132121211 dddEddEddEdEdEER ++++−++−= (1)
The procedure is then reversed, and calling R the transmitter and T the receiver, a field ET is obtained, given by: )()()()()( 12312312323233 dddEddEddEdEdEET ++++−++−= (2)
The required field is given by ½ [ER + ET]. If both methods are analysed, it can be easily observed that orographical irregularities of the terrain are not considered by any of them. Mountainous regions could present a field strength distribution that does not match with the results given by these two methods.
Also, their application requires an accurate knowledge of the conductivity and permittivity values of the terrain inside the coverage area of the transmitter (or network) planned. This applies especially to urban reception predictions. If one path contains an urban section, the conductivity and permittivity values for this one will have to be estimated and the accuracy of the result will depend strongly on the accuracy of the selected value.
S1
(ó1
, å1) S2
(ó2
, å2) S3
(ó3
, å3)
T R
d1 d2 d3
- 21 - 6E/175-E
MACINTOSH HD:USERS:NIGELLAFLIN:DROPBOX:DIGITAL RADIO:DRM:BUG:ITU DOCS:R03-WP6E-C-0175!!MSW-E.DOC 30.06.2012 30.06.2012
Then, the degree of coincidence between simulations and measurement will be highly dependent on the specific features (both terrain, environment and conductivity-permittivity data) of each target coverage area.
7.2 Conductivity and permittivity available data
Conductivity
The main available data source of ground conductivity is the world conductivity atlas of Recommendation ITU-R P.832-2 [8]. This one includes ground conductivity information for several countries, and it has been a traditional source used to obtain the necessary conductivity data for field strength predictions available in the Recommendation ITU-R P.368-7. Maps included in the atlas can be classified into the following categories: – Maps for miriametric wavelengths: for those frequencies, conductivity information is given
in milisiemens per meter, and data validity is subject to the following constraints: a) values are suitable up to 30 MHz; b) seasonal variations are not taken into account; c) data has been calculated from physiographic and geologic data, along with
measurements performed by several authors; d) given values are effective conductivity of the ground;
– Maps for hectometric wavelengths: for those frequencies, conductivity information is given in milisiemens per meter normalized to a frequency of 1 MHz. Those maps are based on measurements and other information supplied by several countries.
– Provisional information: for zones where conductivity measurement results are not available.
The comparison study between predictions and measurements in this document has been performed with the values corresponding to central Spain in hectometric wavelengths. Conductivity map given by the Recommendation ITU-R P.832-2 [8] for Spain is depictured in Figures 9 and 10.

- 22 - 6E/175-E
MACINTOSH HD:USERS:NIGELLAFLIN:DROPBOX:DIGITAL RADIO:DRM:BUG:ITU DOCS:R03-WP6E-C-0175!!MSW-E.DOC 30.06.2012 30.06.2012
FIGURE 9
Conductivity map of Spain. Source ITU-R
Area where measuerments where taken