centre for marketingfacultyresearch.london.edu/docs/97-802.pdf · why do people drive to shop? jane...
TRANSCRIPT

Centre for Marketing
WHY DO PEOPLE DRIVE TO SHOP?
Jane GouldThomas GolobPatrick Barwise
Centre for Marketing Working PaperNo. 97-802
September 1997
This research forms part of the Future Media Research Programme, funded by theMarkle Foundation, New York and a consortium of companies.
Jane Gould is a Research Fellow in the Centre for Marketing at London Business School.Thomas Golob is the Head of the Activity Studies Research Unit at the Institute of
Transportation Studies, University of California, Irvine. Patrick Barwise is Professor ofManagement and Marketing, and Director of the Centre for Marketing at London
Business School.
London Business School, Regent's Park, London NW1 4SA, U.K.Tel: +44 (0)171 262-5050 Fax: +44 (0)171 724-1145
[email protected] [email protected]://www.lbs.ac.uk
Copyright © London Business School 1997.
�

Why Do People Drive to Shop?
ABSTRACT
Over the past fifty years shoppers have increasingly relied upon motorized transportation,especially the car, to reach stores. This dependence could change if consumers choose toshop from home using electronic channels like the Internet. Although there has been someresearch on how consumers feel about the substitution of home shopping for visitingstores, there has been little investigation of how they feel about substituting the travelcomponent. This study investigates the travel trip to shop, and describes its characteristics.We explore whether people like to travel to shop, and empirically test the likely impact onin-home and out-of-home activities if people could give up the travel time to shop. Ourresults indicate that busy working women might be an initial target for home shopping,since they have a latent demand to use saved travel time for other activities. Other workersmay not have the same interest in home shopping. An activity analysis of teleworkers(people who work from home) finds that they currently engage in more shopping trips,and shopping related travel than office workers. Although teleworkers are a potentialmarket for home shopping because they are home during the day to receive homedeliveries, shopping trips may be an occasion for them to get outside the house andinteract with others.

1
In a short article that was prescient of issues in electronic shopping, Tauber (1972) asked
‘why do people shop?’ He distinguished shopping from buying and consumption, and
asked whether there were motivations for going to stores other than buying products.
Today, with the approach of electronic shopping from home, the question ‘why do people
shop?’ holds great relevance. Will people still choose to visit stores if they can search for
goods and make secure transactions from home or work through electronic networks?
Although researchers have started to explore this issue (Alba et al. 1997; Hoffman and
Novak 1996) there has been little recent consideration of transportation aspects, although
there is earlier work by Salomon and Koppelman (1988) and Koppelman, Salomon, and
Proussalogou (1991). A distinguishing feature of shopping at home is that it is ‘aspatial’:
people do not have to travel. In his investigation, Tauber did not consider the travel aspect
of shopping to be a main factor, but did observe that exposure to new shopping
opportunities was facilitated by having access to transportation, as well as discretionary
time.
As an increasing range of shopping could be done aspatially, we need to examine what the
motivations are for trips outside the home to stores, and whether driving to stores has
intrinsic value, at least for some consumers, some of the time. Are there segments of the
2
population who would prefer to travel to stores, and others who find shopping from home
to be an advantage? What are the factors involved?
‘Shopping trips’, as contrasted with trips to make a specific purchase, may be particularly
uncertain with the development of electronic channels. Tauber (1972) noted that a
shopping motive might be quite distinct from a buying motive, and that one aspect of
shopping was to do with search. The growth of intelligent agents and shopping services
may make it technically feasible for consumers to compare product features and prices
online. Recently, there has been a tremendous growth in sites that offer pre-purchase
information (e.g. for cars). Although some of this was possible before the growth of the
Internet, consumers may have found the use of catalogue or telephone shopping to be
cumbersome or not time effective (Barwise 1997).
In this study we look at the relationship between shopping and travel trips, especially by
car, and ask whether the travel trip has intrinsic value and/or costs for shoppers.
The plan of this paper is as follows: First we establish a baseline about shopping travel,
based on recent travel statistics. We then seek, through the transportation and marketing
literatures, different approaches to the question of why people travel to stores. This leads
us to pose specific hypotheses about shopping-related trips which we then test using
activity-based demand modelling. The final sections discuss our results and conclusions.
They suggest that the behaviors associated with the adoption of electronic home shopping

3
are complex, and that it is naïve to view home shopping as just another channel. Home
shopping will not evolve independently of other changes in work, daily routines, and
leisure time use.
Recent Trends in Travelling to Shop
When shopping trips are examined from beginning to end, travel time is often a major
component. Figure 1 presents a schematic of a weekly grocery shopping trip in Europe
(Coopers & Lybrand 1996). Travel represents about 30 % of this activity. The return trip
home is longer since it includes time to load and unload groceries. If instead consumers
were to shop for groceries online, one estimate is that it initially takes about 2 hours to set
up a weekly, standing grocery order, and an average of about 40 minutes thereafter to
complete a weekly shop, a reduction of over 50% (Electronic Home Services 1997).
Based on estimates that it currently takes 90 minutes to complete a weekly food shop,
home shopping for groceries would offer substantial time savings even after allowing for
some additional time to wait for grocery delivery and to unpack.
-Figure I-
Official travel statistics show that there has been a large increase in the time people spend
driving to stores over the past 30 years. Although some shopping trips are made by foot,

4
mass transit, or bicycle, the car accounts for more than 80% of shopping trips in the USA
and 74% in the UK (UK DOT 1996; US DOT 1994). In the UK, the number of shopping
trips per person has nearly doubled since 1965, and the annual shopping mileage has
nearly trebled. There are probably many interrelated reasons:
a) The increase in car ownership ( Table 1). In Table 1, we track only shopping trips
greater than one mile in length. As people acquire cars, they drive instead of walking
to stores, increasing the number of trips greater than one mile.
b) The growth in retailing centers at a distance (Table I) has coincided with ownership of
the personal automobile. These two trends have reinforced each other (Tedlow 1996).
c) Closely related to the growth of suburban retailing centers, has been the emergence of
combined shopping/ recreational travel. For example, a one-day family outing may now
combine an out-of-town shopping trip, amusement rides at the mall, and a restaurant
meal. Since the 1970s, there has been growth in warehouse stores and factory outlet
stores situated outside major metropolitan areas.
Trips for shopping are one of the major uses of the household vehicle. In the UK, 12% of
all mileage and 20% of all car journeys are undertaken for shopping (UK Department of
Transport 1996). Results for the US are similar - 19% of all person trips in the US are

5
made for shopping and this represents 12% of the annual vehicles miles travelled, or VMT
(US Department of Transportation 1994).
These statistics should be interpreted with care. First, shopping trips are often combined
with other types of travel, like the trip home from work (Bhat 1997). In some travel
statistics, trips taken for multiple purposes are not cross-classified. Second, many
shopping trips involve multiple stops, and there is some confusion as to whether these
should be categorized as separate shopping trips. Another difficulty stems from measuring
the time spent in shopping activities, as respondents vary in their perception of time the
accuracy of self-reporting.
Literature on Travel Related Shopping
We now review previous research on why people travel to shop. Today, consumers may
have no alternative although certain product categories like insurance and travel bookings
are increasingly transacted over the telephone. However, the range of products and
services available online will rapidly grow. Can we identify through the literature any
relevant consumer attitudes which may provide insights into the likely response to online
shopping channels?

6
1. Home delivery and the perceived costs of transport:
Shoppers have historically carried home with them the things that they bought, although
home delivery achieved some popularity during the first part of this century. Opportunities
to shop from home have steadily increased during this century with the adoption of the
household telephone, and more recently, the fax machine and personal computer.
However, since WW II, there has been a general decline in home delivery from stores.
One reason is the reduced availability of consumers at home. There are fewer people home
during the daytime as the number of working women increased, and the family unit size
decreased. The absence of at-home neighbors to accept deliveries and increases in crime
are additional factors that have deterred home delivery.
Consumers perceive that the car provides more benefits than home delivery. Since
consumers initiate trips to stores, it is more efficient for them to bring back home with
them the goods that they buy. They have the immediate gratification of having their
purchases at hand, instead of waiting a day or more, and they avoid home delivery charges
(Quelch and Takeuchi, 1981). According to McKinnon and Woodburn (1994) ‘the journey
between shop and home can be considered the final link in the supply chain’.
Although there is a cost to traveling to and from the stores, it is unlikely that consumers
factor it into their decision making. Studies from the transportation field suggest that
drivers rarely enumerate the total cost of owning and operating a car, nor do they attempt

7
to estimate the incremental cost of a particular trip, no matter how regularly they make it
(Louviere, cited by Wachs, 1991). Many consumers probably assume (wrongly) that the
marginal cost of car travel is no more than the gasoline cost, and for short trips they do
not even consider that.
2. The centrality of cars and car dependence:
A second reason that people drive to shop may have to do with vehicle ownership. Over
the past decade, there has been growing awareness of ‘car dependence’ (Newman and
Kenworty 1989; RAC 1995). The personal vehicle has become such a pivotal feature of
daily life that we organize activities around it. For example, in the UK, the number of
short trips taken by car is increasing, at the expense of trips on foot or by bicycle. It has
been found that acquisition of a car encourages people to gradually change their behavior
and activity patterns, and to acquire new ones that favor use of the vehicle. Owning a car
is a powerful predictor that it will be used, and there is concomitant relationship between
car dependence and other social changes, like the location of stores and services (RAC
1995).
‘Car dependence’ turns on its head the commonsense view that the car is a mode of
transport to get to a place. Instead, it suggests that having a car will, in its own right,
generate travel. If this construct is extended to non-food shopping trips, people might at
least prefer shopping opportunities, some of the time, that allowed them to use their car
8
more (e.g., factory outlet shopping), and may not be averse to shopping trips that required
unusual or variable levels of driving (e.g. yard sales, boot sales).
Tauber (1972) posited that people often go to stores because there is a recreational aspect
to shopping. Here we posit that there is also a recreational aspect to driving. Although
there are complaints about driving, such as parking, road rage, and congestion, many
people still appear to enjoy taking their car out for a shopping trip, making this partly a
recreational use. Stores foster this by providing safe and sheltered car parks, and in some
upscale markets, valet parking. In the past, some other recreational activities, like the
drive-in movie, developed specifically around enjoyment of car-based activities.
Although there are many opportunities today to shop without driving, consumers do not
seem to non-retail shopping formats because they offer travel-less shopping. Most recent
studies on catalog shoppers assume that consumers have access to cars. Other factors, like
recreation, quality, and value shopping are cited in the use of catalogs or videotext
(McDonald 1993; Eastlick 1993). A recent study found little indication that mail-order
and catalog shopping was used as a substitute for travel to stores (Handy and Yantis
1996). Shoppers who used mail-order frequented retail stores as often as non-users. Some
of the products available through catalogs are “hard to find” (and easy to ship) items, such
as clothing in special sizes or craft items. Sales advertising in catalogs also exposes the
consumer to attractive price discounting. There is, however, one group that does seem to

9
favor home shopping because of reduced mobility. Older people are heavily represented in
home shopping services like Shoppers Express in the US (Electronic Home Services
1997) and the ‘TeleSuper’ project in the Netherlands (Tacken 1990).
3. Personal freedom and other psychological constructs:
Another aspect of ‘why people drive to shop’ may have to do with an underlying desire
for mobility. People buy vehicles that exceed their utilitarian use, and although most
people habitually drive the same routes, a car may provide psychological freedom. For
instance, the ability to drive to a store may also introduce serendipity: as people travel,
they may see a sign announcing a sale or promotion, or come upon a new store. This
introduces an element of adventure to the shopping process.
Another reason, again related to psychological motives, is that time spent in cars may be
a useful ‘transition’: Albertson (1977) has suggested that the journey to work by car
provides a time for people to make the transition between work and home roles, and this
may help to explain why some commuters do not want to give up the drive to and from
work. By extension, the time spent driving to stores may abet transition into a consumer
role. This may be of value to shoppers and help them organize shopping visit effectively.
Online shopping does not provide this opportunity. The absence of transition time might
be a particular problem for teleworkers; i.e., those who work at home, often using
computers.

10
Although there is little empirical data about travel to stores, existing evidence does not
suggest that most people find it onerous. In fact, people may blur their travel time to shop
with entertainment. Evidence for this can be found in a methodological study by Kalfs
(1995). She compared three methods of collecting travel diary data: paper and pencil
interviews (PAPI), computer assisted self interviews (CASI), and computer assisted
telephone interviews (CATI). One of the major differences between the collection
methods was how respondents coded their travel time to shop. In the CATI, the purpose
of a travel trip was coded as shopping, but in the CASI it was often recorded as travel
time for entertainment or travelling around. That is, travel time for shopping and
entertainment activities tended to blur, depending upon the data collection method.
In a different context, the value of travel can be readily seen. Holiday travel is one of the
most important activities in the US and Western Europe. Vacation related travel trips
have increased in the UK by a factor of four between 1965 and 1991. Among workers
who get a summer vacation, 60% of them take a holiday that involves travel (Argyle
1996). This type of discretionary travel is obviously regarded by consumers as a valuable
use of time and money.

11
Travel Behavior Models and Research Hypotheses
Consumers’ outlook towards travel is likely to play a pivotal role in the development of
electronic home shopping. If shoppers have access to a vehicle, available time, and a
propensity to leave home/work, then driving to stores might be viewed as an acceptable,
and even enjoyable aspect of shopping. However, if people are busy and/or would prefer
to engage in other activities, then travel time to shop might be seen as onerous, and home
shopping would provide an alternative. The latter view was articulated by Rosenberg and
Hirschman (1980), who predicted customer reluctance once teleshopping developed, to
drive great distances, except for high-priority shopping expeditions.
One way to explore these choices is through the use of travel behavior models. Models
based on activity demand have been used to identify the relationships between travel and
activities (Kitamura 1988; Lu and Pas 1997). These models predict travel, based on
factors like time use, vehicle access, and competing in-home, out-of-home choices. They
are similar to models used to study consumer time budgets (e.g., Lane and Lindquist,
1988), but they explicitly consider the role of travel. Household travel patterns have been
studied using a three-way classification, based on a hierarchy of needs (Chapin 1974;
Robinson 1977; Golob and McNally 1997). This hierarchy, which applies to activities both
in and out of the home, is shown in Figure 2, but it is modified to draw attention to
shopping activities.

12
(1) Level 1 is comprised of subsistence activities, measured by the amount of time
spent travelling to and engaging in out-of-home work activities. They are at the
top of the hierarchy. The more time a person devotes to subsistence activities, the
less time he or she has available for all other activities.
(2) Level 2 is made up of maintenance activities, which includes the activity time
and travel for all activities that households typically need to perform on a regular
basis, such as most types of shopping, eating meals, engaging in personal or
professional services, medical care, taking care of household or personal
obligations, picking up or dropping off passengers, school, and religious activities
at non-home locations. For purposes of investigation, we will distinguish between
shopping and all other maintenance activities.
(3) Finally, Level 3 is comprised of discretionary activities, which encompass
social, recreational, and entertainment activities (such as visits to friends or
relatives, engaging in cultural and civic activities, amusements, hobbies, exercising,
sport, rest and relaxation, attending spectator athletic events, or making incidental
or tag-along trips). As Level 3 is at the bottom of the hierarchy, discretionary
activities are affected by activities at the two upper levels, and there are no direct
effects originating from discretionary activities.

13
-Figure 2-
In most prior research using these activity models, shopping has been treated at as
maintenance activity, and is aggregated at Level 2. However, recognizing that shopping
can take place for both maintenance and discretionary reasons, and that these may overlap,
our analysis treats shopping and shopping- related travel ‘outside’ of either category. We
can then examine how shopping from home could lead to time savings that are channelled
towards additional maintenance or discretionary activities, or both.
If people did not have to travel to shop, then they would recoup the time of their round-
trip travel, assuming for now that the duration of the shopping visit remained constant. In
order to model the effects of the travel time savings, we expand the activity hierarchy of
Figure 2 to separate out-of-home shopping activity time and shopping travel time. In
Figure 3, we specify how time that is saved from shopping trips could be directed towards
either discretionary activities (in-home or out-of-home) or towards maintenance activities
(in-home or out-of home), or toward an increase in shopping itself. The additional three
‘feedback effects’ of travel time result in a structural model, depicted by the flow diagram
of Figure 3, that is defined by nine direct effects: five direct effects that portray the activity
hierarchy, one direct effect that represents the need to travel to conduct out-of-home
shopping, and three feedback links that represent potential shopping travel time influences
on activities.

14
-Figure 3-
The relationships postulated in Figure 3 could apply to anyone working outside the home,
but Gould and Golob (1997) established that many busy working women are time-
pressured. Busy working women are likely to harbor latent demand for out-of-home
Level 2 and Level 3 activities; and because of this reason, they represent one segment that
is likely to is likely to be an initial target for home shopping. Women, for example,
currently make up about 80% of the users of the Peapod home delivery food service
(Foremski 1996).
This leads to a hypothesis that working women might favor electronic home shopping
because they have an unmet demand to engage in different maintenance or discretionary
activities, and they would direct saved shopping travel time to other areas. The null
hypothesis is that among working women, new time savings, from travel, would not
increase maintenance or discretionary activities outside the home.

15
Future Work/Home Relationships
Figure 2 directs our attention to the primary influence of work (subsistence activities).
Time spent at work is a critical predictor of other travel and activities, and more work
activity implies less time for shopping activities. Empirical analysis has confirmed that that
retired people and homemakers without paid employment spend significantly more time
shopping in stores than full and part time workers (Gould and Golob, 1997).
If people work from home more, will they then spend more time in stores, like retired
people and homemakers? For some professionals the distinction between home based
activities and work may blur, especially if the same technology that enables work from
home enables other activities like electronic home shopping.
Early adopters of telecommuting might be studied for clues. One recent study has found
that telecommuters tend to choose spatial locations closer to home (Saxena and
Mokhtarian 1997). White-collar teleworkers spend large portions of their day using
computers are likely to be targeted by home shopping services since they have modems,
and are also at home during the daytime to accept deliveries. However, teleworkers
might shun these services if outside travel and shopping serve other psychological roles.
Since we believe, like Tauber (1972), that seeking diversion outside the home is an
important function of shopping, we expect that people who work at home will still seek to
16
spend time in both travel to stores and shopping. If both the shopping activity and
shopping travel are of value, then they may both increase in the future, as more people
telework (provided that new, competing out-of-home activities do not capture all the
resulting latent demand). We test the null hypotheses that:
(1): The amount of shopping time will be the same among teleworkers and other
workers.
(2): The amount of travel time for shopping will be the same among teleworkers
and other workers.
Methodology and Data
Sample and Data Collection
An activity and travel study with a large and representative sample was conducted for the
Portland Metropolitan Area in Northwest Oregon and Southwest Washington, in 1994-95
(for a discussion of the sample see Cambridge Systematics 1996; for a discussion of the
measurement issues see Lu and Pas 1997). This is the only recent multi-day travel diary
available with a spatial distribution of stores and households, similar to other large
metropolitan areas in the US, and it was developed after two phases of pilot testing. A
random probability sample of telephone exchanges in the area of interest was used, and the
first step was to determine an eligible sample, after eliminating business and government
numbers, disconnected numbers, no answers, and so forth. Among 7,090 eligible

17
households, there was a recruitment rate of 53%, and a completion rate among them of
63%. Demographic and household characteristics of the final sample were compared to
the US Census, and are reported by NuStats (1995). The survey achieved similar
distribution of households compared the 1990 Census, but there was a slight tendency for
low-income households to be underrepresented because these households may have had
fewer telephones, and were more reluctant to participate.
The survey was conducted in several stages. First, respondents received an advance letter
about the survey, followed by a recruitment interview. Recruited households received a
packet of survey materials, and later, a reminder phone call to log their activity diaries.
Finally, a telephone survey was used to retrieve activity and travel data following the last
designated travel day. The activity diaries were extensively pretested, and recorded all
activities involving travel and in-home activities with a duration of at least 30 minutes, for
all individuals in the household, over a 48-hour period. A full range of household and
person data were also collected.
After the elimination of records with any missing travel activity data, there were 6,919
persons aged 16+ in 3,891 households. These 6,919 respondents recorded 13,838 days
of observation. These days were not equally distributed across the week due to logistical
problems in the interviewing and the need to over-represent work days in the sample for
transportation planning reasons. Since activity participation varies by day of the week, it

18
was necessary to weight statistics computed from the person-day sample so that all days
were equally represented. The day weights, centered at unity to preserve the original
sample size in statistical tests, varied from 0.82 (Thursday) to 1.30 (Sunday).
For the analysis of teleworkers, a work activity was defined if its duration was four or
more hours. The sample sizes here are 5,263 days with work solely away from home, 367
days with work both at home and away, and 287 days with work solely at home. For the
analysis of busy working women, we selected 1669 women who recorded at least four
hours of out-of-home work activity on at least one of the diary days. This segment
represents 46.7% of the 3573 women older than 15 years of age in the full data set.
Analysis
Our analysis consists of two distinct segments. First, we specify a structural equations
model upon a sample of working women to investigate the potential effects of a reduction
in shopping travel time on future activity. In the second part, we study teleworkers and
discuss their shopping time and travel patterns.
The structural equation model tests the hypotheses of Figure 3. The relationships among
the endogenous activity variables are conditioned on exogenous factors of household and
person characteristics. The exogenous variables we use have been shown to be important
in explaining differences among adults in their demand for these shopping, maintenance,
discretionary, and work activities (Robinson 1977; Pas 1984; Golob and McNally 1997;

19
Gould and Golob 1997; Lu and Pas, 1997). The household characteristics include income,
car ownership, and household composition by age group, and personal characteristics
include age and gender. In addition, since our activity diary data can be recorded on any
two consecutive days in the week, we include two dummy exogenous variables, one for
Saturday and one for Sunday, to account for differences in activity patterns on weekends
versus week days.
We estimate the structural equation model using maximum likelihood estimation (MLE),
because the two-day activity diaries picked up well-distributed activity durations for all
activity types. A particular advantage of MLE is that it is generally applied, as here, to
covariances (rather than correlations), so that the estimated coefficients are in the scales of
the variables, which facilitates interpretation of the results.
The second part of our analysis, about teleworkers, is descriptive. We use an analysis of
variance to test the null hypotheses about activity duration and travel time across groups
stratified by the amount of time spent at an away- from- home work site. Having a group
that works both at home, and away from the home, gives us the chance to see whether
their activity duration and travel time more resembles home-only workers, or office-only
workers. We recognize that online shopping options available to teleworkers today are

20
different than future ones, so we look primarily for evidence that today’s teleworkers seek
shopping and travel outside the home.
RESULTS
Effects of Reduced Shopping Travel Time on Activity Patterns
We fitted the structural equations model for the sample of 1669 busy working women.
The fit yielded a chi-square value of 12.71 with 23 degree of freedom, which indicates that
the model fits extremely well and cannot be rejected at the p = .05 level. The estimated
direct effects among the endogenous variables are shown in Figure 4. All of these direct
effects have the expected sign, and all coefficients are statistically significantly at the p =
.05 level with one exception. The single insignificant link is the feedback from shopping
travel time to discretionary activities. This suggests that busy working women would
convert saved shopping time into additional shopping and other maintenance activities,
but not necessarily into additional discretionary activities.
-Figure 4-
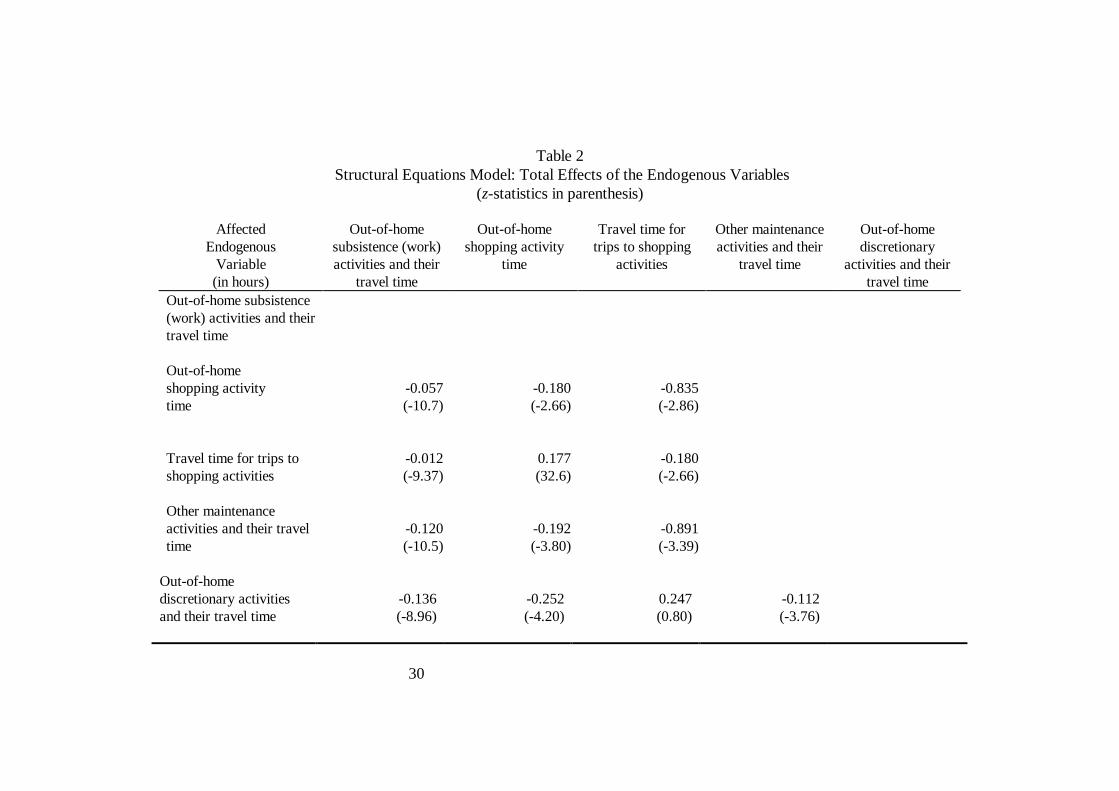
The total effects of each variable on all other variables are listed together with their t-
statistics in Table 2. A comparison of the total effects emanating from shopping travel
time (Table 2) with the direct effects (Figure 4) shows that the conversion of saved time is

21
dampened by the feedback loop involving shopping activity time and shopping travel time;
increased shopping activities generate more shopping travel time. The net effect of saved
travel time on discretionary activities actually turns out to be negative (but not
significantly different from zero), because increased Level 2 activities depress discretionary
activities.
-Table 2-
We interpret these results to mean that female workers have a latent demand for all out-of-
home maintenance activities. If more time is available, they would participate more in
such activities. Work is largely responsible for repressing this demand, but our results
indicate that shopping travel time is also a significant component of the time that could be
converted to maintenance activities. Among busy working women the elimination of
some shopping trips due to the substitution of in-home for out-of-home shopping should
therefore lead to an increase in demand for activities that include other types of shopping.
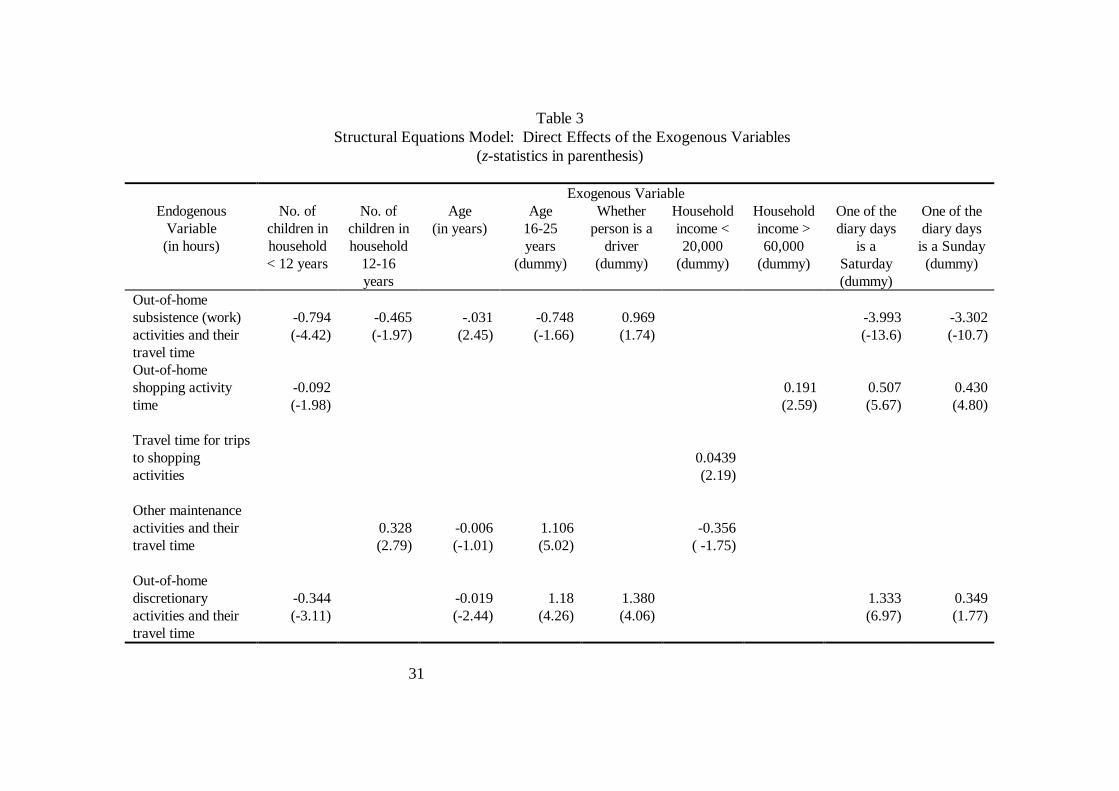
Table 3 lists the direct exogenous effects on which the endogenous effects are
conditioned, and Table 4 reports the total effects of the exogenous variables. These total
effects are computed by solving the structural equations system so that the endogenous
variables are functions only of the exogenous variables.

22
These results tend to support further the time/trade-off issues. They show that shopping
activities are integrated into other routines and roles For example, working women with a
higher household income shop more, while younger women seems to be involved in
different types of maintenance and discretionary activities (perhaps school or sports
groups). Working women from both the highest and lowest income households travel
more for shopping than do women from middle-income households, but for higher income
women this is the result of more demand for shopping activity time, while lower income
women must travel further per hour of shopping activity, presumably due to residential
location factors.
The large coefficient between shopping activity and weekend days suggests that working
women are using what free time they do have to engage in shopping activities. The model
suggests that electronic shopping might serve a valuable role, based on the evidence that
working women would channel their saved travel time into additional out-of-home
activities because there is a latent demand to meet other needs.
Teleworkers
We found that people who worked exclusively at home on a given day allocated their time
different than other workers. Results from an analysis of variance are listed in Table 5, for
full time teleworkers (n=287), full time office-workers (n=5263), and a third group who
23
mixed work at home and at the office (n=367). For teleworkers, the first null hypothesis
is rejected as the groups are significantly different in terms of shopping activity duration,
primarily due to the higher level of shopping activity participation for teleworkers. The
second null hypothesis is also rejected as there are significant differences (at the p = .05
level) in terms of travel time to shopping, and the groups that work at home travel
somewhat further to shop. However, this may not reflect a preference for longer trips, as
the shorter travel time for out of-home workers might also occur because full time
workers can perform shopping activities on their way home from the office or during lunch
time. (Among the away-from-home workers, 53% of their shopping activities were linked
to the work trip, and among those who worked both at home and away, 49% of their
shopping activities were linked to the work trip.)
The duration of non-shopping maintenance activities is significantly higher for out-of-
home workers because at lunch-time they often eat out, pick up papers or packages, and
so forth. The travel times for these maintenance activities are not significantly different
across the three groups. Also, there are no significant differences in discretionary
activities and travel; this is due to the high variances on these variables. Finally, combining
all non-work out-of-home activities and travel, teleworkers spend, on average, more than
1.5 hours per day engaged in non-work activities outside the home, which is significantly
higher than the time spent by other workers. Table 6 compares the three groups, in terms
of the percentage breakdown of their non-work out-of-home activities. Relative to the

24
other groups, teleworkers allocated only very slightly more of this time to discretionary
activities (41% vs. 38%). Instead, they spent a substantially higher proportion of this time
shopping and a substantially lower proportion on other maintenance activities.
Looking now at just non-work travel activity, we find that although they are not
statistically significant, the results are in the expected direction. The telecommuters travel
somewhat more across all conditions. There are several interpretations: one is that
teleworkers are unable to conduct their shopping and errands in conjunction with their
office lunch or the drive home from work. Therefore, when working at home they have to
undertake new and separate trips. Another explanation is that the teleworkers use trips
outside the home to break their isolation or seek outside contact. These data do not enable
us to distinguish between these two competing ideas, but they both point in the direction
of a different activity pattern for teleworkers which we might expect to become more
widespread as more people work from home.
This has implications for the future location of stores, and for the choice of transportation
to reach these stores. Today, the location of many stores is based upon proximity to
offices and commute corridors. Since store locations are often at a distance from home,
telecommuters currently have to drive to shop. If telecommuters choose shopping sites
that are close to home then they might also reach them on foot, on bicycle, or in entirely
new vehicles like electric cars.

25
Discussion
In 1972 when Ed Tauber asked ‘Why do People Shop?’, there were few alternatives to
going to the store since the range of home shopping was limited to mail-order and direct
marketing. Today, home delivery shopping services are growing and electronic commerce
is burgeoning. So, it is appropriate to ask, as Tauber did, whether going to stores has an
intrinsic value, beyond the selection of individual products. One of the components of the
visit to the store is the shopping trip, and we are in a better position to understand the
adoption of future home shopping if we examine the characteristics of this travel.
As online shopping grows, other factors will not remain static. The range of stores that are
visited in-person is likely to change if consumers gain free time or expand their awareness
of alternatives. The location of stores, their ambiance, the motivation for a shopping trip,
and the number of impulse versus routine visits are all likely to change in response to the
range and variety of products sold online and the ease and cost with which they can be
acquired. Transportation and communication interactions often lead to unanticipated but
far-reaching levels of change. An analogy can be found from the financial industry where
the expansion of automatic teller machines has contributed to significant change in the
number and location of bank branches.

26
One finding is that teleworkers increased non-work time spent outside the home,
especially shopping, relative to other workers. The future growth of telework presents
something of a paradox for electronic home shopping. On the one hand, the availability of
household members for home delivery will facilitate its growth. People are more likely to
be at home during the day to accept delivery of packages, and might even welcome this
break in their routine. On the other hand, teleworkers may favor physical activity outside
their home and diversions which provide a contrast to computer usage. Baer (1985) and
Gr• nmo (1987) depict scenarios where social contact and interaction decrease, and the
computerized home becomes an electronic isolation chamber. It should be noted however,
that both of these studies preceded the rise of electronic mail. It is still a valid hypothesis,
however, that home-bound workers might choose to travel, and future shopping could
serve many functions, including social contact outside the home.
While teleworkers may favor shopping in stores (provided that other out-of-home
alternatives do not develop), the results for working women suggest a different pattern.
Working women appear to be an initial market for home shopping primarily because they
have a latent demand to engage in other maintenance activities. Our model indicates that
such women would direct saved travel towards maintenance tasks, and these probably
include things like banking or financial transactions, chauffeuring others, or health
appointments. In the future, more of these maintenance activities could be done online
and electronic services might produce new time savings for working women. However, an
27
increase in the number of maintenance activities could also generate demand for new
products, and subsequently lead to additional shopping (e.g. more chauffeured trips�need
for a different vehicle � new shopping). The model also identified a link which showed
that if shopping travel time was reduced, more shopping activity might take place (in
stores). Electronic shopping could facilitate this since the travel-intensive bits of
shopping, like price and feature comparisons, could be done on-line. All of these results
point to the need for future restructuring among retail centers, as the expectations and
needs of electronic consumers change.
Limitations and Further Research
In this study we have used a broad definition of shopping which combines both search
activities and transactions. It is likely that survey respondents tended to under-report trips
that were taken for browsing, or that did not result in a transaction. With the growth of
electronic home shopping it would be useful to have a finer-grained definition of shopping
to see whether there is a link between online search activity, use of different electronic
sources, and subsequent trips to stores.
It will be important as the definition of shopping is honed, to separate out shopping
activity for different products and services. With the emergence of products that can be
sold either digitally or in stores, like software and music CDs, we need to understand their

28
trip-generating potential. We would also like to suggest that future investigation of
shopping split off the search for groceries from the search for other types of items. Food
shopping is less discretionary and more habitual than other types of travel for shopping. It
is also an area of home shopping that is rapidly growing.
Our data are cross-sectional, with the usual limitations. In future research, our hypotheses
might best be followed longitudinally- by setting up a study of people who are about to
subscribe to a shopping service (e.g. Shoppers Express or Peapod) and then tracking their
behavior over time. There are ‘virgin’ opportunities to study home shopping today that
may rapidly disappear as electronic home shopping becomes more commonplace.

29
Table 1 Trends in UK Shopping Trips per Person
ShoppingTrips P/ PersonP/Year*
Avg. MilesP/ Trip
AnnualMileage*
CarOwnership*
Number of PurposeBuilt ShoppingCentres (not towncentre)* *
Real ConsumerExpenditure per capita(£bn)constant=1993
1965 77 3.5 268 42% 50 218.3
1975 115 3.8 440 53% 300 270.2
1985 125 4.6 577 62% 500 323.4
1995 145 5.2 747 68% 990 (1992) 405.6 (1993)
*Excludes shopping trips < 1 mile Sources: Social Trends (1997), UK DOT (1996)** British Council Shopping Centres (1993). Numbers are rounded up.
30
Table 2 Structural Equations Model: Total Effects of the Endogenous Variables
(z-statistics in parenthesis)
AffectedEndogenous
Variable(in hours)
Out-of-homesubsistence (work)activities and their
travel time
Out-of-homeshopping activity
time
Travel time fortrips to shopping
activities
Other maintenanceactivities and their
travel time
Out-of-homediscretionary
activities and theirtravel time
Out-of-home subsistence(work) activities and theirtravel time
Out-of-homeshopping activitytime
-0.057(-10.7)
-0.180(-2.66)
-0.835(-2.86)
Travel time for trips toshopping activities
-0.012(-9.37)
0.177(32.6)
-0.180(-2.66)
Other maintenanceactivities and their traveltime
-0.120(-10.5)
-0.192(-3.80)
-0.891(-3.39)
Out-of-homediscretionary activitiesand their travel time
-0.136(-8.96)
-0.252(-4.20)
0.247(0.80)
-0.112(-3.76)
31
Table 3 Structural Equations Model: Direct Effects of the Exogenous Variables
(z-statistics in parenthesis)
Exogenous VariableEndogenous
Variable(in hours)
No. ofchildren inhousehold< 12 years
No. ofchildren inhousehold
12-16years
Age(in years)
Age16-25years
(dummy)
Whetherperson is a
driver(dummy)
Householdincome <20,000
(dummy)
Householdincome >60,000
(dummy)
One of thediary days
is aSaturday(dummy)
One of thediary daysis a Sunday(dummy)
Out-of-homesubsistence (work)activities and theirtravel time
-0.794(-4.42)
-0.465(-1.97)
-.031(2.45)
-0.748(-1.66)
0.969(1.74)
-3.993(-13.6)
-3.302(-10.7)
Out-of-homeshopping activitytime
-0.092(-1.98)
0.191(2.59)
0.507(5.67)
0.430(4.80)
Travel time for tripsto shoppingactivities
0.0439(2.19)
Other maintenanceactivities and theirtravel time
0.328(2.79)
-0.006(-1.01)
1.106(5.02)
-0.356( -1.75)
Out-of-homediscretionaryactivities and theirtravel time
-0.344(-3.11)
-0.019(-2.44)
1.18(4.26)
1.380(4.06)
1.333(6.97)
0.349(1.77)

32
Table 4 Structural Equations Model: Total Effects of the Exogenous Variables
(z-statistics in parenthesis)
Exogenous VariableEndogenous
Variable(in hours)
No. ofchildren inhousehold <
12 years
No. ofchildren inhousehold
12-16 years
Age(in years)
Age16-25years
(dummy)
Whetherperson is a
driver(dummy)
Householdincome <20,000
(dummy)
Householdincome >60,000
(dummy)
One of thediary days isa Saturday(dummy)
One of thediary days is
a Sunday(dummy)
Out-of-homesubsistence (work)activities and theirtravel time
-0.794(-4.42)
-0.465(-1.98)
-0.031(-2.45)
-0.750(-1.66)
0.969(1.74)
-3.994(-13.6)
-3.302(-10.7)
Out-of-homeshopping activitytime
-0.030(-0.78)
0.027(1.95)
0.002(2.38)
0.043(1.64)
-0.055(-1.72)
-0.037(-1.78)
0.157(2.62)
0.643(9.74)
0.541(7.81)
Travel time for tripsto shopping activities -0.0065
(-0.78)0.0057(1.94)
0.0004(2.37)
-0.0119(-1.71)
0.0356(2.16)
0.0338(2.61)
0.1386(8.70)
0.1164(7.24)
Other maintenanceactivities and theirtravel time
0.113(4.45)
0.383(3.18)
-0.002(-0.36)
1.196(5.27)
-0.117(-1.72)
-0.383(-1.88)
-0.037(-2.21)
0.383(6.09)
0.314(5.45)
Out-of-homediscretionaryactivities and theirtravel time
-0.212(-1.88)
0.026(0.72)
-0.014(-1.76)
1.161(4.09)
1.248(3.59)
0.051(1.74)
-0.048(-2.26)
1.747(9.45)
0.688(3.54)

33
Table 5 Out-of-home Activities for Three Types of Workers
(in hours)
Group means Test of equality ofmeans
Away-from-home only
Mixed home& away
In-home only FStatistic probability
N= 5263 N= 367 N= 287Shopping activity duration 0.154 0.175 0.321 18.70 0.000 travel time to activities 0.057 0.072 0.077 3.18 0.042Other maintenance activity duration 0.679 0.543 0.589 3.37 0.035 travel time to activities 0.167 0.163 0.181 0.35 0.705Discretionary activity duration 0.520 0.440 0.648 2.46 0.086 travel time to activities 0.101 0.086 0.120 0.92 0.401Total non-work out-of-home activities activity duration 1.352 1.157 1.558 4.75 0.009 travel time to activities 0.325 0.320 0.378 1.77 0.171Total non-work traveltime
1.300 1.354 0.741 59.93 0.000

34
Table 6 Total Out of Home Time (Excluding Work) Spent in Different Types of Activities (%)
Away FromHome
Mixed Homeand Away
Telecommute
Shopping 11% 14 21Maintenance 50 47 38Discretionary 38 38 41

35
Figure 1Estimated Time and Travel/Non-Travel Activity for Weekly Grocery Shopping
3. TRAVEL TO SHOP
5. Pay forPurchases
6. Use Other StoreFacilities
7. RETURNHOME
8.Meal Planning
1.Plan ShoppingTrip
------------TRAVEL
Store Based
------------ TRAVEL
Non-storeBased
Non-storeBased
10%
2%
10%
40%
10%
8%
20%*
*includes time to pack car ( or go to bus stop) and unpack groceries at home Schema is based on a study of the European grocery industry by Coopers &Lybrand (1996).
2. Decide Whereto Shop
4. SelectPurchases

36
Figure 2 Flow Diagram of Postulated Direct Effects Among Four Types of Activities
WorkActivities
Maintence Activities
DiscretionaryActivities
ShoppingActivities
Level 1
Level 2
Level 3

37
Figure 3Flow Diagram of a Model Designed to Estimate the Effects of Saved Shopping Travel
Time on Different Types of Activities
WorkActivities
Maintence Activities
DiscretionaryActivities
ShoppingActivity Time
Level 1
Level 2
Level 3
ShoppingTravel Time

38
Figure 4 Estimated Direct Effects Among the Four Types of Activities and Shopping Travel Time
(one effect not significant at the p = .05 level shown in parentheses)
WorkActivities
Maintence Activities
DiscretionaryActivities
ShoppingActivity Time
Level 1
Level 2
Level 3
ShoppingTravel Time
-0.134
-0.069
-0.112 -0.305
-0.168
(-0.133)
0.215
-1.09-1.02

39
References
Alba, Joseph, John Lynch, Barton Weitz, Chris Janiszewski, Richard Lutz, Alan Sawyer,
Stacy Wood (1997), “Interactive Home Shopping: Consumer, Retailer, and Manufacturers
Incentives to Participate in Electronic Markets,” Journal of Marketing, 61, forthcoming.
Argyle, Michael (1996), The Social Psychology of Leisure. London: Penguin Books.
Albertson, L (1977), “Telecommunications as a travel substitute: some psychological,
organizational and social aspects, ” Journal of Communication, 7, 3-43.
Baer, Walter (1985), “Information Technology Comes Home,” Telecommunications
Policy, 9, 3-22.
Barwise, Patrick (1997), “ Brands in a Digital World,” Journal of Brand Management, 4,
220-223.
Bhat, C. (1996), “ A Generalized Multiple Durations Proportional Hazard Model with an
Application to Activity Behavior During the Evening Work-to-Home Commute”,
Transportation Research B, 30, 465-480.

40
British Council of Shopping Centres (1993), “The Shopping Centre Industry 1993: Thirty
Years of Growth,” Prepared by Oxford Institute of Retail Management. Templeton
College.
Cambridge Systematics (1996), Data Collection in the Portland, Oregon Metropolitan
Area. Travel Model Improvement Program. Report prepared for the U.S. Department of
Transportation. Oakland, Ca.
Chapin, F. (1974), Human Activity Patterns in the City: Things People Do in Time and
Space. New York: Wiley.
Coopers and Lybrand (1996), The Future For the Food Store: Challenges and
Alternatives. Project VI (for Coca-Cola Retailing Research Group).
Eastlick, Mary Ann (1993), “ Predictors of Videotex Adoption,” Journal of Direct
Marketing, Volume 7, Number 3, Summer, 66- 74.
Electronic Home Services Proceedings (1997), Keynote address by Martin Kahn,
Shoppers Express USA. “Providing a Real Alternative to Mainstream Shopping,” The
Café Royal, London.

41
Foremski, Thomas (1996), “Case Study: Home Shopping in the US, Peapod Service Saves
Time and Adds Value,” London (UK) Financial Times, October 2.
Golob, Thomas (1996), “A model of household demand for activity participation and
mobility,” Paper presented to the Conference on Theoretical Foundations of Travel Choice
Modelling, Stockholm, Sweden. August 7-11.
----and McNally, Michael (1997) “ A model of household interactions in activity
participation and the derived demand for travel,” Transportation Research, forthcoming.
Gould, Jane and Thomas Golob (1997), “An Investigation of Home Shopping”,
Transport Reviews. September-December, 1997. Forthcoming.
Gr• nmo, Sigmund (1987), “The Strategic Position of Consumers in the Information
Society,” Journal of Consumer Policy, 10, 43-67.
Handy, Susan and Tom Yantis (1997) “The Impact of Telecommunications Technologies
on Non-Work Travel Behavior,” Working paper. Southwest Regional University
Transportation Center, Austin, Tx.

42
Hoffman, Donna and Thomas Novak (1996), “Marketing in Hypermedia Computer-
Mediated Environments: Conceptual Foundations,” Journal of Marketing, 60, 50-68.
Javalgi, Rajshekhar, Edward Thomas and S.R. Rao (1992), “Consumer Behavior in the
US Pleasure Travel Marketplace: An Analysis of Senior and Nonsenior Travellers,”
Journal of Travel Research , 31 (Fall) 14-19.
Kalfs, Nelly (1995), “The Effects of Different Data Collection Procedures in Time Use
Research,” Paper presented at the Transportation Research Board Annual Meeting,
Washington, DC.
Kitamura, Ryuichi (1988) “An Evaluation of Activity-Based Travel Analysis.”
Transportation, 15, 9-34.
Koppelman, Frank, Ilan Salomon, and K. Proussaloglou (1991), “Teleshopping or Store
Shopping? A Choice Model for Forecasting the Use of New Telecommunications-Based
Services,” Environment and Planning B, 19, 473-489.
Lane, Paul and Lindquist, (1988), Definitions for the Fourth Dimension: A Proposed Time
Classification Scheme,” in Kenneth D. Bahn, ed. Developments of Marketing Science 11,
Blacksburg, Va: Academy of Marketing Science, 38-46.

43
Lu, X., and Pas, Eric (1997), “A structural equations model of the relationships among
socio-demographics, activity participation and travel behavior,” Paper presented at the
Transportation Research Board Annual Meeting, Washington, DC.
McDonald, William (1993), “ The Role of Demographics, Purchase Histories and
Shopper Decision Making Styles in Predicting Catalog Loyalty,” Journal of Direct
Marketing, 7,( Summer), 55-65.
McKinnon, Alan and Allan Woodburn (1994) “The Consolidation of Retail Deliveries: Its
Effect on CO2 Emissions.” Transport Policy, 1(2), 125-136.
Newman, Peter and Jeffrey Kenworthy (1989), Cities and Auto Dependence: A
Sourcebook. Gower Publishing Co., Aldershot, Hants, England.
NuStats (1995) Final Report on Oregon and Southwest Washington Household Activity
and Travel Survey, Austin, Tx.
Pas, Eric (1984), “The effects of selected sociodemographic characteristics on daily travel-
activity behavior,” Environment and Planning A, 16, 571-581.

44
Quelch, John and Takeuchi, Hirotaka(1981) ,”Nonstore Marketing: Fast Track of Slow?”
Harvard Business Review, July-August, 75-84.
RAC (1995) “Car Dependence: A Report for the RAC Foundation for Motoring and the
Environment.” London.
Robinson, John (1977), How Americans Use Time: A Social-Psychological Analysis of
Everyday Behavior. New York: Praeger.
Rosenberg. Larry and Hirschman, Elizabeth (1980), “Retailing without Stores,” Harvard
Business Review, July-August, 103-112.
Salomon, Ilan and Koppelman, Frank (1988), “A Framework for Studying Teleshopping
Versus Store Shopping,” Transportation Research , 22A(4), 247-255.
Saxena, Somitra and Mokhtarian, Patricia (1997), “The Impact of Telecommuting on the
Activity Spaces of Participants,” Geographical Analysis, 29(2), 124-143.
Social Trends 27 (1997), Office for National Statistics (UK). London: The Stationery
Office.

45
Tacken, M. (1990), “Effects of Teleshopping on the Use of Time and Space,”
Transportation Research Record, 1285, 89-91.
Tauber, Edward (1972), “Why Do People Shop,” Journal of Marketing, 36 (October),
46-48.
Tedlow, Richard (1996), New and Improved: Mass Marketing in America. Harvard
Business School Press.
U.K. Department of Transport (1996), Transport Statistics (London: HMSO).
U.S. Department of Transportation (1994) , 1990 Nationwide Personal Transportation
Survey, June, 1994. Federal Highway Administration.
Wachs, Martin (1992), “ Policy Implications of Recent Behavioral Research in
Transportation Demand Management,” Journal of Planning Literature, 5, 332-341.