cep discussion paper no 1586 the effect of the brexit...
TRANSCRIPT

ISSN 2042-2695
CEP Discussion Paper No 1586
December 2018
The Effect of the Brexit Referendum Result on Subjective Well-being
Georgios Kavetsos Ichiro Kawachi
Ilias Kyriopoulos Sotiris Vandoros

Abstract We study the effect of the Brexit referendum result on subjective well-being in the United Kingdom. Using a quasi-experimental design, we find that this outcome led to an overall decrease in subjective well-being in the UK compared to a control group. The effect is driven by individuals who hold an overall positive attitude towards the EU and shows little signs of adaptation. Subjective well-being of those with a very negative attitude towards the EU increases in the short-run but turns negative, possibly due to unmet expectations. Using three different measures of socio-economic connection between the UK and other European countries, we generally do not find evidence supporting the presence of spillover effects of the Brexit referendum result on subjective well-being of individuals in other EU countries. Key words: subjective well-being, happiness, Brexit, referendum, election JEL Codes: D72; I30; I31; I38 This paper was produced as part of the Centre’s Wellbeing Programme. The Centre for Economic Performance is financed by the Economic and Social Research Council. We are grateful Chen et al. (2018b) and Dhingra et al. (2017) for sharing part of their data on the effects of Brexit on other countries, which we use in our spillover regressions. We thank Paul Dolan, Carol Graham, Amanda Henwood, Laura Kudrna, stella Ladi, Kate Laffan and Robert Metcalfe for useful comments and suggestions. The research reported in this paper is not the result of a for-pay consulting project; the authors do not have a financial interest in the topic of this study and there are no conflicts of interest.
Georgios Kavetsos, Queen Mary University of London and Centre for Economic Performance, London School of Economics. Ichiro Kawachi, Harvard University. Ilias Kyriopoulos, London School of Economics. Sotiris Vandoros, King’s College London and Harvard University. Published by Centre for Economic Performance London School of Economics and Political Science Houghton Street London WC2A 2AE All rights reserved. No part of this publication may be reproduced, stored in a retrieval system or transmitted in any form or by any means without the prior permission in writing of the publisher nor be issued to the public or circulated in any form other than that in which it is published. Requests for permission to reproduce any article or part of the Working Paper should be sent to the editor at the above address. G. Kavetsos, I. Kawachi, I. Kyriopoulos and S. Vandoros, submitted 2018.

example, YouGov polls (a popular opinion poll in the UK) on 24 July 2015, a year before the
referendum, found Remain to be up 44% against Brexit 38%; this was also the case on 25
April 2016, just months before the referendum. This tendency for Remain was consistently
reflected in betting odds as well.1 Although Brexit built some momentum leading up to the
referendum2, the outcome was still rather unexpected as exit-polls on referendum day were
estimating a victory for Remain.3
This paper studies the effects of this referendum’s result on subjective well-being—
“experienced utility” (Kahneman et al., 1997)—in the UK. Our investigation is motivated by
a number of unique characteristics that make the effects of the EU membership referendum
on subjective well-being worth examining.
First, the Brexit referendum result is a major policy change with potentially signifi-
cant socio-economic implications; see, for example, Sampson (2017) and an OECD report
(Kierzenkowski et al., 2016) on the adverse economic consequences of Brexit, Dhingra et al.
(2017) on the effects on trade, and Breinlich et al. (2016a) and Breinlich (2016b) on house-
hold income and inflation, respectively. Similar views have been echoed by the governor of
the Bank of England, warning of lower living standards, higher inflation, job cuts and pos-
sibly a recession as a result of leaving the EU.4 More recently, a UK government long-term
analysis suggested that any type of Brexit will adversely affect the economy.5 These factors
have been shown to be directly related with reductions in subjective well-being (Boyce et
al., 2013; De Neve et al., 2018; Di Tella et al., 2001; Kassenboehmer and Haisken-DeNew,
2009; Lucas et al., 2004; Luechinger et al., 2010). It is important to note though that not
all of these, rather gloom, economic predictions have (yet) materialised; there is, however,
little doubt that the referendum’s result led to an immediate devaluation of the pound ster-
ling’s, possibly due to the expected implications on trade and economic growth (Johnson
and Mitchell, 2017).
Second, whereas general election cycles in modern representative democracies result in
parties often alternating in office, leaving the EU is expected to be permanent. There is
mixed evidence in the literature on the effect of holding office or of elections on subjective
well-being. Di Tella and MacCulloch (2005) find increases in life satisfaction when the
government is of the same ideological position as that of the respondent; Kinari et al. (2015)
find supporters of the winning (losing) party to be significantly happier (unhappier); Pierce
et al. (2016) find only ‘partisan losers’ to be negatively affected; Metcalfe et al. (2008) do
1See articles in the media, including the NewStatesman, The Independent, and The Telegraph.2E.g., only days before the referendum both campaigns were at 45% each according to this poll (YouGov
poll, 4 July 2016). YouGov surveys available via https://whatukthinks.org/eu/questions/if-there-was-a-referendum-on-britains-membership-of-the-eu-how-would-you-vote-2/?pollster%5B%5D=yougov.
3In fact, one of Brexit’s most prominent campaigners had accepted defeat as the voting was coming toa close that day. See article in The Independent.
4See media articles, including BBC (2017a, 2017b, 2017c) and The Guardian.5See 2018 EU Exit report.
2
1 Introduction
Following a relatively heated campaign leading up to a referendum with a record turnout
of 72.2%, the UK voted in favour of leaving the European Union (EU)—also known as
‘Brexit’—on 23 June 2016 with a majority of 51.9% of the votes. The referendums outcome
was somewhat unexpected as opinion polls before June 2016 tended to favour Remain’. For
not find any significant effects of election results.6 The effects of this referendum’s result will
thus offer us a better understanding of the effects of (claimed) irreversible voting outcomes
on subjective well-being.
Third, and related to the above, this literature also suggests that election outcomes
tend to have a rather short-term effect on subjective well-being (Kinari et al., 2015; Pierce
et al., 2016). It is unclear whether—in this setting—this is still because of some innate
tendency of individuals to adapt to various unfavourable outcomes (Loewenstein and Ubel,
2008; Oswald and Powdthavee, 2008; Wilson and Gilbert, 2008; Bradford and Dolan, 2010),
or because the policies of mainstream political parties have gradually converged—possibly
due to the Median Voter Theorem (Matsusaka, 2005).7 Referenda capture only two, dia-
metrically opposing, options with the decision-making process satisfied by the majority rule
(May’s Theorem, 1952), so are often likely to leave a significant part of the voting popula-
tion dissatisfied. Further note that this single-issue referendum led to rather high levels of
polarisation, and a Member of Parliament was murdered just a week before the referendum.
Our study further relates to the literature on the relationship between decision utility—
or preference utility (Adler, 2013)—and experienced utility. The results from this literature
generally point towards a concordance between choices and subjective well-being which is,
however, far from perfect and depends on the measure of subjective well-being used (e.g.,
Benjamin et al., 2012, 2014; Perez-Truglia, 2015). Voting is arguably the most fundamental
expression of an individual’s preferences in representative democracies, hence the study of
voting outcomes and subjective well-being offers a suitable setting to study this relationship
in larger populations.
In considering the effects of the Brexit result on subjective well-being, this study builds
on the existing literature and makes the following contributions. First, using data from
the Eurobarometer, we consider the referendum as the ‘event’ of a quasi-experiment and
apply a difference-in-differences approach, to identify its effects on subjective well-being of
individuals in the UK compared to those in other European countries, which are not exposed
to the treatment (referendum). A previous study on the Brexit referendum result uses a
narrower outcome measure, physician antidepressant prescriptions (Vandoros et al., 2018).
This study, as the authors acknowledge, is not as informative in determining the well-being
implications for society as whole and does not capture any changes in mood or mental
health of people who do not take antidepressants. In a similar spirit to ours, Powdthavee
6The reverse relationship (i.e., subjective well-being affecting voting intentions/election outcomes) hasalso been the focus of several studies. Using British panel data Metcalfe et al. (2008) find that moresatisfied Conservative supporters are less likely to vote compared to Labour supporters. This is contraryto Liberini et al. (2017a) who, using the same data, find that higher levels of life satisfaction are animportant determinant of supporting the incumbent. Ward (2015) uses Eurobarometer data to study over130 parliamentary elections in 15 European countries, finding a positive association between subjective well-being and the vote share received by the incumbent. Herrin et al. (2018) present similar findings for the2016 US Presidential election. Liberini et al. (2017b) study the effect of subjective well-being on statedpreferences for Brexit, finding that dissatisfaction with one’s financial situation (not life in general) to bean important determinant.
7Also referred to as Hotelling’s principle of minimal differentiation.
3
et al. (2017) use subjective well-being measures as the outcome, but consider a UK-based
control group in their difference-in-differences model. Despite the Brexit outcome being
unexpected, the referendum itself was not an exogenous event to a UK-based control group.
Introducing an external control group allows us to benchmark pre- and post-referendum
trends in subjective well-being in the UK against pooled pre- and post-referendum trends
in other countries.
Second, we use a question on respondents’ feelings of being an EU citizen to contem-
poraneously estimate heterogeneous effects of the referendum’s result and also estimate
how individuals’ subjective well-being adapts depending on their attitudes towards the EU.
Powdthavee et al. (2017) split their sample in control and treatment groups based on in-
dividuals’ stated preference for Brexit in the second of their two-wave panel; thus, making
the implicit assumption that respondents do not exhibit preference reversals between waves.
To the extent that the unobserved (former wave) preferences for Brexit might have been
different to those observed in the latter wave, this would have implications for the difference-
in-differences estimates.
Third, our choice of a European-wide dataset is motivated by an additional research
question. With Brexit arguably having implications for EU’s integration and economy, it
is plausible for it to have an effect on other EU countries. Following an approach similar
to Dolan et al. (2016), we introduce separate treatment effects to test for any spillover
effects of the referendum’s result on subjective well-being in other EU countries. We use
three measures to determine the economic ‘exposure’ of a country to the UK—advanced by
Chen et al. (2018a), the IMF (Chen et al., 2018b) and Dhingra et al. (2017)—which we use
to split countries in our sample into four groups of exposure. We subsequently include as
separate treatment effects with the group least exposed acting as the reference group.
Our main finding is that the Brexit result led to an overall decrease in subjective well-
being in the UK. The effect is mostly driven by individuals who hold an overall positive
attitude towards the EU, with little signs of adaptation within the span of our sample (up
to autumn 2017). For those with very negative attitudes towards the EU, we find short-term
increases in subjective well-being, followed by significant decreases, perhaps because of some
sort of distress or unmet expectations of a ‘hard(er) Brexit’. Overall, we do not find much
evidence supporting the presence of spillover effects in other countries; which only appear to
be present for the group of countries mostly connected to the UK in only one (the narrowest)
of the three measures of socio-economic exposure considered here. It is important to note at
this point that as Brexit has not yet officially occurred, what we are essentially measuring
are the effects of the referendum result and during the initial stages of the ‘Brexit transition
period’.
The rest of this study is structured as follows. Section 2 describes the data and empirical
methods; Section 3 presents the results and robustness tests; and Section 4 discusses our
findings and concludes.
4

2 Empirical Strategy
2.1 Data and Methods
To investigate the effect of the 2016 EU referendum on subjective well-being we use data from
the Eurobarometer Survey Series, the European Commission’s public opinion survey. This
is a cross-sectional face-to-face survey of individuals in EU member states conducted usually
twice a year (spring and autumn) since the 1970s. About 1,000 respondents are interviewed
in each country-wave on a range of topics including their satisfaction with life given by the
question “on the whole, are you very satisfied, fairly satisfied, not very satisfied, or not at
all satisfied with the life you lead?”. Such measures are increasingly being used in academic
and policy circles to evaluate policy, intangibles and non-market goods; see for example van
Praag and Baarsma (2005), Dolan and Kahneman (2008), Luechinger and Raschky (2009),
Metcalfe et al. (2011), Levinson (2012), HM Treasury (2011), OECD (2013), and National
Research Council (2013).
We use data spanning over the period 2015-2017, which includes waves 83.1 (Feb-Mar
2015), 83.3 (May 2015), 83.4 (May-June 2015), 84.3 (Nov 2015), 85.1 (Apr 2016), 85.2
(May 2016) and 85.3 (June 2016) before the referendum, and waves 86.1 (Sep-Oct 2016),
86.2 (Nov 2016), 86.3 (Nov-Dec 2016), 87.1 (Mar 2017), 87.3 (May 2017), 88.1 (Sep-Oct
2017), 88.2 (Oct 2017) and 88.3 (Nov 2017) after the referendum. The following countries
are included in every wave in our sample: Austria, Belgium, Bulgaria, Croatia, Cyprus,
Czech Republic, Denmark, Estonia, Finland, France, Germany, Greece, Hungary, Ireland,
Italy, Latvia, Lithuania, Luxembourg, Malta, the Netherlands, Poland, Portugal, Romania,
Slovakia, Slovenia, Spain, Sweden, and the United Kingdom.
We estimate a difference-in-differences (DiD) model, where the treatment group consists
of individuals interviewed in the UK and the control group consists of individuals interviewed
in the 27 remaining EU countries in our data. Our baseline specification is given by equation
1:
SWBicmt = β0 + β1UKic × PostBrexitmt + β2UKic + β3PostBrexitmt+
+Macrocmt +X ′icmtΓ+ φc + κm + ξt + uicmt
(1)
where SWB is the subjective well-being of respondent i at country c interviewed in
month m and year t; UK is a time-invariant dummy variable equal to one if the respondent
is interviewed in the UK and zero otherwise; PostBrexit is a dummy variables equal to
one if the respondent is interviewed after the Brexit referendum result; X is a vector of
individual characteristics/observables; φc is the country fixed effect; κm is the month of
interview fixed effect; ξt is the year of interview fixed effect8; and Macro is a vector of some
key macroeconomic indicators to control for different macroeconomic conditions in these
8We do not control for day of week fixed effects due to data unavailability in waves 83.3 and 85.2. Ourresults are, however, robust to the exclusion of these waves and the introduction of day-of-the-week fixedeffects.
5

countries over time.
In particular, vector X includes the following individual observables: gender, marital
status, age and age squared, type of community, education, occupation, social status9,
number of children aged under 14, number of people present during the interview and the
time of the interview. The vector Macro consists of the monthly unemployment rate,
monthly inflation rate and quarterly GDP per capita obtained from Eurostat (Di Tella et
al., 2001). Robust standard errors are clustered at the country-wave level are reported
throughout.
Using the calendar dimension of the survey waves following the Brexit result, we next test
for adaptation. As discussed, this is an important motivation of this study, due to this vote
being based on a single-issue referendum with non-reversible and non-trivial implications.
Due to the calendar proximity between, and sometimes overlap of, survey waves we pool
waves together into seasons of the year—spring and autumn—and estimate the following
model:
SWBicmt = β0 + β1UKic × Autumn2016mt + β2UKic × Spring2017mt+
+β3UKic × Autumn2017mt + β4UKic + β5Autumn2016mt+
+β6Spring2017mt + β7Autumn2017mt +Macrocmt+
+X ′icmtΓ+ φc + κm + ξt + uicmt
(2)
where Autumn2016 is a dummy variable equal to one if the individual is interviewed after
the referendum and during autumn 2016 (wave 86); Spring2017 is a dummy variable equal
to one if interviewed in May 2017 (wave 87), a year after the referendum; and Autumn2017
is a dummy variable equal to one if interviewed in autumn 2017 (wave 87).
We next test for heterogeneous effects of the referendum’s outcome on UK respondents.
In the absence of a Brexit-specific question in a cross-country dataset such as the Eurobarom-
eter, we use a proxy variable to capture respondents’ attitudes towards the EU instead. This
is not necessarily a limitation. Given the heated campaign leading up to this vote, as well
as the ongoing equally heated debate on this matter, focusing on a Brexit-specific question
could possibly make some respondents reluctant to reveal their true preference and/or sen-
timents towards the matter (Berinsky, 1999) and avoid being labelled as a ‘Brexiteer’ or a
‘Remainer’. A question on wider attitudes towards the EU might, thus, be considered to be
appropriate.
This variable is available in only some of these waves and captures respondents’ feelings
of being an EU citizen given by the response to the following question “You feel you are a
9 Note that as of 2004 the Eurobarometer does not include a question on income. We proxy, to someextent, the relationship between subjective well-being and income by including a subjective measure ofsocial status (“Do you see yourself and your household belonging to: (a) working class, (b) lower middleclass, (c) middle class, (d) upper middle class, or (e) higher class?”). Such measures have been shown toreflect respondents’ relative socio-economic status as compared to their peers or to their own past situation,and arguably are a more important determinant of subjective well-being than absolute income (Ferrer-i-Carbonell, 2005; Luttmer, 2005; Clark et al., 2008; Cheung and Lucas, 2016).
6

citizen of the EU: Yes, definitely; Yes, to some extent; No, not really; No, definitely not”.10
We assume it is unlikely for a respondent in the UK with broadly positive feelings of being
an EU citizen to have a preference for Brexit, and for a respondent with broadly negative
feelings to have a preference for Remain.
We use this measure to split the UK sample in heterogeneous sub-groups, each of which
are then interacted with the post-treatment indicator. This specification is given in equation
3:
SWBicmt = β0 + β1UKV eryPosic × PostBrexitmt + β2UKPosic × PostBrexitmt+
+β3UKNegic × PostBrexitmt + β4UKV eryNegic × PostBrexitmt+
+β5UKV eryPosic + β6UKPosic + β7UKNegic + β8UKV eryNegic+
+β9PostBrexitmt +Macrocmt +X ′icmtΓ+ φc + κm + ξt + uicmt
(3)
We then test for adaptation following the Brexit vote for each group of respondents based
on this measure.
2.2 Spillover Effects
Our final model considers the international implications of the UKs referendum for EU
membership. There is no precedent of a country exiting the EU11; thus the Brexit vote
is, arguably, capable of having socio-economic and political implications that might have a
spillover effect on subjective well-being of other EU member countries.
Examples of such an approach include Kim and Kim (2018) who test the effects of the
Charlie Hebdo shooting on mental health in France, and also consider the spillover effects
of this adverse event on neighbouring countries (Belgium, Germany, and Switzerland); and
Dolan et al. (2016) who, in an approach similar in spirit to ours, estimate the subjective
well-being impact of hosting the 2012 Olympics in London (treatment group) compared to
Paris and Berlin (pooled control group), and then subsequently include Paris as a separate
treatment, in addition to London, due to its earlier interest and bid to host the 2012 Games
and keep only Berlin as the control group.
Determining the countries that Brexit could have a spillover effect on is not as trivial
an exercise and is an approach that is susceptible to speculative arguments. For example,
in contrast to Kim and Kim (2018), we do not have any prior reason to believe that neigh-
bouring countries are necessarily more closely related to the UK and, consequently, more
likely to be affected in this setting; thus, a distance-based measure seems to be a rather
inappropriate approach here. Moreover, even if countries plausibly affected by Brexit could
10Waves including this question are: 83.3 (May 2015); 84.3 (Nov 2015); 85.2 (May 2016); 86.2 (Nov 2016);87.3 (May 2017); and 88.3 (Nov 2017).
11Greenland, that left the then European Economic Community in 1985, is a constituent country of theKingdom of Denmark.
7

be identified, the spillover effect flowing to these might differ in terms of intensity.
Here, our approach towards spillover effects is summarised as follows. With much of
the discussion on Brexit being within the sphere of its economic consequences, we consider
spillover effects in terms of measures of economic integration between the UK and other EU
countries. Our review of the literature in this topic identified three main papers which we
consider for completeness and robustness purposes. These include Chen et al. (2018a), who
develop a measure capturing trade links between the UK and the EU; Dhingra et al. (2017),
who develop a measure accounting for trade and fiscal transfers; and an IMF report (Chen
et al., 2018b), which develops a more comprehensive measure accounting for trade, financial
linkages, and migration.
Rather than applying subjective cut-off points to allocate countries in different groups
of intensity to Brexit, we overcome this challenge by splitting each measure into four groups
of countries depending on the quartiles of the respective distributions of those measures.
Finally, we include the top three quartiles given by each index as separate treatment effects
and estimate our DiD model with the first, least ‘exposed’, quartile being the reference
group. Our model of spillover effects extends the baseline specification and is given in
equation 4:
SWBicmt = β0 + β1UKic × PostBrexitmt + β2Q2ic × PostBrexitmt + β3Q3ic × PostBrexitmt+
+β4Q4ic × PostBrexitmt + β5UKic + β6Q2ic + β7Q3ic + β8Q4ic + β9PostBrexitmt+
+Macrocmt +X ′icmtΓ+ φc + κm + ξt + uicmt
(4)
where Qjj=[2,4] are time-invariant dummy variables takes the value of one if the respon-
dent was interviewed in the country whose economy is ‘highly linked’ (Q4), ‘linked’ (Q3),
and ‘not linked’ (Q2) to the UK; and zero otherwise. ‘Least linked’ (Q1) being the reference
group of countries.
Further note that in considering a different potential set of countries for the control
group resulting under Q1 for each index, this specification implicitly serves as a robustness
test to our baseline model.
2.3 Identifying Assumptions
The key identifying assumption of the DiD design is that—controlling for the variables we
noted previously—the treatment group would have similar trends to the control group in
the absence of the treatment; that is, in the absence of the referendum taking place.
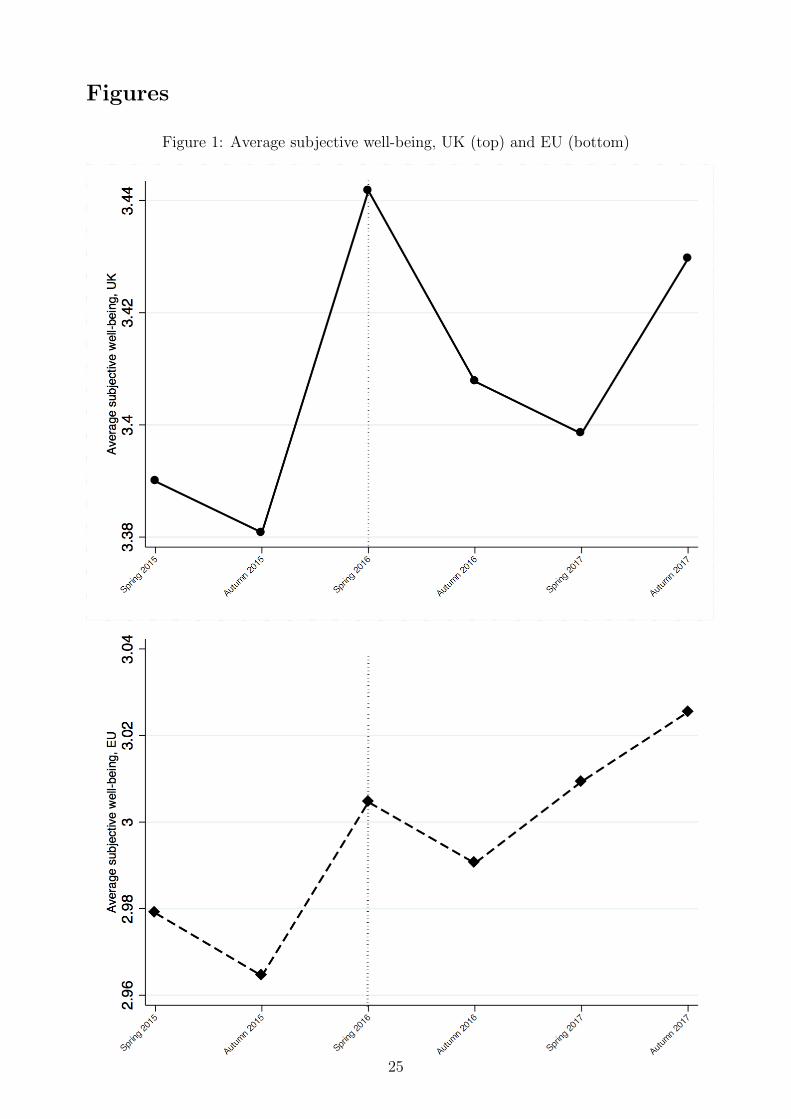
The pre-treatment period in Figure 1 offers some prima facie evidence of similar trends
between subjective well-being in the UK and the that of the remaining EU countries. We
proceed by estimating placebo-time treatment regressions at different points in time pre-
referendum as the means of providing more robust empirical evidence on the trend between
8

control and treatment pre-referendum. As most pre-treatment surveys are only weeks apart,
we pool them together as follows: those conducted during spring 2015 (i.e., the surveys
included in Eurobarometer 83 (83.1, 83.3, 83.4)); the survey carried out in autumn 2015
(i.e., 84.3); and those conducted during Spring 2016 (i.e., Eurobarometer 85 surveys (85.1,
85.2 and 85.3)). We then estimate five equation 1-type models between waves 85 vs. 84, 84
vs. 83, 85 vs. 83, 85 vs. 83 and 84 pooled, and finally 84 and 85 pooled vs. 83.
If the DiD identifying assumption holds, there should be no statistically significant dif-
ference in the estimated coefficient between the treatment and the control group in these
placebo-time treatment regressions. This is indeed what we find in all cases we examine,
suggesting that the identifying assumption holds; see Table A1 in the appendix.
3 Results
3.1 Graphical evidence
In Figure 1 we graph average subjective well-being for the UK and for the EU27 over the
span of our sample. Treatment and control follow the same trend before the referendum.
In the immediate period following the referendum (autumn 2016), we observe a pronounced
drop in subjective well-being in the UK as compared to the EU, with a further decrease
being observed about a year after the referendum (spring 2017). Subjective well-being in
the UK appears to be improving by autumn 2017.
Figure 2 shows average subjective well-being right before (spring 2016) and right after
(autumn 2016) the referendum, in the UK and the EU27. Although we are comparing two
time periods spanning over different seasons of the year, we are interested in the immediate
effect the Brexit vote had on different groups of people, based on their feelings of being an
EU citizen.
Individuals who definitely do not feel they are an EU citizen report higher levels of
subjective well-being on average in autumn 2016 as compared to spring 2016 (3.275 before
and 3.435 after), while those who definitely do feel they are an EU citizen report lower levels
(3.541 before and 3.457 after). The direction of these average changes for these groups on
either end of the spectrum provides some first evidence of an alignment between preference
utility and experience utility.
Those with less strong feelings show smaller changes on average. The subjective well-
being of those who say they do not really feel they are an EU citizen remained about the
same (3.386 before; 3.382 after) and of those who do feel an EU citizen to some extent
demonstrated a decrease (from 3.478 to 3.450), which was, however, smaller than the de-
crease reported by those with a very positive attitude towards the EU.
In contrast, average subjective well-being exhibits small changes in between these two
periods in the EU27. Here, there is an increase for people who definitely do not feel they
are an EU citizen (2.475 before; 2.527), but this increase is much lower than in the UK,
9

both in absolute and percentage terms. Subjective well-being of those who answered that
they definitely or to some extent feel they are an EU citizen remained practically the same
(definitely: 3.232 before; 3.230 after. To some extent: 3.006 before; 3.001 after), as opposed
to the decrease observed in both groups within the UK. Those not really feeling citizens
of the EU reported an increase (2.747 before; 2.797 after) as opposed to a practically no
change within the UK.
3.2 Regression Results
Table 1, columns 1 and 2, present the baseline regression estimates for equation 1 , where
we initially estimate our model without the inclusion of macroeconomic controls. Compared
to the pre-Brexit period, subjective well-being in the UK decreases significantly post-Brexit
by 0.062 points (column 1) and by 0.055 points once macroeconomic controls are considered
(column 2).
Table 1, columns 3 and 4, present a similar set of results testing for adaptation to the
Brexit result based on the estimation of equation 2. The effect of the Brexit result appears
to become even more pronounced in the short term (from autumn 2016 to spring 2017) and
there does not seem to be evidence of adaptation within the span of our sample although
the effect is somewhat smaller by autumn 2017. More specifically, focusing on the more
complete model that includes macroeconomic controls (column 4), in autumn 2016, a few
months following the referendum, subjective well-being in the UK decreased by 0.032 points.
This coefficient broadly doubled in the spring (-0.078) and autumn (-0.064) of the following
year.
Next, we test for heterogeneous effects based on UK respondents’ feelings of being an
EU citizen, given by equation 3. The results, shown in Table 2 column 1, suggest that the
overall decrease in subjective well-being in the UK estimated previously stems from those
with positive feelings. In fact, the effect is larger (in absolute terms) the more positive one’s
feelings are; for example, it more than doubles from the ‘positive’ to the ‘very positive’
categories. On the contrary, we do not find significant differences in subjective well-being
for those with a negative attitude towards the EU.
Table 2, column 2, presents heterogeneous effects on adaptation to the Brexit result. The
effect on subjective well-being generally seems to consistently become more pronounced
over time for those with overall positive (i.e., the ‘very positive’ and ‘positive’ groups)
feelings of being an EU citizen, thus are far from showing any signs of adaptation. The
interesting finding here arises for those ‘definitely not feeling’ a citizen of the EU (the ‘very
negative’ group). For these individuals, we find a significant increase in subjective well-
being in autumn 2016, arguably capturing the satisfaction of their preferences following
the referendum’s result. This increase (0.114) is about as large (in absolute terms) as the
decrease in subjective well-being for the ‘very positive’ group (-0.125) over the same time
period (i.e. autumn 2016). By spring 2017, however, the sign of this coefficient reverses to
10
a significant reduction, and this might be due to either to some sort of distress or unmet
expectation resulting from the exit negotiations. The effect turns statistically insignificant
by autumn 2017.
Given these heterogeneous effects of the Brexit result in the UK, the question that
naturally arises is whether subjective well-being of UK respondents with a certain feeling
towards being an EU citizen is significantly different from that of their EU counterparts
with whom they share the same feelings. We answer this question by separately stratifying
the sample by respondents’ feelings and re-estimating equation 1. Results are presented in
Table 3 and suggest that UK respondents with overall positive feelings (columns 1-2) are
significantly less satisfied with their life compared to their EU counterparts. The reverse
does not appear to be the case for those holding overall negative feelings (columns 3 and 4),
whose subjective well-being is not significantly different even when compared to that of EU
respondents holding equally negative feelings.
3.3 Spillover Effects
This section presents the results for potential spillover effects of Brexit. We consider three
measures based on Chen et al. (2018a), Dhingra et al. (2017), and the IMF (Chen et al.,
2018b). The country-composition of each measure is slightly different. The IMF’s includes
all 27 countries in our sample and, compared to the other two, is a more comprehensive
measure which accounts for trade, financial linkages, and migration. Chen et al.’s (2018a)
includes 26 countries in our sample, with the exception of Croatia (correlation coefficient
with IMF’s measure is 0.865). Dhingra et al.’s (2017) includes 19 countries in our sample,
with the exception of Bulgaria, Croatia, Cyprus, Estonia, Latvia, Lithuania, Luxembourg,
and Malta. It also considers the effects of a “soft” and “hard” Brexit—a terminology used to
determine the success of the exit negotiations between the UK and the EU (correlation coef-
ficient with IMF’s measure is 0.987 and 0.99 under a “soft” and “hard” Brexit, respectively);
we consider both scenarios for completeness and for robustness purposes.
Table 4 lists the countries included in each measure, split into four quartile groups based
on the distribution of each measure: from least affected (bottom quartile, Q1) to most
affected (upper quartile, Q4). The quartile split of each measure results in similarities, but
also important differences. For example, Greece, Romania and Slovenia are consistently in
Q1 across all measures considered; as is the case for the Czech Republic and Sweden in Q2
and Belgium, Ireland and the Netherlands in Q4. Some notable differences include Cyprus
(which falls under Q1 in Chen et al. (2018a), but under Q4 in IMF’s measure) and Poland
(which falls under Q3 in Chen et al. (2018a) and Dhingra et al. (2017), but under Q1 in
IMF’s measure). In the majority of cases however, countries switch by one quartile group
between the different measures.
Table 5 reports the estimated results following the estimation of equation 4. Note that
the estimate of our main treatment effect, UK ×Post Brexit, is robust and even somewhat
11

more pronounced to that of the baseline model (Table 1, column 2). The effect of the
Brexit result in the UK is somewhat reduced when considering the Dhingra et al. index,
which is however based on a smaller sample of countries. Given each measure’s different
composition of countries within the first quartile group (Q1) acting as the reference group,
these estimates offer robust and compelling evidence of the effect of the Brexit result on
subjective well-being in the UK.
Overall and across measures, the spillover estimates do not suggest that the Brexit result
has a significant effect in the subjective well-being of other countries irrespective of their
degree of association to the UK. The only exception within this investigation is the fourth
quartile under the Chen et al. (2018a) index; for this group of countries more closely related
to the UK, Brexit led to a significant reduction in subjective well-being. This effect is not
negligible and is about half the effect estimated for the UK.
3.4 Robustness
As discussed, the estimates of our main treatment effect are robust to the inclusion of
macroeconomic controls and to different compositions of a reference group, as evidenced in
the spillover regressions. In this section, we offer additional robustness tests.
First, we estimate heterogeneous effects of the Brexit result on subjective well-being,
using a different proxy variable to capture respondents attitudes towards the EU. In doing
so, we rely on a variable given by the response to the following question: “In general, does
the EU conjure up for you a very positive, fairly positive, neutral, fairly negative or very
negative image?”; a question included in every wave in our sample.12 Second, we repeat
the spillover regressions using five groups of countries, with cut-off points based on quintiles
of the distribution of each measure, rather than quartiles. Third, we repeat our main
specification by considering placebo outcomes; that is, outcomes which we do not expect
the Brexit result to have an effect upon.
Overall, the results presented in this section reinforce our findings regarding the effect
of the Brexit vote on subjective well-being.
3.4.1 Heterogeneity: Image towards the EU
Table 6, column 1, shows the heterogeneous effects based on individuals’ EU image. The
results are consistent between this and our original measure of feeling an EU citizen, and
suggest that subjective well-being decreased for those being positive towards EU. Similar
to the main estimate, this is not the case for the ones having a negative image towards the
EU. Results further suggest a significant decrease in subjective well-being for those with a
neutral image towards the EU; though smaller in absolute terms as compared to that of the
‘positive’ groups.
12 Note that the correlation coefficient between feeling a citizen of the EU’ and ‘image towards the EU’is 0.44.
12

Table 6, Column 2, presents adaptation estimates based on this measure. The interpre-
tation of these estimates is similar to those in the main analysis. Here, we do not generally
find significant estimates for those with a ‘very negative’ EU image, but we do find a signifi-
cant reduction in reported subjective well-being for those in the ‘negative’ group by autumn
2017.
Stratifying the sample depending on this measure produces similar results as those pre-
sented in Table 3: UK respondents with an overall positive and also neutral image towards
the EU are significantly less satisfied with their life compared to their EU counterparts. The
reverse does not appear to be the case for those holding a negative attitude, whose subjec-
tive well-being is not significantly different even when compared to that of EU respondents
holding an equally negative image towards the EU.13
3.4.2 Spillover effects on quintiles of exposure
Results for the spillover effects based on quintiles are reported in Table 7; a list of countries
included in each quintile, by measure, is provided in Table A2 in the appendix.
The results hold a similar interpretation as above, with the Brexit vote generally not
having spillover effects other than for, now, the two top quintiles (Q4 and Q5) interaction
effects only for the case of the Chen et al. (2018a) measure. Under this specification, we
find increases in subjective well-being following the referendum for countries in Q2 for the
IMF measure. This result might be viewed as expectations of potential benefits, such as
businesses relocating their activities, accruing to this group of countries (Austria, Italy,
Portugal, Slovakia and Spain) following Brexit. In all cases, the estimate for our main
treatment effect is statistically significant and even more pronounced.
3.4.3 Placebo outcomes
For our placebo outcomes we consider two measures. The first is based on whether the
individual is in favour of a tax on financial transactions14 (available in Eurobarometer 83.1,
83.3, 84.3, 85.2, 86.2, 87.3 and 88.3), and the second whether he/she thinks that crime is
considered as an important issue in their country (available in Eurobarometer 83.3, 84.3,
85.2, 86.2, 87.3 and 88.3). The latter is a binary variable hence we estimate equation 1 using
a probit model.
Results, presented in Table 8, suggest that there are no significant differences for these
outcome measures following the Brexit result.15
13These results are available upon request.14Given by the question: “Thinking about reforming global financial markets, please tell me whether you
are in favour or opposed to the introduction of a tax on financial transactions”, with responses including‘stongly in favour, fairly in favour, fairly opposed, and strongly opposed’.
15Given the smaller samples in Table 8 due to data availability, note that the corresponding subjective well-being regressions following the estimation of an equation 1 model for these samples still yield a statisticallysignificant estimate for the main treatment effect, equal to -0.062 and -0.06 for the tax and crime models,respectively.
13

4 Discussion
Over recent decades there has been considerable interest in reports of subjective well-being
as a measure of individuals’ experienced utility. Whereas more direct democracy leads to
higher levels of subjective well-being (Frey and Stutzer, 2000), the evidence of the effect of
the resulting outcome on subjective well-being is still mixed. This paper studies the effect of
the Brexit referendum result on subjective well-being. The rather unexpected result of this
single-issue referendum is worth examining for at least two reasons. First, it has already had
an adverse effect in the UK economy (Johnson and Mitchell, 2017), with future projections
not being very positive16; second, it is a permenenent decision, which has implications for
the degree of adaptation to this outcome.
Using data from the Eurobarometer between 2015-2017 and applying a quasi-experimental
design, we find that life satisfaction post-referendum significantly decreased in the UK as a
whole as compared to a pool of other EU countries. This effect is robust to the inclusion
of macroeconomic controls. This estimate is not negligible; to put it in context, it is 1.3
times larger than the effect of widowhood on subjective well-being and about 1/6 of that
of unemployment (which is one of the largest significant adverse effects on subjective well-
being to which there is no adaptation—Lucas et al., 2004; Knabe and Ratzel, 2011). We do
not find evidence of adaptation to the referendums outcome, at least not within the span
of our sample. The overall reduction in subjective well-being does, however, appear to be
mitigated in the final wave of our data.
Estimating heterogeneous effects of the Brexit result by individuals’ attitudes towards the
EU—measured by one’s ‘feeling a citizen of the EU’—suggests that those with an overall
positive attitude report significantly lower levels of subjective well-being; with the effect
being more pronounced the more positive one’s EU attitude is. Under the assumption that
individuals with positive attitudes towards the EU do not have a preference for Brexit,
then these estimates are perhaps not as surprising. More importantly, and contrary to
other studies in the literature that find a rather fast adaptation process to electoral results
(Kinari et al., 2015; Pierce et al., 2016; Powdthavee et al., 2017), we do not generally find
their levels of subjective well-being to adapt within our time span. In addition to preferences
not being met, this might reflect the uncertainty that lie ahead as the country goes through
the transition period to exit the EU (Wilson and Gilbert, 2008).
Our results do not support the reverse for the case of those with negative attitudes
towards the EU; their estimates of subjective well-being are not statistically different com-
pared to the control group. To this extent, our findings are similar to Pierce et al. (2016)
who for the 2012 US Presidential election find the subjective well-being of ‘partisan losers’
(Republicans) to be negatively affected following the election, but that of ‘partisan winners’
(Democrats) remaining unaffected.
16See, for example, the Bank of England’s report commissioned by the House of Commons TreasuryCommittee, as well as a recent analysis by the UK Government. (November 2018)
14
Looking in more detail on the specific time periods following the referendum for these
individuals with overall negative attitudes towards the EU is, however, more informative.
Subjective well-being of those ‘definitely not feeling a citizen of the EU’ (‘very negative’
attitude) significantly increased in autumn 2016; that is, in the coming months following
the Brexit result. In relative terms, this increase in subjective well-being is about as large
as the decrease experienced by those with a very positive ‘feeling of being an EU citizen’
over the same time period (i.e., autumn 2016; see Table 2, column 2). This is in line
with Powdthavee et al. (2017) who find those with a stated preference for Brexit to be more
satisfied, and those with a stated preference for Remain to be less satisfied, post-referendum.
Our estimates suggest though that this positive effect is not sustained over time. It turns
significantly negative by spring 2017—perhaps reflecting some sort of a distress or unmet
expectations following the evolving exit negotiations and, even possibly a dissatisfaction from
deviating away from a ‘hard(er) Brexit’—and statistically insignificant by autumn 2017—
which could indeed be due to adaptation to this outcome as their underlying preference for
Brexit is being satisfied.
In our final model, we account for spillover effects of the Brexit result. We use three
measures of socio-economic integration to split our sample into quartiles based on the level
of a country’s link (or ‘exposure’) to the UK: a measure accounting only for trade links
(Chen et al., 2018a); one accounting for trade and fiscal transfers (Dhingra et al., 2017);
and one accounting for trade, financial linkages and migration, available from the IMF (Chen
et al., 2018b). We generally do not find strong evidence in favour of the presence of spillover
effects during the Brexit transition period, which appear to be present for the top quartile of
countries mostly related to the UK for only the case of the first (i.e., least inclusive) measure
considered here.
As the bottom quartile group—i.e., the control group in the spillover regressions—differs
across our three measures, these regressions serve implicitly as a robustness tests of our main
treatment effect. In all cases, the estimate for the effect of the Brexit result on subjective
well-being in the UK is negative and statistically significant. These results are robust to
dividing countries in quintiles, instead of quartiles, of the corresponding distribution of
countries’ linkage to the UK.
This study, like any other, is not free of limitations. The Eurobarometer data we use is
being broadly conducted in the spring and autumn of every year; with the EU membership
referendum taking place in July 2016, we do not estimate the immediate aftermath of the
Brexit result on subjective well-being. Further note that we do not have information on what
UK respondents in our sample voted for in the referendum, let alone whether they voted at
all. To the extent that those who do vote are considered to be rational utility maximisers,
information on their actual vote could allow us to more formally test the connection between
decision/preference and experienced utility in this setting.
These inferences are instead drawn based on general attitudes individuals in our sample
hold towards the EU; and although being rather unlikely, say, for a UK individual ‘feeling
15

being a citizen of the EU’ having a preference for Brexit, we cannot strictly exclude this
possibility for the reverse case of those individuals with a rather negative attitude towards
the EU. To illustrate, consider the case of a UK individual ‘definitely not feeling being
a citizen of the EU’. This might arise because of his/her dissatisfaction with certain EU
policies that are correlated with such feelings but not necessarily with a preference for
Brexit. This argument might indeed, partly, justify why our regression results estimate a
significant decrease in subjective well-being for those with a positive attitude towards the
EU (i.e., offering evidence of preference and experience utility coinciding), and no statistical
evidence—but in one occasion as discussed above—of a positive effect for those with a
negative attitude towards the EU despite the UK now ‘taking back control’. One should
also weigh this limitation of observing preferences towards Brexit against the possibility
of individuals feeling reluctant to state their sentiments in a Brexit-specific question, to
perhaps avoid being labelled as a ‘Brexiteer’ or a ‘Remainer’.
Notwithstanding these issues, this study offers robust evidence of an overall decrease in
subjective well-being for individuals in the UK during the Brexit transition period. With the
UK set to formally exit the EU in March 2019, the long-term effects of Brexit on subjective
well-being will undoubtedly be the focus of future research.
16

Tables
Table 1: Brexit result and subjective well-being
(1) (2) (3) (4)
UK×Post Brexit -0.062*** -0.055***
(0.013) (0.014)
UK×Autumn 2016 -0.034** -0.032**
(0.015) (0.015)
UK×Spring 2017 -0.082*** -0.078***
(0.012) (0.012)
UK×Autumn 2017 -0.075*** -0.064***
(0.014) (0.016)
UK 0.527*** 0.474*** 0.527*** 0.476***
(0.014) (0.027) (0.014) (0.027)
Autumn 2016 -0.018 -0.016
(0.016) (0.027)
Spring 2017 0.049*** 0.032**
(0.01) (0.013)
Autumn 2017 0.015 0.015
(0.014) (0.016)
Post Brexit -0.008 -0.005
(0.012) (0.012)
Controls Yes Yes Yes Yes
Macroeconomic Controls No Yes No Yes
R2 0.28 0.28 0.28 0.28
N 366,928 366,928 366,928 366,928
Notes: Regressions are OLS based on Eq. 1 (columns 1 and 2) and Eq.
2 (columns 3 and 4); without and with macroeconomic controls. Controls
include: individual characteristics, country effects, month of the year effects,
and year effects. Robust standard errors clustered at the country-wave level
reported in parentheses.
*** p < 0.01, ** p < 0.05
17
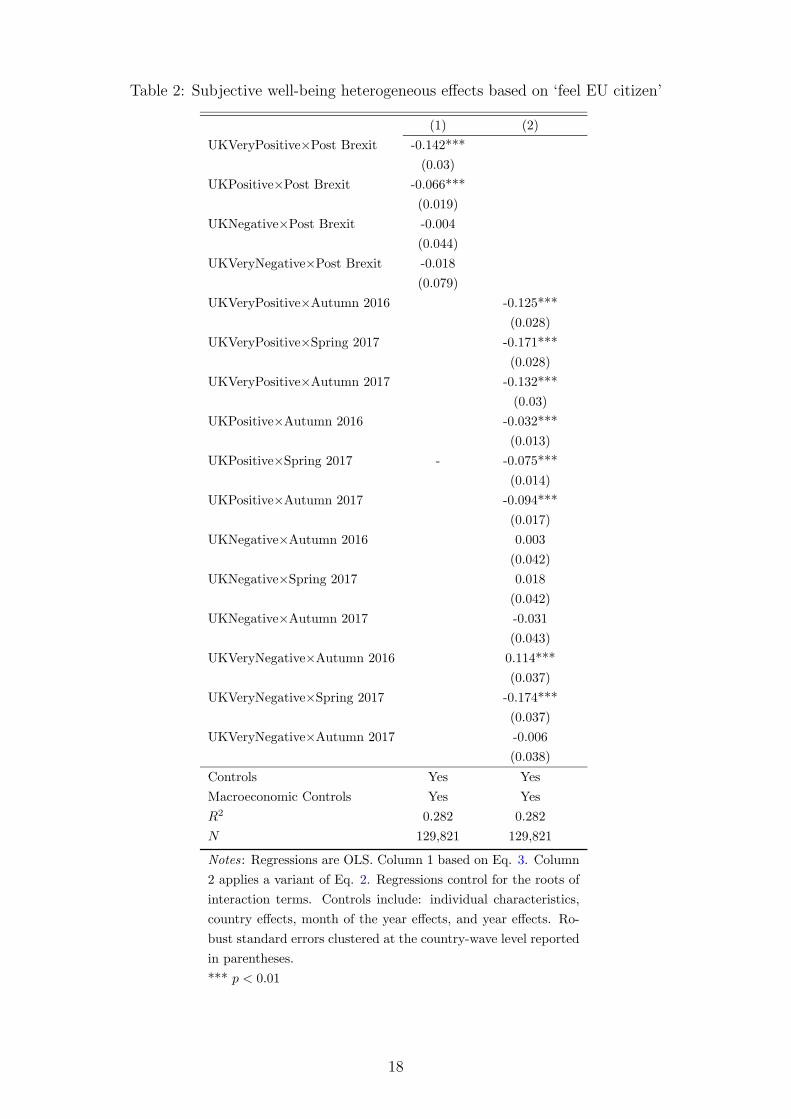
Table 2: Subjective well-being heterogeneous effects based on ‘feel EU citizen’
(1) (2)
UKVeryPositive×Post Brexit -0.142***
(0.03)
UKPositive×Post Brexit -0.066***
(0.019)
UKNegative×Post Brexit -0.004
(0.044)
UKVeryNegative×Post Brexit -0.018
(0.079)
UKVeryPositive×Autumn 2016 -0.125***
(0.028)
UKVeryPositive×Spring 2017 -0.171***
(0.028)
UKVeryPositive×Autumn 2017 -0.132***
(0.03)
UKPositive×Autumn 2016 -0.032***
(0.013)
UKPositive×Spring 2017 - -0.075***
(0.014)
UKPositive×Autumn 2017 -0.094***
(0.017)
UKNegative×Autumn 2016 0.003
(0.042)
UKNegative×Spring 2017 0.018
(0.042)
UKNegative×Autumn 2017 -0.031
(0.043)
UKVeryNegative×Autumn 2016 0.114***
(0.037)
UKVeryNegative×Spring 2017 -0.174***
(0.037)
UKVeryNegative×Autumn 2017 -0.006
(0.038)
Controls Yes Yes
Macroeconomic Controls Yes Yes
R2 0.282 0.282
N 129,821 129,821
Notes: Regressions are OLS. Column 1 based on Eq. 3. Column
2 applies a variant of Eq. 2. Regressions control for the roots of
interaction terms. Controls include: individual characteristics,
country effects, month of the year effects, and year effects. Ro-
bust standard errors clustered at the country-wave level reported
in parentheses.
*** p < 0.01
18

Table 3: Effects of Brexit result onnsubjective well-being, stratified by ‘feel EU citizen’
(1) (2) (3) (4)
Very Positive Positive Negative Very Negative
UK×Post Brexit -0.124*** -0.048*** 0.007 -0.012
(0.03) (0.016) (0.054) (0.066)
UK 0.338*** 0.457*** 0.44*** 0.566***
(0.051) (0.053) (0.067) (0.108)
Post Brexit 0.001 0.002 0.041 0.051
(0.017) (0.017) (0.022) (0.041)
Controls Yes Yes Yes Yes
Macroeconomic Controls Yes Yes Yes Yes
R2 0.206 0.246 0.296 0.325
N 36,155 54,370 27,083 12,213
Notes: Regressions are OLS based on Eq. 1 with stratified samples depending
on responses to the ‘feel EU citizen’ measure. Controls include: individual char-
acteristics, country effects, month of the year effects, and year effects. Robust
standard errors clustered at the country-wave level reported in parentheses.
*** p < 0.01
19

Table 4: Exposure measures — quartiles
Chen et al. (2018a) Dhingra et al. (2017) IMF
Soft Brexit Hard Brexit (Chen et al., 2018b)
Quartile
Q1 Bulgaria Greece Greece Austria
Cyprus Italy Italy Bulgaria
Greece Romania Romania Croatia
Italy Slovenia Slovenia Greece
Portugal Spain Spain Poland
Romania Romania
Slovenia Slovenia
Q2 Austria Austria Austria France
Estonia Finland Finland Italy
Finland France France Lithuania
Latvia Portugal Portugal Luxembourg
Lithuania Slovakia Slovakia Portugal
Spain Slovakia
Spain
Q3 Czech Rep. Czech Rep. Czech Rep. Czech Rep.
Denmark Germany Denmark Estonia
Hungary Hungary Germany Finland
Luxembourg Poland Poland Germany
Poland Sweden Sweden Hungary
Slovakia Latvia
Sweden Sweden
Q4 Belgium Belgium Belgium Belgium
France Denmark Hungary Cyprus
Germany Ireland Ireland Denmark
Ireland Netherlands Netherlands Ireland
Malta Malta
Netherlands Netherlands
Notes: Chen et al.’s (2018a) measure includes 26 countries within our sample (except
Croatia); Dhingra et al.’s (2017) includes 19 countries (except: Bulgaria, Croatia,
Cyprus, Estonia, Latvia, Lithuania, Luxembourg, Malta); IMF’s (Chen et al., 2018b)
includes all 27 countries in our sample. Countries in bold fonts appear consistently in
the same distributional quartile across measures.
20

Table 5: Spillover effects based on quartiles
Chen et al. (2018a) Dhingra et al. (2017) IMF
Soft Brexit Hard Brexit (Chen et al., 2018b)
UK×Post Brexit -0.068*** -0.047** -0.046** -0.06***
(0.019) (0.021) (0.021) (0.019)
Q2×Post Brexit -0.016 0.027 0.027 0.009
(0.016) (0.019) (0.02) (0.017)
Q3×Post Brexit -0.015 0.001 0.001 -0.01
(0.016) (0.018) (0.018) (0.015)
Q4×Post Brexit -0.032** -0.009 -0.008 -0.022
(0.015) (0.018) (0.019) (0.015)
UK 0.912*** 0.931*** 0.938*** 0.575***
(0.116) (0.02) (0.125) (0.098)
Q2 0.214*** 0.497*** 0.507*** 0.088
(0.039) (0.143) (0.138) (0.099)
Q3 0.312*** 0.337*** 0.338*** -0.033
(0.051) (0.033) (0.032) (0.027)
Q4 0.477*** 0.902*** 0.101*** 0.342***
(0.125) (0.249) (0.031) (0.05)
Post Brexit 0.007 -0.005 -0.006 -0.001
(0.017) (0.02) (0.02) (0.017)
Controls Yes Yes Yes Yes
Macroeconomic controls Yes Yes Yes Yes
R2 0.286 0.289 0.289 0.028
N 353,040 280,841 280,841 366,928
Notes: Regressions are OLS based on Eq. 4. Chen et al.’s (2018a) measure based on 26 countries;
Dhingra et al.’s (2017) measure based on 19 countries; IMF’s (Chen et al., 2018b) measure based on
all 27 countries in our sample. Controls include: individual characteristics, country effects, month
of the year effects, and year effects. Robust standard errors clustered at the country-wave level
reported in parentheses.
*** p < 0.01, ** p < 0.05
21

Table 6: Heterogeneous effects based on ‘EU image’
(1) (2)
UKVeryPositive×Post Brexit -0.107***
(0.036)
UKPositive×Post Brexit -0.075***
(0.017)
UKNeutral×Post Brexit -0.058***
(0.021)
UKNegative×Post Brexit -0.051
(0.028)
UKVeryNegative×Post Brexit -0.039
(0.058)
UKVeryPositive×Autumn 2016 -0.062
(0.045)
UKVeryPositive×Spring 2017 -0.185***
(0.034)
UKVeryPositive×Autumn 2017 -0.09***
(0.033)
UKPositive×Autumn 2016 -0.054***
(0.016)
UKPositive×Spring 2017 -0.082***
(0.015)
UKPositive×Autumn 2017 -0.091***
(0.024)
UKNeutral×Autumn 2016 -0.043***
(0.018)
UKNeutral×Spring 2017 -0.105***
(0.018)
UKNeutral×Autumn 2017 -0.042
(0.026)
UKNegative×Autumn 2016 -0.031
(0.034)
UKNegative×Spring 2017 -0.054
(0.028)
UKNegative×Autumn 2017 -0.07**
(0.03)
UKVeryNegative×Autumn 2016 0.007
(0.056)
UKVeryNegative×Spring 2017 -0.056
(0.012)
UKVeryNegative×Autumn 2017 -0.069
(0.072)
Controls Yes Yes
Macroeconomic Controls Yes Yes
R2 0.28 0.28
N 362,083 362,083
Notes: Regressions are OLS. Column 1 based on Eq. 3. Column 2 applies a variant
of Eq. 2. Regressions control for the roots of interaction terms. Controls include:
individual characteristics, country effects, month of the year effects, and year effects.
Robust standard errors clustered at the country-wave level reported in parentheses.
*** p < 0.01, ** p < 0.05
22

Table 7: Spillover Effects based on quintiles
Chen et al. (2018a) Dhingra et al. (2017) IMF
Soft Brexit Hard Brexit (Chen et al., 2018b)
UK×Post Brexit -0.07*** -0.057** -0.056** -0.053***
(0.018) (0.022) (0.022) (0.02)
Q2×Post Brexit -0.003 0.011 0.014 0.048***
(0.019) (0.023) (0.023) (0.018)
Q3×Post Brexit -0.025 0.001 -0.001 -0.019
(0.016) (0.02) (0.02) (0.018)
Q4×Post Brexit -0.029** -0.016 -0.016 -0.001
(0.015) (0.019) (0.019) (0.017)
Q5×Post Brexit -0.032** -0.027 -0.028 -0.019
(0.015) (0.019) (0.019) (0.017)
UK 0.931*** 0.357*** 0.353*** 0.573***
(0.116) (0.069) (0.069) (0.098)
Q2 0.267*** -0.555*** -0.077 -0.043
(0.038) (0.067) (0.08) (0.031)
Q3 0.323*** -0.068 -0.232 0.102
(0.051) (0.008) (0.024) (0.098)
Q4 0.493*** -0.449*** -0.448*** -0.034
(0.127) (0.049) (0.049) (0.036)
Q5 0.664*** 0.304 0.297 0.343***
(0.061) (0.186) (0.186) (0.05)
Post Brexit 0.009 0.005 0.005 -0.008
(0.016) (0.021) (0.021) (0.018)
Controls Yes Yes Yes Yes
Macroeconomic controls Yes Yes Yes Yes
R2 0.286 0.289 0.289 0.028
N 353,040 280,841 280,841 366,928
Notes: Regressions are OLS based on Eq. 4. Chen et al.’s (2018a) measure based on 26 countries;
Dhingra et al.’s (2017) measure based on 19 countries; IMF’s (Chen et al., 2018b) measure based on
all 27 countries in our sample. Controls include: individual characteristics, country effects, month
of the year effects, and year effects. Robust standard errors clustered at the country-wave level
reported in parentheses.
*** p < 0.01, ** p < 0.05
23

Table 8: Placebo outcomes
Tax Financial Crime
Transactions
UK×Post Brexit 0.03 0.061
(0.03) (0.056)
UK -0.276*** -0.174
(0.069) (0.096)
Post Brexit 0.231*** -0.137**
(0.03) (0.056)
Controls Yes Yes
Macroeconomic Controls Yes Yes
R2 0.098
Pseudo R2 0.046
N 110,390 157,877
Notes: Column 1 regression is OLS based on Eq. 1. Column 2
regression is a probit of Eq. 1 given the binary outcome. Controls
include: individual characteristics, country effects, month of the
year effects, and year effects. Robust standard errors clustered
at the country-wave level reported in parentheses.
*** p < 0.01, ** p < 0.05
24
Figures
Figure 1: Average subjective well-being, UK (top) and EU (bottom)
25
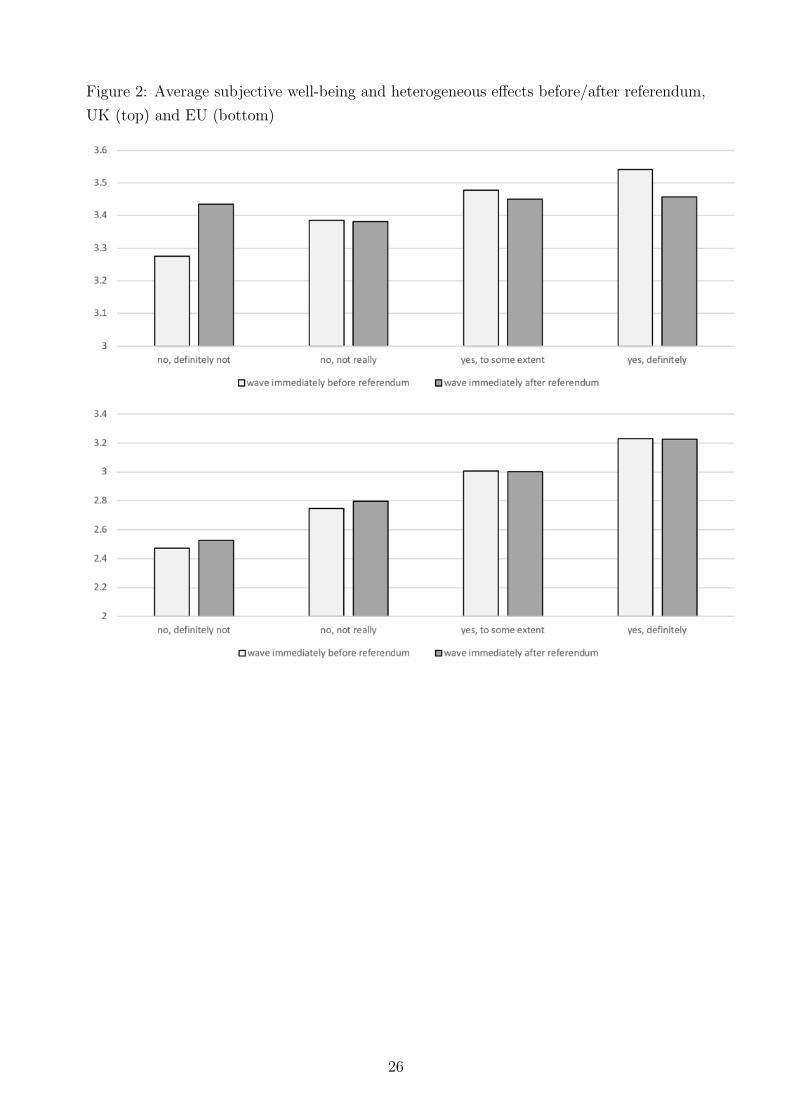
Figure 2: Average subjective well-being and heterogeneous effects before/after referendum,
UK (top) and EU (bottom)
26

References
Adler, M.D. (2013) Happiness surveys and public policy: What’s the use? Duke Law
Journal, 62, 1509-1601.
Benjamin, D. J., O. Heffetz, M. S. Kimball, and A. Rees-Jones (2012) What do you
think would make you happier? What do you think you would choose?. American
Economic Review, 102, 2083-2110.
Benjamin, D.J., O. Heffetz, M.S. Kimball, and A. Rees-Jones (2014) Can marginal
rates of substitution be inferred from happiness data? Evidence from residency choices.
American Economic Review, 104, 3498-3528.
Berinsky, A.J. (1999) The two faces of public opinion. American Journal of Political
Science, 43, 1209-1230.
Boyce, C.J., A.M. Wood, J. Banks, A.E. Clark, and G.D.A. Brown (2013) Money,
well-being, and loss-aversion: Does an income lass have a greater effect on well-being
than an equivalent income gain? Psychological Science, 24, 2557-2562.
Bradford, W.D., and P. Dolan (2010) Getting used to it: The adaptive global utility
model. Journal of Health Economics, 29, 811-820.
Breinlich, H., E. Leromain, D. Novy, and T. Sampson (2016b) The Brexit vote, infla-
tion and UK living standards. Centre for Economic Performance, CEP Brexit Analysis
No. 11. London School of Economics.
Breinlich, H., S. Dhingra, T. Sampson, and J. Van Reenen (2016a) Who bears the
pain? How the costs of Brexit would be distributed across income groups. Centre for
Economic Performance, CEP Brexit Analysis No. 7. London School of Economics.
Chen, J., C. Ebeke, L. Lin, H. Qu, H. Schoelermann, and J. Siminitz (2018b) Euro
area policies: Long-term impact of Brexit on the EU. International Monetary Fund
(IMF). July 2018.
Chen, W., L. Bart, P. McCann, R. Ortega-Argils, M. Thissen, and F. van Oort (2018a)
The continental divide? Economic exposure to Brexit in regions and countries on both
sides of The Channel. Papers in Regional Science, 97, 25-54.
Cheung, F., and Lucas, R. (2016). Income inequality is associated with stronger
social comparison effects: The effect of relative income on life satisfaction. Journal of
Personality & Social Psychology, 110, 332-341.
Clark, A. E., P. Frijters, and M.A. Shields (2008). Relative income, happiness, and
utility: An explanation for the Easterlin paradox and other puzzles. Journal of Eco-
nomic Literature, 46, 95-144.
27

De Neve, J.E., G. Ward, F. De Keulenaer, B. Van Landeghem, G. Kavetsos, and M.I.
Norton (2018) The asymmetric experience of positive and negative economic growth:
Global evidence using subjective well-being data. Review of Economics & Statistics,
100, 362-375.
Dhingra, S., H. Huang, G. Ottaviano, J.P. Pessoa, T. Sampson, and J. Van Reenen
(2017) Trade and Brexit: The costs and benefits of leaving the EU - Trade effects.
Economic Policy, 651-705.
Di Tella, R., R. MacCulloch, and A.J. Oswald (2001) Preferences over inflation and
unemployment: Evidence from surveys of happiness. American Economic Review, 91,
335-341.
Di Tella, R., and R. MacCulloch (2005) Partisan social happiness. Review of Economic
Studies, 72, 367-393.
Dolan, P., and D. Kahenman (2008) Interpretations of utility and their implications
for the valuation of health. Economic Journal, 118, 215-234.
Dolan, P., Kavetsos, G., Krekel, C., Mavridis, D., Metcalfe, R., Senik, C., Szymanski,
S., Ziebarth, N.R., 2016. The Host with the Most? The Effects of the Olympic Games
on Happiness. CEP Discussion Paper No. 1441, London School of Economics.
Ferrer-i-Carbonell, A. (2005) Income and well-being: An empirical analysis of the
comparison income effect. Journal of Public Economics, 89, 997-1019.
Frey, B.S., and A. Stutzer (2000) Happiness, economy and institutions. Economic
Journal, 110, 918-938.
Herrin, J., D. Witters, B. Roy, C. Riley, D. Liu, and H.M. Krumholz (2018) Population
well-being and electoral shifts. PLoS ONE, 13: e0193401.
HM Treasury (2011) The Green Book: Appraisal and Evaluation in Central Govern-
ment. HM Treasury, UK.
Johnson, P., and I. Mitchell (2017) The Brexit vote, economics, and economic policy.
Oxford Review of Economic Policy, 33, S12-S21.
Kahneman, D., P. Wakker, and R. Sarin (1997) Back to Bentham? Explorations of
experience utility. Quarterly Journal of Economics, 112, 375-406.
Kassenboehmer, S.C., and J.P. Haisken-DeNew (2009) You’re fired! The causal nega-
tive effect of entry unemployment on life satisfaction. Economic Journal, 119, 448-462
28

Kierzenkowski R., N. Pain, E. Rusticelli, and S. Zwart (2016) The Economic Conse-
quences of Brexit: A Taxing Decision, OECD Economic Policy Papers, No. 16, OECD
Publishing, Paris.
Kim, D., and Y.A. Kim (2018) Mental health cost of terrorism: Study of the Charlie
Hebdo attack in Paris. Health Economics, 27, e1-e14.
Kinari, Y., F. Ohtake, M. Kimball, S. Morimoto, Y. Tsutsui (2015) Happiness be-
fore and after an election: An analysis based on a daily survey around Japan’s 2009
Election. ISER Discussion Paper No. 924. Osaka.
Knabe, A. and S. Ratzel (2011) Scarring or scaring? The psychological impact of past
unemployment and future unemployment risk. Economica, 78, 283-293.
Levinson, A. (2012) Valuing public goods using happiness data: The case of air quality.
Journal of Public Economics, 96, 869-880.
Liberini, F., A.J. Oswald, E. Proto, and M. Redoano (2017b) Was Brexit caused by
the unhappy and the old? IZA Discussion Paper, No. 11059, September 2017.
Liberini, F., M. Redoano, and E. Proto (2017a) Happy voters. Journal of Public
Economics, 146, 41-57.
Loewenstein, G., and P.A. Ubel (2008) Hedonic adaptation and the role of decision
and experience utility in public policy. Journal of Public Economics, 92, 1795-1810.
Lucas, R.E., A.E. Clark, Y. Georgellis, and E. Diener (2004) Unemployment alters the
set point for life satisfaction. Psychological Science, 15, 8-13.
Luechinger, S., and P.A. Raschky (2009) Valuing flood disasters using the life satis-
faction approach. Journal of Public Economics, 93, 620-633.
Luechinger, S., S. Meier, and A. Stutzer (2010) Why does unemployment hurt the
employed? Evidence from the life satisfaction gap between the public and the private
sector. Journal of Human Resources, 45, 998-1045.
Luttmer, E.F.P. (2005) Neighbors as negatives: Relative earnings and well-being.
Quarterly Journal of Economics, 120, 963-1002.
Matsusaka, J.G. (2005) Direct democracy works. Journal of Economic Perspectives,
19, 185-206.
May, K. (1952) A set of independent necessary and sufficient conditions for simple
majority decision. Econometrica, 20, 680-684.
29
Metcalfe, R., P. Dolan, and N. Powdthavee (2008) Electing Happiness: Does Happiness
Affect Voting and do Elections Affect Happiness? Discussion Paper 08/30, Department
of Economics, University of York.
Metcalfe, R., N. Powdthavee, and P. Dolan (2011) Destruction and distress: Using a
quasi-experiment to show the effects of the September 11 attacks on mental well-being
in the United Kingdom. Economic Journal, 121, 81-103.
National Research Council (2013) Subjective Well-Being: Measuring Happiness, Suf-
fering, and Other Dimensions of Experience. Washington D.C. The National Academies
Press.
OECD (2013) OECD guidelines on measuring subjective well-being. OECD Publish-
ing.
Oswald, A.J., and N. Powdthavee (2008) Does happiness adapt? A longitudinal study
of disability with implications for economists and judges. Journal of Public Economics,
92, 1061-1077.
Perez-Truglia, R. (2015) A Samuelsonian validation test for happiness data. Journal
of Economic Psychology, 49, 74-83.
Pierce, L., T. Roggers, and J.A. Snyder (2016) Losing hurts: The happiness impact of
partisan electoral loss. Journal of Experimental Political Science, 3, 44-59.
Powdthavee, N., A.C. Plagnol, P. Frijters, and A.E. Clark (2017) Who got the Brexit
blues? Using a quasi-experiment to show the effect of Brexit on subjective wellbeing
in the UK. IZA Discussion Paper, No. 11206.
Sampson, T. (2017) The economics of international disintegration. Journal of Eco-
nomic Perspectives, 31, 163-184.
van Praag, B.M.S., and B.E. Baarsma (2005) Using happiness surveys to value intan-
gibles: The case of airport noise. Economic Journal, 115, 224-246.
Vandoros, S., M. Avendano, and I. Kawachi (2018) The EU referendum and mental
health in the short-term: A natural experiment using antidepressant prescriptions
in England. Journal of Epidemiology & Community Health. doi:10.1136/jech-2018-
210637.
Ward, G. (2015) Is happiness a predictor of election results?, CEP Discussion Paper
No. 1343, London School of Economics.
Wilson, T.D., and D.T. Gilbert (2008) Explaining away: A model of affective adapta-
tion. Perspectives on Psychological Science, 3, 370-386.
30

Appendix
Table A1: Placebo-time treatments pre-referendum
(1) (2) (3) (4) (5)
Eurobarometer Waves: 85 vs. (83 & 84) (84 & 85) vs. 83 85 vs. 84 84 vs. 83 85 vs. 83
UK×Post 0.03 0.016 0.034 -0.002 0.025
(0.02) (0.025) (0.02) (0.018) (0.026)
UK 0.49*** 0.495*** 0.503*** 0.445*** 0.498***
(0.036) (0.041) (0.047) (0.051) (0.042)
Post -0.001 -0.006 0.011 -0.022 -0.003
(0.018) (0.02) (0.016) (0.019) (0.018)
Controls Yes Yes Yes Yes Yes
Macroeconomic Controls Yes Yes Yes Yes Yes
R2 0.283 0.283 0.287 0.281 0.283
N 157,228 157,228 104,610 78,696 131,150
Notes: Controls include: individual characteristics, country effects, month of the year effects, and year
effects. Robust standard errors clustered at the country-wave level reported in parentheses.
*** p < 0.01
31
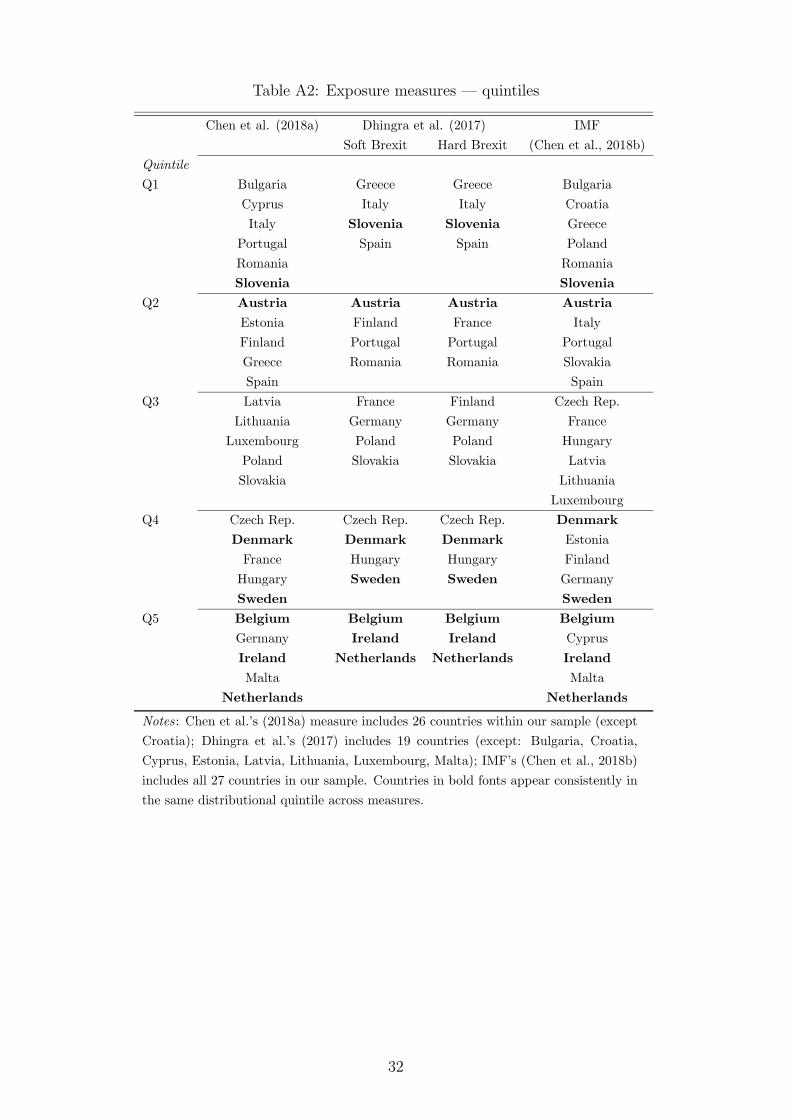
Table A2: Exposure measures — quintiles
Chen et al. (2018a) Dhingra et al. (2017) IMF
Soft Brexit Hard Brexit (Chen et al., 2018b)
Quintile
Q1 Bulgaria Greece Greece Bulgaria
Cyprus Italy Italy Croatia
Italy Slovenia Slovenia Greece
Portugal Spain Spain Poland
Romania Romania
Slovenia Slovenia
Q2 Austria Austria Austria Austria
Estonia Finland France Italy
Finland Portugal Portugal Portugal
Greece Romania Romania Slovakia
Spain Spain
Q3 Latvia France Finland Czech Rep.
Lithuania Germany Germany France
Luxembourg Poland Poland Hungary
Poland Slovakia Slovakia Latvia
Slovakia Lithuania
Luxembourg
Q4 Czech Rep. Czech Rep. Czech Rep. Denmark
Denmark Denmark Denmark Estonia
France Hungary Hungary Finland
Hungary Sweden Sweden Germany
Sweden Sweden
Q5 Belgium Belgium Belgium Belgium
Germany Ireland Ireland Cyprus
Ireland Netherlands Netherlands Ireland
Malta Malta
Netherlands Netherlands
Notes: Chen et al.’s (2018a) measure includes 26 countries within our sample (except
Croatia); Dhingra et al.’s (2017) includes 19 countries (except: Bulgaria, Croatia,
Cyprus, Estonia, Latvia, Lithuania, Luxembourg, Malta); IMF’s (Chen et al., 2018b)
includes all 27 countries in our sample. Countries in bold fonts appear consistently in
the same distributional quintile across measures.
32

CENTRE FOR ECONOMIC PERFORMANCE Recent Discussion Papers
1585 Giulia Giupponi Camille Landais
Subsidizing Labor Hoarding in Recessions: The Employment & Welfare Effects of Short Time Work
1584 Brian Bell Pawel Bukowski Stephen Machin
Rent Sharing and Inclusive Growth
1583 Giuseppe Berlingieri Frank Pisch Claudia Steinwender
Organizing Global Supply Chains: Input Costs Shares and Vertical Integration
1582 Michael Amior The Contribution of Foreign Migration to Local Labor Market Adjustment
1581 Grant Bickwit Emanuel Ornelas John L. Turner
Preferential Trade Agreements and Global Sourcing
1580 Maria Molina-Domene Labor Specialization as a Source of Market Frictions
1579 Arturs Kalnins Stephen F. Lin Catherine Thomas
In-House and Arm’s Length: Productivity Heterogeneity and Variation in Organizational Form
1578 Emanuel Ornelas Marcos Ritel
The Not-So-Generalized Effects of the Generalized System of Preferences
1577 Matthew Ridlay Camille Terrier
Fiscal and Education Spillovers from Charter School Expansion
1576 John Van Reenen Increasing Differences Between Firms: Market Power and the Macro-Economy

1575 Margarida Madaleno Max Nathan Henry Overman Sevrin Waights
Incubators, Accelerators and Regional Economic Development
1574 Esteban M. Aucejo Patrick Coate Jane Cooley Fruehwirth, Sean Kelly Zachary Mozenter
Teacher Effectiveness and Classroom Composition
1573 Stephan Heblich Stephen J. Redding Daniel M. Sturm
The Making of the Modern Metropolis: Evidence from London
1572 Johannes Beohm Ezra Oberfield
Misallocation in the Market for Inputs: Enforcement and the Organization of Production
1571 Hans R. A. Koster Edward W. Pinchbeck
How do Households Value the Future? Evidence from Property Taxes
1570 Holger Breinlich Elsa Leromain Dennis Novy Thomas Sampson Ahmed Usman
The Economic Effects of Brexit – Evidence From the Stock Market
1569 J. Vernon Henderson Sebastian Kriticos Dzhamilya Nigmatulina
Measuring Urban Economic Density
1568 Philippe Bracke Silvana Tenreyro
History Dependence in the Housing Market
1567 Ester Faia Sebastien Laffitte Gianmarco Ottaviano
Foreign Expansion, Competition and Bank Risk
The Centre for Economic Performance Publications Unit Tel: +44 (0)20 7955 7673 Email [email protected] Website: http://cep.lse.ac.uk Twitter: @CEP_LSE