cerebral monitoring during carotid endarterectomy using nirs and
TRANSCRIPT

Cerebral monitoring during carotid endarterectomy using near-infrared diffuse optical
spectroscopies and electroencephalogram
This article has been downloaded from IOPscience. Please scroll down to see the full text article.
2011 Phys. Med. Biol. 56 3015
(http://iopscience.iop.org/0031-9155/56/10/008)
Download details:
IP Address: 128.163.176.84
The article was downloaded on 21/04/2011 at 14:38
Please note that terms and conditions apply.
View the table of contents for this issue, or go to the journal homepage for more
Home Search Collections Journals About Contact us My IOPscience
IOP PUBLISHING PHYSICS IN MEDICINE AND BIOLOGY
Phys. Med. Biol. 56 (2011) 3015–3032 doi:10.1088/0031-9155/56/10/008
Cerebral monitoring during carotid endarterectomyusing near-infrared diffuse optical spectroscopies andelectroencephalogram
Yu Shang1, Ran Cheng1, Lixin Dong1, Stephen J Ryan2, Sibu P Saha3
and Guoqiang Yu1
1 Center for Biomedical Engineering, University of Kentucky, KY, USA2 Department of Neurology, University of Kentucky, KY, USA3 Division of Cardiothoracic Surgery, University of Kentucky, KY, USA
E-mail: [email protected]
Received 7 December 2010, in final form 6 March 2011Published 20 April 2011Online at stacks.iop.org/PMB/56/3015
AbstractIntraoperative monitoring of cerebral hemodynamics during carotidendarterectomy (CEA) provides essential information for detecting cerebralhypoperfusion induced by temporary internal carotid artery (ICA) clampingand post-CEA hyperperfusion syndrome. This study tests the feasibilityand sensitivity of a novel dual-wavelength near-infrared diffuse correlationspectroscopy technique in detecting cerebral blood flow (CBF) and cerebraloxygenation in patients undergoing CEA. Two fiber-optic probes were tapedon both sides of the forehead for cerebral hemodynamic measurements, andthe instantaneous decreases in CBF and electroencephalogram (EEG) alpha-band power during ICA clamping were compared to test the measurementsensitivities of the two techniques. The ICA clamps resulted in significantCBF decreases (−24.7 ± 7.3%) accompanied with cerebral deoxygenationat the surgical sides (n = 12). The post-CEA CBF were significantlyhigher (+43.2 ± 16.9%) than the pre-CEA CBF. The CBF responses toICA clamping were significantly faster, larger and more sensitive than EEGresponses. Simultaneous monitoring of CBF, cerebral oxygenation and EEGpower provides a comprehensive evaluation of cerebral physiological status,thus showing potential for the adoption of acute interventions (e.g., shunting,medications) during CEA to reduce the risks of severe cerebral ischemia andcerebral hyperperfusion syndrome.
(Some figures in this article are in colour only in the electronic version)
1. Introduction
Approximately 20% of ischemic strokes are caused by extracranial internal carotid artery (ICA)stenosis (Chaturvedi et al 2005, Chang et al 1995). Carotid endarterectomy (CEA) is the most
0031-9155/11/103015+18$33.00 © 2011 Institute of Physics and Engineering in Medicine Printed in the UK 3015
3016 Y Shang et al
frequently used surgical intervention for restoration of the blood circulation by removing theblockage from the carotid artery, thus reducing the stroke risk (Chaturvedi et al 2005, Plestiset al 1997, Rowed et al 2004). During CEA, the common, external and internal carotidarteries are temporarily clamped for removal of the atheromatous plaques in the inner liningof the carotid artery. The ICA clamping, if without temporary shunting (a temporary bypassconnecting the sections below and above blockage for establishment of blood flow in clampedartery) to the brain, may lead to cerebral ischemia and hypoxia. However, the shunting itselfmay induce embolic events leading to perioperative stroke (Bond et al 2003, Ackerstaff et al1995). The use of shunting during ICA clamping is usually selected by surgeons based on thereal-time monitoring of brain physiological status (e.g., electroencephalographic monitoring)associated with cerebral hypoperfusion during surgery (Moritz et al 2007, Blume et al 1986,Cursi et al 2005). Moreover, real-time monitoring of cerebral perfusion may help in makingdecisions for adopting acute medications for reducing the risk of cerebral hyperperfusionsyndrome (CHS): a cause of neurological dysfunction after CEA (Adhiyaman and Alexander2007).
Currently, techniques for direct or indirect monitoring of cerebral perfusion during CEAat the bedside of surgical rooms include electroencephalography (EEG) (Blume et al 1986,Cursi et al 2005, Hirofumi et al 2003, Jansen et al 1993, Plestis et al 1997, Rowed et al2004), somatosensory-evoked potential (SEP) (Friedell et al 2008, Rowed et al 2004, Moritzet al 2007), transcranial Doppler sonography (TCD) (Jansen et al 1993, Rowed et al 2004,Ackerstaff et al 1995, Moritz et al 2007, Belardi et al 2003), stump pressure (SP) (Moritzet al 2007, Belardi et al 2003) and Xe133 technique (Sundt et al 1981). Among these techniques,EEG and SEP record the cerebral functional state (Franceschini et al 2008, Moritz et al 2007)that does not necessarily reflect the cerebral perfusion. TCD and SP detect blood flow or bloodpressure in large cerebral vessels which may not be consistent with cerebral blood flow (CBF)in microvasculature (Edlow et al 2010). Although the Xe133 technique can measure CBF inmicrovasculature, the invasive and complex nature of injecting radioactive isotopes in arterylimits its wide use during surgery.
Near-infrared diffuse optical spectroscopy (NIRS) offers a noninvasive, rapid, portable andlow-cost alternative for direct monitoring of cerebral tissue oxygenation in microvasculature(Fantini et al 1999, Boas et al 2001, Culver et al 2005, Hebden et al 2004, Everdell et al 2005,Tian et al 2009, Franceschini et al 2006). The difference between major tissue chromophoresin near-infrared (NIR) absorption spectra allows for the measurement of oxygenated and de-oxygenated hemoglobin concentrations, total hemoglobin concentration and blood oxygensaturation. NIRS has also been incorporated with EEG for concurrently detecting cerebraloxygenation and brain waves in premature infants (Roche-Labarbe et al 2007), healthy adults(Cooper et al 2009b, Rovati et al 2007), and tissue-like phantoms (Cooper et al 2009a).Applications of an NIR tissue oximeter during CEA have demonstrated that severe cerebralischemia is associated with 5–25% decline in cerebral blood oxygen saturation (Pennekampet al 2009). However, the NIR tissue oximeter does not directly measure CBF.
NIR diffuse correlation spectroscopy (DCS) is an emerging technique capable of directlymeasuring CBF in healthy and diseased brains (Durduran et al 2004, 2009, 2010, Gagnonet al 2008 Cheung et al 2001, Culver et al 2003, Li et al 2008, Zhou et al 2009, Roche-Labarbeet al 2010, Zirak et al 2010). DCS utilizes rapid temporal fluctuations of NIR light intensity todirectly detect the motion of moving scatterers (e.g., red blood cells) in the microvasculatureof biological tissues. Measurements of blood flow variations by DCS in various organsand tissues have been compared and validated to other standards, including power Dopplerultrasound (Yu et al 2005b), laser Doppler (Durduran 2004), Xenon-CT (Kim et al 2010),Doppler ultrasound (Buckley et al 2009, Roche-Labarbe et al 2010), fluorescent microsphere
Cerebral monitoring during carotid endarterectomy using NIRS and EEG 3017
measurement (Zhou et al 2009), and perfusion MRI (Yu et al 2007). DCS offers severalattractive new features for blood flow measurement, such as noninvasiveness, high temporalresolution (up to several milliseconds) (Dietsche et al 2007), portability and relatively largepenetration depth (up to several centimeters) (Durduran et al 2004, Li et al 2005).
In some of the previous studies described above, DCS was combined with the NIR tissueoximeter in hybrid instruments to simultaneously measure both blood flow and oxygenationwhich allows an estimation of tissue oxygen metabolism (Zhou et al 2007, Yu et al 2005a,Roche-Labarbe et al 2010). However, the combination of DCS flowmeter and NIR tissueoximeter made the hybrid instruments large and expensive. Recently, we developed atruly portable, easy-to-use and relatively inexpensive diffuse optical device based on DCStechnology (namely DCS flow-oximeter) for simultaneous monitoring of tissue blood flow andoxygenation (Shang et al 2009). DCS flow-oximeter measurements of blood oxygenationchanges have been validated against a commercial tissue oximeter (Imagent, ISS Inc.) (Shanget al 2009). Being truly portable (dimensions: 8′′ ×12′′ × 18′′), the DCS flow-oximeteris suitable for bedside monitoring of CBF and oxygenation in clinic, thus providing acomprehensive evaluation of cerebral physiological status.
This study aims to test the capability of DCS flow-oximeter in detecting cerebralhypoperfusion and hypoxia during ICA clamping as well as post-CEA hyperperfusion insurgical rooms. To the best of our knowledge, there have been no published reports ofsimultaneous measurements of CBF and cerebral oxygenation in microvasculature duringCEA. Since EEG was applied in our patient population by the surgeon to detect the severecerebral hypoperfusion for shunting selection, we compared the CBF variations measured bythe DCS flow-oximeter with the changes of EEG power spectra to test the sensitivity of opticalmeasurements in the evaluation of cerebral hemodynamics during CEA.
2. Methods
2.1. Patient characteristics and surgical procedures
Eleven patients with carotid stenosis and undergoing CEA participated in this study with thesigned consents approved by the University of Kentucky Institutional Review Board (IRB).The stenoses caused by plaques inside the ICA were identified by duplex Doppler ultrasound,magnetic resonance (MR) and/or computed tomography (CT) angiography. Table 1 listspatient demographics, carotid stenosis percentages at the surgical and opposite (control) sides,and ICA clamping duration. The left or right side for each individual surgery was selectedprimarily based on the severity of carotid stenosis. However, patient 4 received CEA at the leftside with 80% stenosis rather than the right side with 100% stenosis. In fact, CEA for 100%stenosis is not recommended since the surgical benefits to total ICA occlusion are insufficientand the surgeries are associated with a high risk of preoperative stroke (Matic et al 2009,Bowen et al 1997). Note that one patient underwent CEA twice at the right and left sides,respectively, on two different dates with an interval of 67 days. This patient was assigned twoconsequence numbers (5 and 6) for differentiating the right and left CEA. In total, 12 CEAprocedures were monitored in this study.
The patients were placed under general endotracheal anesthesia. Using a standard steriletechnique, an incision was made on the side with severe ICA stenosis along the anterior borderof sternomastoid muscle and was deepened on subcutaneous tissue and platysma. Afterthe placement of a self-retaining retractor and ligation of common facial vein, the carotidsheath was opened and common, external and internal carotid arteries were exposed andclamped sequentially using vascular clamps. Patients were given 5000 units of heparin prior
3018 Y Shang et al
(a) (b) (c)
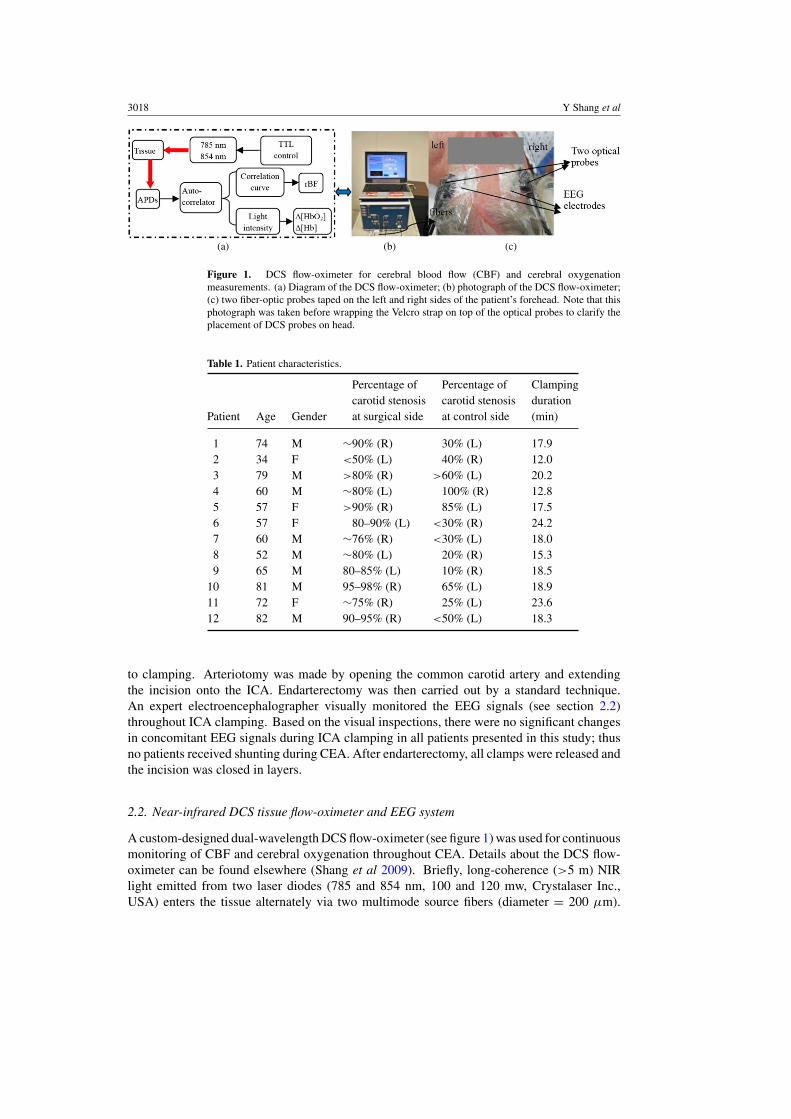
Figure 1. DCS flow-oximeter for cerebral blood flow (CBF) and cerebral oxygenationmeasurements. (a) Diagram of the DCS flow-oximeter; (b) photograph of the DCS flow-oximeter;(c) two fiber-optic probes taped on the left and right sides of the patient’s forehead. Note that thisphotograph was taken before wrapping the Velcro strap on top of the optical probes to clarify theplacement of DCS probes on head.
Table 1. Patient characteristics.
Percentage of Percentage of Clampingcarotid stenosis carotid stenosis duration
Patient Age Gender at surgical side at control side (min)
1 74 M ∼90% (R) 30% (L) 17.92 34 F <50% (L) 40% (R) 12.03 79 M >80% (R) >60% (L) 20.24 60 M ∼80% (L) 100% (R) 12.85 57 F >90% (R) 85% (L) 17.56 57 F 80–90% (L) <30% (R) 24.27 60 M ∼76% (R) <30% (L) 18.08 52 M ∼80% (L) 20% (R) 15.39 65 M 80–85% (L) 10% (R) 18.5
10 81 M 95–98% (R) 65% (L) 18.911 72 F ∼75% (R) 25% (L) 23.612 82 M 90–95% (R) <50% (L) 18.3
to clamping. Arteriotomy was made by opening the common carotid artery and extendingthe incision onto the ICA. Endarterectomy was then carried out by a standard technique.An expert electroencephalographer visually monitored the EEG signals (see section 2.2)throughout ICA clamping. Based on the visual inspections, there were no significant changesin concomitant EEG signals during ICA clamping in all patients presented in this study; thusno patients received shunting during CEA. After endarterectomy, all clamps were released andthe incision was closed in layers.
2.2. Near-infrared DCS tissue flow-oximeter and EEG system
A custom-designed dual-wavelength DCS flow-oximeter (see figure 1) was used for continuousmonitoring of CBF and cerebral oxygenation throughout CEA. Details about the DCS flow-oximeter can be found elsewhere (Shang et al 2009). Briefly, long-coherence (>5 m) NIRlight emitted from two laser diodes (785 and 854 nm, 100 and 120 mw, Crystalaser Inc.,USA) enters the tissue alternately via two multimode source fibers (diameter = 200 μm).
Cerebral monitoring during carotid endarterectomy using NIRS and EEG 3019
The scattered light through the tissue is collected by a single-mode detector fiber (diameter =5.6 μm) connected to an avalanche photodiode (APD, Pacer Components Inc., UK). Thedistance between the fibers of the laser source (S) and the APD detector (D) is 2.5 cm. Thelight intensity fluctuation within a single speckle area of tissue (∼25 (π×(5.6/2)2) μm2),detected by the APD, is sensitive to the motion of moving scatterers in tissue (e.g., moving redblood cells). An autocorrelator board (www.correlator.com, USA) takes the output of APDand computes the light intensity temporal autocorrelation function. From the normalizedintensity autocorrelation function, the electric field temporal autocorrelation function G1(τ )is derived, which satisfies the correlation diffusion equation in highly scattering media (Boaset al 1995, Boas and Yodh 1997). The exact form of the correlation diffusion equationdepends on the nature and heterogeneity of the scatterer motion. For the case of diffusivemotion, the normalized electric field temporal autocorrelation function g1(τ ) decays at anearly time approximately exponentially in τ (delay time). Relative blood flow (rBF) is thusextracted by fitting the autocorrelation curve whose decay rate depends on a parameter α
(which is proportional to the tissue blood volume fraction), and on the motion of the red bloodcells (Cheung et al 2001, Yu et al 2005a, 2005b, Boas et al 1995). The two wavelengthmeasurements (785 and 854 nm) generate two flow curves (Shang et al 2009).
The oxygenation information is extracted from data obtained by recording the averagelight intensities at two wavelengths (785 and 854 nm) detected by the APD. The wavelengthswere chosen based on the lasers available, and optimization of wavelengths (Strangmanet al 2003) will be the subject of future work. The changes of oxygenated hemoglobinconcentration (�[HbO2]) and deoxygenated hemoglobin concentration (�[Hb]) relative totheir baseline values (determined before physiological changes) are calculated using a‘differential pathlength method’ (Strangman et al 2003, Song et al 2005), based on themodified Beer–Lambert law. In this method, the standard Beer–Lambert law is modifiedto account for the lengthening of the mean photon pathlength due to tissue scattering. Adifferential pathlength factor (DPF) is introduced, which is the ratio of the mean photonpathlength to the physical separation of the source and detector. The detected time-coursechanges in light intensities at two wavelengths depend on extinction coefficients and DPFvalues at the working wavelengths as well as hemoglobin concentration changes (�[HbO2]and �[Hb]) of the measured tissue. The extinction coefficients and DPF values are determinedbased on the literatures (Duncan et al 1995, Kim et al 2005).
A 16-channel EEG system (XLTEK, Excel-Tech Ltd, Canada) was used to continuouslymonitor brain waves during CEA. Nineteen electrodes (including 16 active electrodes and3 reference electrodes) were placed around the scalp based on 10–20 International System(Fisch 1999). The electrode placed on a specific location of scalp probed the averaged fieldpotential created by the cortical neurons in that particular area of the brain (Kaiser 2005).
2.3. Optical and EEG measurements
Two fiber-optic probes containing source and detector fibers were taped on the surgical (withtemporary ICA clamping during CEA) and control (without ICA clamping) sides of theforehead (see figure 1) before surgery using sterile transparent dressing (Tegaderm
TM, 3M
Health Care, USA). A Velcro strap was then employed across the forehead to tightly fix bothprobes and minimize the influence of room light on optical measurements. The two opticalprobes were connected to two DCS flow-oximeter devices for simultaneous monitoring ofCBF and cerebral tissue oxygenation at both sides. The sampling time for a complete frame offlow and oxygenation measurements was 2.4 s. Note that one patient underwent two separateCEA surgeries on different dates, and received temporary ICA clamping at only one side
3020 Y Shang et al
during each CEA. This patient was assigned two consequential numbers (5 and 6), and theunclamped side during each CEA was used as the control side for comparison.
The 16-channel EEG signals were obtained from FP1-F3, F3-C3, C3-P3, P3-O1, FP1-F7,F7-T7, T7-P7, P7-O1 positions on the left hemisphere, and FP2-F4, F4-C4, C4-P4, P4-O2,FP2-F8, F8-T8, T8-P8, P8-O2 positions on the right hemisphere (Fisch 1999). The samplingrate of the system was 500 Hz, and a band-pass filter (0.1–100 Hz) was implemented to reducenoises at low and high frequencies.
2.4. EEG data analysis: instantaneous changes during ICA clamping
A previously established power spectral method (Cursi et al 2005, Blume et al 1986) is usedto quantify the instantaneous changes in EEG signals during ICA clamping. Briefly, 2 s EEGdata (1000 data points at 500 Hz sampling rate) centered at time t from each of 16 channelsare detrended as one series. After being preprocessed by a Hanning window to reduce theeffect of spectral leakage, each series is transformed into a frequency domain by Fast FourierTransform (FFT), from which the power spectrum at 8–15 Hz bandwidth is obtained. Thereduction in 8–15 Hz EEG spectral power during ICA clamping compared to the baselinevalue indicates a decline in alpha-band brain activity, which is believed to be closely related tocerebral ischemia (Cursi et al 2005, Mariucci et al 2003, Blume et al 1986). The consecutiveseries of the 2 s power spectra are then smoothed with Welch’s method (Oppenheim andSchafer 1975) through averaging 10 series of power spectra data. By averaging the 8-channelpower spectra on left and right hemispheres, respectively, the function of spectral power P(t)at the time t is acquired for each hemisphere.
To evaluate instantaneous changes of EEG signals during ICA clamping, the EEGdesynchronization function D(t) is defined as D(t) = 100% × (P (t) − P0)/P0. Here D(t)represents the percentage change of spectral power at time t, when compared to 1 min averagedpre-clamping power P0 (the reference power). A slope of D(t) during the first 30 s clampingperiod, S = (D(t0 + 30) − D(t0))/30, is then calculated to quantify the instantaneous EEGresponses to the ICA clamping, since most of EEG changes occur within 30 s after thebeginning of clamping (Plestis et al 1997). Here t0 is the beginning time of arterial clamping.The minimum of D(t) during the entire period of clamping is defined as D-index, representingthe most severe cerebral hypoperfusion during ICA clamping. The period from the beginningof clamping (t0) to the time of D(t) attaining its minimum (D-index) is defined as time-to-minimum.
2.5. Optical data analysis
2.5.1. Individual hemodynamic responses throughout CEA. The optical measurements usinga source–detector (S–D) separation of 2.5 cm permit NIR light to penetrate ∼1.25 cm intothe tissue, allowing for the detection of cerebral hemodynamics in adult cortex (Kim et al2010). The uses of 2.5 cm S–D separation for detection of CBF and cerebral oxygenationhave been demonstrated and validated in various human studies (Edlow et al 2010, Durduranet al 2004, 2009, Li et al 2005, Kim et al 2010). For example, Kim et al (2010) have recentlydemonstrated that the CBF obtained from the 2.5 cm S–D separation of DCS measurementagreed well with the CBF in adult cortex detected by Xenon-Enhanced CT. Note however,even at this relatively large S–D separation (2.5 cm), there are always some contributions tothe cortex signal from the overlaying tissues (skin and skull), i.e., the partial volume effects(Durduran et al 2004). In order to precisely extract cerebral hemodynamic information,measurements with multiple source–detector separations and multi-layer theoretical models
Cerebral monitoring during carotid endarterectomy using NIRS and EEG 3021
are required (Kienle and Glanzmann 1999, Farrell et al 1998, van Beekvelt et al 2001), whichwill be the subject of future work.
Since DCS flow signals are not sensitive to variation in the wavelength (Shang et al2009), CBF data obtained from one wavelength (785 nm) are presented in this study. Cerebraloxygenation changes are extracted by measuring the light intensity changes at two wavelengths(785 and 854 nm). Individual time traces for relative changes in CBF and oxygenation duringCEA are calculated and presented. The relative CBF (rCBF) is denoted as the CBF percentagerelative to its baseline value (assigned to be 100%). The �[HbO2] and �[Hb] represent thechanges of oxygenated and deoxygenated hemoglobin concentrations relative to their baselinevalues (assigned to be zero).
2.5.2. Averaged hemodynamic changes throughout CEA. In order to evaluate hemodynamicand EEG changes during ICA clamping and compare with previous studies (Cursi et al 2005),the 1 min hemodynamic data (rCBF, �[HbO2], �[Hb]) right before clamping are averaged asthe pre-clamping baselines, which are consistent with the data analysis used in previous studies.The mean hemodynamic values during the entire period of ICA clamping are then comparedto these pre-clamping baselines for the evaluation of cerebral ischemia/hypoxia during ICAclamping. The post-CEA hemodynamic data are averaged for 5 min and compared to the5 min averaged pre-CEA baselines for investigating the CEA-created hemodynamic changes.
2.5.3. Instantaneous CBF changes during ICA clamping. To evaluate instantaneous CBFchanges during ICA clamping and compare them to the brain activity (EEG) changes, the samemethod used for EEG spectral power (P(t)) (see section 2.4) is applied to the CBF data analysis,resulting in derivative CBF outcomes of D(t), slope (S), D-index and time-to-minimum.
3. Results
3.1. Individual cerebral hemodynamic changes throughout CEA
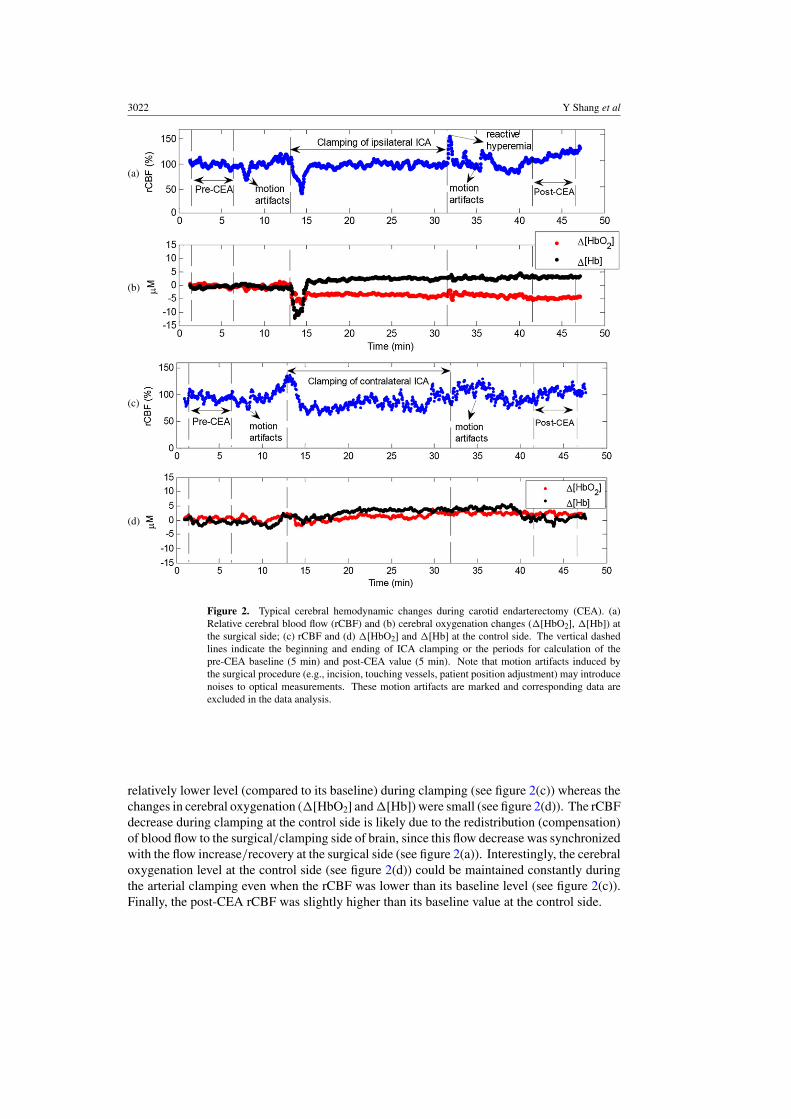
The data analysis methods are depicted in section 2.5.1. Figure 2 shows the typical cerebralhemodynamics at the surgical and control sides from one patient (12) undergoing CEA. Uponinitial clamping of the ICA for removing atheromatous plaque, the rCBF at the surgicalside decreased sharply and rapidly (see figure 2(a)), causing immediate reductions in both�[HbO2] and �[Hb] (see figure 2(b)). These instantaneous responses are expected since theICA clamping cut off the blood flow (rCBF) and reduced the blood volume (proportionalto [HbO2] + [Hb]) supplied to the surgical side of the brain. After reaching its minimallevel, rCBF increased and partially recovered toward its baseline value in a short timeperiod although the rCBF level finally remained slightly lower than its pre-ICA baseline(see figure 2(a)). The observed rCBF increase/recovery at the surgical side was likely due tothe compensation of blood flow from the control side of the brain (see the rCBF decrease at thecontrol side described in the following paragraph). The instantaneous rCBF increase/recoverytemporarily elevated both �[HbO2] and �[Hb]. However, as a result of ICA clampingand continuous cerebral oxygen consumption, �[HbO2] decreased whereas �[Hb] increasedgradually (see figure 2(b)). Following the release of arterial clamping, there was an obviousreactive hyperemia (see figure 2(a)), causing small fluctuations in cerebral oxygenation (seefigure 2(b)). Ultimately, the post-CEA rCBF (121.3%) was higher than its baseline value atthe surgical side (see figure 2(a)).
The hemodynamic responses to ICA clamping at the control side were different fromthose at the surgical side; rCBF decreased rapidly at the beginning of clamping and stayed in a
3022 Y Shang et al
(a)
(b)
(c)
(d)
Figure 2. Typical cerebral hemodynamic changes during carotid endarterectomy (CEA). (a)Relative cerebral blood flow (rCBF) and (b) cerebral oxygenation changes (�[HbO2], �[Hb]) atthe surgical side; (c) rCBF and (d) �[HbO2] and �[Hb] at the control side. The vertical dashedlines indicate the beginning and ending of ICA clamping or the periods for calculation of thepre-CEA baseline (5 min) and post-CEA value (5 min). Note that motion artifacts induced bythe surgical procedure (e.g., incision, touching vessels, patient position adjustment) may introducenoises to optical measurements. These motion artifacts are marked and corresponding data areexcluded in the data analysis.
relatively lower level (compared to its baseline) during clamping (see figure 2(c)) whereas thechanges in cerebral oxygenation (�[HbO2] and �[Hb]) were small (see figure 2(d)). The rCBFdecrease during clamping at the control side is likely due to the redistribution (compensation)of blood flow to the surgical/clamping side of brain, since this flow decrease was synchronizedwith the flow increase/recovery at the surgical side (see figure 2(a)). Interestingly, the cerebraloxygenation level at the control side (see figure 2(d)) could be maintained constantly duringthe arterial clamping even when the rCBF was lower than its baseline level (see figure 2(c)).Finally, the post-CEA rCBF was slightly higher than its baseline value at the control side.
Cerebral monitoring during carotid endarterectomy using NIRS and EEG 3023
(a) (b) (c)
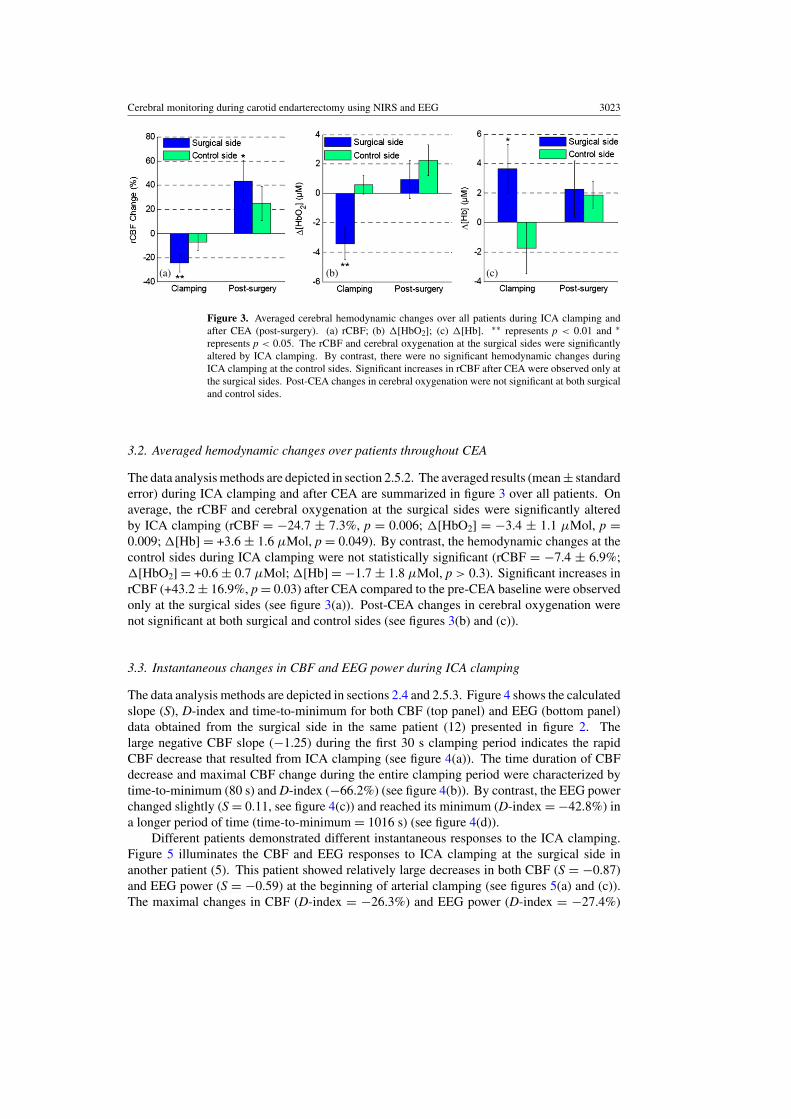
Figure 3. Averaged cerebral hemodynamic changes over all patients during ICA clamping andafter CEA (post-surgery). (a) rCBF; (b) �[HbO2]; (c) �[Hb]. ∗∗ represents p < 0.01 and ∗represents p < 0.05. The rCBF and cerebral oxygenation at the surgical sides were significantlyaltered by ICA clamping. By contrast, there were no significant hemodynamic changes duringICA clamping at the control sides. Significant increases in rCBF after CEA were observed only atthe surgical sides. Post-CEA changes in cerebral oxygenation were not significant at both surgicaland control sides.
3.2. Averaged hemodynamic changes over patients throughout CEA
The data analysis methods are depicted in section 2.5.2. The averaged results (mean ± standarderror) during ICA clamping and after CEA are summarized in figure 3 over all patients. Onaverage, the rCBF and cerebral oxygenation at the surgical sides were significantly alteredby ICA clamping (rCBF = −24.7 ± 7.3%, p = 0.006; �[HbO2] = −3.4 ± 1.1 μMol, p =0.009; �[Hb] = +3.6 ± 1.6 μMol, p = 0.049). By contrast, the hemodynamic changes at thecontrol sides during ICA clamping were not statistically significant (rCBF = −7.4 ± 6.9%;�[HbO2] = +0.6 ± 0.7 μMol; �[Hb] = −1.7 ± 1.8 μMol, p > 0.3). Significant increases inrCBF (+43.2 ± 16.9%, p = 0.03) after CEA compared to the pre-CEA baseline were observedonly at the surgical sides (see figure 3(a)). Post-CEA changes in cerebral oxygenation werenot significant at both surgical and control sides (see figures 3(b) and (c)).
3.3. Instantaneous changes in CBF and EEG power during ICA clamping
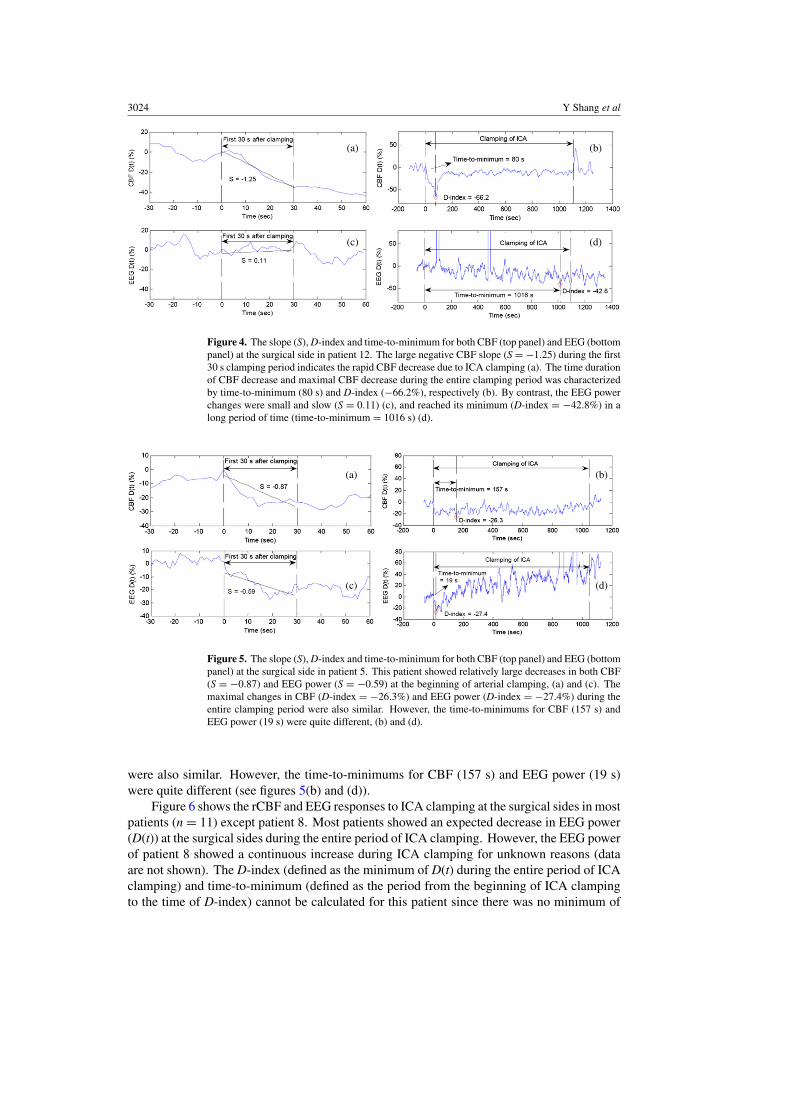
The data analysis methods are depicted in sections 2.4 and 2.5.3. Figure 4 shows the calculatedslope (S), D-index and time-to-minimum for both CBF (top panel) and EEG (bottom panel)data obtained from the surgical side in the same patient (12) presented in figure 2. Thelarge negative CBF slope (−1.25) during the first 30 s clamping period indicates the rapidCBF decrease that resulted from ICA clamping (see figure 4(a)). The time duration of CBFdecrease and maximal CBF change during the entire clamping period were characterized bytime-to-minimum (80 s) and D-index (−66.2%) (see figure 4(b)). By contrast, the EEG powerchanged slightly (S = 0.11, see figure 4(c)) and reached its minimum (D-index = −42.8%) ina longer period of time (time-to-minimum = 1016 s) (see figure 4(d)).
Different patients demonstrated different instantaneous responses to the ICA clamping.Figure 5 illuminates the CBF and EEG responses to ICA clamping at the surgical side inanother patient (5). This patient showed relatively large decreases in both CBF (S = −0.87)and EEG power (S = −0.59) at the beginning of arterial clamping (see figures 5(a) and (c)).The maximal changes in CBF (D-index = −26.3%) and EEG power (D-index = −27.4%)
3024 Y Shang et al
(a)
(c)
(b)
(d)
Figure 4. The slope (S), D-index and time-to-minimum for both CBF (top panel) and EEG (bottompanel) at the surgical side in patient 12. The large negative CBF slope (S = −1.25) during the first30 s clamping period indicates the rapid CBF decrease due to ICA clamping (a). The time durationof CBF decrease and maximal CBF decrease during the entire clamping period was characterizedby time-to-minimum (80 s) and D-index (−66.2%), respectively (b). By contrast, the EEG powerchanges were small and slow (S = 0.11) (c), and reached its minimum (D-index = −42.8%) in along period of time (time-to-minimum = 1016 s) (d).
(a) (b)
(c) (d)
Figure 5. The slope (S), D-index and time-to-minimum for both CBF (top panel) and EEG (bottompanel) at the surgical side in patient 5. This patient showed relatively large decreases in both CBF(S = −0.87) and EEG power (S = −0.59) at the beginning of arterial clamping, (a) and (c). Themaximal changes in CBF (D-index = −26.3%) and EEG power (D-index = −27.4%) during theentire clamping period were also similar. However, the time-to-minimums for CBF (157 s) andEEG power (19 s) were quite different, (b) and (d).
were also similar. However, the time-to-minimums for CBF (157 s) and EEG power (19 s)were quite different (see figures 5(b) and (d)).
Figure 6 shows the rCBF and EEG responses to ICA clamping at the surgical sides in mostpatients (n = 11) except patient 8. Most patients showed an expected decrease in EEG power(D(t)) at the surgical sides during the entire period of ICA clamping. However, the EEG powerof patient 8 showed a continuous increase during ICA clamping for unknown reasons (dataare not shown). The D-index (defined as the minimum of D(t) during the entire period of ICAclamping) and time-to-minimum (defined as the period from the beginning of ICA clampingto the time of D-index) cannot be calculated for this patient since there was no minimum of
Cerebral monitoring during carotid endarterectomy using NIRS and EEG 3025
(a)
(b)
(c)
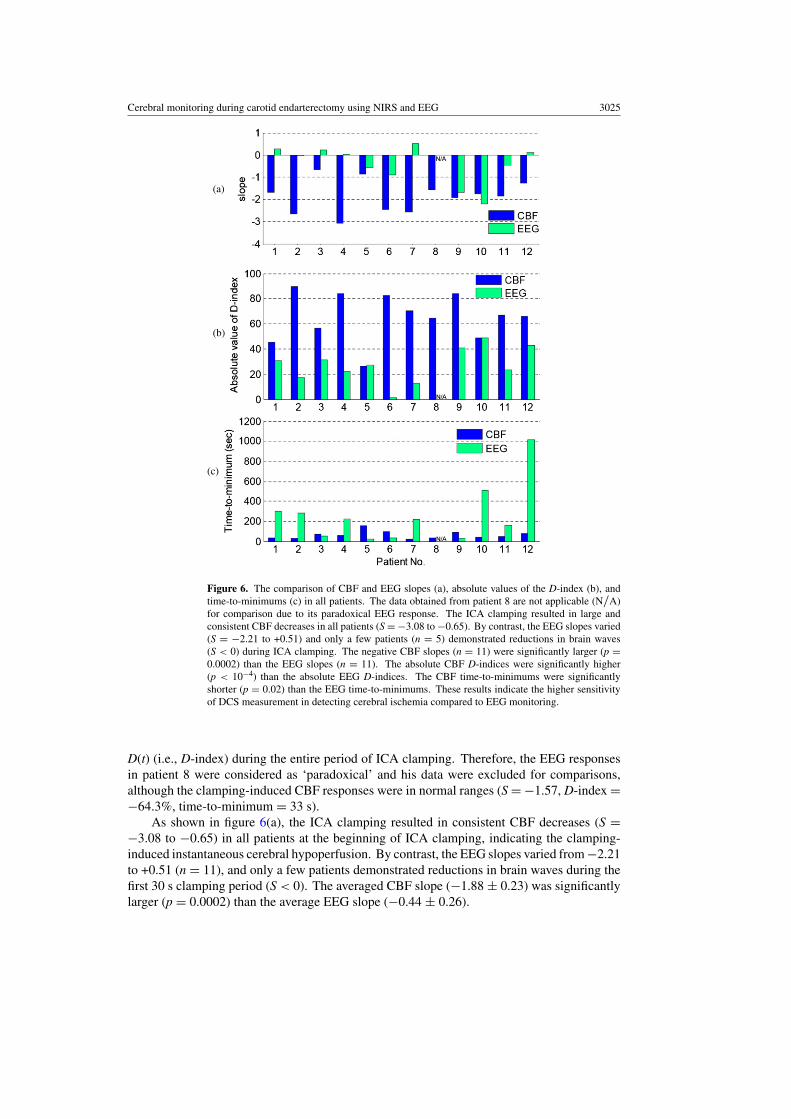
Figure 6. The comparison of CBF and EEG slopes (a), absolute values of the D-index (b), andtime-to-minimums (c) in all patients. The data obtained from patient 8 are not applicable (N/A)for comparison due to its paradoxical EEG response. The ICA clamping resulted in large andconsistent CBF decreases in all patients (S = −3.08 to −0.65). By contrast, the EEG slopes varied(S = −2.21 to +0.51) and only a few patients (n = 5) demonstrated reductions in brain waves(S < 0) during ICA clamping. The negative CBF slopes (n = 11) were significantly larger (p =0.0002) than the EEG slopes (n = 11). The absolute CBF D-indices were significantly higher(p < 10−4) than the absolute EEG D-indices. The CBF time-to-minimums were significantlyshorter (p = 0.02) than the EEG time-to-minimums. These results indicate the higher sensitivityof DCS measurement in detecting cerebral ischemia compared to EEG monitoring.
D(t) (i.e., D-index) during the entire period of ICA clamping. Therefore, the EEG responsesin patient 8 were considered as ‘paradoxical’ and his data were excluded for comparisons,although the clamping-induced CBF responses were in normal ranges (S = −1.57, D-index =−64.3%, time-to-minimum = 33 s).
As shown in figure 6(a), the ICA clamping resulted in consistent CBF decreases (S =−3.08 to −0.65) in all patients at the beginning of ICA clamping, indicating the clamping-induced instantaneous cerebral hypoperfusion. By contrast, the EEG slopes varied from −2.21to +0.51 (n = 11), and only a few patients demonstrated reductions in brain waves during thefirst 30 s clamping period (S < 0). The averaged CBF slope (−1.88 ± 0.23) was significantlylarger (p = 0.0002) than the average EEG slope (−0.44 ± 0.26).
3026 Y Shang et al
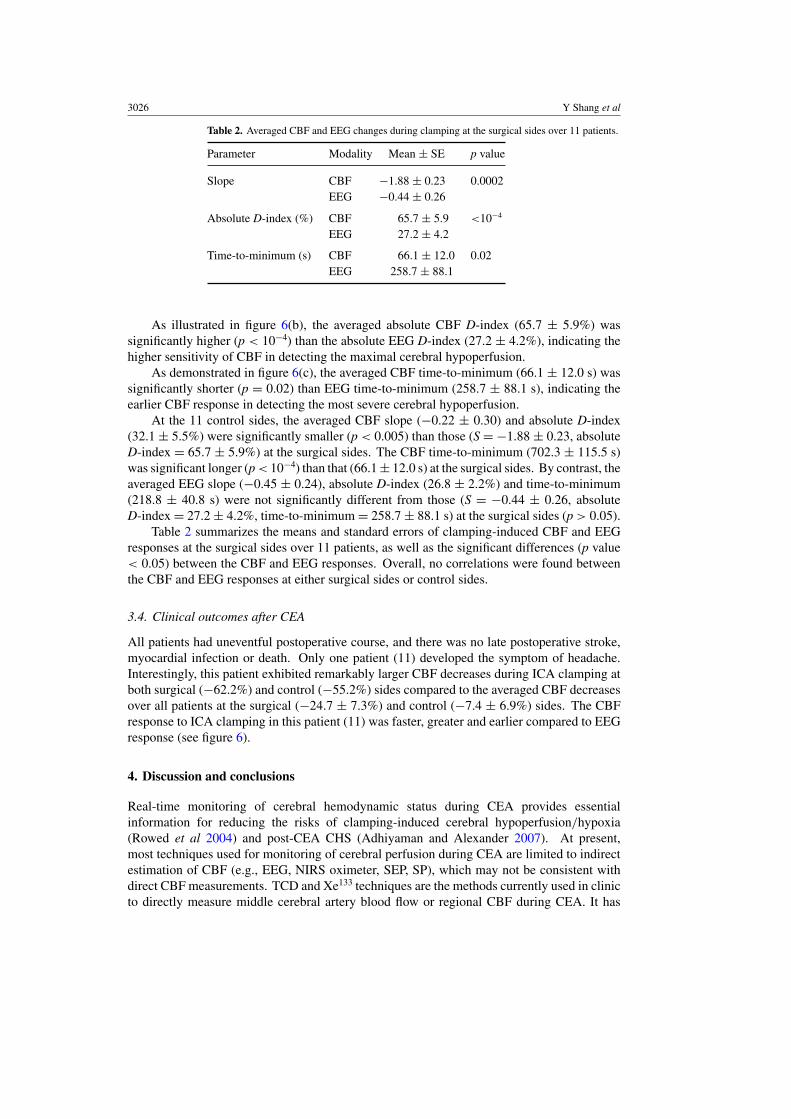
Table 2. Averaged CBF and EEG changes during clamping at the surgical sides over 11 patients.
Parameter Modality Mean ± SE p value
Slope CBF −1.88 ± 0.23 0.0002EEG −0.44 ± 0.26
Absolute D-index (%) CBF 65.7 ± 5.9 <10−4
EEG 27.2 ± 4.2
Time-to-minimum (s) CBF 66.1 ± 12.0 0.02EEG 258.7 ± 88.1
As illustrated in figure 6(b), the averaged absolute CBF D-index (65.7 ± 5.9%) wassignificantly higher (p < 10−4) than the absolute EEG D-index (27.2 ± 4.2%), indicating thehigher sensitivity of CBF in detecting the maximal cerebral hypoperfusion.
As demonstrated in figure 6(c), the averaged CBF time-to-minimum (66.1 ± 12.0 s) wassignificantly shorter (p = 0.02) than EEG time-to-minimum (258.7 ± 88.1 s), indicating theearlier CBF response in detecting the most severe cerebral hypoperfusion.
At the 11 control sides, the averaged CBF slope (−0.22 ± 0.30) and absolute D-index(32.1 ± 5.5%) were significantly smaller (p < 0.005) than those (S = −1.88 ± 0.23, absoluteD-index = 65.7 ± 5.9%) at the surgical sides. The CBF time-to-minimum (702.3 ± 115.5 s)was significant longer (p < 10−4) than that (66.1 ± 12.0 s) at the surgical sides. By contrast, theaveraged EEG slope (−0.45 ± 0.24), absolute D-index (26.8 ± 2.2%) and time-to-minimum(218.8 ± 40.8 s) were not significantly different from those (S = −0.44 ± 0.26, absoluteD-index = 27.2 ± 4.2%, time-to-minimum = 258.7 ± 88.1 s) at the surgical sides (p > 0.05).
Table 2 summarizes the means and standard errors of clamping-induced CBF and EEGresponses at the surgical sides over 11 patients, as well as the significant differences (p value< 0.05) between the CBF and EEG responses. Overall, no correlations were found betweenthe CBF and EEG responses at either surgical sides or control sides.
3.4. Clinical outcomes after CEA
All patients had uneventful postoperative course, and there was no late postoperative stroke,myocardial infection or death. Only one patient (11) developed the symptom of headache.Interestingly, this patient exhibited remarkably larger CBF decreases during ICA clamping atboth surgical (−62.2%) and control (−55.2%) sides compared to the averaged CBF decreasesover all patients at the surgical (−24.7 ± 7.3%) and control (−7.4 ± 6.9%) sides. The CBFresponse to ICA clamping in this patient (11) was faster, greater and earlier compared to EEGresponse (see figure 6).
4. Discussion and conclusions
Real-time monitoring of cerebral hemodynamic status during CEA provides essentialinformation for reducing the risks of clamping-induced cerebral hypoperfusion/hypoxia(Rowed et al 2004) and post-CEA CHS (Adhiyaman and Alexander 2007). At present,most techniques used for monitoring of cerebral perfusion during CEA are limited to indirectestimation of CBF (e.g., EEG, NIRS oximeter, SEP, SP), which may not be consistent withdirect CBF measurements. TCD and Xe133 techniques are the methods currently used in clinicto directly measure middle cerebral artery blood flow or regional CBF during CEA. It has
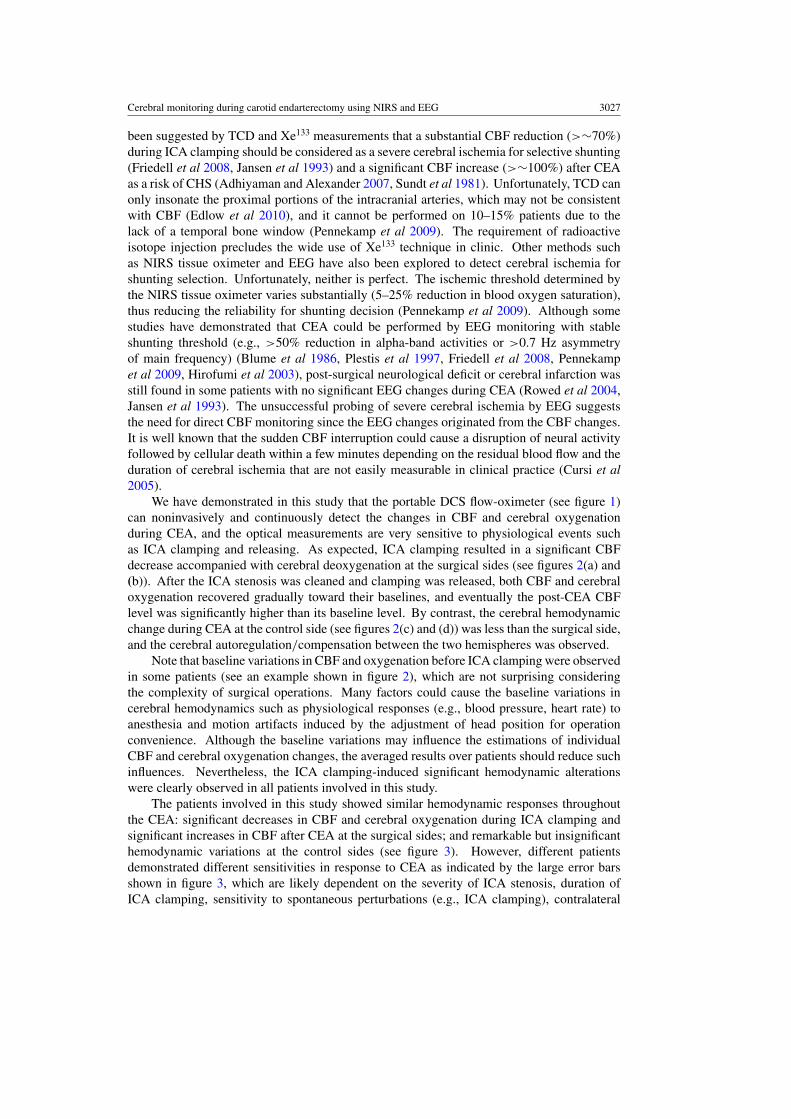
Cerebral monitoring during carotid endarterectomy using NIRS and EEG 3027
been suggested by TCD and Xe133 measurements that a substantial CBF reduction (>∼70%)during ICA clamping should be considered as a severe cerebral ischemia for selective shunting(Friedell et al 2008, Jansen et al 1993) and a significant CBF increase (>∼100%) after CEAas a risk of CHS (Adhiyaman and Alexander 2007, Sundt et al 1981). Unfortunately, TCD canonly insonate the proximal portions of the intracranial arteries, which may not be consistentwith CBF (Edlow et al 2010), and it cannot be performed on 10–15% patients due to thelack of a temporal bone window (Pennekamp et al 2009). The requirement of radioactiveisotope injection precludes the wide use of Xe133 technique in clinic. Other methods suchas NIRS tissue oximeter and EEG have also been explored to detect cerebral ischemia forshunting selection. Unfortunately, neither is perfect. The ischemic threshold determined bythe NIRS tissue oximeter varies substantially (5–25% reduction in blood oxygen saturation),thus reducing the reliability for shunting decision (Pennekamp et al 2009). Although somestudies have demonstrated that CEA could be performed by EEG monitoring with stableshunting threshold (e.g., >50% reduction in alpha-band activities or >0.7 Hz asymmetryof main frequency) (Blume et al 1986, Plestis et al 1997, Friedell et al 2008, Pennekampet al 2009, Hirofumi et al 2003), post-surgical neurological deficit or cerebral infarction wasstill found in some patients with no significant EEG changes during CEA (Rowed et al 2004,Jansen et al 1993). The unsuccessful probing of severe cerebral ischemia by EEG suggeststhe need for direct CBF monitoring since the EEG changes originated from the CBF changes.It is well known that the sudden CBF interruption could cause a disruption of neural activityfollowed by cellular death within a few minutes depending on the residual blood flow and theduration of cerebral ischemia that are not easily measurable in clinical practice (Cursi et al2005).
We have demonstrated in this study that the portable DCS flow-oximeter (see figure 1)can noninvasively and continuously detect the changes in CBF and cerebral oxygenationduring CEA, and the optical measurements are very sensitive to physiological events suchas ICA clamping and releasing. As expected, ICA clamping resulted in a significant CBFdecrease accompanied with cerebral deoxygenation at the surgical sides (see figures 2(a) and(b)). After the ICA stenosis was cleaned and clamping was released, both CBF and cerebraloxygenation recovered gradually toward their baselines, and eventually the post-CEA CBFlevel was significantly higher than its baseline level. By contrast, the cerebral hemodynamicchange during CEA at the control side (see figures 2(c) and (d)) was less than the surgical side,and the cerebral autoregulation/compensation between the two hemispheres was observed.
Note that baseline variations in CBF and oxygenation before ICA clamping were observedin some patients (see an example shown in figure 2), which are not surprising consideringthe complexity of surgical operations. Many factors could cause the baseline variations incerebral hemodynamics such as physiological responses (e.g., blood pressure, heart rate) toanesthesia and motion artifacts induced by the adjustment of head position for operationconvenience. Although the baseline variations may influence the estimations of individualCBF and cerebral oxygenation changes, the averaged results over patients should reduce suchinfluences. Nevertheless, the ICA clamping-induced significant hemodynamic alterationswere clearly observed in all patients involved in this study.
The patients involved in this study showed similar hemodynamic responses throughoutthe CEA: significant decreases in CBF and cerebral oxygenation during ICA clamping andsignificant increases in CBF after CEA at the surgical sides; and remarkable but insignificanthemodynamic variations at the control sides (see figure 3). However, different patientsdemonstrated different sensitivities in response to CEA as indicated by the large error barsshown in figure 3, which are likely dependent on the severity of ICA stenosis, duration ofICA clamping, sensitivity to spontaneous perturbations (e.g., ICA clamping), contralateral
3028 Y Shang et al
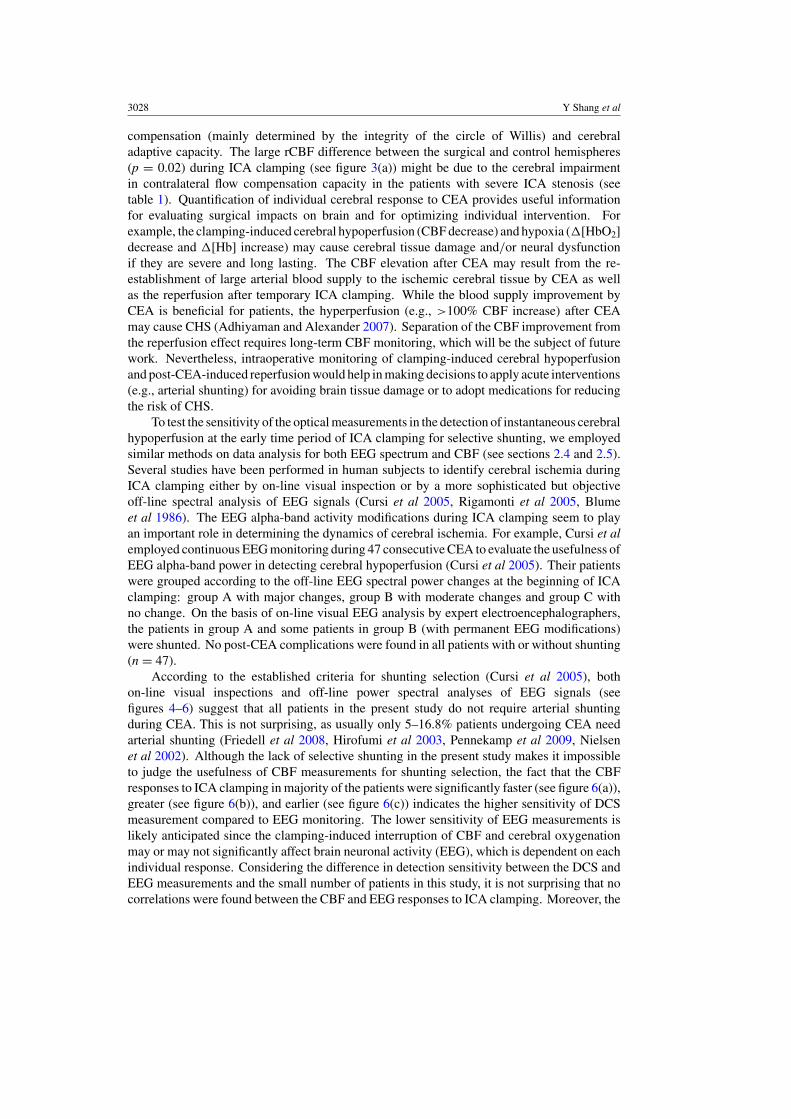
compensation (mainly determined by the integrity of the circle of Willis) and cerebraladaptive capacity. The large rCBF difference between the surgical and control hemispheres(p = 0.02) during ICA clamping (see figure 3(a)) might be due to the cerebral impairmentin contralateral flow compensation capacity in the patients with severe ICA stenosis (seetable 1). Quantification of individual cerebral response to CEA provides useful informationfor evaluating surgical impacts on brain and for optimizing individual intervention. Forexample, the clamping-induced cerebral hypoperfusion (CBF decrease) and hypoxia (�[HbO2]decrease and �[Hb] increase) may cause cerebral tissue damage and/or neural dysfunctionif they are severe and long lasting. The CBF elevation after CEA may result from the re-establishment of large arterial blood supply to the ischemic cerebral tissue by CEA as wellas the reperfusion after temporary ICA clamping. While the blood supply improvement byCEA is beneficial for patients, the hyperperfusion (e.g., >100% CBF increase) after CEAmay cause CHS (Adhiyaman and Alexander 2007). Separation of the CBF improvement fromthe reperfusion effect requires long-term CBF monitoring, which will be the subject of futurework. Nevertheless, intraoperative monitoring of clamping-induced cerebral hypoperfusionand post-CEA-induced reperfusion would help in making decisions to apply acute interventions(e.g., arterial shunting) for avoiding brain tissue damage or to adopt medications for reducingthe risk of CHS.
To test the sensitivity of the optical measurements in the detection of instantaneous cerebralhypoperfusion at the early time period of ICA clamping for selective shunting, we employedsimilar methods on data analysis for both EEG spectrum and CBF (see sections 2.4 and 2.5).Several studies have been performed in human subjects to identify cerebral ischemia duringICA clamping either by on-line visual inspection or by a more sophisticated but objectiveoff-line spectral analysis of EEG signals (Cursi et al 2005, Rigamonti et al 2005, Blumeet al 1986). The EEG alpha-band activity modifications during ICA clamping seem to playan important role in determining the dynamics of cerebral ischemia. For example, Cursi et alemployed continuous EEG monitoring during 47 consecutive CEA to evaluate the usefulness ofEEG alpha-band power in detecting cerebral hypoperfusion (Cursi et al 2005). Their patientswere grouped according to the off-line EEG spectral power changes at the beginning of ICAclamping: group A with major changes, group B with moderate changes and group C withno change. On the basis of on-line visual EEG analysis by expert electroencephalographers,the patients in group A and some patients in group B (with permanent EEG modifications)were shunted. No post-CEA complications were found in all patients with or without shunting(n = 47).
According to the established criteria for shunting selection (Cursi et al 2005), bothon-line visual inspections and off-line power spectral analyses of EEG signals (seefigures 4–6) suggest that all patients in the present study do not require arterial shuntingduring CEA. This is not surprising, as usually only 5–16.8% patients undergoing CEA needarterial shunting (Friedell et al 2008, Hirofumi et al 2003, Pennekamp et al 2009, Nielsenet al 2002). Although the lack of selective shunting in the present study makes it impossibleto judge the usefulness of CBF measurements for shunting selection, the fact that the CBFresponses to ICA clamping in majority of the patients were significantly faster (see figure 6(a)),greater (see figure 6(b)), and earlier (see figure 6(c)) indicates the higher sensitivity of DCSmeasurement compared to EEG monitoring. The lower sensitivity of EEG measurements islikely anticipated since the clamping-induced interruption of CBF and cerebral oxygenationmay or may not significantly affect brain neuronal activity (EEG), which is dependent on eachindividual response. Considering the difference in detection sensitivity between the DCS andEEG measurements and the small number of patients in this study, it is not surprising that nocorrelations were found between the CBF and EEG responses to ICA clamping. Moreover, the
Cerebral monitoring during carotid endarterectomy using NIRS and EEG 3029
observed significant differences between the two hemispheres in CBF slope, D-index and time-to-minimum indicate the sensitivity of CBF in distinguishing the ischemic and non-ischemichemispheres. By contrast, the difference between the two hemispheres in EEG response wasnot significant.
To conclude, this pilot study demonstrates the capacity of DCS flow-oximeter in detectingcerebral hypoperfusion and hypoxia during ICA clamping and cerebral reperfusion after CEA.DCS provides a direct, objective (without the need of visual inspection), straightforward(without the need of off-line power spectral analysis), and more sensitive way in determiningCBF changes compared to EEG. Early detection of the CBF interruption during CEA may alertthe surgeons to take prompt actions for preventing consequent complications. Simultaneousmonitoring of CBF and cerebral oxygenation (by DCS flow-oximeter) as well as brain neuronalactivity (by EEG) provides a comprehensive evaluation of cerebral physiological status duringCEA, thus showing a potential for adoption of acute interventions (e.g. shunting, medications)during CEA to reduce the risks of severe cerebral ischemia and CHS. More patients arebeing recruited and cerebral hemodynamic responses during CEA would be correlated withlong-term clinical outcomes (e.g., post-surgical neurological deficit or cerebral infarction) todetermine the thresholds of severe hypoperfusion during ICA clamping and hyperperfusionafter CEA.
Acknowledgments
We are thankful for the support of the American Heart Association BGIA 2350015 andthe University of Kentucky Research Funds. We also thank Dr Ivan Horvath for beneficialdiscussions on EEG data analysis, and Daniel Kameny, Douglas Long and Lisa O’Quinn fortheir assistance in the recruitment of patients.
References
Ackerstaff R G A, Jansen C, Moll F L, Vermeulen F E E, Hamerlijnck R P H M and Mauser H W 1995 Thesignificance of microemboli detection by means of transcranial Doppler ultrasonography monitoring in carotidendarterectomy J. Vasc. Surg. 21 963–9
Adhiyaman V and Alexander S 2007 Cerebral hyperperfusion syndrome following carotid endarterectomy Q. J. Med.100 239–44
Belardi P, Lucertini G and Ermirio D 2003 Stump pressure and transcranial Doppler for predicting shunting in carotidendarterectomy Eur. J. Vasc. Endovasc. Surg. 25 164–7
Blume W T, Ferguson G G and Mcneill D K 1986 Significance of EEG changes at carotid endarterectomy Stroke17 891–7
Boas D A, Campbell L E and Yodh A G 1995 Scattering and imaging with diffusing temporal field correlations Phys.Rev. Lett. 75 1855–8
Boas D A, Gaudette T, Strangman G, Cheng X F, Marota J J A and Mandeville J B 2001 The accuracy of near infraredspectroscopy and imaging during focal changes in cerebral hemodynamics Neuroimage 13 76–90
Boas D A and Yodh A G 1997 Spatially varying dynamical properties of turbid media probed with diffusing temporallight correlation J. Opt. Soc. Am. A 14 192–215
Bond R, Rerkasem K and Rothwell P M 2003 Routine or selective carotid artery shunting for carotid endarterectomy(and different methods of monitoring in selective shunting) Stroke 34 824–5
Bowen J C, Garcia M, Garrard C L, Mankin C J and Fluke M M 1997 Anomalous branch of the internal carotid arterymaintains patency distal to a complete occlusion diagnosed by duplex scan J. Vasc. Surg. 26 164–7
Buckley E M 2009 Cerebral hemodynamics in preterm infants during positional intervention measured with diffusecorrelation spectroscopy and transcranial Doppler ultrasound Opt. Express 17 12571–81
Chang Y J, Lin S K, Ryu S J and Wai Y Y 1995 Common carotid artery occlusion: evaluation with duplex sonographyAm. J. Neuroradiol. 16 1099–105
Chaturvedi S et al 2005 Carotid endarterectomy—an evidence-based review. Report of the Therapeutics andTechnology Assessment Subcommittee of the American Academy of Neurology Neurology 65 794–801
3030 Y Shang et al
Cheung C, Culver J P, Takahashi K, Greenberg J H and Yodh A G 2001 In vivo cerebrovascular measurementcombining diffuse near-infrared absorption and correlation spectroscopies Phys. Med. Biol. 46 2053–65
Cooper R J, Bhatt D, Everdell N L and Hebden J C 2009a A tissue-like optically turbid and electrically conductingphantom for simultaneous EEG and near-infrared imaging Phys. Med. Biol. 54 N403–8
Cooper R J, Everdell N L, Enfield L C, Gibson A P, Worley A and Hebden J C 2009b Design and evaluation of aprobe for simultaneous EEG and near-infrared imaging of cortical activation Phys. Med. Biol. 54 2093–102
Culver J P, Durduran T, Furuya T, Cheung C, Greenberg J H and Yodh A G 2003 Diffuse optical tomography ofcerebral blood flow, oxygenation, and metabolism in rat during focal ischemia J. Cereb. Blood FlowMetab. 23 911–24
Culver J P, Siegel A M, Franceschini M A, Mandeville J B and Boas D A 2005 Evidence that cerebral bloodvolume can provide brain activation maps with better spatial resolution than deoxygenated hemoglobinNeuroimage 27 947–59
Cursi M, Meraviglia M V, Fanelli G F, Chiesa R, Tirelli A, Comi G and Minicucci F 2005 Electroencephalographicbackground desynchronization during cerebral blood flow reduction Clin. Neurophysiol. 116 2577–85
Dietsche G, Ninck M, Ortolf C, Li J, Jaillon F and Gisler T 2007 Fiber-based multispeckle detection for time-resolveddiffusing-wave spectroscopy: characterization and application to blood flow detection in deep tissue Appl.Opt. 46 8506–14
Duncan A, Meek J H, Clemence M, Elwell C E, Tyszczuk L, Cope M and Delpy D T 1995 Optical pathlengthmeasurements on adult head, calf and forearm and the head of the newborn infant using phase resolved opticalspectroscopy Phys. Med. Biol. 40 295–304
Durduran T 2004 Non-invasive measurements of tissue hemodynamics with hybrid diffuse optical methods PhDDissertation University of Pennsylvania, Philadelphia
Durduran T, Yu G, Burnett M G, Detre J A, Greenberg J H, Wang J J, Zhou C and Yodh A G 2004 Diffuse opticalmeasurement of blood flow, blood oxygenation, and metabolism in a human brain during sensorimotor cortexactivation Opt. Lett. 29 1766–8
Durduran T et al 2009 Transcranial optical monitoring of cerebrovascular hemodynamics in acute stroke patients Opt.Express 17 3884–902
Durduran T et al 2010 Optical measurement of cerebral hemodynamics and oxygen metabolism in neonates withcongenital heart defects J. Biomed. Opt. 15 10
Edlow B L, Kim M N, Durduran T, Zhou C, Putt M E, Yodh A G, Greenberg J H and Detre J A 2010 The effects ofhealthy aging on cerebral hemodynamic responses to posture change Physiol. Meas. 31 477–95
Everdell N L, Gibson A P, Tullis I D C, Vaithianathan T, Hebden J C and Delpy D T 2005 A frequency multiplexednear-infrared topography system for imaging functional activation in the brain Rev. Sci. Instrum. 76 093705
Fantini S, Hueber D, Franceschini M A, Gratton E, Rosenfeld W, Stubblefield P G, Maulik D and Stankovic M R1999 Non-invasive optical monitoring of the newborn piglet brain using continuous-wave and frequency-domainspectroscopy Phys. Med. Biol. 44 1543–63
Farrell T J, Patterson M S and Essenpreis M 1998 Influence of layered tissue architecture on estimates of tissue opticalproperties obtained from spatially resolved diffuse reflectometry Appl. Opt. 37 1958–72
Fisch B J 1999 Fisch and Spehlmann’s EEG Primer: Basic Principles of Digital and Analog EEG 3rd edn (Amsterdam:Elsevier)
Franceschini M A, Joseph D K, Huppert T J, Diamond S G and Boas D A 2006 Diffuse optical imaging of the wholehead J. Biomed. Opt. 11 054007
Franceschini M A, Nissila I, Wu W C, Diamond S G, Bonmassar G and Boas D A 2008 Coupling betweensomatosensory evoked potentials and hemodynamic response in the rat Neuroimage 41 189–203
Friedell M L, Clark J M, Graham D A, Isley M R and Zhang X F 2008 Cerebral oximetry does not correlatewith electroencephalography and somatosensory evoked potentials in determining the need for shunting duringcarotid endarterectomy J. Vasc. Surg. 48 601–6
Gagnon L, Desjardins M, Jehanne-Lacasse J, Bherer L and Lesage F 2008 Investigation of diffuse correlationspectroscopy in multi-layered media including the human head Opt. Express 16 15514–30
Hebden J C, Gibson A, Austin T, Yusof R M, Everdell N, Delpy D T, Arridge S R, Meek J H and Wyatt J S 2004Imaging changes in blood volume and oxygenation in the newborn infant brain using three-dimensional opticaltomography Phys. Med. Biol. 49 1117–30
Hirofumi O, Otone E, Hiroshi I, Satosi I, Shigeo I and Masato N Y S 2003 The effectiveness of regional cerebraloxygen saturation monitoring using near-infrared spectroscopy in carotid endarterectomy J. Clin.Neurosci. 10 79–83
Jansen C, Vriens E M, Eikelboom B C, Vermeulen F E, van Gijn J and Ackerstaff R G 1993 Carotid endarterectomywith transcranial Doppler and electroencephalographic monitoring. A prospective study in 130 operations Stroke24 665–9

Cerebral monitoring during carotid endarterectomy using NIRS and EEG 3031
Kaiser D A 2005 Basic principles of quantitative EEG J. Adult Dev. 12 99–104Kienle A and Glanzmann T 1999 In vivo determination of the optical properties of muscle with time-resolved
reflectance using a layered model Phys. Med. Biol. 44 2689–702Kim J G, Xia M N and Liu H L 2005 Extinction coefficients of hemoglobin for near-infrared spectroscopy of tissue
IEEE Eng. Med. Biol. Mag. 24 118–21Kim M N et al 2010 Noninvasive measurement of cerebral blood flow and blood oxygenation using near-infrared and
diffuse correlation spectroscopies in critically brain-injured adults Neurocrit. Care 12 173–80Li J, Dietsche G, Iftime D, Skipetrov S E, Maret G, Elbert T, Rockstroh B and Gisler T 2005 Noninvasive
detection of functional brain activity with near-infrared diffusing-wave spectroscopy J. Biomed. Opt.10 44002
Li J, Ninck M, Koban L, Elbert T, Kissler J and Gisler T 2008 Transient functional blood flow change in the humanbrain measured noninvasively by diffusing-wave spectroscopy Opt. Lett. 33 2233–5
Mariucci G, Stasi M A, Taurelli R, Nardo P, Tantucci M, Pacifici L, Carminati P and Ambrosini M V 2003 EEGpower spectra changes and forebrain ischemia in rats Can. J. Neurol. Sci. 30 54–60
Matic P, Ilijevski N, Radak S, Kolar J and Radak D 2009 Recanalization of chronic carotid occlusion: case reportand review of the literature Vascular 17 281–3
Moritz S, Kasprzak P, Arit M, Taeger K and Metz C 2007 Accuracy of cerebral monitoring in detecting cerebralischemia during carotid endarterectomy Anesthesiology 107 563–9
Nielsen M Y, Sillesen H H, Jorgensen L G and Schroeder T V 2002 The haemodynamic effect of carotidendarterectomy Eur. J. Vasc. Endovasc. Surg. 24 53–8
Oppenheim A V and Schafer R W 1975 Digital Signal Processing (Englewood Cliffs, NJ: Prentice-Hall)Pennekamp C W A, Bots M L, Kappelle L J, Moll F L and de Borst G J 2009 The value of near-infrared spectroscopy
measured cerebral oximetry during carotid endarterectomy in perioperative stroke prevention. A review Eur. J.Vasc. Endovasc. Surg. 38 539–45
Plestis K A, Loubser P, Mizrahi E M, Kantis G, Jiang Z D and Howell J F 1997 Continuous electroencephalographicmonitoring and selective shunting reduces neurologic morbidity rates in carotid endarterectomy J. Vasc.Surg. 25 620–8
Rigamonti A, Scandroglio M, Minicucci F, Magrin S, Carozzo A and Casati A 2005 A clinical evaluation of near-infrared cerebral oximetry in the awake patient to monitor cerebral perfusion during carotid endarterectomy J.Clin. Anesth. 17 426–30
Roche-Labarbe N, Carp S A, Surova A, Patel M, Boas D A, Grant R E and Franceschini M A 2010 Noninvasiveoptical measures of CBV, StO(2), CBF index, and rCMRO(2) in human premature neonates’ brains in the firstsix weeks of life Hum. Brain Mapp. 31 341–52
Roche-Labarbe N, Wallois F, Ponchel E, Kongolo G and Grebe R 2007 Coupled oxygenation oscillation measuredby NIRS and intermittent cerebral activation on EEG in premature infants Neuroimage 36 718–27
Rovati L, Salvatori G, Bulf L and Fonda S 2007 Optical and electrical recording of neural activity evoked by gradedcontrast visual stimulus Biomed. Eng. Online 6 1–5
Rowed D W, Houlden D A, Burkholder L M and Taylor A B 2004 Comparison of monitoring techniques forintraoperative cerebral ischemia Can. J. Neurol. Sci. 31 347–56
Shang Y, Zhao Y, Cheng R, Dong L, Irwin D and Yu G 2009 Portable optical tissue flow oximeter based on diffusecorrelation spectroscopy Opt. Lett. 34 3556–8
Song Y L, Kim J G, Mason R P and Liu H L 2005 Investigation of rat breast tumour oxygen consumption byhear-infrared spectroscopy J. Phys. D: Appl. Phys. 38 2682–90
Strangman G, Franceschini M A and Boas D A 2003 Factors affecting the accuracy of near-infrared spectroscopyconcentration calculations for focal changes in oxygenation parameters Neuroimage 18 865–79
Sundt T M, Sharbrough F W, Piepgras D G, Kearns T P, Messick J M and O’Fallon W M 1981 Correlation of cerebralblood flow and electroencephalographic changes during carotid endarterectomy: with results of surgery andhemodynamics of cerebral ischemia Mayo Clin. Proc. 56 533–43
Tian F H, Chance B and Liu H L 2009 Investigation of the prefrontal cortex in response to duration-variable anagramtasks using functional near-infrared spectroscopy J. Biomed. Opt. 14 054016
van Beekvelt M C P, Borghuis M S, van Engelen B G M, Wevers R A and Colier W N J M 2001 Adipose tissuethickness affects in vivo quantitative near-IR spectroscopy in human skeletal muscle Clin. Sci. 101 21–8
Yu G, Durduran T, Lech G, Zhou C, Chance B, Mohler E R and Yodh A G 2005a Time-dependent blood flow andoxygenation in human skeletal muscles measured with noninvasive near-infrared diffuse optical spectroscopiesJ. Biomed. Opt. 10 024027
Yu G, Durduran T, Zhou C, Wang H W, Putt M E, Saunders H M, Sehgal C M, Glatstein E, Yodh A G andBusch T M 2005b Noninvasive monitoring of murine tumor blood flow during and after photodynamic therapyprovides early assessment of therapeutic efficacy Clin. Cancer Res. 11 3543–52

3032 Y Shang et al
Yu G, Floyd T F, Durduran T, Zhou C, Wang J J, Detre J A and Yodh A G 2007 Validation of diffuse correlationspectroscopy for muscle blood flow with concurrent arterial spin labeled perfusion MRI Opt. Express 15 1064–75
Zhou C et al 2007 Diffuse optical monitoring of blood flow and oxygenation in human breast cancer during earlystages of neoadjuvant chemotherapy J. Biomed. Opt. 12 051903
Zhou C, Eucker S A, Durduran T, Yu G, Ralston J, Friess S H, Ichord R N, Margulies S S and Yodh A G 2009 Diffuseoptical monitoring of hemodynamic changes in piglet brain with closed head injury J. Biomed. Opt. 14 034015
Zirak P, Delgado-Mederos R, Martı-Fabregas J and Durduran T 2010 Effects of acetazolamide on the micro- andmacro-vascular cerebral hemodynamics: a diffuse optical and transcranial Doppler ultrasound study Biomed.Opt. Express 1 1443–59