certain coated paper from china and indonesia - usitc · co., ltd., ningbo asia pulp & paper...
TRANSCRIPT
U.S. International Trade CommissionPublication 4192 November 2010
Washington, DC 20436
Certain Coated Paper Suitable for High-Quality Print Graphics Using Sheet-Fed
Presses from China and IndonesiaInvestigation Nos. 701-TA-470-471 and 731-TA-1169-1170 (Final)
U.S. International Trade Commission
COMMISSIONERS
Deanna Tanner Okun, Chairman Irving A. Williamson, Vice Chairman
Charlotte R. Lane Daniel R. Pearson Shara L. Aranoff Dean A. Pinkert
Karen Laney
Staff assigned
Address all communications to Secretary to the Commission
United States International Trade Commission Washington, DC 20436
Acting Director of Operations
Christopher Cassise, Senior Investigator Vincent Honnold, Industry Analyst
Nancy Bryan, Economist David Boyland, Accountant
Gracemary Roth-Roffy, Attorney Marc Bernstein, Attorney David Fishberg, Attorney
Steve Hudgens, Senior Statistician Jim McClure, Supervisory Investigator

U.S. International Trade CommissionWashington, DC 20436
www.usitc.gov
Publication 4192 November 2010
Certain Coated Paper Suitable for High-Quality Print Graphics Using Sheet-Fed
Presses from China and IndonesiaInvestigation Nos. 701-TA-470-471 and 731-TA-1169-1170 (Final)

C O N T E N T S
Page
Determinations . . . . . . . . . . . . . . . . . . . . . . . . . . . . . . . . . . . . . . . . . . . . . . . . . . . . . . . . . . . . . . . . . 1Views of the Commission . . . . . . . . . . . . . . . . . . . . . . . . . . . . . . . . . . . . . . . . . . . . . . . . . . . . . . . . . 3Separate Views of Commissioner Charlotte R. Lane . . . . . . . . . . . . . . . . . . . . . . . . . . . . . . . . . . 41
Part I: Introduction . . . . . . . . . . . . . . . . . . . . . . . . . . . . . . . . . . . . . . . . . . . . . . . . . . . . . . . . . . . . I-1Background . . . . . . . . . . . . . . . . . . . . . . . . . . . . . . . . . . . . . . . . . . . . . . . . . . . . . . . . . . . . . . . . . . I-1Organization of report . . . . . . . . . . . . . . . . . . . . . . . . . . . . . . . . . . . . . . . . . . . . . . . . . . . . . . . . . . I-2U.S. market summary . . . . . . . . . . . . . . . . . . . . . . . . . . . . . . . . . . . . . . . . . . . . . . . . . . . . . . . . . . I-3Summary data and data sources . . . . . . . . . . . . . . . . . . . . . . . . . . . . . . . . . . . . . . . . . . . . . . . . . . I-3Previous and related investigations . . . . . . . . . . . . . . . . . . . . . . . . . . . . . . . . . . . . . . . . . . . . . . . . I-5Nature and extent of sales at LTFV . . . . . . . . . . . . . . . . . . . . . . . . . . . . . . . . . . . . . . . . . . . . . . . I-5
China . . . . . . . . . . . . . . . . . . . . . . . . . . . . . . . . . . . . . . . . . . . . . . . . . . . . . . . . . . . . . . . . . . . . I-5Indonesia . . . . . . . . . . . . . . . . . . . . . . . . . . . . . . . . . . . . . . . . . . . . . . . . . . . . . . . . . . . . . . . . . I-6
Nature of countervailable subsidies . . . . . . . . . . . . . . . . . . . . . . . . . . . . . . . . . . . . . . . . . . . . . . . I-6China . . . . . . . . . . . . . . . . . . . . . . . . . . . . . . . . . . . . . . . . . . . . . . . . . . . . . . . . . . . . . . . . . . . . I-6Indonesia . . . . . . . . . . . . . . . . . . . . . . . . . . . . . . . . . . . . . . . . . . . . . . . . . . . . . . . . . . . . . . . . . I-9
The subject product . . . . . . . . . . . . . . . . . . . . . . . . . . . . . . . . . . . . . . . . . . . . . . . . . . . . . . . . . . . . I-10Commerce’s scope . . . . . . . . . . . . . . . . . . . . . . . . . . . . . . . . . . . . . . . . . . . . . . . . . . . . . . . . . . I-10Tariff treatment . . . . . . . . . . . . . . . . . . . . . . . . . . . . . . . . . . . . . . . . . . . . . . . . . . . . . . . . . . . . I-11Scope issues at Commerce . . . . . . . . . . . . . . . . . . . . . . . . . . . . . . . . . . . . . . . . . . . . . . . . . . . . I-13Physical characteristics and uses . . . . . . . . . . . . . . . . . . . . . . . . . . . . . . . . . . . . . . . . . . . . . . . I-15Categories of certain coated paper . . . . . . . . . . . . . . . . . . . . . . . . . . . . . . . . . . . . . . . . . . . . . . I-17Manufacturing processes . . . . . . . . . . . . . . . . . . . . . . . . . . . . . . . . . . . . . . . . . . . . . . . . . . . . . I-19
Intermediate products . . . . . . . . . . . . . . . . . . . . . . . . . . . . . . . . . . . . . . . . . . . . . . . . . . . . . . . . . . I-22Sheeter rolls vs. Sheets . . . . . . . . . . . . . . . . . . . . . . . . . . . . . . . . . . . . . . . . . . . . . . . . . . . . . . I-22
Domestic like product issues . . . . . . . . . . . . . . . . . . . . . . . . . . . . . . . . . . . . . . . . . . . . . . . . . . . . I-24Certain coated paper vs. web rolls . . . . . . . . . . . . . . . . . . . . . . . . . . . . . . . . . . . . . . . . . . . . . . I-24Certain coated paper other than certain coated paperboard vs. certain coated paperboard . . . I-25
Part II: Conditions of competition in the U.S. market . . . . . . . . . . . . . . . . . . . . . . . . . . . . . . . . II-1U.S. market characteristics . . . . . . . . . . . . . . . . . . . . . . . . . . . . . . . . . . . . . . . . . . . . . . . . . . . . . . II-1Channels of distribution . . . . . . . . . . . . . . . . . . . . . . . . . . . . . . . . . . . . . . . . . . . . . . . . . . . . . . . . II-2Supply and demand considerations . . . . . . . . . . . . . . . . . . . . . . . . . . . . . . . . . . . . . . . . . . . . . . . . II-6
U.S. supply . . . . . . . . . . . . . . . . . . . . . . . . . . . . . . . . . . . . . . . . . . . . . . . . . . . . . . . . . . . . . . . II-6U.S. demand . . . . . . . . . . . . . . . . . . . . . . . . . . . . . . . . . . . . . . . . . . . . . . . . . . . . . . . . . . . . . . II-11
Substitutability issues . . . . . . . . . . . . . . . . . . . . . . . . . . . . . . . . . . . . . . . . . . . . . . . . . . . . . . . . . . II-14Factors affecting purchasing decisions . . . . . . . . . . . . . . . . . . . . . . . . . . . . . . . . . . . . . . . . . . II-14Comparison of domestic product and subject imports . . . . . . . . . . . . . . . . . . . . . . . . . . . . . . . II-17Other country comparisons . . . . . . . . . . . . . . . . . . . . . . . . . . . . . . . . . . . . . . . . . . . . . . . . . . . II-19
Elasticity estimates . . . . . . . . . . . . . . . . . . . . . . . . . . . . . . . . . . . . . . . . . . . . . . . . . . . . . . . . . . . . II-20U.S. supply elasticity . . . . . . . . . . . . . . . . . . . . . . . . . . . . . . . . . . . . . . . . . . . . . . . . . . . . . . . . II-20U.S. demand elasticity . . . . . . . . . . . . . . . . . . . . . . . . . . . . . . . . . . . . . . . . . . . . . . . . . . . . . . . II-21Substitution elasticity . . . . . . . . . . . . . . . . . . . . . . . . . . . . . . . . . . . . . . . . . . . . . . . . . . . . . . . II-21
i

C O N T E N T S
Page
Part III: U.S. producers’ production, shipments, and employment . . . . . . . . . . . . . . . . . . . . . . III-1U.S. producers . . . . . . . . . . . . . . . . . . . . . . . . . . . . . . . . . . . . . . . . . . . . . . . . . . . . . . . . . . . . . . . III-1
U.S. producers of certain coated paper other than coated packaging paperboard . . . . . . . . . . III-1U.S. producers of coated packaging paperboard . . . . . . . . . . . . . . . . . . . . . . . . . . . . . . . . . . . III-2U.S. converters . . . . . . . . . . . . . . . . . . . . . . . . . . . . . . . . . . . . . . . . . . . . . . . . . . . . . . . . . . . . III-2
U.S. capacity, production, and capacity utilization . . . . . . . . . . . . . . . . . . . . . . . . . . . . . . . . . . . III-5Overall U.S. capacity of all U.S. integrated producers . . . . . . . . . . . . . . . . . . . . . . . . . . . . . . III-5U.S. integrated producers . . . . . . . . . . . . . . . . . . . . . . . . . . . . . . . . . . . . . . . . . . . . . . . . . . . . III-7U.S. converters . . . . . . . . . . . . . . . . . . . . . . . . . . . . . . . . . . . . . . . . . . . . . . . . . . . . . . . . . . . . III-10
U.S. producers’ U.S. shipments and export shipments . . . . . . . . . . . . . . . . . . . . . . . . . . . . . . . . . III-11U.S. integrated producers . . . . . . . . . . . . . . . . . . . . . . . . . . . . . . . . . . . . . . . . . . . . . . . . . . . . III-11U.S. converters . . . . . . . . . . . . . . . . . . . . . . . . . . . . . . . . . . . . . . . . . . . . . . . . . . . . . . . . . . . . III-15
U.S. producers’ imports and purchases of imports . . . . . . . . . . . . . . . . . . . . . . . . . . . . . . . . . . . . III-15U.S. producers’ inventories . . . . . . . . . . . . . . . . . . . . . . . . . . . . . . . . . . . . . . . . . . . . . . . . . . . . . III-16U.S. employment, wages, and productivity . . . . . . . . . . . . . . . . . . . . . . . . . . . . . . . . . . . . . . . . . III-17
Part IV: U.S. imports, apparent consumption, and market shares . . . . . . . . . . . . . . . . . . . . . . IV-1U.S. importers . . . . . . . . . . . . . . . . . . . . . . . . . . . . . . . . . . . . . . . . . . . . . . . . . . . . . . . . . . . . . . . . IV-1U.S. imports . . . . . . . . . . . . . . . . . . . . . . . . . . . . . . . . . . . . . . . . . . . . . . . . . . . . . . . . . . . . . . . . . IV-3Cumulation considerations . . . . . . . . . . . . . . . . . . . . . . . . . . . . . . . . . . . . . . . . . . . . . . . . . . . . . . IV-5Negligibility . . . . . . . . . . . . . . . . . . . . . . . . . . . . . . . . . . . . . . . . . . . . . . . . . . . . . . . . . . . . . . . . . IV-5Apparent U.S. consumption and market shares . . . . . . . . . . . . . . . . . . . . . . . . . . . . . . . . . . . . . . IV-7
Certain coated paper other than coated packaging paperboard . . . . . . . . . . . . . . . . . . . . . . . . IV-7Total U.S. integrated production . . . . . . . . . . . . . . . . . . . . . . . . . . . . . . . . . . . . . . . . . . . . . . . IV-10
Ratio of imports to U.S. production . . . . . . . . . . . . . . . . . . . . . . . . . . . . . . . . . . . . . . . . . . . . . . . IV-13
Part V: Pricing and related information . . . . . . . . . . . . . . . . . . . . . . . . . . . . . . . . . . . . . . . . . . . . V-1Factors affecting prices . . . . . . . . . . . . . . . . . . . . . . . . . . . . . . . . . . . . . . . . . . . . . . . . . . . . . . . . . V-1
Raw material costs . . . . . . . . . . . . . . . . . . . . . . . . . . . . . . . . . . . . . . . . . . . . . . . . . . . . . . . . . . V-1U.S. inland transportation costs . . . . . . . . . . . . . . . . . . . . . . . . . . . . . . . . . . . . . . . . . . . . . . . . V-1
Pricing practices . . . . . . . . . . . . . . . . . . . . . . . . . . . . . . . . . . . . . . . . . . . . . . . . . . . . . . . . . . . . . . V-1Pricing methods . . . . . . . . . . . . . . . . . . . . . . . . . . . . . . . . . . . . . . . . . . . . . . . . . . . . . . . . . . . . V-1Sales terms and discounts . . . . . . . . . . . . . . . . . . . . . . . . . . . . . . . . . . . . . . . . . . . . . . . . . . . . V-2
Price data . . . . . . . . . . . . . . . . . . . . . . . . . . . . . . . . . . . . . . . . . . . . . . . . . . . . . . . . . . . . . . . . . . . V-3Price trends . . . . . . . . . . . . . . . . . . . . . . . . . . . . . . . . . . . . . . . . . . . . . . . . . . . . . . . . . . . . . . . V-4Price comparisons . . . . . . . . . . . . . . . . . . . . . . . . . . . . . . . . . . . . . . . . . . . . . . . . . . . . . . . . . . V-9
Lost sales and lost revenues . . . . . . . . . . . . . . . . . . . . . . . . . . . . . . . . . . . . . . . . . . . . . . . . . . . . . V-12
ii
C O N T E N T S
Page
Part VI: Financial condition of U.S. producers . . . . . . . . . . . . . . . . . . . . . . . . . . . . . . . . . . . . . . VI-1Background . . . . . . . . . . . . . . . . . . . . . . . . . . . . . . . . . . . . . . . . . . . . . . . . . . . . . . . . . . . . . . . . . . VI-1Operations on certain coated paper other than coated packaging paperboard . . . . . . . . . . . . . . . VI-1Operations on coated packaging paperboard . . . . . . . . . . . . . . . . . . . . . . . . . . . . . . . . . . . . . . . . VI-2Combined operations on certain coated paper other than coated packaging
paperboard and coated packaging paperboard . . . . . . . . . . . . . . . . . . . . . . . . . . . . . . . . . . . . . VI-11Capital expenditures, research and development expenses, assets, and return on investment . . . VI-20Capital and investment . . . . . . . . . . . . . . . . . . . . . . . . . . . . . . . . . . . . . . . . . . . . . . . . . . . . . . . . . VI-21
Part VII: Threat considerations . . . . . . . . . . . . . . . . . . . . . . . . . . . . . . . . . . . . . . . . . . . . . . . . . . VII-1The industry in China . . . . . . . . . . . . . . . . . . . . . . . . . . . . . . . . . . . . . . . . . . . . . . . . . . . . . . . . . . VII-2The industry in Indonesia . . . . . . . . . . . . . . . . . . . . . . . . . . . . . . . . . . . . . . . . . . . . . . . . . . . . . . . VII-10Combined industry data for both subject countries . . . . . . . . . . . . . . . . . . . . . . . . . . . . . . . . . . . VII-11
U.S. importers’ inventories . . . . . . . . . . . . . . . . . . . . . . . . . . . . . . . . . . . . . . . . . . . . . . . . . . . . . . VII-11U.S. importers’ current orders . . . . . . . . . . . . . . . . . . . . . . . . . . . . . . . . . . . . . . . . . . . . . . . . . . . VII-11Antidumping and countervailing duty orders in third-country markets . . . . . . . . . . . . . . . . . . . . VII-11Information on producers in nonsubject countries . . . . . . . . . . . . . . . . . . . . . . . . . . . . . . . . . . . . VII-12
Appendixes
A. Federal Register notices . . . . . . . . . . . . . . . . . . . . . . . . . . . . . . . . . . . . . . . . . . . . . . . . . . . . . . . A-1B. List of conference witnesses . . . . . . . . . . . . . . . . . . . . . . . . . . . . . . . . . . . . . . . . . . . . . . . . . . . B-1C. Summary data . . . . . . . . . . . . . . . . . . . . . . . . . . . . . . . . . . . . . . . . . . . . . . . . . . . . . . . . . . . . . . . C-1D. Nonsubject pricing data . . . . . . . . . . . . . . . . . . . . . . . . . . . . . . . . . . . . . . . . . . . . . . . . . . . . . . . D-1
Note.--Information that would reveal confidential operations of individual concerns may not be publishedand therefore has been deleted from this report. Such deletions are indicated by asterisks.
iii

UNITED STATES INTERNATIONAL TRADE COMMISSION
Investigation Nos. 701-TA-470-471 and 731-TA-1169-1170 (Final)
CERTAIN COATED PAPER SUITABLE FOR HIGH-QUALITY PRINT GRAPHICS USING SHEET-FED PRESSES FROM CHINA AND INDONESIA
DETERMINATIONS
On the basis of the record1 developed in the subject investigations, the United States InternationalTrade Commission (Commission) determines, pursuant to sections 705(b) and 735(b) of the Tariff Act of1930 (19 U.S.C. § 1671d(b)) and (19 U.S.C. § 1673d(b)) (the Act), that an industry in the United States isthreatened with material injury2 3 by reason of imports of certain coated paper suitable for high-qualityprint graphics using sheet-fed presses (“certain coated paper”) from China and Indonesia, provided for insubheadings 4810.14.11, 4810.14.19, 4810.14.20, 4810.14.50, 4810.14.60, 4810.14.70, 4810.19.11,4810.19.19, 4810.19.20, 4810.22.10, 4810.22.50, 4810.22.60, 4810.22.70, 4810.29.10, 4810.29.50,4810.29.60, 4810.29.70, 4810.32, 4810.39, and 4810.92, of the Harmonized Tariff Schedule of the UnitedStates, that the U.S. Department of Commerce has determined are subsidized by the Governments ofChina and Indonesia and sold in the United States at less than fair value (“LTFV”).
BACKGROUND
The Commission instituted these investigations effective September 23, 2009, following receiptof a petition filed with the Commission and Commerce by Appleton Coated, LLC, Kimberly, WI;NewPage Corp., Miamisburg, OH; Sappi Fine Paper North America, Boston, MA; and the United Steel,Paper and Forestry, Rubber Manufacturing, Energy, Allied Industrial and Service Workers InternationalUnion (“USW”). The final phase of the investigations was scheduled by the Commission followingnotification of preliminary determinations by Commerce that imports of certain coated paper from Chinaand Indonesia were subsidized by the Governments of China and Indonesia within the meaning of section703(b) of the Act (19 U.S.C. § 1671b(b)) and dumped within the meaning of 733(b) of the Act (19 U.S.C.§ 1673b(b)). Notice of the scheduling of the final phase of the Commission’s investigations and of apublic hearing to be held in connection therewith was given by posting copies of the notice in the Officeof the Secretary, U.S. International Trade Commission, Washington, DC, and by publishing the notice inthe Federal Register on May 25, 2010 (75 FR 29364). The hearing was held in Washington, DC, onSeptember 16, 2010, and all persons who requested the opportunity were permitted to appear in person orby counsel.
1 The record is defined in sec. 207.2(f) of the Commission’s Rules of Practice and Procedure (19 CFR § 207.2(f)).
2 Commissioner Charlotte R. Lane determines that the domestic certain coated paper industry is materially injuredby reason of imports of the subject merchandise from China and Indonesia.
3 Chairman Deanna Tanner Okun, Commissioner Daniel R. Pearson, Commissioner Shara L. Aranoff,Commissioner Irving A. Williamson, and Commissioner Dean A. Pinkert determine that they would not have foundmaterial injury but for the suspension of liquidation.
1

VIEWS OF THE COMMISSION
Based on the record in the final phase of these investigations, we find that an industry in theUnited States is threatened with material injury by reason of imports of certain coated paper suitable forhigh-quality print graphics using sheet-fed presses (“coated paper”) from China and Indonesia that aresold in the United States at less than fair value (“LTFV”) and subsidized by the Governments of Chinaand Indonesia.1
I. BACKGROUND
Domestic producers Appleton Coated, LLC (“Appleton”), NewPage Corporation (“NewPage”),S.D. Warren Company d/b/a Sappi Fine Paper North America (“Sappi”), and a workers union, UnitedSteel, Paper and Forestry, Rubber Manufacturing, Energy, Allied Industrial and Service WorkersInternational Union (collectively “Petitioners”) filed the petition in these investigations on September 23,2009. Petitioners appeared at the hearing and filed joint prehearing and posthearing briefs.
Respondents encompass a group of producers of subject merchandise that participated in theseproceedings through their corporate affiliates Asia Pulp and Paper, Ltd. (China) and Asia Pulp and Paper,Ltd. (Indonesia) (collectively “APP”). The specific producers represented by APP include Chineseproducers Gold East Paper (Jiangsu) Co. Ltd., Gold Huasheng Paper Co., Ltd., Ningbo Zhonghua PaperCo., Ltd., Ningbo Asia Pulp & Paper Co., Ltd., and Indonesian producers PT Pindo Deli Pulp and PaperMills, PT, Pabrik Kertas Tjiwa Kimia, Tbk, and PT Indah Kiat Pulp and Paper Tbk.
The Commission received questionnaire responses from 11 integrated U.S. producers of coatedpaper and coated paperboard products and four U.S. converters of such products.2 It also receivedquestionnaire responses from 11 importers which accounted for a majority of U.S. imports from Chinaand Indonesia,3 35 U.S. purchasers,4 ten Chinese producers accounting for approximately *** percent of2009 production of subject merchandise from that country,5 and three Indonesian producers accountingfor approximately *** percent of 2009 production of subject merchandise from that country.6
II. DOMESTIC LIKE PRODUCT
A. In General
In determining whether an industry in the United States is materially injured or threatened withmaterial injury by reason of imports of the subject merchandise, the Commission first defines the
1 Commissioner Charlotte R. Lane finds an industry in the United States is materially injured by reason of importsof certain coated paper suitable for high-quality print graphics using sheet-fed presses from China and Indonesia thatare sold in the United States at less than fair value and subsidized by the Governments of China and Indonesia. SeeSeparate Views of Commissioner Charlotte R. Lane. She joins sections I-VI of these Views.
2 Confidential Report (CR) at I-4, Public Report (PR) at I-4. The questionnaire data are believed to account forthe vast majority of production of the domestic like product that the Commission has defined in section II below. See CR/PR at I-4 n.8, III-1 n.4.
3 CR at IV-1, PR at IV-1.
4 CR at II-2, PR at II-1.
5 CR at VII-2, PR at VII-2.
6 CR at VII-13, PR at VII-10.
3

“domestic like product” and the “industry.”7 Section 771(4)(A) of the Tariff Act of 1930, as amended(“the Tariff Act”), defines the relevant domestic industry as the “producers as a whole of a domestic likeproduct, or those producers whose collective output of a domestic like product constitutes a majorproportion of the total domestic production of the product.”8 In turn, the Tariff Act defines “domestic likeproduct” as “a product which is like, or in the absence of like, most similar in characteristics and useswith, the article subject to an investigation ... .”9
The decision regarding the appropriate domestic like product(s) in an investigation is a factualdetermination, and the Commission has applied the statutory standard of “like” or “most similar incharacteristics and uses” on a case-by-case basis.10 No single factor is dispositive, and the Commissionmay consider other factors it deems relevant based on the facts of a particular investigation.11 TheCommission looks for clear dividing lines among possible like products and disregards minor variations.12 Although the Commission must accept the determination of the U.S. Department of Commerce(“Commerce”) as to the scope of the imported merchandise subsidized or sold at LTFV,13 the Commissiondetermines what domestic product is like the imported articles Commerce has identified.14
B. Imported Merchandise within Scope
In its final determinations, Commerce defined the imported merchandise within the scope of theseinvestigations as follows:
certain coated paper and paperboard in sheets suitable for high quality print graphicsusing sheet-fed presses; coated on one or both sides with kaolin (China or other clay),
7 19 U.S.C. § 1677(4)(A).
8 19 U.S.C. § 1677(4)(A).
9 19 U.S.C. § 1677(10).
10 See, e.g., Cleo, Inc. v. United States, 501 F.3d 1291, 1299 (Fed. Cir. 2007); NEC Corp. v. Department ofCommerce, 36 F. Supp.2d 380, 383 (Ct. Int’l Trade 1998); Nippon Steel Corp. v. United States, 19 CIT 450, 455(1995); Torrington Co. v. United States, 747 F. Supp. 744, 749 n.3 (Ct. Int’l Trade 1990), aff’d, 938 F.2d 1278 (Fed.Cir. 1991) (“every like product determination ‘must be made on the particular record at issue’ and the ‘unique factsof each case’”). The Commission generally considers a number of factors including the following: (1) physicalcharacteristics and uses; (2) interchangeability; (3) channels of distribution; (4) customer and producer perceptionsof the products; (5) common manufacturing facilities, production processes, and production employees; and, whereappropriate, (6) price. See Nippon, 19 CIT at 455 n.4; Timken Co. v. United States, 913 F. Supp. 580, 584 (Ct. Int’lTrade 1996).
11 See, e.g., S. Rep. No. 96-249 at 90-91 (1979).
12 Nippon, 19 CIT at 455; Torrington, 747 F. Supp. at 748-49; see also S. Rep. No. 96-249 at 90-91 (1979)(Congress has indicated that the like product standard should not be interpreted in “such a narrow fashion as topermit minor differences in physical characteristics or uses to lead to the conclusion that the product and article arenot ‘like’ each other, nor should the definition of ‘like product’ be interpreted in such a fashion as to preventconsideration of an industry adversely affected by the imports under consideration.”).
13 See, e.g., USEC, Inc. v. United States, 34 Fed. Appx. 725, 730 (Fed. Cir. 2002) (“The ITC may not modify theclass or kind of imported merchandise examined by Commerce.”); Algoma Steel Corp. v. United States, 688 F.Supp. 639, 644 (Ct. Int’l Trade 1988), aff’d, 865 F.3d 240 (Fed. Cir.), cert. denied, 492 U.S. 919 (1989).
14 Hosiden Corp. v. Advanced Display Mfrs., 85 F.3d 1561, 1568 (Fed. Cir. 1996) (Commission may find a singlelike product corresponding to several different classes or kinds defined by Commerce); Cleo, 501 F.3d at 1298 n.1(“Commerce’s {scope} finding does not control the Commission’s {like product} determination.”); Torrington, 747F. Supp. at 748-52 (affirming Commission determination of six like products in investigations where Commercefound five classes or kinds).
4
calcium carbonate, titanium dioxide, and/or other inorganic substances; with or without abinder; having a GE brightness level of 80 or higher; weighing not more than 340 gramsper square meter; whether gloss grade, satin grade, matte grade, dull grade, or any othergrade of finish; whether or not surface-colored, surface-decorated, printed (except asdescribed below), embossed, or perforated; and irrespective of dimensions (“certaincoated paper”).
Certain coated paper includes: (a) coated free sheet paper and paperboard that meets thisscope definition; (b) coated groundwood paper and paperboard produced from bleachedchemi-thermo-mechanical pulp (“BCTMP”) that meets this scope definition; and (c) anyother coated paper and paperboard that meets this scope definition.15
There is no dispute that the scope covers coated paper in sheets meeting the brightness, basisweight, and other physical limitations stated in the scope definition. There is also no dispute that thescope covers coated paperboard in sheets meeting the brightness, basis weight, and other physicallimitations stated in the scope definition that is used in commercial printing applications. There is,however, a dispute concerning the extent to which the language stating that in-scope merchandise must be“suitable for high quality print graphics” serves to limit in-scope paperboard to commercial printingapplications and does not include paperboard used for packaging. As explained below, Commerce hasnot squarely resolved this issue.
Neither party has made a consistent argument on this issue throughout the various Commerce andCommission proceedings. Before Commerce, Petitioners argued that the “suitable for high quality printgraphics” language was “surplusage and its removal from the description would not result in anyalteration or expansion of the scope.”16 Before the Commission, by contrast, Petitioners maintain that“the phrase . . . is essential to define subject merchandise.”17 For their part, Respondents argued beforeCommerce that the “suitable for high quality print graphics” language was an “important limiting physicalcharacteristic” that was an essential part of the scope.18 By contrast, Respondents submitted an affidavitto the Commission contending that this phrase has no real meaning in the industry and contend that thelanguage, taken by itself, does not currently exclude any merchandise otherwise covered by the scope.19
We rely on Commerce’s own explanation for why it has retained this phrase in the scopedefinition. Commerce addressed the issue in an August 3, 2010 memorandum concerning scope issues inthe investigations.20 We find several statements in the Commerce memorandum of particularsignificance. Most importantly, Commerce found that “no one has put forward an objective definition of
15 75 Fed. Reg. 59209, 59210 (Sept. 27, 2010) (Indonesia CVD); 75 Fed. Reg. 59212, 59213 (Sept. 27, 2010)(China CVD); 75 Fed. Reg. 59217, 59219 (Sept. 27, 2010) (China AD); 75 Fed. Reg. 59223, 59224 (Sept. 27, 2010)(Indonesia AD).
16 Letter from Petitioners to Gary Locke at 4 (Apr. 9, 2010); see also Petitioners’ Rebuttal Brief Regarding Scopeat 15 (Aug. 24, 2010). Both submissions appear in ex. 6 to Petitioners’ Response to October 12 Commission Letter(Oct. 14, 2010) (“Petitioners’ October Scope Submission”).
17 Petitioners’ Final Comments at 8.
18 Respondents’ Additional Scope Comments at 18 (Mar. 29, 2010); Respondents’ Case Brief Concerning ScopeIssues at 21 (Aug. 20, 2010). Both submissions appear at ex. 6 to Petitioners’ October Scope Submission.
19 Respondents’ Response to October 12 Commission Letter (Oct. 14, 2010) (“Respondents’ October ScopeSubmission”), attachment 13, Aff. of Mark Dragoo, ¶¶ 2-3; Respondents’ Final Comments at 8.
20 Memorandum from Susan Kuhbach to Ronald K. Lorentzen (Aug. 3, 2010) (“Commerce ScopeMemorandum”). Commerce relied on the analysis in this memorandum in making its final scope determinations. See Commerce Issues and Decision Memorandum at 57 (Sept. 20, 2010).
5
the phrase ‘suitable for high quality print graphics.’”21 Because Commerce found that the phrase does nothave a particular meaning in the industry and provided no clarification, and because the parties have notconstrued it consistently, we look to its plain and ordinary meaning. In this respect, we do not find thephrase “suitable for high quality print graphics” is limited to use for commercial printing applications. Products may be suitable for high quality print graphics without actually being used in printingapplications.22 For this reason, we cannot accept Petitioners’ current argument that only products “usedfor printing” are within the scope.23 Additionally, Commerce does not provide any description of thetypes of otherwise in-scope merchandise that the phrase “suitable for high quality print graphics” wouldserve to exclude. To the contrary, it states that “it may be difficult to determine whether there are anyproducts that meet the physical description of the scope that would somehow not be suitable for highquality print graphics such that they should not be included in these investigations.”24 AlthoughCommerce retained the language in the scope because its deletion could potentially expand the scope ofthe investigation, Commerce did not describe the merchandise that the phrase excludes from the scope. Instead, it merely states that the language will permit specific products to be excluded from the scope ifsuch action is warranted after a case-specific analysis.25 We therefore find that the “suitable for highquality print graphics” phrase in the scope definition does not distinguish any particular types of productsas being outside the scope definition. Consequently, we find that paperboard otherwise meeting thephysical specifications set forth in the scope is included in the scope, even if such paperboard is used forpackaging, rather than only for commercial printing.
C. Domestic Like Product
1. Whether Coated Paper and Paperboard are Separate Domestic Like Products
During the investigations, the Commission requested that the parties address whether coatedpaper and paperboard are separate domestic like products. Each party contends that the Commissionshould not divide the domestically produced merchandise meeting the specifications of the scopedefinition into multiple domestic like products.26
We find that there is no clear dividing line between coated paper and paperboard that we havedetermined is within the scope definition. Both coated paper and paperboard are used in commercialprinting applications.27 They overlap on such physical characteristics as brightness, basis weight, andcaliper.28 To the extent that the products overlap in these physical characteristics, they are considered
21 Commerce Scope Memorandum at 9. This is also an accurate characterization of the record before theCommission.
22 Some paperboard products are used in packaging for consumer goods such as frozen foods and cereal boxestypically characterized by the use of print graphics. See CR at I-22, PR at I-19. See also Respondents’ OctoberScope Submission, attachment 5 (domestically produced paperboard packaging product promoted as being suitablefor “high end printing applications”).
23 See Petitioners’ Posthearing Brief, Response to Commissioners’ Questions, tab 1 at 4.
24 Commerce Scope Memorandum at 10 (emphasis in original).
25 Commerce Scope Memorandum at 9-10.
26 Petitioners’ Posthearing Brief, Response to Commissioners’ Questions, tab 4 at 1; Respondents’ PosthearingBrief, ex. 3 at 4.
27 CR at I-21-22, PR at I-17-18.
28 CR at I-21-23, PR at I-17-19.
6
broadly interchangeable in the marketplace,29 and are sold in similar channels of distribution.30 Coatedpaper and paperboard are usually made by different producers, although they are typically produced usingsimilar processes and equipment.31 The record does not indicate that market participants perceive coatedpaper and paperboard as distinct products.32 Accordingly, we do not define multiple domestic likeproducts corresponding to those articles within the scope definition.
2. Whether Sheeter Rolls Should be Included in the Domestic Like Product
Sheeter rolls are a semi-finished form of coated paper products. Integrated producers orindependent converters cut a sheeter roll into individual sheets.33 Because the scope definition includesonly merchandise “in sheets,” sheeter rolls are not included within the scope. In the preliminarydeterminations, the Commission included sheeter rolls within the domestic like product after applying its“semifinished product” like product analysis. It found that virtually all sheeter rolls are used in theproduction of coated paper, and there is at most a small market for sheeter rolls. Moreover, sheeter rollsrepresent a substantial proportion of the cost and value of the finished product and undergo only one otherproduction step before transformation into coated paper.34
We find that the record concerning sheeter rolls has not changed since the preliminary phaseinvestigations. The parties also do not dispute the inclusion of sheeter rolls in the domestic like product.35 Accordingly, for the reasons stated in the preliminary determinations, we include sheeter rolls within thedomestic like product.
3. Whether Web Rolls Should be Included in the Domestic Like Product
Web rolls are rolls of coated free sheet paper intended for use in web presses, which are largeprinting machines designed to handle high volume printing runs at high speeds. Unlike sheeter rolls, webrolls undergo no further processing prior to use in web presses.36 Because these products are not in sheetform, they are not included within the scope. Respondents contend that web rolls should be includedwithin the domestic like product.37 Petitioners disagree.38
29 CR at I-22, PR at I-18.
30 Respondents’ Posthearing Brief, ex. 36, Aff. of Mark Dragoo, ¶ 22.
31 Respondents’ Posthearing Brief, ex. 36, Aff. of Mark Dragoo, ¶¶ 20-21.
32 CR at I-20 n.48, PR at I-17 n.48 (no common or objective definition of “paperboard” within the U.S. paperindustry); Respondents’ Posthearing Brief, ex. 36, Aff. of Mark Dragoo, ¶ 12.
33 See CR at I-26, 29-30, PR at I-21, 23.
34 Certain Coated Paper Suitable for High-Quality Print Graphics Using Sheet-Fed Presses from China andIndonesia, Inv. Nos. 701-TA-470-471 and 731-TA-1169-1170 (Preliminary), USITC Pub. 4108 at 8 (Nov. 2009)(“Preliminary Determinations”).
35 See Petitioners’ Posthearing Brief, Response to Commission Questions, tab 3 at 1; Respondents’ PrehearingBrief at 16.
36 See Preliminary Determinations, USITC Pub. 4108 at I-10-11.
37 Respondents’ Prehearing Brief at 16-20. Respondents’ contention that the Commission acted unfairly bydeclining to collect trade and financial data concerning web rolls in the final phase questionnaires, id. at 12-15,overlooks several important facts. First, in the preliminary determinations the Commission undertook a detailedanalysis of Respondents’ argument that web rolls should be included in the domestic like product. PreliminaryDeterminations, USITC Pub. 4108 at 9-10. The Commission found Respondents’ contentions to be without merit. Significantly, the preliminary determinations did not contain any statement that the issue was particularly close orwarranted further consideration in the final phase investigations. Consequently, the final phase draft questionnaires
(continued...)
7
We analyze below whether web rolls should be included in the domestic like product. Much ofour discussion is devoted to addressing Respondents’ contentions that the findings in the preliminarydeterminations of clear distinctions between web rolls and the other products within the Commission’sdomestic like product were irrelevant or incorrect.
Physical Characteristics and End Uses. In its preliminary determinations, the Commissiondetermined that, although web rolls and coated paper are both used in printing applications, the productsdiffer physically from one another because of the requirements of the presses on which they are used. Specifically, the Commission found that coated paper has a high moisture level to prevent the paper fromcurling and to eliminate the build-up of static charges that cause paper jams in sheet-fed presses. Additionally, it noted that coated paper is less porous than web rolls to accommodate high tack inks usedin sheet-fed presses. The Commission also observed that coated paper also must have certain mechanicalproperties, such as flatness (meaning waves in the paper) and stability.39 In contrast, the Commissionfound that web rolls have a lower moisture content and a higher porosity than coated paper which permitthe web roll to withstand the heat setting of the web press and not blister and fail. Finally, theCommission found that web rolls hold a substantial amount of paper, and may weigh one to five tons,permitting web press printers to run high volume print jobs at high speeds.40
In the final phase investigations, Respondents contend that the only possible physical distinctionsbetween web rolls and coated paper concern moisture content and porosity.41 Respondents introducedtestimony from Robert Hanscom, a sales executive for Eagle Ridge Paper, maintaining that significantchanges in the paper production process and printing technology have minimized the importance of thesedistinctions.42 Mr. Hanscom’s testimony is contradicted by other evidence in the record.43 Specifically,Petitioners’ witnesses testified that although they use state of the art equipment, moisture content and
37 (...continued)staff circulated to the parties for comment pursuant to Commission rule 207.20(b) did not seek informationconcerning web rolls. Respondents, in their comments on the draft questionnaires, argued that the Commissionshould seek such information. These comments essentially involved the same arguments that Respondents assertedduring the preliminary phase. See Respondents’ Comments on Draft Questionnaires at 9-15 (June 2, 2010).
We considered Respondents’ renewed arguments before approving issuance of the questionnaires, but didnot direct that the questionnaires seek additional trade and financial data on web rolls. We emphasize that we do notsimply grant as a matter of course parties’ requests that questionnaires in final phase investigations seek informationabout different like product breakouts. To militate against undue burden to the parties, and to best utilize theCommission’s own staff resources, in determining whether to request such information in this case we considered,among other factors, the likely burden entailed by such requests and the fact that the issue had been considered anddecided in the preliminary determinations on the basis of essentially the same arguments.
Nevertheless, the Commission continued to collect information bearing on the like product issue in thebriefs and hearing testimony of Petitioners and Respondents. As discussed below, this additional informationsupports our conclusion not to define the domestic like product to include web rolls.
38 Petitioners’ Posthearing Brief at 6-8.
39 Preliminary Determinations, USITC Pub. 4108 at 9.
40 Preliminary Determinations, USITC Pub. 4108 at 9.
41 Respondents’ Prehearing Brief at 18.
42 Respondents’ Prehearing Brief, ex. 2 at 2.
43 We observe that Mr. Hanscom’s personal knowledge concerning the matters about which he testified appears tobe limited. Mr. Hanscom admitted in his Commission hearing testimony that “we’re not selling web rolls,” andsuggested his assertions were based on observations of his customers’ (as opposed to his own) operations. HearingTr. at 318-19 (Hanscom).
8

porosity of paper still have a significant bearing on what type of press can be used to print the paper.44 Additionally, a recent article indicates that static build-up continues to be an issue with respect to sheet-fed presses; static build-up requires that “[t]he skids of paper must be stored and be climate adjusted andtransported by the press at the right time to run the job, along with printing plates, special inks, UVcoatings and other chemistry.”45 As such, the record supports the conclusion that coated paper’s highmoisture and porosity levels continue to be important for its use in sheet-fed presses.
Interchangeability. In the preliminary determinations, the Commission found that there was atbest limited interchangeability between web rolls and coated paper as both were produced to meet therequirements of the different presses on which they are printed. As such, it found that web rolls are notused in sheet-fed presses, and coated paper (in finished sheet form) cannot be used in web presses. TheCommission noted that while coated paper in sheeter rolls may be used in web presses, according towitness testimony, web rolls’ lower moisture content and more porous surface make them more suitablefor web-fed presses. Additionally, the Commission found that because sheeter rolls do not share thesephysical characteristics, producers will not warrant their use for web presses. It further stated thatalthough Respondents’ witness testified that sheeter rolls may be substituted for web rolls in web presses,such substitution was infrequent. Indeed, the Commission further observed that the same witness alsotestified that, for printers with dual printing capability (sheet-fed and web presses), coated paper is used inthe sheet press while web rolls are used in web presses.46
Respondents contend that the Commission’s finding in the preliminary determinations that webrolls cannot be used in sheet-fed presses was incorrect.47 Respondents maintain that the use of web rollsin sheet-fed presses is “quite common” and that the addition of just one piece of equipment, an in-line rollsheeter, enables printers to use web rolls in sheet-fed presses.48 Respondents indicate that in-line rollsheeters are produced by Mabeg and Heilderberg and provided brochures from both vendors. Theymaintain that a major printer has stated that “[p]utting the roll sheeter on it adds to economic advantagewe have in buying rolls; U.S. manufactured paper instead of Asian paper.”49
We find that the additional material Respondents submitted in the final phase investigations doesnot support the proposition that the use of web rolls in sheet-fed presses is common. Indeed, theproposition that in-line sheeters are typically sold for the purpose of enabling use of web rolls in sheet-fedpresses is directly contradicted by an affidavit prepared by the U.S. representative of ***. ***, submittedan affidavit indicating that only about 3.5 percent of the sheet-fed presses his firm has sold during the lastfive years were sold with in-line sheeters.50 Indeed, materials submitted by both parties indicate that thenumber of in-line sheeters in the United States is very low in comparison to the number of sheet-fedpresses.51 Because the record indicates that use of in-line roll sheeters to convert web rolls into sheet is at
44 Hearing Tr. at 167 (Schoedinger), 170 (Gardner). This is consistent with testimony offered during thepreliminary phase investigations. See Conference Tr. at 81-84 (Graff). See also Petitioners’ Posthearing Brief,Responses to Staff Questions, tab 7, ex.1, ex. 6 at 3.
45 Respondents’ Posthearing Brief, ex. 24, Graftech Printing Engineering, “Squeezing More Profit out of EveryJob Run on a Sheetfed Press (“Graftech article”) at 2-3.
46 Preliminary Determinations, USITC Pub. 4108 at 10 at 9-10.
47 Respondents’ Prehearing Brief at 19-20.
48 Respondents’ Prehearing Brief at 20; Respondents’ Posthearing Brief at 54.
49 Respondents’ Posthearing Brief, ex. 24.
50 Petitioners’ Posthearing Brief, Response to Staff Questions, tab 7, ex. 5, ¶ 5.
51 Petitioners’ Posthearing Brief, Response to Staff Questions, tab 7, ex. 6 at 5 (100 roll sheet feeders in NorthAmerica compared to over 100,000 sheet-fed presses in operation within the printing market); Respondents’Posthearing Brief, ex. 24, Graftech article at 5 (about 100 roll sheeters in North America as compared to “at least
(continued...)
9
best highly infrequent, we accord little weight to Respondents’ listing of major individual printers thathave in-line sheeters. In any event, this listing does not purport to establish that these printers use webrolls in sheet-fed presses.52 The assertion Mr. Hanscom made on Respondents’ behalf that “it is commonknowledge” that petitioner NewPage ships large quantities of web rolls to Pro Con, a converter, whichthen converts the web rolls into sheets for sheet-fed presses,53 was directly rebutted by officials from bothPro Con and NewPage.54
Other information in the record further rebuts Respondents’ contention that in-line sheeters arecommonly used to convert web rolls into sheets for sheet-fed presses. ***, the official of in-line sheeterproducer ***, further testified that use of an in-line sheeter is economical only if a printer consistently haslarge-volume jobs requiring the same stock and application and that conversion of web rolls into sheets“would affect the quality and appearance of the printed product because of the differences between webstock and sheet stock.”55 Additionally, warranties for web rolls do not cover use in sheet-fed presses.56 This suggests that if converters use sheeted web rolls in sheet-fed presses, this activity would be limited,because the use of the converted product would pose a risk for both the converter and the printer.
The record indicates that, while there may be some instances in which web rolls are run in sheet-fed presses, this appears to be infrequent and is hardly the “quite common” occurrence claimed byRespondents. Only a very small number of U.S. printers are equipped with in-line sheeters whichpurportedly can be used for adapting web rolls for sheet-fed presses. It is by no means clear that thepreponderance of these in-line sheeters are used to sheet web rolls, as opposed to sheeter rolls. Web rollproducers do not provide warranty coverage for web rolls used in sheet-fed presses. Thus, anyinterchangeability between coated paper and web rolls is greatly limited.
Producer and Customer Perceptions. The record indicates that six out of nine reporting U.S.producers (integrated producers and converters) and five of 12 of the reporting importers indicated thatthey perceived web rolls and coated paper to be distinct products.57 Additionally, in the final phaseinvestigations only a minority of reporting importers (three of nine) and none of the 32 respondingpurchasers identified web rolls as a substitute for coated paper.58 Although the importers’ responses areto some extent mixed, the record does not support the proposition that market participants commonlyperceive web rolls and coated paper to be similar products.
Channels of Distribution. As the Commission found in the preliminary determinations, amajority of market participants report that web rolls and coated paper use the same channels of
51 (...continued)10,000 active printing presses”).
52 At least some companies that have purchased in-line sheeters use such equipment for only sheeter rolls and notweb rolls. Petitioners’ Posthearing Brief, Response to Staff Questions, tab 7, ex. 6 at 4, ex. 8 at 1-2. Respondentsalso presented statements from three other printers that they use converted web rolls in a sheet-fed press. Respondents’ Posthearing Brief, ex. 24, attachment A. Each of these statements is conclusory. Moreover, a fargreater number of printers submitted statements that they did not use coated sheets made from web rolls on theirsheet-fed presses. Petitioners’ Posthearing Brief, Response to Staff Questions, tab 7, ex. 7 (13 statements).
53 Respondents’ Prehearing Brief, ex. 2.
54 Hearing Tr. at 135 (Nelson); Petitioners’ Posthearing Brief, Response to Staff Questions, tab 7, exs. 2, 3.
55 Petitioners’ Posthearing Brief, Answers to Staff Questions, tab 7, ex. 5, ¶¶ 6-7.
56 Preliminary Determinations, USITC Pub. 4108 at 10; Hearing Tr. at 135 (Nelson), 169 (Salonen).
57 INV-GG-104 at I-23-24 (Nov. 2, 2009).
58 CR at II-21-22, PR at II-13-14.
10

distribution, although producers’ responses to this question were mixed.59 Whether sales to printers are inthe form of web rolls or coated paper depends on the type of equipment printers use.60
Common Manufacturing, Processes and Employees. Both coated paper and web rolls generallyare manufactured on the same equipment, by the same processes, and with some of the same employees. However, certain coated paper requires an additional production step of sheeting before it is a finishedproduct.61
Price. Respondents contend that coated paper and web rolls are priced similarly, based on acomparison of quarterly pricing data collected by the Commission for coated paper and data provided byRISI, a private monitoring service, for web rolls.62 The use of two different data sets by Respondentsprecludes an accurate comparison. Available RISI pricing data for both coated paper and web rollscovering the period of investigation indicate that coated paper in sheets was priced consistently andmarkedly higher than coated paper in web rolls.63
Conclusion. The record in these final investigations indicates that there is a clear dividing linedistinguishing web rolls from coated paper.64 There are admittedly some similarities between theproducts: they have similar channels of distribution, are produced using the same processes andequipment, and are used in similar printing applications. Nevertheless, there are clear distinctionsbetween them. Each is produced to meet distinct requirements of particular printing presses. Thus, theydiffer in moisture content, porosity, and mechanical characteristics such as flatness. The evidence doesnot indicate that they are broadly interchangeable; to the contrary, in-line sheeters are infrequently used tosheet web rolls in sheet-fed presses. Moreover, we find that coated paper and web rolls are priceddifferently, and the record does not indicate that market participants, producers in particular, perceive theproducts to be broadly similar.
Taking all of these considerations into account, we do not include web rolls within the definitionof the domestic like product. This is the same conclusion we reached in our preliminary determinations. In this respect, we emphasize that Respondents’ contentions that the factual conclusions the Commissionreached in the preliminary determinations were incorrect are based primarily on the testimony of a singlewitness, Mr. Hanscom, whose assertions were repeatedly contradicted by credible and informedtestimony of other industry participants.
Accordingly, we define the domestic like product in these investigations as coated paper meetingthe physical specifications of Commerce’s scope definition (as we construed that definition above) andsheeter rolls. We will henceforth refer to the domestic like product as “CCP.”
59 Preliminary Determinations, USITC Pub. 4108 at 10.
60 This follows from our conclusion above that coated paper and web rolls cannot generally be usedinterchangeably on the same equipment. See also Preliminary Determinations, USITC Pub. 4108 at 9.
61 Preliminary Determinations, USITC Pub. 4108 at 10.
62 Respondents’ Prehearing Brief at 21.
63 See RISI January 2010 Paper Trader Monitoring Report, tables 6, 9 (EDIS Doc. 435233). Respondents’witness in the preliminary phase conference also testified that, for products of comparable quality, basis weight, andbrightness, web rolls are typically priced lower than coated paper in sheets. Conference Tr. at 135 (Hunley).
64 Respondents emphasize that the Commission found web rolls and coated paper to be in the same domestic likeproduct in Coated Free Sheet Paper from China, Indonesia, and Korea, Inv. Nos. 701-TA-444-446, 731-TA-1107-1109 (Final), USITC Pub. 3965 (Dec. 2007). In the prior investigations, both web rolls and coated paper wereincluded in the scope definition and no party argued that the Commission should find multiple domestic likeproducts. See id. at 4-5. Compare id. at 12 (finding limited competition between web rolls and sheet products). These investigations feature a significantly different factual record, which contains information not before theCommission in the prior investigations about the purported similarities and differences of coated paper and webrolls.
11

III. DOMESTIC INDUSTRY
The domestic industry is defined as the domestic “producers as a whole of a domestic likeproduct, or those producers whose collective output of a domestic like product constitutes a majorproportion of the total domestic production of the product.”65 In defining the domestic industry, theCommission’s general practice has been to include in the industry producers of all domestic production ofthe like product, whether toll-produced, captively consumed, or sold in the domestic merchant market.
There are two sets of domestic industry issues in these final phase investigations. The firstconcerns whether converters engage in sufficient production-related activities to be considered domesticproducers. The second concerns whether appropriate circumstances exist pursuant to the statutory relatedparties provision to exclude from the domestic industry two converters that also purchased subjectmerchandise.
A. Sufficient Production-Related Activities
We first consider whether converters of sheeter rolls engage in sufficient production-relatedactivities to be considered domestic producers.66 Converters perform the final finishing operation onsheeter rolls purchased from integrated producers. Specifically, converters cut sheeter rolls into thefinished sheet product.67
In the preliminary determinations, the Commission determined that converters engage insufficient production-related activities to be included in the domestic industry. It emphasized converters’substantial capital investments and employment.68 The record concerning converters’ production-relatedactivities has not changed since the preliminary determinations. In light of this, and the absence of anycontrary argument, we again include converters in the domestic industry producing CCP.
B. Related Parties
We must determine whether any producer of the domestic like product should be excluded fromthe domestic industry pursuant to section 771(4)(B) of the Tariff Act. This provision allows theCommission, if appropriate circumstances exist, to exclude from the domestic industry producers that arerelated to an exporter or importer of subject merchandise or which are themselves importers.69 Exclusionof such a producer is within the Commission’s discretion based upon the facts presented in eachinvestigation.70 The Commission has also concluded that a domestic producer that does not itself import
65 19 U.S.C. § 1677(4)(A).
66 To determine whether a firm is engaged in sufficient production-related activities to be considered a domesticproducer of the like product, the Commission generally considers six factors: (1) source and extent of the firm'scapital investment; (2) technical expertise involved in U.S. production activities; (3) value added to the product inthe United States; (4) employment levels; (5) quantity and type of parts sourced in the United States; and (6) anyother costs and activities in the United States directly leading to production of the like product. No single factor isdeterminative and the Commission may consider any other factors it deems relevant in light of the specific facts ofany investigation. See, e.g., Diamond Sawblades and Parts Thereof from China and Korea, Inv. Nos. 731-TA-1092-1093 (Final), USITC Pub. 3862 at 11 (July 2006); Outboard Engines from Japan, Inv. No. 731-TA-1069(Preliminary), USITC Pub. 3673 at 10-12 (Mar. 2004).
67 See CR at I-26, PR at I-21.
68 Preliminary Determinations, USITC Pub. 4108 at 11-12.
69 19 U.S.C. § 1677(4)(B).
70 The primary factors the Commission has examined in deciding whether appropriate circumstances exist to(continued...)
12

subject merchandise, or does not share a corporate affiliation with an importer, may nonetheless bedeemed a related party if it controls large volumes of subject imports.71
Converters *** and *** purchased subject merchandise during the period of investigation.72 Because the quantity of each firm’s purchases of subject imports was small, we do not find thatappropriate circumstances exist to exclude either converter from the domestic industry pursuant to therelated party provision.73
Accordingly, we define a single domestic industry consisting of U.S. producers and converters ofCCP.
70 (...continued)exclude a related party are as follows: (1) the percentage of domestic production attributable to the importingproducer; (2) the reason the U.S. producer has decided to import the product subject to investigation, i.e., whetherthe firm benefits from the LTFV sales or subsidies or whether the firm must import in order to enable it to continueproduction and compete in the U.S. market, and (3) the position of the related producer vis-a-vis the rest of theindustry, i.e., whether inclusion or exclusion of the related party will skew the data for the rest of the industry. See,e.g., Torrington Co. v. United States, 790 F. Supp. 1161 (Ct. Int’l Trade 1992), aff’d mem., 991 F.2d 809 (Fed. Cir.1993). The Commission has also considered the ratio of import shipments to U.S. production for related producersand whether the primary interest of the related producer lies in domestic production or importation. These latter twoconsiderations were cited as appropriate factors in Allied Mineral Products, Inc. v. United States, 28 CIT 1861, 1864(2004) (“The most significant factor considered by the Commission in making the ‘appropriate circumstances’determination is whether the domestic producer accrued a substantial benefit from its importation of the subjectmerchandise.”); USEC, Inc. v. United States, 132 F. Supp. 2d 1, 12 (Ct. Int’l Trade 2001) (“the provision’s purposeis to exclude from the industry headcount domestic producers substantially benefitting from their relationships withforeign exporters.”), aff’d, 34 Fed. Appx. 725 (Fed. Cir. April 22, 2002); S. Rep. No. 249, 96th Cong. 1st Sess. at 83(1979) (“where a U.S. producer is related to a foreign exporter and the foreign exporter directs his exports to theUnited States so as not to compete with his related U.S. producer, this should be a case where the ITC would notconsider the related U.S. producer to be a part of the domestic industry”).
71 Such control will occur only if the domestic producer was responsible for a predominant portion of animporter’s purchases and the importer’s purchases were substantial. See, e.g., Certain Cut-to-Length Steel Platefrom the Czech Republic, France, India, Indonesia, Italy, Japan, Korea, and Macedonia, Inv. Nos. 701-TA-387-392and 731-TA-815-822 (Preliminary), USITC Pub. 3181 at 12 (April 1999); Certain Brake Drums and Rotors fromChina, Inv. No. 731-TA-744 (Final), USITC Pub. 3035 at 10 n.50 (April 1997).
72 CR/PR, Table III-16.
73 *** purchases never exceeded *** percent of subject imports from China or *** percent of subject importsfrom Indonesia in any calendar year. *** purchases never exceeded *** percent of subject imports from China inany calendar year. CR/PR, Tables III-16, IV-2.
13
IV. CUMULATION74
A. Legal Framework
For purposes of evaluating the volume and price effects for a determination of material injury byreason of the subject imports, section 771(7)(G)(i) of the Tariff Act requires the Commission to cumulatesubject imports from all countries as to which petitions were filed and/or investigations self-initiated byCommerce on the same day, if such imports compete with each other and with domestic like products inthe U.S. market and no statutory exceptions apply.75 The statutory threshold for cumulation is satisfied inthese investigations because the petition with respect to both China and Indonesia was filed on the sameday: September 23, 2009.76
In assessing whether subject imports compete with each other and with the domestic like product,the Commission has generally considered four factors:
(1) the degree of fungibility between the subject imports from different countries andbetween imports and the domestic like product, including consideration of specificcustomer requirements and other quality related questions;
(2) the presence of sales or offers to sell in the same geographic markets of subjectimports from different countries and the domestic like product;
(3) the existence of common or similar channels of distribution for subject importsfrom different countries and the domestic like product; and
(4) whether the subject imports are simultaneously present in the market.77 78
While no single factor is necessarily determinative, and the list of factors is not exclusive, these factorsare intended to provide the Commission with a framework for determining whether the subject imports
74 We find that subject imports from China and Indonesia are not negligible under 19 U.S.C. § 1677(24). ForSeptember 2008 through August 2009, which is the 12-month period preceding filing of the petition, subject importsfrom China accounted for 43.9 percent of total U.S. imports. CR at IV-7, PR at IV-5. During the same period,subject imports from Indonesia accounted for 6.4 percent of total U.S. imports. CR at IV-8, PR at IV-6. Each figuresurpasses the applicable negligibility threshold in 19 U.S.C. § 1677(24).
In their prehearing submission, Respondents claimed that the Commission should find subject imports fromIndonesia to be negligible. This argument was premised on the assumption that Commerce would grantRespondents’ request to exclude multi-ply products from the scope definition. Respondents’ Prehearing Brief at 22-23. Commerce denied Respondents’ request and retained multi-ply products within the scope. Commerce Issuesand Decision Memorandum at 59. Respondents did not contest the Commission report’s negligibility calculations,or otherwise address this issue, in their posthearing submissions.
75 19 U.S.C. § 1677(7)(G)(i).
76 CR at I-1; PR at I-1. None of the statutory exceptions to cumulation is applicable.
77 See Certain Cast-Iron Pipe Fittings from Brazil, the Republic of Korea, and Taiwan, Inv. Nos. 731-TA-278-280(Final), USITC Pub. 1845 (May 1986), aff'd, Fundicao Tupy, S.A. v. United States, 678 F. Supp. 898 (Ct. Int'lTrade), aff'd, 859 F.2d 915 (Fed. Cir. 1988).
78 Commissioner Lane notes with respect to the first factor that her analysis does not require such similarity ofproducts that a perfectly symmetrical fungibility is required. See Separate Views of Commissioner Charlotte R.Lane, Certain Lightweight Thermal Paper from China, Germany, and Korea, Inv. Nos. 701-TA-451 and 731-TA-1126-1128 (Preliminary), USITC Pub. 3964 (Nov. 2007).
14
compete with each other and with the domestic like product.79 Only a “reasonable overlap” ofcompetition is required.80
In the preliminary determinations, the Commission found a reasonable overlap of competitionbetween subject imports from China and Indonesia and the domestic like product, and among the importsthemselves.81 The Commission thus analyzed subject imports on a cumulated basis.82
In the final phase investigations, Petitioners contend that the Commission should cumulatesubject imports from China and Indonesia as there is a reasonable overlap of competition.83 Respondentsdid not address the issue of cumulation at the hearing or in their briefs.
B. Analysis
Based on the four traditional factors which the Commission considers in analyzing cumulation,we find that there is a reasonable overlap of competition.
Fungibility. There appears to be a reasonable degree of fungibility among the subject importsfrom each country and the domestic like product. The questionnaire responses indicate that marketparticipants perceive domestically produced CCP and the subject imports to be interchangeable. Six ofnine U.S. integrated producers, all four responding converters, seven of eight importers, and 19 of 24purchasers reported that the domestic like product and subject imports from China are always orfrequently interchangeable.84 Six of nine U.S. integrated producers, three of four converters, six of sevenimporters, and 14 of 15 purchasers reported that the domestic like product and subject imports fromIndonesia are always or frequently interchangeable.85 All eight integrated producers, three of fourconverters, six of eight importers, and 14 of 15 purchasers found subject imports from China and subjectimports from Indonesia always or frequently interchangeable.86
Geographic Overlap. *** of the integrated producers and *** reporting converters reported thatthey serve a nationwide market.87 *** importers of coated paper from China reported selling nationwide,while *** importers of coated paper from Indonesia reported selling nationwide.88 Official Commercestatistics show that U.S. imports from the China and Indonesia entered the United States throughgeographically dispersed U.S. ports of entry.89
79 See, e.g., Wieland Werke, AG v. United States, 718 F. Supp. 50 (Ct. Int'l Trade 1989).
80 The Uruguay Round Agreements Act, Statement of Administrative Action, H.R. Doc. No. 103-316, Vol. 1 at848 (1994) (“SAA”) expressly states that “the new section will not affect current Commission practice under whichthe statutory requirement is satisfied if there is a reasonable overlap of competition.” SAA at 848 (citing FundicaoTupy, S.A. v. United States, 678 F. Supp. 898, 902 (Ct. Int'l Trade 1988)), aff’d, 859 F.2d 915 (Fed. Cir. 1988). SeeGoss Graphic Sys., Inc. v. United States, 33 F. Supp. 2d 1082,1087 (Ct. Int’l Trade 1998) (“cumulation does notrequire two products to be highly fungible”); Wieland Werke, AG, 718 F. Supp. at 52 (“Completely overlappingmarkets are not required.”).
81 Preliminary Determinations, USITC Pub. 4108 at 16.
82 Preliminary Determinations, USITC Pub. 4108 at 16-17.
83 Petitioners’ Prehearing Brief at 10-16; Petitioners’ Posthearing Brief at 7-8.
84 CR/PR, Table II-4.
85 CR/PR, Table II-4.
86 CR/PR, Table II-4.
87 CR at II-3, PR at II-2.
88 CR at II-3, PR at II-2.
89 CR at IV-6, PR at IV-5.
15

Channels of Distribution. The vast majority of U.S. producers’ shipments of CCP and the vastmajority of subject imports from each subject country were to merchants/distributors.90
Simultaneous Presence. The record indicates that domestic producers’ U.S. shipments, alongwith imports from China and Indonesia, have been simultaneously present in the U.S. market throughoutthe entire period of investigation.91
Conclusion. The record indicates that the four cumulation criteria are satisfied in theseinvestigations. We therefore conclude that there is a reasonable overlap of competition between importsfrom each subject country and the domestic like product and between subject imports from China andIndonesia. Consequently, we cumulatively assess the volume and effects of subject imports fordetermining material injury by reason of the subject imports.
C. Cumulation for Threat Analysis
Because our determinations address the issue of threat of material injury by reason of subjectimports, we must also consider whether to cumulate subject imports from China and Indonesia forpurposes of a threat analysis.92 In contrast to cumulation for material injury, cumulation for threatanalysis is discretionary. Under section 771(7)(H) of the Tariff Act, the Commission may “to the extentpracticable” cumulatively assess the volume and price effects of subject imports from all countries as towhich petitions were filed on the same day if the requirements for cumulation in the material injurycontext are satisfied.93
In the preceding section, we found that the requirements for cumulating subject imports forpurposes of our material injury analysis are satisfied. We further find that subject imports from China andIndonesia are likely to compete under similar conditions of competition in the U.S. market in theimminent future, based on the following considerations.94
First, the imports from each subject country showed similar volume trends. As a share of thequantity of U.S. apparent consumption, subject imports from China and Indonesia each rose slightly from2007 to 2008, increased at a greater rate from 2008 to 2009, and was lower in January-June (“interim”)2010 than in interim 2009.95
Second, with respect to pricing, subject imports from China and Indonesia each undersold thedomestic like product in the majority of quarterly comparisons. Underselling margins were inoverlapping ranges, varying from 1.5 to 25.2 percent for subject imports from China and from 2.6 to 14.4percent for subject imports from Indonesia.96
Furthermore, we observe that subject producers in China and Indonesia affiliated with a singlefirm – APP – are responsible for a *** of production and a *** of exports to the Untied States from each
90 CR/PR, Table II-1.
91 CR/PR, Tables IV-2, C-3.
92 Commissioner Lane does not reach the issue of threat of material injury and does not join this section.
93 19 U.S.C. § 1677(7)(H).
94 Commissioner Pinkert does not join in this sentence. In determining whether to cumulate subject imports forpurposes of a threat analysis, he focuses primarily on volume and price trends for the subject imports. Here, he joinshis colleagues in finding the volume and pricing trends for the subject imports from China and Indonesia to besimilar as well as in their observations concerning APP’s ability to shift exports between affiliated facilities in thetwo subject countries. He thus concludes that cumulation of the subject imports from China and Indonesia iswarranted for purposes of a threat analysis.
95 CR/PR, Table C-3. On an absolute basis, the quantity of subject imports from China and Indonesia eachincreased from 2007 to 2009 and each was lower in interim 2010 than in interim 2009. Id.
96 CR/PR, Table V-7.
16

of the subject countries.97 APP has the ability to shift exports to the United States from its affiliatedfacilities in one subject country to its facilities in the other.98
Accordingly, for our analysis of threat of material injury by reason of subject imports, wecumulate subject imports from China and Indonesia.
V. LEGAL STANDARDS
A. In General
In the final phase of antidumping and countervailing duty investigations, the Commissiondetermines whether an industry in the United States is materially injured or threatened with materialinjury by reason of the imports under investigation.99 In making this determination, the Commission mustconsider the volume of subject imports, their effect on prices for the domestic like product, and theirimpact on domestic producers of the domestic like product, but only in the context of U.S. productionoperations.100 The statute defines “material injury” as “harm which is not inconsequential, immaterial, orunimportant.”101 In assessing whether the domestic industry is materially injured by reason of subjectimports, we consider all relevant economic factors that bear on the state of the industry in the UnitedStates.102 No single factor is dispositive, and all relevant factors are considered “within the context of thebusiness cycle and conditions of competition that are distinctive to the affected industry.”103
Although the statute requires the Commission to determine whether the domestic industry is“materially injured or threatened with material injury by reason of” unfairly traded imports,104 it does notdefine the phrase “by reason of,” indicating that this aspect of the injury analysis is left to theCommission’s reasonable exercise of its discretion.105 In identifying a causal link, if any, between subjectimports and material injury to the domestic industry, the Commission examines the facts of record thatrelate to the significance of the volume and price effects of the subject imports and any impact of thoseimports on the condition of the domestic industry. This evaluation under the “by reason of” standardmust ensure that subject imports are more than a minimal or tangential cause of injury and that there is asufficient causal, not merely a temporal, nexus between subject imports and material injury.106
97 CR at VII-2, VII-13, PR at VII-2, VII-10; CR/PR, Table VII-1.
98 See Respondents’ Prehearing Brief at 126; Gold East Paper (Jiangsu) Co. Ltd. Foreign Producers’Questionnaire, response to question II-7 (EDIS Doc. 430824).
99 19 U.S.C. §§ 1671d(b), 1673d(b).
100 19 U.S.C. § 1677(7)(B)( i). The Commission “may consider such other economic factors as are relevant to thedetermination” but shall “identify each {such} factor ... and explain in full its relevance to the determination.” 19 U.S.C. § 1677(7)(B).
101 19 U.S.C. § 1677(7)(A).
102 19 U.S.C. § 1677(7)(C)(iii).
103 19 U.S.C. § 1677(7)(C)(iii).
104 19 U.S.C. §§ 1671d(a), 1673d(a).
105 Angus Chemical Co. v. United States, 140 F.3d 1478, 1484-85 (Fed. Cir. 1998) (“{T}he statute does not‘compel the commissioners’ to employ {a particular methodology}.”), aff’d, 944 F. Supp. 943, 951 (Ct. Int’l Trade1996).
106 The Federal Circuit, in addressing the causation standard of the statute, observed that “{a}s long as its effectsare not merely incidental, tangential, or trivial, the foreign product sold at less than fair value meets the causationrequirement.” Nippon Steel Corp. v. USITC, 345 F.3d 1379, 1384 (Fed. Cir. 2003). This was further ratified inMittal Steel Point Lisas Ltd. v. United States, 542 F.3d 867, 873 (Fed. Cir. 2008), where the Federal Circuit, quoting
(continued...)
17

In many investigations, there are other economic factors at work, some or all of which may alsobe having adverse effects on the domestic industry. Such economic factors might include nonsubjectimports; changes in technology, demand, or consumer tastes; competition among domestic producers; ormanagement decisions by domestic producers. The legislative history explains that the Commission mustexamine factors other than subject imports to ensure that it is not attributing injury from other factors tothe subject imports, thereby inflating an otherwise tangential cause of injury into one that satisfies thestatutory material injury threshold.107 In performing its examination, however, the Commission need notisolate the injury caused by other factors from injury caused by unfairly traded imports.108 Nor does the“by reason of” standard require that unfairly traded imports be the “principal” cause of injury orcontemplate that injury from unfairly traded imports be weighed against other factors, such as nonsubjectimports, which may be contributing to overall injury to an industry.109 It is clear that the existence ofinjury caused by other factors does not compel a negative determination.110
Assessment of whether material injury to the domestic industry is “by reason of” subject imports“does not require the Commission to address the causation issue in any particular way” as long as “theinjury to the domestic industry can reasonably be attributed to the subject imports” and the Commission
106 (...continued)Gerald Metals, Inc. v. United States, 132 F.3d 716, 722 (Fed. Cir. 1997), stated that “this court requires evidence inthe record ‘to show that the harm occurred “by reason of” the LTFV imports, not by reason of a minimal ortangential contribution to material harm caused by LTFV goods.’” See also Nippon Steel Corp. v. United States,458 F.3d 1345, 1357 (Fed. Cir. 2006); Taiwan Semiconductor Industry Ass’n v. USITC, 266 F.3d 1339, 1345 (Fed.Cir. 2001).
107 SAA at 851-52 (“{T}he Commission must examine other factors to ensure that it is not attributing injury fromother sources to the subject imports.”); S. Rep. 96-249 at 75 (1979) (the Commission “will consider informationwhich indicates that harm is caused by factors other than less-than-fair-value imports.”); H.R. Rep. 96-317 at 47(1979) (“in examining the overall injury being experienced by a domestic industry, the ITC will take into accountevidence presented to it which demonstrates that the harm attributed by the petitioner to the subsidized or dumpedimports is attributable to such other factors;” those factors include “the volume and prices of nonsubsidized importsor imports sold at fair value, contraction in demand or changes in patterns of consumption, trade restrictive practicesof and competition between the foreign and domestic producers, developments in technology and the exportperformance and productivity of the domestic industry”); accord Mittal Steel, 542 F.3d at 877.
108 SAA at 851-52 (“{T}he Commission need not isolate the injury caused by other factors from injury caused byunfair imports.”); Taiwan Semiconductor Industry Ass’n v. USITC, 266 F.3d 1339, 1345 (Fed. Cir. 2001) (“{T}heCommission need not isolate the injury caused by other factors from injury caused by unfair imports ... . Rather, theCommission must examine other factors to ensure that it is not attributing injury from other sources to the subjectimports.” (emphasis in original)); Asociacion de Productores de Salmon y Trucha de Chile AG v. United States, 180F. Supp. 2d 1360, 1375 (Ct. Int’l Trade 2002) (“{t}he Commission is not required to isolate the effects of subjectimports from other factors contributing to injury” or make “bright-line distinctions” between the effects of subjectimports and other causes.); see also Softwood Lumber from Canada, Invs. Nos. 701-TA-414 and 731-TA-928(Remand), USITC Pub. 3658 at 100-01 (Dec. 2003) (Commission recognized that “{i}f an alleged other factor isfound not to have or threaten to have injurious effects to the domestic industry, i.e., it is not an ‘other causal factor,’then there is nothing to further examine regarding attribution to injury”), citing Gerald Metals, Inc. v. United States,132 F.3d 716, 722 (Fed. Cir. 1997) (the statute “does not suggest that an importer of LTFV goods can escapecountervailing duties by finding some tangential or minor cause unrelated to the LTFV goods that contributed to theharmful effects on domestic market prices.”).
109 S. Rep. 96-249 at 74-75; H.R. Rep. 96-317 at 47.
110 See Nippon Steel Corp., 345 F.3d at 1381 (“an affirmative material-injury determination under the statuterequires no more than a substantial-factor showing. That is, the ‘dumping’ need not be the sole or principal cause ofinjury.”).
18

“ensure{s} that it is not attributing injury from other sources to the subject imports.”111 112 Indeed, theFederal Circuit has examined and affirmed various Commission methodologies and has disavowed “rigidadherence to a specific formula.”113
The Federal Circuit’s decisions in Gerald Metals, Bratsk, and Mittal Steel all involved caseswhere the relevant “other factor” was the presence in the market of significant volumes of price-competitive nonsubject imports. The Commission interpreted the Federal Circuit’s guidance in Bratsk asrequiring it to apply a particular additional methodology following its finding of material injury in casesinvolving commodity products and a significant market presence of price-competitive nonsubjectimports.114 The additional “replacement/benefit” test looked at whether nonsubject imports might havereplaced subject imports without any benefit to the U.S. industry. The Commission applied that specificadditional test in subsequent cases, including the Carbon and Certain Alloy Steel Wire Rod from Trinidadand Tobago determination that underlies the Mittal Steel litigation.
Mittal Steel clarifies that the Commission’s interpretation of Bratsk was too rigid and makes clearthat the Federal Circuit does not require the Commission to apply an additional test nor any one specificmethodology; instead, the court requires the Commission to have “evidence in the record” to “show thatthe harm occurred ‘by reason of’ the LTFV imports,” and requires that the Commission not attributeinjury from nonsubject imports or other factors to subject imports.115 Accordingly, we do not considerourselves required to apply the replacement/benefit test that was included in Commission opinionssubsequent to Bratsk.
The progression of Gerald Metals, Bratsk, and Mittal Steel clarifies that, in cases involvingcommodity products where price-competitive nonsubject imports are a significant factor in the U.S.
111 Mittal Steel, 542 F.3d at 877-78; see also id. at 873 (“While the Commission may not enter an affirmativedetermination unless it finds that a domestic industry is materially injured ‘by reason of’ subject imports, theCommission is not required to follow a single methodology for making that determination ... {and has} broaddiscretion with respect to its choice of methodology.”) citing United States Steel Group v. United States, 96 F.3d1352, 1362 (Fed. Cir. 1996) and S. Rep. 96-249 at 75.
112 Commissioner Pinkert does not join this paragraph or the following four paragraphs. He points out that theFederal Circuit, in Bratsk, 444 F.3d 1369, and Mittal, held that the Commission is required, in certain circumstanceswhen considering present material injury, to undertake a particular kind of analysis of nonsubject imports, albeitwithout reliance upon presumptions or rigid formulas. Mittal explains as follows:
What Bratsk held is that “where commodity products are at issue and fairly traded, price-competitive,nonsubject imports are in the market,” the Commission would not fulfill its obligation to consider animportant aspect of the problem if it failed to consider whether nonsubject or non-LTFV imports wouldhave replaced LTFV subject imports during the period of investigation without a continuing benefit to thedomestic industry. 444 F.3d at 1369. Under those circumstances, Bratsk requires the Commission toconsider whether replacement of the LTFV subject imports might have occurred during the period ofinvestigation, and it requires the Commission to provide an explanation of its conclusion with respect tothat factor.
542 F.3d at 878.
113 Nucor Corp. v. United States, 414 F.3d 1331, 1336, 1341 (Fed. Cir. 2005); see also Mittal Steel, 542 F.3d at879 (“Bratsk did not read into the antidumping statute a Procrustean formula for determining whether a domesticinjury was ‘by reason’ of subject imports.”).
114 Mittal Steel, 542 F.3d at 875-79.
115 Mittal Steel, 542 F.3d at 873 (quoting from Gerald Metals, 132 F.3d at 722), 875-79 & n.2 (recognizing theCommission’s alternative interpretation of Bratsk as a reminder to conduct a non-attribution analysis).
19
market, the Court will require the Commission to give full consideration, with adequate explanation, tonon-attribution issues when it performs its causation analysis.116 117
The question of whether the material injury threshold for subject imports is satisfied,notwithstanding any injury from other factors, is factual and subject to review under the substantialevidence standard.118 Congress has delegated this factual finding to the Commission because of theagency’s institutional expertise in resolving injury issues.119
B. Material Injury by Reason of Subject Imports
In evaluating the volume of subject imports, section 771(7)(c) of the Tariff Act provides that the“Commission shall consider whether the volume of imports of the merchandise, or any increase in thatvolume, either in absolute terms or relative to production or consumption in the United States, issignificant.”120
In evaluating the price effects of the subject imports, section 771(7)(C)(ii) of the Tariff Actprovides that the Commission shall consider whether –
(I) there has been significant price underselling by the imported merchandise ascompared with the price of domestic like products of the United States, and
(II) the effect of imports of such merchandise otherwise depresses prices to a significantdegree or prevents price increases, which otherwise would have occurred, to a significantdegree.121
In examining the impact of subject imports, section 771(7)(C)(iii) of the Tariff Act provides thatthe Commission “shall evaluate all relevant economic factors which have a bearing on the state of theindustry.”122 These factors include output, sales, inventories, ability to raise capital, research anddevelopment, and factors affecting domestic prices. No single factor is dispositive and all relevant factors
116 Commissioner Lane also refers to her dissenting views in Polyethylene Terephthalate Film, Sheet, and Stripfrom Brazil, China, Thailand, and the United Arab Emirates, Invs. Nos. 731-TA-1131 to 1134 (Final), USITC Pub.4040 (Oct. 2008), for further discussion of Mittal Steel.
117 To that end, after the Federal Circuit issued its decision in Bratsk, the Commission began to present publishedinformation or send out information requests in final phase investigations to producers in nonsubject countries thataccounted for substantial shares of U.S. imports of subject merchandise (if, in fact, there were large nonsubjectimport suppliers). In order to provide a more complete record for the Commission’s causation analysis, theserequests typically seek information on capacity, production, and shipments of the product under investigation in themajor source countries that export to the United States. The Commission plans to continue utilizing published orrequested information in final phase investigations in which there are substantial levels of nonsubject imports.
118 We provide in our respective discussions of volume, price effects, and impact a full analysis of other factorsalleged to have caused any material injury or threat thereof experienced by the domestic industry.
119 Mittal Steel, 542 F.3d at 873; Nippon Steel Corp., 458 F.3d at 1350, citing U.S. Steel Group, 96 F.3d at 1357;S. Rep. 96-249 at 75 (“The determination of the ITC with respect to causation is ... complex and difficult, and is amatter for the judgment of the ITC.”).
120 19 U.S.C. § 1677(7)(C)(i).
121 19 U.S.C. § 1677(7)(C)(ii).
122 19 U.S.C. § 1677(7)(C)(iii); see also SAA at 851 and 885 (“In material injury determinations, the Commissionconsiders, in addition to imports, other factors that may be contributing to overall injury. While these factors, insome cases, may account for the injury to the domestic industry, they also may demonstrate that an industry is facingdifficulties from a variety of sources and is vulnerable to dumped or subsidized imports.”).
20

are considered “within the context of the business cycle and conditions of competition that are distinctiveto the affected industry.”123
C. Threat of Material Injury by Reason of Subject Imports
Section 771(7)(F) of the Tariff Act directs the Commission to determine whether the U.S.industry is threatened with material injury by reason of the subject imports by analyzing whether “furtherdumped or subsidized imports are imminent and whether material injury by reason of imports wouldoccur unless an order is issued or a suspension agreement is accepted.”124 The Commission may not makesuch a determination “on the basis of mere conjecture or supposition,” and considers the threat factors “asa whole” in making its determination whether dumped or subsidized imports are imminent and whethermaterial injury by reason of subject imports would occur unless an order is issued.125 In making ourdetermination, we consider all statutory threat factors that are relevant to this investigation.126
123 19 U.S.C. § 1677(7)(C)(iii); see also SAA at 851, 885; Live Cattle from Canada and Mexico, Inv. Nos. 701-TA-386, 731-TA-812-813 (Preliminary), USITC Pub. 3155 at 25 n.148 (Feb. 1999).
124 19 U.S.C. § 1677(7)(F)(ii).
125 19 U.S.C. § 1677(7)(F)(ii).
126 These factors are as follows:
(I) if a countervailable subsidy is involved, such information as may be presented to it by the administeringauthority as to the nature of the subsidy (particularly as to whether the countervailable subsidy is a subsidydescribed in Article 3 or 6.1 of the Subsidies Agreement) and whether imports of the subject merchandiseare likely to increase,
(II) any existing unused production capacity or imminent, substantial increase in production capacity in theexporting country indicating the likelihood of substantially increased imports of the subject merchandiseinto the United States, taking into account the availability of other export markets to absorb any additionalexports,
(III) a significant rate of increase of the volume or market penetration of imports of the subject merchandiseindicating the likelihood of substantially increased imports,
(IV) whether imports of the subject merchandise are entering at prices that are likely to have a significantdepressing or suppressing effect on domestic prices and are likely to increase demand for further imports,
(V) inventories of the subject merchandise,
(VI) the potential for product-shifting if production facilities in the foreign country, which can be used toproduce the subject merchandise, are currently being used to produce other products.
* * *
(IX) any other demonstrable adverse trends that indicate the probability that there is likely to be materialinjury by reason of imports (or sale for importation) of the subject merchandise (whether or not it is actuallybeing imported at the time).
19 U.S.C. § 1677(7)(F)(i). To organize our analysis, we discuss the applicable statutory threat factors using thesame volume/price/impact framework that applies to our material injury analysis. Statutory threat factors (I), (II),(III), (V), and (VI) are discussed in the analysis of subject import volume. Statutory threat factor (IV) is discussed inthe price effects analysis, and statutory threat factor (IX) is discussed in the impact analysis. Statutory threat factor
(continued...)
21
VI. CONDITIONS OF COMPETITION AND THE BUSINESS CYCLE
The following conditions of competition inform our analysis of whether there is material injury orthreat of material injury by reason of subject imports.
A. Demand Conditions
CCP is used in printed material requiring high-gloss sheets, including annual company reports,high end brochures, catalogues, magazines, direct mail advertisements, labels, and certain packagingapplications.127 As such, the demand for CCP is largely determined by the overall economy and demandfor high-end commercially printed advertisements, reports, and brochures.128
Apparent U.S. consumption of CCP by quantity decreased by 21.3 percent from 2007 to 2009overall, before improving in the first half of 2010.129 Market participants noted that demand for CCPdecreased or fluctuated over the period of investigation. When asked how demand for CCP had changedsince January 2007, 10 of 11 responding U.S. integrated producers, all nine responding importers, and 18of 22 responding purchasers reported that demand had decreased or fluctuated.130 Four out of fiveconverters reported that demand had decreased.131 Market participants cited the recession in the U.S.economy, which began in late 2008 and continued throughout 2009, and the decline in the use of paperdue to competing forms of advertising and online retail sales, as reasons for the decline in demand.132 Commercial printing activity, as measured by RISI, began to decline in *** and decreased overall by ***percent from the first quarter of 2007 to the second quarter of 2010.133
B. Supply Conditions
During the period of investigation, the domestic industry accounted for the largest share ofapparent U.S. consumption. From 2007 to 2009, U.S. producers’ market share based on quantityincreased steadily from 60.7 percent in 2007, to 62.4 percent in 2008 and 65.5 percent in 2009. U.S.producers’ market share was 61.9 percent in interim 2009 and 68.7 percent in interim 2010.134 Subjectimports’ market share increased steadily from 13.9 percent in 2007 to 14.5 percent in 2008, and to 18.3percent in 2009.135 It was noticeably higher in interim 2009 at 19.7 percent than in interim 2010 (6.8
126 (...continued)(VII) is inapplicable, as no imports of agricultural products are involved in this investigation. No argument wasmade that the domestic industry is currently engaging or will imminently engage in any efforts to develop aderivative or more advanced version of the domestic like product, which would implicate statutory threat factor(VIII).
127 CR/PR at II-1, CR/PR at Table C-3.
128 CR at II-17, PR at II-11.
129 CR/PR at Table C-3. Apparent U.S. consumption declined from 2.86 million short tons in 2007 to 2.64million short tons in 2008, and to 2.25 million short tons in 2009. Apparent U.S. consumption was 1.07 millionshort tons in interim 2009 and 1.25 million short tons in interim 2010.
130 CR at II-19, PR at II-12.
131 CR at II-19, PR at II-12.
132 CR at II-19, PR at II-12.
133 CR/PR at Figure II-4; CR at II-17, PR at II-11-12.
134 CR/PR at Table C-3
135 CR/PR at Table C-3.
22

percent).136 Nonsubject imports’ market share decreased from 25.4 percent in 2007 to 23.1 percent in2008, and to 16.1 percent in 2009.137 Nonsubject imports’ market share was lower at 18.4 percent ininterim 2009 than in interim 2010 (24.5 percent).138
In 2009, eleven integrated producers accounted for most of U.S. production. U.S. converters,who convert sheeter rolls purchased from integrated producers into CCP, account for the remainder ofU.S. production of CCP.139 The *** integrated producers, ***, accounted for over *** of U.S. productionof CCP.140
During the period of investigation, there were a number of changes in the domestic industry’sorganization and production operations, including a significant amount of restructuring. This includedNewPage’s acquisition of Stora Enso North America and the shutdown of several plants.141 Petitionersmaintain that subject imports are the major cause of the reported mill closures.142 Respondents aver thatthe plant shutdowns are the result of the continuing efforts of the domestic industry to consolidate andrationalize inefficient capacity, and that the closures were presented when they occurred as positiveevents by the U.S. producers in question.143
During the period of investigation, the large majority of U.S. integrated producers’ U.S.shipments of CCP were to merchant/distributors.144 From 2007 to 2009, *** of importers’ shipments ofsubject imports were to merchant/distributors.145 *** percent, of U.S. converters’ U.S. shipments weremade to end users (typically printers) in 2009.146
136 CR/PR at Table C-3.
137 CR/PR at Table C-3.
138 CR/PR at Table C-3.
139 CR/PR at Table III-1. In the final phase of these investigations, the Commission did not request that U.S.producers break out their U.S. shipments of sheeter rolls. In the preliminary phase of these investigations, U.S.integrated producers reported *** short tons of U.S. commercial shipments to converters in 2008. U.S. converterswho submitted responses in the preliminary phase reported production of *** short tons in 2008, or *** percent oftotal U.S. commercial shipments of sheeter rolls. CR/PR at III-1, n.2.
140 CR/PR at Table III-1. Many of the production facilities of U.S. integrated producers produce CCP in onecontinuous operation from the harvested log to the intermediate product (pulp) to the final product. CR at I-23, PRat I-19, CR at VI-34-35, PR at VI-17-18. NewPage, Sappi, Clearwater, and MeadWestvaco are fully integratedproducers. CR at VI-1, PR at VI-1. A few of the smaller integrated producers purchase the pulp input from othersources. CR at VI-35, PR at VI-17-18.
141 CR/PR at Table III-4.
142 Petitioners’ Posthearing Brief, Questions from Commissioner Williamson, ex. 2, p. 1.
143 Respondents’ Prehearing Brief at 78-79.
144 CR/PR at Table II-1. During the period of investigation, the share of U.S. integrated producers’ U.S.shipments of CCP to merchants/distributors ranged from 69.4 percent to 76.7 percent. CR/PR at Table II-1. In2009, *** percent, and in interim 2010 *** percent of integrated producers’ U.S. shipments of CCP were salesthrough “paper directed buy” (PDB) programs. CR/PR at Table II-1. There were *** reported sales of importsthrough PDB programs. PDB programs are defined as sales of certain coated paper where the ultimate end-usecustomer (i.e., the purchaser of printed materials from the printer) negotiates the paper source, specifications, and/orprice directly with the paper distributor or the paper mill. In these transactions, the printer for the ultimate end usermust use the specified paper at the specific price.
145 CR/PR at Table II-1. In interim 2010, *** of U.S. importers’ U.S. shipments of certain coated paper fromChina were to merchants/distributors, with the *** of shipments going to end users. CR/PR at Table II-1.
146 CR/PR at Table II-1
23
In 2009, the large majority of subject merchandise was produced and exported by Chinese andIndonesian producers under the corporate umbrella of Asia Pulp & Paper Co., Ltd (“APP”).147 In thesecond half of 2009, APP began to establish an e-commerce U.S. distribution network for its products,called Eagle Ridge Paper (“Eagle Ridge”).148 Eagle Ridge ***.149 Respondents claim that Eagle Ridgewas established only in response to APP’s loss of business with U.S. distributor Unisource, is in the earlystages of development, and that it will take years before Eagle Ridge is able to supply large volumes ofsubject merchandise.150 Petitioners claim that this distributorship is fully operational and that it canquickly move increased volumes of subject imports into the U.S. market.151
C. Substitutability
The record indicates moderately high interchangeability between the domestic like product andsubject imports. The large majority of U.S. integrated producers, U.S. converters, U.S. importers, andU.S. purchasers reported that the domestic like product, subject imports and nonsubject imports were“always” or “frequently” interchangeable.152
According to market participants, price is a “very important” consideration, although notnecessarily the most important consideration, in purchasing decisions.153 Non-price factors cited bymarket participants as important to purchasing decisions included quality, reliability of supply, deliverytime, and availability.154
U.S. producers typically sell CCP in one of three grades, with Grade No. 1 having the highestbrightness levels, Grade No. 2 having the next highest brightness levels, and Grade No. 3 having thelowest brightness levels.155 The brightness levels of CCP and its classification into particular grades can
147 CR at VII-2-VII-7, VII-13, PR at VII-2-VII-4, VII-10.
148 CR at IV-2, PR at IV-2.
149 CR at IV-2, PR at IV-2. *** CR at IV-2, PR at IV-2.
150 Hearing Tr. at 363-364 (Hunley).
151 Hearing Tr. at 120-121 (Van Ert).
152 CR/PR at Table II-4.
153 CR/PR at Table II-2. Price was named by eight purchasers as the number one factor generally considered indeciding from whom to purchase certain coated paper, while 12 purchasers indicated it was the number two factor,and eight purchasers responded that it was the number three factor. CR at II-23. Quality was named by 15 of 27purchasers as the number one factor generally considered in deciding from whom to purchase certain coated paper,while eight purchasers indicated that it was the number two factor, and four reported that it was the number threefactor. CR at II-23, PR at II-14-15. Twenty-nine of 32 responding purchasers indicated that price was a “veryimportant” factor in their purchasing decisions. CR/PR at Table II-3.
154 CR at II-23-25, PR at II-14-15. Responses were mixed on the issue of whether differences other than pricewere a significant factor in sales of certain coated paper. The majority of responding integrated producers andconverters reported that differences other than price were “sometimes” or “never” a significant factor in their sales,while a majority of importers reported that differences other than price were “always” or “frequently” a significantfactor in their sales. CR/PR at Table II-5.
155 CR at I-18, PR at I-15-16.
24

vary by producer.156 According to Respondents, the large majority of subject imports are in Grade No. 3“economy grades.”157
D. Other Conditions of Competition
Contracts vs. Spot Sales. *** U.S. integrated producers, the majority of U.S. converters, and themajority of importers of certain coated paper from China and Indonesia reported that *** of their sales areon a spot basis.158 The remaining seven integrated producers reported either long-term and/or short-termcontracts as well as spot sales.159
Raw Material Costs. U.S. integrated producers of CCP reported that pulp, chemicals and dyes,coating additives, and packaging are the principal raw materials used in producing CCP.160 RespondingU.S. integrated producers reported that pulp accounts for between *** percent and *** percent of the totalcost of production and that chemicals and dyes account for between *** percent and *** percent.161 Responses by the U.S. integrated producers were mixed regarding whether the cost of pulp had increasedor decreased since 2007, while nearly all of them reported that the costs of chemicals and dyes haveincreased by *** to *** percent since 2007.162
“Black liquor” tax credit. In 2009, certain U.S. paper mills applied for and received analternative fuel tax credit pursuant to Section 642 of the Internal Revenue Code.163 This tax credit wentinto effect in late 2007 and expired at the end of 2009. The tax credit allowed producers to receive $0.50per gallon of kraft pulp by-product (or “black liquor”) that they produced. Such kraft pulp by-productresults from the production of certain coated paper and other papers, including other coated free sheetpapers and coated groundwood paper.164 Respondents claimed that this tax credit allowed U.S. integratedproducers to lower prices on its CCP in 2009,165 whereas Petitioners argue that these credits were not afactor in domestic producers’ pricing decisions in 2009.166
156 CR at I-18, PR at I-15-16. According to the Paperboard Packaging Alliance, there are also three major gradesof coated packaging paperboard: (1) solid bleached sulfate; (2) coated unbleached kraft paperboard; and (3) coatedrecycled paperboard. CR at I-22, PR at I-18-19.
157 Hearing Tr. at 311 (Hunley).
158 CR at V-3-V-4, PR at V-2.
159 CR at V-3, PR at V-2.
160 CR at V-1, PR at V-1.
161 CR/PR at V-1.
162 CR/PR at V-1. Six of the integrated producers reported that the cost of pulp had decreased by *** to ***percent since 2007, and five reported that the cost of pulp had increased by *** to *** percent. CR at V-1, PR at V-1.
163 CR at V-2, PR at V-2.
164 CR/PR at V-1 n.1. In 2009, NewPage reported $317 million and MeadWestvaco reported $375 million as“other income” from the black-liquor tax credit. CR at VI-39, n.33, PR at VI-19, n.33. Sappi classified the $132million from the tax credit as a separate line item that was part of its operating income, and Clearwater classified the$170.6 million from the credit as a component of its Pulp and Paperboard segment operating income. CR at VI-39n.33, PR at VI-19, n.33. International Paper made the largest overall claim, i.e., not specific to CCP, of $2.1 billion. CR at VI-39, n.33, PR at VI-18, n.33.
165 Respondents’ Prehearing Brief at 49-53.
166 Petitioners’ Posthearing Brief at 11.
25

VII. MATERIAL INJURY AND THREAT OF MATERIAL INJURY BY REASON OFSUBJECT IMPORTS
Based on the record in the final phase of these investigations, we find that an industry in theUnited States is threatened with material injury by reason of imports of certain coated paper from Chinathat have been found to be sold in the United States at less than fair value and that have been found to besubsidized by the Government of China and by reason of imports of certain coated paper from Indonesiathat have been found to be sold in the United States at less than fair value and that have been found to besubsidized by the Government of Indonesia. We do not find present material injury by reason of subjectimports.
A. Volume of the Subject Imports167
1. Analysis of Material Injury by Reason of Subject Imports
Subject imports were already present in substantial volumes and market share at the beginning ofthe period and increased their presence in the U.S. market from 2007 to 2009. In absolute terms, subjectimports from China and Indonesia, by quantity, declined from 398,309 short tons in 2007 to 382,245short tons in 2008, before increasing sharply to 413,593 short tons in 2009, for an overall increase of 3.8percent.168
As apparent U.S. consumption declined from 2007 to 2009, subject import market share increasednotably. Apparent U.S. consumption declined by 21.3 percent from 2007 to 2009, while U.S. shipmentsof subject imports increased by 3.8 percent during this same period.169 Consequently, subject importmarket share increased from 13.9 percent in 2007 to 18.3 percent in 2009, an increase of 4.4 percentagepoints.170 The ratio of subject imports to U.S. production increased from 20.5 percent in 2007 to 24.8percent in 2009, an increase of 4.3 percentage points.171 Notably, subject imports were the only source of
167 We note that Commerce in its final determinations added three additional HTS subheadings to its scopedescription (HTS 4810.32, 4810.39, and 4810.92). The parties appear to agree that product within the scope of theseinvestigations would not properly be classified under two of these subheadings (HTS 4810.32 and 4810.39) as theycover “kraft paper or paperboard other than the kind used for writing, printing, or other graphic purposes.” Petitioners stated that Commerce added these HTS subheadings in order to prevent circumvention of any issuedorder. Petitioners’ Posthearing Brief, Questions from Commissioner Lane, ex. 1 at 2. Therefore, the Commissiondid not use these HTS subheadings for its computation of U.S. import volumes and values. In their submissions toCommerce, Respondents stated that two of Gold East’s paper mills exported in-scope multi-ply paperboard productsunder a tariff item within the third subheading (HTS 4810.92.12). Respondents’ Posthearing Brief, ex. 2 at 1-2 andex. 3 at 8. Therefore, the Commission has used U.S. imports from China entering under HTS 4810.92.12, usingadjustment assumptions supplied by Respondents, to compile U.S. imports from China throughout the period ofinvestigation.
As no producer in Indonesia or nonsubject countries reported to Commerce or the Commission that itexported subject product under any of the additional HTS subheadings, the Commission did not in its computation ofU.S. imports from Indonesia and nonsubject countries use imports entering under any of the additional three HTSsubheadings. Finally, we also note that all the HTS subheadings listed in Commerce’s scope description do notidentify product on the basis of whether it is “suitable for high quality print graphics.”
168 CR/PR at Table IV-2, Table C-3.
169 CR/PR at Table C-3.
170 CR/PR at Table C-3.
171 CR/PR at Table IV-8.
26
increased volume into the U.S. market from 2007 to 2009, as both the volumes of the domestic industry’sU.S. shipments and that of nonsubject imports declined over this period.172
Subject imports declined sharply in interim 2010, both in absolute terms and relative toproduction and consumption, relative to interim 2009. Subject imports were 210,506 short tons in interim2009 and 85,033 short tons in interim 2010.173 On a monthly basis, subject imports continued at elevatedlevels in January and February 2010 and then dropped precipitously in March 2010, the month in whichCommerce issued affirmative preliminary countervailing duty determinations.174 Respondentsacknowledge that the steep declines in subject import volume were due to the pending trade cases.175 Based on the record evidence, we find that the decline in subject import volumes at the end of the periodexamined is attributable to the pendency of these investigations. Absent these investigations, the absoluteand relative volumes of subject imports would likely have been greater in interim 2010.
Based on the above information, we find the increase in subject imports, both on an absolute basisand relative to apparent U.S. consumption and production, to be significant.176 We also find that theincrease in subject import shipments and market share over the period examined was significant.
2. Analysis of Threat of Material Injury by Reason of Subject Imports
As explained below, we find that imports of the subject merchandise into the United States, in theabsence of antidumping and countervailing duty orders, will continue to increase their penetration of theU.S. market despite sluggish apparent U.S. consumption. From 2007 to 2009, subject imports showedtheir ability to increase their market presence at a time of falling U.S. demand for CCP. Apparent U.S.consumption declined by 21.3 percent from 2007 to 2009, whereas the volume of subject importsincreased by 3.8 percent and subject import market share increased by 4.4 percentage points.177 Inparticular, from 2008 to 2009, subject imports gained market share when U.S. demand for CCPplummeted. Apparent U.S. consumption declined by 14.7 percent from 2008 to 2009 as subject import
172 CR/PR at Table C-3. In particular, subject imports increased sharply in late 2008 through January 2009 basedon monthly subject import volumes. Subject import volumes were 30,883 short tons in September 2008, 37,935short tons in October 2008, 44,680 short tons in November 2008, 39,974 short tons in December 2008, and 46,964short tons in January 2009. Monthly Import Statistics, EDIS Doc. 434051.
173 CR/PR at Table C-3.
174 CR/PR at I-1. The petition was filed on September 23, 2009. Commerce’s preliminary countervailing dutydeterminations regarding CCP from China and Indonesia were issued on March 9, 2010, and Commerce’spreliminary antidumping duty determinations regarding CCP from China and Indonesia were issued on May 6, 2010. The statutory provision governing the Commission’s treatment of post-petition information, 19 U.S.C. § 1677(7)(I),states as follows:
{T}he Commission shall consider whether any change in the volume, price effects, or impact ofimports of the subject merchandise since the filing of the petition in an investigation … is relatedto the pendency of the investigation and, if so, the Commission may reduce the weight accorded tothe data for the period after the filing of the petition in making its determination of material injury,threat of material injury, or material retardation of the establishment of an industry in the UnitedStates.
175 See, e.g., Respondents’ Prehearing Brief at 72 (stating that in 2010, “subject imports left because of thepending trade cases.”); Respondents’ Prehearing Brief at 30 (stating that the pending trade cases explain why subjectimports declined in the second quarter of 2010).
176 Commissioner Pearson finds the increase in subject imports to be significant only on a relative basis.
177 CR/PR at Table C-3.
27

volumes increased by 8.2 percent, and subject import market share increased by 3.9 percentage points to18.3 percent of the U.S. market.178
The parties disagree about the amount of new capacity coming on line in China within the nextyear. Petitioners contend that data sources, such as EMGE & Co., a paper industry consultancy, projectcapacity to produce coated woodfree paper in China to increase by 2.9 million short tons by 2011, andthat this increased capacity will not be absorbed in the Chinese home market or by other markets inAsia.179 Respondents claim, based on questionnaire responses, that the new capacity in China in 2010 and2011 will be lower at *** short tons and that increases in capacity to produce certain coated paper inChina are necessary to keep up with increased demand in its home and regional markets and are notintended for export to the U.S. market.180
We find that even an increase in capacity of *** short tons between 2009 and 2011 is substantial,given that it is equivalent to approximately 75 percent of total 2009 U.S. consumption of just over 2million tons. Even assuming that the additional Chinese capacity is being brought on with the intentionof supplying the growing Chinese home market, projected consumption growth in China over the nextseveral years will not be sufficient to absorb the new capacity. RISI, an information provider for theglobal forest products industry, and a resource cited by both Petitioners and Respondents, projects thatgrowth in Chinese coated paper production capacity from 2009 to 2011 will be approximately double thegrowth of Chinese consumption.181
Projections on Indonesian capacity are mixed. Questionnaire respondents project flat capacity in2011 while RISI data project an increase in coated woodfree capacity in 2011. Despite mixedprojections, Indonesian producers remain export oriented with exports accounting for *** percent of theirshipments of certain coated paper in 2009.182 Reported production of certain coated paper in Indonesiaincreased overall from 2007 to 2009 and is projected to increase in the imminent future.183
The record indicates not only that subject producers of certain coated paper have the ability toincrease shipments to the United States but that they also have a strong interest in increasing suchshipments, even in a declining market. Chinese producers have been motivated to increase subject
178 CR/PR at Table C-3. Comparing half-year subject import volume data from January 2008 to June 2010,subject import volume peaked in the second half of 2008. Monthly Import Statistics, EDIS Doc. 434051.
179 Petitioners’ Final Comments at 17-20.
180 Respondents’ Final Comments at 20. Three producers of certain coated paper in China reported projections toincrease their capacity in 2010 and 2011 of approximately *** short tons, and another firm in China, Huatai, isprojected to begin producing certain coated paper in 2010 or 2011 with a facility with approximately *** short tonsof capacity. CR at VII-9, n.10, PR at VII-6, n.10. The sum of the reported projected capacity increases and the newcapacity of Huatai is approximately *** short tons.
181 RISI projects that capacity to produce coated woodfree and coated mechanical paper in China will grow from7.2 million metric tons in 2009 to 9.0 million metric tons in 2011, or by 1.8 million metric tons. RISI projects thatChinese consumption of these products will grow from 5.4 million metric tons in 2009 to 6.3 million metric tons in2011, or by 900,000 metric tons. The excess of capacity growth over consumption growth is 900,000 metric tons.Respondents’ Prehearing Brief at Ex. 28.
Although the combination of the RISI categories of coated woodfree and coated mechanical paper is likelyto be somewhat broader than the paper defined by Commerce’s scope, we consider the data to be probative of thelikely relative growth of China’s capacity and consumption of in-scope products.
Consumption growth in the rest of Asia is not projected to absorb the excess of Chinese capacity overconsumption. Excluding Japan (which is projected to shed some capacity but increase its production), RISI projectsconsumption growth from 2009 to 2011 to exceed capacity growth in the rest of Asia by 160,000 tons, well belowthe excess of projected Chinese capacity growth over projected Chinese consumption growth of 900,000 metric tons. Respondents’ Prehearing Brief at Ex. 28.
182 CR/PR at Table VII-5.
183 CR/PR at Table VII-5.
28

exports for quite some time. In particular, we note the behavior of APP, whose affiliated companiesaccounted for *** of reported subject imports in 2009.184 ***.185 ***.186 Moreover, soon after APP lostthe Unisource account in 2009, it made an investment to establish Eagle Ridge, an e-commerce U.S.distribution network for APP’s products to retain and grow its U.S. market presence.187
In addition, the United States represents a highly attractive market for several reasons. Prices aregenerally higher in the United States than in China or other markets in Asia.188 The U.S. market is largeand well understood by certain coated paper producers in China and Indonesia, who increased theiroverall shipments to the United States from 2007 to 2009. Subject producers’ knowledge of the U.S.market will only increase with APP’s investment to establish Eagle Ridge.189 Moreover, the fact that alarge share of CCP is supplied on a spot sales basis allows purchasers to switch between CCP supplierswith relative ease. In addition, the prevalence of private label products, in which merchants or retailersoffer coated paper products under their own brands, provides a ready avenue for subject imports toexpand their presence in the U.S. market even without an advertising or distribution infrastructure.190
There is no indication in the record that subject producers, in the absence of countervailing orantidumping duty orders, would find the U.S. market any less attractive in the imminent future than theydid from 2007 to 2009 when they increased their exports to the United States and their U.S. marketshare.191 Although demand in the United States is expected to remain depressed in the near future, subjectproducers would likely target orders for CCP that arise, consistent with their behavior in aggressivelyseeking sales and market share gains in the United States during the period examined. Given theimportance of price in purchasing decisions, aggressively priced subject imports would be able to quicklygain market share, or, alternatively, force domestic producers to lower their prices substantially in order toretain volume.
Respondents cite APP’s and Sun Paper’s loss of business in 2009 with major U.S. distributorsUnisource and xpedx to either domestic or nonsubject product as an indication that its sales to the UnitedStates are unlikely to increase.192 These developments in isolation may tend to weigh against a finding ofimminent increased import volumes. The evidence demonstrates, however, that APP’s and Sun Paper’sloss of business with Unisource and xpedx did not result in a substantial reduction in the volume of
184 CR/PR at Table IV-1.
185 Petitioners’ Posthearing Brief at ex. 1, p. 1 (“Unisource Affidavit”).
186 Unisource Affidavit, pp. 1-2. ***.
Unisource Affidavit, p. 2.
187 Respondents’ Posthearing Brief, ex. 1, at 62-64; Hearing Tr. at 363-64 (Hunley).
188 CR/PR at Table VII-2 (showing that unit values of China’s export shipments to the United States were over$100 higher than China’s shipments to its home market or other markets in Asia.). We also note that the EuropeanUnion initiated antidumping and countervailing duty investigations on coated paper from China on February 18,2010 and April 17, 2010, respectively. CR at VII-20, PR at VII-11. The resulting uncertainty from the initiation ofthese investigations by the European Union may make it a less attractive market for Chinese exports in the imminentfuture.
189 CR at IV-2, PR at IV-2.
190 CR at II-9, PR at II-6.
191 As discussed above, official Commerce statistics indicate that subject imports have declined in interim 2010. CR/PR at Table C-3. As noted above, we find that the decline in subject import volumes is attributable to thependency of these investigations. See 19 U.S.C. § 1677(7)(I)).
192 Respondents’ Prehearing Brief at 114-116.
29

overall subject imports in 2009 or the first two months of 2010.193 Subject import volume droppedsubstantially only starting in March 2010, when Commerce issued its preliminary countervailing dutydeterminations and CVD deposits were required. Continued high import levels indicate that subjectproducers compensated for the loss of the distributors’ business by increasing sales to their other existingcustomers or commencing sales to new customers. Subject producers’ ability to maintain an elevatedlevel of sales in the U.S. market is not surprising given the prevalence of spot sales, the openness of theU.S. market, and the willingness of purchasers to source imported products, as questionnaire responsesfrom purchasers accounting for the majority of coated paper sold in the U.S. market show. Apart fromrelatively small firms such as printers, nearly all purchasers obtained some coated paper from eithersubject or nonsubject countries during the period 2007 to 2009.194
Respondents argue that the growing value of Forest Stewardship Council (FSC) certification inselling CCP limits the ability of subject imports to increase significantly because APP is not able to offercertified paper.195 The record shows that a lack of FSC certification has not stopped subject imports fromincreasing to their highest levels in 2009, and there is no record evidence that a lack of certification willprevent increases in the imminent future. Specifically, after APP lost its FSC certification in November 2007, APP ***.196 Also, other Chinese and Indonesian producers of certain coated paper have maintainedtheir FSC certifications.197
Respondents also claim that competition is attenuated between the domestic like product andsubject imports because of the existence of PDB programs from which Respondents claim subject importsare largely excluded.198 In 2009, only *** percent of integrated U.S. producers’ U.S. shipments of CCPand in interim 2010 only *** percent of such shipments were sales through PDB programs.199 Moreover,a majority of purchasers reported that domestic and subject suppliers of CCP were comparable in terms of“willingness or ability ... to engage in {P}DB programs,” and several purchasers specifically confirmedparticipating in such programs with subject merchandise.200 Thus, PDB programs are not a distributionavenue that excludes subject imports.
Based on the above, we conclude that subject producers of certain coated paper have both theability and the incentive to increase exports of subject merchandise. We also conclude that the UnitedStates is a highly attractive market for subject certain coated paper producers, given its large size,relatively high prices, and the Chinese producers’ familiarity with it. Additionally, we note that theabsolute volumes and market share of subject imports in the United States have increased from 2007 to2009 despite a substantial decline in apparent U.S. consumption. Thus, we conclude that subject importvolume is likely to be significant within the imminent future, both in absolute terms and relative to
193 Average monthly cumulated subject import volume averaged between 30,000 and 35,000 tons in 2008, 2009,and Jan-Feb 2010. Monthly Import Statistics, EDIS Doc. 434051. We note that monthly subject import volume wasparticularly high at the end of 2008 and in January 2009.
194 See generally responses to purchaser questionnaires. The major exception is ***, a large purchaser thatpurchased only domestic product.
195 Respondents’ Prehearing Brief at 143-155.
196 Petitioners’ Posthearing Brief, Response to Commissioner Aranoff, at ex. 4, p. 6 and Foreign Producers’Questionnaire Responses cited on p. 6, nn.19 & 20.
197 Petitioners’ Posthearing Brief, Response to Commissioner Aranoff, at ex. 4, pp. 5-6 and Exhibit 3.
198 Respondents’ Prehearing Brief at 106-107.
199 CR/PR at Table II-1.
200 CR/PR at Table II-6; Hearing Tr. at 138 (McGehee); Unisource Affidavit at 3.
30

consumption and production in the United States, and that the increase in subject imports’ market sharewill likely be significant.201
B. Price Effects of the Subject Imports
1. Analysis of Material Injury by Reason of Subject Imports
As explained above in the discussion of conditions of competition, the domestic like product andsubject imports have moderately high interchangeability, and price is an important consideration inpurchasing decisions.202 Moreover, most sales of both the domestic like product and subject imports aremade to merchants/distributors.203
In these investigations, the Commission collected pricing data for five products. The pricing dataaccounted for *** percent of U.S. producers’ U.S. shipments of certain coated paper, *** percent of thequantity of U.S. imports from China, and *** percent of the quantity of U.S. imports from Indonesiaduring January 2007-June 2010.204 The data show that prices of cumulated imports undersold thedomestic like product in 48 out of 58 quarterly comparisons by margins ranging from 1.5 percent to 25.2percent.205
Respondents argue that U.S. product sells at a “natural premium” to subject imports due toshorter lead times, more secure supply chains, and purchasers’ preference to buy U.S. product.206 U.S.producer NewPage reported that historically it was able to receive a premium of $40 to $60 per ton, butthat this premium has eroded over time as it has lowered its prices to compete with subject imports.207 Apremium of $40 to $60 per ton is approximately equivalent to a premium of four to six percent for pricingproducts 1 and 4 and three to five percent for pricing product 3.208 We note that the average margins ofunderselling for products 1 and 4 were 7.2 to 7.6 percent and for product 3 was 19.1 percent, both aboveany alleged natural premium.209 Moreover, the average margins of underselling for all products was 12.3percent in 2009 when subject imports increased their volumes to period highs.210
Given the degree of substitutability between the subject and domestic product, the importance ofprice in purchasing decisions, and the prevalence of underselling in quarterly price comparisons, we findthat there has been significant price underselling by the subject imports.
201 We note that the majority of responding subject producers reported that they produce products other thancertain coated paper using the same manufacturing equipment and/or production-related employees, and thereforehave the ability to product shift. CR at VII-12, VII-16, PR at VII-9, VII-10. We also note that China andIndonesia’s cumulated reported end-of-period inventories were *** short tons in 2009, and are projected to *** to*** in 2010 and to *** in 2011. CR/PR at Table VII-8. While we have considered both of these statutory threatfactors, and find that they generally support our finding of threat of material injury, neither factor played asubstantial role in our threat determination.
202 CR/PR at Tables II-5 & II-7.
203 CR/PR at Table II-1.
204 CR/PR at Tables V-1-V-5, Table C-3, and CR at V-6, PR at V-4.
205 CR/PR at Table V-7. The large majority of purchasers reported that subject imports were generally lowerpriced than the domestic like product. CR/PR at Table II-6.
206 Respondents’ Prehearing Brief at 65.
207 CR at V-20-21, PR at V-9-10.
208 CR at V-21, n.15, PR at V-10, n.15.
209 CR/PR at Table V-7; CR at V-21, n.15, PR at V-10, n.15.
210 CR/PR at Table V-7.
31

We have considered movements in the prices of certain coated paper over the period ofinvestigation. Product 1 is a lower-brightness product that accounts for the majority of the sales ofChinese subject imports for which prices were reported; Product 1 also accounts for a significant quantityof sales of domestic product. Both domestic and subject import prices of Product 1 rose irregularly from2007 and much of 2008 with underselling fluctuating generally between four and 10 percent. In fourth-quarter 2008, however, prices of Chinese Product 1 declined sharply while domestic prices showed amodest increase.211 As a result of this divergence, the margin of underselling of the Chinese product 1grew substantially in fourth-quarter 2008, reaching 14.9 percent. Domestic prices of product 1 began todrop in first-quarter 2009, but because subject Chinese import prices continued to fall, the undersellingmargin grew to 15.7 percent in that quarter. In second-quarter 2009, the underselling margin declinedsomewhat to 9.0 percent as domestic prices continued to fall and prices of Chinese product leveled off.
Price movements were similar for Product 4, another lower-brightness product for which reportedprices represented a significant quantity volume of subject imports from China. As with Product 1,Chinese product prices began to fall in fourth-quarter 2008, when domestic prices were still rising,resulting in greater underselling. Domestic prices began to fall in first-quarter 2009 and further in thefollowing two quarters, as subject import prices continued to decline.212
There is an indication that the drop in domestic prices starting in first-quarter 2009 was not onlysubsequent to, but was in response to, the decline in subject import prices. Domestic producers testifiedthat they lowered prices to compete with falling prices of Chinese product.213 Numerous purchasersconfirmed that domestic producers lowered prices over the period of investigation to meet the prices ofsubject imports.214 215
211 A representative of Global Paper Solutions, the main importer from Chinese producer and exporter APP,confirmed the company’s decision to reduce the price of its exports to the U.S. market in fourth-quarter 2008. Hearing Tr. at 275-276 (Hunley).
212 The shipment quantities represented by pricing data on imports from Indonesia was much smaller than forimports from China for Product 1; data for Indonesia were virtually non-existent for Product 4. For Product 1, pricesof Indonesian product began to fall in fourth-quarter 2008, like Chinese product, but only dropped sharply in first-quarter 2009. CR/PR at Table V-1.
213 Domestic producers testified that they were forced to lower prices on their economy grades of CCP to competewith the bulk of the imports, and the resulting depressed pricing structure on economy CCP dragged down the priceson the higher brightness grades as well. Hearing Tr. at 56 (Stewart), at 119 (Van Ert), at 131 (Miller), at 134(Nelson).
214 CR at V-24-30; PR at V-12-14. The Commission collected data on three other products. Products 2 and 5 arehigher-brightness and therefore higher-grade products than Products 1 and 4. There were *** reported sales ofProducts 2 or 5 from China or Indonesia during the period. CR at V-6, PR at V-4. Prices for domestically producedProducts 2 and 5 rose irregularly during 2007 and most of 2008, then declined sharply starting in third-quarter 2009,two quarters later than the declines in Products 1 and 4. Domestic producers testified that prices for Products 2 and5 fell when the spread between the higher-grade products and depressed lower-grade products became unsustainable,even in the absence of direct competition from subject imports of the higher-grade products. Hearing Tr. at 118-120(Van Ert). We find this explanation to be reasonable, and thus reject respondents’ argument that the decreases inprices of Products 2 and 5 in the absence of subject imports of these products is evidence that subject imports did notaffect domestic prices. Respondents’ Prehearing Brief at 67-69.
Product 3 is paper coated on one side only and represents a very small volume of domestic and subjectimported product. Both domestic and subject import prices of Product 3 fluctuated with no clear pattern. CR/PR atTable V-3.
215 There is evidence that domestic producers lost some sales and revenues to subject imports during the period ofinvestigation. *** confirmed lost sales allegations totaling $*** and *** purchasers confirmed lost revenuesallegations totaling $***. CR at V-24, PR at V-12-V-13. We note that the lower prices for subject imports in fourth
(continued...)
32

We find that these pricing trends together with the significant underselling by subject importsshow that subject imports depressed domestic prices at least to some extent for part of the period underexamination.
We do not make a finding of significant price depression, however, because other factors thatwere occurring in the U.S. market likely also contributed importantly to lower prices and we are unable togauge whether there are significant effects attributable to subject imports.216 As discussed above, demandfor certain coated paper was significantly depressed, with apparent U.S. consumption dropping by 14.7percent from 2008 to 2009.217 The black liquor tax credit spurred greater pulp production by domesticproducers in 2009, contributing to lower prices for fiber/pulp which is a key input to production of coatedpaper.218 We find that the failure of domestic prices to rebound significantly in interim 2010 even aftersubject imports largely ceased in March 2010 indicates the important role that factors other than subjectimports played in the market.219 Accordingly, although we find some evidence of price depression bysubject imports, we do not find that cumulated subject imports from China and Indonesia significantlydepressed prices of the domestic like product in the U.S. market.
Nor do we find evidence that subject imports prevented price increases which otherwise wouldhave occurred to a significant degree. Although the domestic industry’s COGS/net sales ratio rose from2007 to 2009, other factors, including the effects of the black liquor tax credits, undermine the ratio as areliable indicator that the industry was experiencing a growing cost/price squeeze in theseinvestigations.220 Although domestic producers did not treat the tax credits as an offset to COGS in theirfinancial results,221 the benefits did affect domestic producers’ costs and production-related activities,according to a NewPage executive.222 Even if the industry did experience a cost/price squeeze, factorsother than subject imports may have prevented domestic producers from raising prices, including theaccelerating fall in demand from 2007 to 2009. Finally, the fact that the domestic industry’s COGS/netsales ratio was higher in interim 2010 than interim 2009, even though subject import market share wasapproximately two-thirds lower in interim 2010 than in interim 2009, casts doubt on the significance ofthe effects of subject imports on the domestic industry’s COGS/net sales ratio during the periodexamined.
215 (...continued)quarter 2008, and the higher margins of underselling in that quarter, coincided with a sharp increase in monthlysubject import volumes, which continued into January 2009.
216 In Commissioner Pinkert's view, the difficulty with a finding of significant price depression in connection withpresent material injury centers on the relatively limited period of time in which price depressing effects are evidenton the record. In particular, he finds an indication of price depression only in the first half of 2009. CR/PR atFigures V-1 and V-4 (Products 1 and 4).
217 CR/PR at Table C-3.
218 CR/PR at Table VI-8. Fiber/pulp costs dropped from $197 per short ton in 2008 to $170 per short ton in 2009. The average unit value of total raw material costs fell from $435 per short ton in 2008 to $411 per short ton in 2009. Integrated producer ***. CR at V-3, PR at V-2.
219 Despite the fact that subject imports were 59.6 percent lower at 85,033 short tons in interim 2010 than ininterim 2009 (210,506 short tons) , domestic prices were relatively flat in interim 2010. CR/PR at Tables V-1 to V-5.
220 CR/PR at Table C-3 (rising COGS/net sales ratios).
221 CR/PR at Table VI-7.
222 CR at VI-40 to VI-41 nn.37 & 41; PR at VI-20, nn.37 & 41. But see CR at VI-40 and PR at VI-19-VI-20(***).
33
2. Analysis of Threat of Material Injury by Reason of Subject Imports
We next consider the likely price effects of subject imports in the imminent future. As theyattempt to increase exports to the United States, the Chinese and Indonesian industries are likely tocontinue to use underselling and aggressive pricing as a means to increase market share, given thatsubject certain coated paper from China and Indonesia and the United States are generally substitutable. Because subject imports undersold domestically produced certain coated paper to a significant degreethroughout the period, and particularly in 2009 when demand was depressed, we find that underselling islikely to be significant in the imminent future. We find that underselling by subject imports is likely toincrease the attractiveness of those imports to domestic purchasers compared with domestic production,and that the underselling is likely to increase demand for further subject imports.
With respect to adverse effects on U.S. prices, we consider whether price depression and/or pricesuppression is likely as a result of subject imports. In performing that analysis, we note first that domesticproducers’ U.S. prices for certain coated paper were relatively flat in interim 2010.223 Moreover, demandfor certain coated paper, as measured by apparent U.S. consumption,224 was higher in interim 2010 than ininterim 2009, although demand was nonetheless relatively depressed compared to its earlier levels bythese measures, and U.S. demand for certain coated paper is projected to decline moderately over the nexttwo years.225 Therefore, any increases in subject import volume will not be absorbed by increaseddemand in the U.S. market.
We identified above several factors other than subject imports that likely placed negative pressureon domestic prices during the period of investigation, including falling consumption and increased pulpproduction due to black liquor subsidies. We find that these factors will not play the same role in theimminent future. Domestic consumption is likely to decline only modestly from 2010 to 2011. Althoughsluggish demand will likely restrain price recovery to some degree, there are no projections of a sharpfalloff in consumption similar to the one in 2009. In addition, the “black liquor” tax credit expired in2009 and is not likely to be renewed.
Without the prominence of these other market forces, we anticipate that a key driver of domesticmarket prices will be the significant volumes of subject imports. We have described above how thesubject imports led domestic prices downward in late 2008 and early 2009.
Absent antidumping or countervailing duty orders, the likely increasing and significant volumesof subject imports will need to enter the U.S. market priced aggressively in an effort to regain marketshare lost in interim 2010 due to the pendency of these investigations. As stated above, subject producershave substantial new capacity coming on line in the imminent future that cannot be absorbed by growinghome market demand. Subject producers are likely to find the United States an attractive market giventheir knowledge of the market, as well as the higher prices in the U.S. market compared to China andAsia.
Chinese producers have already shown a willingness ***226 With the establishment of EagleRidge in 2009, subject producers will have added ability and incentive to increase shipments to the U.S.market quickly. Given that many of the sales in this industry are on a spot basis, and purchasers have ahistory of quickly switching suppliers,227 subject imports will put pressure on domestic producers to lowerprices in a market with depressed demand in order to compete for sales and prevent an accelerated erosion
223 CR/PR at Tables V-2 to V-5.
224 Demand for certain coated paper in the U.S. market was higher in interim 2010, at 1.25 million short tons, thanin interim 2009, at 1.07 million short tons. CR/PR at Table C-3.
225 CR at II-19, PR at II-12.
226 Unisource Affidavit at 2.
227 For example, ***. CR at V-29-V-30, PR at V-13-V-14.
34

of their market share. Accordingly, subject imports are likely to enter the U.S. market imminently atprices that will have a significant depressing effect on domestic prices for certain coated paper.
We conclude that, in the imminent future, the aggressive price competition and underselling bysubject imports during the bulk of the period examined will continue, and the introduction of increasedquantities of subject imports, priced aggressively in an effort to gain market share, will put pressure ondomestic producers to lower prices in a market recovering from severely depressed demand. As subjectimports cause domestic sales volumes and prices to deteriorate, the domestic industry will likelyexperience significant price depression or suppression.
In sum, we conclude that subject imports are likely to have significant adverse effects ondomestic producers’ prices in the imminent future.228
C. Impact of the Subject Imports on the Domestic Industry229
1. Analysis of Material Injury by Reason of Subject Imports
Over the period examined, the domestic industry was faced with price-based competition fromsubject imports in a severely declining market. Many of the domestic industry’s performance basedindicators declined from 2007 to 2009. In interim 2010, when subject imports largely exited the marketand apparent consumption stabilized, the domestic industry’s performance indicators were mixed incomparison to 2009. We now summarize key indicia of domestic industry performance that illustratethese basic trends; these indicia provide the foundation for our findings regarding the current andimminent impact of subject imports.
As apparent U.S. consumption fell by 21.3 percent from 2007 to 2009,230 most indicators ofdomestic industry performance declined. The domestic industry’s average capacity fluctuated butdecreased by 2.3 percent from 2007 to 2009, declining from 2.06 million short tons in 2007 to 1.94
228 Commissioner Pearson finds that the domestic industry will likely experience price depression or suppressionand that subject imports are likely to have adverse effects on domestic producers' prices in the imminent future.
229 In its final affirmative dumping determination on sales of certain coated paper from China, Commerce foundweighted average dumping margins of 7.6 percent for Gold East Paper (Jiangsu) Co., Ltd (“Jiangsu”); GoldHuasheng Paper Co., Ltd (“Huasheng”), Ningbo Zhonghua Paper Co., Ltd. (“Ningbo Zhonghua”), Ningbo Asia Pulp& Paper Co., Ltd. (“Ningbo Asia”), Gold East (Hong Kong) Trading Co., Ltd. (“Hong Kong”), and ShandongChenming Paper Holdings, Ltd. (“Shandong”), and 135.83 percent for all others. CR at I-7, PT at I-6. With respectto Indonesia, Commerce found weighted average dumping margins of 20.13 percent for PT Pabrik Kertas TjiwiTbk., PT Pindo Deli Pulp & Paper, and PT Indah Kiat Pulp & Paper Tbk., and for all others. CR at I-7, PR at I-6.
In its final affirmative countervailing duty investigation of imports from China, Commerce found thefollowing twelve programs to be countervailable: (A) one preferential lending program; (B) four income taxprograms; (C) four indirect tax and import tariff programs; and (D) three provisions of goods or services for less thanadequate remuneration. It found a subsidy rate of 178.03 percent ad valorem for Shandong Sun Paper Industry JointStock Co., Ltd., and Yanzou Tianzhang Paper Industry Co., Ltd., and 17.64 percent for Jiangsu, Huasheng, HongKong, Ningbo Zhonghua, Ningbo Asia, and all others. CR at I-8-I-9, PR at I-7-I-8..
In its final affirmative countervailing duty investigation of imports from Indonesia, Commerce found thefollowing four programs to be countervailable: (A) provision of standing timber for less than adequateremuneration program; (B) government prohibition of log exports; and (C) two debt forgiveness programs. CR at I-10-I-11, PR at I-9.
230 Apparent U.S. consumption declined from 2.86 million short tons in 2007 to 2.64 million short tons in 2008,and to 2.25 millions short tons in 2009. CR/ PR at Table C-3
35

million short tons in 2008, and then increasing to 2.02 million short tons in 2009.231 232 The domesticindustry’s production declined by 14.4 percent from 2007 to 2009, from 1.95 million short tons in 2007 to1.86 million short tons in 2008 and 1.67 million short tons in 2009.233 The domestic industry’s capacityutilization rate fell irregularly from 94.2 percent in 2007 to 82.5 percent in 2009.234 The domesticindustry’s U.S. shipment quantity declined by 15.0 percent from 2007 to 2009, from 1.74 million shorttons in 2007 to 1.65 million short tons in 2008 and 1.48 million short tons in 2009.235
Despite the overall declines in production and shipments from 2007 to 2009, the domesticindustry increased its market share during this period by 4.8 percentage points and the market share ofsubject imports increased by 4.4 percentage points. The increases in market share by the domesticindustry and subject imports from 2007 to 2009 came at the expense of nonsubject imports whose marketshare fell by 9.3 percentage points from 2007 to 2009.236
As the domestic industry’s production and shipments decreased, so did the number of productionrelated workers (“PRWs”), hours worked, and wages paid. Between 2007 and 2009, the number ofPRWs declined by *** percent, from *** PRWs in 2007 to *** PRWs in 2009, while hours workeddeclined by *** percent, and wages paid declined by *** percent.237 Productivity fell irregularly from*** short tons per 1,000 hours in 2007 to *** short tons per 1,000 hours in 2009.238
Parallel to the falling shipments and declining prices described in the section on Price Effects, thedomestic industry experienced declines in many financial indicators from 2007 to 2009.239 The quantityand value of the domestic industry’s net sales declined by 15.3 percent and 15.8 percent from 2007 to
231 CR/PR at Table C-3. Petitioners noted that the domestic industry was forced to shut down two mills thatproduced CCP during the period of investigation, one in Kimberly, Wisconsin in July 2008, and one in Muskegon,Michigan in August 2009, and argued that these closures were caused largely by unfairly traded subject imports. Petitioners’ Posthearing Brief, Questions from Commissioner Williamson, ex. 2, p.1. Respondents claimed thatthese closures were the result of the continuing efforts of the domestic industry to consolidate and rationalizeinefficient capacity, and that domestic producers’ relatively stable capacity during the period of investigation isevidence of this fact. Respondents’ Prehearing Brief at 78-79. We do not find that subject imports were asignificant cause of these closures. Some reductions in capacity are consistent with the declines in apparent U.S.consumption over the period. In fact, the industry maintained close to its overall capacity level from 2007 to 2009.While the industry was subjected to aggressive subject import pricing for the period (2008-2009) that coincided withthese closures, in nearly all cases, at the time of the closures the affected companies cited reasons other than subjectimports for the closures.
232 Commissioner Pinkert is unable to make a definitive determination, on this record, as to whether these plantclosures were caused in whole or in part by subject imports. Nevertheless, he notes that the Kimberly closureoccurred before the late 2008/early 2009 increase in subject imports, and Petitioners did not provide corroborativeevidence to support their assertion that the Muskegon closure was caused by subject imports.
233 CR/PR at Table C-3.
234 CR/PR at Table C-3.
235 CR/PR at Table C-3.
236 CR/PR at Table C-3.
237 CR/PR at Table C-3. Hours worked (1,000) declined from *** in 2007 to *** in 2008 and *** in 2009. Wages paid decreased from $*** in 2007 to $*** in 2008 and $*** in 2009. CR/PR at Table C-3.
238 CR/PR at Table C-3. Productivity was *** short tons per 1,000 hours in interim 2009 as compared to ***short tons per 1,000 hours in interim 2010.
239 We considered the combined financial results on CCP other than coated packaging paperboard and coatedpackaging paperboard to be the most relevant data set for purposes of our threat decision. CR/PR at Tables VI-7 &Table C-3. While we relied on this information without modification, we did take note of certain company-specificreporting issues which we determined did not materially impact the underlying data. CR at VI-12, n.8, PR at VI-11,n.8.
36

2009, respectively.240 The domestic industry experienced positive but declining operating income in eachyear of the period examined, falling from $144.0 million in 2007 to $95.1 million in 2008 and $61.8million in 2009.241 Its operating income as a ratio of net sales declined from 7.4 percent in 2007 to 4.9percent in 2008, and to 3.8 percent in 2009.242 Capital expenditures decreased irregularly, from $51.2million in 2007 to $33.8 million in 2009.243
As described above, subject imports generally departed the market in March 2010 as Commerceissued its preliminary CVD determinations. As a result of this, and a stabilizing CCP market,244 manydomestic industry indicators were higher in interim 2010 than in interim 2009. Domestic production was24.9 percent higher, and shipment quantity was 30.3 percent higher, in interim 2010 than in interim2009.245 Because the industry’s capacity was only slightly higher in interim 2010 than interim 2009, thehigher production in interim 2010 meant that the industry’s capacity utilization was significantly higher ininterim 2010 (94.8 percent) than in interim 2009 (80.3 percent).246
With respect to interim period financial indicators, the industry earned an absolute operatingincome that was 6.6 percent higher in interim 2010 than in interim 2009.247 Because of its higher net salesin interim 2010 than in interim 2009, however, the industry posted a slightly lower operating ratio ininterim 2010 (2.5 percent) than in interim 2009 (2.9 percent).248
We have considered whether there is a link between the worsening condition of the domesticindustry from 2007 to 2009 and the effects of subject imports. As described in earlier sections, subjectimports reached peaks in volume and market share in 2009, there is some evidence that the importsdepressed domestic prices, but the record does not establish that the effects of subject imports ondomestic prices were significant. The deterioration in almost all of the domestic industry’s performanceindicators between 2007 and 2009 coincided with the economic downturn and a sharp decline in demandfor CCP. Despite this decline in demand, the domestic industry remained profitable and steadilyincreased its market share.249 Moreover, even when subject imports largely left the market in interim
240 CR/PR at Table C-3.
241 CR/PR at Table C-3.
242 CR/PR at Table C-3. COGS as a ratio of net sales increased from 86.4 percent in 2007 to 89.7 percent in2009. The domestic industry’s average unit sales values declined overall from 2007 to 2009 but remained higherthan combined unit COGS and SG&A expenses. Average unit sales values were $947 in 2007, $977 in 2008, and$942 in 2009. Unit COGS were $818 in 2007, $864 in 2008, and $845 in 2009, and unit SG&A expenses were $59in 2007, $64 in 2008, and $62 in 2009. CR/PR at Table C-3.
243 CR/PR at Table C-3.
244 Apparent U.S. consumption was 1.07 million short tons in interim 2009 and 1.25 million short tons in interim2010. CR/PR at Table C-3.
245 The domestic industry’s production was 795,320 short tons in interim 2009 and 993,354 short tons in interim2010. The domestic industry’s U.S. shipments were 660,769 short tons in interim 2009 and 861,105 short tons ininterim 2010. CR/PR at Table C-3.
246 The domestic industry’s capacity was 990,138 short tons in interim 2009 as compared to 1.05 million shorttons in interim 2010 . CR/PR at Table C-3. The number of PRWs and hours worked were both slightly lower ininterim 2010 than in interim 2009, while wages paid were higher in interim 2010 as compared to interim 2009. CR/PR at Table C-3. PRWs were *** in interim 2009 and *** in interim 2010. Hours worked (1,000) were *** ininterim 2009 and *** in interim 2010. Wages paid were $*** in interim 2009 and $*** in interim 2010. CR/PR atTable C-3.
247 Operating income was $22.4 million in interim 2009 and $23.9 million in interim 2010. CR/PR at Table C-3.
248 CR/PR at Table C-3. Capital expenditures were $15.7 million in interim 2009 and $18.8 million in interim2010.
249 We also note that domestic producers had a significant revenue stream from the black liquor tax credit in 2009,(continued...)
37

2010 due to the pendency of these investigations, many of the domestic industry’s performance indicatorsdid not improve, including operating margins, COGS/sales ratio and number of workers.250 In light of theforegoing, we do not find a sufficient causal nexus necessary to make a determination that the subjectimports are currently having a significant adverse impact on the domestic industry.
2. Analysis of Threat of Material Injury by Reason of Subject Imports
Even in light of an overall decline in apparent U.S. consumption during the period ofinvestigation, the downward trends in virtually all of the domestic industry’s performance indicatorsduring the period examined weigh heavily in our consideration of the impact of subject imports in theimminent future. Specifically, from 2007 to 2009, the domestic industry suffered double-digit percentagedeclines in production, shipments, capacity utilization, net sales, production workers, operating income,and capital expenditures.251 We recognize that the domestic industry’s financial indicators may have beenworse in 2009 if not for the revenue it received from the black liquor tax credit. As discussed, this taxcredit expired in 2009, and therefore any benefit that the domestic industry received from it in 2009 willnot continue into the imminent future. Even as demand recovered somewhat in interim 2010, and a largemajority of subject imports left the market, the domestic industry’s COGS/sales ratio continued toincrease as its number of production workers and operating margins continued to decline. Accordingly,we find that the industry is vulnerable to material injury.
As a result of the declining trends and given its vulnerable state, the domestic industry will likelycontinue to experience even lower employment levels, net sales, operating income, and profitability asincreasing volumes of low-priced subject imports enter the U.S. market and compete with the domesticlike product. Subject producers have already shown the ability and willingness to lower prices for subjectmerchandise that was already underselling the domestic like product in order to significantly increasetheir exports to the United States, even in a contracting market.252 We believe that this behavior willcontinue in the imminent future, particularly in light of the significant new capacity in China, theestablishment of Eagle Ridge in 2009, and the attractiveness of the U.S. market.
The U.S. market cannot accommodate growth in subject imports without material injury to theU.S. industry. Although apparent U.S. consumption recovered somewhat in interim 2010 from its lowestlevels in 2009, RISI projects a decline of *** percent in apparent U.S. consumption from 2010 to 2011and a further reduction of *** percent in 2012.253 Accordingly, future volumes of subject imports will notbe in response to growing U.S. demand for CCP, but will take sales from current suppliers such as thedomestic industry.
Given that the industry is already in a weakened state, we conclude that, unless antidumping dutyand countervailing duty orders are issued, significant volumes of dumped and subsidized imports willgain additional U.S. market share in the imminent future and material injury by reason of subject importswill occur. We find that there is a likely causal relationship between the subject imports and an imminentadverse impact on the domestic industry.
We also considered whether there are other factors that will likely have an imminent impact onthe domestic industry, in particular, reduced levels of domestic consumption of CCP, and the role of CCPimports from non-subject countries. As noted, U.S. consumption of CCP is projected to decline modestly
249 (...continued)which encouraged domestic producers to produce greater volumes of pulp, and may have insulated them to somedegree from price declines in 2009. CR at VI-40-VI-41, PR at VI-19-VI-20.
250 CR/PR at Table C-3.
251 CR/PR at Table C-3.
252 As discussed above, in late 2008 ***. Unisource Affidavit at 1-2.
253 CR at II-19, PR at II-12.
38

from 2010 to 2011. Although a lower level of consumption is likely to limit the domestic industry’s salesopportunities and restrain potential price increases to some degree, the decline is not of a magnitude thatwould render insignificant the likely effects of subject imports that we have described above.
The same is true for CCP imports from countries other than China and Indonesia. Thesenonsubject imports were sold in the U.S. market throughout the period examined, although from 2007 to2009 their market share declined by 9.3 percentage points overall from 25.4 percent in 2007 to 16.1percent in 2009. The market share held by nonsubject imports was 18.4 percent in interim 2009 and 24.5percent in interim 2010. Although nonsubject imports did gain market share in interim 2010 whensubject imports left the market due to the pendency of the investigations, the domestic industry alsogained 6.8 percentage points of market share from interim 2009 to interim 2010. Moreover, the availabledata reflect that non-subject imports are generally priced higher than subject imports.254 Once thepreliminary duties are lifted, subject imports will compete on price to regain the market share that theylost both to the domestic industry and to non-subject imports in interim 2010, which will in turn result ina more price-competitive U.S. market.
We conclude that, given the vulnerability of the domestic industry, together with the likelihoodthat cumulated subject imports will increase significantly in the imminent future at prices that will likelyundersell the domestic like product and depress or suppress domestic prices to a significant degree,material injury by reason of subject imports will occur absent issuance of antidumping duty andcountervailing duty orders against subject imports. We therefore conclude that the domestic CCPindustry is threatened with material injury by reason of cumulated subject imports from China andIndonesia.
We further determine, pursuant to 19 U.S.C. § 1671d(b)(4)(B), that we would not have foundmaterial injury but for the suspension of liquidation of subject imports.
CONCLUSION
For the reasons discussed above, we find that an industry in the United States is threatened withmaterial injury by reason of imports of certain coated paper from China that were found to be sold in theUnited States at less than fair value and that were found to be subsidized by the Government of China andby reason of imports of certain coated paper from Indonesia that were found to be sold in the UnitedStates at less than fair value and that were found to be subsidized by the Government of Indonesia.
254 The Commission gathered data on non-subject import prices which are reflected in Appendix D of the staffreport. These data reflect non-subject imports, primarily from Korea, overselling subject import prices in 41 out of59 pricing comparisons. These data are consistent with our average unit value (“AUV”) data which show non-subject import AUVs to be consistently higher than subject import AUVs. CR/PR at Appendix D and Table IV-2. Although Respondents argue that our non-subject import pricing data are “thin,” and thus unreliable, the data covercertain coated paper from Korea, the largest source of non-subject imports, and are consistent with our AUV data onsubject and nonsubject imports. CR at IV-4, PR at IV-3.
39


SEPARATE VIEWS OF COMMISSIONER CHARLOTTE R. LANE
MATERIAL INJURY BY REASON OF SUBJECT IMPORTS
Based on the record in the final phase of these investigations, I find that an industry in the UnitedStates is injured by reason of imports of certain coated paper from China that have been found to be soldin the United States at less than fair value and that have been found to be subsidized by the Governmentof China and by reason of imports of certain coated paper from Indonesia that have been found to be soldin the United States at less than fair value and that have been found to be subsidized by the Governmentof Indonesia. I join with the majority views through the majority discussion of Conditions ofCompetition. I do not join with the majority in Section VII of those views discussing material injury andthreat of material Injury by reason of subject imports. I write separately with regard to material injury.
Volume of the Subject Imports1
In evaluating the volume of subject imports, section 771(7)(C)(I) of the Tariff Act provides thatthe “Commission shall consider whether the volume of imports of the merchandise, or any increase in thatvolume, either in absolute terms or relative to production or consumption in the United States, issignificant.”2
Subject imports increased their presence in the U.S. market from 2007 to 2009. Subject importsfrom China and Indonesia increased from 398,309 short tons (“tons”) in 2007 to 413,593 tons in 2009, foran overall increase of 3.8 percent.3 Because apparent U.S. consumption declined from 2007 to 2009,subject import market share increased more than the 3.8 percent overall volumetric increase. ApparentU.S. consumption declined by 21.3 percent from 2007 to 2009, while subject imports increased by 3.8percent during this same period.4 Consequently, subject import market share increased from 13.9 percentin 2007 to 14.5 percent in 2008, and to 18.3 percent in 2009, an increase of 4.4 percentage points, or over30 percent from the 2007 share.5 The ratio of subject imports to U.S. production increased from 20.5percent in 2007 to 20.6 percent in 2008 and then to 24.8 percent in 2009, an increase of 4.3 percentagepoints, or 21 percent, during this period.6 Notably, subject imports were the only source of increased
1 In its final determinations Commerce added three HTS subheading (HTS 4810.32, 4810.39, and 4810.92) to itsscope description. The parties appear to agree that product within the scope of these investigations would notproperly be classified under HTS 4810.32 and 4810.39 as those subheadings cover kraft paper or paperboard otherthan the kind used for writing, printing, or other graphic purposes. Therefore product imported under these HTSsubheadings are not included for computation of U.S. import volumes and values. In its submissions to Commerce,respondents stated that two of Gold East’s paper mills exported multi-ply paperboard products under HTS4810.92.12. Respondents’ Posthearing Brief, exh. 2,at 1-2 and exh. 3, at 8. I have included U.S. imports fromChina entering under HTS 4810.92.12 to compile U.S. imports from China throughout the period of investigation. No producer in Indonesia or nonsubject countries reported to Commerce or the Commission that it exported subjectproduct under any of the additional HTS subheadings. Therefore, the computation of U.S. imports from Indonesiaand nonsubject countries does not include imports entering under any of the three additional HTS subheadings.
2 19 U.S.C. § 1677(7)(C)(i).
3 CR/PR at Table IV-2, Table C-3.
4 CR/PR at Table C-3.
5 CR/PR at Table C-3.
6 CR/PR at Table IV-8.
41
volumes from 2007 to 2009, as both U.S. producers U.S. shipments and nonsubject imports declined overthis period.7
Subject imports declined significantly, both in absolute terms and relative to U.S. production andconsumption, in interim 2010 as compared to interim 2009. Subject imports dropped from 210,506 tonsin interim 2009 to 85,033 tons in interim 2010. The declines in the volume and market share of subjectimports in interim 2010 occurred after the petition in these investigations was filed on September 23,2009, and, for a large portion of the interim period, after Commerce’s affirmative preliminarycountervailing duty determinations regarding China and Indonesia on March 9, 2010. Commerce’saffirmative antidumping duty determinations regarding China and Indonesia occurred on May 19, 2010,closer to the end of the 2010 interim period. Even Respondents acknowledge that the large declines insubject import volume in 2010 were due to the pendency of these cases.8 I give reduced weight to thedecline in subject import volumes at the end of the period examined for purposes of evaluating themagnitude of volumes of subject imports.9 I find that the decline in the volume of subject imports in 2010is attributable to the pendency of these investigations and that the volumes of subject imports wouldlikely have been greater in interim 2010 except for these investigations.
I find that the volume of subject imports during the period examined was significant, both inabsolute terms and relative to consumption and production in the United States. I also find that theincrease in subject imports, both on an absolute basis and relative to apparent U.S. consumption andproduction, was significant.
Price Effects of the Subject Imports
The domestic like product and subject imports are generally interchangeable, and price is animportant consideration in purchasing decisions.10 The interchangeability of products and the importanceof price in purchasing decisions is an important factor when considering the impact of competingproducts on prices.
In these investigations, the Commission collected pricing data for five products. The pricing dataaccounted for *** percent of U.S. producers’ U.S. shipments of certain coated paper, *** percent of thequantity of U.S. imports from China, and *** percent of the quantity of U.S. imports from Indonesia forthe period January 2007 through June 2010.11 The data show that prices of cumulated imports undersoldthe domestic like product in 48 out of 58 quarterly comparisons by margins ranging from 1.5 percent to
7 CR/PR at Table C-3.
8 See, e.g., Respondents’ Prehearing Brief at 72 (stating that in 2010, “subject imports left because of the pendingtrade cases.”); Prehearing Brief at 30 (stating that the pending trade cases explain why subject imports declined inthe second quarter of 2010).
9 CR/PR at I-1. The statutory provision governing the Commission’s treatment of post-petition information,19 U.S.C. § 1677(7)(I), states that:
{T}he Commission shall consider whether any change in the volume, price effects, or impact ofimports of the subject merchandise since the filing of the petition in an investigation … is relatedto the pendency of the investigation and, if so, the Commission may reduce the weight accorded tothe data for the period after the filing of the petition in making its determination of material injury,threat of material injury, or material retardation of the establishment of an industry in the UnitedStates.
10 CR/PR at Tables II-5 & II-7.
11 CR/PR at Tables V-1-V-5, Table C-3, and CR at V-6, PR at V-4.
42

25.2 percent.12 I find that this pricing data shows that there has been significant price underselling by thesubject imports.13
Given that domestic prices increased from 2007 to 2008, there is no evidence that theunderselling of the domestic like product by subject imports resulted in price depression during thatperiod.
I also considered whether subject imports from China and Indonesia suppressed prices of thedomestic like product to a significant degree. During the period examined, the domestic industry’s costof goods sold (“COGS”)-to-net sales ratio increased from *** percent in 2007 to *** percent in 2009.14 Ido not believe that the inability of the domestic industry to fully recover its COGS throughout the periodof investigation, or the inability of the domestic industry to price its product to eliminate at least some ofits decline in profits, can be attributed solely to the market conditions prevailing during the period ofinvestigation. I do not find any merit in the Respondents’ arguments that the Black Liquor tax creditreduced costs of the domestic industry allowing them to reduce prices. Given the financial condition ofthe domestic industry, this argument makes no sense. The domestic industry was not in a financialposition to realistically pass the Black Liquor tax credits, or any other cost savings, onto customers in theform of lower prices. If anything, the industry should have used the Black Liquor tax credit to prop up itsdeclining profitability. I find that they did not, or could not, do that because of the competition that theywere facing from the unfairly traded subject imports.
Based on the record, I find that the domestic industry did experience a cost-price squeeze whichwas caused, to a significant degree, by subject imports. I find that subject imports prevented priceincreases which otherwise would have occurred during the period examined to a significant degree.
12 CR/PR at Table V-7.
13 Respondents argue that U.S. product sells at a “natural premium” to subject imports due to shorter lead times,more secure supply chains, and purchasers’ preference to buy U.S. product. Respondents’ Prehearing Brief at 65. U.S. producer New Page reported that while it historically may have been able to receive a premium of $40 to $60per ton, this premium has eroded over time as it has lowered its prices to compete with subject imports. Hearing Tr.at 133 (Nelson) and 189 (DeVoe). A premium of $40 to $60 per ton is approximately equivalent to a premium of*** to *** percent for pricing products 1 and 4 and *** to *** percent for pricing product 3. The average marginsof underselling for products 1 and 4 were *** to *** percent and for product 3 was *** percent. Thus, theunderselling margins exceeded any natural premium that purchasers may place on domestic paper. CR/PR at TableV-7; CR at V-21, n.15, PR at V-10, n.15.
14 CR/PR at Table C-3.
43

C. Impact of the Subject Imports on the Domestic Industry15
Over the period examined, the domestic industry was faced with significant price competitionfrom unfairly traded subject imports in a severely declining market. Many of the domestic industry’sindicators of operating performance and financial performance declined from 2007 to 2009.
Apparent U.S. consumption fell by 21.3 percent from 2007 to 2009, declining from 2.86 milliontons in 2007, to 2.64 million tons in 2008, and to 2.25 millions tons in 2009. Apparent U.S. consumptionwas 1.25 million tons in interim 2010 as compared to 1.07 million tons in interim 2009.16 The domesticindustry’s average capacity fluctuated but decreased slightly from 2007 to 2009, declining from 2.06million tons in 2007 to 1.94 million tons in 2008, and then increasing to 2.02 million tons in 2009.17 Thedomestic industry’s capacity was 1.05 million tons in interim 2010 as compared to 990,138 tons ininterim 2009.18 The domestic industry’s production declined by 14.4 percent from 2007 to 2009, from1.95 million tons in 2007 to 1.86 million tons in 2008 and to 1.67 million tons in 2009.19 The domesticindustry’s production was 993,354 tons in interim 2010 as compared to 795,320 tons in interim 2009.20 The domestic industry’s capacity utilization rates increased from 94.2 percent in 2007 to 95.6 percent in2008, before falling to 82.5 percent in 2009.21 The domestic industry’s capacity utilization rate was 94.8percent in interim 2010 as compared to 80.3 percent in interim 2009.22 The domestic industry’s U.S.shipments by quantity declined by 15.0 percent from 2007 to 2009, from 1.7 million tons in 2007 to 1.65million tons in 2008, and to 1.48 million tons in 2009.23 The domestic industry’s U.S. shipments were
15 In its final determination of sales of certain coated paper from China, Commerce found weighted averagedumping margins of 7.6 percent for Gold East Paper (Jiangsu) Co., Ltd (“Jiangsu”); Gold Huasheng Paper Co., Ltd(“Huasheng”), Ningbo Zhonghua Paper CO., Ltd. (“Ningbo Zhonghua”), Ningbo Asia Pulp & Paper Co., Ltd.(“Ningbo Asia”), Gold East (Hong Kong) Trading Co., Ltd. (“Hong Kong”), and Shandong Chenming PaperHoldings, Ltd. (“Shandong”), and 135.83 percent for all others. With respect to Indonesia, Commerce foundweighted average dumping margins of 20.13 percent for PT Pabrik Kertas Tjiwi Tbk., PT Pindo Deli Pulp & Paper,and PT Indah Kiat Pulp & Paper Tbk., and for all others. CR at I-7.
In its final affirmative countervailing duty investigation of imports from China, Commerce found a 12countervailable programs. In its final affirmative countervailing duty investigation of imports from Indonesia,Commerce found 4 countervailable programs. Commerce found a subsidy rate of 178.03 percent for Shandong SunPaper Industry Joint Stock Co., Ltd., and Yanzou Tianzhang Paper Industry Co., Ltd., and 17.64 percent for Jiangsu,Huasheng, Hong Kong, Ningbo Zhonghua, Ningbo Asia, and all others.
16 CR/PR at Table C-3.
17 CR/PR at Table C-3. Petitioners noted that it was forced to shut down two mills that produced certain coatedpaper during the period of investigation, one in Kimberly, Wisconsin in July of 2008, and one in Muskegon,Michigan in August 2009, and that these closures were caused largely by unfairly traded subject imports. Petitioners’ Posthearing Brief, “Questions from Commissioner Williamson,” exh. 2, p.1. Respondents argued thatthese closures were the result of the continuing efforts of the domestic industry to consolidate and rationalizeinefficient capacity, and that domestic producers relatively stable capacity during the period of investigation isevidence of this fact. Respondents’ Prehearing Brief at 78-79.
18 CR/PR at Table C-3.
19 CR/PR at Table C-3.
20 CR/PR at Table C-3.
21 CR/PR at Table C-3.
22 CR/PR at Table C-3.
23 CR/PR at Table C-3.
44

861,105 tons in interim 2010 as compared to 660,769 tons in interim 2009.24 Despite the overall declinesin production and shipments from 2007 to 2009, however, the domestic industry increased its marketshare during this period by 4.8 percentage points while the market share of subject imports increased aswell by 4.4 percentage points, until 2010 when it declined as subject imports largely left the market due tothe pendency of the investigations.25 The increases in market share by the domestic industry and subjectimports from 2007 to 2009 came largely at the expense of nonsubject imports whose market share fell by9.3 percentage points from 2007 to 2009.26
As the domestic industry’s production and shipments decreased, so did the number of productionrelated workers (“PRWs”), hours worked, and wages paid. Between 2007 and 2009, the number ofPRWs declined by *** percent, from *** PRWs in 2007 to *** PRWs in 2008 and *** PRWs in 2009,while hours worked declined by *** percent, and wages paid declined by *** percent.27 The number ofPRWs and hours worked were both slightly lower in interim 2010 as compared to interim 2009, whilewages paid were higher in interim 2010 as compared to interim 2009.28 Productivity (tons/per hour)increased slightly from *** tons/per 1,000 hours in 2007 to *** in 2008, before falling to *** in 2009.29
The domestic industry also experienced declines in many financial indicators during the periodexamined.30 The quantity and value of the domestic industry’s net sales declined by 15.3 percent and15.8 percent from 2007 to 2009, respectively.31 The domestic industry experienced positive but decliningoperating incomes in each year of the period examined, reporting operating income of $144.0 million in2007, $95.1 million in 2008, and $61.8 million in 2009.32 Its operating income as a ratio of net salesdeclined in every year of the period from 7.4 percent in 2007, to 4.9 percent in 2008, and to 3.8 percent in2009.33 Its operating income as a ratio of net sales was 2.5 percent in interim 2010 as compared to 2.9percent in interim 2009.34 COGS as a ratio of net sales increased from 86.4 percent in 2007 to 88.5percent in 2008, and to 89.7 percent in 2009. Capital expenditures decreased irregularly during the periodexamined, starting at $51.1 million in 2007, increasing slightly to $52.4 million in 2008, before fallingsharply to $33.8 million in 2009.35 Capital expenditures were $18.8 million in interim 2010 as comparedto $15.7 million in interim 2009.
24 CR/PR at Table C-3.
25 CR/PR at Table C-3.
26 CR/PR at Table C-3.
27 CR/PR at Table C-3. Hours worked (1,000) declined from *** in 2007 to *** in 2008, and to *** in 2009. Wages paid decreased from $*** in 2007 to $*** in 2008, and then to $*** in 2009. CR/PR at Table C-3.
28 CR./PR at Table C-3. PRWs were *** in interim 2010 as compared to *** in interim 2009. Hours worked(1,000) were *** in interim 2010 as compared to *** in interim 2009. Wages paid were $*** in interim 2010 ascompared to $*** in interim 2009.
29 CR/PR at Table C-3. Productivity was *** short tons/per 1,000 hours in interim 2010 as compared to *** shorttons in interim 2009.
30 As did the majority, I considered the combined financial results on certain coated paper other than coatedpackaging paperboard plus coated packaging paperboard to be the relevant data set for purposes of my decision. CR/PR at Tables VI-7 & Table C-3.
31 CR/PR at Table C-3.
32 CR/PR at Table C-3.
33 CR/PR at Table C-3.
34 CR/PR at Table C-3.
35 CR/PR at Table C-3.
45
Based on declines in various measures of operational and financial performance experienced bythe domestic industry I find that it suffered material injury during the period of investigation. However,the mere existence of material injury is not the only thing that I must determine. It is necessary todetermine whether the injury is attributable to subject imports.
It is clear that the significant decline in U.S. demand associated with an unprecedented economicdepression contributed to the injury experienced by the domestic industry. However, that fact does noteliminate the reality that the domestic industry was, in the face of critical economic problems in theUnited States and worldwide, faced with a substantial inflow of competing, unfairly traded subjectimports. I cannot conclude from the record that simply because there were multiple causes of injury tothe domestic industry that there is not material injury be reason of subject imports. To the contrary, Ibelieve there are clear indications that there was significant material injury to the domestic industry byreason of the subject imports.
I have analyzed the data and the likely impacts that would have occurred if subject imports hadbeen fairly traded. I find, based on that analysis, that the record supports a finding of material injury byreason of the subject imports during the period of investigation.
I have reviewed the record data with regard to the elasticities of supply and substitution and theprice elasticity of demand for CCP. The record supports a finding that the domestic supply elasticity ismoderately high. This means that the domestic industry would have been able to increase shipments tomeet increased demand for the domestic like product that would have occurred if subject imports hadbeen fairly traded at a higher price. The substitution between domestic CCP and subject imports islikewise moderately elastic. This is important for two reasons. First, it shows that purchasers would belikely to shift to subject imports if they were offered at a better price than domestic supply. I believe thatis what happened during the period of investigation. Second, a moderately high substitution elasticityshows that purchasers would be likely to shift back, to some extent, to domestic CCP if the prices ofsubject imports had been higher than they were. I believe that subject import prices would have beenhigher if they had been fairly traded, and the domestic industry would have benefitted through an increasein orders as domestic purchasers shifted to U.S. produced CCP. Finally, the price elasticity of demand isrelatively inelastic, in the range of -0.75 to -1.25. This relatively inelastic demand in response to pricechanges indicates that there would be a relatively small decline in the amount of CCP demanded by themarketplace if both subject import and domestic CCP prices increased. All of this would contribute to thedomestic industry being able to achieve volume increases, price increases, or both if subject imports hadbeen fairly traded.
The domestic industry should have been able to increase its prices to at least recover its COGS. Moreover, if subject imports had been fairly traded, their volumes would likely have been lower. Thedomestic industry would have benefitted from increased volume, increased prices or both if subjectimports had been priced fairly. I find that the inability of the domestic industry to increase its prices tooffset the cost-price squeeze it was experiencing or to gain volume to recapture some of the lost profitsthat it was experiencing was not attributable solely to the recessionary economic conditions within theU.S. market. Instead, the industry was also faced with significant and increasing volumes of subjectimports that were trading at unfair prices, below the prices of the domestic product. This worsened thecondition of the domestic industry significantly and contributed to a significant degree to the injuryexperienced by the domestic industry.
CONCLUSION
For the reasons discussed above, I find that an industry in the United States is materially injured by reason of imports of certain coated paper from China that were found to be sold in the United States atless than fair value and that were found to be subsidized by the Government of China and by reason of
46

imports of certain coated paper from Indonesia that were found to be sold in the United States at less thanfair value and that were found to be subsidized by the Government of Indonesia. The record supports afinding that subject imports were a significant contributory factor to the injury to the domestic industrythat is evident in the decline in virtually all of the domestic industry’s operating and financial indicators. While other factors, including the economic decline in the U.S. market and the decline in demand forCCP, contributed to the injury to the domestic industry, I find that significant volumes of pricesuppressing unfairly traded subject imports were a significant injurious factor that cannot be dismissed asan incidental or tangential contributory factor to the injury to the domestic industry.
47


PART I: INTRODUCTION
BACKGROUND
These investigations result from a petition filed on September 23, 2009, by Appleton Coated,LLC (“Appleton”), NewPage Corp. (“NewPage”), Sappi Fine Paper North America (“Sappi”), and theUnited Steel, Paper and Forestry, Rubber Manufacturing, Energy, Allied Industrial and Service WorkersInternational Union (“USW”), alleging that an industry in the United States is materially injured or isthreatened with material injury, by reason of imports from China and Indonesia of certain coated papersuitable for high-quality print graphics using sheet-fed presses (“certain coated paper”)1 that are allegedlysold in the United States at less-than-fair-value (“LTFV”) and subsidized by the governments of Chinaand Indonesia. Information relating to the background of these investigations is provided below.2
Effective date Action
September 23, 2009 Petition filed with Commerce and the Commission; Commission institutes investigation
October 20, 2009 Initiation of countervailing duty investigation on China by Commerce
October 20, 2009 Initiation of countervailing duty investigation on Indonesia by Commerce
October 20, 2009 Initiation of antidumping investigations by Commerce
November 17, 2009 Commission’s preliminary determinations
March 9, 2010 Commerce’s preliminary countervailing duty determinations regarding China and Indonesia
May 6, 2010 Commerce’s preliminary antidumping duty determinations regarding China and Indonesia
May 19, 2010 Commission’s scheduling of its final phase investigations (75 FR 29364, May 25, 2010)
September 16, 2010 Commission’s hearing1
September 27, 2010 Commerce’s final antidumping and countervailing duty determinations (75 FR 59209-59226)
October 22, 2010 Commission’s vote
November 10, 2010 Commission’s determinations and views transmitted to Commerce
1 App. B contains a list of witnesses who appeared at the hearing.
1 A complete description of the imported product subject to these investigations is presented in The SubjectProduct section located in Part I of this report.
2 Federal Register notices cited in the tabulation are presented in app. A.
I-1

ORGANIZATION OF REPORT
Section 771(7)(B) of the Tariff Act of 1930 (the “Act”) (19 U.S.C. § 1677(7)(B)) provides that inmaking its determinations of injury to an industry in the United States, the Commission–
shall consider (I) the volume of imports of the subject merchandise, (II) the effect ofimports of that merchandise on prices in the United States for domestic like products,and (III) the impact of imports of such merchandise on domestic producers ofdomestic like products, but only in the context of production operations within theUnited States; and. . . may consider such other economic factors as are relevant tothe determination regarding whether there is material injury by reason of imports.
Section 771(7)(c) of the Act (19 U.S.C. § 1677(7)(c)) further provides that--
In evaluating the volume of imports of merchandise, the Commission shall considerwhether the volume of imports of the merchandise, or any increase in that volume,either in absolute terms or relative to production or consumption in the UnitedStates is significant.. . . In evaluating the effect of imports of such merchandise on prices, the Commissionshall consider whether . . . (I) there has been significant price underselling by theimported merchandise as compared with the price of domestic like products of theUnited States, and (II) the effect of imports of such merchandise otherwise depressesprices to a significant degree or prevents price increases, which otherwise wouldhave occurred, to a significant degree.. . .In examining the impact required to be considered under subparagraph (B)(i)(III),the Commission shall evaluate (within the context of the business cycle andconditions of competition that are distinctive to the affected industry) all relevanteconomic factors which have a bearing on the state of the industry in the UnitedStates, including, but not limited to. . . (I) actual and potential declines in output, sales, market share, profits, productivity,return on investments, and utilization of capacity, (II) factors affecting domesticprices, (III) actual and potential negative effects on cash flow, inventories,employment, wages, growth, ability to raise capital, and investment, (IV) actual andpotential negative effects on the existing development and production efforts of thedomestic industry, including efforts to develop a derivative or more advancedversion of the domestic like product, and (V) in {an antidumping investigation}, themagnitude of the margin of dumping.
Information on the subject merchandise, margins of dumping and subsidies, and domestic likeproduct is presented in Part I. Information on conditions of competition and other relevant economicfactors is presented in Part II. Part III presents information on the condition of the U.S. industry,including data on capacity, production, shipments, inventories, and employment. The volume of importsof the subject merchandise is presented in Part IV and pricing of domestic and imported products ispresented in Part V. Part VI presents information on the financial experience of U.S. producers. Information obtained for use in the Commission’s consideration of the question of threat of materialinjury is presented in Part VII.
I-2

U.S. MARKET SUMMARY
The U.S. market for certain coated paper3 totaled approximately $2.15 billion and 2.25 millionshort tons in 2009. Currently, eleven integrated firms4 produce certain coated paper in the United States,Appleton, Cascades Boxboard Group, LLC (“Cascades”), Clearwater Paper Co. (“Clearwater”),International Paper, Georgia-Pacific, LLC (“Georgia-Pacific”), MeadWestvaco Corp. (“MeadWestvaco”),Mohawk Fine Papers, Inc. (“Mohawk”), NewPage, Rock-Tenn Co. (“Rock-Tenn”), Sappi, and SmartPapers, Inc. (“Smart”), which accounted for the vast majority of U.S. production of certain coated paperin 2009. At least seven firms have reported importing certain coated paper from subject countries since2007. One firm, Global Paper Solutions, Inc. (“GPS”), accounted for the majority of reported U.S.imports from China. One firm, PaperMax Ltd. (“PaperMax”) accounted for the vast majority of U.S.imports from Indonesia during the period of investigation.
U.S. producers’ U.S. shipments of certain coated paper totaled 1,477,233 short tons valued at$1.44 billion in 2009, and accounted for 65.5 percent of apparent U.S. consumption by quantity (66.6percent by value). U.S. imports from China totaled 352,555 short tons in 2009, and accounted for 15.6percent of apparent U.S. consumption by quantity (13.8 percent by value), while U.S. imports fromIndonesia totaled 61,039 short tons, and accounted for 2.7 percent of apparent consumption by quantity(2.4 percent by value). U.S. imports from all other sources combined totaled 363,472 short tons, andaccounted for 16.1 percent of apparent consumption by quantity (17.1 percent by value). Certain coatedpaper is generally used for printing multi-colored graphics for catalogues, books, magazines, envelopes,labels and wraps, greeting cards, and other commercial printing applications requiring high-quality printgraphics. Coated packaging paperboard is used to manufacture consumer packaging.
SUMMARY DATA AND DATA SOURCES
A summary of data collected in these investigations is presented in appendix C. Appendix C,table C-1 presents summary data for “certain coated paper other than coated packaging paperboard.” U.S.industry data are based on the questionnaire responses of nine U.S. integrated producers5 of products usedin the commercial printing industry and four U.S. converters.6 Appendix C, table C-2 presents summary
3 The data for certain coated paper in this section of the report includes “coated packaging paperboard.” Theparties disagree as to whether this product is properly within the scope of these investigations. Petitioners claim that Commerce’s scope does not include coated paperboard used for packaging applications. Petitioners’ posthearingbrief, “Questions from Commissioner Aranoff” exh. 3 and “Questions from Commissioners” exh 1. Respondentsclaim that coated paperboard meets the physical specifications of the scope and that Commerce did not excludeproducts based on intended end use. Respondents’ posthearing brief, exh. 1, p. 14.
Section III of this report as well as the summary data tables in appendix C present data for “certain coatedpaper other than coated packaging paperboard,” “coated packaging paperboard,” and “total certain coated paper.”
4 These “integrated” firms produce all of the domestically-produced sheeter rolls, which is an upstream productthat is converted into a sheeted product. The scope of these investigations includes only sheeted product. Althoughthe U.S. integrated producers convert or “sheet” the vast majority of their own sheeter rolls, there are a number ofU.S. converters in the marketplace that sheet these rolls either on a toll basis or through arms length purchases ofsheeter rolls.
5 The term “integrated” producers is used to distinguish those producers who produce sheeter rolls from U.S.converters, which process sheeter rolls into sheet, and is not used to indicate the level of vertical integration of thoseproducers.
6 These firms include: Appleton, Cascades, Clearwater, International Paper, MeadWestvaco, Mohawk, NewPage,Sappi, and Smart. The original questionnaire responses were used for Clearwater and MeadWestvaco and not theirSeptember 22, 2010 revised questionnaire responses, which included U.S. industry data regarding coated packaging
(continued...)
I-3

data for “coated packaging paperboard.” U.S. industry data are based on the questionnaire responses offour U.S. integrated producers of products used in the packaging industry and four U.S. converters.7 Table C-3 presents summary data for “certain coated paper other than coated packaging paperboard” and“coated packaging paperboard” (total reported U.S. integrated production). U.S. industry data are basedon questionnaire responses of all eleven reporting U.S. integrated producers and four U.S. converters.8 Data for U.S. imports from China, Indonesia, and nonsubject countries in each of the tables are based onadjusted Commerce statistics.9 Foreign industry data are based on responses to the Commission’s U.S.foreign producer’s questionnaires. Appendix C, table C-4 presents data regarding U.S. converters.
6 (...continued)paperboard.
Appendix C, table C-1 corresponds to data compiled by petitioners which they contended contains onlythose U.S. producers that produce products covered by the scope of these investigations. Petitioners’ posthearingbrief, exh. 3.
7 These firms include: Clearwater, Georgia-Pacific, MeadWestvaco, and Rock-Tenn. Clearwater and MeadWestvaco submitted an original U.S. producer questionnaire response which included
their certain coated paper products sold in the U.S. commercial printing industry. In revisions received by theCommission on September 22, 2010, these firms supplied the Commission with trade and financial data thatincluded products that met the physical specifications listed in the scope (GE brightness, basis weight, and in sheetform) regardless of end use and included products that they had sold to the U.S. packaging industry. In table C-2,Clearwater and MeadWestvaco data are presented as the difference between their September 22, 2010 revisedquestionnaire responses and their original questionnaire responses. All of Georgia-Pacific’s and Rock-Tenn’sproducts were reported ***.
8 Appendix C, table C-3 corresponds to data compiled by respondents which they contended contains all the U.S.producers that produce products covered by the scope of these investigations. Respondents’ posthearing brief, exhs.8 and 23.
9 Adjustments to Commerce statistics are based on assumptions made by the petitioners. See Petitioners’posthearing brief, “Questions from Commissioner Lane,” exhs. 1 and 2. Respondents claimed that petitioners’assumption with regard to U.S. imports from nonsubject countries, specifically EU countries, may be understated. Petitioners’ assumption is that for a number of HTS statistical reporting numbers (those for coated groundwoodpaper), U.S. imports from nonsubject countries are entirely in the form of rolls and not included within the scope ofthese investigations. Respondents claimed that certain EU export statistics show that a portion of these imports arein sheet form. Respondents’ submitted EU export statistics show that the portion claimed to be in sheet form wouldbe equal to between 10.3 percent in 2009 and 12.4 percent in 2008 of total U.S. imports from nonsubject countries. Respondents’ posthearing brief, exh. 1, pp. 11-12 and exh. 4.
Subsequent to Commerce adding three new HTS subheadings to the scope in its final determinations (HTS4810.32, 4810.39, and 4810.92), U.S. imports from China entering under HTS 4810.92.12 have been adjusted andincreased using respondents’ assumptions. In its submissions to Commerce, respondents stated that two of GoldEast’s paper mills exported multi-ply paperboard products under HTS 4810.92.12. Respondents’ posthearing brief,exh. 2, pp. 1-2 and exh. 3, p. 8. Although volume trends of U.S. imports from China remain similar to pre-adjustedvolumes, absolute volumes did increase by 14.2 percent in 2007, 19.5 percent in 2008, 18.8 percent in 2009, and16.3 percent in interim 2010.
Subsequent to Commerce adding three new HTS subheadings to the scope in its final determinations, U.S.imports from Indonesia and nonsubject countries have not been further adjusted. In submissions to Commerce, noproducer in Indonesia reported exporting subject product under any of the additional HTS subheadings. Petitioners’posthearing brief, “Questions from Commissioner Lane,” exhs. 5 and 6.
The parties appear to agree that product within the scope of these investigations would not properly beclassified under HTS 4810.32 and 4810.39 as they cover “kraft paper or paperboard other than the kind used forwriting, printing, or other graphic purposes.” Petitioners posthearing brief, “Questions from Staff,” exh. 5, p. 2;Respondents’ posthearing brief, exh. 3, pp. 6-7. Petitioners stated that Commerce added these HTS subheadings inorder to prevent circumvention of any issued order. Petitioners’ posthearing brief, “Questions from CommissionerLane,” exh. 1, p. 2.
I-4
PREVIOUS AND RELATED INVESTIGATIONS
Certain coated paper, as defined in the scope of these investigations, is a subset of the paperproducts investigated by the Commission in its 2007 investigations on Coated Free Sheet from China,Indonesia, and Korea.10 In the 2007 investigation, the scope definition included sheets, sheeter rolls, andweb rolls. In contrast, the current investigations’ scope definition includes only sheeted product. TheCommission in Coated Free Sheet determined that the U.S. industry was not materially injured orthreatened with material injury by reason of U.S. imports from China, Indonesia, and Korea.11
In 1991, the Commission conducted antidumping duty investigations on Coated GroundwoodPaper from Austria, Belgium, Finland, France, Germany, Italy, the Netherlands, Sweden, and the UnitedKingdom (Inv. Nos. 731-TA-486-494). The Commission determined that the subject imports did notinjure the domestic coated groundwood paper industry.12 13
NATURE AND EXTENT OF SALES AT LTFV
China
On September 27, 2010, Commerce published a notice in the Federal Register setting forth itsfinal determination with regard to its antidumping investigation on certain coated paper from China.14 Commerce determined that imports from China are being sold, or are likely to be sold, in the UnitedStates at less than fair value. The weighted-average dumping margins (in percent ad valorem), asreported by Commerce, are presented in the following tabulation.
10 Coated Free Sheet Paper from China, Indonesia, and Korea, Inv. Nos. 701-TA-444-446 and 731-TA-1107-1109 (Final), USITC Publication 3965, December 2007.
11 Ibid. at pp. 42-43.
12 The product subject to investigation was defined by Commerce as “paper coated on both sides with kaolin(China clay) or other inorganic substances (e.g., calcium carbonate), of which more than ten percent by weight of thetotal fiber content consists of fibers obtained by mechanical process, regardless of (1) basis weight (e.g., pounds perream or grams per one square meter sheet); (2) GE brightness; or (3) the form in which it is sold (e.g., reels, sheets,or other forms).” Paperboard was excluded from the scope of investigation. See Notice of Final Determination ofSales at Less Than Fair Value: Coated Groundwood Paper from Germany, 56 FR 56385, November 4, 1991.
13 Coated Groundwood Paper from Austria, Belgium, Finland, France, Germany, Italy, the Netherlands, Sweden,and the United Kingdom, Inv. Nos. 731-TA-486-494 (Preliminary), USITC Publication 2359, February 1991, p. 3;and Coated Groundwood Paper from Belgium, Finland, France, Germany, and the United Kingdom, Inv. Nos. 731-TA-487-490 and 494 (Final), USITC Publication 2467, December 1991, p. 3.
14 Certain Coated Paper Suitable for High-Quality Print Graphics Using Sheet-Fed Presses from the People’sRepublic of China: Final Determination of Sales at Less Than Fair Value; 75 FR 59217, September 27, 2010.
I-5

Producer/exporterMargin
(percent ad valorem)
Gold East Paper (Jiangsu) Co., Ltd. Gold Huasheng Paper Co., Ltd.Ningbo Zhonghua Paper Co., Ltd.Ningbo Asia Pulp & Paper Co., Ltd.Gold East (Hong Kong) Trading Co., Ltd.
7.6
Shandong Chenming Paper Holdings, Ltd. 7.6
All others 135.83
Source: Certain Coated Paper Suitable for High-Quality Print Graphics Using Sheet-Fed Presses from the People’s Republic ofChina: Final Determination of Sales at Less Than Fair Value; 75 FR 59217, September, 27, 2010.
Indonesia
On September 27, 2010, Commerce published a notice in the Federal Register setting forth itsfinal determination with regard to its antidumping investigation on certain coated paper from Indonesia.15 Commerce determined that imports from Indonesia are being sold, or are likely to be sold, in the UnitedStates at less than fair value. The weighted-average dumping margins (in percent ad valorem), asreported by Commerce, are presented in the following tabulation.
Producer/exporterMargin
(percent ad valorem)
PT Pabrik Kertas Tjiwi Tbk.PT Pindo Deli Pulp & PaperPT Indah Kiat Pulp & Paper Tbk.
20.13
All others 20.13
Source: Certain Coated Paper Suitable for High-Quality Print Graphics Using Sheet-Fed Presses from Indonesia: FinalDetermination of Sales at Less Than Fair Value; 75 FR 59223, September 27, 2010.
NATURE OF COUNTERVAILABLE SUBSIDIES
China
On September 27, 2010, Commerce published a notice in the Federal Register setting forth itsfinal determination with regard to its countervailing duty investigation on certain coated paper fromChina.16 Commerce determined that the Government of China is providing countervailable subsidies toChinese producers of certain coated paper. The countervailable subsidy rates (in percent ad valorem), asreported by Commerce, are presented in the following tabulation.
15 Certain Coated Paper Suitable for High-Quality Print Graphics Using Sheet-Fed Presses from Indonesia:Final Determination of Sales at Less Than Fair Value; 75 FR 59223, September 27, 2010.
16 Certain Coated Paper Suitable for High-Quality Print Graphics Using Sheet-Fed Presses from the People’sRepublic of China: Final Affirmative Countervailing Duty Determination; 75 FR 59212, September 27, 2010.
I-6

Foreign producer/exporterNet subsidy rate
(percent ad valorem)
Gold East Paper (Jiangsu) Co., Ltd.Gold Huasheng Paper Co., Ltd.Gold East (Hong Kong) Trading Co., Ltd.Ningbo Zhonghua Paper Co., Ltd.Ningbo Asia Pulp & Paper Co., Ltd.
17.64
Shandong Sun Paper Industry Joint Stock Co., Ltd.Yanzhou Tianzhang Paper Industry Co., Ltd.
178.03
All others 17.64
Source: Certain Coated Paper Suitable for High-Quality Print Graphics Using Sheet-Fed Presses from the People’s Republic ofChina: Final Affirmative Countervailing Duty Determination; 75 FR 59212, September 27, 2010.
Commerce made the following final determinations regarding specific programs of theGovernment of China alleged in the petition to have provided countervailable subsidies to producers ofcertain coated paper in China:
1. Programs Determined to be Countervailable
A. Preferential Lending to the Coated Paper Industry
1. Policy Loans to Coated Paper Producers and Related Pulp Producers from State-Owned Commercial Banks and Government Policy Banks
B. Income Tax Programs
1. Income Tax Exemption/Reduction under “Two-Free/Three Half” Program 2. Local Income Tax Exemption and Reductions for “Productive” Foreign-Invested
Enterprises (“FIEs”) 3. Income Tax Subsidies to FIEs Based on Geographic Location 4. Preferential Tax Policies for Research and Development at FIEs
C. Indirect Tax and Import Tariff Programs
1. Value Added Tax (“VAT”) and Tariff Exemptions on Imported Equipment 2. VAT Rebates on Domestically Produced Equipment 3. Domestic VAT Refunds for Companies Located in the Hainan Economic Development
Zone 4. Exemption from City Maintenance and Construction Taxes and Education Surcharges
for FIEs
D. Government Provision of Goods or Services for Less Than Adequate Remuneration (“LTAR”)
1. Provision of Electricity 2. Provision of Papermaking Chemicals3. Provision of Land in the Yangpu Economic Development Zone
I-7
2. Programs Determined To Be Not Used or To Not Provide Benefits During the POI
A. Famous Brands Awards
B. Sichuan Technology Renovation Program
C. Ya’an Technology Innovation Program
D. Lending Programs
1. Fast-Growth High-Yield Forestry Program Loans
E. Income Tax Programs
1. Preferential Tax Policies for Technology or Knowledge-Intensive FIEs 2. Tax Programs for FIEs that are High or New Technology Enterprises 3. Income Tax Reductions for High-Technology Industries in Guangdong Province 4. Income Tax Credits for Domestically-Owned Companies Purchasing Domestically-
Produced Equipment 5. Income Tax Exemption Program for Export-Oriented FIEs 6. Corporate Income Tax Refund Program for Reinvestment of FIE profits in Export-
Oriented Enterprises 7. Income Tax Reduction for FIEs Purchasing Domestically-Produced Equipment
F. Grant Programs
1. Funds for Forestry Plantation Construction and Management 2. The State Key Technologies Renovation Project Fund 3. Loan Interest Subsidies for Major Industrial Technology Reform Projects in Wuhan 4. Funds for Water Treatment Improvement Projects in the Songhuajiang Basin 5. Special Fund for Energy Saving Technology Reform in Wuhan and Shouguang
Municipality 6. Clean Production Technology Fund 7. Grants to Enterprises Achieving RMB 10 Billion in Sales (Yanzhou City and Xinyan
Town) (previously “Grants to Enterprises Achieving RMB 10 Billion in SalesRevenue and Implementing “Three Significant Projects”)
8. Grants to Large Enterprises in Jining City 9. Funds for Water Treatment and Pollution Control Projects for the Theree Rivers and
Three Lakes in Shandong Province 10. Grants for Programs Under the 2007 Science and Technology Development Plan in
Shandong Province 11. Special Funds for Encouraging Foreign Economic and Trade Development and for
Drawing Significant Foreign Investment Projects in Shandong Province 12. Interest Subsidies for Forestry Loans
G. Economic Development Zone (“EDZ”) Programs
1. Subsidies in the Nanchang EDZ 2. Subsidies in the Wuhan EDZ 3. Subsidies in the Zhenjiang EDZ
I-8

Indonesia
On September 27, 2010, Commerce published a notice in the Federal Register setting forth itsfinal determination with regard to its countervailing duty investigation on certain coated paper fromIndonesia.17 Commerce determined that the Government of Indonesia is providing countervailablesubsidies to Indonesian producers of certain coated paper. The countervailable subsidy rates (in percentad valorem), as reported by Commerce, are presented in the following tabulation.
Producer/exporterMargin
(percent ad valorem)
PT Pabrik Kertas Tjiwi Tbk.PT Pindo Deli Pulp & PaperPT Indah Kiat Pulp & Paper Tbk.
17.94
All others 17.94
Source: Certain Coated Paper Suitable for High-Quality Print Graphics Using Sheet-Fed Presses from Indonesia: FinalAffirmative Countervailing Duty Determination; 75 FR 59209, September 27, 2010.
Commerce made the following final determinations regarding specific programs of theGovernment of Indonesia alleged in the petition to have provided countervailable subsidies to producersof certain coated paper in Indonesia:
1. Programs Determined to be Countervailable
A. Provision of Standing Timber for Less Than Adequate RemunerationB. Government Prohibition of Log ExportsC. Debt Forgiveness through the Indonesian Government's Acceptance of Financial Instruments
with No Market ValueD. Debt Forgiveness through APP/SMG's Buyback of its Own Debt from the Indonesian
Government
2. Programs Determined To Be Not Used During the POI
A. Government Provision of Interest-Free Reforestation LoansB. Government Forgiveness of Stumpage ObligationsC. Tax Incentives for Investment in Priority Business Lines and Designated Regions
1. Corporate Income Tax Deduction2. Accelerated Depreciation and Amortization3. Extension of Loss Carryforward4. Reduced Withholding Tax on Dividends
17 Certain Coated Paper Suitable for High-Quality Print Graphics Using Sheet-Fed Presses from Indonesia:Final Affirmative Countervailing Duty Determination; 75 FR 59209, September 27, 2010.
I-9
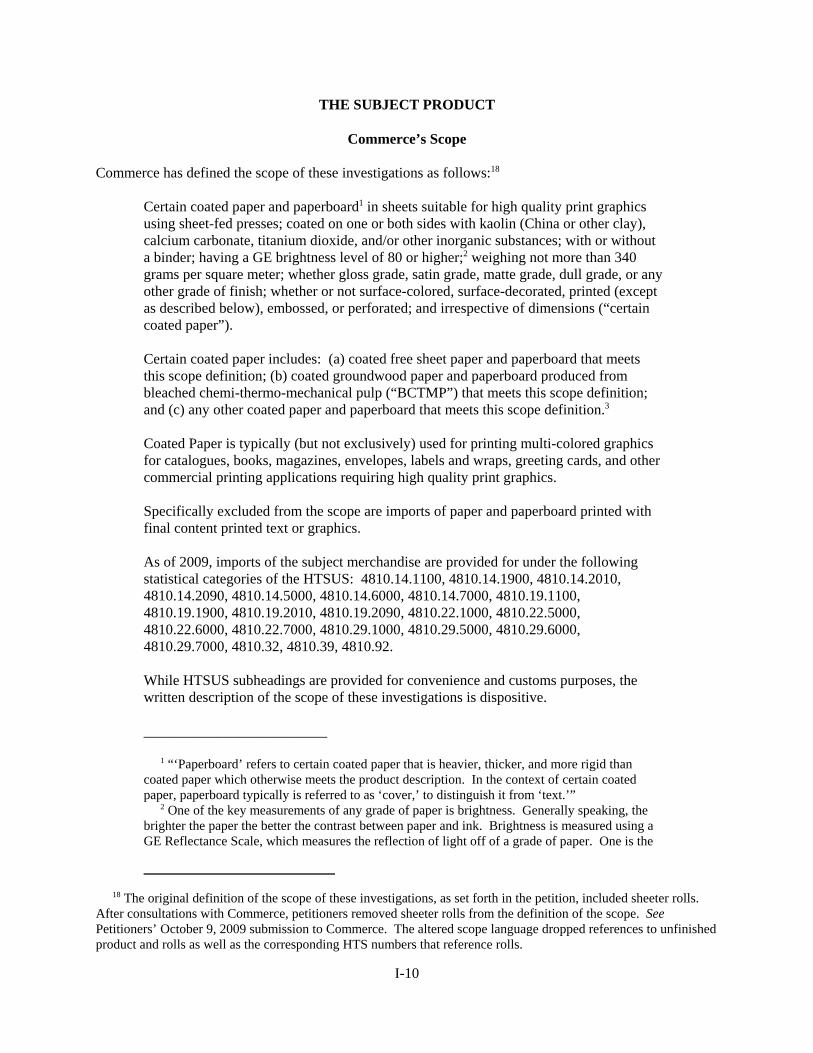
THE SUBJECT PRODUCT
Commerce’s Scope
Commerce has defined the scope of these investigations as follows:18
Certain coated paper and paperboard1 in sheets suitable for high quality print graphicsusing sheet-fed presses; coated on one or both sides with kaolin (China or other clay),calcium carbonate, titanium dioxide, and/or other inorganic substances; with or withouta binder; having a GE brightness level of 80 or higher;2 weighing not more than 340grams per square meter; whether gloss grade, satin grade, matte grade, dull grade, or anyother grade of finish; whether or not surface-colored, surface-decorated, printed (exceptas described below), embossed, or perforated; and irrespective of dimensions (“certaincoated paper”).
Certain coated paper includes: (a) coated free sheet paper and paperboard that meetsthis scope definition; (b) coated groundwood paper and paperboard produced frombleached chemi-thermo-mechanical pulp (“BCTMP”) that meets this scope definition;and (c) any other coated paper and paperboard that meets this scope definition.3
Coated Paper is typically (but not exclusively) used for printing multi-colored graphicsfor catalogues, books, magazines, envelopes, labels and wraps, greeting cards, and othercommercial printing applications requiring high quality print graphics.
Specifically excluded from the scope are imports of paper and paperboard printed withfinal content printed text or graphics.
As of 2009, imports of the subject merchandise are provided for under the followingstatistical categories of the HTSUS: 4810.14.1100, 4810.14.1900, 4810.14.2010,4810.14.2090, 4810.14.5000, 4810.14.6000, 4810.14.7000, 4810.19.1100,4810.19.1900, 4810.19.2010, 4810.19.2090, 4810.22.1000, 4810.22.5000,4810.22.6000, 4810.22.7000, 4810.29.1000, 4810.29.5000, 4810.29.6000,4810.29.7000, 4810.32, 4810.39, 4810.92.
While HTSUS subheadings are provided for convenience and customs purposes, thewritten description of the scope of these investigations is dispositive.
_________________________
1 “‘Paperboard’ refers to certain coated paper that is heavier, thicker, and more rigid thancoated paper which otherwise meets the product description. In the context of certain coatedpaper, paperboard typically is referred to as ‘cover,’ to distinguish it from ‘text.’” 2 One of the key measurements of any grade of paper is brightness. Generally speaking, thebrighter the paper the better the contrast between paper and ink. Brightness is measured using aGE Reflectance Scale, which measures the reflection of light off of a grade of paper. One is the
18 The original definition of the scope of these investigations, as set forth in the petition, included sheeter rolls. After consultations with Commerce, petitioners removed sheeter rolls from the definition of the scope. SeePetitioners’ October 9, 2009 submission to Commerce. The altered scope language dropped references to unfinishedproduct and rolls as well as the corresponding HTS numbers that reference rolls.
I-10

lowest reflection, or what would be given to a totally black grade, and 100 is the brightestmeasured grade. 3 As noted in the Scope Comments section of the Preliminary Determinations, we havedetermined that the word “paperboard” was inadvertently left out of the sentence in the InitiationNotice and we have corrected it.
Tariff Treatment
Certain coated paper is generally imported under the Harmonized Tariff Schedule of the UnitedStates (“HTS”) statistical reporting numbers 4810.14.1100, 4810.14.1900, 4810.14.2010, 4810.14.2090,4810.14.5000, 4810.14.6000, 4810.14.7000, 4810.19.1100, 4810.19.1900, 4810.19.2010, 4810.19.2090,4810.22.1000, 4810.22.5000, 4810.22.6000, 4810.22.7000, 4810.29.1000, 4810.29.5000, 4810.29.6000,4810.29.7000, 4810.32, 4810.39, 4810.9219 and is free of duty under the general duty rate.20 Table I-1shows selected provisions of the HTS that itemize the classification of certain coated paper.
19 In its final determinations, Commerce added the final three HTS subheadings to its scope definition (4810.32,4810.39, 4810.92). See section below entitled, “Scope Issues at Commerce.” 20 Subsequent to petitioners alteration of the scope language on October 9, 2009, the following HTS statisticalreporting numbers were removed from the original scope: 4810.13.1100, 4810.13.1900, 4810.13.2010,4810.13.2090, 4810.13.5000, 4810.13.6000, 4810.13.7000. These statistical reporting numbers reference coatedpaper in roll form.
I-11
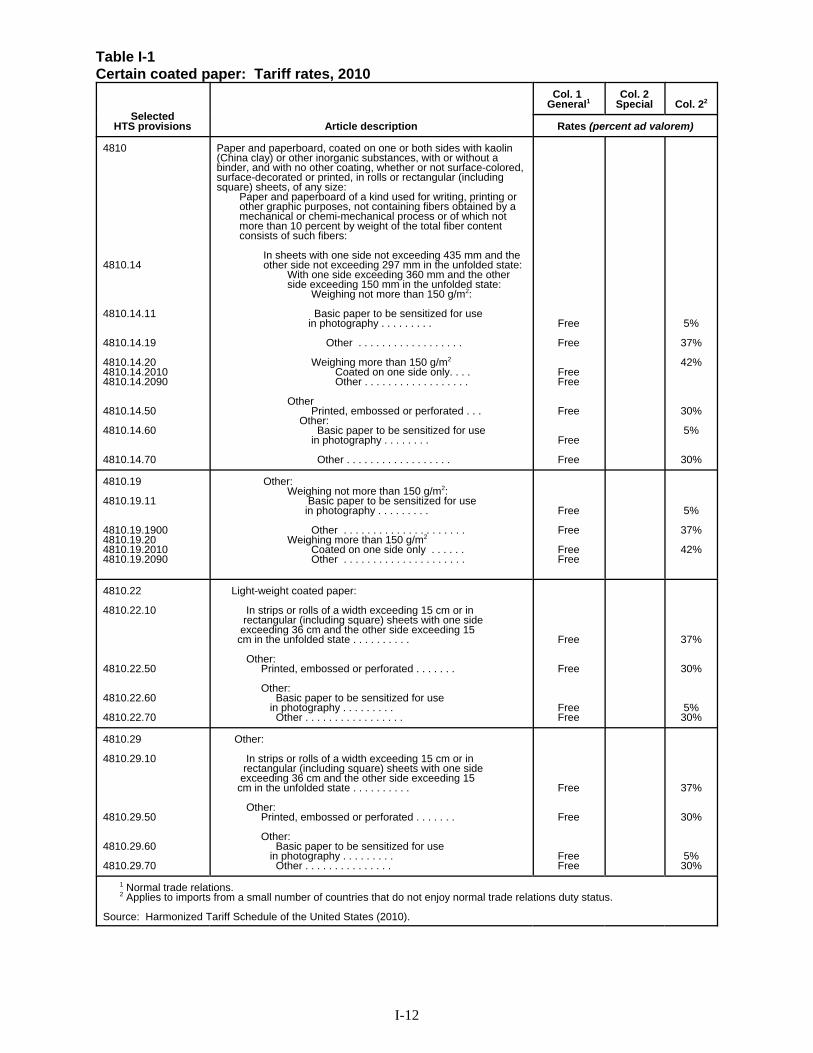
Table I-1Certain coated paper: Tariff rates, 2010
SelectedHTS provisions Article description
Col. 1 General1
Col. 2Special Col. 22
Rates (percent ad valorem)
4810
4810.14
4810.14.11
4810.14.19
4810.14.204810.14.20104810.14.2090
4810.14.50
4810.14.60
4810.14.70
Paper and paperboard, coated on one or both sides with kaolin(China clay) or other inorganic substances, with or without abinder, and with no other coating, whether or not surface-colored,surface-decorated or printed, in rolls or rectangular (includingsquare) sheets, of any size:
Paper and paperboard of a kind used for writing, printing orother graphic purposes, not containing fibers obtained by amechanical or chemi-mechanical process or of which notmore than 10 percent by weight of the total fiber contentconsists of such fibers:
In sheets with one side not exceeding 435 mm and theother side not exceeding 297 mm in the unfolded state:
With one side exceeding 360 mm and the otherside exceeding 150 mm in the unfolded state:
Weighing not more than 150 g/m2:
Basic paper to be sensitized for use in photography . . . . . . . . .
Other . . . . . . . . . . . . . . . . . .
Weighing more than 150 g/m2 Coated on one side only. . . .Other . . . . . . . . . . . . . . . . . .
OtherPrinted, embossed or perforated . . .
Other: Basic paper to be sensitized for use in photography . . . . . . . .
Other . . . . . . . . . . . . . . . . . .
Free
Free
FreeFree
Free
Free
Free
5%
37%
42%
30%
5%
30%
4810.19
4810.19.11
4810.19.19004810.19.204810.19.20104810.19.2090
Other:Weighing not more than 150 g/m2: Basic paper to be sensitized for use in photography . . . . . . . . .
Other . . . . . . . . . . . . . . . . . . . . . Weighing more than 150 g/m2
Coated on one side only . . . . . .Other . . . . . . . . . . . . . . . . . . . . .
Free
Free
FreeFree
5%
37%
42%
4810.22
4810.22.10
4810.22.50
4810.22.60
4810.22.70
Light-weight coated paper:
In strips or rolls of a width exceeding 15 cm or in rectangular (including square) sheets with one side exceeding 36 cm and the other side exceeding 15 cm in the unfolded state . . . . . . . . . .
Other: Printed, embossed or perforated . . . . . . .
Other: Basic paper to be sensitized for use in photography . . . . . . . . . Other . . . . . . . . . . . . . . . . .
Free
Free
FreeFree
37%
30%
5%30%
4810.29
4810.29.10
4810.29.50
4810.29.60
4810.29.70
Other:
In strips or rolls of a width exceeding 15 cm or in rectangular (including square) sheets with one side exceeding 36 cm and the other side exceeding 15 cm in the unfolded state . . . . . . . . . .
Other: Printed, embossed or perforated . . . . . . .
Other: Basic paper to be sensitized for use in photography . . . . . . . . . Other . . . . . . . . . . . . . . .
Free
Free
FreeFree
37%
30%
5%30%
1 Normal trade relations.2 Applies to imports from a small number of countries that do not enjoy normal trade relations duty status.
Source: Harmonized Tariff Schedule of the United States (2010).
I-12

Scope Issues at Commerce
During the preliminary phase of these investigations, petitioners had proposed scope languagethat included the phrase “of a kind used for high-quality writing, printing, and other graphic purposesusing sheet-fed presses,” in order to limit the scope to products used within the U.S. commercial printingindustry. Commerce disagreed with the inclusion of this phrase because of the difficulty enforcingantidumping and countervailing duty orders containing intended end use specifications.21 This phrasedoes not appear in the current scope definition.
Subsequently, respondents filed comments at Commerce seeking to clarify the scope language byincorporating language that would specifically exclude multi-ply coated paperboard from the scope ofthese investigations. Respondents claimed that multi-ply coated paperboard were dissimilar to certaincoated paper because: (1) multi-ply coated paperboard products were not used in the commercial printingmarket neither as cover nor text stock, but rather in the packaging market for producing packaging forproducts such as cosmetics and cigarettes, (2) the two products had different physical characteristics, and(3) petitioners did not intend multi-ply coated paperboard in the scope of these investigations asevidenced by the fact that they neither included the HTS subheading for multi-ply products (4810.92) norlisted in the petition U.S. companies that manufacturer packaging paperboard.22 In its preliminarydeterminations, Commerce agreed with petitioners that the language of the scope did not limit in-scopeproducts by the number of plies, and therefore, did not exclude multi-ply coated paperboard from thescope. After the issuance of its preliminary determinations, Commerce requested comments from theparties regarding the issue of whether the phrase “suitable for high-quality print graphics” could bedeleted from the scope language without expanding the scope due to its concerns of administering anorder containing that phrase, which it considered undefined by the parties and vague.23 The partiesdisagreed as to the effect of this phrase in the scope. Petitioners maintained that the phrase would have noeffect on the products covered by the scope24 whereas respondents claimed that deletion of the phrasewould greatly expand the scope of these investigations to include products obviously not intended to becovered by the petition, namely multi-ply coated paperboard for packaging applications.25
21 Petitioners’ Response to the Department’s Supplemental Questionnaire dated April 23, 2010, filed atCommerce on May 10, 2010, p. 7. 22 Certain Coated Paper Suitable for High-Quality Print Graphics Using Sheet-Fed Presses from Indonesia: Preliminary Affirmative Countervailing Duty Determination and Alignment of Final Countervailing DutyDetermination with Final Antidumping Duty Determination; 75 FR 10761, 10762, March 9, 2010. Respondentsrequested that Commerce reconsider the issue of petitioners’ U.S. industry standing in light of potentially large U.S.firms becoming part of the U.S. industry. Commerce declined to reconsider the issue after it had issued its notice ofinitiation. 23 Ibid; Additional Scope Comments, submitted to Commerce by respondents on March 29, 2010; Petitioners’Rebuttal Comments on Scope, submitted to Commerce by petitioners on April 9, 2010; Antidumping andCountervailing Duty Investigations: Certain Coated Paper Suitable for High-Quality Print Graphics Using Sheet-Fed Presses from Indonesia and the People’s Republic of China, Memorandum to Ronald K. Lorentzen from SusanKuhbach, August 3, 2010. 24 Petitioners argued at Commerce that they “were unaware of any coated paper product that meets the brightnessand other physical characteristics in the scope description that would not be suitable for high quality print graphics. Put another way, a coated paper product that meets the physical description is by definition ‘suitable for high qualityprint graphics.’ Hence the phrase is surplusage and its removal from the description would not result in anyalteration or expansion of the scope.” Petitioners also urged Commerce to add HTS 4810.92 to the scope languageto ensure the suspension of liquidation of any U.S. imports from respondents of in-scope product entering under thatHTS subheading. Petitioners’ Rebuttal Comments on Scope, submitted to Commerce by petitioners on April 9,2010, p. 4. 25 Additional Scope Comments, submitted to Commerce by respondents on March 29, 2010.
I-13
In a memorandum dated August 3, 2010,26 Commerce addressed the following three issues withregard to the scope description of certain coated paper:
(1) Whether to exclude “multi-ply paperboard” from the scope of these investigations.(2) Whether to delete “suitable for high-quality print graphics” from the scope description.(3) Whether to add HTS subheadings 4810.32, 4810.39, 4810.92 to the scope description.In its final determinations, Commerce addressed these issues and determined the following:27
(1) Not to exclude “multi-ply paperboard” from the scope of these investigations.
At Commerce, respondents requested that the scope description be clarified to exclude “multi-plypaperboard,” on the grounds that it is generally used for industrial packaging and not “suitable for high-quality print graphics.” Petitioners maintained that the number of plies is not a specification set forth inthe scope description; and therefore, if the product meet the physical specifications listed in the scopedescription (GE brightness, basis weight, and sheet form) then “multi-ply paperboard” should not beexcluded from the scope description.28 In its final determinations, Commerce decided that “multi-plypaperboard” should not be excluded from the scope description, observed that the number of plies is not aphysical specification addressed in the current scope description, and that certain “multi-ply paperboard”products could be used in printing applications.29
(2) Not to delete “suitable for high-quality print graphics” from the scope description.
Due to the potential difficulty in administering an order that contained the phrase “suitable forhigh-quality print graphics,” Commerce requested that the parties address the issue of whether that phrasecould be deleted from the scope description. Petitioners maintained that the phrase could be deleted withno effect on the scope because any coated paper that met the physical characteristics listed in the scopewould be suitable for high-quality print graphics. Respondents argued that deleting this phrase wouldimpermissibly expand the scope of these investigations by including coated packaging paperboardproducts that met the physical characteristics listed in the scope and were produced by U.S. companiesnot mentioned in the original petition as U.S. producers, such as Georgia-Pacific, MeadWestvaco, andRock-Tenn.30
In its final determinations, Commerce decided not to delete the phrase “suitable for high-qualityprint graphics,” acknowledging petitioners assertion that deleting the phrase would have no effect becauseproducts that meet the listed physical specifications in the scope are suitable for high-quality print
26 Antidumping and Countervailing Duty Investigations: Certain Coated Paper Suitable for High-Quality PrintGraphics Using Sheet-Fed Presses from Indonesia and the People’s Republic of China, Memorandum to Ronald K.Lorentzen from Susan Kuhbach, August 3, 2010. 27 Certain Coated Paper Suitable for High-Quality Print Graphics Using Sheet-Fed Presses from Indonesia:Final Affirmative Countervailing Duty Determination; 75 FR 59209, September 27, 2010 and the “Issues andDecision Memorandum,” dated September 27, 2010. 28 Antidumping and Countervailing Duty Investigations: Certain Coated Paper Suitable for High-Quality PrintGraphics Using Sheet-Fed Presses from Indonesia and the People’s Republic of China, Memorandum to Ronald K.Lorentzen from Susan Kuhbach, August 3, 2010, p. 3. 29 Certain Coated Paper Suitable for High-Quality Print Graphics Using Sheet-Fed Presses from Indonesia:Final Affirmative Countervailing Duty Determination; “Issues and Decision Memorandum,” dated September 27,2010, p. 50. 30 Antidumping and Countervailing Duty Investigations: Certain Coated Paper Suitable for High-Quality PrintGraphics Using Sheet-Fed Presses from Indonesia and the People’s Republic of China, Memorandum to Ronald K.Lorentzen from Susan Kuhbach, August 3, 2010, p. 8.
I-14
graphics. Commerce, however, also stated that “the phrase has definition and meaning, and we havedetermined that the phrase limits the scope of the investigations beyond the physical characteristics listedin the scope.”31 Commerce did not provide specific guidance on the extent that the phrase may limit thecurrent scope of these investigations. It stated that “we do not rule out the possibility that certainmerchandise (and, in particular, certain paper for packaging applications) that meets the physicalcharacteristics described in the scope, may nonetheless be nonsubject merchandise because it is notsuitable for high-quality print graphics.” Subsequently, Commerce set forth its intention to rely on scopeprocedures described in 19 CFR 351.225 (post-order scope rulings) in order to “evaluate claims on aproduct-by-product basis.”32
(3) To add the HTS subheadings 4810.32, 4810.39, 4810.92 to the scope description.
At Commerce, petitioners requested that HTS subheadings 4810.32, 4810.39, 4810.92 be addedto the scope description to prevent possible circumvention of any issued order. Commerce observed thattwo of the HTS subheadings, 4810.32 and 4810.39, cover products described as “kraft paper andpaperboard, other than that of a kind used for writing, printing, or other graphic purposes,” which appearsto contradict the scope. Therefore, subject merchandise would not properly be classified under thesesubheadings. HTS subheading 4810.92 is a basket subcategory covering “other paper and paperboard:multi-ply.” Citing a recent Customs Ruling, Commerce observed that multi-ply paperboard meeting thescope description could enter under this subheading and decided to add all three HTS subheadings to thescope description “to ensure that provisional and potentially final duties apply to all subjectmerchandise.”33
Physical Characteristics and Uses
Certain coated paper and paperboard are coated on one or both sides with kaolin (China or otherclay), calcium carbonate, titanium dioxide, and/or other inorganic substances.34 Paper and paperboardcoated with these substances have a better printing surface than uncoated paper and paperboard. Otherimportant physical characteristics of certain coated paper include: (1) brightness, (2) basis weight, (3)finish, (4) opacity, (5) smoothness, and (6) caliper.
Brightness
Brightness is a measure of the paper’s ability to reflect light. The higher the brightness, thegreater the contrast between the paper and the colors printed upon it. Brightness ranges from 1, a totallyblack grade, to 100, the brightest measured grade.35 U.S. producers typically sell certain coated paper inone of three grades, with Grade No. 1 having the highest brightness levels, Grade No. 2 having the next
31 Certain Coated Paper Suitable for High-Quality Print Graphics Using Sheet-Fed Presses from Indonesia:Final Affirmative Countervailing Duty Determination; “Issues and Decision Memorandum,” dated September 27,2010, p. 50. Commerce also observed that the parties had not provided an objective definition of the phrase,“suitable for high-quality print graphics.” Ibid. 32 Ibid. at p. 51. 33 Antidumping and Countervailing Duty Investigations: Certain Coated Paper Suitable for High-Quality PrintGraphics Using Sheet-Fed Presses from Indonesia and the People’s Republic of China, Memorandum to Ronald K.Lorentzen from Susan Kuhbach, August 3, 2010, p. 12. 34 Certain Coated Paper Suitable for High-Quality Print Graphics Using Sheet-Fed Presses From the People’sRepublic of China: Final Affirmative Countervailing Duty Determination, 75 FR 59212, September 27, 2010. 35 Petition, p. 7.
I-15

highest brightness levels, and Grade No. 3 having the lowest brightness levels.36 One U.S. producer ofcertain coated paper sells Premium No. 1 grades with a brightness level of 96, number 2 grades withbrightness levels of 89 or 90, and number 3 grades with brightness levels of 87.37 The brightness levels ofcertain coated papers and their classification into a particular grade, however, can vary by producer.38
Basis Weight
Basis weight, a traditional unit of measurement for the paper industry in the United States, is theweight in pounds of a ream of paper (500 sheets of paper) of a given size (the basis).39 The basis forcover grades of certain coated paper other than coated packaging paperboard is 20" x 26", and the basisfor text grades of certain coated paper other than coated packaging paperboard is 25" x 38".40 Covergrades typically weigh from 65 pounds to 130 pounds, while text grades weigh from 60 pounds to 100pounds.41 Cover grades are generally used for items such as catalogue and magazine covers, postcards,business cards, and appointment cards. Text grades are generally used as the inside pages for items suchas books, catalogues, and magazines.
Finish
The finish of a sheet of paper or paperboard refers to the characteristics of the surface of the paperor paperboard. The most common finishes are gloss, dull, and matte. Paper or paperboard with a glossfinish has a very hard and smooth surface, which results in a printed image that is lustrous and shiny inappearance. Paper or paperboard with a dull finish has a smooth surface but lacks luster or gloss; paper orpaperboard with a matte finish also has a smooth surface but lacks gloss.42
Opacity
Opacity is a measure of the ability of a sheet of paper to have a printed image on one side withoutthe image showing through to the other side.43
Smoothness
Smoothness is the even and consistent continuity of the surface of the paper or paperboard. Paperor paperboard with a gloss finish has the smoothest surface.44
36 Ibid., p. 25. 37 Product brochure for coated papers, NewPage. 38 Petition, p. 25. 39 On a metric basis, the weight of paper is measured in grams per square meter. 40 Sappi Limited Web site.http://www.sappi.com/SappiWeb/Tools+and+resources/Paper_Print+information/Standard+weights+and... (accessed October 7, 2009). 41 NewPage Corporation Web site. Product specifications for coated papers found athttp://www.newpagecorp.com (accessed October 7, 2009). 42 Product brochure for coated papers, NewPage Corporation; Smook, Gary. 2nd Edition Handbook of Pulp &Paper Terminology. Bellingham, Washington: Angus Wilde Publications Inc., 2001. 43 Sappi Limited Web site.http://www.sappi.com/SappiWeb/Tools+and+resources/Paper_Print+information/Specifying+paper/Paper+checklist.htm (accessed October 7, 2009). 44 Ibid.; Product brochure for coated papers, NewPage Corp.
I-16

Caliper
Caliper is the thickness of the paper or paperboard, measured in thousandths of an inch andtypically expressed as points (e.g., 10 points equals 0.010 inch, 8 points equals 0.008 inch, and so on). Certain coated paper other than coated packaging paperboard is generally manufactured to a certain basisweight, while coated packaging paperboard is often produced to a specified thickness.45
End Uses
Certain coated paper other than coated packaging paperboard is generally used for printing multi-colored graphics for books, catalogues, magazines, envelopes, greeting cards, labels and wraps, and anyother commercial printing applications requiring high quality print graphics.46 It is also used for itemssuch as business cards, appointment cards, brochures, catalogue and magazine covers, postcards, andtickets.47 Coated packaging paperboard is typically used for packaging for cosmetics, pharmaceuticals,cigarettes, and other consumer goods.
Categories of Certain Coated Paper
The imported merchandise included in the scope of these investigations consists of certain coatedpaper and paperboard in sheets suitable for high quality print graphics using sheet-fed presses. Certaincoated paper and paperboard48 as examined in these investigations includes the following categories ofpaper products: (1) certain coated paper other than coated paperboard, (2) coated paperboard used in thecommercial printing industry as “cover” stock, and (3) coated packaging paperboard. These threecategories of paper products are described further below.
Certain Coated Paper Other than Coated Paperboard
Certain coated paper other than coated paperboard includes (1) text grades of coated free sheetpaper and (2) coated groundwood paper produced from bleached chemi-thermo-mechanical pulp. Coatedfree sheet is a clay coated paper predominately composed of chemically obtained fibers (90 percent ormore by weight), used primarily for permanent and higher priced publications such as premiummagazines, gift books, and art reproductions. Coated groundwood is a clay coated paper made withsubstantial proportions of mechanically derived pulp,49 generally used for multi-colored publications that
45 Respondents’ posthearing brief, exhibit 36. 46 Certain Coated Paper Suitable for High-Quality Print Graphics Using Sheet-Fed Presses From the People’sRepublic of China: Final Affirmative Countervailing Duty Determination, 75 FR 59212, September 27, 2010. 47 Respondents’ posthearing brief, exhibit 36. 48 There exists in the U.S. paper industry no common or objective definition of “paperboard.” When requested byCommerce to provide a definition of “paperboard” using objective, physical characteristics, the petitioners providedCommerce with the following: “‘Paperboard’ refers to certain coated paper that is heavier, thicker, and more rigidthan coated paper which otherwise meets the product description. In the context of certain coated paper, paperboardtypically is referred to as ‘cover,’ to distinguish it from ‘text.’” This definition currently appears in Commerce’sfinal scope definition as footnote 1.
49 Bleached chemi-thermo-mechanical pulp is a type of mechanical pulp produced by chemicals, heat, pressure,and grinding techniques, after which the pulp is bleached. According to petitioners, coated paper containing morethan 10 percent bleached chemi-thermo-mechanical pulp has all the quality attributes of coated free sheet andconsequently can be sold as such in the market. Conference transcript, p. 38 (Savage).
I-17
remain in use from several days to a month–primarily magazines, merchandising catalogues, and betterquality newspaper inserts.
Certain coated paper other than coated paperboard generally has brightness levels well over 80and basis weights ranging from 60 pounds to 100 pounds. The finish of this paper is typically gloss, dull,or matte. The caliper is usually below 7 points.50
Coated Paperboard Used in the Commercial Printing Industry as “Cover” Stock
Coated paperboard used in the commercial printing industry as “cover” stock includes: (1) covergrades of coated free sheet paper produced by the petitioners and (2) coated paperboard produced byfirms that traditionally service the packaging industry that sell coated paperboard to commercial printersand used by them as cover stock.51 These two product categories are heavier, thicker, and more rigid thantext grades of coated free sheet paper and coated groundwood paper produced from bleached chemi-thermo-mechanical pulp. Although each of these two product categories is generally manufactured bydifferent producers, they are generally interchangeable in the marketplace.52
Cover grades of coated free sheet paper generally have brightness levels well over 80. Theweight of the paper, on a grams per square meter basis, ranges from approximately 176 to 352. The finishof this paper is usually gloss, dull, or matte, and the caliper ranges from 7 points to 14 points.53 Coatedcover stock also has brightness levels well over 80. The weight of this paper, on a grams per square meterbasis, ranges from approximately 176 to 465. The finish of the paper can vary, and the caliper rangesfrom 8 points to 26 points.54
Coated Packaging Paperboard
According to the Paperboard Packaging Alliance, there are three major grades of coatedpackaging paperboard:55
Solid bleached sulfate– a premium grade of coated paperboard that is made froma furnish that contains at least 80 percent virgin bleached wood pulp and used forpackaging items such as medical goods, milk and juice, cosmetics and perfume,frozen food, and candy.
50 NewPage Corporation Web site. Product specifications for coated papers found athttp://www.newpagecorp.com (accessed October 7, 2009). 51 According to petitioners, U.S. firms that traditionally have served the packaging market, yet still producepaperboard products that they deem to be within the scope of these investigations include: Cascade, Clearwater,International Paper, and MeadWestvaco. Petitioners’ posthearing brief, “Questions from the Commissioners,” exh.3, pp. 1-2 and 6 (Scenario 2A is petitioners compilation of data for paperboard produced by these firms that theydeem within the scope). 52 See Petitioners’ posthearing brief, Question no. 3, (Questions from Commissioners), exh. 3; Respondents’posthearing brief, exh. 36. 53 NewPage Corporation Web site. Product specifications for coated papers found athttp://www.newpagecorp.com (accessed October 7, 2009). 54 Respondents’ posthearing brief, exhibit 36; Respondents’ comments on draft questionnaires, attachment 1, June2, 2010. 55 The Paperboard Packaging Alliance is a joint initiative of the Paperboard Packaging Council and the AmericanForest & Paper Association. Information about packaging paperboard found at http://www.paperboardpackaging.org(accessed September 24, 2010).
I-18

Coated unbleached kraft paperboard– a superior strength grade of coatedpaperboard that is made from a furnish that contains at least 80 percent virginunbleached wood pulp and used for packaging items such as frozen food, milk,and pharmaceuticals.
Coated recycled paperboard– a multiply coated paperboard that is made from 100percent recovered paperboard and used for packaging items such as soap andlaundry detergent, cookies and crackers, facial tissue and napkins, cake mix,breakfast cereal, and other types of dry food.
Some of the U.S. production of these three grades of coated packaging paperboard falls outside of thescope of these investigations because some products within these three grades are in the form of web rollsor fail to meet the brightness and/or the basis weight specifications described in the scope language.
Table I-2 presents data for U.S. shipments of these three grades during 2007-2009.
Table I-2Coated packaging paperboard: U.S. shipments by grade,1 2007-09
Item 2007 2008 2009
Shipments (1,000 short tons)
Solid bleached sulfate 2,069 2,031 1,792
Coated unbleached kraftpaperboard 2,063 1,975 1,834
Coated recycledpaperboard 2,268 2,212 2,168
1 A portion of these shipment data include coated packaging paperboard that is within the scope of these investigations, butalso coated packaging paperboard that is outside the scope of these investigations because it is in web roll form or does notmeet the GE brightness and/or basis weight specifications.
Source: 2009 Statistical Summary for Paper, Paperboard and Pulp, American Forest & Paper Association.
Coated packaging paperboard has brightness levels of 80 or higher but generally lower than thebrightness levels of certain coated paper other than coated paperboard and coated paperboard used in thecommercial printing industry as “cover” stock. The weight of coated packaging paperboard ranges fromapproximately 185 grams per square meter to 545 grams per square meter. The finish of the paperboardis generally between a gloss finish and a dull finish, and the caliper ranges from 10 points to 24 points.56
Manufacturing Processes
Many of the production facilities of U.S. producers of certain coated paper are integratedoperations, producing these products (as well as sheeter rolls and web rolls) in one continuous processfrom the harvested log to the intermediate product (pulp) to the final paper product.57 This productionprocess is similar for all the producers.
56 Respondents’ comments on draft questionnaires, attachment 1, June 2, 2010. 57 Some U.S. producers also repulp recycled paper and use this recycled pulp solely, or in combination withvirgin pulp, in the production of some of their paper and paperboard; they may also purchase chemical pulp(described infra) or bleached chemi-thermo-mechanical pulp on the open market to supplement their own pulpproduction.
I-19

Manufacture of Pulp
The manufacturing process begins with the removal of the bark from the hardwood and softwoodlogs in a debarking machine. The logs are then chipped into small uniformly sized chips in a chipper. The wood chips next undergo a chemical pulping process whereby they are cooked under pressure withwater and chemicals in a digester cooking vessel to separate the cellulose fibers from the lignin, the gluethat holds the fibers together, and other impurities. The resulting wood pulp is washed and bleached toattain a level of whiteness and brightness required for the grade of paper or paperboard being producedand then refined to enable the wood fibers to mesh together and to increase their bonding properties. (Thepaper or paperboard is made from both hardwood pulp and softwood pulp. The short hardwood fibershelp to provide a good printing surface, while the longer softwood fibers provide strength to the sheet.) Different materials are added to the pulp, including kaolin clay and calcium carbonate for brightness,opacity, and smoothness, dyes for shade control, optical brighteners for whiteness, and sizing agents formoisture control. The exact proportions of these materials are determined by the specifications for theparticular type of coated paper or paperboard that is being produced. A large volume of water is alsoadded.58
Post-Pulp Paper Manufacturing Process
At this stage of the manufacturing process, the pulp mixture is 99.5 percent water and it is readyto be run continuously through a paper machine. A paper machine has three major parts–the base sheetforming section (the wet end), the press section, and the dryer section. The mixture is pumped out onto acontinuously moving wire web that is usually oriented horizontally and which loops around rollers at bothends. As the wire web moves along, water drains through it, the fibers begin to bond, and a sheet (web)of paper begins to form on the wire. The web at this point has an 80 percent water content. The web ofpaper leaves the moving wire and enters the press section, where a set of steel rollers squeezes more waterout of the web, reducing its water content to about 65 percent. The web then proceeds into the dryersection and passes over and under successive steam-heated drying cylinders. This drying processremoves most of the remaining water from the web of paper.59 60
Coating Process
At this point, the web is now ready for coating and also, if need be, calendering. Coatingequipment is either integrated in line with the paper machine (on-line coating) or separate from the papermachine (off-line coating). For on-line coating, the paper enters the coating equipment after leaving thedryer section. If the coating is to occur off-line, the paper is wound onto large reels after the dryingprocess and transported over to the off-line coating equipment. In either case, the coating and calenderingprocesses are the same. The coating to be applied to the paper consists of a variety of chemicals and other
58 Petition, Volume II-a, pp. 4-7; Coated Free Sheet Paper From China, Indonesia, and Korea, Inv. Nos. 701-TA-444-446 (Final) and 731-TA-1107-1109 (Final), USITC Publication 3965, December 2007, pp. I-15-I-17; SappiLimited Web site. http://www.sappi.com/SappiWeb/Tools+and+resources/How+paper+is+made/Papermaking.htm(accessed October 8, 2009); Stora Enso Paperboard Guide, Stora Enso Web site. http://www.storaenso.com(accessed September 28, 2010). 59 Ibid. 60 Some coated packaging paperboard has a multiply structure, i.e., the paperboard consists of multiple layers orplies of fiber that are formed separately at the wet end of the paper machine and subsequently bonded together toform a single sheet during pressing and drying. Smook, Gary. 3rd Edition Handbook for Pulp & PaperTechnologists, p. 299. Bellingham, Washington: Angus Wilde Publications Inc., 2002.
I-20
materials mixed together in certain proportions according to the requirements of the paper or paperboardbeing produced. These chemicals and other materials may include kaolin clay, other types of clay,calcium carbonate, titanium dioxide, latex, starches, dyes, lubricants, thickeners, plastic pigments, opticalbrighteners, and biocides. These various items, among other things, brighten the paper, increase itsopacity and gloss, help bind the coating to the paper, and control the buildup of fungus and mold.61
When the paper web enters the coating equipment, a thin coat is applied evenly to one side, whichis then dried, followed by the coating and drying of the other side of the web. One method of applyingthe coating to the paper involves a blade coating process, whereby extra coating is applied to the paperand then scraped off by a steel blade. The pressure of the steel blade against the surface results in a moreuniform surface. After the coating process, the paper or paperboard is rewound onto large reels, inpreparation for the calendering process. A calendar is a set of steel rolls, stacked one on top of the other,through which the paper web is passed. The rolls apply heat and pressure to the paper, increasing thesmoothness and gloss of the surface. Paper with a gloss or dull finish is typically calendered, while paperwith a matte finish is not. After calendering, the paper is rewound again onto large reels.62
Certain coated paper in sheeter roll form
All certain coated paper is made and sold by U.S. producers in both sheet form and sheeter rollform. These terms are generally defined as follows:
Sheets– certain coated paper other than coated packaging paperboard and coatedpackaging paperboard that have been sheeted (cut) into certain sheet sizes from sheeterrolls by paper producers or by independent converters for use in sheet-fed presses. Thesepresses generally print only one side of the sheet at a time and tend to have smaller printruns. Sheets have high moisture levels and certain mechanical properties that allow themto run through a sheet-fed press without curling or losing print and color fidelity.
Sheeter rolls– rolls of certain coated paper other than coated packaging paperboard andcoated packaging paperboard intended to be sheeted into various sheet sizes by paperproducers or independent converters. Sheeter rolls and sheets are identical in physicalcharacteristics but for the sheeting process.
The large reels of paper or paperboard (jumbo rolls) are transported to the finishing departmentwhere a slitter/rewinder unwinds and slits them into smaller width rolls and rewinds them onto narrowerreels. The various widths of these narrower rolls are dictated by the width of the presses for which theyare intended. At this point in the production process, sheeter rolls (to be sheeted by independentconverters) are wrapped and labeled for delivery to customers. U.S. producers sell certain coated paperother than coated packaging paperboard and coated packaging paperboard in the form of sheets. Theremaining sheeter rolls are processed on a sheeter, which cuts the rolls into sheets, performs a qualitycheck of the surface of the paper, removes faulty sheets, counts and packages the sheets in reamquantities, and stacks them on pallets ready for delivery. Until the sheets and sheeter rolls actually leave
61 Petition, Volume II-a, pp. 4-7; Coated Free Sheet Paper From China, Indonesia, and Korea, Inv. Nos. 701-TA-444-446 (Final) and 731-TA-1107-1109 (Final), USITC Publication 3965, December 2007, pp. I-15-I-17; SappiLimited Web site. http://www.sappi.com/SappiWeb/Tools+and+resources/How+paper+is+made/Papermaking.htm(accessed October 8, 2009); Stora Enso Paperboard Guide, Stora Enso Web site. http://www.storaenso.com(accessed Sepember 28, 2010). 62 Ibid.
I-21

the paper mill for the customer, they are kept in climate-controlled areas and monitored carefully viainventory control software.63
INTERMEDIATE PRODUCTS
Sheeter Rolls vs. Sheets
When an issue arises as to whether products at different stages of production should be includedin the same domestic like product, the Commission has employed a five-factor “semifinished/finishedproducts” analysis. In these investigations, certain coated paper (which as defined by the scope is in sheetform) are downstream products of sheeter rolls (sheets in roll form), which are the upstream orintermediate product. The issue then is whether sheeter rolls, although not in the definition of the scopeof these investigations, should be included in the definition of the domestic like product.64 During thepreliminary phase of these investigations, both petitioners and respondents argued that sheeter rollsshould be included into the Commission’s definition of the domestic like product.65 The Commissionpreliminarily determined that the domestic like product included sheeter rolls, stating that “virtually allsheeter rolls are used in the production of certain coated paper, and there is at most a small market forsheeter rolls. Sheeter rolls represent a substantial proportion of the cost and value of the finished productand undergo only one other production step before transformation into certain coated paper.”66
In the final phase of these investigations, petitioners asserted that the issue of whether sheeterrolls should be included in the domestic like product is not dispositive and take no position.67 Respondents maintained their position from the preliminary phase of these investigations that sheeter rollsare properly included in the domestic like product.68
The five factors that the Commission has considered in analyzing semifinished products include: (1) uses (is the upstream product dedicated to the production of the downstream product or does it haveindependent uses?); (2) markets (are there separate markets for the upstream and downstream products?); (3) characteristics and functions (are there differences in the physical characteristics and functions of theupstream and downstream products?); (4) value (are there differences in the production costs and/or salesvalues (transfer values or market prices as appropriate) of the upstream and downstream products?); and(5) transformation processes (what is the significance and extent of the processes used to transform theupstream product into the downstream product?). The first three factors presented below are based onquestions asked of market participants in the preliminary phase of these investigations.69 In the finalphase of these investigations, U.S. converters were requested to provide information regarding the processand the value added of their U.S. conversion activities.
63 Ibid. 64 The original definition of the scope of these investigations, as set forth in the petition, included sheeter rolls. After consultations with Commerce, petitioners removed sheeter rolls from the definition of the scope. SeePetitioners’ October 9, 2009 submission to Commerce. Subsequent to the alteration of the scope language,petitioners argued that sheeter rolls should be included in the domestic like product by way of the Commission’ssemifinished product analysis. Ibid. 65 Petitioners’ postconference brief, “Answers to Questions from Staff,” exh. 7. Respondents’ postconferencebrief, exh. 1, p. 20. Respondents did not include a specific “semifinished analysis” in their brief, however, arguedfor a definition of the domestic like product that included sheets, sheeter rolls, and web rolls. 66 Certain Coated Paper Suitable for High-Quality Print Graphics Using Sheet-Fed Presses from China andIndonesia, Inv. Nos. 701-TA-470-471 and 731-TA-1169-1170 (Final), USITC Publication 4108, November 2009, p.8. 67 Petitioners’ prehearing brief, pp. 7-8. 68 Respondents’ prehearing brief, p. 16. 69 The Commission did not request information regarding these factors in the final phase of these investigations.
I-22

Whether the Upstream Product is Dedicated to the Production of the Downstream Product
In the preliminary phase of these investigations, petitioners argued that sheeter rolls are not soldor warranted for use on web roll presses and are produced for the sole purpose of being converted intosheet (certain coated paper).70 Market participants agreed that sheeter rolls have no use but in theproduction of certain coated paper. *** reported that all sheeter rolls are dedicated to the downstreamsheeted product.71 Twelve out of 13 responding U.S. importers stated that they believed 100 percent ofimported sheeter rolls are dedicated to production of the downstream product.72
Whether There are Separate Markets for the Upstream and Downstream Products
During the preliminary phase of these investigations, petitioners argued that the market forsheeter rolls is limited as the vast majority of sheeter rolls are converted by the integrated producers andonly a small portion of sheeter rolls are sold in the merchant market to unrelated converters.73 Petitionersalso stated that the vast majority of U.S. imports are also in sheet form and thus competition betweendomestic product and imported product occurs in the sheet market and not in a sheeter roll market.74 Eight of 10 reporting U.S. producers (integrated producers and converters) and 10 out of 12 U.S.importers stated that they perceived the market for sheeter rolls and the market for certain coated paper tobe the same market.75
Whether There are Differences in the Physical Characteristics and Functions of the Upstream andDownstream Products
During the preliminary phase of these investigations, petitioners argued that there are nodifferences in physical characteristics between the sheeter roll and certain coated paper (sheets). Theymaintained that the essential physical characteristics, such as moisture content, fiber, weight, and coatingremain unchanged from sheeter roll until finished sheet product.76 Eight out of 10 reporting U.S.producers (integrated producers and converters) and 11 out of 12 reporting U.S. importers concurred andstated they believed that there are no differences in the physical characteristics of the two products.77
What Is the Significance and Extent of the Processes Used to Transform the Upstream Product intothe Downstream Product?
The sheeting process entails sheeter rolls being processed on a “sheeter” or “sheeting machine”,which cuts the rolls into sheets, performs a quality check of the surface of the paper, removes faultysheets, counts and packages the sheets in ream quantities, and stacks them on pallets ready for delivery.
70 Petitioners’ postconference brief, “Answers to Questions from Staff,” exh. 7, p. 2. 71 U.S. producer’s questionnaire (Preliminary), responses to question II-12. 72 U.S. importer’s questionnaire (Preliminary), responses to question II-7. 73 Petitioners’ postconference brief, “Answers to Questions from Staff,” exh. 7, p. 2. 74 Ibid. 75 U.S. producer’s questionnaire (Preliminary), responses to question II-12; U.S. importer’s questionnaire(Preliminary), responses to question II-7. 76 Petitioners’ postconference brief, “Answers to Questions from Staff,” exh. 7, p. 2. 77 U.S. producer’s questionnaire (Preliminary), responses to question II-12; U.S. importer’s questionnaire(Preliminary), responses to question II-7.
I-23

Until the sheets and sheeter rolls actually leave the paper mill for the customer, they are kept in climate-controlled areas and monitored carefully via inventory control software.78
Value Added by U.S. Converters
The Commission requested information from U.S. converters on the value added of their U.S.converting operations. Data submitted in response to the questionnaire by U.S. converters indicates thatconverting operations accounted for an average *** percent of the cost to produce certain coated paperexcluding selling, general, and administrative costs (see Part VI, p. VI-1 fn. 4).
DOMESTIC LIKE PRODUCT ISSUES79
Certain Coated Paper vs. Web Rolls
During the preliminary phase of these investigations, respondents argued that the Commissionshould find one domestic like product that included sheet (certain coated paper), sheeter rolls, and webrolls.80 Petitioners contended that the Commission should find one domestic like product that includes thescope of the investigations as identified by Commerce plus the addition of sheeter rolls (see IntermediateProducts section above).81
In its preliminary views,82 the Commission determined that web rolls are not part of the domesticlike product, stating the following:
“The record supports a finding of a clear dividing line betweencertain coated paper and web rolls, as there are more differences thansimilarities. Although both products are considered to be coated freesheet paper and are used in similar printing applications, each product isproduced to meet distinct requirements of particular printing presses. Asa result, there is at best limited interchangeability between the products. The products are reported to be sold in the same channels of distribution,and both certain coated paper and web rolls generally are manufacturedon the same equipment, by the same processes and with some of thesame employees. However, certain coated paper requires an additionalproduction step of sheeting before it is a finished product. As such, thesheeter operations are either done on a sheeter at the integratedproducers’ mill or at the facilities of independent converters. Finally,
78 Petition, Volume II-a, pp. 4-7; Coated Free Sheet Paper From China, Indonesia, and Korea, Inv. Nos. 701-TA-444-446 (Final) and 731-TA-1107-1109 (Final), USITC Publication 3965, December 2007, pp. I-15-I-17. 79 The Commission’s decision regarding the appropriate domestic products that are “like” the subject importedproducts is based on a number of factors including: (1) physical characteristics and uses; (2) common manufacturingfacilities, production processes, and production employees; (3) interchangeability; (4) customer and producerperceptions; (5) channels of distribution; and (6) price. 80 Respondents’ postconference brief, pp. 5-10 and exh. 1. Respondents urged the Commission to define thedomestic like product in these investigations as it did in Coated Free Sheet Paper, and include sheets, sheeter rolls,and web rolls. In that investigation, no domestic like product issues were advanced by any party and the scopeincluded all of those products. Coated Free Sheet Paper from China, Indonesia, and Korea, Inv. Nos. 701-TA-444-446 and 731-TA-1107-1109 (Final), USITC Publication 3965, December 2007, pp. 3-5. Respondents argued thatbecause there have been no factual changes in the last two years, the Commission should use its prior domestic likeproduct definition in a subsequent investigation on a similar product. 81 Petitioners’ postconference brief, “Answers to Questions from Staff,” exh. 7. 82 In the final phase of these investigations, the Commission did not collect data regarding web rolls.
I-24

certain coated paper is higher priced than web rolls. Taking all of thesefactors into account, we do not include web rolls in the definition of thedomestic like product.”83
In the final phase of these investigations, petitioners maintained that the Commission’spreliminary determination regarding the issue of whether web rolls should be included into the domesticlike product was correct and stated that no additional information placed on the record in the final phaseof these investigations calls into question that determination.84 Respondents argued that web rolls shouldbe included into the domestic like product. They cite additional information specifically pertaining to thedomestic like product factors of physical characteristics and interchangeability. With regard to physicalcharacteristics, respondents observed that in the preliminary phase, the Commission considered the“moisture level” and “porosity” between the products to be dissimilar85 and provide an affidavit from anindustry insider that states that the differences in the moisture and porosity levels between paper in sheetand web roll form has recently been minimized due to advances in technology.86 With regard tointerchangeability, respondents claimed that web rolls are not only able to be sheeted, but are currentlybeing sheeted in the U.S. market. Respondents cited a brochure issued by a vendor advertising a machinethat they claim adds the requisite moisture to web rolls to be able to properly sheet them.87 Petitionersalso submitted affidavits from industry participates that claim that paper in web roll and sheet form arenot interchangeable and that the machine cited by respondents as capable of sheeting web rolls, is in fact,for the sheeting of sheeter rolls and not web rolls.88
Certain Coated Paper Other Than Certain Coated Paperboard vs. Certain Coated Paperboard
In a posthearing request, the Commission asked the parties to address the issue of whether“certain coated paper other than certain coated paperboard” and “certain coated paperboard”89 were
83 Certain Coated Paper Suitable for High-Quality Print Graphics Using Sheet-Fed Presses from China andIndonesia, Inv. Nos. 701-TA-470-471 and 731-TA-1169-1170 (Final), USITC Publication 4108, November 2009, p.10. 84 Petitioners’ prehearing brief, p. 8. 85 Certain Coated Paper Suitable for High-Quality Print Graphics Using Sheet-Fed Presses from China andIndonesia, Inv. Nos. 701-TA-470-471 and 731-TA-1169-1170 (Final), USITC Publication 4108, November 2009, p.9. 86 Respondents’ prehearing brief, p. 19, citing exh. 2 (affidavit of Mr. Hanscom). 87 Respondents’ posthearing brief, at exh. 1, p. 54 (containing a list of new factual allegations that supportincreased interchangeability) and exh. 10 (brochure). 88 Petitioners’ posthearing brief, pp. 6-7 and “Questions from Commission Staff,” exh. 7, pp. 1-3. 89 “Certain coated paperboard” was defined by the Commission as “solid bleached sulfate (SBS) paperboard,coated recycled paperboard (CRP), and coated natural kraft paperboard (CNK) having a GE brightness of 80 orhigher and weighing not more than 340 grams per square meter in sheet form.”
Petitioners maintained that because the definition did not contain the phrase “suitable for high-quality printgraphics,” “certain coated paperboard,” as defined by the Commission, would include out-of-scope product, namelycoated paperboard used in packaging applications, which they argued is not “suitable for high-quality printgraphics.” Petitioners’ posthearing brief, “Questions from Commissioners,” exh. 1, p. 3. Respondents maintainedthat the definition of “certain coated paperboard” is untenable and not a recognizable delineation in the industrybecause there exists no bright line between coated paper and paperboard and there is much overlap between “thickpaper” and “thin paperboard.” Respondents’ posthearing brief, exh. 36, p. 2.
In the course of its scope inquiry, Commerce requested that the petitioners provide a definition of “coatedpaperboard.” Petitioners responded that “there is no single definition that distinguishes between paper andpaperboard in terms of either weight or thickness. Such delineations will vary according to end use.” Petitioners
(continued...)
I-25

separate domestic like products. Both parties continue to urge the Commission to find one domestic likeproduct co-extensive with the scope as defined by Commerce.90 Petitioners claimed that “certain coatedpaperboard” within the scope of these investigations are quite similar as both are “used for printing, aresold to the same customers through the same channels of distribution, and are interchangeable where theyhave similar basis weights.” Petitioners listed one primary difference, namely that the two products areproduced in different manufacturing facilities with different production employees.91
Respondents maintained that “certain coated paper other than certain coated paperboard” and“certain coated paperboard” are part of a single domestic like product. They stated that the physicalcharacteristics of the two products are identical as both products have comparable porosity, moisturecontent and are in sheet form. With regard to end use, respondents maintained that both are used in sheet-fed presses and that there are only two customers for certain coated paperboard, which are commercialprinters that use the product for “covers” and firms that produce packaging. Respondents stated that thetwo products are generally produced at separate paper mills, but that the production processes are verysimilar (only the calibration of the paper-production machines being dissimilar) and productionemployees could easily move from the production of one product to another. With regard to channels ofdistribution, respondents claimed that they are identical for certain coated paperboard used as covers bycommercial printers. Respondents observed that the price of certain coated paper used for covers iscomparable to the price of certain coated paperboard.92
89 (...continued)then recommended what is now footnote 1 in Commerce’s scope definition. See Respondents’ posthearing brief,exh. 37 (exh. 6). 90 The parties appear to disagree as to the proper interpretation of Commerce’s final scope determination. Petitioners maintained that by not excluding the phrase, “suitable for high-quality print graphics” from the scope,Commerce determined that coated packaging paperboard is excluded from the scope of these investigations.Petitioners’ posthearing brief, “Questions from Commissioners,” exh. 1, p. 3. Respondents maintained thatCommerce did not determine that “suitable for high-quality print graphic” creates an end-use limitation to the scope,but rather that any product fitting the physical specifications listed in the scope (brightness, basis weight, and insheet form) would be included within the scope. Respondents’ posthearing brief, exh. 1, p. 14. 91 Petitioners’ posthearing brief, “Questions from Commissioners,” exh. 1, p. 4. Petitioners reported that they donot produce “certain coated paperboard,” as defined by the Commission.
Petitioners also argued that if “certain coated paperboard” products deemed outside the scope of theseinvestigations are included then those products are very different as they are used for packaging applications. Ibid.at p. 3. 92 Respondents’ posthearing brief, exh. 3, p. 4 and exh. 36. Although arguing that the Commission’s definitionof “certain coated paperboard” is artificial and untenable, respondents contended that should the Commission findtwo separate domestic like products then there is not substantial evidence that the “certain coated paperboard”industry in the United States is materially injured or threatened with material injury by subject imports. Respondents’ posthearing brief, exh. 38. In its division of the U.S. industry, respondents included the followingU.S. firms in the U.S. certain coated paperboard industry: (1) Clearwater, (2) Georgia-Pacific, (3) InternationalPaper, (4) MeadWestvaco, and (5) Rock-Tenn. Respondents’ U.S. industry data includes coated paperboardproducts regardless of end use. Clearwater and MeadWestvaco, according to their responses to the U.S. producerquestionnaire produce some product for the U.S. commercial printing industry and some for the U.S. packagingindustry. International Paper reported in its questionnaire response that all of its coated paperboard reported thereinis sold in the U.S. commercial printing industry.
I-26

PART II: CONDITIONS OF COMPETITION IN THE U.S. MARKET
U.S. MARKET CHARACTERISTICS
Certain coated paper is used in printed materials requiring high-gloss sheets, including annualcompany reports, high-end brochures, catalogues, magazines, direct mail advertisements, and labels.1 Purchasers of certain coated paper consist of paper merchants/distributors and end users, which arecommercial printers. Final end-use customers include large corporations, publishing houses, andadvertising agencies.
A majority of U.S. integrated producers of certain coated paper reported that *** of their certaincoated paper is sold from inventory, with lead times ranging from ***.2 The lead times on U.S. integratedproducers’ sales produced to order range from ***. A *** of responding converters of certain coatedpaper reported that most *** of their sales are from inventory, with *** reporting that *** of their salesare produced to order. Lead times on converters’ sales from inventory range from *** and lead times onconverters’ sales produced to order range from ***. Half of the responding importers of certain coatedpaper from China reported that all or most of their sales are from inventory and the other half reportedthat all or most of their sales are produced to order in China. *** of the responding importers of certaincoated paper from Indonesia reported that all or most of their sales are produced to order in Indonesia. Importers’ lead times from inventory range from ***. Lead times on sales produced to order in Chinarange from *** and lead times on sales produced to order in Indonesia range from ***.
The Commission received questionnaire responses from 35 purchasers, including 22 distributorsand 13 end users.3 Among responding purchasers, 33 reported purchasing certain coated paper producedin the United States, 16 of which also reported purchasing imports from China and 7 of which alsoreported purchasing imports from Indonesia; one purchaser reported purchasing imports exclusively fromChina and nonsubject sources.4 Four responding purchasers reported purchasing imports from both Chinaand Indonesia. Purchasers were asked how many suppliers they generally contact before making apurchase. Six of 35 responding purchasers reported that they contact one supplier, 1 purchaser reportedthat it contacts one to two suppliers, 7 purchasers reported that they contact two suppliers, 6 purchasersreported that they contact three suppliers, and 3 reported that they contact three to six suppliers.5
When purchasers were asked if the relative shares of their total purchases of certain coated paper from different sources had changed since 2007, among 35 responding purchasers, 7 reported that theirshares of purchases from U.S. producers have increased.6 Five purchasers reported that their shares ofpurchases from U.S. producers have decreased, two of which cited price reasons and one cited quality. Two purchasers reported that their shares from U.S. producers have not changed. Eight purchasersreported that their shares of purchases from China have increased since 2007, with four citing price, twociting quality, and one citing a switch of its purchases from Indonesia to China due to environmental
1 Coated paperboard is typically used to make folding cartons.
2 ***, reported that *** percent of *** sales are from inventory. *** reported that *** percent of their sales arefrom inventory. U.S. producers of coated packaging paperboard reported that most or all of their sales are ***.
3 Three of the distributors identified themselves as converters and one identified itself as a retailer. Not everypurchaser responded to every question in the questionnaire.
4 One purchaser did not identify the countries of origin of its purchases. Twenty-two purchasers reportedpurchasing imports from nonsubject sources.
5 Two purchasers reported that the number of suppliers they contact varies.
6 Specifically, purchaser *** reported that ***. Purchaser *** also reported that ***. Purchaser *** reportedthat it increased its purchases from U.S. producer ***.
II-1

reasons.7 Five purchasers reported that their shares of purchases from China have decreased, with twociting the pendency of these investigations, one citing long lead times, and one citing a switch to U.S.producers with an environmental certification from the Forest Steward Council (FSC). Three purchasersreported that their shares of purchases from Indonesia have decreased, with one citing the pendency ofthese investigations, one citing environmental reasons that resulted in a shift to a supplier in China, andthe other reportedly switching to a nonsubject supplier in Korea. Eighteen purchasers reported that theirshares of purchases from nonsubject sources have decreased, mostly citing price, availability, orswitching to U.S. product with FSC certification. Six purchasers reported increasing their shares ofpurchases from nonsubject sources, including Germany, France, Finland, and Korea, citing reasons suchas availability, product range, shorter lead times, and quality.
When firms were asked to list the geographic regions of the United States where they sell certaincoated paper, *** of the integrated producers reported that they served a nationwide market, with mostsales in 2009 being shipped to the Midwest, followed by the Southwest and the Northeast. *** of theconverters reported that they served a nationwide market and the *** reporting selling to specificgeographic regions, with most sales in 2009 being shipped to the Northeast, followed by the Southeastand the Midwest. Three importers of certain coated paper from China reported selling nationwide, ***reported selling to the ***, and *** reported selling to ***. Most sales of imports from China in 2009were reportedly shipped to the Southeast, followed by the Northeast, the Midwest, and the West Coast.*** importer of certain coated paper from Indonesia reported that it sells nationwide, one reported sellingto the ***, and one reported selling to the ***. Most sales of imports from Indonesia in 2009 werereportedly shipped to the West Coast, followed *** by the Midwest and the Northeast.
CHANNELS OF DISTRIBUTION
As shown in table II-1, the vast majority of U.S. integrated producers’ U.S. shipments of certaincoated paper were to merchants/distributors. Smaller shares of U.S. integrated producers’ U.S. shipmentsof certain coated paper were sales through “paper directed buy” (PDB) programs and sales to end users.8 The majority of U.S. integrated producers’ shipments of coated packaging paperboard were to end users,with the remainder going to merchants/distributors. A *** of converters’ U.S. shipments of certaincoated paper were to end users, with *** going to merchants/distributors. *** of U.S. importers’shipments of imports from China were to merchants/distributors from 2007 to 2009; in the first sixmonths of 2010, *** of U.S. importers’ shipments of imports from China were to merchants/distributors,with *** of shipments going to end users. *** of U.S. importers’ shipments of imports from Indonesiaand from nonsubject sources went to merchants/distributors. There were *** reported sales of importsthrough PDB programs.
7 One of these purchasers, ***, reported that it has stopped purchasing from its supplier of imports from Chinadue to these investigations.
8 PDB programs are defined as sales of certain coated paper where the ultimate end-use customer (i.e., thepurchaser of printed materials from the printer) negotiates the paper source, specifications, and/or price directly withthe paper distributor or the paper mill. In these transactions, the printer for the ultimate end user must use thespecified paper and at the specific price. See further discussion of PDB programs on the following pages.
II-2

Table II-1Certain coated paper: U.S. integrated producers’, converters’, and importers’ U.S. shipments ofcertain coated paper, by sources and channels of distribution, 2007-09, and January-June 2010
Item
Period
2007 2008 2009Jan.-June
2010
Share of reported shipments (percent)
Integrated producers’ U.S. shipments of certain coated paper OTHER than coated packagingpaperboard to:
Merchants/distributors 84.0 84.2 87.4 90.7
End users 6.3 6.3 5.3 3.6
PDB sales 9.7 9.5 7.3 5.7
Integrated producers’ U.S. shipments of coated packaging paperboard to:
Merchants/distributors 39.4 37.4 36.5 36.2
End users 60.6 62.6 63.5 63.8
PDB sales 0.0 0.0 0.0 0.0
Integrated producers’ U.S. shipments of certain coated paper (total):
Merchants/distributors 70.9 69.4 71.3 76.7
End users 22.2 24.1 23.7 19.1
PDB sales 6.9 6.5 5.0 4.2
Converters’ U.S. shipments of certain coated paper to:
Merchants/distributors *** *** *** ***
End users *** *** *** ***
PDB sales *** *** *** ***
U.S. importers’ U.S. shipments of certain coated paper from China to:
Merchants/distributors *** *** *** ***
End users *** *** *** ***
PDB sales *** *** *** ***
Table continued on following page.
II-3
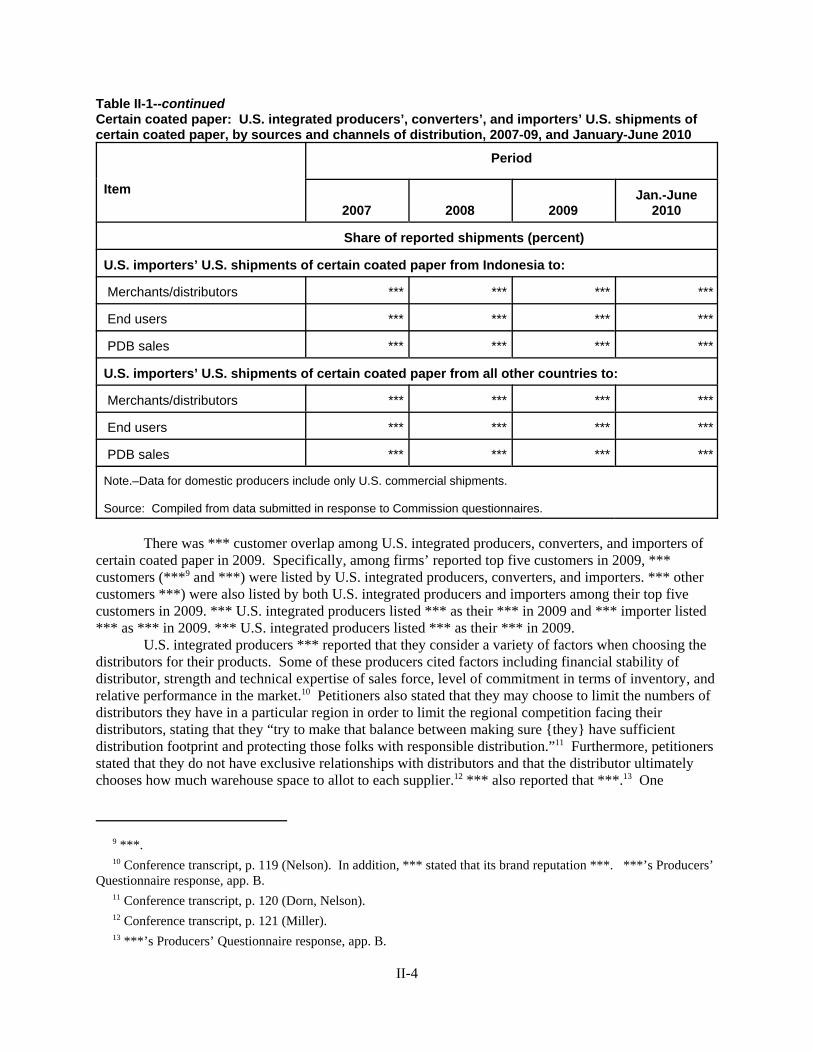
Table II-1--continuedCertain coated paper: U.S. integrated producers’, converters’, and importers’ U.S. shipments ofcertain coated paper, by sources and channels of distribution, 2007-09, and January-June 2010
Item
Period
2007 2008 2009Jan.-June
2010
Share of reported shipments (percent)
U.S. importers’ U.S. shipments of certain coated paper from Indonesia to:
Merchants/distributors *** *** *** ***
End users *** *** *** ***
PDB sales *** *** *** ***
U.S. importers’ U.S. shipments of certain coated paper from all other countries to:
Merchants/distributors *** *** *** ***
End users *** *** *** ***
PDB sales *** *** *** ***
Note.–Data for domestic producers include only U.S. commercial shipments.
Source: Compiled from data submitted in response to Commission questionnaires.
There was *** customer overlap among U.S. integrated producers, converters, and importers of
certain coated paper in 2009. Specifically, among firms’ reported top five customers in 2009, ***customers (***9 and ***) were listed by U.S. integrated producers, converters, and importers. *** othercustomers ***) were also listed by both U.S. integrated producers and importers among their top fivecustomers in 2009. *** U.S. integrated producers listed *** as their *** in 2009 and *** importer listed*** as *** in 2009. *** U.S. integrated producers listed *** as their *** in 2009.
U.S. integrated producers *** reported that they consider a variety of factors when choosing thedistributors for their products. Some of these producers cited factors including financial stability ofdistributor, strength and technical expertise of sales force, level of commitment in terms of inventory, andrelative performance in the market.10 Petitioners also stated that they may choose to limit the numbers ofdistributors they have in a particular region in order to limit the regional competition facing theirdistributors, stating that they “try to make that balance between making sure {they} have sufficientdistribution footprint and protecting those folks with responsible distribution.”11 Furthermore, petitionersstated that they do not have exclusive relationships with distributors and that the distributor ultimatelychooses how much warehouse space to allot to each supplier.12 *** also reported that ***.13 One
9 ***.
10 Conference transcript, p. 119 (Nelson). In addition, *** stated that its brand reputation ***. ***’s Producers’Questionnaire response, app. B.
11 Conference transcript, p. 120 (Dorn, Nelson).
12 Conference transcript, p. 121 (Miller).
13 ***’s Producers’ Questionnaire response, app. B.
II-4

integrated producer reported that it will continue to supply a distributor even if it does not receive its idealamount of shelf space with that distributor and that it has sacrificed on price, not volume, in order to makesales.14
Paper Directed Buy (PDB) Programs
PDB programs are sales of certain coated paper where the ultimate end-use customer (i.e., thepurchaser of printed materials from the printer) negotiates the paper source, specifications, and/or pricedirectly with the paper distributor or the paper mill. In these transactions, the printer for the ultimate enduser must use the specified paper and at the specific price. U.S. integrated producers reported that PDBsales accounted for 5.0 percent of their total U.S. shipments of certain coated paper in 2009, as shown intable II-1. *** U.S. integrated producers (***) reported participating in PDB programs. *** U.S.integrated producer, ***, reported that it does not engage in PDB programs itself, but that it ***. Noimporters reported participating in PDB programs. Three importers reported that they cannot participatein such programs because the customers usually require environmental certifications and only U.S.-produced certain coated paper has such certifications. Two of these importers also stated that they cannotparticipate in PDB programs for several other reasons, including *** the large end-use customers thatparticipate in PDB programs; the fact that large end-use customers typically have a greater need to “buyAmerican;” such programs often require matching amounts of certain coated paper and web rolls ofcoated paper and the importers are not able to compete against U.S. producers in the web roll segment ofthe market; U.S. producers have long-term relationships with the end-use customers involved; and U.S.producers offer complex rebate programs to PDB customers and the importers cannot compete at thoselower prices.
Among responding purchasers, seven merchants/distributors (***) and three end users(commercial printers ***) reported engaging in PDB programs for a portion of their total purchases.15 Five of the distributors reported using U.S. paper mills in such programs. One distributor (***) reportedusing U.S. paper mills *** and another distributor, Mac Papers, reported that it has used certain coatedpaper from APP in such programs.16 All three end users reported using U.S. paper mills in PDBprograms, one of which ***.
Two of the distributors reported participating in PDB programs because they provide them withstable sales volumes; price stability; financial stability of customers base; and ***. When asked if thereare restrictions as to which paper sources they can use for PDB programs, four distributors cited issuessuch as willingness of each participant (i.e., the paper mill, the end user, and the distributor), local salesteam,17 ability of the producer to guarantee prices over a period of time, franchise restrictions, supplychain logistics, and environmental certifications. One of these distributors, ***, later stated that it isunaware of any restriction that would prevent APP or any other foreign manufacturer from having itspaper used in PDB programs.18 One of these distributors also reported that changing the incumbent papersource often results in losing the sale or ***. Two of the distributors that participate in PDB programsreported that there are no restrictions as to which paper source they can use. One of these distributors
14 Conference transcript, p. 122 (Miller).
15 As shown in table II-3, two responding purchasers characterized “willingness to or ability of supplier to engagein PDB programs” as a “very important” factor in their purchasing decisions, while 5 reported that it was “somewhatimportant,” and 24 reported that it was “not important.”
16 Hearing transcript, p. 138 (McGehee).
17 Specifically, one distributor reported that suppliers of imports of certain coated paper are generally excludedfrom participating in PDB programs because they lack a local sales team capable of maintaining ongoingrelationships with the end-use customers.
18 Petitioner’s posthearing brief, exh. 1, p. 3.
II-5
stated that it promotes its paper to end users and is encouraged to do so ***. The other distributor statedthat it typically sources its PDB programs through U.S. producers to ensure reliability and speed ofdelivery, product quality, and good service. One end user reported that its end-use customer selects thepaper source, another end user reported that the distributor selects the paper, and one end user reportedthat it and its end-use customer must test and approve the certain coated paper used.
Private label sales
Private label sales are sales of certain coated paper to large distributors that put their own brand on the paper. Private label product reportedly tends to be economy grade and is generally sold at a lowerprice than mill branded products.19 U.S. producer ***. U.S. producer ***. U.S. producer ***.20 ***.21 Importers ***.22 Respondents reported that they believe that ***.23
Petitioner contends that subject imports are increasingly entering the private label business, stating that subject import suppliers can easily bring in large volumes of product into the United Statesthrough private label sales, which eliminate marketing and promotion costs. Petitioner further argues thatwhen subject import suppliers were the primary source for private label products, the lower prices ofprivate label products drove down prices of mill branded product.24
SUPPLY AND DEMAND CONSIDERATIONS
Supply
U.S. Supply
The supply response of U.S. producers to changes in price depends on such factors as the level ofexcess capacity, the availability of alternate markets for U.S.-produced certain coated paper, inventorylevels, and the ability to shift production to the manufacture of other products. The evidence indicatesthat U.S. producers have the ability to respond to changes in demand with moderate changes in supply,due primarily to ***. Industry capacity
U.S. integrated producers’ annual capacity utilization rates for certain coated paper ranged from93 to 96 percent in 2007 to 77 to 87 percent 2009; they ranged from 92 to 100 percent in the first half of2010.25 These levels of capacity utilization indicate that the U.S. integrated producers have limitedunused capacity with which they could increase production of certain coated paper in the event of a pricechange.
19 Petitioner’s posthearing brief, responses to questions from Commissioner Aranoff, exh. 2. Respondents’posthearing brief, exh. 2, p. 12.
20 Petitioner’s posthearing brief, responses to staff questions, exh. 4, p. 1.
21 Petitioner’s posthearing brief, responses to questions from Commissioner Aranoff, exh. 2, p. 2.
22 Respondents’ posthearing brief, exh. 2, p. 11.
23 Ibid., p. 12.
24 Petitioner’s posthearing brief, responses to questions from Commissioner Aranoff, exh. 2.
25 See part III for further information.
II-6

Alternative markets
U.S. integrated producers’ exports, as a share of their total shipments, *** from2007 to 2008 before decreasing in 2009. Exports of U.S. producers of certain coated paper other thancoated packaging paperboard were *** percent of their total shipments in 2007; *** percent in 2008; 7.3percent in 2009; and were *** percent in the first half of 2010. Exports of U.S. producers of coatedpackaging paperboard were *** percent of their total shipments in 2007; *** percent in 2008; *** percentin 2009; and were *** percent in the first half of 2010.26 These data indicate that the U.S. producers ofcertain coated paper other than packaging paperboard have *** capability to divert shipments to or fromalternative markets in response to changes in the price of certain coated paper, whereas the U.S. producersof coated packaging paperboard have *** to divert shipments to or from alternative markets in responseto changes in the price of coated packaging paperboard.
Inventory levels
For U.S. producers of certain coated paper other than coated packaging paperboard, the ratio ofend-of-period inventories to their total shipments increased from 23.3 percent in 2007 to 28.7 percent in2009 and were 25.2 percent in the first half of 2010. For U.S. producers of coated packaging paperboard,the ratio of end-of-period inventories to their total shipments *** from *** percent in 2007 to *** percentin 2009 and were *** percent in the first half of 2010. These data indicate that the U.S. producers ofcertain coated paper other than coated packaging paperboard have some ability to use inventories as ameans of increasing shipments of certain coated paper to the U.S. market and that U.S. producers ofcoated packaging paperboard *** ability to use inventories as a means of increasing shipments of certaincoated paper to the U.S. market.
Production alternatives
*** of the U.S. integrated producers and *** responding converters reported that they use thesame manufacturing equipment and the same workers used to make certain coated paper in the productionof other products, including uncoated free sheet paper, coated and uncoated groundwood paper, coatedpaper in web roll form, kraft paper, and market pulp.
Supply disruptions
*** U.S. integrated producers (***) reported having supply disruptions since 2007. *** reportedthat demand has outpaced its production since the ***. *** reported that there was a fiber shortage in the***. *** reported that it put customers of certain coated paper on allocation in *** and ***. ***reported that it ***. *** reported that it had supply disruptions ***. *** reported that ***, it was unableto meet all of its customers’ needs ***. *** reported that it had supply disruptions ***. *** also reportedthat it had supply disruptions ***. *** converters reported having supply disruptions since 2007.
*** of 32 responding purchasers reported that one or more suppliers of certain coated paper haverefused to supply them since 2007. Specifically, one purchaser cited U.S. integrated producer ***, statingthat it ***, resulting in extended delivery times of *** before returning to more “acceptable” times of ***in ***. One purchaser reported that U.S. integrated producers restrict their franchise distributorships byregional market and therefore it cannot purchase from ***. Purchaser (***) reported that U.S. integratedproducer ***. Also, in the preliminary phase of these investigations, purchaser *** reported that U.S.integrated producer *** put it on allocation for one of its products in ***.
26 See part III for further information.
II-7
One purchaser named U.S. integrated producers ***, but did not provide specific instances.
Subject Imports from China
The responsiveness of supply of imports from China to changes in price in the U.S. market isaffected by such factors as capacity utilization rates and the availability of home markets and other exportmarkets. Based on available information, producers in China have the capability to respond to changes indemand with moderate changes in the quantity of shipments of certain coated paper to the U.S. market.27 The main contributing factors to the moderate degree of responsiveness of supply are the existence ofalternative markets combined with relatively high capacity utilization rates.
Industry capacity
During the period for which data were collected, the capacity utilization rate for reportingproducers in China of certain coated paper increased from 90.7 percent in 2007 to 95.9 percent in 2009; itis projected to be 99.2 percent in 2010 and 99.3 percent in 2011.
Alternative markets
As shown in figure II-1, available data indicate that producers in China have some ability todivert shipments to or from alternative markets in response to changes in the price of certain coatedpaper. Specifically, the share of shipments by producers in China that went to the United Statesdecreased from 9.6 percent in 2007 to 9.3 percent in 2009; it is projected to be 1.0 percent in 2010 and 0.9percent in 2011. The share of shipments by producers in China to export markets other than the UnitedStates increased from 24.9 in 2007 to 29.1 percent in 2009; it is projected to be 35.2 percent in 2010 and29.8 percent in 2011. The share of shipments by producers in China going to the home market decreasedfrom 65.5 percent in 2007 to 61.5 percent in 2009; it is projected to be 63.7 percent in 2010 and 69.5 percent in 2011. The share of internal consumption by producers in China was zero in 2007 andincreased to 0.1 percent in 2009; it is projected to be virtually zero in 2010 and 2011.
27 The Commission received responses from 10 firms accounting for approximately *** percent of Chineseproduction of certain coated paper in 2009 and approximately *** percent of exports from China to the United Statesin that year.
II-8

0%
10%
20%
30%
40%
50%
60%
70%
80%
90%
100%
Per
cen
t o
f to
tal
ship
men
ts
Internal consumption 0.0 0.0 0.1 0.0 0.0
Shipments to home market 65.5 62.7 61.5 63.7 69.5
Exports to markets otherthan the United States
24.9 27.6 29.1 35.2 29.8
Exports to the United States 9.6 9.7 9.3 1.0 0.7
2007 2008 20092010--
projected2011--
projected
Figure II-1Certain coated paper: Shares of total shipments of certain coated paper by producers in China,by destination, 2007-09 and projected for 2010 and 2011
Source: Compiled from data submitted in response to Commission questionnaires.
Inventory levels
Inventories of responding producers in China, as a share of total shipments, increased from 3.6percent in 2007 to 7.9 percent in 2008 before decreasing to 3.6 percent in 2009; they are projected to be3.2 percent in 2010 and 2.7 percent in 2011.
Supply disruptions
*** importers of certain coated paper from China (***) reported ***. ***. Three purchasersreported that importers of product from both China and Indonesia have restricted supply due to theseinvestigations. One purchaser reported that importers of product from China suspended deliveries for onemonth in 2008 due to the investigation on coated free sheet paper. One purchaser reported that supply ofcertain coated paper was restricted from several suppliers for three to four months in early 2010 due to ashortage in pulp.
Subject Imports from Indonesia
The responsiveness of supply of imports from Indonesia to changes in price in the U.S. market isaffected by such factors as capacity utilization rates and the availability of home markets and other exportmarkets. Based on available information, producers in Indonesia have the capability to respond tochanges in demand with moderate to large changes in the quantity of shipments of certain coated paper to
II-9

the U.S. market. 28 The main contributing factors to this degree of responsiveness of supply are theexistence of unused capacity and alternative markets.
Industry capacity
During the period for which data were collected, the capacity utilization rate for reportingproducers in Indonesia of certain coated paper increased from *** percent in 2007 to *** percent in 2009;it is projected to be *** percent in 2010 and 2011.
Alternative markets
As shown in figure II-2, available data indicate that producers in Indonesia have some ability todivert shipments to or from alternative markets in response to changes in the price of certain coated paper. Specifically, the share of shipments by producers in Indonesia that went to the United States decreasedfrom *** percent in 2007 to *** percent in 2009; it is projected to be *** percent in 2010 and *** percentin 2011. The share of shipments by producers in Indonesia to export markets other than the United States increased from *** in 2007 to *** percent in 2009; it is projected to be *** percent in 2010and *** percent in 2011. The share of shipments by producers in Indonesia going to the home marketincreased slightly from *** percent in 2007 to *** percent in 2009; it is projected to be *** percent in2010 and *** percent in 2011. The share of internal consumption by producers in Indonesia decreasedslightly from *** percent in 2007 to *** percent in 2009; it is projected to be *** percent in 2010 and2011.
Figure II-2Certain coated paper: Shares of total shipments of certain coated paper by producers inIndonesia, by destination, 2007-09 and projected for 2010 and 2011
* * * * * * *
Inventory levels
Responding Indonesia producers’ inventories, as a share of total shipments, decreased from ***percent in 2007 to *** percent in 2009; they are projected to be *** percent in 2010 and 2011.
Supply disruptions
*** importer of certain coated paper from Indonesia (***) reported that it has restricted thesupply of certain products in the United States as a result of these investigations as well as theCommission’s 2007 investigation on coated free sheet paper when temporary antidumping duties wereput in place. Three purchasers reported that importers of product from both China and Indonesia haverestricted supply due to these investigations. One purchaser reported that supply of certain coated paperwas restricted from several suppliers for three to four months in early 2010 due to a pulp shortage.
28 The Commission received responses from three firms accounting for approximately *** percent of Indonesianproduction of certain coated paper in 2009 and approximately *** percent of exports from Indonesia to the UnitedStates in that year.
II-10

-8.0
-6.0
-4.0
-2.0
0.0
2.0
4.0
6.0
2007 2008 2009 2010
Per
cen
t ch
ang
e
Real GDP growth
Nonsubject Imports
Imports from nonsubject sources of certain coated paper, as a share of the quantity of total U.S.imports of certain coated paper, decreased from *** percent in 2007 to *** percent in 2009. Importsfrom nonsubject sources accounted for *** percent of the quantity of total imports in the first half of2010.29
Demand
The existence of substitutes for certain coated paper discussed below indicates that the demand for this product is likely to be relatively price elastic. The demand for certain coated paper is largelydetermined by the overall economy and demand for high-end commercially printed advertisements,reports, and brochures.30 Real GDP growth at seasonally adjusted annual rates is shown in figure II-3.31
As shown in figure II-4, commercial printing activity, as measured by RISI, began to decline in *** and decreased overall by *** percent from the first quarter of 2007 to the second quarter of 2010.32
Figure II-3Certain Coated Paper: Real GDP growth, January 2007-June 2010
Source: Bureau of Economic Analysis.
29 The largest sources of nonsubject imports include Canada, Germany, Finland, and Korea.
30 Petitioner’s postconference brief, p. 17.
31 U.S. Bureau of Economic Analysis. Gross Domestic Product, 2nd quarter 2010 (third estimate). September30, 2010.
32 RISI Commercial Printing Index, August 2010.
II-11
Figure II-4Certain Coated Paper: RISI commercial printing activity index, January 2007-June 2010
* * * * * * *Petitioner reported that demand for certain coated paper is expected to decline in 2011 and
2012.33 Specifically, petitioner cites RISI’s projections of a decline of *** percent in U.S. apparentconsumption from 2010 to 2011 and a further reduction of *** percent in 2012.34
When asked how the overall demand for certain coated paper has changed since January 2007, 10of 11 responding U.S. integrated producers reported that demand has decreased or fluctuated, citing therecession. More specifically, four integrated producers reported that demand decreased from the fourthquarter of 2008 and improved in the second half of 2009, one reported that demand was especially weekin 2009, and two integrated producers reported that demand was still weak into 2010. Four of fiveresponding converters reported that demand has decreased, citing the recession and the increase ofcompeting forms of advertisement; one converter reported that demand has not changed since 2007.
All nine responding importers reported that demand has decreased or fluctuated since 2007,mostly citing the recession.35 Two importers reported that demand in 2010 is stable or improving and oneimporter reported that demand is currently still weak but is expected to improve. Four importers reportedthat the recession caused a decline in prices, while one importer reported that the recession had no effecton prices.
Fifteen of 22 responding purchasers reported that demand has decreased since 2007, mostly citingthe recession.36 Four reported that demand had not changed, three reported that it had fluctuated, and onereported that it had increased. Some purchasers reported that demand decreased by 15 to 30 percentduring the recession.
Apparent U.S. consumption of certain coated paper other than coated packaging paperboard byquantity decreased by *** percent from 2007 to 2009 overall, decreasing by *** percent from 2007 to2008 before decreasing further by *** percent from 2008 to 2009; in the first half of 2010, it was ***percent above the first half of 2009. Apparent U.S. consumption of total certain coated paper by quantitydecreased by *** percent from 2007 to 2009 overall, decreasing by *** percent from 2007 to 2008 beforedecreasing further by *** percent from 2008 to 2009; in the first half of 2010, it was *** percent abovethe first half of 2009.
In the preliminary phase of these investigations, respondents stated that most of the decline indemand for certain coated paper in 2008 and 2009 is permanent, due to a structural shift of printedmaterials to on-line content.37 One converter, three importers, and one purchaser reported that they ortheir customers had switched from certain coated paper to electronic or on-line media.
In the preliminary phase of these investigations, respondents also stated that purchasers of certaincoated paper built up inventories during 2008 in order to hedge against further price increases and thatthese purchasers began to draw down inventories in the second half of 2008, resulting in reduced ordersin addition to the recessionary effect on demand.38 When asked how their level of inventories haschanged since 2007, 16 of 29 responding purchasers reported that their inventories of U.S. product have
33 Petitioner’s posthearing brief, p. 9.
34 Petitioner’s posthearing brief, responses to questions from Commissioner Pinkert, exh. 3. RISI Paper Trader,July 2010.
35 One importer also cited competing forms of advertisement, such as electronic media and the internet, for thedecrease in demand.
36 One purchaser also cited a shift toward electronic media for the decrease in demand.
37 Respondents’ postconference brief, pp. 14-15.
38 Respondents’ postconference brief, p. 28.
II-12

decreased, while 7 reported that they have not changed, and 6 reported that they have increased.39 Purchasers of imports from China and Indonesia did not respond to this question.40
Business Cycles
When asked if the certain coated paper market was subject to business cycles, four U.S.integrated producers and two converters reported that demand peaks in the third and fourth quarters leading up to the holiday season. Three integrated producers reported that there is also a peak in the firstquarter due to the printing of annual reports and spring fashion advertisements.41 Twelve of 28responding purchasers reported that the certain coated paper market was subject to business cycles, witheight specifically citing a peak in the fall and six citing a peak in the first quarter. Sixteen purchasersreported that a business cycle does not exist in the certain coated paper market.
In the preliminary phase of these investigations, respondents reported that there are seasonalpeaks in the spring and in the fall, but that the typical business cycle was disrupted in the second half of2008 and 2009 due to the recession.42
Substitute Products
Six U.S. integrated producers and two converters listed substitutes for certain coated paper, threeof which cited uncoated paper and one of which cited electronic media. Two producers and twoconverters cited solid bleached (or unbleached) sulfate paperboard or lightweight recycled paperboard asa substitute. One U.S. integrated producer noted that uncoated paper does not print with the same imageand color quality as certain coated paper. One integrated producer noted that electronic or on-line media,while not direct substitutes for certain coated paper, are viable alternatives to conventional print media. Three producers reported that the prices of alternative types of paper can affect the price of certain coatedpaper, with one citing a time lag of 3 to 6 months.
Five of nine responding importers reported substitutes for certain coated paper, with three citingcoated groundwood paper, three citing electronic or on-line media, three citing web rolls, and one citingsupercalendared groundwood paper. Three importers reported that the prices of substitutes can affect theprice of certain coated paper, stating that the prices of printing papers (excluding newspaper) tend tomove together. One of these importers noted that, due to the recession, consumers of the more costlycertain coated paper have switched to less costly groundwood paper. Two importers reported that theircustomers have switched from certain coated paper to electronic or on-line media and one importerreported switching to coated groundwood.
Twenty-two of 32 responding purchasers reported that there are no substitutes for certain coatedpaper. Ten purchasers cited possible substitutes, including uncoated free sheet paper, coated groundwoodpaper, and supercalendared paper. Three of these purchasers specifically cited electronic or on-line mediaas substitutes. One purchaser cited other forms as packaging as substitutes for paperboard, including
39 Three of these purchasers noted that their inventories had fluctuated and slightly increased overall.
40 Purchasers were also asked to provide their end-of-period inventories of certain coated paper from each source,but not all purchasers responded. Total end-of-period inventories of U.S. product reported by 19 of the 31responding purchasers of U.S. product *** by *** percent from 2007 to 2008 and *** by *** percent in 2009. Totalend-of-period inventories of imports from China reported by 10 of the 17 responding purchasers of imports fromChina *** by *** percent from 2007 to 2008 and *** by *** percent in 2009. Total end-of-period inventories ofimports from Indonesia reported by 3 of the 6 responding purchasers of imports from Indonesia *** by *** percentfrom 2007 to 2008 and *** by *** percent in 2009.
41 Another integrated producer reported that national elections and the Olympics may also affect demand.
42 Respondents also stated that, due to the lead times from China and Indonesia, imports are typically shipped inJanuary or February for the spring season. Conference transcript, p. 195 (Hunley).
II-13
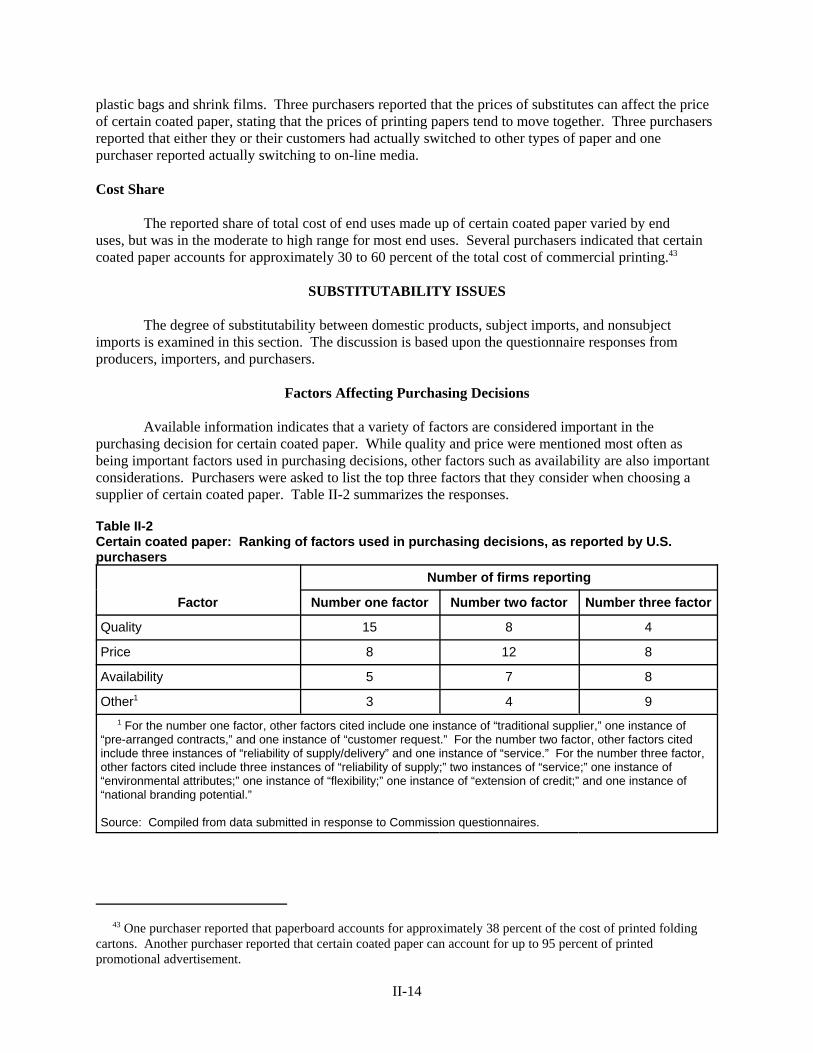
plastic bags and shrink films. Three purchasers reported that the prices of substitutes can affect the priceof certain coated paper, stating that the prices of printing papers tend to move together. Three purchasersreported that either they or their customers had actually switched to other types of paper and onepurchaser reported actually switching to on-line media.
Cost Share
The reported share of total cost of end uses made up of certain coated paper varied by end uses, but was in the moderate to high range for most end uses. Several purchasers indicated that certaincoated paper accounts for approximately 30 to 60 percent of the total cost of commercial printing.43
SUBSTITUTABILITY ISSUES
The degree of substitutability between domestic products, subject imports, and nonsubjectimports is examined in this section. The discussion is based upon the questionnaire responses fromproducers, importers, and purchasers.
Factors Affecting Purchasing Decisions
Available information indicates that a variety of factors are considered important in thepurchasing decision for certain coated paper. While quality and price were mentioned most often asbeing important factors used in purchasing decisions, other factors such as availability are also important considerations. Purchasers were asked to list the top three factors that they consider when choosing asupplier of certain coated paper. Table II-2 summarizes the responses.
Table II-2Certain coated paper: Ranking of factors used in purchasing decisions, as reported by U.S.purchasers
Factor
Number of firms reporting
Number one factor Number two factor Number three factor
Quality 15 8 4
Price 8 12 8
Availability 5 7 8
Other1 3 4 9
1 For the number one factor, other factors cited include one instance of “traditional supplier,” one instance of“pre-arranged contracts,” and one instance of “customer request.” For the number two factor, other factors citedinclude three instances of “reliability of supply/delivery” and one instance of “service.” For the number three factor,other factors cited include three instances of “reliability of supply;” two instances of “service;” one instance of“environmental attributes;” one instance of “flexibility;” one instance of “extension of credit;” and one instance of“national branding potential.” Source: Compiled from data submitted in response to Commission questionnaires.
43 One purchaser reported that paperboard accounts for approximately 38 percent of the cost of printed foldingcartons. Another purchaser reported that certain coated paper can account for up to 95 percent of printedpromotional advertisement.
II-14

Quality was named by 15 of 27 purchasers as the number one factor generally considered indeciding from whom to purchase certain coated paper, while 8 purchasers indicated that it was thenumber two factor, and 4 reported that it was the number three factor. As indicated in table II-3, a largemajority of responding purchasers indicated that product consistency and quality meeting industrystandards were “very important” factors in their purchasing decisions.
Price was named by 8 purchasers as the number one factor generally considered in deciding fromwhom to purchase certain coated paper, while 12 purchasers indicated that it was the number two factor,and 8 purchasers responded that it was the number three factor. As indicated in table II-3, 29 of 32 responding purchasers indicated that price was a “very important” factor in their purchasing decisions. When asked how often they purchase the certain coated paper that is offered at the lowest price, 15 of 31 responding purchasers reported “sometimes,” 12 reported “usually,” 3 reported “never,” and 1 purchaserreported “always.”44
When purchasers were asked if they had purchased from one source although comparable certaincoated paper were available from another source at a lower price, 25 of 31 responding purchasers reportedthat they had done so, mostly citing lead and delivery times, availability, reliability of supply, paper millproximity, franchise relationship with supplier, minimum order requirements, past relationship with thesupplier, and service.
Availability was named by five purchasers as the number one factor generally considered indeciding from whom to purchase certain coated paper, while seven indicated that it was the number twofactor, and eight purchasers reported that it was the number three factor. As indicated in table II-3, 30 of32 responding purchasers indicated that availability and reliability of supply were “very important”factors in their purchasing decisions.
When asked if buying certain coated paper that is produced in the United States was an importantfactor in their purchasing decisions, 19 of 32 responding purchasers responded “yes,” with two citingshorter lead times from U.S. paper mills, one citing customer requiring use of environmentally-friendly(or Forest Steward Council-certified paper), and one citing product range and laws or regulationsrequiring the purchase of domestic product.45 Eight of 31 responding purchasers reported buying onlyU.S.-produced certain coated paper since 2007, mostly citing reasons such as shorter lead times,convenience, quality, traditional relationship, availability, and freedom from carrying inventories due toshort delivery times.
Fourteen of 32 responding purchasers reported that they require suppliers to become certified for all or some of their purchases.46 When purchasers were asked what factors they consider when qualifyinga new supplier, purchasers most often cited product quality and consistency, reliability, service, supplychain management, environmental record or certifications, lead time, product range, volume capacity, andprice. Certifications consist of lab testing for quality and consistency and reportedly take from *** to ***to complete. Six purchasers reported that a supplier had failed in its attempt to qualify product with them. Two of these purchasers cited U.S. product (with one citing poor quality) and two purchasers citedsuppliers of imports from China47 due to inconsistent quality, poor service, long lead times, and poorenvironmental record.
44 One purchaser reported that it “usually” purchases certain coated paper that is offered at the lowest price whenpurchasing for commercial printers, but that it “sometimes” does so when purchasing for end users.
45 Of those purchasers that reported the share of total purchases that were affected by preferences to purchaseU.S.-produced product, six reported that such preferences affect 10 percent or less of their purchases, while four reported that they affect 25 to 40 percent, and two reported that they affect 60 to 80 percent of their purchases.
46 Twelve of these purchasers reported that they require suppliers to be certified for all of their purchases.
47 One of these purchasers named importer ***.
II-15
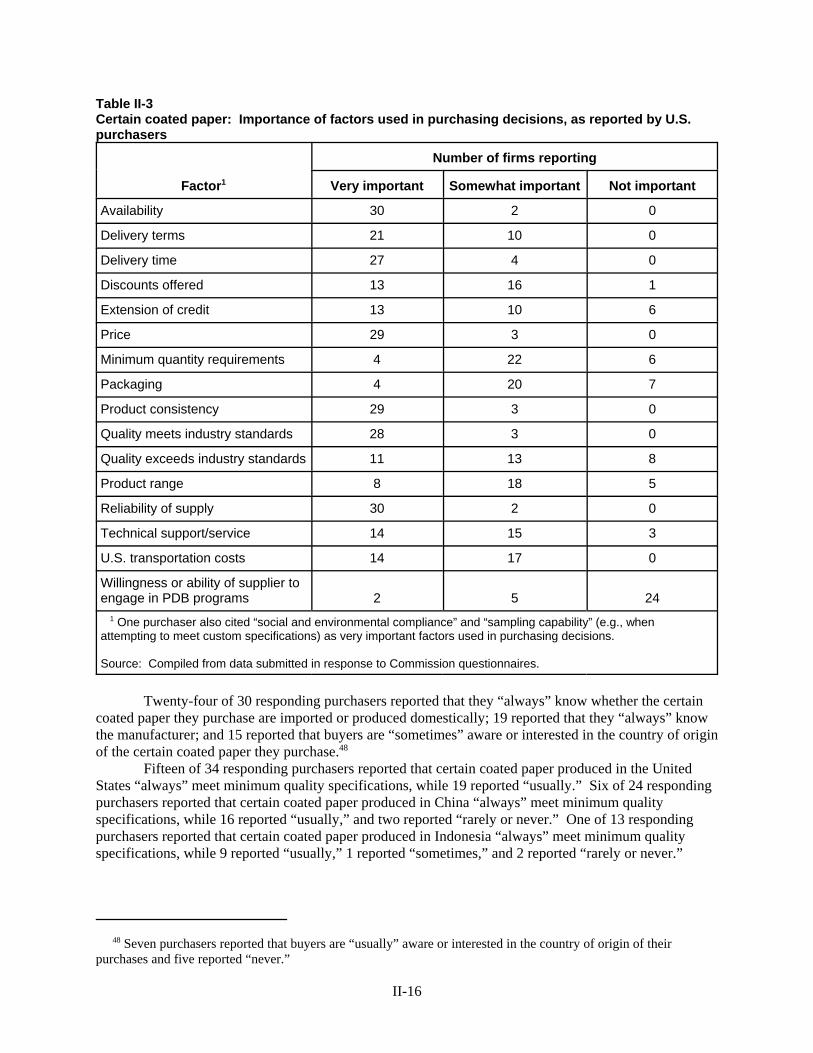
Table II-3Certain coated paper: Importance of factors used in purchasing decisions, as reported by U.S.purchasers
Factor1
Number of firms reporting
Very important Somewhat important Not important
Availability 30 2 0
Delivery terms 21 10 0
Delivery time 27 4 0
Discounts offered 13 16 1
Extension of credit 13 10 6
Price 29 3 0
Minimum quantity requirements 4 22 6
Packaging 4 20 7
Product consistency 29 3 0
Quality meets industry standards 28 3 0
Quality exceeds industry standards 11 13 8
Product range 8 18 5
Reliability of supply 30 2 0
Technical support/service 14 15 3
U.S. transportation costs 14 17 0
Willingness or ability of supplier toengage in PDB programs 2 5 24
1 One purchaser also cited “social and environmental compliance” and “sampling capability” (e.g., whenattempting to meet custom specifications) as very important factors used in purchasing decisions.
Source: Compiled from data submitted in response to Commission questionnaires.
Twenty-four of 30 responding purchasers reported that they “always” know whether the certain
coated paper they purchase are imported or produced domestically; 19 reported that they “always” knowthe manufacturer; and 15 reported that buyers are “sometimes” aware or interested in the country of originof the certain coated paper they purchase.48
Fifteen of 34 responding purchasers reported that certain coated paper produced in the UnitedStates “always” meet minimum quality specifications, while 19 reported “usually.” Six of 24 respondingpurchasers reported that certain coated paper produced in China “always” meet minimum qualityspecifications, while 16 reported “usually,” and two reported “rarely or never.” One of 13 respondingpurchasers reported that certain coated paper produced in Indonesia “always” meet minimum qualityspecifications, while 9 reported “usually,” 1 reported “sometimes,” and 2 reported “rarely or never.”
48 Seven purchasers reported that buyers are “usually” aware or interested in the country of origin of theirpurchases and five reported “never.”
II-16
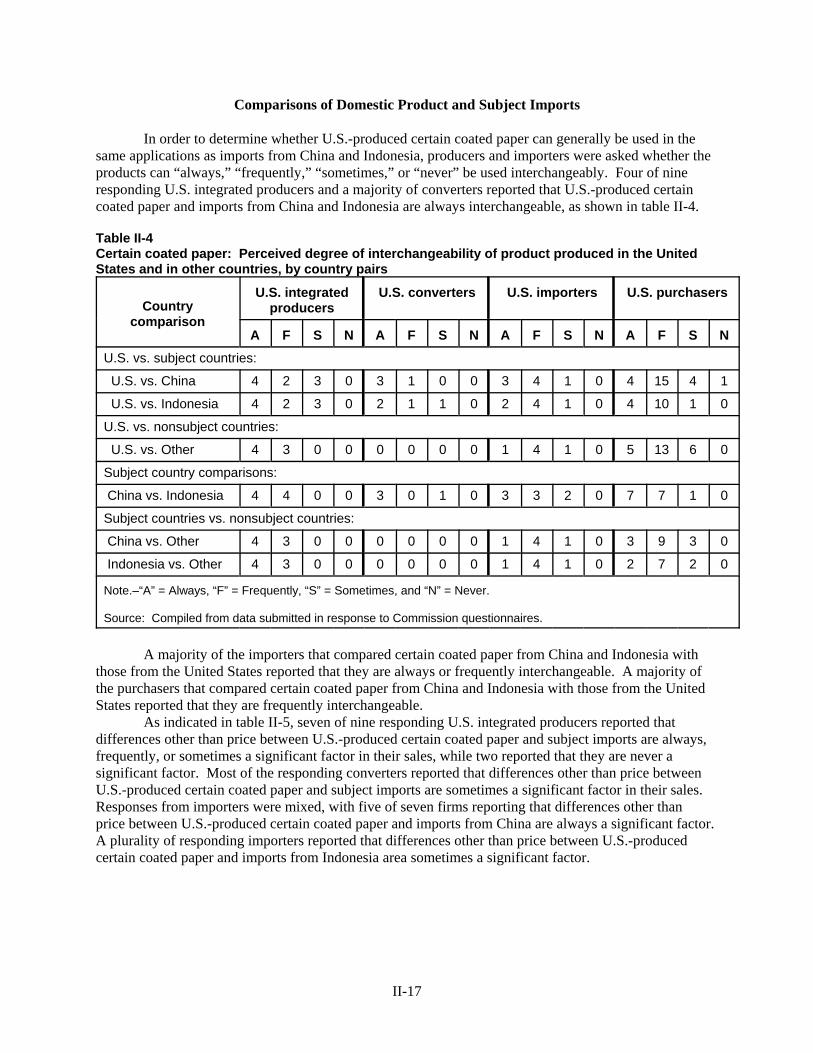
Comparisons of Domestic Product and Subject Imports
In order to determine whether U.S.-produced certain coated paper can generally be used in thesame applications as imports from China and Indonesia, producers and importers were asked whether theproducts can “always,” “frequently,” “sometimes,” or “never” be used interchangeably. Four of nineresponding U.S. integrated producers and a majority of converters reported that U.S.-produced certaincoated paper and imports from China and Indonesia are always interchangeable, as shown in table II-4.
Table II-4Certain coated paper: Perceived degree of interchangeability of product produced in the UnitedStates and in other countries, by country pairs
Countrycomparison
U.S. integratedproducers
U.S. converters U.S. importers U.S. purchasers
A F S N A F S N A F S N A F S N
U.S. vs. subject countries:
U.S. vs. China 4 2 3 0 3 1 0 0 3 4 1 0 4 15 4 1
U.S. vs. Indonesia 4 2 3 0 2 1 1 0 2 4 1 0 4 10 1 0
U.S. vs. nonsubject countries:
U.S. vs. Other 4 3 0 0 0 0 0 0 1 4 1 0 5 13 6 0
Subject country comparisons:
China vs. Indonesia 4 4 0 0 3 0 1 0 3 3 2 0 7 7 1 0
Subject countries vs. nonsubject countries:
China vs. Other 4 3 0 0 0 0 0 0 1 4 1 0 3 9 3 0
Indonesia vs. Other 4 3 0 0 0 0 0 0 1 4 1 0 2 7 2 0
Note.–“A” = Always, “F” = Frequently, “S” = Sometimes, and “N” = Never.
Source: Compiled from data submitted in response to Commission questionnaires.
A majority of the importers that compared certain coated paper from China and Indonesia withthose from the United States reported that they are always or frequently interchangeable. A majority ofthe purchasers that compared certain coated paper from China and Indonesia with those from the UnitedStates reported that they are frequently interchangeable.
As indicated in table II-5, seven of nine responding U.S. integrated producers reported thatdifferences other than price between U.S.-produced certain coated paper and subject imports are always,frequently, or sometimes a significant factor in their sales, while two reported that they are never asignificant factor. Most of the responding converters reported that differences other than price betweenU.S.-produced certain coated paper and subject imports are sometimes a significant factor in their sales. Responses from importers were mixed, with five of seven firms reporting that differences other than price between U.S.-produced certain coated paper and imports from China are always a significant factor. A plurality of responding importers reported that differences other than price between U.S.-producedcertain coated paper and imports from Indonesia area sometimes a significant factor.
II-17
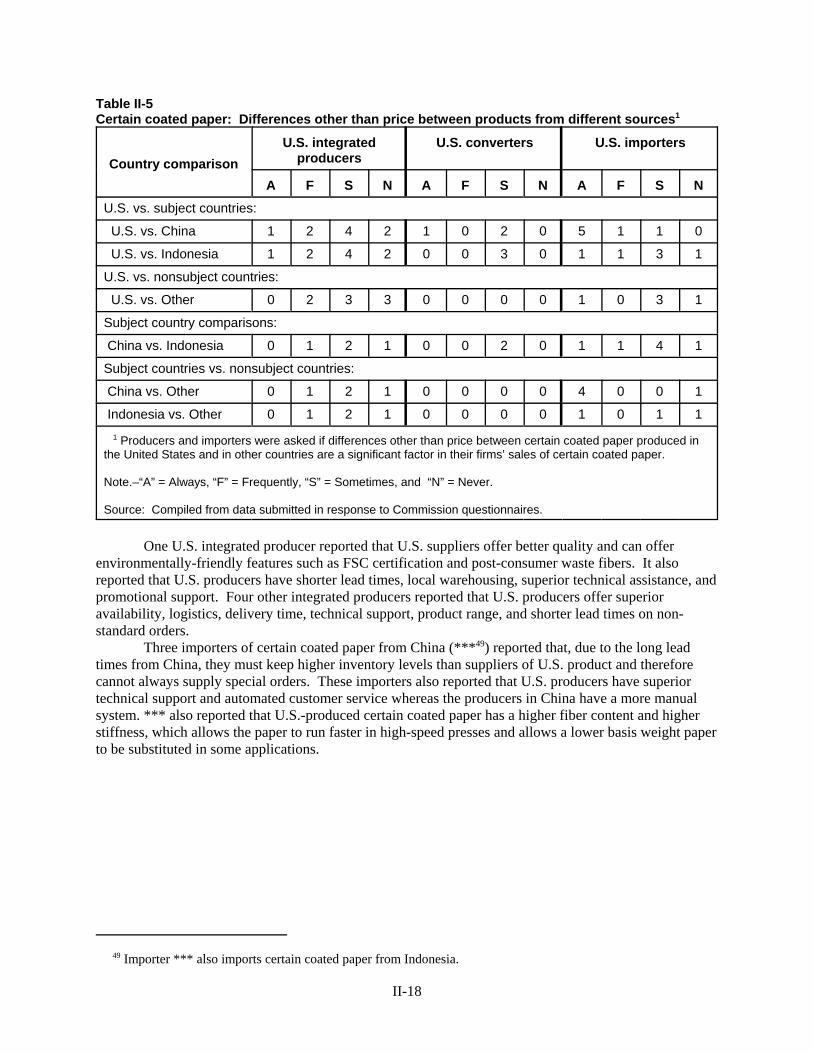
Table II-5Certain coated paper: Differences other than price between products from different sources1
Country comparison
U.S. integratedproducers
U.S. converters U.S. importers
A F S N A F S N A F S N
U.S. vs. subject countries:
U.S. vs. China 1 2 4 2 1 0 2 0 5 1 1 0
U.S. vs. Indonesia 1 2 4 2 0 0 3 0 1 1 3 1
U.S. vs. nonsubject countries:
U.S. vs. Other 0 2 3 3 0 0 0 0 1 0 3 1
Subject country comparisons:
China vs. Indonesia 0 1 2 1 0 0 2 0 1 1 4 1
Subject countries vs. nonsubject countries:
China vs. Other 0 1 2 1 0 0 0 0 4 0 0 1
Indonesia vs. Other 0 1 2 1 0 0 0 0 1 0 1 1
1 Producers and importers were asked if differences other than price between certain coated paper produced inthe United States and in other countries are a significant factor in their firms’ sales of certain coated paper.
Note.–“A” = Always, “F” = Frequently, “S” = Sometimes, and “N” = Never.
Source: Compiled from data submitted in response to Commission questionnaires.
One U.S. integrated producer reported that U.S. suppliers offer better quality and can offerenvironmentally-friendly features such as FSC certification and post-consumer waste fibers. It alsoreported that U.S. producers have shorter lead times, local warehousing, superior technical assistance, andpromotional support. Four other integrated producers reported that U.S. producers offer superioravailability, logistics, delivery time, technical support, product range, and shorter lead times on non-standard orders.
Three importers of certain coated paper from China (***49) reported that, due to the long leadtimes from China, they must keep higher inventory levels than suppliers of U.S. product and thereforecannot always supply special orders. These importers also reported that U.S. producers have superiortechnical support and automated customer service whereas the producers in China have a more manualsystem. *** also reported that U.S.-produced certain coated paper has a higher fiber content and higherstiffness, which allows the paper to run faster in high-speed presses and allows a lower basis weight paperto be substituted in some applications.
49 Importer *** also imports certain coated paper from Indonesia.
II-18

Respondents contend that import suppliers APP, Eagle Ridge, and GPS cannot obtain the FSCcertification, which has resulted in lost sales.50 Respondents also reported that it is difficult for othersubject producers to obtain FSC certification.51
When asked if there had been any significant changes in product range or marketing of certaincoated paper since 2007, one U.S. integrated producer reported that the availability of environmentally-friendly features (e.g., recycled fiber content, green power, certifications) has increased and anotherreported the emergence of private label brands.
Three of 35 responding purchasers reported that there were certain grades, sizes, or types ofcertain coated paper that are only available from a single source, with one citing ***; another citing ***;and one citing ***.
As indicated in table II-6, for the factors that nearly all purchasers reported were “very important”factors used in purchasing decisions (see table II-3), most purchasers reported that the U.S. product issuperior to the product from both China and Indonesia with respect to availability, delivery time, delivery terms, reliability of supply, and technical support/service. Most purchasers reported that the U.S. product is comparable to the product from both China and Indonesia with respect to product consistency and quality meeting or exceeding industry standards. Alternatively, most purchasers reported that U.S. product is inferior to the product from both China and Indonesia with respect to price.
Other Country Comparisons
In addition to comparisons between the U.S. product and imports from the subject country, U.S.producer and importer comparisons between the United States and imports from nonsubject countries andbetween subject imports and nonsubject imports are also shown in tables II-4 and II-5. A majority of U.S.integrated producers, converters, and importers reported that U.S. product and imports from subjectcountries are always or frequently interchangeable with imports from nonsubject countries.
50 APP reported that it has had its FSC certification publicly revoked and will not be able to regain it because theFSC has “disassociated” itself from APP. Respondents’ posthearing brief, exh. 1, pp. 6 and 68. Respondents alsostate that environmental organizations have specifically encouraged purchasers not to purchase certain coated paperfrom APP. Respondents’ prehearing brief, pp. 149-151.
51 Respondents concede that while FSC-certified pulp can be purchased by subject producers, 80 percent of allFSC-certified forests are in North America and Europe, whereas only 3 percent are in Asia. They also maintain thatplantations established after 1994 cannot apply for FSC certification. Respondents’ posthearing brief, exh. 1, pp. 6-7and pp. 67-68.
II-19
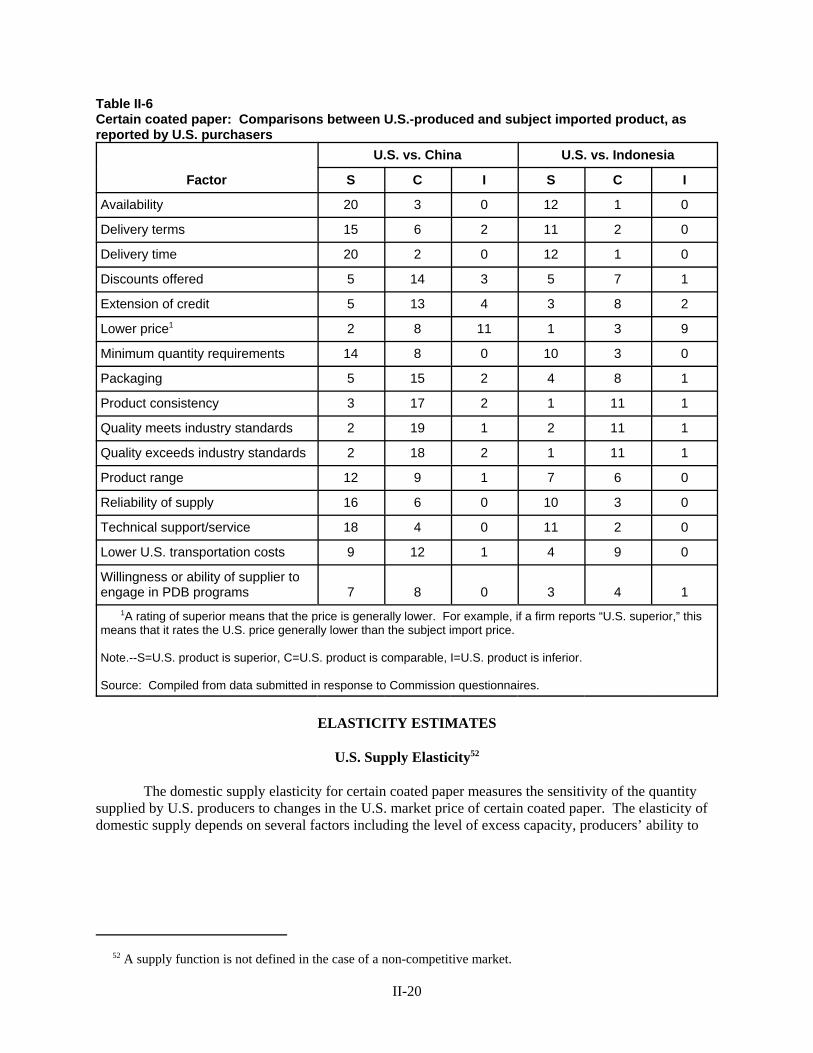
Table II-6Certain coated paper: Comparisons between U.S.-produced and subject imported product, asreported by U.S. purchasers
Factor
U.S. vs. China U.S. vs. Indonesia
S C I S C I
Availability 20 3 0 12 1 0
Delivery terms 15 6 2 11 2 0
Delivery time 20 2 0 12 1 0
Discounts offered 5 14 3 5 7 1
Extension of credit 5 13 4 3 8 2
Lower price1 2 8 11 1 3 9
Minimum quantity requirements 14 8 0 10 3 0
Packaging 5 15 2 4 8 1
Product consistency 3 17 2 1 11 1
Quality meets industry standards 2 19 1 2 11 1
Quality exceeds industry standards 2 18 2 1 11 1
Product range 12 9 1 7 6 0
Reliability of supply 16 6 0 10 3 0
Technical support/service 18 4 0 11 2 0
Lower U.S. transportation costs 9 12 1 4 9 0
Willingness or ability of supplier toengage in PDB programs 7 8 0 3 4 1
1A rating of superior means that the price is generally lower. For example, if a firm reports “U.S. superior,” thismeans that it rates the U.S. price generally lower than the subject import price.
Note.--S=U.S. product is superior, C=U.S. product is comparable, I=U.S. product is inferior.
Source: Compiled from data submitted in response to Commission questionnaires.
ELASTICITY ESTIMATES
U.S. Supply Elasticity52
The domestic supply elasticity for certain coated paper measures the sensitivity of the quantitysupplied by U.S. producers to changes in the U.S. market price of certain coated paper. The elasticity ofdomestic supply depends on several factors including the level of excess capacity, producers’ ability to
52 A supply function is not defined in the case of a non-competitive market.
II-20
shift to production of other products, the existence of inventories, and the availability of alternate marketsfor U.S.-produced certain coated paper. Analysis of these factors above indicates that U.S. producershave some ability to increase or decrease shipments to the U.S. market; an estimate in the range of 2 to 4is suggested.
U.S. Demand Elasticity
The U.S. demand elasticity for certain coated paper measures the sensitivity of the overallquantity demanded to a change in the U.S. market price of certain coated paper. This estimate depends onfactors discussed above such as the existence, availability, and commercial viability of substitute productsand the component share of certain coated paper in the production of downstream products. Based on theavailable information, the aggregate demand elasticity for certain coated paper is likely to be in the rangeof -0.75 to -1.25.
Substitution Elasticity53
The elasticity of substitution depends upon the extent of product differentiation between the
domestic and imported products. Product differentiation, in turn, depends upon such factors as qualityand conditions of sale (availability, sales terms/discounts, etc.). Based on available information, theelasticity of substitution between U.S.-produced certain coated paper and imports from China andIndonesia is likely to be in the range of 3 to 5.54
53 The substitution elasticity measures the responsiveness of the relative U.S. consumption levels of the subjectimports and the domestic like products to changes in their relative prices. This reflects how easily purchasers switchfrom the U.S. product to the subject products (or vice versa) when prices change.
54 Petitioners contend that staff’s substitution elasticity estimate is too low and proposes an estimate in the rangeof 5 to 8. Staff maintains its moderately high estimate of 3 to 5 because, as shown in table II-6, a majority ofresponding purchasers ranked U.S. producer superior to subject imports with respect to several factors such asavailability, deliver terms, delivery time, minimum quantity requirements, reliability of supply, and technicalsupport/service.
II-21


PART III: U.S. PRODUCERS’ PRODUCTION, SHIPMENTS, ANDEMPLOYMENT
Information presented in this section of the report is based on (except as noted) the questionnaireresponses of eleven integrated producers1 which are believed to account for the vast majority of U.S.production of certain coated paper in 2009 and seven U.S. converters, which are estimated to account forless than *** percent2 of U.S. conversion activities in 2008.
U.S. PRODUCERS
The Commission sent producers’ questionnaires to 15 firms identified by the parties as potentialU.S. integrated producers of certain coated paper and 107 firms identified by the parties as potential U.S.converters.3 Eleven firms submitted responses reporting that they engaged in U.S. integrated production.4 Seven firms submitted responses reporting that they engaged in U.S. converting activities. Throughoutthis section of the report, data regarding U.S. integrated producers will be subdivided into threecategories: (1) U.S. producers of certain coated paper other than coated packaging paperboard, (2) U.S.producers of coated packaging paperboard, and (3) a total of categories (1) and (2). Separate sections willalso be provided for data regarding U.S. converters. Brief descriptions of the categories of U.S. producersfollow.
U.S. Producers of Certain Coated Paper Other Than Coated Packaging Paperboard
Nine of the eleven U.S. integrated producers reported manufacturing certain coated paperproducts used in the commercial printing industry. These firms include: (1) Appleton, (2) Cascades, (3)Clearwater, (4) International Paper, (5) MeadWestvaco, (6) Mohawk, (7) NewPage, (8) Sappi, and (9)Smart.5 A number of these firms produce text grades of coated free sheet paper and/or coatedgroundwood paper produced from bleached chemi-thermo-mechanical pulp. A number of these firmsalso produce what is generally referred to in the industry as “paperboard” that is considered by bothparties to be within the scope of these investigations. These products include those that are: (1) used inthe commercial printing industry as “covers” or cover stock and (2) paperboard products produced byfirms that traditionally serve the packaging market but do compete in the commercial printing industry.
1 The term “integrated” producers is used to distinguish those producers who produce sheeter rolls from U.S.converters, which process sheeter rolls into sheet, and is not used to indicate the level of vertical integration of thoseproducers.
2 In the final phase of these investigations, the Commission did not request that U.S. producers break out theirU.S. shipments of sheeter rolls. In the preliminary phase of these investigations, U.S. integrated producers reported*** short tons of U.S. commercial shipments to converters in 2008. U.S. converters which submitted responses tothe Commission’s questionnaire in the preliminary phase reported production of *** short tons in 2008, or ***percent of total U.S. commercial shipments of sheeter rolls.
3 Petitioners identified 5 firms that they believed accounted for all U.S. integrated production of certain coatedpaper other than coated packaging paperboard. Respondents submitted an expanded list of potential U.S. integratedproducers that included an additional 10 potential U.S. producers of coated packaging paperboard.
4 In addition to the eleven responding firms listed in table III-1, two firms, ***, reported that they did not producecertain coated paper. One firm, ***, stated that it commenced production of a small volume (*** short tons) ofcertain coated paper in ***, but did not submit a questionnaire response. One firm, ***, did not respond to theCommission’s questionnaire.
5 Petitioners argued that these firms represent all the U.S. production of in-scope product. Petitioners’posthearing brief, “Questions from the Commissioners,” exh. 3.
III-1

Petitioners produce commercial printing cover stock and service the commercial printing industry. Cascade, Clearwater, International Paper, and MeadWestvaco produce coated paperboard products thatserve both the commercial printing and packaging industries.6
U.S. Producers of Coated Packaging Paperboard
On September 7, 2010, the Commission requested U.S. producer data from a number of firmsthought to produce coated packaging paperboard.7 Four firms, (1) Clearwater, (2) Georgia-Pacific, (3)MeadWestvaco, and (4) Rock-Tenn provided U.S. industry data regarding coated packaging paperboard.8 Only two firms, ***, reported producing coated paperboard for both the commercial printing and thepackaging industries.9 Petitioners reported that they ***.10
U.S. Converters
During the preliminary phase of these investigations, petitioners contended that U.S. firms thatprocess sheeter rolls into certain coated paper should be part of the U.S. industry.11 Respondents did not
6 According to petitioners, U.S. firms that traditionally have served the packaging market, yet still producepaperboard products that compete in the commercial printing industry and that they deem to be within the scope ofthese investigations include: Cascade, Clearwater, International Paper, and MeadWestvaco. Petitioners’ posthearingbrief, “Questions from the Commissioners,” exh. 3, pp. 1-2 and 6 (Scenario 2A is petitioners compilation of data forpaperboard produced by these firms that they deem within the scope).
7 The Commission requested U.S. producer data from the following U.S. integrated producers: (1) Cascades, (2)Clearwater, (3) Georgia-Pacific, (4) Graphic Packaging, (5) International Paper, (6) Rock-Tenn, and (7)MeadWestvaco. The Commission requested data pertaining to products that meet the physical specifications listedin the scope (GE brightness, basis weight, and in sheet form) regardless of end use, specifically requestinginformation regarding coated packaging paperboard in sheet form that meet the physical specifications listed in thescope.
In response, Clearwater and MeadWestvaco revised their submitted trade and financial data to includeproduct sold to the packaging industry. Georgia-Pacific, which had originally responded that it did not producecertain coated paper, submitted a U.S. producer questionnaire containing information regarding its production ofcoated packaging paperboard. International Paper, which originally had not responded to the Commission’squestionnaire request, subsequently, submitted information regarding its operations on coated paperboard forcommercial printing applications. Rock-Tenn, which originally had not responded to the Commission’squestionnaire request, subsequently, submitted information regarding its coated packaging paperboard operations. Cascades confirmed its original questionnaire response as correct. Graphic Packaging verified that it did notproduce coated packaging paperboard in sheet form.
8 Respondents contended that coated packaging paperboard is covered by the scope of these investigations, andtherefore, the Commission consider them part of the U.S. industry. Respondents’ posthearing brief, exhs. 8 and 23.
9 Both Clearwater and MeadWestvaco provided the Commission with an original U.S. producer questionnairesubmission, which contained data regarding their commercial printing products, and then a revised September 22,2010 submission which contained data regarding both commercial printing and coated packaging paperboardproducts. Therefore, each firms’ U.S. industry data was capable of being subdivided by end use application.
10 Petitioners’ posthearing brief, “Questions from Commissioners,” exh. 2, p. 1.
11 In the preliminary phase, petitioners stated that they believed U.S. converters should be considered part of theU.S. industry. Petitioners’ postconference brief, “Answers to Staff Questions,” exh. 9, p. 1. In the final phase,petitioners did not object to the U.S. converters being part of the domestic industry. Petitioners’ prehearing brief, p.9.
III-2
object to these firms being included in the U.S. industry.12 In its preliminary views, the Commissiondetermined that U.S. converters did engage in sufficient production related activities to be included in thedomestic industry.13 Therefore, the Commission sent producers’ questionnaires to 107 companiesbelieved to be potential U.S. converters of certain coated paper that were identified by the parties. Sevenfirms submitted responses.14 The data submitted by U.S. converters are included in the U.S. employmentdata as well as in the financial data set forth in Part VI of this report. The data submitted by U.S.converters are not included in U.S. shipment and U.S. apparent consumption data as this would result inthe double-counting of U.S. shipments, once as U.S. shipments of sheeter rolls from the U.S. integratedproducers to the U.S. converters and then again as U.S. shipments of sheets from U.S. converters to theircustomers.
Table III-1 presents the list of reporting U.S. integrated producers and converters with eachcompany’s U.S. production location, share of reported U.S. integrated or converting production in 2009,and position on the petition.
12 Respondents did not take a definitive position, but indicated that the effects of the inclusion of U.S. converterswould be immaterial on the industry data given their relatively small size in the market. Conference transcript, p.190 (Porter).
13 The Commission stated in its preliminary views: “Although it is a close question and the record has not beenfully developed as to all factors, and absent argument to the contrary, we find that converters engage in sufficientproduction related activities to be included in the domestic industry.” Certain Coated Paper Suitable for High-Quality Print Graphics Using Sheet-Fed Presses from China and Indonesia, Inv. Nos. 701-TA-470-471 and 731-TA-1169-1170 (Preliminary), USITC Publication 4108, November 2009, p. 12.
14 The Commission’s questionnaire mailing list consisted of 210 firms (15 potential U.S. integrated producers,107 potential U.S. converters, and 88 potential U.S. importers). All these firms received U.S. producer’s and U.S.importer’s questionnaires.
Four firms, ***, reported that they engaged exclusively in toll converting activities. ***. Data regardingtoller production activities are neither included in the trade section of part III of this report nor the apparentconsumption section of Part IV because these activities are reported by questionnaire responses of the tollees.
The following 24 firms reported that they did not produce or convert certain coated paper: ***.
III-3

Table III-1Certain coated paper: U.S. integrated producers and converters, U.S. production locations, sharesof U.S. production in 2009, and positions on the petition
Firm Production location
Share ofreported
production(percent)
Position on the petition
China Indonesia
U.S. integrated producers of–
Certain coated paper other than coated packaging paperboard
Appleton1 Combined Locks, WI *** Petitioner Petitioner
Cascades2 Versailles, CT *** *** ***
Clearwater Lewiston, IDCypress Bend, AR
*** *** ***
MeadWestvaco Richmond, VA *** *** ***
International Paper Memphis, TNFranklin, VA
*** *** ***
Mohawk Cohoes, NYHamilton, OHAshtabula, OH
*** *** ***
NewPage3 Escanaba, MILuke, MDRumford, MEWickliffe, KYWisconsin Rapids, WI
*** Petitioner Petitioner
Sappi4 Cloquet, MNSkowhegan, MEAllentown, PA
*** Petitioner Petitioner
Smart5 Hamilton, OH *** *** ***
Coated packaging paperboard
Clearwater Lewiston, IDCypress Bend, AR
*** *** ***
Georgia-Pacific6 Atlanta, GA *** *** ***
MeadWestvaco Richmond, VA *** *** ***
Rock-Tenn7 Demopolis, ALBattle Creek, MISt. Paul, MNSheldon Springs, VTDelaware Water, PADallas, TX
*** *** ***
Table continued on next page.
III-4

Table III-1--ContinuedCertain coated paper: U.S. integrated producers and converters, U.S. production locations,shares of U.S. production in 2009, and positions on the petition
Firm Production location
Share ofreported
production(percent)
Position on the petition
China Indonesia
U.S. converters
Case Harrison, NY(8)
*** ***
Clampitt Dallas, TX *** *** ***
National Converting Ennis, TX(9)
*** ***
Nekoosa Nekoosa, WI *** *** ***
Resource One Little Chute, WI(10)
*** ***
Wausau Mosinee, WI *** *** ***
Williams St. Louis, MO *** *** ***
1 ***. 2 ***. 3 ***. 4 ***. 5 ***. 6 ***. 7 ***. 8 ***. 9 ***. 10 ***.
Source: Compiled from data submitted in response to Commission questionnaires.
U.S. CAPACITY, PRODUCTION, AND CAPACITY UTILIZATION
Overall U.S. Capacity of All U.S. Integrated Producers
All the U.S. integrated producers reported producing other products using the samemanufacturing equipment and/or production employees that were used to produce certain coated paper. Table III-2 presents data for the entire period of investigation for capacity, production, and capacityutilization for all products.15 Table III-3 presents 2009 data for overall capacity as well as production byproduct category and by firm.
15 The out-of-scope paper products include web rolls, coated groundwood paper, uncoated freesheet, uncoatedgroundwood, some packaging paperboard, kraft paper, and market pulp.
III-5
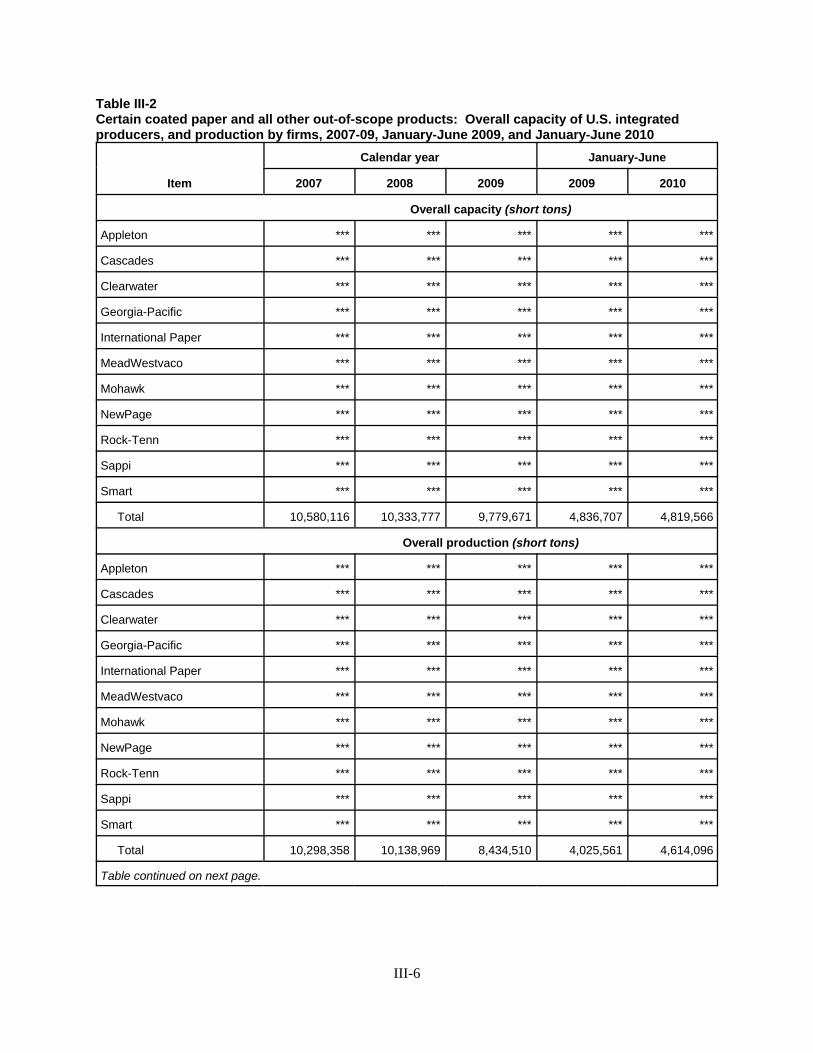
Table III-2Certain coated paper and all other out-of-scope products: Overall capacity of U.S. integratedproducers, and production by firms, 2007-09, January-June 2009, and January-June 2010
Item
Calendar year January-June
2007 2008 2009 2009 2010
Overall capacity (short tons)
Appleton *** *** *** *** ***
Cascades *** *** *** *** ***
Clearwater *** *** *** *** ***
Georgia-Pacific *** *** *** *** ***
International Paper *** *** *** *** ***
MeadWestvaco *** *** *** *** ***
Mohawk *** *** *** *** ***
NewPage *** *** *** *** ***
Rock-Tenn *** *** *** *** ***
Sappi *** *** *** *** ***
Smart *** *** *** *** ***
Total 10,580,116 10,333,777 9,779,671 4,836,707 4,819,566
Overall production (short tons)
Appleton *** *** *** *** ***
Cascades *** *** *** *** ***
Clearwater *** *** *** *** ***
Georgia-Pacific *** *** *** *** ***
International Paper *** *** *** *** ***
MeadWestvaco *** *** *** *** ***
Mohawk *** *** *** *** ***
NewPage *** *** *** *** ***
Rock-Tenn *** *** *** *** ***
Sappi *** *** *** *** ***
Smart *** *** *** *** ***
Total 10,298,358 10,138,969 8,434,510 4,025,561 4,614,096
Table continued on next page.
III-6

Table III-2--ContinuedCertain coated paper and all other out-of-scope products: Overall capacity of U.S. integratedproducers, and production by firms, 2007-09, January-June 2009, and January-June 2010
Item
Calendar year January-June
2007 2008 2009 2009 2010
Overall capacity utilization (percent)
Appleton *** *** *** *** ***
Cascades *** *** *** *** ***
Clearwater *** *** *** *** ***
Georgia-Pacific *** *** *** *** ***
International Paper *** *** *** *** ***
MeadWestvaco *** *** *** *** ***
Mohawk *** *** *** *** ***
NewPage *** *** *** *** ***
Rock-Tenn *** *** *** *** ***
Sappi *** *** *** *** ***
Smart *** *** *** *** ***
Average 97.3 98.1 86.2 83.2 95.7
Source: Compiled from data submitted in response to Commission questionnaires.
Table III-3Certain coated paper and other products: Overall capacity of U.S. integrated producers, andproduction by firms and products, 2009
* * * * * * *
U.S. Integrated Producers
Certain Coated Paper Other Than Coated Packaging Paperboard
Four of the nine U.S. integrated producers of certain coated paper other than coated packagingpaperboard, ***, NewPage, Sappi, and *** reported changes in capacity or production due toacquisitions, work stoppages and/or mill closures.16 Table III-4 lists these events that occurred during theperiod of investigation.
16 Petitioners maintained that unfairly traded subject imports are the major cause of the reported mill closures,production slowdowns, and unemployment. Petitioners’ posthearing brief, “Questions from CommissionerWilliamson, exh. 2, p. 1. Respondents argued that these events are the result of the continuing efforts of thedomestic industry to consolidate and rationalize inefficient capacity and are presented to shareholders as positiveevents. Respondents’ prehearing brief, pp. 78-79.
III-7

Table III-4Certain coated paper other than coated packaging paperboard: Events reported by U.S. integratedproducers occurring during the period of investigation that affected U.S. capacity or production
Firm Date Description of activity
Annual productionchange
(short tons)
U.S. integrated producers of–
Certain coated paper other than coated packaging paperboard
*** *** *** ***
New Page December 2007 Acquired Stora Enso North America Added the WisconsinRapids, WI mill and
the Kimberly, WI mill.
July 2008 Shut down Kimberly, WI coated freesheetfacility
***
November 2008 Shut down Chillicothe sheeting facility (1)
January-March2007
Temporary plant closures and market-relateddowntime
***
April-December2008
Temporary plant closures and market-relateddowntime
***
January-December 2009
Temporary plant closures and market-relateddowntime
***
January-March2010
Temporary plant closures and market-relateddowntime
***
Sappi August 2009 Closure of Muskegon, MI mill ***
*** *** *** (1)
1 No information provided.
Source: Compiled from data submitted in response to Commission questionnaires; Conference transcript, pp. 26-27 (Nelson)and pp. 34-35 (Ayer).
Data on U.S. integrated producers’ capacity, production, and capacity utilization pertaining totheir certain coated paper other than coated packaging paperboard operations are presented in table III-5. Total U.S. capacity decreased by 2.9 percent from 2007 to 2009 and increased by 15.0 percent betweenJanuary-June 2009 and January-June 2010.17 U.S. capacity volume accounted for 76.2 percent ofapparent U.S. consumption of certain coated paper other than coated packaging paperboard in 2009. Total U.S. production of certain coated paper other than coated packaging paperboard decreased by 15.3percent from 2007 to 2009, and increased by 38.0 percent from January-June 2009 to January-June 2010. Capacity utilization ranged from 77.3 percent in January-June 2009 to 93.6 percent in 2008.
17 Respondents argued that petitioners’ relatively stable capacity during the period of investigation indicates thatall of the paper mill closures were the result of prudent restructuring and the shuttering of production of productsother than certain coated paper. Respondents’ prehearing brief, pp. 78-79. Petitioners stated that they allocatedoverall capacity based on production and that the reduction in overall capacity (see table III-2) better depicts theimpact on capacity of the paper mill closures. Petitioners’ posthearing brief, “Questions from CommissionerWilliamson,” exh. 2, p. 1 and “Questions from Commissioner Pearson,” exh. 4.
III-8

Table III-5Certain coated paper other than coated packaging paperboard: U.S. integrated producers’capacity, production, and capacity utilization, 2007-09, January-June 2009, and January-June 2010
Item
Calendar year January-June
2007 2008 2009 2009 2010
Capacity (short tons) 1,395,457 1,266,051 1,354,352 669,847 770,217
Production (short tons) 1,303,273 1,185,322 1,103,889 517,681 714,386
Capacity utilization (percent) 93.4 93.6 81.5 77.3 92.8
Source: Compiled from data submitted in response to Commission questionnaires.
Coated Packaging Paperboard
*** of the four U.S. integrated producers of coated packaging paperboard, ***, reported changesin capacity or production due to acquisitions, work stoppages and/or mill closures. Table III-6 lists theseevents that occurred during the period of investigation.
Table III-6Coated packaging paperboard: Events reported by U.S. integrated producers occurring during theperiod of investigation that affected U.S. capacity or production
* * * * * * *
Data on U.S. integrated producers’ capacity, production, and capacity utilization pertaining tocoated packaging paperboard operations are presented in table III-7. Total U.S. capacity remained steady(lower by 0.9 percent) from 2007 to 2009 and decreased by 13.5 percent between January-June 2009 andJanuary-June 2010. Total U.S. production of coated packaging paperboard decreased by 12.6 percentfrom 2007 to 2009, and increased by 0.5 percent from January-June 2009 to January-June 2010. Capacityutilization ranged from 84.6 percent in 2009 to 100.6 percent in January-June 2010.
Table III-7Coated packaging paperboard: U.S. integrated producers’ capacity, production, and capacityutilization, 2007-09, January-June 2009, and January-June 2010
Item
Calendar year January-June
2007 2008 2009 2009 2010
Capacity (short tons) 668,754 676,762 662,891 320,291 277,185
Production (short tons) 641,740 671,261 561,132 277,639 278,967
Capacity utilization (percent) 96.0 99.2 84.6 86.7 100.6
Source: Compiled from data submitted in response to Commission questionnaires.
III-9

Total U.S. Integrated Producers
Data on U.S. integrated producers’ capacity, production, and capacity utilization pertaining toboth their packaging and non-packaging operations are presented in table III-8. Total U.S. capacitydecreased by 2.3 percent from 2007 to 2009 and increased by 5.8 percent between January-June 2009 andJanuary-June 2010. U.S. capacity volume accounted for 89.5 percent of apparent U.S. consumption ofcertain coated paper in 2009. Total U.S. production of certain coated paper decreased by 14.4 percentfrom 2007 to 2009, and increased by 24.9 percent from January-June 2009 to January-June 2010. Capacity utilization ranged from 80.3 percent in January-June 2009 to 95.6 percent in 2008.
Table III-8Certain coated paper (All U.S. integrated producers): U.S. integrated producers’ capacity,production, and capacity utilization, 2007-09, January-June 2009, and January-June 2010
Item
Calendar year January-June
2007 2008 2009 2009 2010
Capacity (short tons) 2,064,211 1,942,813 2,017,243 990,138 1,047,402
Production (short tons) 1,945,013 1,856,583 1,665,021 795,320 993,354
Capacity utilization (percent) 94.2 95.6 82.5 80.3 94.8
Source: Compiled from data submitted in response to Commission questionnaires.
U.S. Converters
One of the seven reporting U.S. converters, ***, reported changes in capacity or production dueto acquisitions, work stoppages and/or mill closures. Table III-9 lists these events that occurred duringthe period of investigation.
Table III-9Certain coated paper: Events reported by U.S. converters occurring during the period ofinvestigation that affected U.S. capacity or production
Firm Date Description of activity
Annual productionchange
(short tons)
U.S. converters
*** *** *** ***
Source: Compiled from data submitted in response to Commission questionnaires.
Data on U.S. converters’ capacity, production, and capacity utilization are presented in table III-10. Total U.S. capacity remained steady throughout the entire period of investigation. Total U.S.conversion production of certain coated paper decreased by *** percent from 2007 to 2009 and was lowerby *** percent from January-June 2009 to January-June 2010. Capacity utilization ranged from ***percent in 2009 to *** percent in January-June 2009.
III-10
Table III-10Certain coated paper: U.S. converters’ capacity, production, and capacity utilization, 2007-09,January-June 2009, and January-June 2010
* * * * * * *
Four of the seven reporting U.S. converters reported producing other products using the samemanufacturing equipment and/or production employees that were used to produce certain coated paper. Table III-11 shows overall U.S. capacity for U.S. converters as well as the U.S. production of otherproducts for which they have allocated capacity.
Table III-11Certain coated paper and other products: Overall capacity of U.S. converters, and production byfirms and products, 2009
* * * * * * *
U.S. PRODUCERS’ U.S. SHIPMENTS AND EXPORT SHIPMENTS
U.S. Integrated Producers
Certain Coated Paper Other Than Coated Packaging Paperboard
As detailed in table III-12, the volume of U.S. integrated producers’ U.S. shipments of certaincoated paper other than coated packaging paperboard decreased by 18.3 percent from 2007 to 2009, andwas higher by 47.8 percent from January-June 2009 to January-June 2010. The value of U.S. shipmentsdecreased by 22.9 percent from 2007 to 2009, and was higher by 34.4 percent from January-June 2009 toJanuary-June 2010. ***, reported *** internal consumption in 2008 (*** short tons and 2009 (*** shorttons). *** reported export shipments to ***. *** reported export shipments to ***. *** reported exportshipments to ***.
III-11

Table III-12Certain coated paper other than coated packaging paperboard: U.S. integrated producers’shipments, by types, 2007-09, January-June 2009, and January-June 2010
Item
Calendar year January-June
2007 2008 2009 2009 2010
Quantity (short tons)
U.S. commercial shipments 1,223,741 1,115,817 999,459 429,098 634,236
Export shipments *** *** *** *** ***
Total shipments *** *** *** *** ***
Value ($1,000)
U.S. commercial shipments 1,327,764 1,262,975 1,023,688 461,806 620,782
Export shipments *** *** *** *** ***
Total shipments *** *** *** *** ***
Unit value (per short ton)
U.S. commercial shipments 1,085 1,132 1,024 1,076 979
Export shipments *** *** *** *** ***
Average *** *** *** *** ***
Share of quantity (percent)
U.S. commercial shipments *** *** *** *** ***
Export shipments *** *** *** *** ***
Total 100.0 100.0 100.0 100.0 100.0
Note:–***.
Source: Compiled from data submitted in response to Commission questionnaires.
III-12

Coated Packaging Paperboard
As detailed in table III-13, the volume of U.S. integrated producers’ U.S. shipments of coatedpackaging paperboard decreased by 7.0 percent from 2007 to 2009, and was lower by 2.1 percent fromJanuary-June 2009 to January-June 2010. The value of U.S. shipments increased by 5.1 percent from2007 to 2009, and was lower by 4.0 percent from January-June 2009 to January-June 2010.
Table III-13Coated packaging paperboard: U.S. integrated producers’ shipments, by types, 2007-09, January-June 2009, and January-June 2010
Item
Calendar year January-June
2007 2008 2009 2009 2010
Quantity (short tons)
U.S. commercial shipments 513,481 533,155 477,774 231,671 226,869
Export shipments *** *** *** *** ***
Total shipments *** *** *** *** ***
Value ($1,000)
U.S. commercial shipments 391,568 431,578 411,627 201,694 193,543
Export shipments *** *** *** *** ***
Total shipments *** *** *** *** ***
Unit value (per short ton)
U.S. commercial shipments 763 809 862 871 853
Export shipments *** *** *** *** ***
Average *** *** *** *** ***
Share of quantity (percent)
U.S. commercial shipments *** *** *** *** ***
Export shipments *** *** *** *** ***
Total 100.0 100.0 100.0 100.0 100.0
Note:– ***.
Source: Compiled from data submitted in response to Commission questionnaires.
III-13

Total U.S. Integrated Producers
As detailed in table III-14, the volume of U.S. integrated producers’ U.S. shipments of certaincoated paper decreased by 15.0 percent from 2007 to 2009, and was higher by 30.3 percent from January-June 2009 to January-June 2010. The value of U.S. shipments decreased by 16.5 percent from 2007 to2009, and was higher by 22.7 percent from January-June 2009 to January-June 2010.
Table III-14Certain coated paper (All U.S. integrated producers): U.S. integrated producers’ shipments, bytypes, 2007-09, January-June 2009, and January-June 2010
Item
Calendar year January-June
2007 2008 2009 2009 2010
Quantity (short tons)
U.S. commercial shipments 1,737,222 1,648,972 1,477,233 660,769 861,105
Export shipments *** *** *** *** ***
Total shipments *** *** *** *** ***
Value ($1,000)
U.S. commercial shipments 1,719,332 1,694,553 1,435,315 663,500 814,324
Export shipments *** *** *** *** ***
Total shipments *** *** *** *** ***
Unit value (per short ton)
U.S. commercial shipments 990 1,028 972 1,004 946
Export shipments *** *** *** *** ***
Average *** *** *** *** ***
Share of quantity (percent)
U.S. commercial shipments *** *** *** *** ***
Export shipments *** *** *** *** ***
Total 100.0 100.0 100.0 100.0 100.0
Note:–***.
Source: Compiled from data submitted in response to Commission questionnaires.
III-14

U.S. Converters
As shown in table III-15, the volume of U.S. converters’ U.S. shipments of certain coated paperdecreased irregularly by *** percent from 2007 to 2009, and was lower by *** percent from January-June 2009 to January-June 2010. The value of U.S. shipments also decreased irregularly by *** percentfrom 2007 to 2009, and was lower by *** percent from January-June 2009 to January-June 2010. Noneof the U.S. producers reported internal consumption or transfers to related firms of certain coated paper.
Table III-15Certain coated paper: U.S. converters’ shipments of slitted rolls, by types, 2007-09, January-June2009, and January-June 2010
* * * * * * *
U.S. PRODUCERS’ IMPORTS AND PURCHASES OF IMPORTS
None of the U.S. integrated producers reported any U.S. imports or purchases of imports fromChina or Indonesia. ***, reported that they purchased from U.S. importers the subject product from Chinaand Indonesia during the period of investigation.18 Table III-16 presents these purchases of certain coatedpaper from China and Indonesia, the firms’ U.S. conversion production, and the ratio of their purchases totheir U.S. conversion production.
Table III-16Certain coated paper: U.S. converters’ subject imports and purchases of subject imports, 2007-09,January-June 2009, and January-June 2010
* * * * * * *
18 ***.
III-15

U.S. PRODUCERS’ INVENTORIES
Data on end-of-period inventories of certain coated paper for the period of investigation arepresented in table III-17.
Table III-17Certain coated paper: U.S. integrated producers’ and converters’ end-of-period inventories, 2007-09, January-June 2009, and January-June 2010
ItemCalendar year January-June
2007 2008 2009 2009 2010
U.S. integrated producers of–
Certain coated paper other than coated packaging paperboard
Inventories (short tons) 306,146 283,990 309,884 342,037 342,866
Ratio to production (percent) 23.5 24.0 28.1 33.0 24.0
Ratio to U.S. shipments (percent) 25.0 25.5 31.0 39.9 27.0
Ratio to total shipments (percent) 23.3 23.5 28.7 37.2 25.2
Coated packaging paperboard
Inventories (short tons) *** *** *** *** ***
Ratio to production (percent) *** *** *** *** ***
Ratio to U.S. shipments (percent) *** *** *** *** ***
Ratio to total shipments (percent) *** *** *** *** ***
Total U.S. integrated producers
Inventories (short tons) *** *** *** *** ***
Ratio to production (percent) *** *** *** *** ***
Ratio to U.S. shipments (percent) *** *** *** *** ***
Ratio to total shipments (percent) *** *** *** *** ***
U.S. converters
Inventories (short tons) *** *** *** *** ***
Ratio to production (percent) *** *** *** *** ***
Ratio to U.S. shipments (percent) *** *** *** *** ***
Ratio to total shipments (percent) *** *** *** *** ***
Note.--January-June ratios are calculated using annualized production and shipment data.Source: Compiled from data submitted in response to Commission questionnaires.
III-16

U.S. EMPLOYMENT, WAGES, AND PRODUCTIVITY
Data provided by U.S. producers on the number of production and related workers (“PRWs”)engaged in the production of certain coated paper,19 the total hours worked by such workers, wages paid tosuch PRWs, productivity, and unit labor costs during the period of investigation are presented in table III-18, by U.S. integrated producers and U.S. converters.20
Table III-18Certain coated paper: Average number of production and related workers producing certain coatedpaper, hours worked, wages paid to such employees, and hourly wages, productivity, and unit laborcosts, 2007-09, January-June 2009, and January-June 2010
Item
Calendar year January-June
2007 2008 2009 2009 2010
U.S. integrated producers of–
Certain coated paper other than coated packaging paperboard
PRWs (number) 1,874 1,723 1,614 1,654 1,590
Hours worked (1,000) 3,491 3,099 2,894 1,453 1,528
Wages paid ($1,000) 92,464 88,866 84,224 39,811 46,004
Hourly wages $26.49 $28.67 $29.10 $27.40 $30.11
Productivity (short tons per 1,000 hours) 344.0 349.0 350.9 331.9 433.9
Unit labor costs (per short ton) $77.00 $82.15 $82.93 $82.56 $69.40
Table continued on next page.
19 Petitioners argued that the causal link between job losses and unfairly traded subject imports is furtherconfirmed by the Department of Labor’s issuance during the period of investigation of five Trade AdjustmentAssistance certifications for job losses at NewPage’s Kimberly, WI and Rumford, ME mills and for job losses atSmart’s West Chicago, IL mill, Appleton’s Combined Locks, WI mill, and for Sappi’s Muskegon, MI mill. Oneother certification application is pending before the Department of Labor for job losses at New Page’s Luke, MDmill. Petitioners’ prehearing brief, p. 42.
20 ***.
III-17
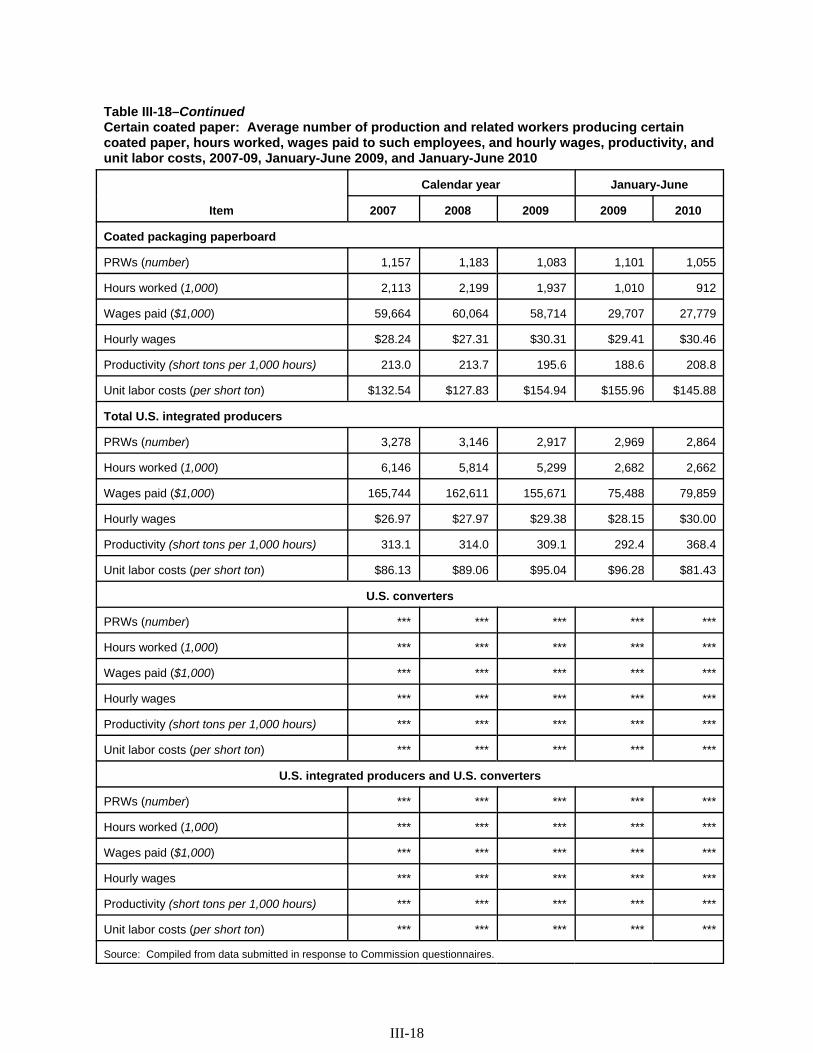
Table III-18–ContinuedCertain coated paper: Average number of production and related workers producing certaincoated paper, hours worked, wages paid to such employees, and hourly wages, productivity, andunit labor costs, 2007-09, January-June 2009, and January-June 2010
Item
Calendar year January-June
2007 2008 2009 2009 2010
Coated packaging paperboard
PRWs (number) 1,157 1,183 1,083 1,101 1,055
Hours worked (1,000) 2,113 2,199 1,937 1,010 912
Wages paid ($1,000) 59,664 60,064 58,714 29,707 27,779
Hourly wages $28.24 $27.31 $30.31 $29.41 $30.46
Productivity (short tons per 1,000 hours) 213.0 213.7 195.6 188.6 208.8
Unit labor costs (per short ton) $132.54 $127.83 $154.94 $155.96 $145.88
Total U.S. integrated producers
PRWs (number) 3,278 3,146 2,917 2,969 2,864
Hours worked (1,000) 6,146 5,814 5,299 2,682 2,662
Wages paid ($1,000) 165,744 162,611 155,671 75,488 79,859
Hourly wages $26.97 $27.97 $29.38 $28.15 $30.00
Productivity (short tons per 1,000 hours) 313.1 314.0 309.1 292.4 368.4
Unit labor costs (per short ton) $86.13 $89.06 $95.04 $96.28 $81.43
U.S. converters
PRWs (number) *** *** *** *** ***
Hours worked (1,000) *** *** *** *** ***
Wages paid ($1,000) *** *** *** *** ***
Hourly wages *** *** *** *** ***
Productivity (short tons per 1,000 hours) *** *** *** *** ***
Unit labor costs (per short ton) *** *** *** *** ***
U.S. integrated producers and U.S. converters
PRWs (number) *** *** *** *** ***
Hours worked (1,000) *** *** *** *** ***
Wages paid ($1,000) *** *** *** *** ***
Hourly wages *** *** *** *** ***
Productivity (short tons per 1,000 hours) *** *** *** *** ***
Unit labor costs (per short ton) *** *** *** *** ***
Source: Compiled from data submitted in response to Commission questionnaires.
III-18

PART IV: U.S. IMPORTS, APPARENT CONSUMPTION, ANDMARKET SHARES
U.S. IMPORTERS
The Commission sent importer questionnaires to 88 firms listed by the parties as potential U.S.importers of certain coated paper, as well as to all U.S. producers.1 Questionnaire responses containingusable data were received from 11 firms and accounted for the majority of U.S. imports from China andIndonesia.2 Of the eleven responding U.S. importers, four firms accounted for the vast majority ofreported U.S. imports from China and Indonesia. These four firms, Asia Pulp & Paper (Canada), Ltd.(“APP”); Eagle Ridge Paper Co. (“Eagle Ridge”); Global Paper Solutions, Inc. (“GPS”); and Paper Max,Ltd. (“Paper Max”) are all affiliated companies to large producers of certain coated paper in China andIndonesia.3 All of these companies, both the U.S. importers and foreign producers, are affiliated withAsia Pulp & Paper, Ltd., headquartered in Singapore, which in turn is part of the multi-billion dollarIndonesian conglomerate, Sinar Mas Group.
In 2009, *** Unisource changed certain coated paper suppliers by ceasing to purchase productproduced in China and ***.4 ***.5 ***.6
1 The Commission’s questionnaire mailing list consisted of 210 firms (15 potential U.S. integrated producers, 107potential U.S. converters, and 88 potential U.S. importers). All these firms received U.S. producer’s and U.S.importer’s questionnaires.
The following eight firms reported that they did not import certain coated paper into the United States: ***.
One firm, ***, reported solely U.S. imports of sheeter rolls (a product not within the scope of theseinvestigations) from China in 2009.
2 The 2009 volume of U.S. imports from China compiled from U.S. importer questionnaire responses accountedfor *** percent of U.S. imports from China compiled from adjusted Commerce statistics. The 2009 volume of U.S.imports from Indonesia compiled from U.S. importer questionnaire responses accounted for *** percent of U.S.imports from Indonesia compiled from adjusted Commerce statistics. The 2009 volume of U.S. imports fromnonsubject countries compiled from U.S. importer questionnaire responses accounted for *** percent of U.S.imports from nonsubject countries compiled from adjusted Commerce statistics.
3 All foreign producers from China and Indonesia that have submitted questionnaires to the Commission and areparticipating in these investigations are affiliated with Asia Pulp & Paper, Ltd. of Singapore.
4 U.S. purchaser’s questionnaire response of ***, p. 14, question III-17. The parties disputed the reason that Unisource decided to switch suppliers. Respondents claimed that
Unisource switched suppliers because of a dispute over payment terms with respondents and that NewPage offeredfavorable pricing because of the subsidies it received as part of the Alternative Fuel Tax Credit, the so-called “BlackLiquor Subsidies.” Respondents’ prehearing brief, p. 59.
Petitioners claimed that Unisource switched to NewPage not because of price, but rather because ofUnisource’s concern that respondents wanted to dramatically increase its volume of imports into the United Statesduring a period of decreasing demand brought about by the recession. Petitioners submitted an affidavit from aUnisource vice president which stated that ***. Petitioners’ posthearing brief, exh. 1.
5 U.S. purchaser’s questionnaire response of ***, p. 14, question III-17.
6 U.S. purchaser’s questionnaire response of ***, p. 5, question II-4(b).
IV-1

In the second half of 2009, subsequent to the loss of its Unisource account, Asia Pulp & PaperCo., Ltd. began to create a U.S. distribution network for its imported products named “Eagle RidgePaper.” The new firm ***. Respondents claim that the ***.7 ***.8
Table IV-1 lists all responding U.S. importers of certain coated paper from Indonesia and China,their U.S. locations, and their quantities of imports, by source, in 2009.
Table IV-1Certain coated paper: Reported U.S. imports, by importers and by sources of imports, 2009
Importer U.S. location
Quantity (short tons)
China IndonesiaNonsubjectcountries Total
Appleton1 Combined Locks, WI *** *** *** *** ***
APP2 Brampton, ON *** *** *** ***
Eagle Ridge3 Brampton, ON *** *** *** ***
GPS4 Anaheim, CA *** *** *** ***
JPP5 Los Angeles, CA (5) *** *** *** ***
Mohawk Cohoes, NY *** ***(6)
*** ***
Moorim7 Denver, CO *** *** *** *** ***
O’Conner8 Buffalo, NY *** *** *** ***
Paper Max9 Anaheim, CA *** *** *** ***
Printing Papers Little Rock, AR *** *** *** *** ***
Sappi10 Boston, MA *** *** *** *** ***
Total *** *** *** ***
1 ***. 2 ***. 3 ***. 4 ***. 5 ***. 6 ***. 7 ***. 8 ***. 9 ***. 10 ***.
Source: Compiled from data submitted in response to Commission questionnaires.
7 Respondents reported that its total investment into Eagle Ridge has amounted to ***. Respondents posthearingbrief, exh. 1, pp. 62 and 123.
8 U.S. importer’s questionnaire response of ***, p. 9, question II-2; Conference transcript, p. 183 (Hunley).
IV-2

U.S. IMPORTS
Table IV-2 presents data for U.S. imports of certain coated paper from China, Indonesia, andnonsubject countries. The data below are compiled using adjusted Commerce statistics. The adjustmentsare based on those provided by the petitioners.9 As shown, the volume of U.S. imports from Chinaincreased by 2.0 percent from 2007 to 2009 and was lower by 62.4 percent from January-June 2009 toJanuary-June 2010.10 The volume of U.S. imports from Indonesia increased by 16.2 percent from 2007 to2009, but was lower by 33.0 percent from January-June 2009 to January-June 2010. The volume of U.S.imports from nonsubject countries decreased by 50.0 percent from 2007 to 2009, and was higher by 56.5percent from January-June 2009 to January-June 2010. The largest sources of U.S. imports fromnonsubject countries in 2009 were (in descending order of volume): (1) Korea, (2) Japan, and (3) Germany.
9 Petitioners’ posthearing brief, “Questions from Commissioner Lane,” exhs. 1 and 2. Respondents claimed thatpetitioners’ assumption with regard to U.S. imports from nonsubject countries, specifically EU countries, may beunderstated. Petitioners’ assumption is that for a number of HTS statistical reporting numbers (those for coatedgroundwood paper), U.S. imports from nonsubject countries are entirely in the form of rolls and not included withinthe scope of these investigations. Respondents claimed that certain EU export statistics show that a portion of theseimports are in sheet form. Respondents’ submitted EU export statistics show that the portion claimed to be in sheetform would be equal to between 10.3 percent in 2009 and 12.4 percent in 2008 of total U.S. imports from nonsubjectcountries. Respondents’ posthearing brief, exh. 1, pp. 11-12 and exh. 4.
Subsequent to Commerce adding three new HTS subheadings to the scope in its final determinations (HTS4810.32, 4810.39, and 4810.92), U.S. imports from China entering under HTS 4810.92.12 have been adjusted andincreased using respondents’ assumptions. In its submissions to Commerce, respondents stated that two of GoldEast’s paper mills exported multi-ply paperboard products under HTS 4810.92.12. Respondents’ posthearing brief,exh. 2, pp. 1-2 and exh. 3, p. 8. Although volume trends of U.S. imports from China remain similar to pre-adjustedvolumes, absolute volumes did increase by 14.2 percent in 2007, 19.5 percent in 2008, 18.8 percent in 2009, and16.6 percent in interim 2010.
Subsequent to Commerce adding three new HTS subheadings to the scope in its final determinations, U.S.imports from Indonesia and nonsubject countries have not been further adjusted. In submissions to Commerce, noproducer in Indonesia reported exporting subject product under any of the additional HTS subheadings. Petitioners’posthearing brief, “Questions from Commissioner Lane,” exhs. 5 and 6.
The parties appear to agree that product within the scope of these investigations would not properly beclassified under HTS 4810.32 and 4810.39 as they cover “kraft paper or paperboard other than the kind used forwriting, printing, or other graphic purposes.” Petitioners posthearing brief, “Questions from Staff,” exh. 5, p. 2;Respondents’ posthearing brief, exh. 3, pp. 6-7. Petitioners stated that Commerce added these HTS subheadings inorder to prevent circumvention of any issued order. Petitioners’ posthearing brief, “Questions from CommissionerLane,” exh. 1, p. 2.
10 In the preliminary phase of these investigations, respondents argued that the preliminary duties in the 2007Coated Free Sheet Paper investigation distorted volumes of U.S. imports from subject countries particularly in thefirst half of 2008. They maintained that the preliminary duties ceased in late 2007 and, given the order lead time,U.S. imports in the first half of 2008 “were simply returning to historical levels,” and are not evidence of a “surge”in U.S. imports from subject countries. Respondents’ postconference brief, p. 23.
IV-3

Table IV-2Certain coated paper: U.S. imports, by sources, 2007-09, January-June 2009, and January-June2010
Source
Calendar year January-June
2007 2008 2009 2009 2010
Quantity (short tons)
China 345,768 329,307 352,555 190,622 71,706
Indonesia 52,541 52,938 61,039 19,883 13,327
Subtotal 398,309 382,245 413,593 210,506 85,033
All others 727,306 611,626 363,472 196,512 307,612
Total 1,125,615 993,872 777,066 407,018 392,645
Value ($1,000)1
China 318,066 319,306 297,527 165,213 63,243
Indonesia 45,543 48,765 52,384 16,458 11,536
Subtotal 363,609 368,071 349,911 181,670 74,779
All others 737,251 650,135 368,605 204,901 286,665
Total 1,100,860 1,018,206 718,516 386,572 361,443
Unit value (per short ton)
China 920 970 844 867 882
Indonesia 867 921 858 828 866
Subtotal 913 963 846 863 879
All others 1,014 1,063 1,014 1,043 932
Average 978 1,024 925 950 921
Share of quantity (percent)
China 30.7 33.1 45.4 46.8 18.3
Indonesia 4.7 5.3 7.9 4.9 3.4
Subtotal 35.4 38.5 53.2 51.7 21.7
All others 64.6 61.5 46.8 48.3 78.3
Total 100.0 100.0 100.0 100.0 100.0
Share of value (percent)
China 28.9 31.4 41.4 42.7 17.5
Indonesia 4.1 4.8 7.3 4.3 3.2
Subtotal 33.0 36.1 48.7 47.0 20.7
All others 67.0 63.9 51.3 53.0 79.3
Total 100.0 100.0 100.0 100.0 100.0
1 Landed, duty-paid.
Source: Compiled from adjusted Commerce statistics.
IV-4
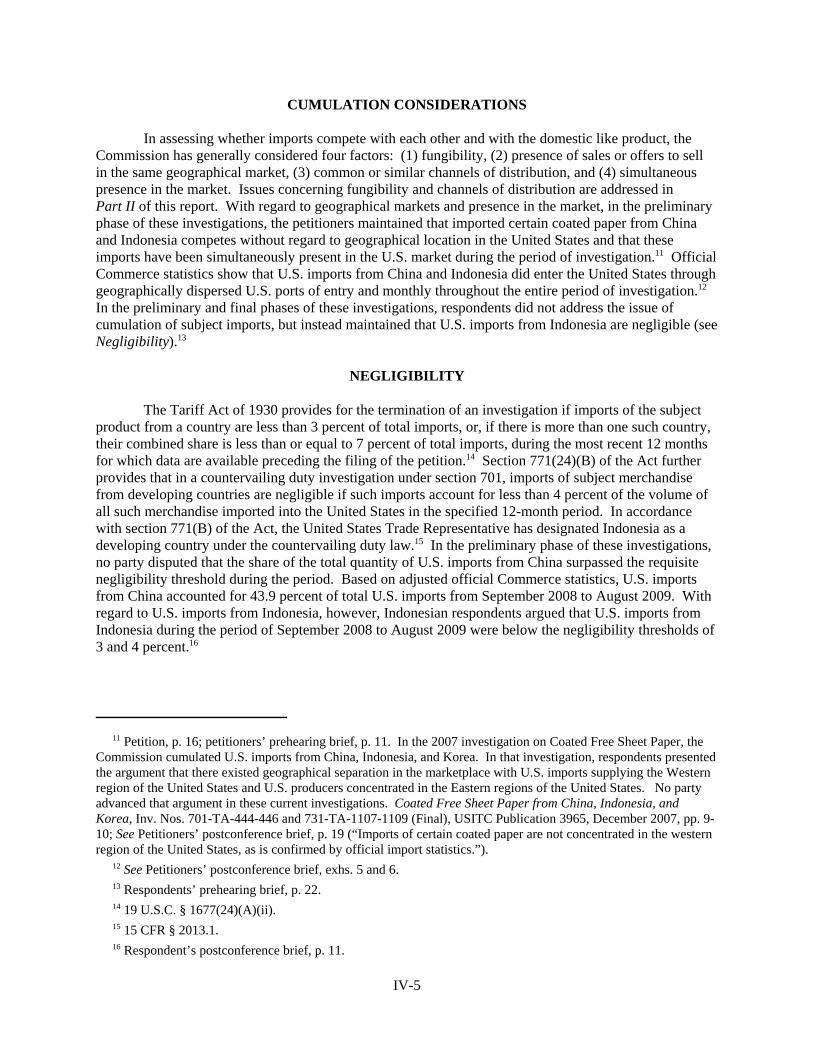
CUMULATION CONSIDERATIONS
In assessing whether imports compete with each other and with the domestic like product, theCommission has generally considered four factors: (1) fungibility, (2) presence of sales or offers to sellin the same geographical market, (3) common or similar channels of distribution, and (4) simultaneouspresence in the market. Issues concerning fungibility and channels of distribution are addressed in Part II of this report. With regard to geographical markets and presence in the market, in the preliminaryphase of these investigations, the petitioners maintained that imported certain coated paper from Chinaand Indonesia competes without regard to geographical location in the United States and that theseimports have been simultaneously present in the U.S. market during the period of investigation.11 OfficialCommerce statistics show that U.S. imports from China and Indonesia did enter the United States throughgeographically dispersed U.S. ports of entry and monthly throughout the entire period of investigation.12 In the preliminary and final phases of these investigations, respondents did not address the issue ofcumulation of subject imports, but instead maintained that U.S. imports from Indonesia are negligible (seeNegligibility).13
NEGLIGIBILITY
The Tariff Act of 1930 provides for the termination of an investigation if imports of the subjectproduct from a country are less than 3 percent of total imports, or, if there is more than one such country,their combined share is less than or equal to 7 percent of total imports, during the most recent 12 monthsfor which data are available preceding the filing of the petition.14 Section 771(24)(B) of the Act furtherprovides that in a countervailing duty investigation under section 701, imports of subject merchandisefrom developing countries are negligible if such imports account for less than 4 percent of the volume ofall such merchandise imported into the United States in the specified 12-month period. In accordancewith section 771(B) of the Act, the United States Trade Representative has designated Indonesia as adeveloping country under the countervailing duty law.15 In the preliminary phase of these investigations,no party disputed that the share of the total quantity of U.S. imports from China surpassed the requisitenegligibility threshold during the period. Based on adjusted official Commerce statistics, U.S. importsfrom China accounted for 43.9 percent of total U.S. imports from September 2008 to August 2009. Withregard to U.S. imports from Indonesia, however, Indonesian respondents argued that U.S. imports fromIndonesia during the period of September 2008 to August 2009 were below the negligibility thresholds of3 and 4 percent.16
11 Petition, p. 16; petitioners’ prehearing brief, p. 11. In the 2007 investigation on Coated Free Sheet Paper, theCommission cumulated U.S. imports from China, Indonesia, and Korea. In that investigation, respondents presentedthe argument that there existed geographical separation in the marketplace with U.S. imports supplying the Westernregion of the United States and U.S. producers concentrated in the Eastern regions of the United States. No partyadvanced that argument in these current investigations. Coated Free Sheet Paper from China, Indonesia, andKorea, Inv. Nos. 701-TA-444-446 and 731-TA-1107-1109 (Final), USITC Publication 3965, December 2007, pp. 9-10; See Petitioners’ postconference brief, p. 19 (“Imports of certain coated paper are not concentrated in the westernregion of the United States, as is confirmed by official import statistics.”).
12 See Petitioners’ postconference brief, exhs. 5 and 6.
13 Respondents’ prehearing brief, p. 22.
14 19 U.S.C. § 1677(24)(A)(ii).
15 15 CFR § 2013.1.
16 Respondent’s postconference brief, p. 11.
IV-5

In the preliminary phase of these investigations, the parties presented multiple methodologies forthe adjustment of official Commerce statistics.17 In the preliminary phase, the Commission determinedthat U.S. imports from Indonesia were not negligible noting that “in light of the questions regarding theimport data from Indonesia, and the fact that official import data show subject imports exceed the 4percent threshold for countervailing duty investigations, we do not find that imports from Indonesia arenegligible for purposes of the present material injury investigations. We will reexamine this issue andseek to clarify the subject import data from Indonesia in any final phase investigations.”18
In the final phase of these investigations, the Commission requested from U.S. importers monthlySeptember 2008 to August 2009 U.S. import data for Indonesia. Reported monthly U.S. import data forIndonesia, as reported by U.S. importers, however, may be understated.19 Therefore, table IV-3 belowpresents monthly U.S. import data from September 2008 to August 2009 using adjusted monthlyCommerce statistics using petitioners’ assumptions as to the adjustments as well as respondents’adjustment regarding additional U.S. imports entering under the additional HTS subheading 4810.92.12.20 Using this methodology shows that U.S. imports from Indonesia accounted for 6.4 percent of total U.S.imports from September 2008 to August 2009.21
17 One issue that the parties disputed in the preliminary phase was whether “multi-ply paperboard” was includedin the scope of these investigations. Respondents argued that this product is not properly included in the scope, butthe U.S. import volumes are included in the Commerce statistics, thereby overstating monthly U.S. imports fromIndonesia for purposes of the Commission’s negligibility analysis. Petitioners argued that multi-ply paperboard isincluded in the scope definition of certain coated paper and therefore the official Commerce statistics are notoverstated. Commerce has determined that multi-ply paperboard is within the scope of these investigations. CertainCoated Paper Suitable for High-Quality Print Graphics Using Sheet-Fed Presses from Indonesia: Final AffirmativeCountervailing Duty Determination; “Issues and Decision Memorandum,” dated September 27, 2010, p. 50.
18 Certain Coated Paper Suitable for High-Quality Print Graphics Using Sheet-Fed Presses from China andIndonesia, Inv. Nos. 701-TA-470-471 and 731-TA-1169-1170 (Preliminary), USITC Publication 4108, November2009, p. 15.
19 Indonesian respondents reported that they accounted for *** percent of the export shipments to the UnitedStates during the period of investigation. In 2009, Indonesian respondents reported export shipments to the UnitedStates of *** short tons while U.S. importers reported 2009 U.S. imports from Indonesia of *** short tons, or ***percent of reported 2009 export shipments.
20 See Part IV, p. 4, fn. 9 for an explanation of the adjustments made to official Commerce statistics. Petitionersargued that it would be improper to add any volume to U.S. imports under the three additional HTS subheadings inthe Commission’s negligibility calculation because Commerce added these subheadings to prevent circumvention ofany issued orders and properly classified subject imports would not enter under these HTS subheadings. Therefore,petitioners argued that methodology 1 in the Commission’s prehearing report, which computed a 6.8 percent sharefor U.S. imports from Indonesia using adjusted Commerce statistics, is the proper method for the computation ofnegligibility. Petitioners’ posthearing brief, “Questions from Commissioner Lane,” exh. 1, p. 10. Respondentsargued that based on Commerce’s final scope determinations, all volumes from the three additional HTSsubheadings for Indonesia, China, and nonsubject countries should be used to compute negligibility. Petitionersobserved that even in the event that the Commission did decide to use all the U.S. import volumes from China,Indonesia, and nonsubject countries in its negligibility computation, the share of U.S. imports from Indonesia wouldbe 5.2 percent, and therefore, still not below the negligibility threshold of 4 percent. Petitioners’ posthearing brief,“Questions from Commissioner Lane,” exh. 1 (exh. 7).
21 The computation shown in table IV-3 uses “subject merchandise” data to compute Indonesian and total U.S.imports meaning that these imports are those as defined by Commerce’s scope definition of these investigations. Neither of these methodologies expands the definition of “subject imports” to include sheeter rolls or web rolls.
IV-6

Table IV-3Certain coated paper: Monthly U.S. imports, by sources of imports, September 2008-August 2009
Monthly Adjusted Commerce Statistics
Month/Year Indonesia Total imports
Quantity (short tons); shares (percent)
Sept. 2008 7,297 75,154
Oct. 2008 6,596 81,414
Nov. 2008 4,499 97,265
Dec. 2008 4,882 88,542
Jan. 2009 4,680 94,694
Feb. 2009 1,574 66,931
March 2009 3,629 65,174
April 2009 2,334 61,245
May 2009 2,891 59,822
June 2009 4,774 59,152
July 2009 3,753 61,368
Aug. 2009 8,754 58,329
Total quantity 55,665 869,090
Share of total (percent) 6.4
Source: Adjusted Commerce statistics.
APPARENT U.S. CONSUMPTION AND MARKET SHARES
Apparent U.S. Consumption Using U.S. Shipments from U.S. Producers of Certain Coated PaperOther Than Coated Packaging Paperboard
Data on apparent U.S. consumption of certain coated paper other than coated packagingpaperboard are presented in table IV-4. From 2007 to 2009, the quantity of apparent U.S. consumptiondecreased by 24.4 percent and was higher by 22.8 percent from January-June 2009 to January-June 2010. From 2007 to 2009, the value of apparent U.S. consumption decreased by 28.3 percent and was higher by15.8 percent from January-June 2009 to January-June 2010.
Data on U.S. market shares for certain coated paper other than coated packaging paperboard arepresented in table IV-5. From 2007 to 2009, U.S. producers’ market share based on quantity increased by4.2 percentage points and based on value increased 4.1 percentage points. Between January-June 2009and January-June 2010, U.S. producers’ market share based on volume increased by 10.4 percentagepoints and based on value increased by 8.8 percentage points. U.S. imports from China gained 5.1percentage points of U.S. market share from 2007 to 2009 based on quantity and 4.0 percentage pointsbased on value. Between the interim periods, U.S. imports from China lost 15.8 percentage points of U.S.market share based on quantity and 13.0 percentage points based on value. U.S. imports from Indonesiagained 1.2 percentage points of U.S. market share from 2007 to 2009 based on quantity and 1.1
IV-7

percentage points based on value. Between the interim periods, U.S. imports from Indonesia lost 1.1percentage points of U.S. market share based on quantity and 0.8 percentage points based on value. U.S.imports from nonsubject countries lost 10.5 percentage points of U.S. market share from 2007 to 2009based on quantity and 9.2 percentage points based on value. Between the interim periods, U.S. importsfrom nonsubject countries gained 6.5 percentage points of U.S. market share based on quantity and 5.0percentage points based on value.
Table IV-4Certain coated paper other than coated packaging paperboard: U.S. shipments of domesticproduct, U.S. imports by sources, and apparent U.S. consumption, 2007-09, January-June 2009,and January-June 2010
Item
Calendar year January-June
2007 2008 2009 2009 2010
Quantity (short tons)
U.S. producers’ U.S. shipments 1,223,741 1,115,817 999,459 429,098 634,236
U.S. imports from–
China 345,768 329,307 352,555 190,622 71,706
Indonesia 52,541 52,938 61,039 19,883 13,327
Subtotal 398,309 382,245 413,593 210,506 85,033
All other countries 727,306 611,626 363,472 196,512 307,612
Total imports 1,125,615 993,872 777,066 407,018 392,645
Apparent U.S. consumption 2,349,356 2,109,689 1,776,525 836,116 1,026,881
Value ($1,000)
U.S. producers’ U.S. shipments 1,327,764 1,262,975 1,023,688 461,806 620,782
U.S. imports from–
China 318,066 319,306 297,527 165,213 63,243
Indonesia 45,543 48,765 52,384 16,458 11,536
Subtotal 363,609 368,071 349,911 181,670 74,779
All other countries 737,251 650,135 368,605 204,901 286,665
Total imports 1,100,860 1,018,206 718,516 386,572 361,443
Apparent U.S. consumption 2,428,624 2,281,181 1,742,203 848,377 982,225
Source: Compiled from data submitted in response to Commission questionnaires and from adjusted Commerce statistics.
IV-8
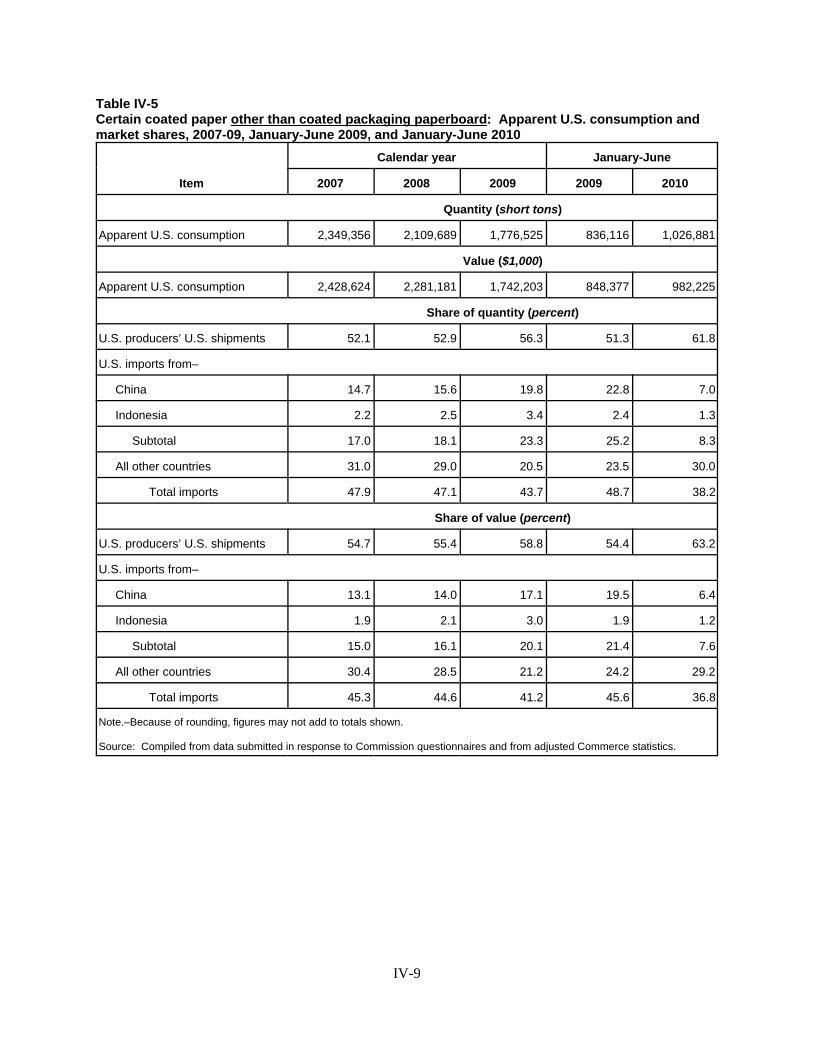
Table IV-5Certain coated paper other than coated packaging paperboard: Apparent U.S. consumption andmarket shares, 2007-09, January-June 2009, and January-June 2010
Item
Calendar year January-June
2007 2008 2009 2009 2010
Quantity (short tons)
Apparent U.S. consumption 2,349,356 2,109,689 1,776,525 836,116 1,026,881
Value ($1,000)
Apparent U.S. consumption 2,428,624 2,281,181 1,742,203 848,377 982,225
Share of quantity (percent)
U.S. producers’ U.S. shipments 52.1 52.9 56.3 51.3 61.8
U.S. imports from–
China 14.7 15.6 19.8 22.8 7.0
Indonesia 2.2 2.5 3.4 2.4 1.3
Subtotal 17.0 18.1 23.3 25.2 8.3
All other countries 31.0 29.0 20.5 23.5 30.0
Total imports 47.9 47.1 43.7 48.7 38.2
Share of value (percent)
U.S. producers’ U.S. shipments 54.7 55.4 58.8 54.4 63.2
U.S. imports from–
China 13.1 14.0 17.1 19.5 6.4
Indonesia 1.9 2.1 3.0 1.9 1.2
Subtotal 15.0 16.1 20.1 21.4 7.6
All other countries 30.4 28.5 21.2 24.2 29.2
Total imports 45.3 44.6 41.2 45.6 36.8
Note.–Because of rounding, figures may not add to totals shown.
Source: Compiled from data submitted in response to Commission questionnaires and from adjusted Commerce statistics.
IV-9

Apparent U.S. Consumption Using U.S. Shipments from U.S. Producers of Total U.S. IntegratedProduction
Data on apparent U.S. consumption of certain coated paper are presented in table IV-6. From2007 to 2009, the quantity of apparent U.S. consumption of certain coated paper decreased by 21.3percent and was higher by 17.4 percent from January-June 2009 to January-June 2010. From 2007 to2009, the value of apparent U.S. consumption decreased by 23.6 percent and was higher by 12.0 percentfrom January-June 2009 to January-June 2010.
Data on U.S. market shares for certain coated paper are presented in table IV-7. From 2007 to2009, U.S. producers’ market share based on quantity increased by 4.8 percentage points and based onvalue increased 5.7 percentage points. Between January-June 2009 and January-June 2010, U.S.producers’ market share based on volume increased by 6.8 percentage points and based on valueincreased by 6.1 percentage points. U.S. imports from China gained 3.6 percentage points of U.S. marketshare from 2007 to 2009 based on quantity and 2.5 percentage points based on value. Between theinterim periods, U.S. imports from China lost 12.1 percentage points of U.S. market share based onquantity and 10.4 percentage points based on value. U.S. imports from Indonesia gained 0.9 percentagepoints of U.S. market share from 2007 to 2009 based on quantity and 0.8 percentage points based onvalue. Between the interim periods, U.S. imports from Indonesia lost 0.8 percentage points of U.S.market share based on quantity and 0.6 percentage points based on value. U.S. imports from nonsubjectcountries lost 9.3 percentage points of U.S. market share from 2007 to 2009 based on quantity and 9.0percentage points based on value. Between the interim periods, U.S. imports from nonsubject countriesgained 6.1 percentage points of U.S. market share based on quantity and 4.9 percentage points based onvalue.
IV-10
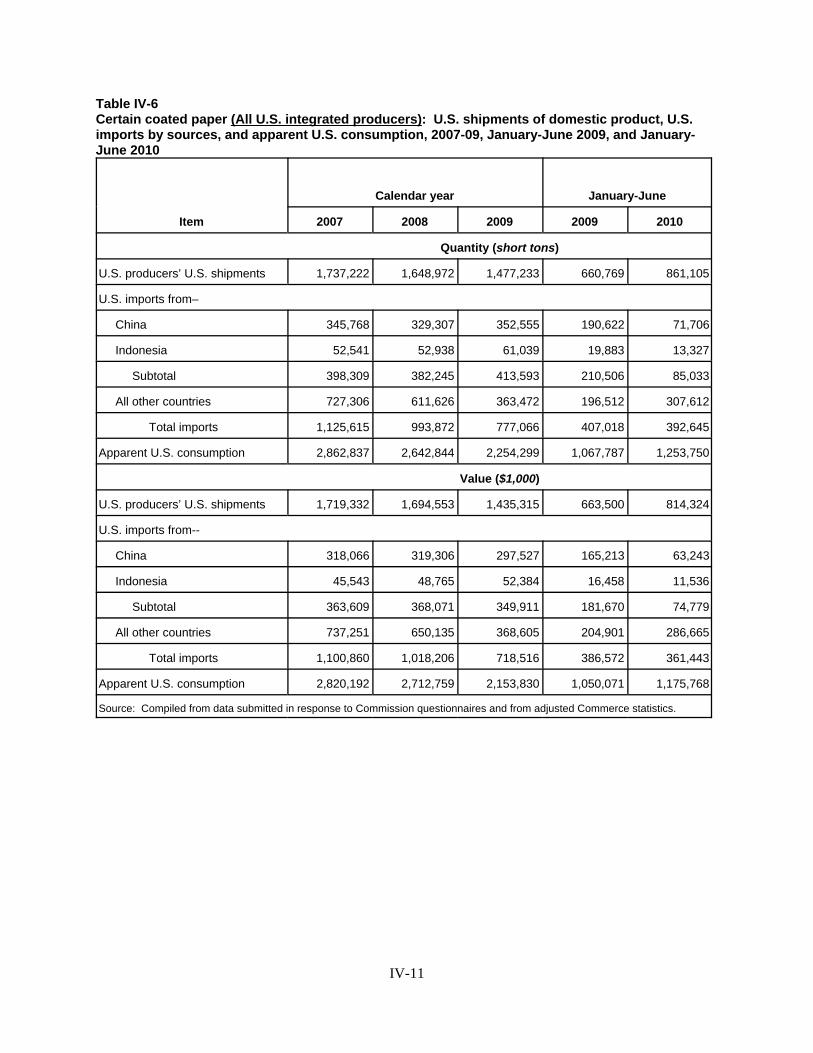
Table IV-6Certain coated paper (All U.S. integrated producers): U.S. shipments of domestic product, U.S.imports by sources, and apparent U.S. consumption, 2007-09, January-June 2009, and January-June 2010
Item
Calendar year January-June
2007 2008 2009 2009 2010
Quantity (short tons)
U.S. producers’ U.S. shipments 1,737,222 1,648,972 1,477,233 660,769 861,105
U.S. imports from–
China 345,768 329,307 352,555 190,622 71,706
Indonesia 52,541 52,938 61,039 19,883 13,327
Subtotal 398,309 382,245 413,593 210,506 85,033
All other countries 727,306 611,626 363,472 196,512 307,612
Total imports 1,125,615 993,872 777,066 407,018 392,645
Apparent U.S. consumption 2,862,837 2,642,844 2,254,299 1,067,787 1,253,750
Value ($1,000)
U.S. producers’ U.S. shipments 1,719,332 1,694,553 1,435,315 663,500 814,324
U.S. imports from--
China 318,066 319,306 297,527 165,213 63,243
Indonesia 45,543 48,765 52,384 16,458 11,536
Subtotal 363,609 368,071 349,911 181,670 74,779
All other countries 737,251 650,135 368,605 204,901 286,665
Total imports 1,100,860 1,018,206 718,516 386,572 361,443
Apparent U.S. consumption 2,820,192 2,712,759 2,153,830 1,050,071 1,175,768
Source: Compiled from data submitted in response to Commission questionnaires and from adjusted Commerce statistics.
IV-11
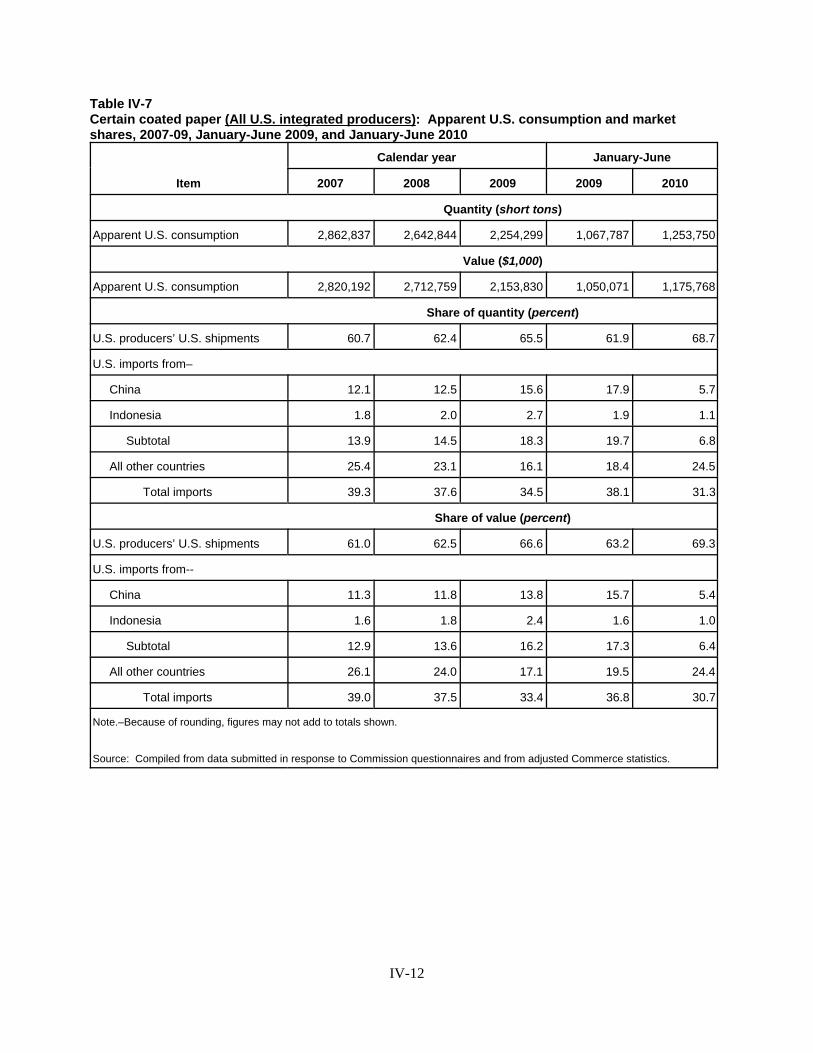
Table IV-7Certain coated paper (All U.S. integrated producers): Apparent U.S. consumption and marketshares, 2007-09, January-June 2009, and January-June 2010
Item
Calendar year January-June
2007 2008 2009 2009 2010
Quantity (short tons)
Apparent U.S. consumption 2,862,837 2,642,844 2,254,299 1,067,787 1,253,750
Value ($1,000)
Apparent U.S. consumption 2,820,192 2,712,759 2,153,830 1,050,071 1,175,768
Share of quantity (percent)
U.S. producers’ U.S. shipments 60.7 62.4 65.5 61.9 68.7
U.S. imports from–
China 12.1 12.5 15.6 17.9 5.7
Indonesia 1.8 2.0 2.7 1.9 1.1
Subtotal 13.9 14.5 18.3 19.7 6.8
All other countries 25.4 23.1 16.1 18.4 24.5
Total imports 39.3 37.6 34.5 38.1 31.3
Share of value (percent)
U.S. producers’ U.S. shipments 61.0 62.5 66.6 63.2 69.3
U.S. imports from--
China 11.3 11.8 13.8 15.7 5.4
Indonesia 1.6 1.8 2.4 1.6 1.0
Subtotal 12.9 13.6 16.2 17.3 6.4
All other countries 26.1 24.0 17.1 19.5 24.4
Total imports 39.0 37.5 33.4 36.8 30.7
Note.–Because of rounding, figures may not add to totals shown.
Source: Compiled from data submitted in response to Commission questionnaires and from adjusted Commerce statistics.
IV-12

RATIO OF IMPORTS TO U.S. PRODUCTION
Data on the ratio of imports to U.S. production of certain coated paper are presented in table IV-8.
Table IV-8Certain coated paper: U.S. production, U.S. imports, and ratios of imports to production, 2007-09,January-June 2009, and January-June 2010
Item
Calendar year January-June
2007 2008 2009 2009 2010
Quantity (short tons)
U.S. production of–
Certain coated paper other than coated packaging paperboard 1,303,273 1,185,322 1,103,889 517,681 714,386
Total U.S. integrated 1,945,013 1,856,583 1,665,021 795,320 993,354
U.S. imports from--
China 345,768 329,307 352,555 190,622 71,706
Indonesia 52,541 52,938 61,039 19,883 13,327
Subtotal 398,309 382,245 413,593 210,506 85,033
All other countries 727,306 611,626 363,472 196,512 307,612
Total imports 1,125,615 993,872 777,066 407,018 392,645
Ratio of imports to U.S. production of certain coated paper other than packagingpaperboard(percent)
U.S. imports from--
China 26.5 27.8 31.9 36.8 10.0
Indonesia 4.0 4.5 5.5 3.8 1.9
Subtotal 30.6 32.2 37.5 40.7 11.9
All other countries 55.8 51.6 32.9 38.0 43.1
Total imports 86.4 83.8 70.4 78.6 55.0
Ratio of imports to total U.S. production (percent)
U.S. imports from--
China 17.8 17.7 21.2 24.0 7.2
Indonesia 2.7 2.9 3.7 2.5 1.3
Subtotal 20.5 20.6 24.8 26.5 8.6
All other countries 37.4 32.9 21.8 24.7 31.0
Total imports 57.9 53.5 46.7 51.2 39.5
Source: Compiled from data submitted in response to Commission questionnaires and from adjusted Commerce statistics.
IV-13


PART V: PRICING AND RELATED INFORMATION
FACTORS AFFECTING PRICES
Raw Material Costs
U.S. integrated producers of certain coated paper reported that pulp, chemicals and dyes, coatingadditives, and packaging are the principal raw materials used in producing certain coated paper. Most ofthe integrated producers reported that pulp accounts for between *** percent and *** percent of the totalcost of production and that chemicals and dyes account for between *** percent and *** percent. Six ofthe integrated producers reported that the cost of pulp has decreased by *** to *** percent since 2007 andfive reported that the cost of pulp has increased by *** to *** percent. Nearly all of the integratedproducers reported that the cost of chemicals and dyes has increased by *** to *** percent since 2007.
U.S. Inland Transportation Costs
U.S. integrated producers reported that U.S. inland transportation costs of certain coated paperrange from *** to *** percent of the delivered price. Converters reported that U.S. inland transportationcosts range from *** to *** percent of the delivered price. Importers reported that U.S. inlandtransportation costs range from *** to *** percent of the delivered price.
U.S. inland shipping distances for U.S.-produced certain coated paper and certain coated paperproduced in China and Indonesia were requested from both U.S. producers and U.S. importers. For theU.S. producers, *** percent of their U.S. sales in 2009 occurred within distances of 100 miles from theirfacilities, *** percent occurred within distances of 101 to 1,000 miles, and *** percent occurred withindistances over 1,000 miles from their facilities. For converters, *** percent of sales in 2009 occurredwithin 100 miles of their facilities, *** percent of sales occurred within 101 to 1,000 miles, and ***percent occurred within distances over 1,000 miles. For importers of certain coated paper from China,approximately *** percent of sales in 2009 occurred within 100 miles of their storage facilities, ***percent of sales occurred within 101 to 1,000 miles, and *** occurred within distances over 1,000 miles. For importers of certain coated paper from Indonesia, approximately *** percent of sales by value in2009 occurred within 100 miles of their storage facilities, *** percent of sales occurred within 101 to1,000 miles, and *** occurred within distances over 1,000 miles.
PRICING PRACTICES
Pricing Methods
When questionnaire respondents were asked how they determined the prices that they charge forcertain coated paper, *** of the U.S. integrated producers reported the use of price lists, *** reportedusing transaction-by-transaction negotiations, and *** reported ***. *** converters reported the use of***, *** reported using transaction-by-transaction negotiations, and *** reported using both. ***importers of certain coated paper from China reported using transaction-by-transaction negotiations and*** reported the use of price lists. Importers of certain coated paper from Indonesia reported determiningprices *** or through transaction-by-transaction negotiations.
*** U.S. integrated producers reported that they quote prices of certain coated paper on an f.o.b.basis and *** quote prices on a delivered basis. Converters typically quote prices on a delivered basis.*** importers reported that they quote prices of certain coated paper on a delivered basis and ***reported that they quote prices of certain coated paper on an f.o.b. basis.
V-1

Alternative fuel tax credit
In early 2009, U.S. paper mills began applying for and receiving an alternative fuel tax credit of$0.50 per gallon of kraft pulp by-product (or “black liquor”) they produced.1 The tax credit expired at theend of 2009.2 Six U.S. integrated producers and one converter reported receiving the “black liquor” taxcredit. In the preliminary phase of these investigations, respondent parties contended that the alternativefuel tax credit allowed U.S. integrated producers to lower prices on its certain coated paper in 2009.3 ***integrated producers (***) reported that the tax credit had no effect on their sales prices.4 Integratedproducer *** reported that the ***.5 Integrated producer *** reported that, ***.6
Sales Terms and Discounts
U.S. producers and importers of certain coated paper from China and Indonesia were asked whatshare of their sales were on a (1) long-term contract basis (multiple deliveries for more than 12 months),(2) short-term contract basis (up to and including 12 months), and (3) spot sales basis (for a singledelivery) during 2009. *** integrated producers reported that *** of their sales are on a spot basis, twoU.S. integrated producers reported a mixture of short-term contracts and spot sales, *** reported amixture of long-term and short-term contracts and spot sales, and *** reported a mixture of long-termcontracts and spot sales. These producers’ long-term contracts can last from *** to ***.7 Theseproducers’ short-term contracts typically last ***. Most converters reported that they sell exclusively ona spot basis, with *** reporting that most of ***. Converters’ short-term contracts last ***.
Among the importers that reported sales of imports from China, *** reported that *** of theirsales are on a spot basis, *** reported that a majority of their sales are on a long-term contract basis; and*** reported that all of *** sales are on a short-term contract basis. Among the importers that reportedsales of imports from Indonesia, *** reported that *** of their sales are on a spot basis, and *** reportedthat a majority of *** sales are on a long-term contract basis, but also reported some short-term contractsand spot sales. Importers’ long-term contracts typically fix prices with an approximate expected quantity,and do not contain meet-or-release provisions, whereas importers’ short-term contracts fix both price butnot quantity and do not contain meet-or-release provisions.
*** reported that they offer non-standard discounts based on volume. Three converters alsoreported that they offer discounts based on volume. *** of eight responding importers of certain coatedpaper from China and Indonesia reported applying discounts on a transaction-by-transaction basis, eitherbased on volume or to meet competition.
When purchasers were asked if a price leader existed in the certain coated paper market, 21 of 34responding purchasers responded “yes.” Specifically, 14 purchasers reported that U.S. producers are theprice leaders, citing their large market share and the fact that they are typically first in announcing price
1 The tax credit is under Section 6426(e) of the Internal Revenue Code that went into effect in 2007. Petitioners’postconference brief, answers to Staff Questions, exh. 6, p. 2. Such kraft pulp by-product results from theproduction of certain coated paper and other papers, including other coated free sheet papers and coated groundwoodpaper. IRS Notice 2006-92. http://www.irs.gov/pub/irs-drop/n-06-92.pdf.
2 U.S. integrated producer *** reported that it does not expect the alternative fuel tax credit to be renewed.
3 Conference transcript, pp. 12-13 (Durling). Petitioners stated in the preliminary phase of these investigationsthat they ***. Petitioner’s postconference brief, Answer to Staff Questions, exh. 6, p. 8.
4 ***’s U.S. Producers’ Questionnaire responses at IV-3 (b).
5 ***’s U.S. Producers’ Questionnaire response at IV-3 (b).
6 ***’s U.S. Producers’ Questionnaire responses at IV-3 (b).
7 ***.
V-2

increases.8 Four purchasers reported that suppliers of imports from China were price leaders, one citedsuppliers of imports from Indonesia, and two cited suppliers of imports from Asia, stating that theyoffered the lowest prices.
PRICE DATA
The Commission requested U.S. integrated producers, converters, and importers of certain coatedpaper from China and Indonesia to provide quarterly data for the total quantity and f.o.b. value of selectedproducts that were shipped to unrelated customers in the U.S. market.9 Data were requested for the periodJanuary 2007-June 2010. The products for which pricing data were requested are as follows:
Product 1.—Coated paper, two-side coated sheets, 70-100 pounds text basis weights, GE brightness levels equal to or above 86 but less than 90.
Product 2.— Coated paper, two-side coated sheets, 70-100 pounds text basis weights, GE brightness levels equal to or above 90 but less than 96.
Product 3.— Coated paper, one-side coated sheets, 70-100 pounds text basis weights, GE brightness levels equal to or greater than 83.
Product 4.— Coated paper, two-side coated sheets, 80-100 pounds cover basis weights, GE brightness levels equal to or greater than 86 but less than 90.
Product 5. — Coated paper, two-side coated sheets, 80-100 pounds cover basis weights, GE brightness levels equal to or greater than 90 but less than 96.
*** U.S. integrated producers, *** converters,10 *** importers of product imported from China (***), and *** importers of product imported from Indonesia (***) provided pricing data for salesof the requested products, although not all firms reported pricing data for all products for all quarters.11 Pricing data reported by these firms accounted for approximately *** percent of the quantity of U.S.producers’s U.S. shipments of certain coated paper other than coated packaging paperboard, *** percent
8 Two of these purchasers stated that U.S. producers became price leaders from 2009 and into the spring of 2010.
9 For product 1, firms were also asked to report pricing data separately for non-PDB sales and PDB sales. PDBprograms are defined as sales of certain coated paper where the ultimate end-use customer (i.e., the purchaser ofprinted materials from the printer) negotiates the paper source, specifications, and/or price directly with the paperdistributor or the paper mill. In these transactions, the printer for the ultimate end user must use the specified paperand at the specific price. *** integrated producers (***) reported sales of product 1 via PDB programs. The salesprices of product 1 sold via PDB programs reported by these integrated producers were ***. The total sales volumesof product 1 sold via PDB programs ***. Inclusion of sales of product 1 sold via PDB programs ***. Pricing dataon product 1 presented here combine the data reported on non-PDB and PDB sales. Firms were also requested to provide pricing data on sales of imports from nonsubject sources. These prices arepresented in app. D.
10 The U.S. sales prices presented here include sales reported by integrated producers and converters. Salesreported by converters accounted for *** percent of the sales data presented here and do not change the price trendsor margins of underselling. Among the responding converters, *** and *** reported that they *** use U.S.-sourcedsheeter rolls in their conversion of sheets, while *** reported that it used sheeter rolls from ***.
11 Staff excluded pricing data on *** reported by U.S. integrated producer *** because the product it reported***. E-mail from ***.
V-3
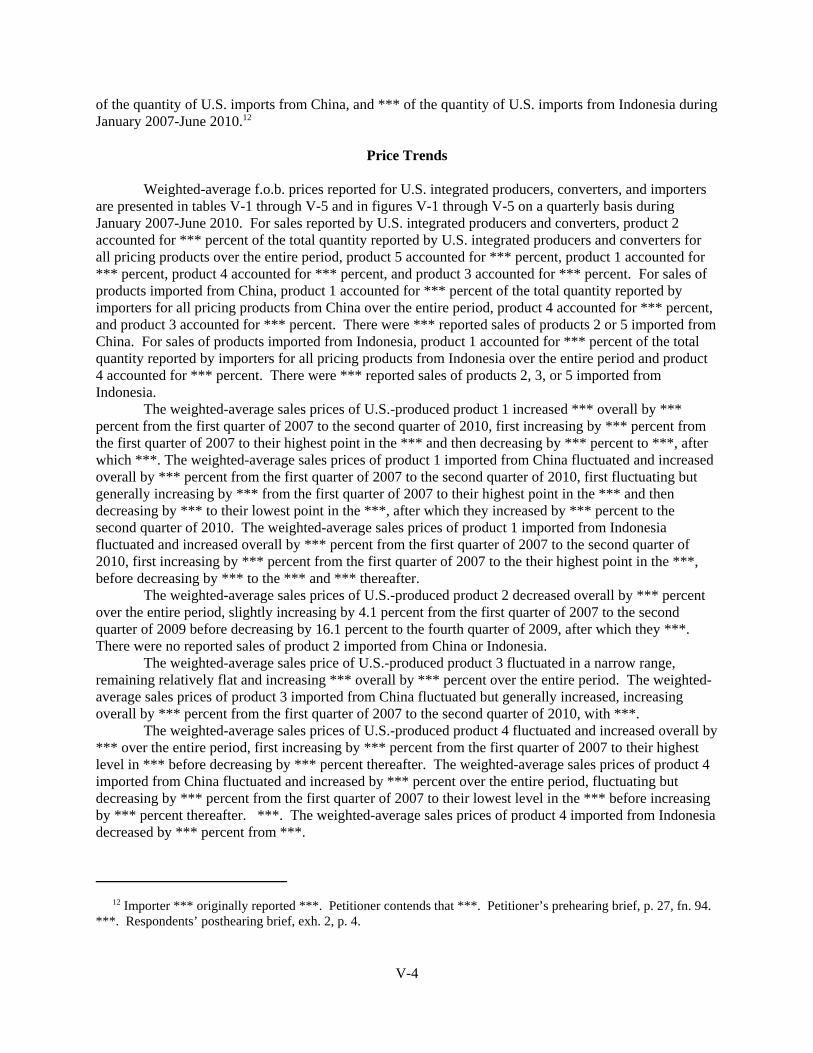
of the quantity of U.S. imports from China, and *** of the quantity of U.S. imports from Indonesia duringJanuary 2007-June 2010.12
Price Trends
Weighted-average f.o.b. prices reported for U.S. integrated producers, converters, and importersare presented in tables V-1 through V-5 and in figures V-1 through V-5 on a quarterly basis duringJanuary 2007-June 2010. For sales reported by U.S. integrated producers and converters, product 2accounted for *** percent of the total quantity reported by U.S. integrated producers and converters forall pricing products over the entire period, product 5 accounted for *** percent, product 1 accounted for*** percent, product 4 accounted for *** percent, and product 3 accounted for *** percent. For sales ofproducts imported from China, product 1 accounted for *** percent of the total quantity reported byimporters for all pricing products from China over the entire period, product 4 accounted for *** percent,and product 3 accounted for *** percent. There were *** reported sales of products 2 or 5 imported fromChina. For sales of products imported from Indonesia, product 1 accounted for *** percent of the totalquantity reported by importers for all pricing products from Indonesia over the entire period and product4 accounted for *** percent. There were *** reported sales of products 2, 3, or 5 imported fromIndonesia.
The weighted-average sales prices of U.S.-produced product 1 increased *** overall by ***percent from the first quarter of 2007 to the second quarter of 2010, first increasing by *** percent fromthe first quarter of 2007 to their highest point in the *** and then decreasing by *** percent to ***, afterwhich ***. The weighted-average sales prices of product 1 imported from China fluctuated and increasedoverall by *** percent from the first quarter of 2007 to the second quarter of 2010, first fluctuating butgenerally increasing by *** from the first quarter of 2007 to their highest point in the *** and thendecreasing by *** to their lowest point in the ***, after which they increased by *** percent to thesecond quarter of 2010. The weighted-average sales prices of product 1 imported from Indonesiafluctuated and increased overall by *** percent from the first quarter of 2007 to the second quarter of2010, first increasing by *** percent from the first quarter of 2007 to the their highest point in the ***,before decreasing by *** to the *** and *** thereafter.
The weighted-average sales prices of U.S.-produced product 2 decreased overall by *** percentover the entire period, slightly increasing by 4.1 percent from the first quarter of 2007 to the secondquarter of 2009 before decreasing by 16.1 percent to the fourth quarter of 2009, after which they ***. There were no reported sales of product 2 imported from China or Indonesia.
The weighted-average sales price of U.S.-produced product 3 fluctuated in a narrow range,remaining relatively flat and increasing *** overall by *** percent over the entire period. The weighted-average sales prices of product 3 imported from China fluctuated but generally increased, increasingoverall by *** percent from the first quarter of 2007 to the second quarter of 2010, with ***.
The weighted-average sales prices of U.S.-produced product 4 fluctuated and increased overall by*** over the entire period, first increasing by *** percent from the first quarter of 2007 to their highestlevel in *** before decreasing by *** percent thereafter. The weighted-average sales prices of product 4imported from China fluctuated and increased by *** percent over the entire period, fluctuating butdecreasing by *** percent from the first quarter of 2007 to their lowest level in the *** before increasingby *** percent thereafter. ***. The weighted-average sales prices of product 4 imported from Indonesiadecreased by *** percent from ***.
12 Importer *** originally reported ***. Petitioner contends that ***. Petitioner’s prehearing brief, p. 27, fn. 94. ***. Respondents’ posthearing brief, exh. 2, p. 4.
V-4
The weighted-average sales prices of U.S.-produced product 5 fluctuated and decreased overallby 13.0 percent, fluctuating in a narrow range from the first quarter of 2007 to the second quarter of 2009,after which they decreased by 15.2 percent to the second quarter of 2010. There were no reported sales ofproduct 5 imported from China or Indonesia.
Table V-1Certain coated paper: Weighted-average f.o.b. prices and quantities of domestic and importedproduct 1 and margins of underselling/(overselling), by quarters, January 2007-June 2010
* * * * * * *
Table V-2Certain coated paper: Weighted-average f.o.b. prices and quantities of domestic product 21, byquarters, January 2007-June 2010
Period
United States
Price(per short ton)
Quantity(short tons)
2007: Jan.-Mar. $1,217.03 55,320
Apr.-June 1,227.19 58,300
July-Sept. 1,243.25 57,878
Oct.-Dec. 1,229.43 54,032
2008: Jan.-Mar. 1,262.72 52,315
Apr.-June 1,270.76 53,101
July-Sept. 1,299.17 47,183
Oct.-Dec. 1,288.65 43,360
2009: Jan.-Mar. 1,280.20 34,581
Apr.-June 1,266.64 35,922
July-Sept. 1,170.19 38,222
Oct.-Dec. 1,063.04 49,398
2010: Jan.-Mar. *** ***
Apr.-June *** ***
1 Coated paper, two-side coated sheets, 70-100 pounds text basis weights, GE brightness levels equalto or above 90 but less than 96.
Source: Compiled from data submitted in response to Commission questionnaires.
V-5

Table V-3Certain coated paper: Weighted-average f.o.b. prices and quantities of domestic and importedproduct 3 and margins of underselling/(overselling), by quarters, January 2007-June 2010
* * * * * * *
Table V-4Certain coated paper: Weighted-average f.o.b. prices and quantities of domestic and importedproduct 4 and margins of underselling/(overselling), by quarters, January 2007-June 2010
* * * * * * *
Table V-5Certain coated paper: Weighted-average f.o.b. prices and quantities of domestic product 51 andmargins of underselling/(overselling), by quarters, January 2007-June 2010
Period
United States
Price(per short ton)
Quantity(short tons)
2007: Jan.-Mar. $1,338.17 43,606
Apr.-June 1,346.43 42,134
July-Sept. 1,336.61 44,799
Oct.-Dec. 1,352.44 45,951
2008: Jan.-Mar. 1,323.60 42,789
Apr.-June 1,327.70 39,362
July-Sept. 1,350.19 40,359
Oct.-Dec. 1,387.41 35,571
2009: Jan.-Mar. 1,394.03 26,046
Apr.-June 1,372.05 27,398
July-Sept. 1,269.98 33,225
Oct.-Dec. 1,196.20 40,054
2010: Jan.-Mar. 1,177.87 38,099
Apr.-June 1,164.08 41,629
1 Coated paper, two-side coated sheets, 80-100 pounds cover basis weights, GE brightness levels equal to orgreater than 90 but less than 96.
Source: Compiled from data submitted in response to Commission questionnaires.
V-6

Figure V-1Certain coated paper: Weighted-average f.o.b prices and quantities of domestic and importedproduct 1, by quarters, January 2007-June 2010
* * * * * * *
Figure V-2Certain coated paper: Weighted-average f.o.b prices and quantities of domestic product 2, byquarters, January 2007-June 2010
* * * * * * *
Figure V-3Certain coated paper: Weighted-average f.o.b prices and quantities of domestic and importedproduct 3, by quarters, January 2007-June 2010
* * * * * * *
Figure V-4Certain coated paper: Weighted-average f.o.b prices and quantities of domestic and importedproduct 4, by quarters, January 2007-June 2010
* * * * * * *
V-7
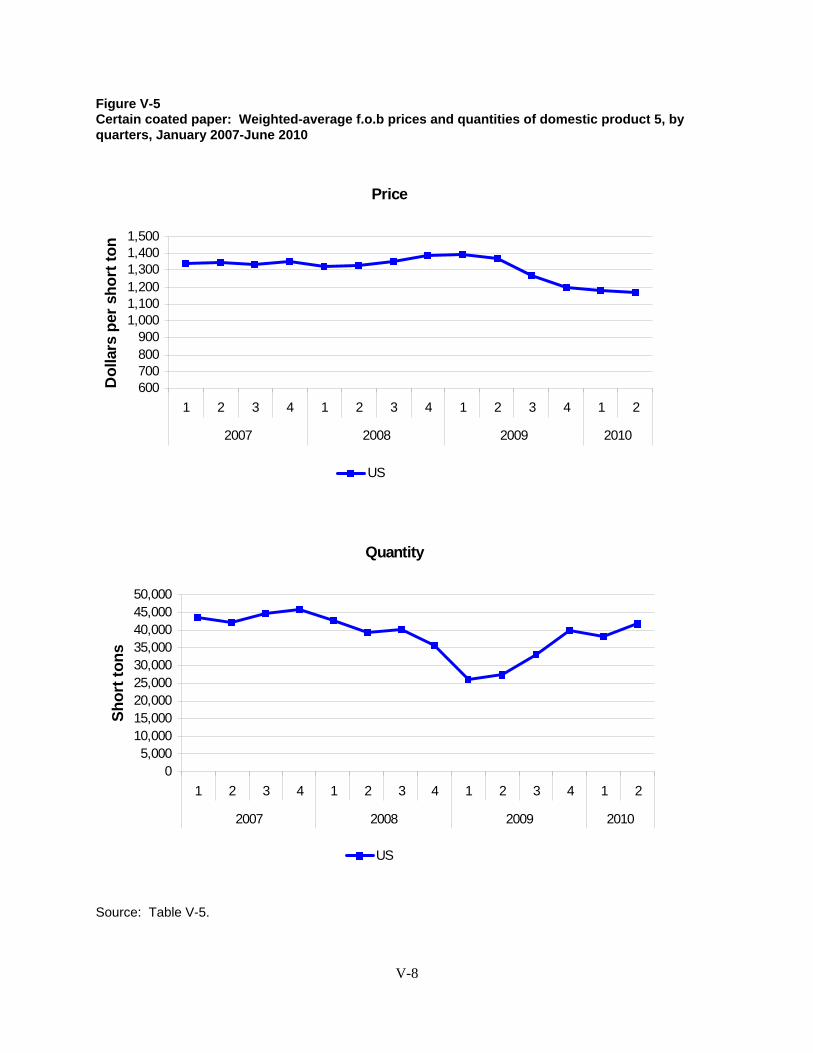
Price
600700800900
1,0001,1001,2001,3001,4001,500
1 2 3 4 1 2 3 4 1 2 3 4 1 2
2007 2008 2009 2010
Do
llars
per
sh
ort
to
n
US
Quantity
05,000
10,00015,00020,00025,00030,00035,00040,00045,00050,000
1 2 3 4 1 2 3 4 1 2 3 4 1 2
2007 2008 2009 2010
Sh
ort
to
ns
US
Figure V-5Certain coated paper: Weighted-average f.o.b prices and quantities of domestic product 5, byquarters, January 2007-June 2010
Source: Table V-5.
V-8

Table V-6Certain coated paper: Summary of weighted-average f.o.b. prices for products 1-5 from the UnitedStates, China, and Indonesia
Item Number ofquarters
Low price (per short ton)
High price(per short ton)
Change in price1
(percent)
Product 1
United States 14 $*** $*** ***
China 14 *** *** ***
Indonesia 14 *** *** ***
Product 2
United States 14 *** *** ***
China 0 (2) (2) (2)
Indonesia 0 (2) (2) (2)
Product 3
United States 14 *** *** ***
China 14 *** *** ***
Indonesia 0 (2) (2) (2)
Product 4
United States 14 *** *** ***
China 14 *** *** ***
Indonesia 2 *** *** ***
Product 5
United States 14 1,164.08 1,394.03 -13.0
China 0 (2) (2) (2)
Indonesia 0 (2) (2) (2)
1 Percentage change from the first quarter in which price data were available to the last quarter in which price datawere available, based on unrounded data. 2 Not applicable.
Source: Compiled from data submitted in response to Commission questionnaires.
Price Comparisons
Margins of underselling and overselling for the period are presented by product category in table V-7. The data show that prices of imports from China were lower than the U.S. producers’ prices in 39out of 42 quarterly comparisons, by margins ranging from 1.5 percent to 25.2 percent. The prices ofimports from China were higher than U.S. producers’ prices in 3 quarterly comparisons, by marginsranging from 1.4 to 14.3 percent. The data show that prices of imports from Indonesia were lower than the U.S. producer prices in 9 out of 16 quarterly comparisons, by margins ranging from 2.6 percent to14.4 percent. The prices of imports from Indonesia were higher than U.S. producers’ prices in 7 quarterlycomparisons, by margins ranging from 0.6 to 18.7 percent.
Respondents contend that U.S. product sells at a “natural premium” to subject imports, due to shorterlead times, more secure supply chains, and purchasers’ preferences to buy U.S. product.13 U.S. producer
13 Respondents’ prehearing brief, p. 65.
V-9
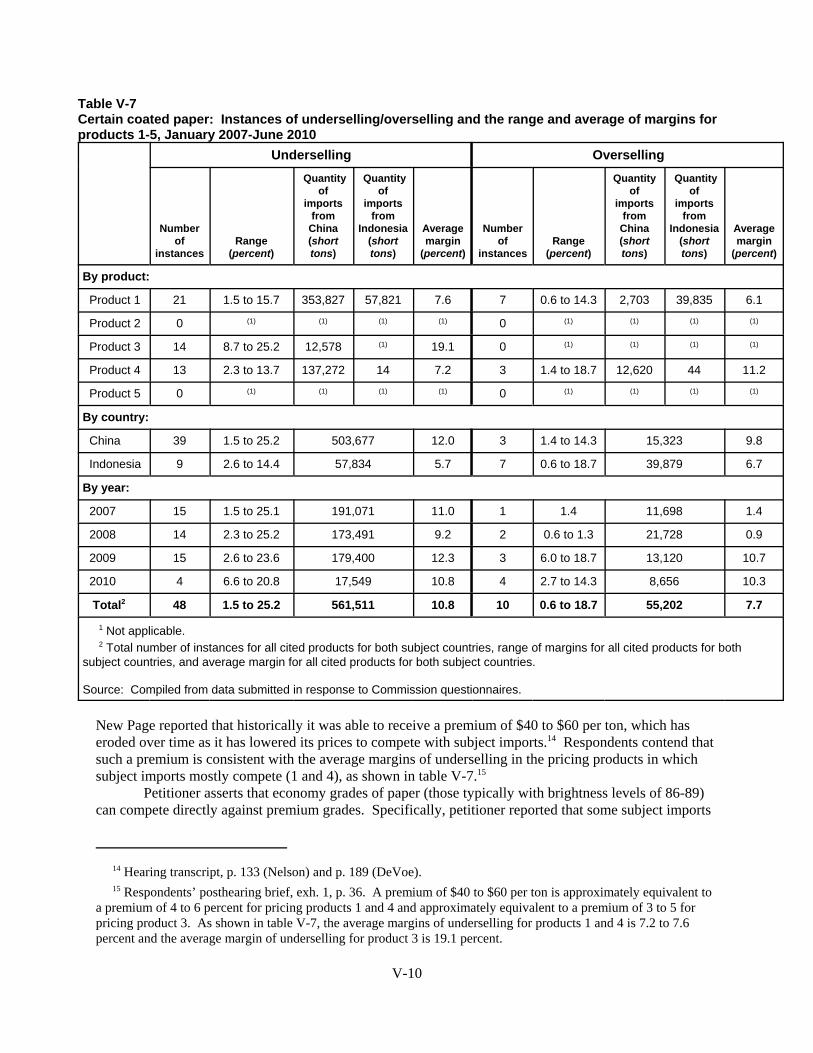
Table V-7Certain coated paper: Instances of underselling/overselling and the range and average of margins forproducts 1-5, January 2007-June 2010
Underselling Overselling
Numberof
instancesRange
(percent)
Quantityof
importsfrom
China(shorttons)
Quantityof
importsfrom
Indonesia(shorttons)
Averagemargin
(percent)
Numberof
instancesRange
(percent)
Quantityof
importsfrom
China(shorttons)
Quantityof
importsfrom
Indonesia(shorttons)
Averagemargin
(percent)
By product:
Product 1 21 1.5 to 15.7 353,827 57,821 7.6 7 0.6 to 14.3 2,703 39,835 6.1
Product 2 0 (1) (1) (1) (1) 0 (1) (1) (1) (1)
Product 3 14 8.7 to 25.2 12,578 (1) 19.1 0 (1) (1) (1) (1)
Product 4 13 2.3 to 13.7 137,272 14 7.2 3 1.4 to 18.7 12,620 44 11.2
Product 5 0 (1) (1) (1) (1) 0 (1) (1) (1) (1)
By country:
China 39 1.5 to 25.2 503,677 12.0 3 1.4 to 14.3 15,323 9.8
Indonesia 9 2.6 to 14.4 57,834 5.7 7 0.6 to 18.7 39,879 6.7
By year:
2007 15 1.5 to 25.1 191,071 11.0 1 1.4 11,698 1.4
2008 14 2.3 to 25.2 173,491 9.2 2 0.6 to 1.3 21,728 0.9
2009 15 2.6 to 23.6 179,400 12.3 3 6.0 to 18.7 13,120 10.7
2010 4 6.6 to 20.8 17,549 10.8 4 2.7 to 14.3 8,656 10.3
Total2 48 1.5 to 25.2 561,511 10.8 10 0.6 to 18.7 55,202 7.7
1 Not applicable.
2 Total number of instances for all cited products for both subject countries, range of margins for all cited products for bothsubject countries, and average margin for all cited products for both subject countries.
Source: Compiled from data submitted in response to Commission questionnaires.
New Page reported that historically it was able to receive a premium of $40 to $60 per ton, which haseroded over time as it has lowered its prices to compete with subject imports.14 Respondents contend thatsuch a premium is consistent with the average margins of underselling in the pricing products in whichsubject imports mostly compete (1 and 4), as shown in table V-7.15
Petitioner asserts that economy grades of paper (those typically with brightness levels of 86-89)can compete directly against premium grades. Specifically, petitioner reported that some subject imports
14 Hearing transcript, p. 133 (Nelson) and p. 189 (DeVoe).
15 Respondents’ posthearing brief, exh. 1, p. 36. A premium of $40 to $60 per ton is approximately equivalent toa premium of 4 to 6 percent for pricing products 1 and 4 and approximately equivalent to a premium of 3 to 5 forpricing product 3. As shown in table V-7, the average margins of underselling for products 1 and 4 is 7.2 to 7.6percent and the average margin of underselling for product 3 is 19.1 percent.
V-10

straddle the economy grade and the premium grade and thus can compete directly with both economy andpremium domestic products.16 Moreover, petitioner reported that the prices of the different grades ofcertain coated paper impact one another. Petitioner asserts that the historical relationship between theprices the U.S. industry charges for the premium grades and the economy grades widened to an“unsustainable” level in the ***, as the prices of economy grade products declined sharply, leading toprice reductions in the premium grades in ***.17
Respondents contend that the prices of U.S. producers’ premium grades fell, not because ofsubject imports, but because purchasers shifted to economy grades during the recession in order to savemoney on print jobs.18 Respondents also assert that U.S. producers had an incentive to reduce their priceson the premium grades in order to maintain volume on high-margin product.19 Respondents furthercontend that the shift among purchasers from premium grades to economy grades began in ***.20
Petitioner also asserts that the determining factor in U.S. profit margins and prices is subjectimport volumes. In its prehearing brief, petitioner presented econometric estimates21 of the effect ofsubject and nonsubject import volumes and demand on the U.S. industry profit margin, defined here asthe sales price of certain coated paper minus the price of pulp.22 Notably, petitioner’s model does notinclude an estimate of the effect of the price of pulp on the profit margin because petitioner asserts that
16 Hearing transcript, p. 219 (DeVoe) and pp. 216-217 (Nelson).
17 Hearing transcript, p. 132 (Miller) and p. 118 (Van Ert). When asked for the historical relationship between theprices of different grades, petitioner reported that from ***, U.S. producer ***’s intermediate premium gradeproduct #2 was priced between *** percent above its economy grade product #3 and its highest premium gradeproduct #1 was priced between *** percent above its economy grade product during this period. Petitioner’sposthearing brief, responses to staff questions, exh. 1, p. 1.
18 Respondents’ posthearing brief, p. 8.
19 Respondents’ posthearing brief, exh. 1, p. 16.
20 Respondents’ posthearing brief, p. 6.
21 Petitioner also submitted a regression based on a difference-in-difference model in which it attempts to estimatethe effect of the explanatory variables listed above on the difference between the price of certain coated paper (i.e.,sheets) and the price of coated web rolls. Petitioner reported that such a model can capture the effect of cost anddemand variables omitted from its regression summarized above due to lack of data. Petitioner’s difference-in-difference model implicitly assumes that certain coated paper sheets and coated web rolls face similar supply anddemand drivers but that only coated paper sheets face competition from dumped imports. Petitioner’s prehearingbrief, exh. 5, pp. 10-12. Respondents contend that web roll prices face demand factors unrelated to subject importsthat are different than the demand factors for certain coated paper sheets; namely, they state that coated web rolls areused in the printing of catalogs, magazines, text books, and publications, whereas certain coated paper sheets areused in commercial printing consisting of annual reports, high-end brochures, and advertisements. Respondents’posthearing brief, exh. 6, p. 10 and att. B.
22 Specifically, petitioner defined U.S. industry performance as U.S. producer ***’s U.S. sales price of #3economy grade certain coated paper sheets minus the cost of pulp as measured by RISI. It states that it used ***’ssales prices of its #3 coated sheet because there are no public historical price series available for certain coatedpaper. Petitioner’s prehearing brief, exh. 5, p. 4. Staff estimates that the correlation coefficient between the *** #3coated sheet price series and U.S. prices of pricing product 1 (the pricing product that most closely matches #3coated sheet) is ***. Staff also estimates that the *** #3 coated sheet price series is relatively highly correlated withthe U.S. prices of pricing products 2, 4, and 5 (with correlation coefficients ranging between ***), but is not veryhighly correlated with U.S. sales prices of pricing product 3 (with a correlation coefficient of ***). Petitioner’sregression also includes seasonal quarterly effects and is based on quarterly data from the first quarter of 2002 to thefirst quarter of 2010. Petitioner used a commercial print activity index as measured by RISI as a proxy for demand.
V-11
changes in the price of pulp lead to equal changes in the sales price of certain coated paper and thus haveno impact on U.S. profit margins.23 Petitioner reported that its model indicates that subject importvolumes have a “statistically significant negative impact” and that demand did not have a statisticallysignificant impact on U.S. profit margins.24 More specifically, petitioner estimates that the U.S.industry’s profit margin falls by $*** for every additional ton of subject imports.25
Respondents assert that petitioner’s proposed econometric model disregards the important effectof the price of pulp on the U.S. industry’s profit margins, possibly causing biased results.26 Respondents,therefore, presented an alternative econometric model in which they include the price of pulp as anotherexplanatory factor in determining U.S. profit margins, in addition to those proposed by petitioner,effectively allowing for changes in raw material costs not to be fully passed through to the sales price.27 Respondents reported that their alternative model indicates that the price of pulp and demand are bothstatistically significant and “economically meaningful drivers” of the U.S. industry’s profit margin,whereas the impact of subject import volumes was “very small.”28 More specifically, they estimate that aone percent increase in the price of pulp is associated with a *** percent decline in the profit margin andthat a one percent increase in the commercial print index is associated with a *** percent increase in theprofit margin.29
LOST SALES AND LOST REVENUES
The Commission requested that U.S. integrated producers and converters report any instances oflost sales or revenues they experienced due to competition from imports of certain coated paper fromChina and Indonesia since January 2006.30 Integrated producers and converters provided *** lost salesallegations totaling $*** and *** lost revenues allegations totaling $***. Staff contacted the ***purchasers cited in the allegations; *** responded. *** confirmed lost sales allegations totaling $*** and
23 Petitioner stated that its model implicitly assumes that domestic producer pass through changes in raw materialcosts one-for-one. Petitioner’s posthearing brief, responses to staff questions, exh. 2, p. 3.
24 Ibid. Staff notes that one cannot necessarily infer magnitude or the true sign of the parameter based onstatistical significance alone. See James J. Fetzer, “Inference for econometric modeling in antidumping,countervailing duty and safeguard investigations,” World Trade Review (2009) 8(4): 377, 377-380.
25 Petitioner also reported that the interval of estimates of the effect of subject imports on profit margins rangefrom $*** to $***. Petitioner’s posthearing brief, responses to staff questions, exh. 2, pp. 3-4.
26 Respondents stated that omitting a relevant variable can lead to bias in the coefficients of the remainingvariables. Respondents’ posthearing brief, exh. 6, p. 1.
27 Respondents’ model, therefore, implicitly assumes that U.S. producers pass through raw material costs at a rateother than one-for-one. Respondents also presented a second alternative model, in which they incorporated subjectimport prices (instead of subject import volumes) as one of the explanatory factors. That model also indicates thatthe price of pulp and demand are the principal factors in determining the profit margin. Respondent’s posthearingbrief, exh. 6, p. 18.
28 Respondents’ posthearing brief, exh. 6, p. 1.
29 Respondents’ posthearing brief, exh. 6, p. 12. Respondents also presented the estimates of the percentcontribution to the change in the profit margin is explained by each factor; namely, they estimate that changes in theprice of pulp account for *** percent of the change in the price-minus-pulp margin; changes in demand account for*** percent; and changes in subject import volumes account for *** percent. Respondents’ posthearing brief, exh. 6,p. 15.
30 *** allegations provided by converters total $*** or *** percent of the total value of lost sales allegations and*** allegations provided by converters total $*** or *** percent of the total value of lost revenues allegations.
V-12
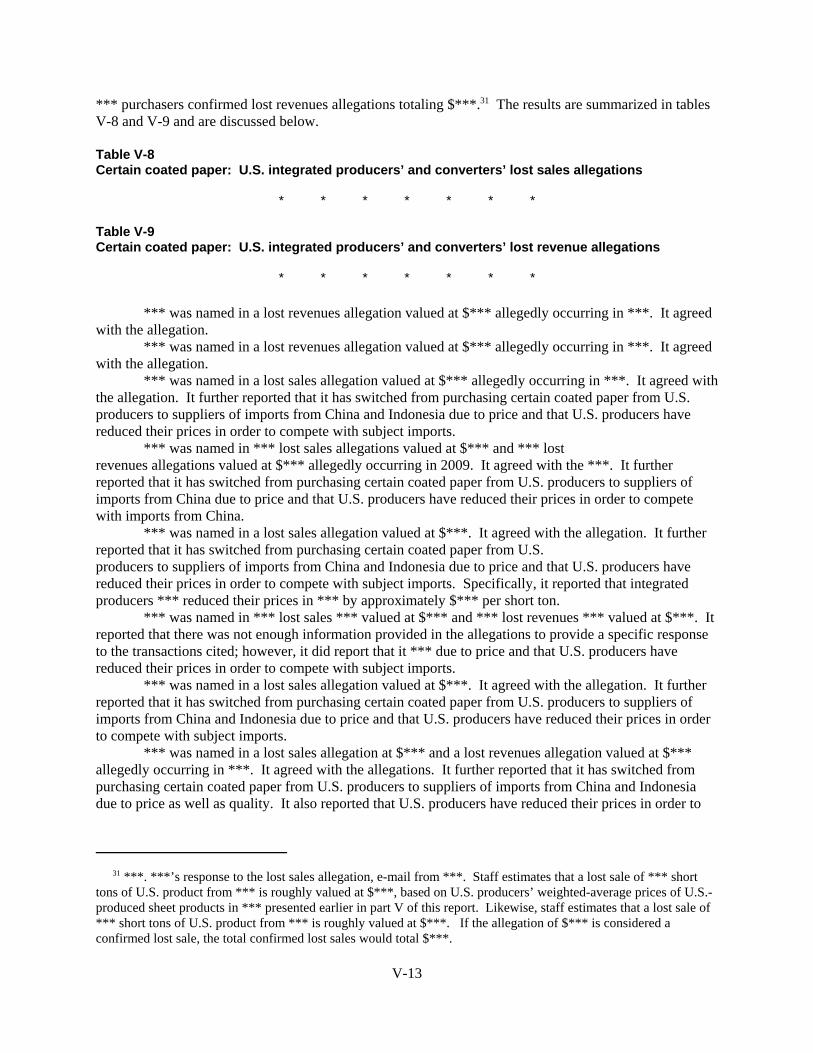
*** purchasers confirmed lost revenues allegations totaling $***.31 The results are summarized in tablesV-8 and V-9 and are discussed below.
Table V-8Certain coated paper: U.S. integrated producers’ and converters’ lost sales allegations
* * * * * * *
Table V-9Certain coated paper: U.S. integrated producers’ and converters’ lost revenue allegations
* * * * * * *
*** was named in a lost revenues allegation valued at $*** allegedly occurring in ***. It agreedwith the allegation.
*** was named in a lost revenues allegation valued at $*** allegedly occurring in ***. It agreedwith the allegation.
*** was named in a lost sales allegation valued at $*** allegedly occurring in ***. It agreed withthe allegation. It further reported that it has switched from purchasing certain coated paper from U.S.producers to suppliers of imports from China and Indonesia due to price and that U.S. producers havereduced their prices in order to compete with subject imports.
*** was named in *** lost sales allegations valued at $*** and *** lost revenues allegations valued at $*** allegedly occurring in 2009. It agreed with the ***. It furtherreported that it has switched from purchasing certain coated paper from U.S. producers to suppliers ofimports from China due to price and that U.S. producers have reduced their prices in order to competewith imports from China.
*** was named in a lost sales allegation valued at $***. It agreed with the allegation. It furtherreported that it has switched from purchasing certain coated paper from U.S. producers to suppliers of imports from China and Indonesia due to price and that U.S. producers havereduced their prices in order to compete with subject imports. Specifically, it reported that integratedproducers *** reduced their prices in *** by approximately $*** per short ton.
*** was named in *** lost sales *** valued at $*** and *** lost revenues *** valued at $***. Itreported that there was not enough information provided in the allegations to provide a specific responseto the transactions cited; however, it did report that it *** due to price and that U.S. producers havereduced their prices in order to compete with subject imports.
*** was named in a lost sales allegation valued at $***. It agreed with the allegation. It furtherreported that it has switched from purchasing certain coated paper from U.S. producers to suppliers ofimports from China and Indonesia due to price and that U.S. producers have reduced their prices in orderto compete with subject imports.
*** was named in a lost sales allegation at $*** and a lost revenues allegation valued at $***allegedly occurring in ***. It agreed with the allegations. It further reported that it has switched frompurchasing certain coated paper from U.S. producers to suppliers of imports from China and Indonesiadue to price as well as quality. It also reported that U.S. producers have reduced their prices in order to
31 ***. ***’s response to the lost sales allegation, e-mail from ***. Staff estimates that a lost sale of *** shorttons of U.S. product from *** is roughly valued at $***, based on U.S. producers’ weighted-average prices of U.S.-produced sheet products in *** presented earlier in part V of this report. Likewise, staff estimates that a lost sale of*** short tons of U.S. product from *** is roughly valued at $***. If the allegation of $*** is considered aconfirmed lost sale, the total confirmed lost sales would total $***.
V-13
compete with subject imports, but that prices of imports from Europe, Korea, and Japan have also drivenprices down.
*** was named in a lost sales allegation valued at $***. It did not respond to the specifictransaction cited in the allegation, but did report that it has switched from purchasing certain coated paperfrom U.S. producers to suppliers of imports from China due to price and that U.S. producers have reducedtheir prices to compete with imports from China.
*** was named in a lost sales allegation valued at $*** allegedly occurring in ***. *** reportedthat it did reduce its purchases from U.S. producers by *** short tons from *** and increased itspurchases of imports from China by *** short tons in that period, due to a variety of factors, one of whichmay have been price.32 *** then switched from purchasing subject imports in *** to U.S. integratedproducer *** and ***.33 ***. ***. Respondents claim that ***.34
***.35 ***.36 *** was named in *** lost revenues *** allegedly occurring in ***. It disagreed with the
allegations, stating that the prices cited in the allegations ***. *** further reported that it has not switchedfrom purchasing certain coated paper from U.S. producers to suppliers of imports from China and/orIndonesia; however, it did report that U.S. producers have reduced their prices in order to compete withsubject imports.
*** was named in *** lost sales ***, *** valued at $*** and another ***. It disagreed with theallegations, stating that ***. Specifically, it reported that ***. ***. It also reported that ***.
***.37 ***.38 ***.39 It further reported that it has not switched purchasing certain coated paper from U.S.
producers to suppliers of imports from China and/or Indonesia; however, it did report that U.S. producershave reduced their prices in order to compete with subject imports.
32 ***’s response to the lost sales allegation, e-mail from ***.
33 Respondents’ postconference brief, pp. 45-46.
34 Respondents’ postconference brief, at exh. 1, pp. 7-8.
35 Petitioners’ postconference brief, “Answers to Staff Questions,” pp. 2-3.
36 Petitioners’ postconference brief, “Answers to Staff Questions,” exh. Q4-2.
37 ***’s Purchasers’ Questionnaire response at II-4 (a) and (b).
38 Respondents’ postconference brief, exh. 19.
39 ***’s Purchasers’ Questionnaire response at II-4 (a) and (b).
V-14

PART VI: FINANCIAL EXPERIENCE OF THE U.S. PRODUCERS
BACKGROUND
The financial results on certain coated paper other than coated packaging paperboard representthe combined operations of Appleton, Cascade, Clearwater, International Paper, MeadWestvaco,Mohawk, NewPage, Sappi, and Smart Papers, which are integrated or semi-integrated producers. Thefollowing converters are also included in the financial results on certain coated paper other than coatedpackaging paperboard: Nekoosa, Resource One, Wausau, and Williams Paper.1 Financial results oncoated packaging paperboard, as described in a previous section of this report, were reported by producersClearwater, Georgia Pacific, MeadWestvaco, and Rock-Tenn. (Note: Clearwater and MeadWestvaco areclassified as producing both certain coated paper other than coated packaging paperboard and coatedpackaging paperboard).
Overall revenue represents commercial sales comprised primarily of domestic shipments followedby smaller shares of exports. Revenue for coated packaging paperboard also includes internalconsumption reported by ***.2 With the exception of Sappi, financial results were reported on the basisof U.S. generally accepted accounting principles (“GAAP”).3 The U.S. producer questionnaire responseof NewPage was verified on August 10-11, 2010. Revisions pursuant to verification are reflected in thisand other sections of the staff report.4
OPERATIONS ON CERTAIN COATED PAPER OTHER THANCOATED PACKAGING PAPERBOARD
Income-and-loss data for operations on certain coated paper other than coated packagingpaperboard are presented in table VI-1 and on an average unit basis in table VI-2.5 A corresponding
1 ***. USITC auditor final-phase notes.
2 ***. Ibid.
3 Sappi’s financial results are based on International Financial Reporting Standards (IFRS). With the exception ofRock-Tenn and Williams Paper, which both reported on the basis of fiscal-years ending in September, financialresults were reported on a calendar-year basis. The following companies (all converters) are not reflected in the industry’s financial results because the financialsections of their U.S. producer questionnaire responses were incomplete or largely incomplete: ***. Ibid. To theextent that these companies responded to the Commission’s question regarding actual and anticipated negativeeffects due to subject imports, their responses are reflected in this section of the report. ***, a converter thatreported its financial results for the preliminary phase of these investigations did not submit a U.S. producerquestionnaire response for the final phase. ***. Ibid.
4 Verification report, pp. 2-3.
5 Differences between the trade section and financial section of this report, in terms of total sales/shipmentvolume and value, in part reflect the elimination of converters in the trade section in order to avoid the doublecounting of volume. Staff also notes that some double counting of sales volume is inevitable when combining thefinancial results of producers and converters. However, the aggregated financial results are still generallymeaningful on a consolidated basis due to the offsetting effect of any double counted volume being reported once asrevenue at the integrated level and again as a component of raw material cost at the converter level. Because totalsales volume reflects some double counting, average sales and cost values on a producer and converter-basis aremore specific to those operations (see table VI-3) as compared to average values based on consolidated financialresults (see table VI-2). As noted above and with regard to other differences between trade and financial section, ***. USITC auditorfinal-phase notes.
VI-1
variance analysis of the financial results of operations on certain coated paper other than coatedpackaging paperboard is presented in table VI-3.6
As shown in table VI-1, a notable trend of the financial results on certain coated paper other thancoated packaging paperboard was the steady decline in sales volume and corresponding sales revenuethroughout the full-year period. While the overall decline in absolute operating income between 2007and 2009 can be attributed to a combination of negative price, cost/expense, and volume variances (seesummary section of table VI-3), period-to-period negative variances alternated; i.e., the negative costexpense variance occurred between 2007 and 2008, while the negative price variance occurred between2008 and 2009. Table VI-2, which presents average unit values, indicates that the full-year period-to-period cost/expense variances were driven largely by changes in raw material costs. Notwithstanding thelarge negative price variance between interim 2009 and interim 2010, interim 2010 profitability marginswere at about the same level as full-year 2009. As shown in the summary section of table VI-3, theabsence of a further decline in relative profitability in interim 2010 is due largely to an even largercorresponding positive cost/expense variance. Product and company-specific financial results arediscussed further in the combined financial results section below.
OPERATIONS ON COATED PACKAGING PAPERBOARD
Income-and-loss data for operations on coated packaging paperboard are presented in table VI-4and on an average unit basis in table VI-5. A variance analysis for the financial results of operations oncoated packaging paperboard is presented in table VI-6.
The pattern of sales volume and corresponding revenue for coated packaging paperboard wassomewhat different compared to certain coated paper other than coated packaging paperboard (see tableVI-1). As shown in table VI-4, coated packaging paperboard sales peaked in 2008 and subsequentlydeclined. A primary similarity between the two product groups is that both reported negativecost/expense variances between 2007 and 2008 which contributed to corresponding declines inprofitability. Unlike the financial results on certain coated paper other than packaging paperboard,however, coated packaging paperboard reported a notable increase in profitability in 2009 which isattributable, at least in part, to simultaneous positive price and cost/expense variances between 2008 and2009 (see summary section of table VI-6). As shown in table VI-5, the components of COGS whichcontributed most importantly to the positive cost/expense variance were lower average raw materials and
6 The Commission’s variance analysis is generally calculated in three parts: sales variance, cost of sales variance,and SG&A expense variance. Each part consists of a price variance (in the case of the sales variance) or a costvariance (in the case of the cost of sales and SG&A expense variance) and a volume variance. The sales or costvariance is calculated as the change in unit price times the new volume, while the volume variance is calculated asthe change in volume times the old unit price. Summarized at the bottom of table VI-3 and table VI-6, the pricevariance is from sales, the cost/expense variance is the sum of those items from COGS and SG&A variances,respectively, and the volume variance is the sum of the corresponding lines under the price and cost/expensevariances.
VI-2
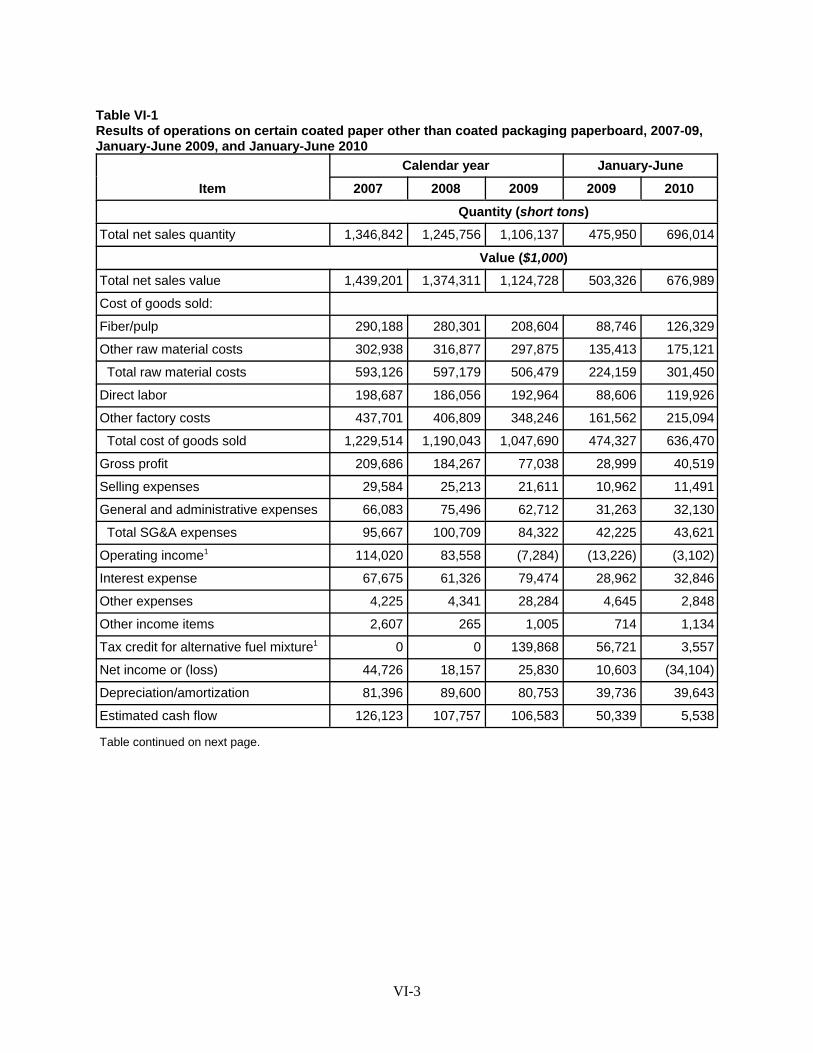
Table VI-1Results of operations on certain coated paper other than coated packaging paperboard, 2007-09,January-June 2009, and January-June 2010
Item
Calendar year January-June
2007 2008 2009 2009 2010
Quantity (short tons)
Total net sales quantity 1,346,842 1,245,756 1,106,137 475,950 696,014
Value ($1,000)
Total net sales value 1,439,201 1,374,311 1,124,728 503,326 676,989
Cost of goods sold:
Fiber/pulp 290,188 280,301 208,604 88,746 126,329
Other raw material costs 302,938 316,877 297,875 135,413 175,121
Total raw material costs 593,126 597,179 506,479 224,159 301,450
Direct labor 198,687 186,056 192,964 88,606 119,926
Other factory costs 437,701 406,809 348,246 161,562 215,094
Total cost of goods sold 1,229,514 1,190,043 1,047,690 474,327 636,470
Gross profit 209,686 184,267 77,038 28,999 40,519
Selling expenses 29,584 25,213 21,611 10,962 11,491
General and administrative expenses 66,083 75,496 62,712 31,263 32,130
Total SG&A expenses 95,667 100,709 84,322 42,225 43,621
Operating income1 114,020 83,558 (7,284) (13,226) (3,102)
Interest expense 67,675 61,326 79,474 28,962 32,846
Other expenses 4,225 4,341 28,284 4,645 2,848
Other income items 2,607 265 1,005 714 1,134
Tax credit for alternative fuel mixture1 0 0 139,868 56,721 3,557
Net income or (loss) 44,726 18,157 25,830 10,603 (34,104)
Depreciation/amortization 81,396 89,600 80,753 39,736 39,643
Estimated cash flow 126,123 107,757 106,583 50,339 5,538
Table continued on next page.
VI-3

Table VI-1--ContinuedResults of operations on certain coated paper other than coated packaging paperboard, 2007-09,January-June 2009, and January-June 2010
Item
Calendar year January-June
2007 2008 2009 2009 2010
Ratio to net sales (percent)
Fiber/pulp 20.2 20.4 18.5 17.6 18.7
Other raw material costs 21.0 23.1 26.5 26.9 25.9
Total raw material costs 41.2 43.5 45.0 44.5 44.5
Direct labor 13.8 13.5 17.2 17.6 17.7
Other factory costs 30.4 29.6 31.0 32.1 31.8
Cost of goods sold 85.4 86.6 93.2 94.2 94.0
Gross profit 14.6 13.4 6.8 5.8 6.0
SG&A expenses 6.6 7.3 7.5 8.4 6.4
Operating income (loss)1 7.9 6.1 (0.6) (2.6) (0.5)
Net income or (loss) 3.1 1.3 2.3 2.1 (5.0)
Number of producers reporting
Operating losses1 4 3 7 7 5
Data 13 13 13 13 13 1 The Commission’s U.S. producer questionnaire classified the alternative fuel mixture tax credit as a separate“other” (non-operating) income item. If the alternative fuel mixture tax credit were treated as a component ofoperating income, operating income for the period examined would be as follows:
Value ($1,000)
Operating income 114,020 83,558 132,584 43,495 455
Ratio to net sales (percent)
Operating income 7.9 6.1 11.8 8.6 0.1
COGS 85.4 86.6 80.7 83.0 93.5
Number of producers reporting
Operating losses 4 3 4 5 5
Source: Compiled from data submitted in response to Commission questionnaires.
VI-4

Table VI-2Results of operations on certain coated paper other than coated packaging paperboard (per shortton), 2007-09, January-June 2009, and January-June 2010
Item
Calendar year January-June
2007 2008 2009 2009 2010
Unit value (dollars per short ton)
Total net sales 1,069 1,103 1,017 1,058 973
Cost of goods sold:
Fiber/Pulp 215 225 189 186 182
Other raw materials 225 254 269 285 252
Total raw materials 440 479 458 471 433
Direct labor 148 149 174 186 172
Other factory costs 325 327 315 339 309
Total cost of goods sold 913 955 947 997 914
Gross profit 156 148 70 61 58
SG&A expenses 71 81 76 89 63
Operating income (loss)1 85 67 (7) (28) (4) 1 The Commission’s U.S. producer questionnaire classified the alternative fuel mixture tax credit as a separate“other” (non-operating) income item. If the alternative fuel mixture tax credit were treated as a component ofoperating income, operating income for the period examined would be as follows:
Unit value (dollars per short ton)
Operating income 85 67 120 91 1
Source: Compiled from data submitted in response to Commission questionnaires.
VI-5

Table VI-3Variance analysis of financial results of operations on certain coated paper other than coatedpackaging paperboard, 2007-09, January-June 2009, and January-June 2010
Item
Calendar year Jan.-June
2007-09 2007-08 2008-09 2009-10
Value ($1,000)
Total net sales:
Price variance (57,263) 43,128 (95,557) (59,058)
Volume variance (257,210) (108,018) (154,026) 232,721
Total net sales variance (314,473) (64,890) (249,583) 173,663
Cost of sales:
Raw materials:
Cost variance (19,355) (48,569) 23,770 26,353
Volume variance 106,002 44,517 66,929 (103,644)
Net raw material variance 86,647 (4,052) 90,699 (77,291)
Direct labor:
Cost variance (29,786) (2,282) (27,761) 9,649
Volume variance 35,509 14,912 20,852 (40,968)
Net direct labor variance 5,722 12,631 (6,908) (31,320)
Other factory costs:
Cost variance 11,231 (1,959) 12,970 21,168
Volume variance 78,225 32,851 45,593 (74,701)
Net other factory cost variance 89,456 30,892 58,563 (53,533)
Net cost of sales:
Cost variance (37,911) (52,809) 8,980 57,170
Volume variance 219,736 92,280 133,374 (219,313)
Total net cost of sales variance 181,825 39,471 142,354 (162,143)
Gross profit variance (132,648) (25,419) (107,229) 11,520
SG&A expenses:
Expense variance (5,753) (12,222) 5,100 18,127
Volume variance 17,097 7,180 11,287 (19,523)
Total SG&A variance 11,344 (5,042) 16,386 (1,396)
Operating income variance (121,304) (30,461) (90,843) 10,124
Summarized as:
Price variance (57,263) 43,128 (95,557) (59,058)
Net cost/expense variance (43,664) (65,032) 14,079 75,297
Net volume variance (20,377) (8,558) (9,365) (6,115)
Source: Compiled from data submitted in response to Commission questionnaires.
VI-6
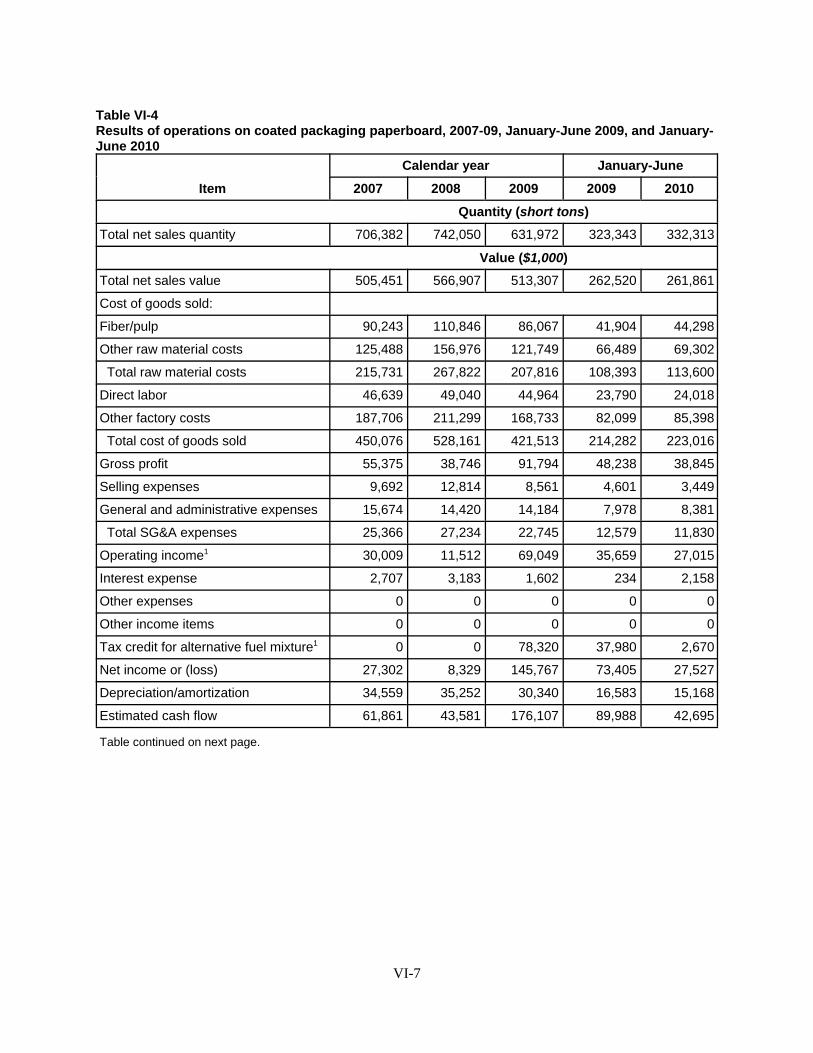
Table VI-4Results of operations on coated packaging paperboard, 2007-09, January-June 2009, and January-June 2010
Item
Calendar year January-June
2007 2008 2009 2009 2010
Quantity (short tons)
Total net sales quantity 706,382 742,050 631,972 323,343 332,313
Value ($1,000)
Total net sales value 505,451 566,907 513,307 262,520 261,861
Cost of goods sold:
Fiber/pulp 90,243 110,846 86,067 41,904 44,298
Other raw material costs 125,488 156,976 121,749 66,489 69,302
Total raw material costs 215,731 267,822 207,816 108,393 113,600
Direct labor 46,639 49,040 44,964 23,790 24,018
Other factory costs 187,706 211,299 168,733 82,099 85,398
Total cost of goods sold 450,076 528,161 421,513 214,282 223,016
Gross profit 55,375 38,746 91,794 48,238 38,845
Selling expenses 9,692 12,814 8,561 4,601 3,449
General and administrative expenses 15,674 14,420 14,184 7,978 8,381
Total SG&A expenses 25,366 27,234 22,745 12,579 11,830
Operating income1 30,009 11,512 69,049 35,659 27,015
Interest expense 2,707 3,183 1,602 234 2,158
Other expenses 0 0 0 0 0
Other income items 0 0 0 0 0
Tax credit for alternative fuel mixture1 0 0 78,320 37,980 2,670
Net income or (loss) 27,302 8,329 145,767 73,405 27,527
Depreciation/amortization 34,559 35,252 30,340 16,583 15,168
Estimated cash flow 61,861 43,581 176,107 89,988 42,695
Table continued on next page.
VI-7
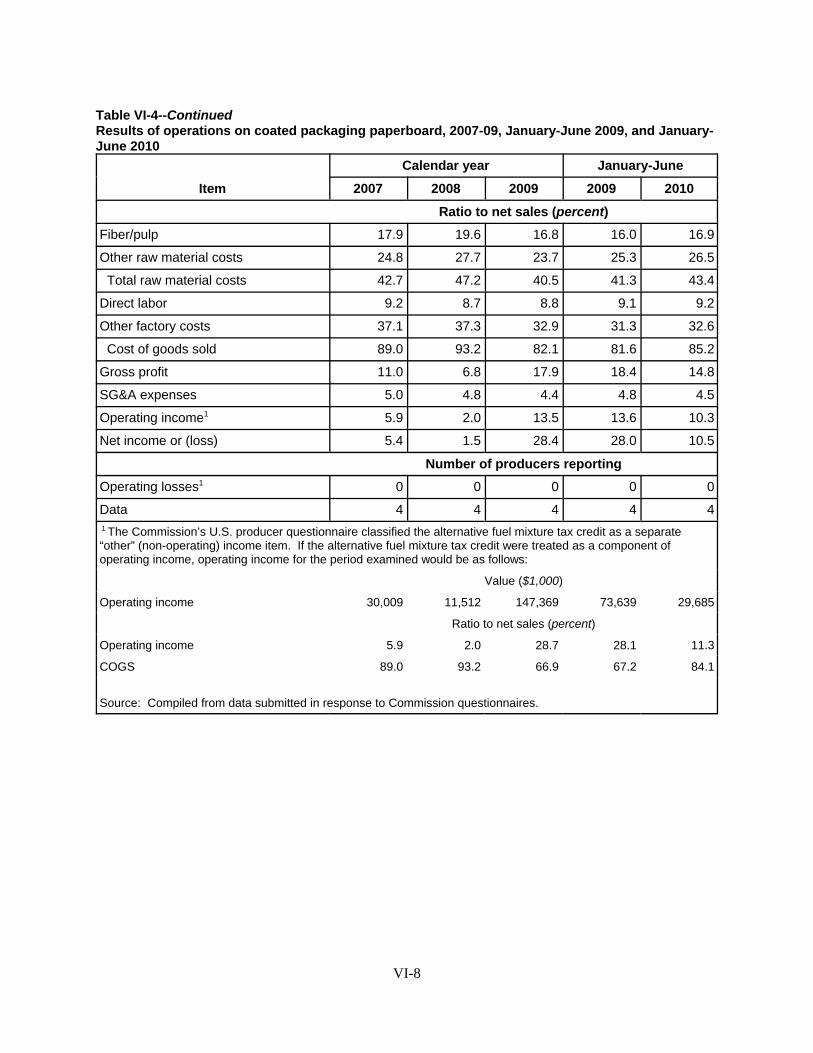
Table VI-4--ContinuedResults of operations on coated packaging paperboard, 2007-09, January-June 2009, and January-June 2010
Item
Calendar year January-June
2007 2008 2009 2009 2010
Ratio to net sales (percent)
Fiber/pulp 17.9 19.6 16.8 16.0 16.9
Other raw material costs 24.8 27.7 23.7 25.3 26.5
Total raw material costs 42.7 47.2 40.5 41.3 43.4
Direct labor 9.2 8.7 8.8 9.1 9.2
Other factory costs 37.1 37.3 32.9 31.3 32.6
Cost of goods sold 89.0 93.2 82.1 81.6 85.2
Gross profit 11.0 6.8 17.9 18.4 14.8
SG&A expenses 5.0 4.8 4.4 4.8 4.5
Operating income1 5.9 2.0 13.5 13.6 10.3
Net income or (loss) 5.4 1.5 28.4 28.0 10.5
Number of producers reporting
Operating losses1 0 0 0 0 0
Data 4 4 4 4 4 1 The Commission’s U.S. producer questionnaire classified the alternative fuel mixture tax credit as a separate“other” (non-operating) income item. If the alternative fuel mixture tax credit were treated as a component ofoperating income, operating income for the period examined would be as follows:
Value ($1,000)
Operating income 30,009 11,512 147,369 73,639 29,685
Ratio to net sales (percent)
Operating income 5.9 2.0 28.7 28.1 11.3
COGS 89.0 93.2 66.9 67.2 84.1
Source: Compiled from data submitted in response to Commission questionnaires.
VI-8

Table VI-5Results of operations on coated packaging paperboard (per short ton), 2007-09, January-June2009, and January-June 2010
Item
Calendar year January-June
2007 2008 2009 2009 2010
Unit value (dollars per short ton)
Total net sales 716 764 812 812 788
Cost of goods sold:
Fiber/Pulp 128 149 136 130 133
Other raw materials 178 212 193 206 209
Total raw materials 305 361 329 335 342
Direct labor 66 66 71 74 72
Other factory costs 266 285 267 254 257
Total cost of goods sold 637 712 667 663 671
Gross profit 78 52 145 149 117
SG&A expenses 36 37 36 39 36
Operating income1 42 16 109 110 81 1 The Commission’s U.S. producer questionnaire classified the alternative fuel mixture tax credit as a separate“other” (non-operating) income item. If the alternative fuel mixture tax credit were treated as a component ofoperating income, the industry’s operating income for the period examined would be as follows:
Unit value (dollars per short ton)
Operating income 42 16 233 228 89
Source: Compiled from data submitted in response to Commission questionnaires.
VI-9

Table VI-6Variance analysis of financial results of operations on coated packaging paperboard, 2007-09,January-June 2009, and January-June 2010
Item
Calendar year Jan.-June
2007-09 2007-08 2008-09 2009-10
Value ($1,000)
Total net sales:
Price variance 61,100 35,934 30,497 (7,942)
Volume variance (53,244) 25,522 (84,097) 7,283
Total net sales variance 7,856 61,456 (53,600) (659)
Cost of sales:
Raw materials:
Cost variance (14,810) (41,198) 20,276 (2,200)
Volume variance 22,725 (10,893) 39,730 (3,007)
Net raw material variance 7,915 (52,091) 60,006 (5,207)
Direct labor:
Cost variance (3,238) (46) (3,199) 432
Volume variance 4,913 (2,355) 7,275 (660)
Net direct labor variance 1,675 (2,401) 4,076 (228)
Other factory costs:
Cost variance (800) (14,115) 11,221 (1,021)
Volume variance 19,773 (9,478) 31,345 (2,278)
Net other factory cost variance 18,973 (23,593) 42,566 (3,299)
Net cost of sales:
Cost variance (18,848) (55,359) 28,299 (2,790)
Volume variance 47,411 (22,726) 78,349 (5,944)
Total net cost of sales variance 28,563 (78,085) 106,648 (8,734)
Gross profit variance 36,419 (16,629) 53,048 (9,393)
SG&A expenses:
Expense variance (51) (587) 449 1,098
Volume variance 2,672 (1,281) 4,040 (349)
Total SG&A variance 2,621 (1,868) 4,489 749
Operating income variance 39,040 (18,497) 57,537 (8,644)
Summarized as:
Price variance 61,100 35,934 30,497 (7,942)
Net cost/expense variance (18,899) (55,946) 28,748 (1,692)
Net volume variance (3,161) 1,515 (1,708) 989
Source: Compiled from data submitted in response to Commission questionnaires.
VI-10

other factory costs.7 Product and company-specific financial results are discussed further in thecombined financial results section below.
COMBINED OPERATIONS ON CERTAIN COATED PAPER OTHER THANPACKAGING PAPERBOARD AND COATED PACKAGING PAPERBOARD
Income-and-loss data for combined operations on certain coated paper other than coatedpackaging paperboard and coated packaging paperboard are presented in table VI-7 and on an averageunit basis in table VI-8. Table VI-9 presents selected company-specific financial information andcorresponding product subtotals. Selected financial results by product group for first half and second half2008, first half and second half 2009, and first half 2010 are presented in table VI-10 .8
Restructuring and Related Activity
As described in Part III of this report, U.S. producers reporting their financial results to theCommission underwent restructuring/consolidation during the period examined. Of the companiesspecifically reporting that they incurred non-recurring charges during the period examined, in large partrelated to restructuring activity, the amounts reported by ***.9 As noted below, *** reported reductions
7 ***:
Item
Calendar year January-June
2007 2008 2009 2009 2010
Value ($1,000)
Operating income *** *** *** *** ***
Ratio to net sales (percent)
Operating income *** *** *** *** ***
8 Footnote 3 and footnote 7 describe concerns regarding the financial results reported by ***:
Item
Calendar year January-June
2007 2008 2009 2009 2010
Value ($1,000)
Operating income *** *** *** *** ***
Ratio to net sales (percent)
Operating income *** *** *** *** ***
9 The extent to which restructuring charges are directly reflected in the financial results reported to theCommission varies based on how these charges are treated for internal reporting purposes. ***. Public financial information indicates that MeadWestvaco incurred restructuring charges related to its PackagingResources segment (i.e., the segment which includes certain coated paper operations) during the period examinedwith the most substantial being $42 million in 2009 out of company-wide total restructuring charges of $189 million. Since public financial information indicates that its restructuring charges are not directly assigned to segment-level operations ***. USITC auditor final-phase notes.
VI-11

Table VI-7Combined results of operations on certain coated paper other than coated packaging paperboardand coated packaging paperboard, 2007-09, January-June 2009, and January-June 2010
Item
Calendar year January-June
2007 2008 2009 2009 2010
Quantity (short tons)
Total net sales quantity 2,053,224 1,987,806 1,738,109 799,293 1,028,327
Value ($1,000)
Total net sales value 1,944,652 1,941,218 1,638,035 765,846 938,850
Cost of goods sold:
Fiber/pulp 380,431 391,147 294,671 130,650 170,627
Other raw material costs 428,426 473,853 419,624 201,902 244,423
Total raw material costs 808,857 865,001 714,295 332,552 415,050
Direct labor 245,326 235,096 237,928 112,396 143,944
Other factory costs 625,407 618,108 516,979 243,661 300,492
Total cost of goods sold 1,679,590 1,718,204 1,469,203 688,609 859,486
Gross profit 265,061 223,013 168,832 77,237 79,364
Selling expenses 39,276 38,027 30,172 15,563 14,940
General and administrative expenses 81,757 89,916 76,896 39,241 40,511
Total SG&A expenses 121,033 127,943 107,067 54,804 55,451
Operating income1 144,029 95,070 61,765 22,433 23,913
Interest expense 70,382 64,509 81,076 29,196 35,004
Other expenses 4,225 4,341 28,284 4,645 2,848
Other income items 2,607 265 1,005 714 1,134
Tax credit for alternative fuel mixture1 0 0 218,188 94,701 6,227
Net income or (loss) 72,028 26,486 171,597 84,008 (6,577)
Depreciation/amortization 115,955 124,852 111,093 56,319 54,811
Estimated cash flow 187,984 151,338 282,691 140,327 48,233
Table continued on next page.
VI-12

Table VI-7--ContinuedCombined results of operations on certain coated paper other than coated packaging paperboardand coated packaging paperboard, 2007-09, January-June 2009, and January-June 2010
Item
Calendar year January-June
2007 2008 2009 2009 2010
Ratio to net sales (percent)
Fiber/pulp 19.6 20.2 18.0 17.1 18.2
Other raw material costs 22.0 24.4 25.6 26.4 26.0
Total raw material costs 41.6 44.6 43.6 43.4 44.2
Direct labor 12.6 12.1 14.5 14.7 15.3
Other factory costs 32.2 31.8 31.6 31.8 32.0
Cost of goods sold 86.4 88.5 89.7 89.9 91.5
Gross profit 13.6 11.5 10.3 10.1 8.5
SG&A expenses 6.2 6.6 6.5 7.2 5.9
Operating income1 7.4 4.9 3.8 2.9 2.5
Net income or (loss) 3.7 1.4 10.5 11.0 (0.7)
Number of producers reporting
Operating losses1 4 3 7 7 5
Data2 15 15 15 15 15 1 The Commission’s U.S. producer questionnaire classified the alternative fuel mixture tax credit as a separate“other” (non-operating) income item. If the alternative fuel mixture tax credit were treated as a component ofoperating income, operating income for the period examined would be as follows:
Value ($1,000)
Operating income 144,029 95,070 279,953 117,134 30,140
Ratio to net sales (percent)
Operating income 7.4 4.9 17.1 15.3 3.2
COGS 86.4 88.5 76.4 77.5 90.9
Number of producers reporting
Operating losses2 4 3 4 5 5
2 As indicated at the beginning of this section, 15 companies reported their financial results. Clearwater andMeadWestvaco were the only companies reporting financial results classified by the Commission as certain coatedpaper other than coated packaging paperboard and coated packaging paperboard, respectively.
Source: Compiled from data submitted in response to Commission questionnaires.
VI-13
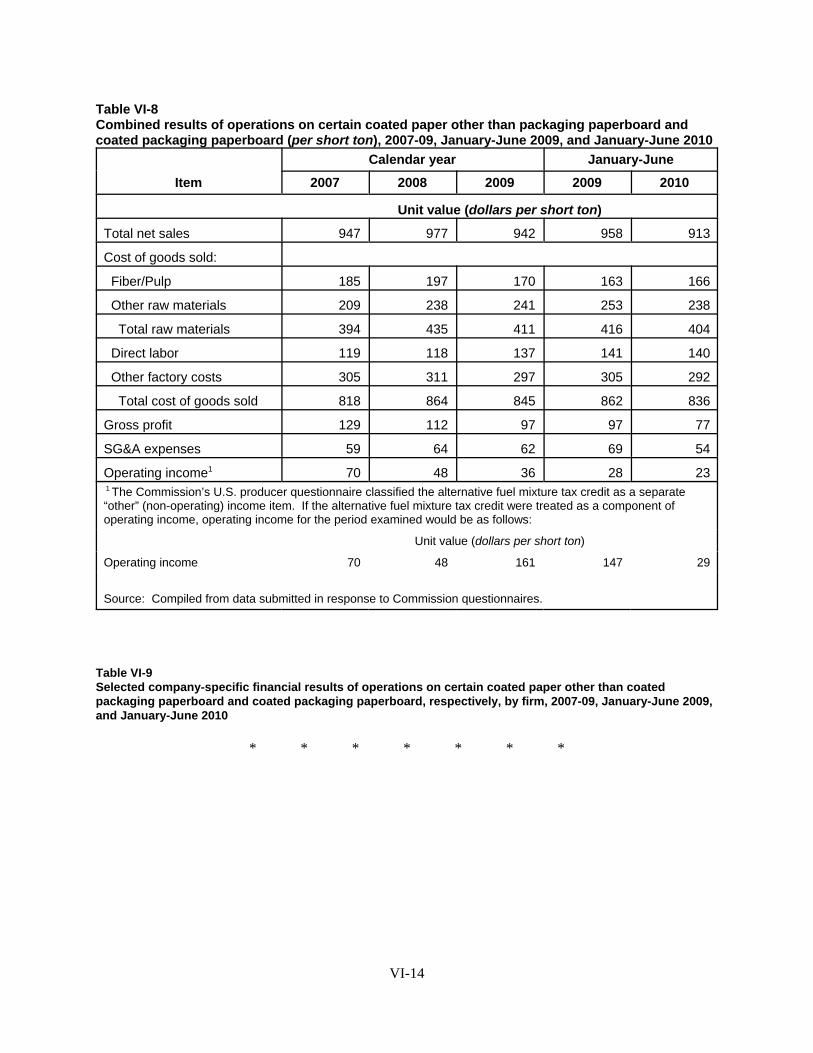
Table VI-8Combined results of operations on certain coated paper other than packaging paperboard andcoated packaging paperboard (per short ton), 2007-09, January-June 2009, and January-June 2010
Item
Calendar year January-June
2007 2008 2009 2009 2010
Unit value (dollars per short ton)
Total net sales 947 977 942 958 913
Cost of goods sold:
Fiber/Pulp 185 197 170 163 166
Other raw materials 209 238 241 253 238
Total raw materials 394 435 411 416 404
Direct labor 119 118 137 141 140
Other factory costs 305 311 297 305 292
Total cost of goods sold 818 864 845 862 836
Gross profit 129 112 97 97 77
SG&A expenses 59 64 62 69 54
Operating income1 70 48 36 28 23 1 The Commission’s U.S. producer questionnaire classified the alternative fuel mixture tax credit as a separate“other” (non-operating) income item. If the alternative fuel mixture tax credit were treated as a component ofoperating income, operating income for the period examined would be as follows:
Unit value (dollars per short ton)
Operating income 70 48 161 147 29
Source: Compiled from data submitted in response to Commission questionnaires.
Table VI-9Selected company-specific financial results of operations on certain coated paper other than coatedpackaging paperboard and coated packaging paperboard, respectively, by firm, 2007-09, January-June 2009,and January-June 2010
* * * * * * *
VI-14

Table VI-10Results of operations, January-June 2008 (overall certain coated paper operations from preliminary staff report), July-December2008 (overall certain coated paper operations from preliminary staff report (extrapolated)), January-June 2009, July-December 2009(extrapolated), and January-June 2010 (primary product groups as identified in final staff report)
Item
Jan.-June July-Dec. Jan.-June July-Dec. Jan.-June
2008 2008 2009 2009 2010
Sales: Unit value (dollars per short ton)
Sales (converters) -- CCP other than coated packaging paperboard 560 804 595
Sales (producers) -- CCP other than coated packaging paperboard 1,075 990 981
Sales (producers) -- coated packaging paperboard 812 813 788
Sales -- overall CCP sales (preliminary staff report) 1,184 1,123
Cost of goods sold: Ratio to net sales (percent)
COGS (converters) -- CCP other than coated packaging paperboard 83.5 89.1 86.8
COGS (producers) -- CCP other than coated packaging paperboard 94.4 92.3 94.1
COGS (producers) -- coated packaging paperboard 81.6 82.6 85.2
COGS -- overall certain coated paper (preliminary staff report) 83.9 87.7
Gross profit (loss): Ratio to net sales (percent)
Gross profit (converters) -- CCP other than coated packaging paperboard 16.5 10.9 13.2
Gross profit (producers) -- CCP other than coated packaging paperboard 5.6 7.7 5.9
Gross profit (producers) -- coated packaging paperboard 18.4 17.4 14.8
Gross profit -- overall certain coated paper (preliminary staff report) 16.1 12.3
Operating income or (loss):1 Ratio to net sales (percent)
Operating income (converters) -- CCP other than coated packaging paperboard 4.4 (0.4) 2.0
Operating income (loss) (producers) -- CCP other than coated packaging paperboard (2.8) 1.0 (0.5)
Operating income (producers) -- coated packaging paperboard 13.6 13.3 10.3
Operating income -- overall certain coated paper (preliminary staff report) 7.9 4.7
1 The operating income (loss) information presented in this table does not directly reflect the impact of the alternative fuel mixture tax credit. Notes to tableVI-1, table VI-4, and table VI-7 present operating adjusted to reflect the inclusion of the alternative fuel mixture tax credit.
Note: Second half information was extrapolated by subtracting first half financial results from full-year financial results. 2008 is based on financial resultsreported to the Commission during the preliminary phase of these investigations. In terms of a time series, staff believes that the 2008 financial results aremost directly comparable to the certain coated paper other than coated packaging paperboard producer category.
Source: Compiled from data submitted in response to Commission questionnaires.
VI-15
in average conversion costs in 2009 and interim 2010, respectively, which appear to reflect, at least inpart, the elimination of capacity and corresponding efficiencies related to restructuring.10
In early 2008, NewPage, which purchased Stora Enso North America on December 21, 2007,announced major restructuring plans. According to NewPage, the company “. . . expect{ed} to generateannualized synergies as a result of the acquisition of approximately $265 million within 18 monthsfollowing its completion. These synergies are expected to come form optimizing paper production,reducing input costs, and reducing selling, general and administrative expenses.”11 As indicated infootnote 9, NewPage specifically identified *** in 2008 as restructuring activity directly related to itscertain coated paper operations; i.e., NewPage closed other facilities during this period which were notdirectly related to certain coated paper operations.12 In its 2009 10-K and with respect to its overalloperations, NewPage states that “{w}e completed our integration activities during the third quarter of2009, at which time we had achieved approximately $200 synergies. Additional synergies may berealized in the future from anticipated economies of scale when our paper machines return to running athistorical operating patterns with a beneficial grade mix.”13 Sappi, which accounted for the ***.14 With regard to its decision to close the Muskegon, MI mill, Sappi also states in its 2009 annual report that“{c}ompared to fiscal 2008, sales volume dropped by 18 percent to 1,274,000 tons in 2009 as a result ofthe significant decrease in economic activity and demand for print advertising in North America. In thesecircumstances we decided to close our Muskegon mill which was the smallest and least efficient of ourNorth American coated woodfree mills. The full range of products previously produced at the Muskegon mill were successfullytransferred to our Somerset and Cloquet mills.”15
Revenue
As shown in table VI-3 and when considering product groups, there were some differences in thepattern of change in sales volume during the period examined. In particular, coated packagingpaperboard reported a modest increase in overall sales volume in 2008 compared to 2007, while thecertain coated paper other than coated packaging paperboard reported a decline in sales volume.16 As
10 ***. E-mail with attachment from counsel for Petitioners on behalf of Sappi to USITC auditor, October 5,2010.
11 NewPage 2007 10-K, p. 18.
12 In its U.S. producer questionnaire response, NewPage described this restructuring as follows: ***. NewPageresponse to question III-9, U.S. producer questionnaire.
13 NewPage 2009 10-K, p.26.
14 Sappi response to question III-9 of U.S. producer questionnaire.
15 Sappi 2009 annual report, p. 45. ***. E-mail with attachment from counsel for Petitioners on behalf of Sappito USITC auditor, October 5, 2010.
16 With regard to overall coated paper demand, NewPage stated that “{d}uring 2008, North American coatedpaper demand declined significantly compared to 2007, as a result of decreased advertising spending and magazineand catalog circulation resulting from macroeconomic factors. North American customers purchased approximately12 million short tons of coated paper in 2008 and approximately 13 million short tons of coated paper in 2007.” NewPage 2008 10-K, p. 4. The following year NewPage made a similar statement observing that overall coatedpaper purchases in North American declined to 9 million short tons in 2009. NewPage 2009 10-K, p 4. Accordingto NewPage and with regard to the interim period “{d}uring the first half of 2010, North American printing paperdemand increased compared to the first half of 2009, as a result of decreased advertising spending and magazine andcatalog circulation during the first half of 2009 largely attributable to general economic factors and inventoryreductions by customers.” NewPage 2010 (first half) 10-Q, p. 23.
VI-16

shown in table VI-9, the increase in coated packaging paperboard sales volume is attributable ***. Forthe rest of the period, changes in sales volume were more uniform with the majority of producersreporting declines in sales volume in 2009 and then increases in interim 2010. In contrast with salesvolume, in which producers for much of the period reported similar patterns of period-to-period change,company-specific trends in average sales value were less uniform and reflect both changes in bothunderlying price and product mix.17 18 The variance analysis for certain coated paper other than coatedpackaging paperboard and coated packaging paperboard (see table VI-3 and table VI-6) shows that theformer generated negative price variances for most of the period, the exception being 2007-2008, whilethe latter, with exception of interim 2009-2010, generated positive price variances.19
Cost of Goods Sold
MeadWestvaco is the only U.S. producer reporting financial results to the Commission that isfully integrated with respect to the underlying wood/fiber source.20 As shown in table VI-9,MeadWestvaco’s average pulp/fiber cost was among the least volatile of companies reporting thatinformation. The remaining producers either primarily purchase fiber and internally produce pulp(Clearwater, Georgia Pacific, International Paper, NewPage, Sappi) or purchase market pulp fromunrelated parties (Appleton, Cascade, Mohawk, Smart).21 As shown in table VI-9, the full-year averagefiber/pulp raw material cost (specific to producers in both product categories) peaked in 2008, declined in2009, and was marginally lower on an overall basis in interim 2010.22 23 The “other raw materials”
17 ***. Sappi response to question III-7, U.S. producer questionnaire. ***. NewPage response to question III-7,U.S. producer questionnaire. ***. MeadWestvaco response to question III-7, U.S. producer questionnaire. ***. Clearwater response toquestion III-7, U.S. producer questionnaire
18 With regard to coated paper products in general, NewPage states in its 2009 10-K that “North American pricesfor coated paper products historically have been determined by North American supply and demand, rather thandirectly by raw material costs and other costs of sales.” NewPage 2009 10-K, p. 25.
19 While the majority of producers in both product categories reported increases in average sales value in 2008compared to 2007, the pattern of company-specific changes in average sales value in subsequent periods was lessuniform.
20 ***. MeadWestvaco response to question III-10, U.S. producer questionnaire. ***. USITC auditor final-phase notes.
21 According to NewPage, “{t}he former SENA {Stora Enso} mills have historically been a net purchaser ofmarket pulp. Following the Acquisition {in late 2007}, we intend to use substantially all of our excess pulpproduction internally, thus reducing the amount of pulp purchased from third parties.” NewPage 2007 10-K, p. 9. In2009 NewPage stated that it internally produced pulp represented approximately 94 percent of its pulp requirements. NewPage 2009 10-K, p. 27. ***. Sappi response to question III-8, U.S. producer questionnaire.
22 With regard to the pattern of higher input costs in 2008 in general, NewPage stated in its 2008 10-K that“{d}uring 2008, we experienced significant increases in our input costs due to substantially higher prices for wood,chemicals, natural gas, coal and electricity. In particular, costs of certain petroleum-based chemicals andtransportation costs increased substantially.” NewPage 2008 10-K, pp. 27-28.
23 Because of variations in underlying input costs, the “pulp” line item, as reported in the Commission’squestionnaire, is designated as “fiber/pulp” in the relevant tables presented in this section of the report. Verificationreport, p. 7.
VI-17
component of COGS generally reflects chemicals related to pulping, depending on the level of company-specific integration, and coating.24 25
On an overall basis, U.S. producers collectively reported that variable costs ranged from around62.0 percent to 64.6 percent of total COGS during the period examined, peaking in 2008, while fixedcosts ranged from 35.4 percent to 38.0 percent of COGS, peaking in interim 2009.26 ***.
The pattern of other factory costs, which includes variable costs such as energy, as well as fixedmanufacturing overhead, was highest for both product groups on a per ton basis in 2008; i.e., despitereductions in sales volume and increasing market-related downtime, average other factory costs declinedin 2009 compared to 2008. As shown in table VI-9 and relative to the timing of their respectiverestructurings, ***.
According to Appleton, ***.27 In contrast with the general pattern reflected in table VI-9, ***.28 ***.29
With regard to the relative decline in overall average other factory costs in interim 2010compared to interim 2009 (see table VI-2), this pattern, at least in part, appears to reflect the impact ofSappi’s reduced costs after the closure of its Muskegon, MI mill in 2009. Additionally, the relativeincrease in the industry’s overall sales volume in interim 2010 compared to interim 2009 also would havegenerally resulted in improved fixed cost absorption as machine downtime was reduced.30
Tax Credit for Alternative Fuel Mixture
As it relates to this investigation in particular, only the U.S. producers that produce pulp areeligible to claim the alternative fuel mixture tax credit. As described by MeadWestvaco and with respectto its overall operations, “{t}hrough December 31, 2009, the U.S. Internal Revenue Code allowed anexcise tax credit for alternative fuel mixtures produced by a taxpayer for sale, or for use as a fuel in ataxpayer’s trade or business. MWV {MeadWestvaco} qualified for the alternative fuel mixture creditbecause it uses an alternative fuel known as black liquor, which is a byproduct of its wood pulping
24 Ibid.
25 According to NewPage and with respect to its overall operations, “{t}he principal components of our cost ofsales are chemicals, fiber, energy, labor, maintenance and depreciation and amortization. Costs for commoditiesincluding chemicals, wood and energy, are the most variable component of cost of sales because the prices of manyof the commodities that we use can fluctuate substantially . . .” NewPage 2009 10-K, p. 27.
26 Addressing fixed costs specifically, NewPage states that “{p}aper manufacturing is highly capital intensiveand a large portion of our and our competitors operating costs are fixed. Additionally, paper machines are large,complex systems that operate more efficiently when operated continuously. Consequently, both we and ourcompetitors typically continue to run our machines whenever marginal sales exceed marginal costs.” NewPage2007 10-K, p. 19. Producer-specific shares of variable versus fixed costs were not uniform which is generally consistent withdifferences in underlying cost structure and assumptions regarding cost classification. ***. Verification report, p. 8. ***.
27 Appleton response to question III-11, U.S. producer questionnaire.
28 ***. USITC auditor final-phase notes.
29 Ibid.
30 With respect to its overall operations, NewPage in its 2010 10-Q (first half) stated that “{w}e took 39,000 tonsof market-related downtime in the first half of 2010 compared to 310,000 tons of market-related downtime in thefirst half of 2009.” NewPage 2010 10-Q (first half), p. 26.
VI-18

process, to power its paperboard mills.”31 While the IRS announced in July 2010 that black liquor sold orused in 2009 is eligible for the cellulosic biofuel tax credit (a non-refundable tax credit of $1.01 pergallon of qualifying fuel), the Health Care and Education Reconciliation Act of 2010 reportedly excludedblack liquor from the definition of cellulosic fuel. As such and with respect to black liquor specifically,the basis of any claim for the cellulosic biofuel tax credit by U.S. producers would in effect be the sameblack liquor which was the basis of the alternative fuel mixture tax credit. Since the two credits cannot beclaimed simultaneously or allocated, money received under the alternative fuel mixture tax credit plusinterest would have to be returned to the U.S. Government in order to claim the benefit (an offset totaxable income) from the cellulosic biofuel tax credit. At this point, Rock-Tenn is the only company thatit has indicated that it will revise its tax filings in order to claim the cellulosic biofuel tax credit.32
With respect to U.S. producers reporting financial results to the Commission, a comparison ofpublic financial information generally indicates that International Paper made the largest overall claim(i.e., not specific to certain coated paper) for the alternative fuel mixture tax credit. In contrast, ***accounts for the largest amount allocated to certain coated paper operations.33
As indicated in table VI-1, table VI-4, and table VI-7, the format of the Commission’s incomestatement in this report classifies the alternative fuel mixture tax credit below operating income; i.e.,effectively it is treated as “other” income. The classification of the alternative fuel mixture tax credit,however, for public financial reporting is not uniform. With respect to the U.S. producers responding tothe Commission’s questionnaire and whose public income statement classification has been determined,MeadWestvaco and NewPage classify the tax credit as a component of “other” income, InternationalPaper and Rock-Tenn classify it as a direct offset to COGS, Sappi classifies it as a separate line item thatwas explicitly part of operating income, and Clearwater classifies it as a component of its Pulp andPaperboard segment operating income.34 35
Table VI-1, table VI-4, and table VI-7 show that U.S. producers began recognizing the tax creditin the first half of 2009. The majority of the cumulative gain was recognized in full-year 2009 with somecompanies also recognizing residual amounts in interim 2010. When asked how the alternative fuelmixture tax credit impacted their operations, Clearwater stated that the ***. According to Cascade there
31 MeadWestvaco 2009 10-K, p. 17.
32 Petitioner’s posthearing brief, response to Commissioner Aranoff’s questions (attachment 5) and response tostaff questions (attachment 7). Respondent’s posthearing brief, response to staff questions (attachment 2, pp. 15-19). Rock-Tenn 2010 10-Q (Q3), p. 7.
33 International Paper: $2.1 billion; MeadWestvaco: $375 million; NewPage: $317 million; Clearwater: $170.6million; Sappi: $132 million. (Source: International Paper 2009 10-K, p. 31. MeadWestvaco 2009 10-K, p. 32. NewPage 2009 10-K, p, 33. NewPage 2010 10-Q (first half), p. 27. Clearwater 2009 10-K, p. 26. Sappi annualreport, p. 21.)
34 MeadWestvaco 2009 10-K, p. 32. NewPage 2009 10-K, p. 33. International Paper 2009 10-K, p. 31. Rock-Tenn 2009 10-K , p. 19. Clearwater 2009 10-K, pp. 26-27. Sappi 2009 Annual Report, pp. 44-46. The manner inwhich Georgia Pacific formally treats the alternative fuel mixture tax credit was not determined.
35 With regard to NewPage’s income statement classification, the company’s controller and chief accountingofficer stated that “{t}he alternative fuel tax mixture credit was a non-recurring, extraordinary item which expired atthe end of 2009. Our conclusion was and is that including this credit as an offset to NewPage’s cost of goods soldwould have distorted the results for 2009, making it difficult to evaluate financial performance across prior andfuture periods.” Petitioner’s posthearing brief, response to Commissioner Williamson’s questions (attachment 3,exhibit 2).
VI-19

***. Georgia Pacific stated that ***. Similarly, International Paper stated that ***.36 As described byNewPage, ***.37 Rock-Tenn stated that ***.38 Similarly, according to Sappi ***.39
U.S. producers that purchase all of their pulp requirements and therefore could not claim the taxcredit (Appleton, Cascade, Mohawk, Smart) generally indicated that ***.40 While the pulp component ofraw material costs for these producers reached its ***.41 According to Appleton, ***.42 ***.43
CAPITAL EXPENDITURES, RESEARCH AND DEVELOPMENT EXPENSES, ASSETS, AND RETURN ON INVESTMENT
Data on capital expenditures, research and development (“R&D”) expenses, assets, and return oninvestment related to certain coated paper operations are presented in table VI-11.
***.44 ***.45
Table VI-11Operations on certain coated paper other than coated packaging paperboard and coated packagingpaperboard, respectively: Capital expenditures, R&D expenses, total assets, and return on investment, byfirms, 2007-09, January-June 2009, and January-June 2010
* * * * * * *
36 Clearwater, Cascade, Georgia Pacific, International Paper, responses to question III-10, U.S. producerquestionnaire.
37 NewPage response to question III-10, U.S. producer questionnaire. ***. Verification report, p. 9.
38 Rock-Tenn response to question III-10, U.S. producer questionnaire.
39 Sappi response to question III-10, U.S. producer questionnaire.
40 Appleton, Cascade, Mohawk, and Smart responses to question III-10, U.S. producer questionnaire.
41 As indicated in the preliminary staff report, a NewPage executive noted during the company’s 2nd quarter 2009earnings conference call that “. . . our competitive cost advantage is reduced due to the impact of substantially lowerpulp prices. While the tax credit is currently benefitting all producers, it’s actually potentially benefitting the non-integrated producer more, due to the flattening of the cost curve. The highest cost producers are the non-integratedmills and they have been receiving substantial benefits in their costs due to extra pulp that’s been produced, and soldat lower prices so that the domestic producers can benefit from the subsidy.” Respondent’s postconference brief,exhibit 7 (2nd quarter 2009 NewPage Corporation Earnings Conference Call, p. 4).
42 Appleton response to question III-11, U.S. producer questionnaire.
43 ***. August 20, 2010 e-mail with attachment from *** to USITC auditor.
44 Verification report, p. 9.
45 ***. USITC auditor final-phase notes.
VI-20

CAPITAL AND INVESTMENT
The Commission requested U.S. producers to describe any actual or anticipated negative effectsof imports of certain coated paper and paperboard from China and Indonesia on their firms’ growth,investment, ability to raise capital, existing development and production efforts (including efforts todevelop a derivative or more advanced version of the product), or the scale of capital investments.
Actual Negative EffectsConverters
Case46 ***.Clampitt47 ***.Nekoosa ***.Resource One ***.Wausau ***.Williams Paper ***.
Integrated Producers
Appleton ***.Cascade ***.Clearwater ***.Georgia Pacific ***.International Paper ***.MeadWestvaco ***.Mohawk ***.NewPage ***.Rock-Tenn ***.Sappi ***.Smart Papers ***.
Anticipated Negative EffectsConverters
Case ***.Clampitt ***.Resource One ***.Nekoosa ***.Wausau ***.Williams Paper ***.
Integrated Producers
Appleton ***.Cascade ***.
46 ***.
47 ***.
VI-21
Clearwater ***.Georgia Pacific ***.International Paper ***.MeadWestvaco ***.Mohawk ***.NewPage ***.Rock-Tenn ***.Sappi ***.Smart Papers ***.
VI-22
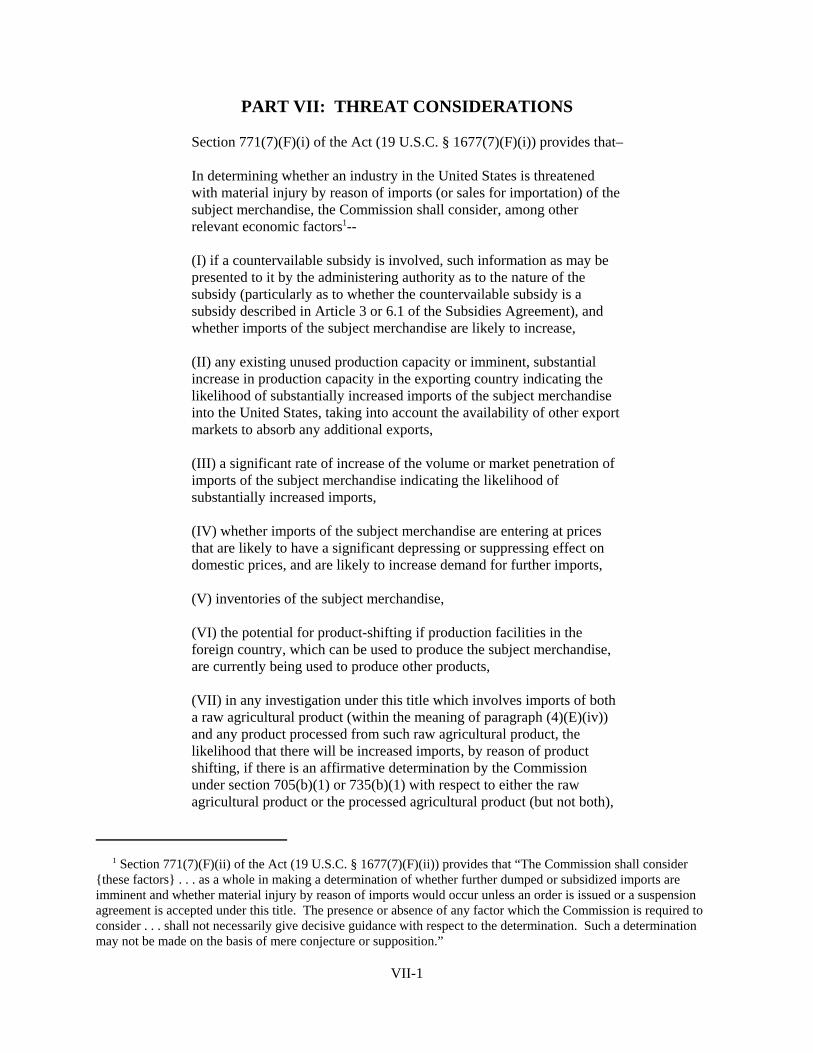
PART VII: THREAT CONSIDERATIONS
Section 771(7)(F)(i) of the Act (19 U.S.C. § 1677(7)(F)(i)) provides that–
In determining whether an industry in the United States is threatenedwith material injury by reason of imports (or sales for importation) of thesubject merchandise, the Commission shall consider, among otherrelevant economic factors1--
(I) if a countervailable subsidy is involved, such information as may bepresented to it by the administering authority as to the nature of thesubsidy (particularly as to whether the countervailable subsidy is asubsidy described in Article 3 or 6.1 of the Subsidies Agreement), andwhether imports of the subject merchandise are likely to increase,
(II) any existing unused production capacity or imminent, substantialincrease in production capacity in the exporting country indicating thelikelihood of substantially increased imports of the subject merchandiseinto the United States, taking into account the availability of other exportmarkets to absorb any additional exports,
(III) a significant rate of increase of the volume or market penetration ofimports of the subject merchandise indicating the likelihood ofsubstantially increased imports,
(IV) whether imports of the subject merchandise are entering at pricesthat are likely to have a significant depressing or suppressing effect ondomestic prices, and are likely to increase demand for further imports,
(V) inventories of the subject merchandise,
(VI) the potential for product-shifting if production facilities in theforeign country, which can be used to produce the subject merchandise,are currently being used to produce other products,
(VII) in any investigation under this title which involves imports of botha raw agricultural product (within the meaning of paragraph (4)(E)(iv))and any product processed from such raw agricultural product, thelikelihood that there will be increased imports, by reason of productshifting, if there is an affirmative determination by the Commissionunder section 705(b)(1) or 735(b)(1) with respect to either the rawagricultural product or the processed agricultural product (but not both),
1 Section 771(7)(F)(ii) of the Act (19 U.S.C. § 1677(7)(F)(ii)) provides that “The Commission shall consider{these factors} . . . as a whole in making a determination of whether further dumped or subsidized imports areimminent and whether material injury by reason of imports would occur unless an order is issued or a suspensionagreement is accepted under this title. The presence or absence of any factor which the Commission is required toconsider . . . shall not necessarily give decisive guidance with respect to the determination. Such a determinationmay not be made on the basis of mere conjecture or supposition.”
VII-1

(VIII) the actual and potential negative effects on the existingdevelopment and production efforts of the domestic industry, includingefforts to develop a derivative or more advanced version of the domesticlike product, and
(IX) any other demonstrable adverse trends that indicate the probabilitythat there is likely to be material injury by reason of imports (or sale forimportation) of the subject merchandise (whether or not it is actuallybeing imported at the time).2
Information on the nature of the subsidies was presented earlier in this report; information on thevolume and pricing of imports of the subject merchandise is presented in Parts IV and V; and informationon the effects of imports of the subject merchandise on U.S. producers’ existing development andproduction efforts is presented in Part VI. Information on inventories of the subject merchandise; foreignproducers’ operations, including the potential for “product-shifting;” any other threat indicators, ifapplicable; and any dumping in third-country markets, follows.
THE INDUSTRY IN CHINA
The Commission received responses from ten firms accounting for approximately *** percent of2009 production of certain coated paper in China and approximately *** percent of exports to the UnitedStates from China.3 The ten reporting Chinese producers include: (1) Daewoo Paper Manufacturing Co.,Ltd. (“Daewoo”); (2) Gold East Paper (Jiangsu) Co., Ltd. (“Gold East”); (3) Gold Huansheng Paper Co.,Ltd. (“Gold Huansheng”); (4) Ningbo Asia Pulp & Paper Co., Ltd. (“Ningbo Asia”); (5) NingboZhonghua Paper Co., Ltd. (“Ningbo Zhonghua”); (6) Yan Zhou Tian Zhang Paper Industry Co., Ltd.(“Sun Paper”); (7) Tiger Forest & Paper Co., Ltd. (“Tiger Forest”); (8) Stora Enso Suzhou Paper Co., Ltd.(“Stora Enso”); (9) Shandong Chenming Paper Holdings, Ltd. (“Chenming”); and (10) Zhuhai HongtaRenheng Paper Co., Ltd. (“Renheng”).4 Four of the reporting producers, Gold East, Gold Huansheng,Ningbo Asia, and Ningbo Zhonghua, are related companies and are also affiliates of the largeconglomerate, Asia Pulp & Paper Co., Ltd., headquartered in Singapore. Asia Pulp & Paper Co., Ltd. isalso affiliated with Indonesian respondents and a number of U.S. importers. ***. Daewoo, Renheng, andStora Enso reported that they *** during the period of investigation. Tiger Forest reported that ***. Capacity, production, and export shipment data regarding the individual firms are presented in table VII-1.
2 Section 771(7)(F)(iii) of the Act (19 U.S.C. § 1677(7)(F)(iii)) further provides that, in antidumpinginvestigations, “. . . the Commission shall consider whether dumping in the markets of foreign countries (asevidenced by dumping findings or antidumping remedies in other WTO member markets against the same class orkind of merchandise manufactured or exported by the same party as under investigation) suggests a threat of materialinjury to the domestic industry.”
3 Percentages provided are based upon estimates provided by Chinese producers of certain coated paper in theirresponses to the Commission’s Foreign Producer questionnaire.
4 Four firms, ***, reported that they neither produced in China nor exported to the United States certain coatedpaper during the period of investigation. ***. Respondents’ prehearing brief, exh. 39.
VII-2

Table VII-1Certain coated paper: China’s reported production capacity, production, and shipments, by firm,2009
Chinese producer
Share ofreported
2009production
in China(percent)
Quantity (short tons); capacity utilization and share of total shipments(percent)
Capacity ProductionCapacityutilization
Exports tothe U.S.
Share oftotal
shipmentsexported to
the U.S.
Chenming *** *** *** *** *** ***
Daewoo *** *** *** *** *** ***
Gold East *** *** *** *** *** ***
Gold Huansheng *** *** *** *** *** ***
Ningbo Asia *** *** *** *** *** ***
Ningbo Zhonghua *** *** *** *** *** ***
Renheng *** *** *** *** *** ***
Stora Enso *** *** *** *** *** ***
Sun Paper *** *** *** *** *** ***
Tiger Forest *** *** *** *** *** ***
Total 100.0 3,832,237 3,673,622 95.9 353,386 100.0
***. Source: Compiled from data submitted in Commission questionnaire responses.
APP Affiliated Chinese Producers
The four Asia Pulp & Paper Co., Ltd. affiliated producers, Gold East, Gold Huansheng, NingboAsia, and Ningbo Zhonghua, accounted for *** percent of reported 2009 Chinese production of certaincoated paper. Specific data regarding each affiliated firm are presented below.
Gold East
Gold East reported that *** percent of its total sales in the most recent fiscal year were sales ofcertain coated paper. In 2009, *** percent of Gold East’s total shipments of certain coated paper wereexported to the United States, *** percent of its shipments were to its home market, and *** percent of itsshipments were to European Union countries, and *** percent of total shipments went to export marketsin ***. From 2007 to 2009, Gold East’s exports to the United States increased by *** percent.
VII-3

Gold East’s reported capacity decreased from 2007 to 2009 ***,5 and is projected to ***.6 Itsproduction decreased by *** percent from 2007 to 2009, and is projected to ***. Gold East reported thatits largest U.S. importer of certain coated paper in 2008 was ***.
Gold Huansheng
Gold Huansheng reported that *** percent of its total sales in the most recent fiscal year weresales of certain coated paper. In 2009, *** percent of Gold Huansheng’s total shipments of certain coatedpaper were exported to the United States, *** percent of its shipments were to its home market, ***percent of its shipments were to the European Union, and *** percent of its shipments were to otherexport markets in ***. Gold Huansheng’s exports to the United States increased by *** percent from2007 to 2009 and are projected to ***. Gold Huansheng’s reported capacity *** from 2007 to 2009, andis projected to ***. Its production *** from 2007 to 2009, and is projected to ***. Gold Huanshengreported that its largest U.S. importer of certain coated paper in 2009 was ***.
Ningbo Asia
Ningbo Asia reported that *** percent of its total sales in the most recent fiscal year were sales ofcertain coated paper. In 2009, *** percent of Ningbo Asia’s total shipments of certain coated paper wereexported to the United States, *** percent of its shipments were to its home market, *** percent of itsshipments were to the European Union, and *** percent of its shipments were to other export markets in***. Ningbo Asia’s exports to the United States increased by *** percent from 2007 to 2009 (***) andare projected to ***. Ningbo Asia’s reported capacity *** from 2007 to 2009, and is projected to ***. Its production increased by *** percent from 2007 to 2009, and is projected to ***. Ningbo Asiareported that its largest U.S. importer of certain coated paper in 2009 was ***.
Ningbo Zhonghua
Ningbo Zhonghua reported that *** percent of its total sales in the most recent fiscal year weresales of certain coated paper. In 2009, *** percent of Ningbo Zhonghua’s total shipments of certaincoated paper were exported to the United States, *** percent of its shipments were to its home market,*** percent of its shipments were to the European Union, and *** percent of its shipments were to otherexport markets in ***. Ningbo Zhonghua’s exports to the United States increased by *** percent from2007 to 2009 and are projected to ***. Ningbo Zhonghua’s reported capacity *** from 2007 to 2009,and is projected to ***. Its production increased by *** percent from 2007 to 2009, and is projected to*** from 2009 to 2011. Ningbo Zhonghua reported that its largest U.S. importer of certain coated paperin 2009 was ***.
Producers in China not affiliated with APP
Chenming
Chenming reported that *** percent of its total sales in the most recent fiscal year were sales ofcertain coated paper. In 2009, *** percent of Chenming’s total shipments of certain coated paper wereexported to the United States, *** percent of its shipments were to its home market, *** percent of itsshipments were to the European Union, and *** percent of its shipments were to other export markets
5 ***.
6 ***.
VII-4

such as ***. Chenmings’s exports to the United States decreased by *** percent from 2007 to 2009, andare projected to be ***. Its export Chenming’s reported capacity increased by *** percent from 2007 to2009, and is projected to ***.7 Its production increased by *** percent from 2007 to 2009, and isprojected to ***. Chenming reported that its largest U.S. importer of certain coated paper in 2009 was***.
Sun Paper
Sun Paper reported that *** percent of its total sales in the most recent fiscal year were sales ofcertain coated paper. In 2009, *** percent of Sun Paper’s total shipments of certain coated paper wereexported to the United States, *** percent of its shipments were to its home market, *** of its shipmentswere to the European Union, and *** of its shipments were to other export markets, ***. Sun Paper’sexports to the United States increased by *** percent from 2007 to 2009, but were ***. Its exportshipments to the United States are projected to ***. Sun Paper’s reported capacity *** from 2007 to2009, and is projected to ***. Its production increased by *** percent from 2007 to 2009, and isprojected to ***. Sun Paper reported that its exclusive U.S. importer of certain coated paper in 2009 was***.
Daewoo, Renheng, Stora Enso, and Tiger Forest
Daewoo reported that ***. Renheng and Stora Enso reported that ***. Tiger Forest reported***.
Other Data
RISI, an information provider for the global forest products industry, projects an increase of 17.3percent in Chinese capacity to produce coated woodfree paper products from 2010 to 2011. During thesame 2010 to 2011 time horizon, RISI projects an increase of 7.5 percent in the apparent consumption ofcoated woodfree paper in China.8 Respondents maintained that Chinese producers currently have highcapacity utilization rates and that increases in capacity to produce certain coated paper in China arenecessary to keep up with increased demand in its home market and not intended for export markets.Respondents also observed that Chinese producers *** Unisource. Unisource, another large nationalpaper distributor, stopped receiving shipments from respondents in July 2009, after it decided earlier in2009 to obtain its supply needs from New Page.9
Table VII-2 presents cumulative data for reported capacity, production, and shipments of certaincoated paper for all reporting producers in China. Cumulatively, producers in China reported that in2009, 9.3 percent of their total shipments of certain coated paper were exported to the United States, 61.5percent of its shipments were to its home market, 7.6 percent of its shipments were to the EuropeanUnion, and 21.5 percent of its shipments were to other export markets. Chinese producers’ exports to theUnited States increased by 3.6 percent from 2007 to 2009, but were lower by 85.8 percent from January-June 2009 to January-June 2010. Export shipments to the United States are projected to ***. Chinese
7 Chenming reported that ***. Foreign Producer’s questionnaire response of Chenming, p. 6, response toquestion II-1.
8 Respondents’ prehearing brief, p. 129 (citing RISI World Pulp & Recovered Paper Forecast found at exh. 27).
9 Respondents’ prehearing brief, pp. 121-122; Respondents’ posthearing brief, pp. 12-14 and exh. 1, pp. 84-86.
VII-5

producer’s reported capacity decreased by 1.1 percent from 2007 to 2009, and is projected to ***.10 Theirproduction increased by 4.5 percent from 2007 to 2009, and is projected to *** from 2009 to 2011.
10 Three producers of certain coated paper in China reported projections to increase their capacity in 2010 and2011 of approximately *** short tons. These firms include: ***. Responses to foreign producer questionnaires,question II-8a; Respondents’ posthearing brief, exh. 1, p. 4. Another firm in China, ***, is projected to beginproducing certain coated paper in 2010 or 2011 with an approximately *** short tons capacity facility. Petitionerscontended that other data sources such as that of EMGE & Co., a paper industry consultancy, projects capacity toproduct coated woodfree paper in China to increase by 2.6 million metric tons (2.9 million short tons) by 2011. Petitioners’ prehearing brief, p. 55-57 and exh. 8.
VII-6

Table VII-2Certain coated paper: China’s reported production capacity, production, shipments, andinventories, 2007-09, January-June 2009, January-June 2010, and projections for 2010 and 2011
Item
Actual experience Projections
2007 2008 2009
January-June
2010 20112009 2010
Quantity (short tons)
Capacity 3,875,558 3,919,692 3,832,237 1,927,417 1,850,778 3,885,009 4,778,462
Production 3,515,012 3,626,445 3,673,622 1,772,807 1,833,516 3,852,608 4,744,995
End-of-period inventories 129,672 274,467 137,314 212,720 221,840 121,696 119,740
Shipments:
Internal consumption 1,759 1,075 2,365 1,335 906 1,643 1,643
Home market 2,335,641 2,183,226 2,347,216 1,177,097 1,114,446 2,448,392 3,398,091
Exports to–
The United States 341,194 339,324 353,386 176,325 25,002 39,907 31,787
European Union 241,836 231,857 288,749 124,432 137,383 269,614 268,668
Asia 481,410 483,826 530,852 268,037 331,943 722,074 722,754
All other markets 164,779 242,536 290,985 123,018 179,829 362,072 354,644
Total exports 1,229,219 1,297,543 1,463,972 691,812 674,157 1,393,667 1,377,853
Total shipments 3,566,619 3,481,844 3,813,553 1,870,244 1,789,509 3,843,702 4,777,587
Ratios and shares (percent)
Capacity utilization 90.7 92.5 95.9 92.0 99.1 99.2 99.3
Inventories to production 3.7 7.6 3.7 6.0 6.0 3.2 2.5
Inventories to total shipments 3.6 7.9 3.6 5.7 6.2 3.2 2.5
Shares of total quantity ofshipments:
Internal consumption 0.0 0.0 0.1 0.1 0.1 0.0 0.0
Home market 65.5 62.7 61.5 62.9 62.3 63.7 71.1
Exports to–
The United States 9.6 9.7 9.3 9.4 1.4 1.0 0.7
European Union 6.8 6.7 7.6 6.7 7.7 7.0 5.6
Asia 13.5 13.9 13.9 14.3 18.5 18.8 15.1
All other markets 4.6 7.0 7.6 6.6 10.0 9.4 7.4
Total exports 34.5 37.3 38.4 37.0 37.7 36.3 28.8
Table continued on next page.
VII-7
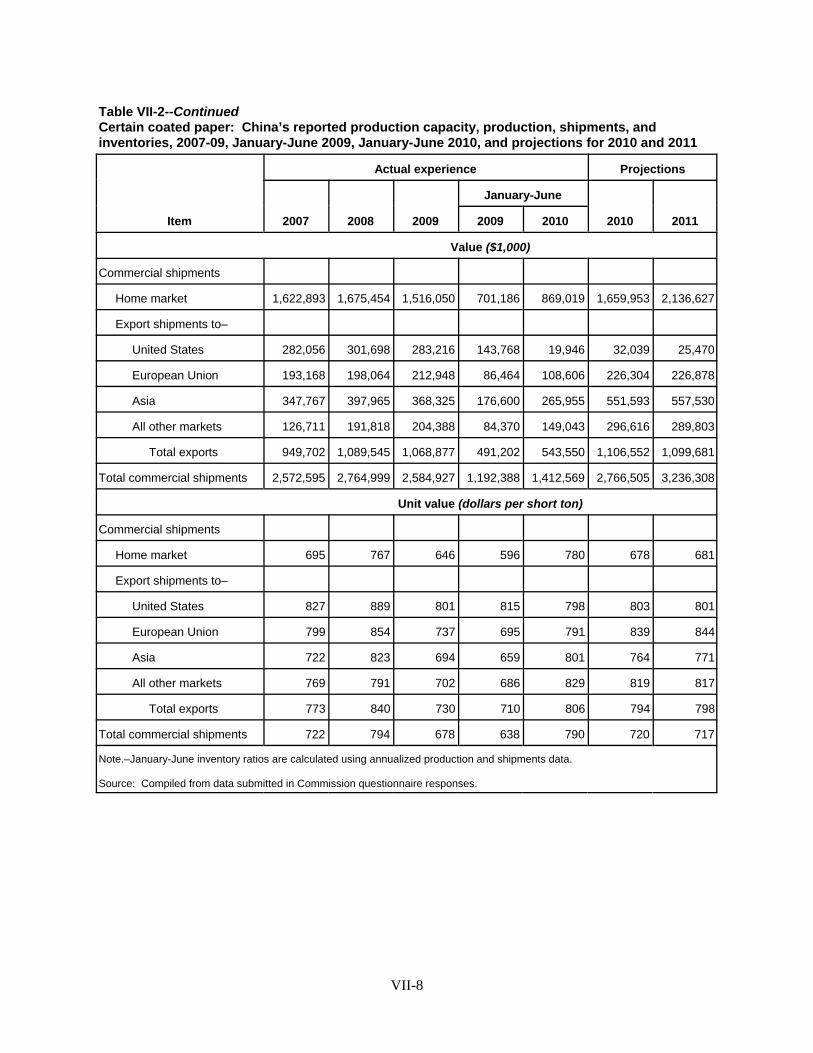
Table VII-2--ContinuedCertain coated paper: China’s reported production capacity, production, shipments, andinventories, 2007-09, January-June 2009, January-June 2010, and projections for 2010 and 2011
Item
Actual experience Projections
2007 2008 2009
January-June
2010 20112009 2010
Value ($1,000)
Commercial shipments
Home market 1,622,893 1,675,454 1,516,050 701,186 869,019 1,659,953 2,136,627
Export shipments to–
United States 282,056 301,698 283,216 143,768 19,946 32,039 25,470
European Union 193,168 198,064 212,948 86,464 108,606 226,304 226,878
Asia 347,767 397,965 368,325 176,600 265,955 551,593 557,530
All other markets 126,711 191,818 204,388 84,370 149,043 296,616 289,803
Total exports 949,702 1,089,545 1,068,877 491,202 543,550 1,106,552 1,099,681
Total commercial shipments 2,572,595 2,764,999 2,584,927 1,192,388 1,412,569 2,766,505 3,236,308
Unit value (dollars per short ton)
Commercial shipments
Home market 695 767 646 596 780 678 681
Export shipments to–
United States 827 889 801 815 798 803 801
European Union 799 854 737 695 791 839 844
Asia 722 823 694 659 801 764 771
All other markets 769 791 702 686 829 819 817
Total exports 773 840 730 710 806 794 798
Total commercial shipments 722 794 678 638 790 720 717
Note.–January-June inventory ratios are calculated using annualized production and shipments data.
Source: Compiled from data submitted in Commission questionnaire responses.
VII-8

Eight of the ten reporting Chinese producers reported that they produced products other thancertain coated paper using the same manufacturing equipment and/or production-related employees. Only*** reported that they produced exclusively certain coated paper. Table VII-3 presents data for the entireperiod of investigation for capacity, production, and capacity utilization for all products. Table VII-4presents 2009 data for overall capacity as well as production by product category and by firm.
Table VII-3Certain coated paper and all other out-of-scope products: Overall capacity, production, andcapacity utilization of Chinese producers, 2007-09, January-June 2009, and January-June 2010
Item
Calendar year January-June
2007 2008 2009 2009 2010
Overall capacity (short tons) 5,747,288 5,756,103 6,219,169 3,113,940 3,094,965
Overall production (short tons) 5,343,296 5,469,750 5,742,680 2,783,255 2,957,783
Overall capacity utilization (percent) 93.0 95.0 92.3 89.4 95.6
Source: Compiled from data submitted in response to Commission questionnaires.
Table VII-4Certain coated paper and other products: Overall capacity of Chinese producers, and productionby firms and products, 2009
Firm Overall capacity
Chinese production of–
Certain coatedpaper1
Other coatedpaper2
Uncoatedfreesheet3
Otherproducts4
Quantity (short tons)
*** *** *** *** *** ***
*** *** *** *** *** ***
*** *** *** *** *** ***
*** *** *** *** *** ***
*** *** *** *** *** ***
*** *** *** *** *** ***
*** *** *** *** *** ***
*** *** *** *** *** ***
1 This category includes products within the scope of these investigations. 2 This category includes products such as web rolls and coated groundwood paper. These products are not within the scope ofthese investigations. 3 This category includes products such as uncoated freesheet, uncoated groundwood. These products are not within the scopeof these investigations. 4 This category includes other paper products such packaging paperboard, kraft paper, and market pulp. These products arenot within the scope of these investigations.
Source: Compiled from data submitted in response to Commission questionnaires.
VII-9

THE INDUSTRY IN INDONESIA
The Commission received responses from three producers of certain coated paper in Indonesia. As the firms are all related, they submitted a consolidated response to the Commission’s foreign producerquestionnaire. These firms included: (1) PT. Pindo Deli Pulp and Paper Mills, (2) PT. Pabrik KertasTjiwi Kimia, Tbk., and (3) PT. Indah Kiat Pulp & Paper Tbk. (collectively, “Indonesian respondents”). Indonesian respondents are affiliates of the large conglomerate, Asia Pulp & Paper Co., Ltd.,headquartered in Singapore. The Indonesian respondents claimed to account for approximately ***percent of production of certain coated paper in Indonesia, and accounted for *** percent of the exportsto the United States during the period of investigation.
Indonesian respondents reported that *** percent of their total sales in the most recent fiscal yearwere sales of certain coated paper. In 2009, *** percent of Indonesian respondents’ total shipments ofcertain coated paper were exported to the United States, *** percent of their shipments were to their homemarket, *** percent of their shipments were to the European Union, and *** percent of their shipmentswere to other export markets such as ***. From 2007 to 2009, Indonesian respondents’ exports to theUnited States decreased by *** percent and are projected to ***.11 Indonesian respondents’ reportedcapacity remained steady from 2007 to 2009, and is projected to ***. Their production increased by ***percent from 2007 to 2009, and is projected to ***. Indonesian respondents reported that its largest U.S.importer of certain coated paper in 2009 was ***. Table VII-5 presents data for reported capacity,production, and shipments of certain coated paper for all reporting producers in Indonesia.
Table VII-5Certain coated paper: Indonesia’s reported production capacity, production, shipments, andinventories, 2007-09, January-June 2009, January-June 2010, and projections for 2010 and 2011
* * * * * * *
Indonesian respondents reported that they produced products other than certain coated paperusing the same manufacturing equipment and/or production-related employees. Table VII-6 presents datafor the entire period of investigation for capacity, production, and capacity utilization for all products. Table VII-7 presents 2009 data for overall capacity as well as production by product category and byfirm.
Table VII-6Certain coated paper and all other out-of-scope products: Overall capacity, production, andcapacity utilization of Indonesian producers, 2007-09, January-June 2009, and January-June 2010
* * * * * * *
Table VII-7Certain coated paper and other products: Overall capacity of Indonesian producers, andproduction by firms and products, 2009
* * * * * * *
11 Indonesian respondents stated ***. Foreign producer questionnaire response of Indonesian respondents, p. 9,question II-8b.
VII-10
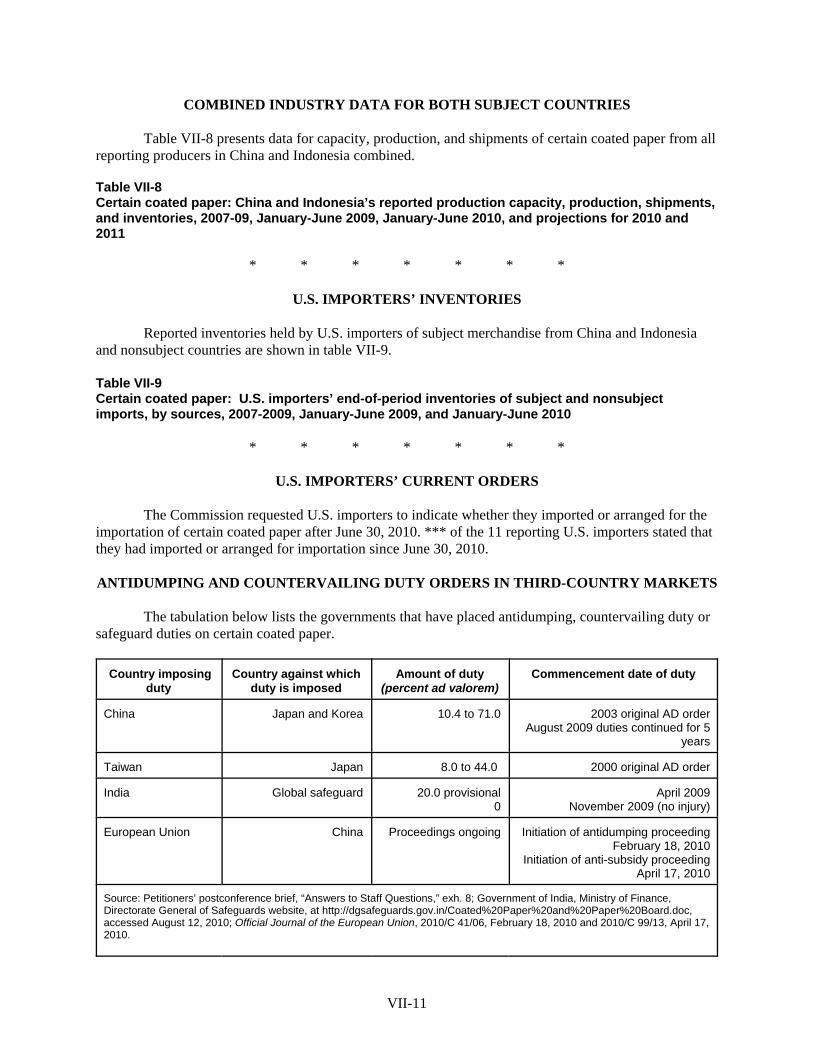
COMBINED INDUSTRY DATA FOR BOTH SUBJECT COUNTRIES
Table VII-8 presents data for capacity, production, and shipments of certain coated paper from allreporting producers in China and Indonesia combined.
Table VII-8Certain coated paper: China and Indonesia’s reported production capacity, production, shipments,and inventories, 2007-09, January-June 2009, January-June 2010, and projections for 2010 and2011
* * * * * * *
U.S. IMPORTERS’ INVENTORIES
Reported inventories held by U.S. importers of subject merchandise from China and Indonesiaand nonsubject countries are shown in table VII-9.
Table VII-9Certain coated paper: U.S. importers’ end-of-period inventories of subject and nonsubjectimports, by sources, 2007-2009, January-June 2009, and January-June 2010
* * * * * * *
U.S. IMPORTERS’ CURRENT ORDERS
The Commission requested U.S. importers to indicate whether they imported or arranged for theimportation of certain coated paper after June 30, 2010. *** of the 11 reporting U.S. importers stated thatthey had imported or arranged for importation since June 30, 2010.
ANTIDUMPING AND COUNTERVAILING DUTY ORDERS IN THIRD-COUNTRY MARKETS
The tabulation below lists the governments that have placed antidumping, countervailing duty orsafeguard duties on certain coated paper.
Country imposingduty
Country against whichduty is imposed
Amount of duty(percent ad valorem)
Commencement date of duty
China Japan and Korea 10.4 to 71.0 2003 original AD orderAugust 2009 duties continued for 5
years
Taiwan Japan 8.0 to 44.0 2000 original AD order
India Global safeguard 20.0 provisional0
April 2009November 2009 (no injury)
European Union China Proceedings ongoing Initiation of antidumping proceedingFebruary 18, 2010
Initiation of anti-subsidy proceedingApril 17, 2010
Source: Petitioners’ postconference brief, “Answers to Staff Questions,” exh. 8; Government of India, Ministry of Finance,Directorate General of Safeguards website, at http://dgsafeguards.gov.in/Coated%20Paper%20and%20Paper%20Board.doc,accessed August 12, 2010; Official Journal of the European Union, 2010/C 41/06, February 18, 2010 and 2010/C 99/13, April 17,2010.
VII-11

INFORMATION ON PRODUCERS IN NONSUBJECT COUNTRIES
In assessing whether the domestic industry is materially injured or threatened with material injury“by reason of subject imports,” the legislative history states “that the Commission must examine allrelevant evidence, including any known factors, other than the dumped or subsidized imports, that may beinjuring the domestic industry, and that the Commission must examine those other factors (including non-subject imports) ‘to ensure that it is not attributing injury from other sources to the subject imports.’”12
The worldwide market environment for coated free sheet paper during the period of investigationhas been tumultuous, with demand, production, and shipments declining rapidly, leading to excessproduction capacity despite some reductions in capacity. Global demand for coated free sheet paperdecreased as the severe economic downturn caused advertising expenditures to drop sharply, reducingdemand for magazines and catalogues. This cyclical decline in demand was accompanied by a structuraldecline in demand for coated free sheet paper, particularly in North America and Europe, as someadvertisers migrated away from the print medium. Global demand for coated free sheet paper declined byapproximately 16 percent, from 30 million tons in 2006 to an estimated 25.2 million tons in 2009, withmost of this decline occurring within the past two years. The drop in demand began in North Americaand Europe, but in 2009 spread to Asia and Latin America. As demand fell, producers cut production andshipments of coated free sheet paper. Despite capacity reductions by some producers, excess capacity forcoated free sheet paper remained, particularly in Europe.13 In January-June 2010, global economicrecovery caused demand for coated free sheet to increase above 2009 levels but demand remained below2008 levels.14
The United States imports certain coated paper from a number of nonsubject countries. Canada,Finland, Germany, and Korea are four important suppliers to the United States. Information on thesecountries’ trade in certain coated paper is provided below.
Canada
Table VII-10 presents data on Canadian exports and imports of certain coated paper, and tableVII-11 shows data for Canadian exports to the United States as a share of total Canadian exports. During2007-09, Canada had a large trade deficit in certain coated paper. The United States accounted for morethan 80 percent of total Canadian exports of certain coated paper between 2007 and 2009.15
12 Mittal Steel Point Lisas Ltd. v. United States, Slip Op. 2007-1552 at 17 (Fed. Cir., Sept. 18, 2008), quotingfrom Statement of Administrative Action on Uruguay Round Agreements Act, H.R. Rep. 103-316, Vol. I at 851-52;see also Bratsk Aluminum Smelter v. United States, 444 F.3d 1369 (Fed. Cir. 2006).
13 Maine, John. “Green Shoots of Recovery in Printing and Writing Paper Markets?” September 10, 2009http://www.risiinfo.com (accessed September 11, 2009); Maine, John. “North American Coated Paper Demand andCapacity Are Closing the Gap, but Europe Will Likely Announce Huge Closures in 2010.” October 22, 2009http://www.risiinfo.com (accessed October 22, 2009); Stora Enso, “Interim Review January-March 2009" April 23,2009 http://www.storaenso.com (accessed October 22, 2009); Stora Enso, “Interim Review January-September2009" October 22, 2009 http://www.storaenso.com (accessed October 22, 2009).
14 Stora Enso press release, “Stora Enso CEO Jouko Karvinen Comments on Second Quarter Results AnnouncedToday” July 22, 2010 http://www.storaenso.com (accessed July 22, 2010).
15 Two Canadian firms (Domtar Corporation and Thunder Bay Fine Papers) were reported to have producedcoated free sheet paper during the period of investigation. Their production may have included certain coated paper. 2008 Lockwood-Post Directory of Pulp & Paper Mills Global Edition. Bedford, Massachusetts: RISI, Inc., 2008.
VII-12

Table VII-10Certain coated paper: Canada’s exports and imports, 2007-09
Destination
Calendar year
2007 2008 2009
Quantity (short tons)
Exports 5,466 4,651 3,187
Imports 240,442 226,598 176,060
Net exports (234,977) (221,946) (172,874)
Note.–Export and import figures are quantities reported at the 6-digit level for HTS subheadings 4810.14 and 4810.19.
Source: Compiled from Global Trade Atlas database.
Table VII-11Certain coated paper: Canada’s total exports and exports to the United States, 2007-09
Destination
Calendar year
2007 2008 2009
Quantity (short tons)
United States 5,266 3,897 3,110
World 5,466 4,651 3,187
Share of total (percent)
United States 96.3 83.8 97.6
Note.–Export figures are quantities reported at the 6-digit level for HTS subheadings 4810.14 and 4810.19.
Source: Compiled from Global Trade Atlas database.
Finland
Table VII-12 presents data on Finland’s exports and imports of certain coated paper, and tableVII-13 shows data for Finland’s exports to the United States as a share of total Finnish exports. Finlandwas a net exporter of certain coated paper during 2007-09, supplying paper to numerous countries,including Brazil, Denmark, Germany, Mexico, Russia, and Sweden. Finland’s exports declined by 21percent between 2008 and 2009 as the global recession reduced demand for certain coated paper. Duringthe period, exports to the United States accounted for no more than 7 percent of total Finnish exports ofcertain coated paper.16
16 Six Finnish firms (Ahlstrom Kauttua Oy, Jujo Thermal Ltd., M-real Corp., Stora Enso, Tervakoski Oy, andUPM) were reported to have produced coated free sheet paper during the period of investigation. Some of thesefirms likely produced certain coated paper. 2008 Lockwood-Post Directory of Pulp & Paper Mills Global Edition.Bedford, Massachusetts: RISI, Inc., 2008.
VII-13

Table VII-12Certain coated paper: Finland’s exports and imports, 2007-09
Destination
Calendar year
2007 2008 2009
Quantity (short tons)
Exports 464,126 450,116 356,427
Imports 48,366 32,586 28,515
Net exports 415,760 417,530 327,911
Note.–Export and import figures are quantities reported at the 6-digit level for HTS subheadings 4810.14 and 4810.19.
Source: Compiled from Global Trade Atlas database.
Table VII-13Certain coated paper: Finland’s total exports and exports to the United States, 2007-09
Destination
Calendar year
2007 2008 2009
Quantity (short tons)
United States 30,419 17,627 6,160
World 464,126 450,116 356,427
Share of total (percent)
United States 6.6 3.9 1.7
Note.–Export figures are quantities reported at the 6-digit level for HTS subheadings 4810.14 and 4810.19.
Source: Compiled from Global Trade Atlas database.
Germany
Table VII-14 presents data on German exports and imports of certain coated paper, and table VII-15 shows data for German exports to the United States as a share of total German exports. Germanyexported and imported large volumes of certain coated paper during 2007-09. Other European countrieswere the destination for much of Germany’s exports. Between 2008 and 2009, Germany’s exports ofcertain coated paper fell by 20 percent in response to weaker foreign demand. Germany’s largest exportmarket during the period was France, but in 2009 France accounted for only 8 percent of total Germanexports. Exports to the United States comprised only 5 percent of total German exports of certain coatedpaper in 2009.17
17 Approximately 14 German firms were reported to have produced coated free sheet paper during the period ofinvestigation. Some of these firms likely produced certain coated paper. These firms are: ButtenpapierfabrikGmund GmbH & Co. KG, Hahnemuhle FineArt GmbH, Papierfabrik August Koehler AG, Koehler Kehl GmbH, M-real Corp., Nordland Papier GmbH, Sappi Fine Papers, Papierfabrik Scheufelen GmbH & Co. KG, Stora Enso,Papierfabrick Zerkall Renker & Sohne GmbH & Co. KG, Steinbeis Temming Papier GmbH & Co., Illig’schePapierfabrick, Kanzan Spezialpapiere GmbH, and Felix Schoeller Jr. 2008 Lockwood-Post Directory of Pulp &
(continued...)
VII-14
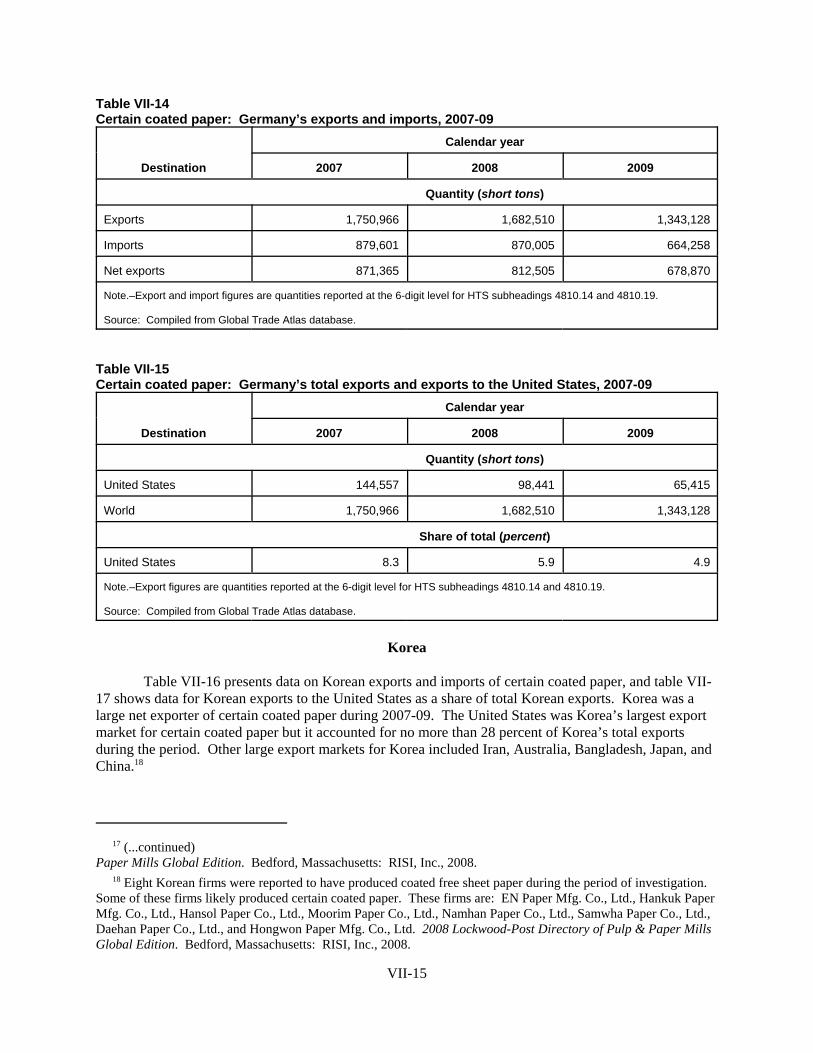
Table VII-14Certain coated paper: Germany’s exports and imports, 2007-09
Destination
Calendar year
2007 2008 2009
Quantity (short tons)
Exports 1,750,966 1,682,510 1,343,128
Imports 879,601 870,005 664,258
Net exports 871,365 812,505 678,870
Note.–Export and import figures are quantities reported at the 6-digit level for HTS subheadings 4810.14 and 4810.19.
Source: Compiled from Global Trade Atlas database.
Table VII-15Certain coated paper: Germany’s total exports and exports to the United States, 2007-09
Destination
Calendar year
2007 2008 2009
Quantity (short tons)
United States 144,557 98,441 65,415
World 1,750,966 1,682,510 1,343,128
Share of total (percent)
United States 8.3 5.9 4.9
Note.–Export figures are quantities reported at the 6-digit level for HTS subheadings 4810.14 and 4810.19.
Source: Compiled from Global Trade Atlas database.
Korea
Table VII-16 presents data on Korean exports and imports of certain coated paper, and table VII-17 shows data for Korean exports to the United States as a share of total Korean exports. Korea was alarge net exporter of certain coated paper during 2007-09. The United States was Korea’s largest exportmarket for certain coated paper but it accounted for no more than 28 percent of Korea’s total exportsduring the period. Other large export markets for Korea included Iran, Australia, Bangladesh, Japan, andChina.18
17 (...continued)Paper Mills Global Edition. Bedford, Massachusetts: RISI, Inc., 2008.
18 Eight Korean firms were reported to have produced coated free sheet paper during the period of investigation. Some of these firms likely produced certain coated paper. These firms are: EN Paper Mfg. Co., Ltd., Hankuk PaperMfg. Co., Ltd., Hansol Paper Co., Ltd., Moorim Paper Co., Ltd., Namhan Paper Co., Ltd., Samwha Paper Co., Ltd.,Daehan Paper Co., Ltd., and Hongwon Paper Mfg. Co., Ltd. 2008 Lockwood-Post Directory of Pulp & Paper MillsGlobal Edition. Bedford, Massachusetts: RISI, Inc., 2008.
VII-15
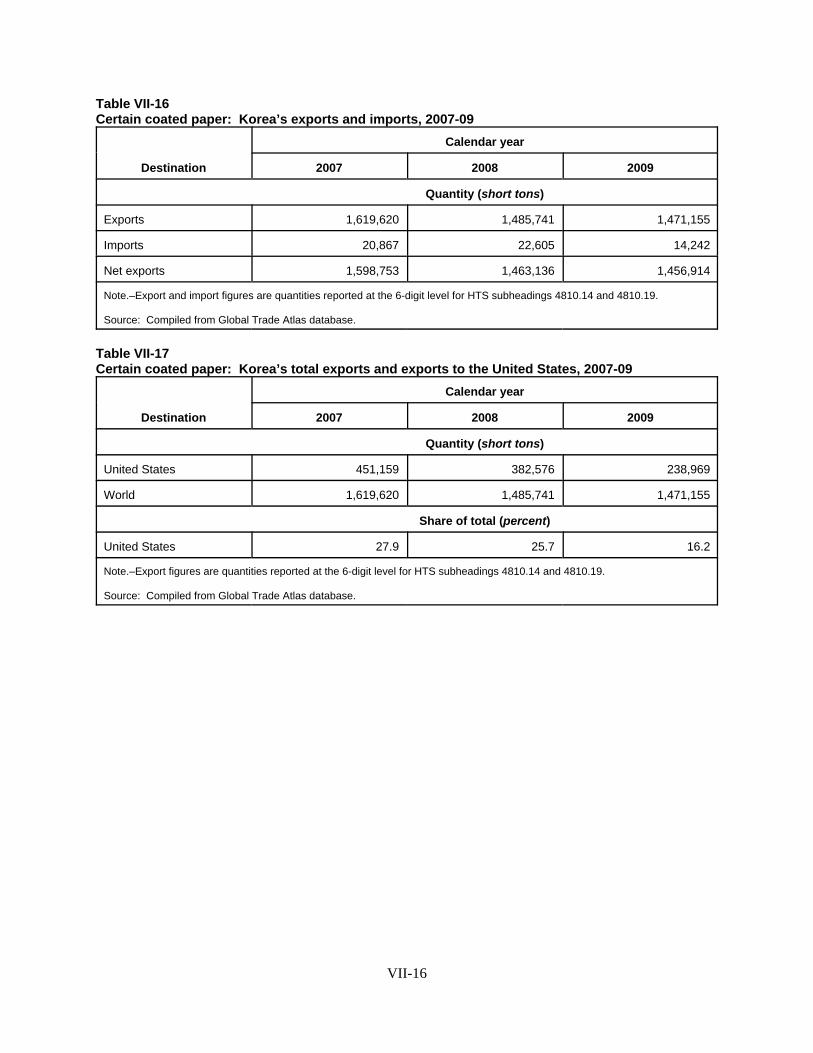
Table VII-16Certain coated paper: Korea’s exports and imports, 2007-09
Destination
Calendar year
2007 2008 2009
Quantity (short tons)
Exports 1,619,620 1,485,741 1,471,155
Imports 20,867 22,605 14,242
Net exports 1,598,753 1,463,136 1,456,914
Note.–Export and import figures are quantities reported at the 6-digit level for HTS subheadings 4810.14 and 4810.19.
Source: Compiled from Global Trade Atlas database.
Table VII-17Certain coated paper: Korea’s total exports and exports to the United States, 2007-09
Destination
Calendar year
2007 2008 2009
Quantity (short tons)
United States 451,159 382,576 238,969
World 1,619,620 1,485,741 1,471,155
Share of total (percent)
United States 27.9 25.7 16.2
Note.–Export figures are quantities reported at the 6-digit level for HTS subheadings 4810.14 and 4810.19.
Source: Compiled from Global Trade Atlas database.
VII-16
APPENDIX A
FEDERAL REGISTER NOTICES
A-1


59209 Federal Register / Vol. 75, No. 186 / Monday, September 27, 2010 / Notices
7 See the Department’s memorandum entitled, ‘‘2007 Administrative Review of the Antidumping Duty Order on Wooden Bedroom Furniture from the People’s Republic of China: Due Date for Interested Parties to Submit Comments on Draft Results of Redetermination Pursuant to Remand,’’ dated July 16, 2010.
8 See Timken, 893 F.2d at 341. 9 See NSR Final Results.
and its determination that it could not address its failure to consider the February 5, 2009, submission as a ministerial error. On June 7, 2010, the Department filed an unopposed motion for voluntary remand with the Court so that the Department could fully consider and evaluate the overlooked record evidence, prepare draft remand results, issue a draft to the parties for comment, analyze those comments, and take such action as may be appropriate pertaining to Bon Ten. On June 8, 2010, the Court granted the Department’s voluntary remand motion.
On June 11, 2010, we issued a supplemental questionnaire to Bon Ten, in which we provided Bon Ten the opportunity to submit a no-shipment certification. On June 15, 2010, Bon Ten submitted a certification that it had no shipments of WBF during the period August 1, 2007, through December 31, 2007, the portion of the 2007 AR POR that was not covered by the preceding NSR POR. On July 16, 2010, we released to all interested parties for comment: (1) Our draft redetermination pursuant to the remand finding that Bon Ten had properly submitted its no-shipment certification and stating our intent to rescind the AR with respect to Bon Ten; (2) a U.S. Customs and Border Protection (‘‘CBP’’) data listing of all type 3 entries (i.e., entries subject to antidumping and countervailing duty tariffs) classified under subheadings 7009.92.5000, 9403.50.9080, and 9403.50.9040 of the Harmonized Tariff Schedule of the United States that entered the United States during the 2007 AR POR and were exported/ manufactured by Bon Ten; and (3) a draft version of Bon Ten’s amended final cash deposit instructions reflecting the draft redetermination results, which the Department intends to send to CBP, pending the expiration of the period of appeal or, if appealed, pending a final and conclusive court decision.7 We received no comments from interested parties on the Department’s draft redetermination results, CBP data, or the draft version of the cash deposit instructions for Bon Ten.
On August 9, 2010, the Department issued its final results of redetermination pursuant to Bon Ten v. United States. The remand redetermination explained that, in accordance with the CIT’s instructions, we have reconsidered the record
information with regard to Bon Ten’s no-shipment certification and separate- rate status for the 2007 AR. Based on this reconsideration, we have determined to rescind the 2007 AR with respect to Bon Ten pursuant to 19 CFR 351.214(j) and 19 CFR 351.213(d)(3).
Timken Notice In its decision in Timken, the CAFC
held that, pursuant to section 516A(e) of the Tariff Act of 1930, as amended (‘‘the Act’’), the Department must publish a notice of a court decision that is not ‘‘in harmony’’ with a Department determination and must suspend liquidation of entries pending a ‘‘conclusive’’ court decision.8 The CIT’s decision in Bon Ten v. United States, issued on September 17, 2010, constitutes a final decision of that Court that is not in harmony with the Department’s Final Results and Amended Final Results. This notice is published in fulfillment of the publication requirements of Timken. Accordingly, pending the expiration of the period of appeal or, if appealed, pending a final and conclusive court decision, the Department will instruct CBP to collect a cash-deposit rate for Bon Ten, effective October 31, 2008, based on the rate established in the final results of Bon Ten’s NSR (i.e., 0.00 percent) until completion of any subsequent administrative review of Bon Ten.9
This notice is issued and published in accordance with section 516A(c)(1) of the Act.
Dated: September 23, 2010. Paul Piquado, Acting Deputy Assistant Secretary for Import Administration. [FR Doc. 2010–24321 Filed 9–24–10; 8:45 am]
BILLING CODE 3510–DS–P
DEPARTMENT Of COMMERCE
International Trade Administration
[C–560–824]
Certain Coated Paper Suitable for High–Quality Print Graphics Using Sheet–Fed Presses from Indonesia: Final Affirmative Countervailing Duty Determination
AGENCY: Import Administration, International Trade Administration, Department of Commerc. SUMMARY: The Department of Commerce (the Department) has determined that countervailable subsidies are being provided to producers and exporters of
certain coated paper suitable for high– quality print graphics using sheet–fed presses (coated paper) from Indonesia. For information on the estimated countervailing duty rates, please see the ‘‘Suspension of Liquidation’’ section, below. EFFECTIVE DATE: September 27, 2010. FOR FURTHER INFORMATION CONTACT: Gene Calvert or Nicholas Czajkowski, AD/CVD Operations, Office 6, Import Administration, International Trade Administration, U.S. Department of Commerce, 14th Street and Constitution Avenue, NW, Washington, DC 20230; telephone: (202) 482–3586 and (202) 482–1395, respectively. SUPPLEMENTARY INFORMATION:
Case History The following events have occurred
since the announcement of the preliminary determination, which was published in the Federal Register on March 9, 2010. See Certain Coated Paper from Indonesia: Preliminary Affirmative Countervailing Duty Determination and Alignment of Final Countervailing Duty Determination with Final Antidumping Duty Determination, 75 FR 10761 (March 9, 2010) (Preliminary Determination).
The Department issued additional supplemental questionnaires to the Government of Indonesia (GOI), and to cross–owned company respondents PT Pabrik Kertas Tjiwi Kimia Tbk., PT Indah Kiat Pulp and Paper Tbk., and PT Pindo Deli Pulp and Paper Mills (collectively, APP/SMG) regarding the programs under investigation. Parties submitted timely responses to these supplemental questionnaires on May 11 and May 26 (the GOI and APP/SMG) and June 25 (the GOI only). On April 7 and April 8, APP/SMG and Appleton Coated LLC, NewPage Corporation, S.D. Warren Company d/b/a Sappi Fine Paper North America, and the United Steel, Paper and Forestry, Rubber, Manufacturing, Energy, Allied Industrial and Service Workers International Union (collectively, Petitioners), respectively, submitted timely requests for a hearing pursuant to 19 CFR 351.310(c), which they both subsequently withdrew on August 6, 2010.
The Department conducted verification of the questionnaire responses submitted by the GOI and APP/SMG from June 28, 2010 through July 8, 2010. The Department issued the final business–proprietary version of the verification reports on August 6, 2010. We received case briefs from the GOI and APP/SMG, jointly, and from Petitioners on August 16. We received
VerDate Mar<15>2010 17:01 Sep 24, 2010 Jkt 220001 PO 00000 Frm 00004 Fmt 4703 Sfmt 4703 E:\FR\FM\27SEN1.SGM 27SEN1srob
inso
n on
DS
KH
WC
L6B
1PR
OD
with
NO
TIC
ES

59210 Federal Register / Vol. 75, No. 186 / Monday, September 27, 2010 / Notices
1 ‘‘ ‘Paperboard’ refers to Certain Coated Paper that is heavier, thicker and more rigid than coated paper which otherwise meets the product description. In the context of Certain Coated Paper, paperboard typically is referred to as ‘cover,’ to distinguish it from ‘text.’’’
2 One of the key measurements of any grade of paper is brightness. Generally speaking, the brighter the paper the better the contrast between the paper and the ink. Brightness is measured using a GE Reflectance Scale, which measures the reflection of light off of a grade of paper. One is the lowest reflection, or what would be given to a totally black grade, and 100 is the brightest measured grade.
rebuttal briefs from these parties on August 23.
Scope of the Investigation
The merchandise under investigation includes certain coated paper and paperboard1 in sheets suitable for high quality print graphics using sheet–fed presses; coated on one or both sides with kaolin (China or other clay), calcium carbonate, titanium dioxide, and/or other inorganic substances; with or without a binder; having a GE brightness level of 80 or higher;2 weighing not more than 340 grams per square meter; whether gloss grade, satin grade, matte grade, dull grade, or any other grade of finish; whether or not surface–colored, surface–decorated, printed (except as described below), embossed, or perforated; and irrespective of dimensions (Certain Coated Paper).
Certain Coated Paper includes (a) coated free sheet paper and paperboard that meets this scope definition; (b) coated groundwood paper and paperboard produced from bleached chemi–thermo-mechanical pulp (BCTMP) that meets this scope definition; and (c) any other coated paper and paperboard that meets this scope definition.
Certain Coated Paper is typically (but not exclusively) used for printing multi– colored graphics for catalogues, books, magazines, envelopes, labels and wraps, greeting cards, and other commercial printing applications requiring high quality print graphics.
Specifically excluded from the scope are imports of paper and paperboard printed with final content printed text or graphics.
As of 2009, imports of the subject merchandise are provided for under the following categories of the Harmonized Tariff Schedule of the United States (HTSUS): 4810.14.11, 4810.14.1900, 4810.14.2010, 4810.14.2090, 4810.14.5000, 4810.14.6000, 4810.14.70, 4810.19.1100, 4810.19.1900, 4810.19.2010, 4810.19.2090, 4810.22.1000, 4810.22.50, 4810.22.6000, 4810.22.70, 4810.29.1000, 4810.29.5000, 4810.29.6000, 4810.29.70, 4810.32,
4810.39 and 4810.92. While HTSUS subheadings are provided for convenience and customs purposes, the written description of the scope of the investigation is dispositive.
Scope Comments Following the Preliminary
Determination, on August 3, 2010, the Department issued a decision memorandum addressing three scope issues in this and the concurrent antidumping and countervailing duty investigations on certain coated paper from Indonesia and the People’s Republic of China: (1) whether to clarify the scope of these investigations to exclude multi–ply coated paper and paperboard; (2) whether to modify the scope language by striking the phrase ‘‘suitable for high–quality print graphics;’’ and (3) whether to add three HTSUS numbers which may include in– scope merchandise (i.e., HTSUS 4810.32, 4810.39 and 4810.92). See August 3, 2010, Memorandum to Ronald K. Lorentzen, Deputy Assistant Secretary for Import Administration, from Susan Kuhbach, Director, Office 1, entitled ‘‘Scope’’ (August 3, 2010 Scope Memorandum). For the reasons explained in the August 3, 2010, Scope Memorandum, the Department determined that: (1) multi–ply products that otherwise meet the description of the scope of the investigations are not excluded from the scope; (2) the ‘‘suitable for high–quality print graphics’’ language should not be deleted from the scope; and (3) the three HTSUS numbers at issue should be added to the scope.
The Department subsequently provided the interested parties an opportunity to comment on its post– preliminary scope determination. In response, the respondents in these investigations filed a case brief on August 20, 2010, and the petitioners filed a rebuttal brief on August 24, 2010. Based on the Department’s analysis of these comments and the factual records of these investigations, the Department continues to find that multi–ply coated paper and paperboard are not excluded from the scope of the investigations, that the ‘‘suitable for high–quality print graphics’’ language should be maintained, and that the three HTSUS numbers listed above should be added to the scope. For a complete discussion of the parties’ comments and the Department’s position, see ‘‘Issues and Decision Memorandum for the Final Determination in the Countervailing Duty Investigation of Certain Coated Paper Suitable for High–Quality Print Graphics Using Sheet–Fed Presses from the People’s Republic of China,’’ dated
concurrently with this notice and incorporated herein by reference.
Injury Test
Because Indonesia is a ‘‘Subsidies Agreement Country’’ within the meaning of section 701(b) of the Tariff Act of 1930, as amended (the Act), the International Trade Commission (ITC) is required to determine pursuant to section 701(a)(2) of the Act whether imports of the subject merchandise from Indonesia materially injure, or threaten material injury to, a United States industry. On November 23, 2009, the ITC published its preliminary determination that there is a reasonable indication that an industry in the United States is materially injured by reason of allegedly subsidized imports from Indonesia of subject merchandise. See Certain Coated Paper Suitable for High–Quality Print Graphics Using Sheet–Fed Presses from China and Indonesia, 74 FR 61174 (November 23, 2009); and Certain Coated Paper Suitable for High–Quality Print Graphics Using Sheet–Fed Presses from China and Indonesia (Preliminary), USITC Pub. 4108, Inv. Nos. 701–TA– 470–471 and 731–TA–1169–1170 (November 2009).
Period of Investigation
The period for which we are measuring subsidies, i.e., the period of investigation (POI), is January 1, 2008 through December 31, 2008.
Analysis of Comments Received
All non–scope issues raised in the case and rebuttal briefs submitted by the GOI, APP/SMG, and Petitioners are addressed in the Memorandum to Ronald K. Lorentzen, Deputy Assistant Secretary for Import Administration, ‘‘Issues and Decision Memorandum for Certain Coated Paper Suitable for High– Quality Print Graphics Using Sheet–Fed Presses from Indonesia: Final Affirmative Countervailing Duty Determination’’ (September 20, 2010) (hereafter referred to as the ‘‘Decision Memorandum’’), which is hereby adopted by this notice. Attached to this notice as an Appendix is a list of the issues that parties have raised and to which we have responded in the Decision Memorandum. Parties can find this public memorandum in the Department’s Central Records Unit, located in Room 7046 in the main Commerce building. In addition, a complete version of the Decision Memorandum can be accessed directly on the Internet at http://ia.ita.doc.gov/ ia–highlights-and–news.html or http:// ia.ita.doc.gov/frn/. The paper copy and
VerDate Mar<15>2010 17:01 Sep 24, 2010 Jkt 220001 PO 00000 Frm 00005 Fmt 4703 Sfmt 4703 E:\FR\FM\27SEN1.SGM 27SEN1srob
inso
n on
DS
KH
WC
L6B
1PR
OD
with
NO
TIC
ES
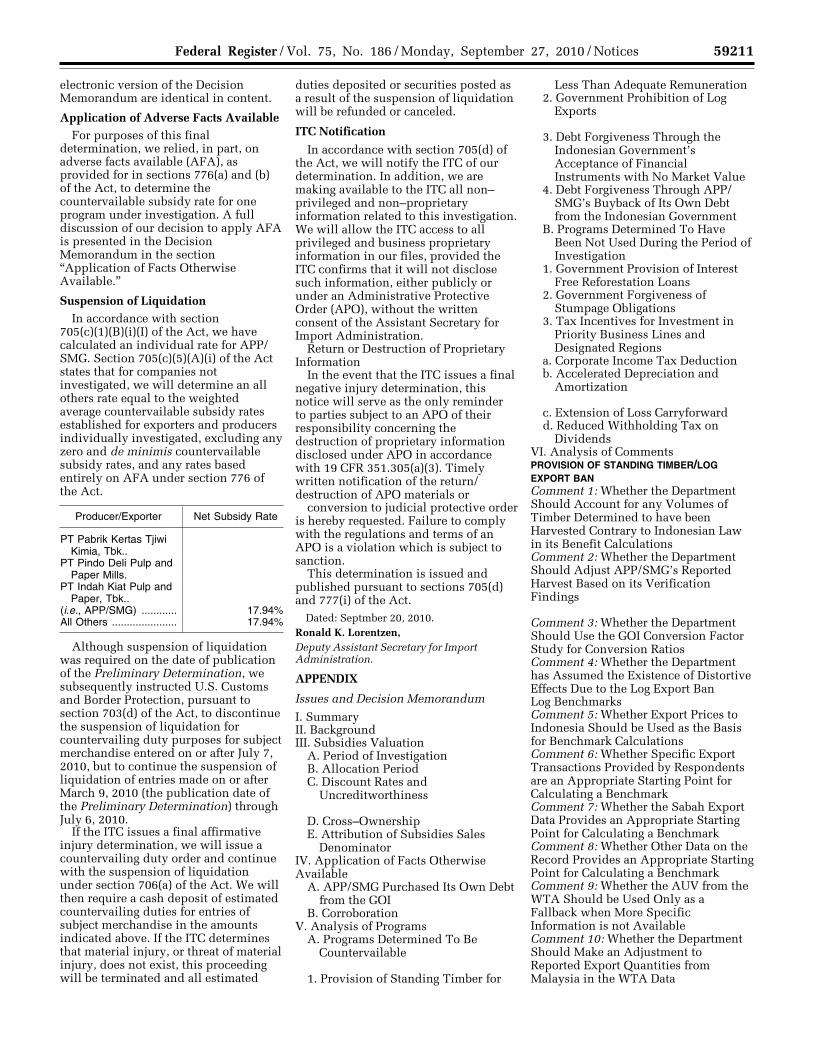
59211 Federal Register / Vol. 75, No. 186 / Monday, September 27, 2010 / Notices
electronic version of the Decision Memorandum are identical in content.
Application of Adverse Facts Available For purposes of this final
determination, we relied, in part, on adverse facts available (AFA), as provided for in sections 776(a) and (b) of the Act, to determine the countervailable subsidy rate for one program under investigation. A full discussion of our decision to apply AFA is presented in the Decision Memorandum in the section ‘‘Application of Facts Otherwise Available.’’
Suspension of Liquidation In accordance with section
705(c)(1)(B)(i)(I) of the Act, we have calculated an individual rate for APP/ SMG. Section 705(c)(5)(A)(i) of the Act states that for companies not investigated, we will determine an all others rate equal to the weighted average countervailable subsidy rates established for exporters and producers individually investigated, excluding any zero and de minimis countervailable subsidy rates, and any rates based entirely on AFA under section 776 of the Act.
Producer/Exporter Net Subsidy Rate
PT Pabrik Kertas Tjiwi Kimia, Tbk..
PT Pindo Deli Pulp and Paper Mills.
PT Indah Kiat Pulp and Paper, Tbk..
(i.e., APP/SMG) ............ 17.94% All Others ...................... 17.94%
Although suspension of liquidation was required on the date of publication of the Preliminary Determination, we subsequently instructed U.S. Customs and Border Protection, pursuant to section 703(d) of the Act, to discontinue the suspension of liquidation for countervailing duty purposes for subject merchandise entered on or after July 7, 2010, but to continue the suspension of liquidation of entries made on or after March 9, 2010 (the publication date of the Preliminary Determination) through July 6, 2010.
If the ITC issues a final affirmative injury determination, we will issue a countervailing duty order and continue with the suspension of liquidation under section 706(a) of the Act. We will then require a cash deposit of estimated countervailing duties for entries of subject merchandise in the amounts indicated above. If the ITC determines that material injury, or threat of material injury, does not exist, this proceeding will be terminated and all estimated
duties deposited or securities posted as a result of the suspension of liquidation will be refunded or canceled.
ITC Notification
In accordance with section 705(d) of the Act, we will notify the ITC of our determination. In addition, we are making available to the ITC all non– privileged and non–proprietary information related to this investigation. We will allow the ITC access to all privileged and business proprietary information in our files, provided the ITC confirms that it will not disclose such information, either publicly or under an Administrative Protective Order (APO), without the written consent of the Assistant Secretary for Import Administration.
Return or Destruction of Proprietary Information
In the event that the ITC issues a final negative injury determination, this notice will serve as the only reminder to parties subject to an APO of their responsibility concerning the destruction of proprietary information disclosed under APO in accordance with 19 CFR 351.305(a)(3). Timely written notification of the return/ destruction of APO materials or
conversion to judicial protective order is hereby requested. Failure to comply with the regulations and terms of an APO is a violation which is subject to sanction.
This determination is issued and published pursuant to sections 705(d) and 777(i) of the Act.
Dated: Septmber 20, 2010. Ronald K. Lorentzen, Deputy Assistant Secretary for Import Administration.
APPENDIX
Issues and Decision Memorandum
I. Summary II. Background III. Subsidies Valuation
A. Period of Investigation B. Allocation Period C. Discount Rates and
Uncreditworthiness
D. Cross–Ownership E. Attribution of Subsidies Sales
Denominator IV. Application of Facts Otherwise Available
A. APP/SMG Purchased Its Own Debt from the GOI
B. Corroboration V. Analysis of Programs
A. Programs Determined To Be Countervailable
1. Provision of Standing Timber for
Less Than Adequate Remuneration 2. Government Prohibition of Log
Exports
3. Debt Forgiveness Through the Indonesian Government’s Acceptance of Financial Instruments with No Market Value
4. Debt Forgiveness Through APP/ SMG’s Buyback of Its Own Debt from the Indonesian Government
B. Programs Determined To Have Been Not Used During the Period of Investigation
1. Government Provision of Interest Free Reforestation Loans
2. Government Forgiveness of Stumpage Obligations
3. Tax Incentives for Investment in Priority Business Lines and Designated Regions
a. Corporate Income Tax Deduction b. Accelerated Depreciation and
Amortization
c. Extension of Loss Carryforward d. Reduced Withholding Tax on
Dividends VI. Analysis of Comments PROVISION OF STANDING TIMBER/LOG EXPORT BAN Comment 1: Whether the Department Should Account for any Volumes of Timber Determined to have been Harvested Contrary to Indonesian Law in its Benefit Calculations Comment 2: Whether the Department Should Adjust APP/SMG’s Reported Harvest Based on its Verification Findings
Comment 3: Whether the Department Should Use the GOI Conversion Factor Study for Conversion Ratios Comment 4: Whether the Department has Assumed the Existence of Distortive Effects Due to the Log Export Ban Log Benchmarks Comment 5: Whether Export Prices to Indonesia Should be Used as the Basis for Benchmark Calculations Comment 6: Whether Specific Export Transactions Provided by Respondents are an Appropriate Starting Point for Calculating a Benchmark Comment 7: Whether the Sabah Export Data Provides an Appropriate Starting Point for Calculating a Benchmark Comment 8: Whether Other Data on the Record Provides an Appropriate Starting Point for Calculating a Benchmark Comment 9: Whether the AUV from the WTA Should be Used Only as a Fallback when More Specific Information is not Available Comment 10: Whether the Department Should Make an Adjustment to Reported Export Quantities from Malaysia in the WTA Data
VerDate Mar<15>2010 17:01 Sep 24, 2010 Jkt 220001 PO 00000 Frm 00006 Fmt 4703 Sfmt 4703 E:\FR\FM\27SEN1.SGM 27SEN1srob
inso
n on
DS
KH
WC
L6B
1PR
OD
with
NO
TIC
ES
59212 Federal Register / Vol. 75, No. 186 / Monday, September 27, 2010 / Notices
Comment 11: Whether Certain HTS numbers Should Be Excluded from WTA Statistics Comment 12: The Department Should Ensure that its Benchmark for the Log Export Ban Program Captures the Full Price an Indonesian Firm Would Pay for Imported Pulp Logs Comment 13: Whether the Department Should Use Monthly Malaysian Exchange Rates to Convert the Monthly Malaysian Export Statistics used as Benchmarks
Comment 14: Whether the Department Should Round the Malaysian Export Statistics
Comment 15: Whether the Department Should Use the GOI Study of Operating Costs in Indonesia to Adjust the Benchmark for the Provision of Standing Timber Debt Forgiveness Comment 16: Whether the Department Should Apply AFA Regarding Debt Forgiveness through APP/SMG’s Buyback of its Own Debt Comment 17: Whether Commerce’s Decision to Cancel the Verification of the IBRA Debt Sale Was Improper Comment 18: Whether the Department Should Apply the Highest Rate Calculated for any Other Program as AFA Regarding the APP/SMG Debt Buyback Allegation Comment 19: Whether the Department Should Adjust the Benefit Calculation Regarding the APP/SMG Debt Buyback Program Comment 20: Whether the Department Should Revise the Interest Rate Used to Calculate the Discount Rate Used for Calculating APP/SMG’s Allocable Subsidies
Other Comment 21: Whether the Department Should Countervail SPA’s Outstanding DR Fees as an Interest–Free Loan VII. Recommendation [FR Doc. 2010–24182 Filed 9–24–10; 8:45 am]
BILLING CODE 3510–DS–S
DEPARTMENT OF COMMERCE
International Trade Administration
[C–570–959]
Certain Coated Paper Suitable for High-Quality Print Graphics Using Sheet-Fed Presses From the People’s Republic of China: Final Affirmative Countervailing Duty Determination
AGENCY: Import Administration, International Trade Administration, Department of Commerce.
SUMMARY: The Department of Commerce (the ‘‘Department’’) has determined that countervailable subsidies are being provided to producers and exporters of certain coated paper suitable for high- quality print graphics using sheet-fed presses from the People’s Republic of China (‘‘PRC’’). For information on the estimated countervailing duty rates, please see the ‘‘Suspension of Liquidation’’ section, below. DATES: Effective Date: September 27, 2010.
FOR FURTHER INFORMATION CONTACT: David Neubacher, Jennifer Meek, and Mary Kolberg, AD/CVD Operations, Office 1, Import Administration, International Trade Administration, U.S. Department of Commerce, 14th Street and Constitution Avenue, NW., Washington, DC 20230; telephone: (202) 482–5823, (202) 482–2778, and (202) 482–1785, respectively. SUPPLEMENTARY INFORMATION:
Period of Investigation The period for which we are
measuring subsidies, or the period of investigation (‘‘POI’’), is January 1, 2008, through December 31, 2008.
Case History The following events have occurred
since the publication of the preliminary determination in the Federal Register on March 9, 2010. See Certain Coated Paper Suitable for High-Quality Print Graphics Using Sheet-Fed Presses from the People’s Republic of China: Preliminary Affirmative Countervailing Duty Determination and Alignment of Final Countervailing Duty Determination with Final Antidumping Duty Determination, 75 FR 10774 (March 9, 2010) (‘‘Preliminary Determination’’).
On March 4, 2010, the Department initiated investigations into new subsidy allegations on several grant programs to Shandong Sun Paper Industry Co., Ltd. and Yanzhou Tianzhang Paper Industry Co., Ltd. (collectively, ‘‘Sun companies’’). See Memorandum from David Neubacher, International Trade Compliance Analyst, Office 1, to Susan Kuhbach, Director, Office 1, Import Administration, regarding ‘‘New Subsidy Allegations,’’ (March 4, 2010), available in the Department’s Central Records Unit in Room 7046 of the main Department building (‘‘CRU’’).
On March 5, 2010, the Department issued a questionnaire regarding the new subsidy allegations to the Government of the People’s Republic of China (‘‘GOC’’), and received a response on April 2, 2010.
On March 17, 2010, the Department received a submission from Appleton Coated LLC, NewPage Corporation, S.D.Warren Company d/b/a Sappi Fine Paper North America, and United Steel, Paper and Forestry, Rubber, Manufacturing, Energy, Allied Industrial and Service Workers International Union (collectively, ‘‘Petitioners’’) regarding additional information to be collected from Gold East (Jiangsu) Co., Ltd., Gold Huasheng Paper Co., Ltd., and their reporting cross-owned companies (collectively, ‘‘Gold companies’’) in connection with the entered value adjustment.
The Department issued supplemental questionnaires to the GOC on April 14, May 12, and May 21, 2010, and received responses on April 29, May 19, and May 26, 2010, respectively. The Department issued supplemental questionnaires to the Gold companies on April 22, May 12, and May 21, 2010, and received responses on May 14, May 20 (a portion of the response was timely filed on May 27), and May 26, 2010, respectively. Finally, the Department issued supplemental questionnaires to the Sun companies on April 1, and May 14, 2010, and received responses on April 27, and May 28, 2010, respectively.
On March 31, 2010, the Department determined to investigate Petitioners’ uncreditworthiness allegation for the Gold companies for the years 2006– 2008. See Memorandum from Nancy Decker, Program Manager, Office 1, to Susan Kuhbach, Director, Office 1, Import Administration, regarding ‘‘Uncreditworthiness Allegation for Gold East (Jiangsu) Co., Ltd., (‘‘Gold East’’), Gold Huasheng Paper Co., Ltd. (‘‘GH’’), Ningbo Zhonghua Paper Co., Ltd. (‘‘NZ’’), Ningbo Asia Pulp & Paper Co. Ltd., and Hainan Jinhai Pulp and Paper Co., Ltd. (collectively, the ‘‘APP companies’’),’’ (March 31, 2010), available in the CRU.
On June 1, 2010, the Department published an amended affirmative preliminary determination to correct a significant ministerial error in the Preliminary Determination. See Certain Coated Paper Suitable For High-Quality Print Graphics Using Sheet-Fed Presses from the People’s Republic of China: Amended Affirmative Preliminary Countervailing Duty Determination, 75 FR 30370 (June 1, 2010) (‘‘Amended Preliminary Determination’’).
From June 7, 2010, to June 18, 2010, the Department conducted verification of the questionnaire responses submitted by the GOC, Gold companies, and Sun companies. See Memorandum from David Neubacher and Jennifer Meek, International Trade Compliance Analysts, Office 1, to Susan H. Kuhbach,
VerDate Mar<15>2010 17:01 Sep 24, 2010 Jkt 220001 PO 00000 Frm 00007 Fmt 4703 Sfmt 4703 E:\FR\FM\27SEN1.SGM 27SEN1srob
inso
n on
DS
KH
WC
L6B
1PR
OD
with
NO
TIC
ES

59213 Federal Register / Vol. 75, No. 186 / Monday, September 27, 2010 / Notices
1 ‘Paperboard’ refers to Certain Coated Paper that is heavier, thicker and more rigid than coated paper which otherwise meets the product description. In the context of Certain Coated Paper, paperboard typically is referred to as ‘cover,’ to distinguish it from ‘text.’
2 One of the key measurements of any grade of paper is brightness. Generally speaking, the brighter the paper the better the contrast between the paper and the ink. Brightness is measured using a GE Reflectance Scale, which measures the reflection of light off of a grade of paper. One is the lowest reflection, or what would be given to a totally black grade, and 100 is the brightest measured grade.
Director, AD/CVD Operations, Office 1, regarding ‘‘Verification Report of the Government of the People’s Republic of China’’ (July 28, 2010); Memorandum from David Neubacher, David Layton, and Jennifer Meek, International Trade Compliance Analysts, Office 1, to Susan H. Kuhbach, Director, AD/CVD Operations, Office 1, regarding ‘‘Verification Report of Shandong Sun Paper Industry Joint Stock Co., Ltd., and Yanzhou Tianzhang Paper Industry Co., Ltd.’’ (August 4, 2010); and Memorandum from David Neubacher, Scott Holland, David Layton, and Jennifer Meek, International Trade Compliance Analysts, Office 1, to Susan H. Kuhbach, Director, AD/CVD Operations, Office 1, regarding ‘‘Verification Report of Gold East Paper (Jiangsu) Co., Ltd. and its reported cross- owned affiliates’’ (August 24, 2010).
On August 26, 2010, we issued a preliminary determination regarding the creditworthiness of the Gold companies for the years 2006–2008. See Memorandum from Mary Kolberg, International Trade Compliance Analyst, Office 1, to Susan H. Kuhbach, Director, AD/CVD Operations, Office 1, regarding ‘‘Preliminary Creditworthiness Determination for Gold East Paper (Jiangsu) Co., Ltd. and its Cross-Owned Affiliates,’’ (August 26, 2010).
On August 27, 2010, the Department issued its Post-Preliminary Analysis for the Gold and Sun companies. See Memorandum from The Team, Office 1, to Ronald K. Lorentzen, Deputy Assistant Secretary for Import Administration, regarding ‘‘Countervailing Duty Investigation of Certain Coated Paper Suitable for High- Quality Print Graphics Using Sheet-Fed Presses from the People’s Republic of China: Post-Preliminary Analysis Memorandum for Gold East Paper (Jiangsu) Co., Ltd. (‘‘GE’’), Gold Huasheng Paper Co., Ltd. (‘‘GHS’’), and their reported cross-owned affiliates (collectively, ‘‘APP companies’’),’’ (August 27, 2010) and Memorandum from The Team, Office 1, to Ronald K. Lorentzen, Deputy Assistant Secretary for Import Administration, regarding ‘‘Countervailing Duty Investigation of Certain Coated Paper Suitable for High- Quality Print Graphics Using Sheet-Fed Presses from the People’s Republic of China: Post-Preliminary Analysis Memorandum for Shandong Sun Paper Industry Joint Stock Co., Ltd. (‘‘Sun Paper’’) and Yanzhou Tianzhang Paper Industry Co. Ltd. (‘‘Yanzhou Tianzhang’’) (collectively, ‘‘Sun companies’’),’’ (August 27, 2010), available in the CRU. (These analyses are referred to herein as ‘‘Post- Preliminary Analyses’’.)
On August 30, 2010, the Department determined not to investigate a new subsidy allegation regarding currency undervaluation. See Memorandum form The Team to Ronald K. Lorentzen, Deputy Assistant Secretary for Import Administration, regarding ‘‘New Subsidy Allegation—Currency,’’ (August 30, 2010), available in the CRU.
We received case briefs from the GOC, the Gold companies, the Sun companies, and Petitioners on September 7, 2010. The same parties submitted rebuttal briefs on September 10, 2010.
The GOC, Gold companies, and Petitioners requested a hearing. The same parties later withdrew their requests. Therefore, no hearing was held.
Scope of the Investigation
The merchandise covered by this investigation includes certain coated paper and paperboard 1 in sheets suitable for high quality print graphics using sheet-fed presses; coated on one or both sides with kaolin (China or other clay), calcium carbonate, titanium dioxide, and/or other inorganic substances; with or without a binder; having a GE brightness level of 80 or higher; 2 weighing not more than 340 grams per square meter; whether gloss grade, satin grade, matte grade, dull grade, or any other grade of finish; whether or not surface-colored, surface- decorated, printed (except as described below), embossed, or perforated; and irrespective of dimensions (‘‘Certain Coated Paper’’).
Certain Coated Paper includes: (a) Coated free sheet paper and paperboard that meets this scope definition; (b) coated groundwood paper and paperboard produced from bleached chemi-thermo-mechanical pulp (‘‘BCTMP’’) that meets this scope definition; and (c) any other coated paper and paperboard that meets this scope definition.
Certain Coated Paper is typically (but not exclusively) used for printing multi- colored graphics for catalogues, books, magazines, envelopes, labels and wraps, greeting cards, and other commercial
printing applications requiring high quality print graphics.
Specifically excluded from the scope are imports of paper and paperboard printed with final content printed text or graphics.
As of 2009, imports of the subject merchandise are provided for under the following categories of the Harmonized Tariff Schedule of the United States (‘‘HTSUS’’): 4810.14.11, 4810.14.1900, 4810.14.2010, 4810.14.2090, 4810.14.5000, 4810.14.6000, 4810.14.70, 4810.19.1100, 4810.19.1900, 4810.19.2010, 4810.19.2090, 4810.22.1000, 4810.22.50, 4810.22.6000, 4810.22.70, 4810.29.1000, 4810.29.5000, 4810.29.6000, 4810.29.70, 4810.32, 4810.39 and 4810.92. While HTSUS subheadings are provided for convenience and customs purposes, the written description of the scope of this investigation is dispositive.
Scope Comments Following the Preliminary
Determination, on August 3, 2010, the Department issued a decision memorandum addressing three scope issues in this and the concurrent antidumping and countervailing duty investigations on certain coated paper from Indonesia and the People’s Republic of China: (1) Whether to clarify the scope of these investigations to exclude multi-ply coated paper and paperboard; (2) whether to modify the scope language by striking the phrase ‘‘suitable for high-quality print graphics;’’ and (3) whether to add three HTSUS numbers which may include in- scope merchandise (i.e., HTSUS 4810.32, 4810.39 and 4810.92). See August 3, 2010, Memorandum to Ronald K. Lorentzen, Deputy Assistant Secretary for Import Administration, from Susan Kuhbach, Director, Office 1, entitled ‘‘Scope’’ (August 3, 2010 Scope Memorandum). For the reasons explained in the August 3, 2010, Scope Memorandum, the Department determined that: (1) Multi-ply products that otherwise meet the description of the scope of the investigations are not excluded from the scope; (2) the ‘‘suitable for high-quality print graphics’’ language should not be deleted from the scope; and (3) the three HTSUS numbers at issue should be added to the scope.
The Department subsequently provided the interested parties an opportunity to comment on its post- preliminary scope determination. In response, the respondents in these investigations filed a case brief on August 20, 2010, and Petitioners filed a rebuttal brief on August 24, 2010. Based on the Department’s analysis of these
VerDate Mar<15>2010 17:01 Sep 24, 2010 Jkt 220001 PO 00000 Frm 00008 Fmt 4703 Sfmt 4703 E:\FR\FM\27SEN1.SGM 27SEN1srob
inso
n on
DS
KH
WC
L6B
1PR
OD
with
NO
TIC
ES

59214 Federal Register / Vol. 75, No. 186 / Monday, September 27, 2010 / Notices
comments and the factual records of these investigations, the Department continues to find that multi-ply coated paper and paperboard are not excluded from the scope of the investigations, that the ‘‘suitable for high-quality print graphics’’ language should be maintained, and that the three HTSUS numbers listed above should be added to the scope. For a complete discussion of the parties’ comments and the Department’s position, see Memorandum from Susan Kuhbach, Acting Deputy Assistant Secretary for Antidumping and Countervailing Duty Operations, to Ronald K. Lorentzen, Deputy Assistant Secretary for Import Administration, entitled ‘‘Issues and Decision Memorandum for the Final Determination in the Countervailing Duty Investigation of Certain Coated Paper Suitable For High-Quality Print Graphics Using Sheet-Fed Presses from the People’s Republic of China’’ (September 20, 2010) (hereafter ‘‘Decision Memorandum’’), which is hereby adopted by this notice.
Injury Test Because the PRC is a ‘‘Subsidies
Agreement Country’’ within the meaning of section 701(b) of the Tariff Act of 1930, as amended (‘‘the Act’’), the International Trade Commission (the ‘‘ITC’’) is required to determine whether imports of the subject merchandise from the PRC materially injure, or threaten material injury to, a U.S. industry. On November 9, 2009, the U.S. International Trade Commission (‘‘ITC’’) issued its affirmative preliminary determination that there is a reasonable indication that an industry in the United States is materially injured by reason of allegedly subsidized imports of coated paper from the PRC. See Certain Coated Paper Suitable for High- Quality Print Graphics Using Sheet-Fed Presses From China and Indonesia; Determinations, Investigation Nos. 701– TA–470–471 and 731–TA–1169–1170, 74 FR 61174 (November 23, 2009).
Analysis of Comments Received All issues raised in the case and
rebuttal briefs by parties to this investigation are addressed in the above-referenced Decision Memorandum. Attached to this notice as an Appendix is a list of the issues that parties have raised and to which we have responded in the Decision Memorandum. Parties can find a complete discussion of all issues raised in this investigation and the corresponding recommendations in this public memorandum, which is on file in the CRU. In addition, a complete version of the Decision Memorandum
can be accessed directly on the Internet at http://ia.ita.doc.gov/frn/. The paper copy and electronic version of the Decision Memorandum are identical in content.
Use of Adverse Facts Available Consistent with the Preliminary
Determination, we have continued to rely on facts available and to draw an adverse inference, in accordance with sections 776(a) and (b) of the Act, for certain of our findings. With respect to the GOC’s provision of papermaking chemicals, we determine that kaolin clay, caustic soda and titanium dioxide are being provided by governmental authorities for the reasons explained in the Preliminary Determination and we determine that the subsidy conferred through the GOC’s provision of caustic soda is specific for the reasons explained in the Post-Preliminary Analysis. With respect to the GOC’s provision of land use rights in the Yangpu Economic Development Zone, we determine that the subsidy is specific for the reason explained in Post-Preliminary Analyses. Finally, with respect to the GOC’s provision of electricity, we determine that the GOC has made a financial contribution that is specific, and we have applied an adverse inference is determining the benefit for the reasons explained in the Preliminary Determination.
Sun Companies In a departure from the Preliminary
Determination, the Department now finds that the use of ‘‘facts otherwise available’’ pursuant to section 776(a) of the Act is warranted with regard to the Sun companies. At verification, we learned that numerous companies that meet the Department’s criteria for being ‘‘cross-owned,’’ as that term is defined in 19 CFR 351.525(b)(6)(vi), and that produced certain coated paper or inputs for paper products were not included in the Sun companies’ responses. Therefore, information that the Department needs to calculate the Sun companies’ subsidy rate has not been provided and the Department is unable to accurately determine the appropriate level of subsidization provided to the Sun companies. By not providing this information despite being in a position to do so, the Sun companies failed to act to the best of their ability. Accordingly, we find that an adverse inference is warranted, pursuant to section 776(b) of the Act.
For the final determination and consistent with the Department’s recent practice, we are computing a total AFA rate for the Sun companies, generally using program-specific rates determined
for the cooperating respondent or in past cases. Specifically, for programs other than those involving income tax exemptions and rate reductions, we will apply the highest calculated rate for the identical program in this investigation if a responding company used the identical program. If there is no identical program match within the investigation, we will use the highest non-de minimis rate calculated for the same or similar program in another PRC CVD investigation. Absent an above-de minimis subsidy rate calculated for the same or similar program, we will apply the highest calculated subsidy rate for any program otherwise listed that could conceivably be used by the Sun companies. See, e.g., Certain Kitchen Shelving and Racks from the People’s Republic of China: Final Affirmative Countervailing Duty Determination, 74 FR 37012 (July 27, 2009) and the accompanying Issues and Decision Memorandum at ‘‘Use of Facts Otherwise Available and Adverse Facts Available’’ at 4–5. The Department has further amended its methodology to exclude any calculated rate for a program by a voluntary respondent. See Aluminum Extrusions From the People’s Republic of China: Preliminary Affirmative Countervailing Duty Determination, 75 FR 54302, 54305 (September 7, 2010).
Also, as explained in Certain Tow- Behind Lawn Groomers and Certain Parts Thereof from the People’s Republic of China: Initiation of Countervailing Duty Investigation, 73 FR 42324 (July 21, 2008) and accompanying Initiation Checklist, where the GOC can demonstrate through complete, verifiable, positive evidence that non- cooperative companies (including all their facilities and cross-owned affiliates) are not located in particular provinces whose subsidies are being investigated, the Department does not intend to include those provincial programs in determining the countervailable subsidy rate for the non- cooperative companies.
The GOC failed to provide verifiable information demonstrating that the Sun companies are located in particular provinces or that they have no facilities or cross-owned affiliates in any other province in the PRC, as requested. Therefore, the Department makes the adverse inference that the Sun companies have facilities and/or cross- owned affiliates that received subsidies under all of the sub-national programs alleged prior to the selection of mandatory respondents.
In deciding which facts to use as AFA, section 776(b) of the Act and 19 CFR 351.308(c)(1) authorize the
VerDate Mar<15>2010 17:01 Sep 24, 2010 Jkt 220001 PO 00000 Frm 00009 Fmt 4703 Sfmt 4703 E:\FR\FM\27SEN1.SGM 27SEN1srob
inso
n on
DS
KH
WC
L6B
1PR
OD
with
NO
TIC
ES

59215 Federal Register / Vol. 75, No. 186 / Monday, September 27, 2010 / Notices
Department to rely on information derived from: (1) The petition; (2) a final determination in the investigation; (3) any previous review or determination; or (4) any other information placed on the record. The Department’s practice when selecting an adverse rate from among the possible sources of information is to ensure that the rate is sufficiently adverse ‘‘as to effectuate the statutory purposes of the adverse facts available rule to induce respondents to provide the Department with complete and accurate information in a timely manner.’’ See, e.g., Notice of Final Determination of Sales at Less Than Fair Value: Static Random Access Memory Semiconductors From Taiwan, 63 FR 8909, 8932 (February 23, 1998). The Department’s practice also ensures ‘‘that the party does not obtain a more favorable result by failing to cooperate than if it had cooperated fully.’’ See Uruguay Round Agreements Act Statement of Administrative Action (‘‘SAA’’), attached to H.R. Rep. No. 103– 316, Vol. I, at 870 (1994), reprinted in 1994 U.S.C.C.A.N 3773, 4163.
Consistent with this, we have calculated the Sun companies’ countervailable subsidy rate as follows:
Loans For the ‘‘Preferential Lending to the
Coated Paper Industry’’ and ‘‘Fast Growth High-Yield Forestry Program Loans’’ programs, we have applied the loan rate calculated for the Gold companies in this investigation, 8.89 percent, to each program.
Grants The Department included in its
investigation numerous grant programs: ‘‘Funds for Forestry Plantation Construction and Management,’’ ‘‘State Key Technologies Renovation Project Fund,’’ ‘‘Loan Interest Subsidies for Major Industrial Technology Reform Projects in Wuhan,’’ ‘‘Funds for Water Treatment Improvement Projects in the Songhuajiang Basin,’’ ‘‘Special Fund for Energy Saving Technology Reform in Wuhan and Shougang Municipality,’’ ‘‘Clean Production Technology Fund,’’ ‘‘Famous Brands Awards,’’ ‘‘Grants to Enterprises Achieving RMB 10 Million in Sales Revenue and Implementing ‘Three Significant Projects,’ ’’ ‘‘Grants to Large Enterprises in Jining City,’’ ‘‘Funds for Water Treatment and Pollution Control Projects for Three Rivers and Three Lakes,’’ ‘‘Grants for Programs Under the 2007 Science and Technology Development Plan in Shandong Province,’’ ‘‘Special Funds for Economic and Trade Development,’’ and ‘‘Interest Subsidies for Forestry Loans.’’ The Gold companies did not use any of these
programs and the Department has not calculated above de minimis rates for any of these programs in prior investigations. Moreover, all previously calculated rates for grant programs from prior PRC CVD investigations have been de minimis. Therefore, for each of these programs, we have determined to use the highest calculated subsidy rate by a non-voluntary respondent for any program otherwise listed, which could conceivably have been used by the Sun companies. This rate was 8.89 percent for the ‘‘Government Policy Lending Program’’ calculated for the Gold companies in this investigation.
Income Tax Rate Reduction and Exemption Programs
For ‘‘The ‘Two Free, Three Half’ Program,’’ ‘‘Income Tax Subsidies for Foreign Invested Enterprises (‘FIEs’) Based on Geographic Location,’’ ‘‘Income Tax Reduction for FIEs Purchasing Domestically Produced Equipment,’’ ‘‘Local Income Tax Exemption and Reduction Program for ‘Productive FIEs,’ ’’ ‘‘Preferential Tax Policies for Technology or Knowledge- Intensive FIEs,’’ ‘‘Preferential Tax Programs for FIEs that are New or High Technology Enterprises,’’ ‘‘Income Tax Reductions for High-Technology Industries in Guandong Province,’’ ‘‘Income Tax Exemption Program for Export-Oriented FIEs,’’ we have applied an adverse inference that the Sun companies paid no income tax during the POI (i.e., calendar year 2008). The standard income tax rate for corporations in the PRC was 30 percent, plus a three percent provincial income tax rate. See GOC’s Response to the Department’s Initial Questionnaire, dated January 8, 2010. Therefore, the highest possible benefit for these income tax programs is 33 percent. We are applying the 33 percent AFA rate on a combined basis (i.e., the eight programs combined provided a 33 percent benefit). This 33 percent AFA rate does not apply to tax credit and refund programs.
Other Tax Benefits and VAT/Tariff Reductions and Exemptions
We are using the rates calculated for the Gold companies in this investigation for the following programs: ‘‘Preferential Tax Policies for Research and Development at FIEs’’ (0.01 percent); ‘‘Exemption from Maintenance and Construction Taxes and Education Surcharges for FIEs’’ (0.34 percent); ‘‘Value Added-Tax and Tariff Exemptions on Imported Equipment’’ (3.46 percent); ‘‘Domestic VAT Refunds for Companies Located in the Hainan Economic Development Zone’’ (0.37
percent); and ‘‘VAT Rebates on Domestically Produced Equipment’’ (0.20 percent). For the programs the Gold companies did not use, ‘‘Corporate Income Tax Refund Program for Reinvestment of FIE Profits in Export Orientated Enterprises,’’ and ‘‘Income Tax Credits for Domestically Owned Companies Purchasing Domestically Produced Equipment,’’ we have used the highest non-de minimis rate for any indirect tax program from a PRC CVD investigation. The rate we selected is 1.51 percent, which was the rate calculated for respondent Gold East Paper (Jiangsu) Co., Ltd. (‘‘GE’’) for the ‘‘Value-added Tax and Tariff Exemptions on Imported Equipment,’’ program. See Coated Free Sheet Paper from the People’s Republic of China: Final Affirmative Countervailing Duty Determination, 72 FR 60645 (October 25, 2007) and accompanying Issues and Decision Memorandum at 14.
Provision of Goods and Services for Less Than Adequate Remuneration (‘‘LTAR’’)
For ‘‘Provision of Electricity for LTAR,’’ ‘‘Provision of Papermaking Chemicals for LTAR,’’ and ‘‘Land in the Yangpu Economic Development Zone,’’ we have used the rates calculated for the Gold companies in this investigation, 0.08 percent, 0.80 percent and 0.85 percent, respectively.
Economic Development Zones (‘‘EDZs’’) For the ‘‘Subsidies in the Nanchang
Economic Development Zone,’’ Petitioners alleged that land, water and electricity were provided to producers of coated paper for LTAR in the Nanchang EDZ. For land, we have applied the rate calculated for the Gold companies in this investigation, 0.85 percent. For water, the Department has not calculated an above de minimis rate for this program in prior investigations. Therefore, we have applied the land for LTAR rate calculated for the Gold companies in this investigation, 0.85 percent because this program is similar to other EDZ LTAR programs in this investigation. We are not applying a sub-national rate for electricity, as we are already applying a national-level rate to the Sun companies as AFA.
For ‘‘Subsidies in the Wuhan Economic Development Zone,’’ Petitioners alleged that land was provided to producers of coated paper at LTAR in the Wuhan EDZ. Therefore, we have applied the rate calculated for the Gold companies in this investigation, 0.85 percent. For ‘‘Subsidies in the Yangpu Economic Development Zone,’’ Petitioners alleged that land and electricity were provided to producers of coated paper at LTAR in the Yangpu
VerDate Mar<15>2010 17:01 Sep 24, 2010 Jkt 220001 PO 00000 Frm 00010 Fmt 4703 Sfmt 4703 E:\FR\FM\27SEN1.SGM 27SEN1srob
inso
n on
DS
KH
WC
L6B
1PR
OD
with
NO
TIC
ES
59216 Federal Register / Vol. 75, No. 186 / Monday, September 27, 2010 / Notices
EDZ. For land, we are applying the rate calculated for the Gold companies in this investigation, 0.85 percent. For electricity, as previously discussed we are not applying a sub-national rate. Finally, for ‘‘Subsidies in the Zhenjiang Economic Development Zone,’’ Petitioners alleged that electricity was provided to producers of coated paper at LTAR in the Zhenjiang EDZ. As discussed above, we are not applying a sub-national rate for electricity.
Section 776(c) of the Act provides that, when the Department relies on secondary information rather than on information obtained in the course of an investigation or review, it shall, to the extent practicable, corroborate that information from independent sources that are reasonably at its disposal. Secondary information is ‘‘information derived from the petition that gave rise to the investigation or review, the final determination concerning the subject merchandise, or any previous review under section 751 concerning the subject merchandise.’’ See e.g., SAA, at 870. The Department considers information to be corroborated if it has probative value. See id. To corroborate secondary information, the Department will, to the extent practicable, examine the reliability and relevance of the information to be used. The SAA emphasizes, however, that the Department need not prove that the selected facts available are the best alternative information. See SAA at 869.
With regard to the reliability aspect of corroboration, we note that these rates were calculated in recent final CVD determinations. Further, the calculated rates were based upon verified information about the same or similar
programs. Moreover, no information has been presented in this investigation that calls into question the reliability of these calculated rates that we are applying as AFA. Finally, unlike other types of information, such as publicly available data on the national inflation rate of a given country or national average interest rates, there typically are no independent sources for data on company-specific benefits resulting from countervailable subsidy programs.
With respect to the relevance aspect of corroborating the rates selected, the Department will consider information reasonably at its disposal in considering the relevance of information used to calculate a countervailable subsidy benefit. Where circumstances indicate that the information is not appropriate as AFA, the Department will not use it. See Fresh Cut Flowers From Mexico; Final Results of Antidumping Duty Administrative Review, 61 FR 6812 (February 22, 1996).
In the absence of record evidence concerning these programs due to Sun companies’ decision to impede the investigation, the Department has reviewed the information concerning PRC subsidy programs in this and other cases. For those programs for which the Department has found a program-type match, we find that, because these are the same or similar programs, they are relevant to the programs of this case. For the programs for which there is no program-type match, the Department has selected the highest calculated subsidy rate for any PRC program from a non-voluntary respondent from which the Sun companies could receive a benefit to use as AFA. The relevance of this rate is that it is an actual calculated
CVD rate for a PRC program from which the Sun companies could conceivably receive a benefit. Further, this rate was calculated for a period close to the POI in the instant case. Moreover, the Sun companies’ failure to respond to requests for information has ‘‘resulted in an egregious lack of evidence on the record to suggest an alternative rate.’’ See Shanghai Taoen Int’l Trading Co., Ltd. v. United States, 360 F. Supp. 2d 1339, 1348 (Ct. Int’l Trade 2005). Due to the lack of participation by the Sun companies and the resulting lack of record information concerning these programs, the Department has corroborated the rates it selected to the extent practicable.
On this basis, we determine that the AFA countervailable subsidy rate for the Sun companies is 178.03 percent ad valorem.
Suspension of Liquidation
In accordance with section 705(c)(1)(B)(i)(I) of the Act, we have calculated individual rates for each producer/exporter of the subject merchandise individually investigated. Section 705(c)(5)(A)(i) of the Act states that for companies not investigated, we will determine an ‘‘all others’’ rate equal to the weighted-average countervailable subsidy rates established for exporters and producers individually investigated, excluding any zero and de minimis countervailable subsidy rates, and any rates determined entirely under section 776 of the Act. As the Sun companies’ subsidy rate was determined entirely under section 776 of the Act, the Gold companies’ calculated rate was used as the All Others rate.
Exporter/manufacturer Net subsidy rate
Gold East Paper (Jiangsu) Co., Ltd, Gold Huasheng Paper Co., Ltd., Gold East Trading (Hong Kong) Company Ltd., Ningbo Zhonghua Paper Co., Ltd., and Ningbo Asia Pulp & Paper Co., Ltd .................................................................................................. 17.64
Shandong Sun Paper Industry Joint Stock Co., Ltd. and Yanzhou Tianzhang Paper Industry Co., Ltd ............................................... 178.03 All Others ................................................................................................................................................................................................. 17.64
Also, in accordance with section 703(d) of the Act, we instructed U.S. Customs and Border Protection to discontinue the suspension of liquidation for countervailing duty purposes for subject merchandise entered on or after July 7, 2010, but to continue the suspension of liquidation of entries made from March 9, 2010, through July 6, 2010.
We will issue a countervailing duty order if the ITC issues a final affirmative injury determination, and we will require a cash deposit of estimated countervailing duties for such entries of
merchandise in the amounts indicated above. If the ITC determines that material injury, or threat of material injury, does not exist, this proceeding will be terminated and all estimated deposits or securities posted as a result of the suspension of liquidation will be refunded or canceled.
ITC Notification
In accordance with section 705(d) of the Act, we will notify the ITC of our determination. In addition, we are making available to the ITC all non- privileged and non-proprietary
information related to this investigation. We will allow the ITC access to all privileged and business proprietary information in our files, provided the ITC confirms that it will not disclose such information, either publicly or under an APO, without the written consent of the Assistant Secretary for Import Administration.
Return or Destruction of Proprietary Information
In the event that the ITC issues a final negative injury determination, this notice will serve as the only reminder
VerDate Mar<15>2010 17:01 Sep 24, 2010 Jkt 220001 PO 00000 Frm 00011 Fmt 4703 Sfmt 4703 E:\FR\FM\27SEN1.SGM 27SEN1srob
inso
n on
DS
KH
WC
L6B
1PR
OD
with
NO
TIC
ES
59217 Federal Register / Vol. 75, No. 186 / Monday, September 27, 2010 / Notices
to parties subject to an administrative protective order (‘‘APO’’) of their responsibility concerning the destruction of proprietary information disclosed under APO in accordance with 19 CFR 351.305(a)(3). Timely written notification of the return/ destruction of APO materials or conversion to judicial protective order is hereby requested. Failure to comply with the regulations and terms of an APO is a violation which is subject to sanction.
This determination is published pursuant to sections 705(d) and 777(i) of the Act.
Dated: September 20, 2010. Ronald K. Lorentzen, Deputy Assistant Secretary for Import Administration.
Appendix
List of Comments and Issues in the Decision Memorandum
General Issues
Comment 1 Application of CVD Law to the PRC
Comment 2 Application of the CVD Law to NMEs and the Administrative Protection Act
Comment 3 Double Counting/Overlapping Remedies
Comment 4 Cutoff Date for Identifying Subsidies
Currency
Comment 5 Opportunity to Comment and the Initiation Standard
Comment 6 The Determination Not To Investigate the Alleged Currency Subsidy
Comment 7 The Department’s Analysis of a Unified Rate of Exchange
Scope
Comment 8 Burden Imposed on Respondents
Comment 9 Whether Multi-ply Paperboard Was Intended To Be in the Scope
Comment 10 Physical Characteristics and End-use Applications Distinguish Multi- ply Paper From the Covered Merchandise
Comment 11 Whether the Department Should Retain the ‘‘Suitability’’ Language in the Scope Description
Comment 12 Whether Inclusion of Multi- ply Paper in the Scope Affects Respondent Selection
Comment 13 Scope Expansion Violates Standing and Injury Requirements
Chemicals for LTAR
Comment 14 Benchmarks—Papermaking Chemicals
Comment 15 Provision of Papermaking Chemicals for LTAR—Specificity
Comment 16 Government Ownership and Determining Whether a Financial Contribution Has Occurred
Preferential Lending to the Coated Paper Industry
Comment 17 Whether Chinese Banks Are Authorities
Comment 18 Whether the Policy Loan Program Is Specific
Lending Benchmarks
Comment 19 Whether Negative Real Interest Rates Should Be Excluded From the Regression
Comment 20 Whether the Regression Is Statistically Valid
Comment 21 Should the Department Use an In-Country Benchmark
Comment 22 Terms of Loan Rates in the IMF Data
Comment 23 Whether the Long-Term and Discount Rates Are Flawed
Provision of Land for LTAR
Comment 24 Whether HYDC Is an Authority
Comment 25 Financial Contribution Comment 26 Whether To Use an In-country
Benchmark Comment 27 Whether There Are Flaws in
the Thai Benchmark Comment 28 Specificity of Land for LTAR
Based on AFA
Issues Related to Sun Companies
Comment 29 Whether To Use Revised Sales Values for the Sun Companies
Comment 30 Whether To Apply Adverse Facts Available to Sun Companies’ Unreported Loans
Comment 31 Whether To Apply Facts Available to Sun Companies’ Unreported Cross-Owned Companies
Issues Related to Gold Companies
Comment 32 Whether To Grant the Gold Companies an EV Adjustment
Comment 33 Creditworthiness Comment 34 Whether To Adjust the
Uncreditworthiness Benchmark Comment 35 GE Sales Denominator Comment 36 Whether To Attribute
Subsidies Received by Input Suppliers Whose Inputs Are Not Used for Merchandise Exported to the United States
Comment 37 Whether the Department Should Attribute Subsidies From Pulp Producers Based on the Percentage of Total Pulp Sales to the Paper Producers Covered
Comment 38 Whether To Countervail Additional Financing Reported by the Gold Companies
Comment 39 Whether To Adjust the Gold Companies’ Interest Calculation
Comment 40 Whether To Adjust JHP’s Reported VAT and Duty Exemptions on Imported Equipment
Comment 41 Whether To Use an Alternative Electricity Benchmark
Comment 42 Whether To Apply AFA to JAP and JHP Caustic Soda Purchases
[FR Doc. 2010–24184 Filed 9–24–10; 8:45 am]
BILLING CODE 3510–DS–P
DEPARTMENT OF COMMERCE
International Trade Administration
[A–570–958]
Certain Coated Paper Suitable for High-Quality Print Graphics Using Sheet-Fed Presses From the People’s Republic of China: Final Determination of Sales at Less Than Fair Value
AGENCY: Import Administration, International Trade Administration, Department of Commerce. DATES: Effective Date: September 27, 2010. SUMMARY: On May 6, 2010, the Department of Commerce (‘‘Department’’) published its preliminary determination of sales at less than fair value (‘‘LTFV’’) in the antidumping investigation of certain coated paper suitable for high-quality print graphics using sheet-fed presses (‘‘coated paper’’) from the People’s Republic of China (‘‘PRC’’). We invited interested parties to comment on our preliminary determination of sales at LTFV. Based on our analysis of the comments we received, we have made changes to our margin calculations for the mandatory respondents. The final dumping margins for this investigation are listed in the ‘‘Final Determination Margins’’ section below. FOR FURTHER INFORMATION CONTACT: Lindsey Novom and Demitri Kalogeropoulos, AD/CVD Operations, Office 8, Import Administration, International Trade Administration, U.S. Department of Commerce, 14th Street and Constitution Avenue, NW., Washington, DC 20230; telephone: (202) 482–5256 or (202) 482–2623, respectively.
SUPPLEMENTARY INFORMATION:
Case History
The Department published its preliminary determination of sales at LTFV on May 6, 2010. See Certain Coated Paper Suitable for High-Quality Print Graphics Using Sheet-Fed Presses from the People’s Republic of China: Notice of Preliminary Determination of Sales at Less Than Fair Value and Postponement of Final Determination, 75 FR 24892, (May 6, 2010) (‘‘Preliminary Determination’’).
On May 19, 2010, Shandong Sun Paper Industry Joint Stock Co., Ltd., Yanzhou Tianzhang Paper Industry Co., Ltd., Shandong International Paper and Sun Coated Paperboard Co., Ltd., International Paper and Sun Cartonboard Co., Ltd. (collectively ‘‘Sun Paper Companies’’) ceased participating
VerDate Mar<15>2010 17:01 Sep 24, 2010 Jkt 220001 PO 00000 Frm 00012 Fmt 4703 Sfmt 4703 E:\FR\FM\27SEN1.SGM 27SEN1srob
inso
n on
DS
KH
WC
L6B
1PR
OD
with
NO
TIC
ES

59218 Federal Register / Vol. 75, No. 186 / Monday, September 27, 2010 / Notices
1 See letter from Sun Paper Companies, regarding ‘‘Certain Coated Paper Suitable for High-Quality Print Graphics Using Sheet-Fed Presses from the People’s Republic of China; Withdrawal from Antidumping Case,’’ dated May 19, 2010.
2 See Memorandum to the file, ‘‘Wage Rate Data,’’ dated July 16, 2010.
in the investigation.1 On May 10, 2010, Gold East Paper (Jiangsu) Co., Ltd. (‘‘GE’’), Gold Huasheng Paper Co., Ltd. (‘‘GHS’’), Gold East (Hong Kong) Trading Co., Ltd. (‘‘GEHK’’), Ningbo Zhonghua Paper Co., Ltd. (‘‘NBZH’’), Ningbo Asia Pulp and Paper Co., Ltd. (‘‘NAPP’’), collectively referred to as the ‘‘GE Group,’’ or ‘‘APP-China,’’ alleged that the Department made ministerial errors in its Preliminary Determination. On May 13, 2010, APP-China and Appleton Coated LLC, NewPage Corporation, S.D. Warren Company d/b/a Sappi Fine Paper North America, and United Steel, Paper and Forestry, Rubber, Manufacturing, Energy, Allied Industrial and Service Workers International Union (collectively, ‘‘Petitioners’’) submitted comments on APP-China’s allegations. On June 9, 2010, the Department released a memo detailing the errors it found to be ‘‘clerical’’ in nature, but determined not to amend the Preliminary Determination as the ministerial errors were not significant under 19 CFR 351.224(g).
In a Memo to the File, on May 19, 2010, regarding ‘‘Phone Call Regarding Factual Information Submission and Tackifier Input,’’ the Department requested information with respect to APP-China’s ‘‘tackifier’’ input. On May 21, 2010, APP-China submitted the input data. APP-China and Shandong Chenming Paper Holding Ltd. (‘‘Chenming’’) also submitted a market- oriented industry (‘‘MOI’’) submission, on May 19, 2010.
Between May 26, 2010, and June 25, 2010, the Department conducted verifications of several of the APP-China entities and their affiliated U.S. reseller Global Paper Solutions Inc. (‘‘GPS’’). The Department released both verification reports for these companies on July 21, 2010. See the ‘‘Verification’’ section below for additional information. Petitioners submitted a request for a public hearing on May 28, 2010, and June 3, 2010, respectively. On August 6, 2010, APP-China and Petitioners filed timely requests for a withdrawal of request for a public hearing.
APP-China and Petitioners submitted surrogate value comments on June 29, 2010. On July 6, 2010, Petitioners submitted rebuttal comments on this information. On July 27, 2010, the Department requested a revised factors of production (‘‘FOP’’) and sales database from APP-China, and on July 30, 2010, APP-China submitted the requested databases to the Department.
On August 5, 2010, case briefs were filed by Petitioners, APP-China, and the Government of China (‘‘GOC’’), APP- China, and Chenming, collectively, submitted a separate case brief on August 5, 2010. On August 10, 2010, Petitioners filed their rebuttal brief, and on August 11, 2010, APP-China filed its rebuttal brief. The Department released labor wage rate data on July 16, 2010.2 Petitioners and APP-China submitted comments on the labor wage rate data on July 23, 2010. The Department released additional (Honduran) labor wage rate data on August 5, 2010, and Petitioners submitted comments on this information on August 9, 2010. On August 12, 2010, APP-China requested that the Department reject parts of Petitioners’ August 10, 2010 rebuttal brief because it contains certain new information. On August 16, 2010, Petitioners submitted a response to APP-China’s request. On August 17, 2010, the Department rejected APP- China’s request and continued to accept the Petitioners’ rebuttal brief as filed because the information at issue already existed on the record of this investigation. On August 19, 2010, APP- China submitted a request for reconsideration, and Petitioners submitted a request to remove APP- China’s request for reconsideration from the record on August 23, 2010. On September 1, 2010, the Department rejected APP-China’s August 19, 2010, request for reconsideration and Petitioners’ August 23, 2010 submission because they contained untimely filed written arguments within the meaning of 19 CFR 351.309 of the Department’s regulations. In accordance with 19 CFR 351.302(d), the Department removed the submissions from the record of the proceeding and has not considered them for purposes of the final determination. On September 3, 2010 APP-China resubmitted its request for reconsideration, and Petitioners resubmitted their request to remove APP-China’s request for reconsideration. On September 16, 2010, the Department issued its final response not to reject Petitioners’ rebuttal brief.
Scope Comments Following the Preliminary
Determination, on August 3, 2010, the Department issued a decision memorandum addressing three scope issues in this and the concurrent antidumping and countervailing duty investigations on certain coated paper from Indonesia and the People’s Republic of China: (1) Whether to clarify
the scope of these investigations to exclude multi-ply coated paper and paperboard; (2) whether to modify the scope language by striking the phrase ‘‘suitable for high-quality print graphics;’’ and (3) whether to add three Harmonized Tariff Schedule of the United States (‘‘HTSUS’’) numbers which may include in-scope merchandise (i.e., HTSUS 4810.32, 4810.39 and 4810.92). See August 3, 2010, Memorandum to Ronald K. Lorentzen, Deputy Assistant Secretary for Import Administration, from Susan Kuhbach, Director, Office 1, entitled ‘‘Scope’’ (August 3, 2010 Scope Memorandum). For the reasons explained in the August 3, 2010, Scope Memorandum, the Department determined that: (1) Multiply products that otherwise meet the description of the scope of the investigations are not excluded from the scope; (2) the ‘‘suitable for high-quality print graphics’’ language should not be deleted from the scope; and (3) the three HTSUS numbers at issue should be added to the scope.
The Department subsequently provided the interested parties an opportunity to comment on its post- preliminary scope determination. In response, the respondents in these investigations filed a case brief on August 20, 2010, and the petitioners filed a rebuttal brief on August 24, 2010. Based on the Department’s analysis of these comments and the factual records of these investigations, the Department continues to find that multi-ply coated paper and paperboard are not excluded from the scope of the investigations, that the ‘‘suitable for high-quality print graphics’’ language should be maintained, and that the three HTSUS numbers listed above should be added to the scope. For a complete discussion of the parties’ comments and the Department’s position, see ‘‘Issues and Decision Memorandum for the Final Determination in the Countervailing Duty Investigation of Certain Coated Paper Suitable for High-Quality Print Graphics Using Sheet-Fed Presses from the People’s Republic of China,’’ dated concurrently with this notice and incorporated herein by reference.
Period of Investigation
The period of investigation (‘‘POI’’) is January 1, 2009, through June 30, 2009. This period corresponds to the two most recent fiscal quarters prior to the month of the filing of the petition, which was September 2009. See 19 CFR 351.204(b)(1).
VerDate Mar<15>2010 17:01 Sep 24, 2010 Jkt 220001 PO 00000 Frm 00013 Fmt 4703 Sfmt 4703 E:\FR\FM\27SEN1.SGM 27SEN1srob
inso
n on
DS
KH
WC
L6B
1PR
OD
with
NO
TIC
ES
59219 Federal Register / Vol. 75, No. 186 / Monday, September 27, 2010 / Notices
3 ‘‘ ‘Paperboard’ refers to Certain Coated Paper that is heavier, thicker and more rigid than coated paper
which otherwise meets the product description. In the context of Certain Coated Paper, paperboard typically is referred to as ‘cover,’ to distinguish it from ‘text.’ ’’
4 One of the key measurements of any grade of paper is brightness. Generally speaking, the brighter the paper the better the contrast between the paper and the ink. Brightness is measured using a GE Reflectance Scale, which measures the reflection of light off of a grade of paper. One is the lowest reflection, or what would be given to a totally black grade, and 100 is the brightest measured grade.
Verification As provided in section 782(i) of the
Tariff Act of 1930, as amended (‘‘Act’’), we verified the information submitted by APP-China for use in our final determination. See the Department’s verification reports on the record of this investigation in the Central Records Unit (‘‘CRU’’), Room 7046 of the main Department building, with respect to these entities. For all verified companies, we used standard verification procedures, including the examination of relevant accounting and production records, as well as original source documents provided by respondents.
Analysis of Comments Received All non-scope issues raised in the
case and rebuttal briefs by parties to this investigation are addressed in the ‘‘Investigation of Certain Coated Paper Suitable for High-Quality Print Graphics Using Sheet-Fed Presses from the People’s Republic of China: Issues and Decision Memorandum,’’ dated concurrently with this notice and hereby adopted in this notice (‘‘Issues and Decision Memorandum’’). A list of the issues which parties have raised and to which we have responded in the Issues and Decision Memorandum is attached to this notice as Appendix I. The Issues and Decision Memorandum is a public document on file in the CRU and is accessible on the Web at ia.ita.doc.gov/frn. The paper copy and electronic version of the memorandum are identical in content.
Changes Since the Preliminary Determination
• Sun Paper Companies did not submit a complete database of all reportable U.S. sales, refused to undergo verification, and withdrew from participating in the investigation. We have also found that Sun Paper Companies did not demonstrate that they are entitled to a separate rate, and are therefore part of the PRC entity. Thus, we have applied total adverse facts available (‘‘AFA’’) to the PRC entity, which includes Sun Paper Companies. See ‘‘Use of Facts Available’’ and ‘‘PRC-Wide Rate’’ sections below. See also Comment 6 of the Issues and Decision Memorandum.
• For APP-China, we made the following changes since the Preliminary Determination:
Æ We revised the targeted dumping analysis to include another customer alleged by Petitioners. See Comment 4 of the Issues and Decision Memorandum.
Æ The Department has revised APP- China’s margin calculation to
incorporate minor corrections submitted at verification, as well as other minor discrepancies noted in the verification report. See Comments 10 and 11 of the Issues and Decision Memorandum. See also the public version of the APP-China Verification report on file in the CRU.
Æ The Department is no longer deducting certain commissions from those sales classified as ‘‘Channel 1’’ sales, based on APP-China’s minor correction from verification. See Comment 12 of the Issues and Decision Memorandum.
Æ The Department has made corrections to the Preliminary Determination that we found to be ‘‘clerical’’ in nature in our Ministerial Error Memo. See Comment 13 of the Issues and Decision Memorandum.
Æ The Department has revised the calculation of foreign truck freight to include the weight of the packing. See Comment 15 of the Issues and Decision Memorandum.
Æ The Department has revised the calculation of domestic inland insurance and brokerage and handling to include the weight of the packing. See Final Analysis Memo.
Æ The Department has revised the surrogate value (‘‘SV’’) for tapioca starch (‘‘TSTARCH’’). For the final determination, the Department is valuing TSTARCH using the Indonesian HTS category 110814, labeled ‘‘Manioc (cassava) starch.’’ See Comment 22 of the Issues and Decision Memorandum.
Æ The Department is using HTS category 3906.90.90, labeled ‘‘other acrylic polymers in other forms,’’ to value the non-market economy (‘‘NME’’) portion of APP-China’s tackifier input. See Comment 25 of the Issues and Decision Memorandum.
Æ The Department has revised the SV for surface sizing starch (‘‘SSS’’). For the final determination, the Department is valuing SSS using the Indian HTS category 3505.10.00, labeled ‘‘dextrins and other modified starches (for example, pregelantinized or esterified starches).’’ See Comment 29 of the Issues and Decision Memorandum.
Æ We have revised the calculation of the wage rate. See Comment 30 of the Issues and Decision Memorandum.
Æ We have revised the brokerage and handling surrogate value. See Comment 31 of the Issues and Decision Memorandum.
Scope of Investigation
The merchandise covered by this investigation includes certain coated paper and paperboard 3 in sheets
suitable for high quality print graphics using sheet-fed presses; coated on one or both sides with kaolin (china or other clay), calcium carbonate, titanium dioxide, and/or other inorganic substances; with or without a binder; having a GE brightness level of 80 or higher;4 weighing not more than 340 grams per square meter; whether gloss grade, satin grade, matte grade, dull grade, or any other grade of finish; whether or not surface-colored, surface- decorated, printed (except as described below), embossed, or perforated; and irrespective of dimensions (‘‘Certain Coated Paper’’).
Certain Coated Paper includes (a) coated free sheet paper and paperboard that meets this scope definition; (b) coated groundwood paper and paperboard produced from bleached chemi-thermo-mechanical pulp (‘‘BCTMP’’) that meets this scope definition; and (c) any other coated paper and paperboard that meets this scope definition.
Certain Coated Paper is typically (but not exclusively) used for printing multi- colored graphics for catalogues, books, magazines, envelopes, labels and wraps, greeting cards, and other commercial printing applications requiring high quality print graphics.
Specifically excluded from the scope are imports of paper and paperboard printed with final content printed text or graphics.
As of 2009, imports of the subject merchandise are provided for under the following categories of the HTSUS: 4810.14.11, 4810.14.1900, 4810.14.2010, 4810.14.2090, 4810.14.5000, 4810.14.6000, 4810.14.70, 4810.19.1100, 4810.19.1900, 4810.19.2010, 4810.19.2090, 4810.22.1000, 4810.22.50, 4810.22.6000, 4810.22.70, 4810.29.1000, 4810.29.5000, 4810.29.6000, 4810.29.70, 4810.32, 4810.39 and 4810.92. While HTSUS subheadings are provided for convenience and customs purposes, the written description of the scope of the investigations is dispositive.
Surrogate Country In the Preliminary Determination, we
stated that we had selected India as the appropriate surrogate country to use in this investigation for the following
VerDate Mar<15>2010 17:01 Sep 24, 2010 Jkt 220001 PO 00000 Frm 00014 Fmt 4703 Sfmt 4703 E:\FR\FM\27SEN1.SGM 27SEN1srob
inso
n on
DS
KH
WC
L6B
1PR
OD
with
NO
TIC
ES

59220 Federal Register / Vol. 75, No. 186 / Monday, September 27, 2010 / Notices
5 See, e.g., Preliminary Determination of Sales at Less Than Fair Value and Partial Affirmative Determination of Critical Circumstances: Certain Polyester Staple Fiber from the People’s Republic of China, 71 FR 77373, 77377 (December 26, 2006), unchanged in Final Determination of Sales at Less Than Fair Value and Partial Affirmative Determination of Critical Circumstances: Certain Polyester Staple Fiber from the People’s Republic of China, 72 FR 19690 (April 19, 2007).
6 For the Preliminary Determination, the Department applied partial AFA to Sun Paper Companies for failing to report all reportable U.S. sales made during the POI. See Preliminary Determination, 75 FR at 24901–24902.
reasons: (1) It is a significant producer of comparable merchandise; (2) it is at a level of economic development comparable to that of the PRC, pursuant to section 773(c)(4) of the Act; and (3) we have reliable data from India that we can use to value the FOPs. See Preliminary Determination, 75 FR at 24898. For the final determination, we received no comments on surrogate country selection and made no changes to our findings with respect to the selection of a surrogate country.
Separate Rates In proceedings involving NME
countries, the Department begins with a rebuttable presumption that all companies within the country are subject to government control and, thus, should be assigned a single antidumping duty deposit rate. It is the Department’s policy to assign all exporters of merchandise subject to an investigation in an NME country this single rate unless an exporter can demonstrate that it is sufficiently independent so as to be entitled to a separate rate. See Final Determination of Sales at Less Than Fair Value: Sparklers from the People’s Republic of China, 56 FR 20588 (May 6, 1991) (‘‘Sparklers’’), as amplified by Notice of Final Determination of Sales at Less Than Fair Value: Silicon Carbide from the People’s Republic of China, 59 FR 22585 (May 2, 1994) (‘‘Silicon Carbide’’), and 19 CFR 351.107(d).
In the Preliminary Determination, we found that the four mandatory respondents (i.e., GE, GHS (and their affiliates, NAPP and NBZH), Tianzhang, and IP Paperboard/IP Cartonboard), and the separate-rate respondent Chenming, demonstrated their eligibility for separate-rate status. For the final determination, we continue to find that the evidence placed on the record of this investigation by GE, GHS (their affiliates, NAPP and NBZH), and Chenming demonstrates both a de jure and de facto absence of government control, with respect to their respective exports of the merchandise under investigation, and, thus are eligible for separate-rate status. See Preliminary Determination, 75 FR at 24899–24900. However, we are no longer finding that Tianzhang, and IP Paperboard/IP Cartonboard are eligible for separate rate status, as they withdrew from participating in the investigation.
Margin for the Separate Rate Company As discussed above, the Department
continues to find that Chenming has demonstrated its eligibility for a separate rate. Consistent with the Department’s practice, as the separate
rate, we have established a margin for Chenming based on the rate we calculated for the cooperating mandatory respondent, APP-China.5
Use of Facts Available (‘‘FA’’) Sections 776(a)(1) and (2) of the Act
provide that the Department shall apply ‘‘facts otherwise available’’ if, inter alia, necessary information is not on the record, or an interested party: (A) Withholds information requested by the Department, (B) fails to provide such information by the deadline, or in the form or manner requested, (C) significantly impedes a proceeding, or (D) provides information that cannot be verified, as provided by section 782(i) of the Act.
Where the Department determines that a response to a request for information does not comply with the request, section 782(d) of the Act provides that the Department will inform the party submitting the response and will, to the extent practicable, provide that party the opportunity to remedy or explain its deficiency. If the party fails to remedy the deficiency within the applicable time limits, subject to section 782(e) of the Act, the Department may disregard all or part of the original and subsequent responses, as appropriate. Pursuant to section 782(e) of the Act, the Department shall not decline to consider submitted information if all of the following requirements are met: (1) The information is submitted by the established deadline; (2) the information can be verified; (3) the information is not so incomplete that it cannot serve as a reliable basis for reaching the applicable determination; (4) the interested party has demonstrated that it acted to the best of its ability; and (5) the information can be used without undue difficulties.
Section 782(e) of the Act states that the Department shall not decline to consider information deemed ‘‘deficient’’ under section 782(d) if: (1) The information is submitted by the established deadline; (2) the information can be verified; (3) the information is not so incomplete that it cannot serve as a reliable basis for reaching the applicable determination; (4) the interested party has demonstrated that it acted to the best of its ability; and (5)
the information can be used without undue difficulties.
Furthermore, section 776(b) of the Act states that if the administering authority finds that an interested party has not acted to the best of its ability to comply with a request for information, the administering authority may, in reaching its determination, use an inference that is adverse to that party. The adverse inference may be based upon: (1) The petition, (2) a final determination in the investigation under this title, (3) any previous review under section 751 of the Act or determination under section 753 of the Act, or (4) any other information placed on the record.
Because Sun Paper Companies ceased participating in the instant investigation, the Department was not able to conduct verification of Sun Paper Companies’ responses. Verification is integral to the Department’s analysis because it allows the Department to satisfy itself that it is relying upon accurate information and calculating dumping margins as accurately as possible. By failing to participate in verification, Sun Paper Companies prevented the Department from verifying its reported information, including separate rates information, and significantly impeded the proceeding. In addition, by not permitting verification, Sun Paper Companies failed to demonstrate that they operate free of government control and are entitled to a separate rate. Accordingly, Sun Paper Companies is considered part of the PRC-wide entity for purposes of this final determination. Thus, we find that, in accordance with sections 776(a)(2)(A), (C) and (D) of the Act, the use of FA for the PRC-wide entity (which includes Sun Paper Companies) is appropriate for this final determination.
First, the PRC-wide entity, which includes Sun Paper Companies, failed to submit a full and proper database of all sales to unaffiliated U.S. customers during the POI. Accordingly, we find that the PRC wide entity withheld information requested by the Department pursuant to section 776(a)(2)(A) of the Act.6 Second, we find that the PRC-wide entity, which includes the Sun Paper Companies, significantly impeded the Department’s proceeding pursuant to sections 776(a)(2)(C) of the Act, by failing to provide the requested information and by refusing to allow verification of their data. Based on the above, we have
VerDate Mar<15>2010 17:01 Sep 24, 2010 Jkt 220001 PO 00000 Frm 00015 Fmt 4703 Sfmt 4703 E:\FR\FM\27SEN1.SGM 27SEN1srob
inso
n on
DS
KH
WC
L6B
1PR
OD
with
NO
TIC
ES

59221 Federal Register / Vol. 75, No. 186 / Monday, September 27, 2010 / Notices
7 See Notice of Final Determination of Sales at Less than Fair Value: Static Random Access Memory Semiconductors From Taiwan, 63 FR 8909, 8932 (February 23, 1998).
8 See Brake Rotors From the People’s Republic of China: Final Results and Partial Rescission of the Seventh Administrative Review; Final Results of the Eleventh New Shipper Review, 70 FR 69937, 69939 (November 18, 2005); See also, SAA at 870.
9 See, e.g., Certain Cased Pencils from the People’s Republic of China; Preliminary Results of Antidumping Duty Administrative Review and Intent to Rescind in Part, 70 FR 76755, 76761 (December 28, 2005) unchanged in final, Certain Cased Pencils from the People’s Republic of China; Final Results and Partial Rescission of Antidumping Duty Administrative Review, 71 FR 38366 (July 6, 2006), and accompanying Issues and Decision Memorandum at Comment 10.
10 See Final Determination of Sales at Less Than Fair Value: Certain Cold-Rolled Carbon Quality
Steel Products from the People’s Republic of China, 65 FR 34660 (May 21, 2000), and accompanying Issues and Decision Memorandum at ‘‘Facts Available.’’
11 See Final Determination of Sales at Less Than Fair Value: Sodium Hexametaphosphate From the People’s Republic of China, 73 FR 6479, 6481 (February 4, 2008), quoting SAA at 870.
12 See Tapered Roller Bearings and Parts Thereof, Finished and Unfinished, From Japan, and Tapered Roller Bearings, Four Inches or Less in Outside Diameter, and Components Thereof, From Japan; Preliminary Results of Antidumping Duty Administrative Reviews and Partial Termination of Administrative Reviews, 61 FR 57391, 57392 (November 6, 1996), unchanged in Tapered Roller Bearings and Parts Thereof, Finished and Unfinished, From Japan, and Tapered Roller Bearings, Four Inches or Less in Outside Diameter, and Components Thereof, From Japan; Final Results of Antidumping Duty Administrative
Continued
determined that the PRC-wide entity, which includes the Sun Paper Companies, failed to act to the best of its ability by not providing the requested information and by ceasing their participation in the proceeding. Therefore, we have determined that when selecting from among FA, an adverse inference is warranted for the PRC-wide entity, including the Sun Paper Companies, pursuant to section 776(b) of the Act.
The PRC-Wide Rate Because we begin with the
presumption that all companies within a NME country are subject to government control, and because only the companies listed under the ‘‘Final Determination Margins’’ section, below, have overcome that presumption, we are applying a single antidumping rate (i.e., the PRC-wide rate) to all other exporters of subject merchandise from the PRC. These other companies did not demonstrate entitlement to a separate rate. See, e.g., Synthetic Indigo From the People’s Republic of China; Notice of Final Determination of Sales at Less Than Fair Value, 65 FR 25706, 25707 (May 3, 2000). The PRC-wide rate applies to all entries of subject merchandise except for entries from the companies eligible for separate rate status.
In the Preliminary Determination, the Department preliminarily determined that there were exporters/producers of the subject merchandise during the POI from the PRC that did not respond to the Department’s request for information. Further, we treated these PRC producers/exporters as part of the PRC- wide entity because they did not apply for a separate rate. As a result, we found that the use of FA was appropriate to determine the PRC-wide rate pursuant to section 776(a)(2)(A) of the Act. See Preliminary Determination, 75 FR at 24900–02.
Thus, in the Preliminary Determination, the Department determined that, in selecting from among the FA, an adverse inference is appropriate because the PRC-wide entity failed to cooperate by not acting to the best of its ability to comply with requests for information. See Id. As AFA, we preliminarily assigned to the PRC-wide entity a rate of 135.8 percent, the highest calculated rate from the petition. See id; see also Statement of Administrative Action accompanying the URAA, H.R. Rep. No. 103–316, vol. 1, at 870 (1994) (‘‘SAA’’).
Section 776(a)(2) of the Act provides that, if an interested party (A) withholds information requested by the Department, (B) fails to provide such
information by the deadline, or in the form or manner requested, (C) significantly impedes a proceeding, or (D) provides information that cannot be verified, the Department shall use, subject to sections 782(d) and (e) of the Act, facts otherwise available in reaching the applicable determination. Because the PRC-wide entity (including Sun Paper Companies) did not respond to our requests for information, withheld information requested by the Department, and did not allow their information to be verified, pursuant to sections 776(a)(2)(A), (C), and (D) of the Act, we determine, as in the Preliminary Determination, that the use of facts otherwise available is appropriate to determine the PRC-wide rate.
Selection of the Adverse Facts Available Rate
In deciding which facts to use as AFA, section 776(b) of the Act and 19 CFR 351.308(c)(1) provide that the Department may rely on information derived from (1) The petition, (2) a final determination in the investigation, (3) any previous review or determination, or (4) any information placed on the record. In selecting a rate for AFA, the Department selects a rate that is sufficiently adverse ‘‘as to effectuate the purpose of the facts available rule to induce respondents to provide the Department with complete and accurate information in a timely manner.’’ 7 It is also the Department’s practice to select a rate that ensures ‘‘that the party does not obtain a more favorable result by failing to cooperate than if it had cooperated fully.’’ 8
Generally, the Department finds selecting the highest rate in any segment of the proceeding as AFA to be appropriate.9 It is the Department’s practice to select, as AFA, the higher of the (a) highest margin alleged in the petition, or (b) the highest calculated rate of any respondent in the investigation.10 In the instant
investigation, as AFA, we have assigned to the PRC-wide entity the highest petition rate, recalculated using the revised wage rate, on the record of this proceeding that can be corroborated. See Certain Coated Paper Suitable for High- Quality Print Graphics Using Sheet-Fed Presses From Indonesia and the People’s Republic of China: Initiation of Antidumping Duty Investigations, 74 FR 53710 (October 20, 2009) (‘‘Initiation Notice’’), and Memorandum to the File, regarding ‘‘Recalculation of Petition Margins,’’ dated concurrently with this notice. The Department determines that this information is the most appropriate from the available sources to effectuate the purposes of AFA.
Corroboration
Section 776(c) of the Act provides that, when the Department relies on secondary information rather than on information obtained in the course of an investigation as FA, it must, to the extent practicable, corroborate that information from independent sources reasonably at its disposal. Secondary information is described as ‘‘information derived from the petition that gave rise to the investigation or review, the final determination concerning merchandise subject to this investigation, or any previous review under section 751 concerning the merchandise subject to this investigation.’’ 11 To ‘‘corroborate’’ means that the Department will satisfy itself that the secondary information to be used has probative value. Independent sources used to corroborate may include, for example, published price lists, official import statistics and customs data, and information obtained from interested parties during the particular investigation. To corroborate secondary information, the Department will, to the extent practicable, examine the reliability and relevance of the information used.12
VerDate Mar<15>2010 17:01 Sep 24, 2010 Jkt 220001 PO 00000 Frm 00016 Fmt 4703 Sfmt 4703 E:\FR\FM\27SEN1.SGM 27SEN1srob
inso
n on
DS
KH
WC
L6B
1PR
OD
with
NO
TIC
ES

59222 Federal Register / Vol. 75, No. 186 / Monday, September 27, 2010 / Notices
Reviews and Termination in Part, 62 FR 11825 (March 13, 1997).
13 See Comment 30 of Issues and Decision Memorandum.
14 See Id. See also Memorandum to the File, regarding ‘‘Recalculation of Petition Margins,’’ dated concurrently with this notice.
15 See Preliminary Determination, 75 FR at 24905.
16 See Memorandum entitled ‘‘Separate-Rates Practice and Application of Combination Rates in Antidumping Investigations involving Non-Market Economy Countries’’ dated April 5, 2005, available at http://ia.ita.doc.gov/policy/index.html.
The AFA rate that the Department used is from the Petition; however, we have updated the labor wage rate used to calculate the Petition rates. The Department’s practice is not to recalculate dumping margins provided in petitions, but rather to corroborate the applicable petition rate when applying that rate as AFA. In the instant case, however, the surrogate wage rate used in the Petition was based upon the Department’s methodology that the Federal Circuit invalidated in Dorbest II.13 In light of the Federal Circuit decision to invalidate the wage rate methodology, the Department has adjusted the petition rate using the surrogate value for labor used in this final determination.14
The AFA rate that the Department used is from the Petition. To corroborate the AFA margin that we have selected, we compared this margin to the transaction-specific margins we found for the cooperating mandatory respondents. We found that the margin of 135.83 percent has probative value because it is in the range of the
transaction-specific margins that we found for APP-China during the period of investigation. See APP-China’s Final Analysis Memo. Accordingly, we find this rate is reliable and relevant, considering the record information, and thus, has probative value. See Memorandum to the File, regarding ‘‘Corroboration of the PRC-Wide Entity Rate and for the Final Determination in the Antidumping Duty Investigation of Certain Coated Paper Suitable for High- Quality Print Graphics Using Sheet-Fed Presses from the People’s Republic of China,’’ dated concurrently with this notice. Given that numerous PRC-wide entities did not respond to the Department’s requests for information and that Sun Paper Companies, which is part of the PRC-wide entity, ceased participating in the investigation, the Department concludes that the updated petition rate of 135.83 percent, as total AFA for the PRC-wide entity, is sufficiently adverse to prevent these respondents from benefitting from their lack of cooperation. See SAA at 870.
Accordingly, we found that the rate of 135.83 percent is corroborated to the extent practicable within the meaning of section 776(c) of the Act.
The PRC-wide rate applies to all entries of the merchandise under investigation except for entries from APP-China and Chenming, as they have demonstrated eligibility for a separate rate. These companies and their corresponding antidumping duty cash deposit rates are listed below in the ‘‘Final Determination’’ section of this notice.
Combination Rates
In the Preliminary Determination, the Department stated that it would calculate combination rates for respondents that are eligible for a separate rate in this investigation.15 This practice is described in the Separate Rate Policy Bulletin.16
Final Determination
The weighted-average dumping margin percentages are as follows:
Exporter Producer Percent margin
Gold East Paper (Jiangsu) Co., Ltd.; .............................................Gold Huasheng Paper Co., Ltd.; ....................................................Ningbo Zhonghua Paper Co., Ltd.; ................................................Ningbo Asia Pulp and Paper Co., Ltd.; ..........................................Gold East (Hong Kong) Trading Co., Ltd ......................................
Gold East Paper (Jiangsu) Co., Ltd.; ...........................................Gold Huasheng Paper Co., Ltd.; ..................................................Ningbo Zhonghua Paper Co., Ltd.; ..............................................Ningbo Asia Pulp and Paper Co., Ltd ..........................................
7.60
Shandong Chenming Paper Holdings Ltd Shandong Chenming Paper Holdings Ltd .................................... 7.60 PRC-Wide Entity* ........................................................................... ....................................................................................................... 135.83
* The PRC-Wide Entity includes the Sun Paper Companies.
Disclosure
We will disclose the calculations performed within five days of the date of publication of this notice to parties in this proceeding in accordance with 19 CFR 351.224(b).
Continuation of Suspension of Liquidation
In accordance with section 735(c)(1)(B) of the Act, we are directing U.S. Customs and Border Protection (‘‘CBP’’) to continue to suspend liquidation of all imports of subject merchandise entered or withdrawn from warehouse, for consumption on or after the date of publication of the Preliminary Determination in the Federal Register. We will instruct CBP to require a cash deposit or the posting of a bond equal to the weighted-average amount by which the normal value
exceeds U.S. price, as follows: (1) The rate for the exporter/producer combinations listed in the chart above will be the rate we have determined in this final determination; (2) for all PRC exporters of subject merchandise which have not received their own rate, the cash-deposit rate will be the PRC-wide rate; and (3) for all non-PRC exporters of subject merchandise which have not received their own rate, the cash-deposit rate will be the rate applicable to the PRC exporter/producer combination that supplied that non-PRC exporter. These suspension-of-liquidation instructions will remain in effect until further notice.
ITC Notification
In accordance with section 735(d) of the Act, we have notified the International Trade Commission (‘‘ITC’’)
of our final determination of sales at LTFV. As our final determination is affirmative, in accordance with section 735(b)(2) of the Act, the ITC will, within 45 days, determine whether the domestic industry in the United States is materially injured or threatened with material injury, by reason of imports or sales (or the likelihood of sales) for importation of the subject merchandise. If the ITC determines that material injury or threat of material injury does not exist, the proceeding will be terminated and all securities posted will be refunded or canceled. If the ITC determines that such injury does exist, the Department will issue an antidumping duty order directing CBP to assess antidumping duties on all imports of the subject merchandise entered or withdrawn from warehouse
VerDate Mar<15>2010 17:01 Sep 24, 2010 Jkt 220001 PO 00000 Frm 00017 Fmt 4703 Sfmt 4703 E:\FR\FM\27SEN1.SGM 27SEN1srob
inso
n on
DS
KH
WC
L6B
1PR
OD
with
NO
TIC
ES
59223 Federal Register / Vol. 75, No. 186 / Monday, September 27, 2010 / Notices
1 The respondents are: PT. Pindo Deli Pulp & Paper Mills (PD), PT. Pabrik Kertas Tjiwi Kimia, Tbk (TK), PT Indah Kiat Pulp & Paper Tbk (IK) (collectively PD/TK/IK). In the preliminary determination, we determined it appropriate to treat PD, TK, and IK as one entity for margin calculation purposes because they met the regulatory criteria for collapsing. See Memorandum to John M. Andersen, Acting Deputy Assistant Secretary for Import Administration, from the Team entitled, ‘‘Whether To Treat Respondents as a Single Entity for Margin Calculation Purposes in the Antidumping Duty Investigation of Certain Coated Paper Suitable for High-Quality Print Graphics Using Sheet-Fed Presses From Indonesia,’’ dated April 21, 2010. No party commented on this preliminary determination and we found nothing at verification that would otherwise compel us to reverse this determination. Therefore, we have continued to treat these affiliated companies as one entity in the final determination.
for consumption on or after the effective date of the suspension of liquidation.
Notification Regarding APO This notice also serves as a reminder
to the parties subject to administrative protective order (‘‘APO’’) of their responsibility concerning the disposition of proprietary information disclosed under APO in accordance with 19 CFR 351.305. Timely notification of return or destruction of APO materials or conversion to judicial protective order is hereby requested. Failure to comply with the regulations and the terms of an APO is a sanctionable violation.
This determination and notice are issued and published in accordance with sections 735(d) and 777(i)(1) of the Act.
Dated: September 20, 2010. Ronald K. Lorentzen, Deputy Assistant Secretary for Import Administration.
Appendix I—List of Issues
Case Issues: Comment 1: Whether to Grant Market-
Oriented Industry (‘‘MOI’’) Status to the Coated Paper Industry
Comment 2A: Whether Simultaneous Application of Countervailing Duties (‘‘CVDs’’) and Antidumping Duties Calculated Using the NME Methodology is Contrary to Law
Comment 2B: Whether Simultaneous Application of Countervailing Duties and Antidumping Duties Calculated Using the NME Methodology to Imports of the Same Products Results in the Imposition of Double Remedies
Comment 3: Whether Targeted Dumping Test Violates the Administrative Procedures Act (‘‘APA’’) and is Flawed
Comment 4: Whether to Revise the Targeted Dumping Analysis in Light of APP-China’s Minor Corrections Filed at Verification
Comment 5: Whether the Department Should Apply Zeroing
Comment 6: Application of Adverse Facts Available (‘‘AFA’’) to Sun Paper Companies
Comment 7: Whether to Apply Market- Oriented Economy (‘‘MOE’’) Treatment to APP-China
Comment 8: Whether to Apply AFA to All Sales and Expense Information of GPS
Comment 9: Whether to Reclassify Certain APP-China Sales from Export Price (‘‘EP’’)- to ‘‘Constructed Export Price (‘‘CEP’’)
Comment 10: Whether the Department Should Reject APP-China’s Minor Correction
Comment 11: Whether the Department Should Deduct Certain Rebates for APP- China
Comment 12: Whether the Department Should Deduct Certain Commission Expenses
Comment 13: Whether the Department Should Correct Certain Ministerial Errors
Comment 14: Whether to Deduct Domestic Inland Insurance from U.S. Price
Comment 15: Application of Foreign Truck Freight
Comment 16: Whether to Treat All of APP- China’s Market Economy (‘‘ME’’) Pulp Purchases as Market Economy Purchases (‘‘MEPs’’)
Comment 17: Whether to Accept APP- China’s ME Purchases from Thailand and Korea
Comment 18: Whether to Employ the 33 Percent Threshold for GE Group’s ME Purchases
Comment 19: Valuation of Calcium Carbonate Ore (‘‘CCORE’’)
Comment 20: Valuation of Optical Brightener (‘‘OBA/OBAS/OBAL’’)
Comment 21: Valuation of Masculine Starch Transforming Agent (‘‘MSTA’’)
Comment 22: Valuation of Tapioca Starch (‘‘TSTARCH’’)
Comment 23: Valuation of Wet End Starch (‘‘WESTARCH’’)
Comment 24: Valuation of Dispersing Agent A (‘‘DISPERSANTA’’)
Comment 25: Valuation of Tackifier Comment 26: Valuation of Hypochlorous
Natrium/Sodium Hypochlorite (‘‘BACLO/ NACLO’’)
Comment 27: Valuation of Coating Binding Agent (‘‘CBA’’)
Comment 28: Valuation of Coating Starch (‘‘CSTARCH’’)
Comment 29: Valuation of Surface Sizing Starch (‘‘SSS’’)
Comment 30: Selection of Labor Rate Comment 31: Valuation of Brokerage &
Handling Comment 32: Whether the Department
Should Include Certain Direct Selling Expenses in the Calculation of SG&A
[FR Doc. 2010–24159 Filed 9–24–10; 8:45 am]
BILLING CODE 3510–DS–P
DEPARTMENT OF COMMERCE
International Trade Administration
[A–560–823]
Certain Coated Paper Suitable for High-Quality Print Graphics Using Sheet-Fed Presses From Indonesia: Final Determination of Sales at Less Than Fair Value
AGENCY: Import Administration, International Trade Administration, Department of Commerce. SUMMARY: The Department of Commerce determines that certain coated paper suitable for high-quality print graphics using sheet-fed presses (certain coated paper) from Indonesia is being, or is likely to be, sold in the United States at less-than-fair-value (LTFV), as provided in section 735 of the Tariff Act of 1930, as amended (the Act). The estimated margins of sales at LTFV are shown in the ‘‘Final Determination Margins’’ section of this notice. DATES: Effective Date: September 27, 2010.
FOR FURTHER INFORMATION CONTACT: Gemal Brangman or Brian Smith, AD/ CVD Operations, Office 2, Import Administration, International Trade Administration, U.S. Department of Commerce, 14th Street and Constitution Avenue, NW., Washington, DC 20230; telephone (202) 482–3773 and (202) 482–1766, respectively. SUPPLEMENTARY INFORMATION:
Background On May 6, 2010, the Department of
Commerce (Department) published in the Federal Register the preliminary determination of sales at LTFV in the antidumping duty investigation of certain coated paper from Indonesia. See Certain Coated Paper Suitable for High-Quality Print Graphics Using Sheet-Fed Presses From Indonesia: Notice of Preliminary Determination of Sales at Less Than Fair Value and Postponement of Final Determination, 75 FR 24885 (May 6, 2010) (Preliminary Determination).
On May 10, 2010, the respondents1 in this investigation alleged a ministerial error in the Department’s preliminary margin calculation.
On May 14, 2010, the Department issued a post-preliminary analysis for PD/TK/IK evaluating whether the use of quarterly cost averaging periods was warranted in this investigation. See Memorandum to Neal Halper, Director, Office of Accounting, entitled ‘‘Alternative Cost Averaging Period Analysis Memorandum—PT Pabrik Kertas Tjiwi Kimia Tbk., PT Pindo Deli Pulp and Paper Mills, and PT Indah Kiat Pulp Tbk,’’ dated May 14, 2010. Based on the data and methodology described in this memorandum, we found that the change in the total cost of manufacturing recognized by PD/TK/IK during the period of investigation (POI) for its highest-volume products sold in the U.S. and home markets did not meet the Department’s standard for significance (i.e., greater than 25 percent
VerDate Mar<15>2010 17:01 Sep 24, 2010 Jkt 220001 PO 00000 Frm 00018 Fmt 4703 Sfmt 4703 E:\FR\FM\27SEN1.SGM 27SEN1srob
inso
n on
DS
KH
WC
L6B
1PR
OD
with
NO
TIC
ES

59224 Federal Register / Vol. 75, No. 186 / Monday, September 27, 2010 / Notices
2 No party commented on the Department’s post- preliminary quarterly cost analysis and we found nothing at verification that warrants the reversal of this determination. Therefore, we have continued to apply our normal POI-average cost methodology in the final determination.
3 The petitioners include the following companies: Appleton Coated LLC, NewPage Corporation, S.D. Warren Company d/b/a/Sappi Fine Paper North America, and the United Steel, Paper and Forestry, Rubber, Manufacturing, Energy, Allied Industrial and Service Workers International Union.
4 ‘‘ ‘Paperboard’ refers to Certain Coated Paper that is heavier, thicker and more rigid than coated paper which otherwise meets the product description. In the context of Certain Coated Paper, paperboard typically is referred to as ‘cover,’ to distinguish it from ‘text.’ ’’
5 One of the key measurements of any grade of paper is brightness. Generally speaking, the brighter the paper the better the contrast between the paper and the ink. Brightness is measured using a GE Reflectance Scale, which measures the reflection of light off of a grade of paper. One is the lowest reflection, or what would be given to a totally black grade, and 100 is the brightest measured grade.
change from the high to the low quarter). See Certain Welded Stainless Steel Pipes From the Republic of Korea: Final Results of Antidumping Duty Administrative Review, 74 FR 31242 (June 30, 2009) and accompanying Issues and Decision Memorandum at Comment 1. Therefore, we determined that no change to our normal POI- average cost methodology was warranted in this case.2
On May 11, 2010, we issued the cost verification agenda to PD/TK/IK.
On May 19, 2010, we determined that the error alleged by PD/TK/IK in its May 10, 2010, submission was a ministerial error, but not a significant ministerial error as defined by 19 CFR 351.224(g), and stated that we would correct this error for purposes of the final determination. See Memorandum from The Team to James Maeder, Director, AD/CVD Operations Office 2, entitled ‘‘Respondent’s Allegation of Ministerial Error in the Preliminary Determination,’’ dated May 19, 2010.
On June 1, 2010, we issued a sales supplemental questionnaire to PD/TK/ IK and received PD/TK/IK’s response to this questionnaire on June 16, 2010.
On June 4, 2010, we issued the sales verification agenda to PD/TK/IK.
During May and June 2010, we verified the sales and cost of production (COP) questionnaire responses of PD/ TK/IK. During June and July 2010, we issued the COP and sales verification reports. See Memorandum to The File entitled ‘‘Verification of the Cost Response of PT Pabrik Kertas Tjiwi Kimia Tbk., PT Pindo Deli Pulp and Paper Mills, and PT Indah Kiat Pulp and Paper Tbk. in the Antidumping Investigation of Certain Coated Paper Suitable for High-Quality Print Graphics Using Sheet-Fed Presses From Indonesia,’’ dated June 29, 2010; Memorandum to The File entitled ‘‘Verification of the Sales Response of (Affiliated Company) in the Antidumping Duty Investigation of Certain Coated Paper Suitable for High- Quality Print Graphics Using Sheet-Fed Presses (Coated Paper) From Indonesia,’’ dated July 26, 2010; Memorandum to The File entitled ‘‘Verification of the Sales Response of PT Pindo Deli Pulp & Paper Mills and PT Pabrik Kertas Tjiwi Kimia, Tbk in the Antidumping Duty Investigation of Certain Coated Paper Suitable for High-Quality Print Graphics Using Sheet-Fed Presses (Coated Paper) From Indonesia,’’ dated July 26, 2010;
Memorandum to The File entitled ‘‘Verification of the Sales Response of PT Indah Kiat Pulp & Paper Tbk. and (Affiliated Company) in the Antidumping Duty Investigation of Certain Coated Paper Suitable for High- Quality Print Graphics Using Sheet-Fed Presses (Coated Paper) From Indonesia,’’ dated July 30, 2010; and Memorandum to The File entitled ‘‘Verification of the Sales Response of (Affiliated Company) in the Antidumping Duty Investigation of Certain Coated Paper Suitable for High-Quality Print Graphics Using Sheet-Fed Presses (Coated Paper) From Indonesia,’’ dated July 30, 2010.
On August 3, 2010, we issued a memorandum addressing certain scope issues in this investigation. See Memorandum to Ronald K. Lorentzen, Deputy Assistant Secretary for Import Administration, from Susan Kuhbach, Director, Office 1, entitled ‘‘Scope’’ (August 3, 2010 Scope Memorandum).
On August 10 and 16, 2010, respectively, the petitioners3 in this investigation and PD/TK/IK each submitted case and rebuttal briefs on all issues excluding scope. On August 18 and 25, 2010, the Department met with the petitioners’ and PD/TK/IK’s counsels, respectively, to discuss the issues raised in these case and rebuttal briefs. See the Department’s memoranda to the file entitled, ‘‘Meeting With Petitioner’s Counsel,’’ dated August 18, 2010, and ‘‘Meeting With the Respondent Counsel,’’ dated August 25, 2010.
On August 20, 2010, PD/TK/TK filed its case brief on scope issues, and on August 24, 2010, the petitioners filed their rebuttal brief on scope issues.
Period of Investigation
The POI is July 1, 2008, to June 30, 2009. This period corresponds to the four most recent fiscal quarters prior to the month of the filing of the petition. See 19 CFR 351.204(b)(1).
Scope of Investigation
The merchandise under investigation includes certain coated paper and paperboard4 in sheets suitable for high quality print graphics using sheet-fed presses; coated on one or both sides
with kaolin (China or other clay), calcium carbonate, titanium dioxide, and/or other inorganic substances; with or without a binder; having a GE brightness level of 80 or higher; 5 weighing not more than 340 grams per square meter; whether gloss grade, satin grade, matte grade, dull grade, or any other grade of finish; whether or not surface-colored, surface-decorated, printed (except as described below), embossed, or perforated; and irrespective of dimensions (‘‘Certain Coated Paper’’).
Certain Coated Paper includes (a) Coated free sheet paper and paperboard that meets this scope definition; (b) coated groundwood paper and paperboard produced from bleached chemi-thermo-mechanical pulp (‘‘BCTMP’’) that meets this scope definition; and (c) any other coated paper and paperboard that meets this scope definition.
Certain Coated Paper is typically (but not exclusively) used for printing multi- colored graphics for catalogues, books, magazines, envelopes, labels and wraps, greeting cards, and other commercial printing applications requiring high quality print graphics.
Specifically excluded from the scope are imports of paper and paperboard printed with final content printed text or graphics.
As of 2009, imports of the subject merchandise are provided for under the following categories of the Harmonized Tariff Schedule of the United States (‘‘HTSUS’’): 4810.14.11, 4810.14.1900, 4810.14.2010, 4810.14.2090, 4810.14.5000, 4810.14.6000, 4810.14.70, 4810.19.1100, 4810.19.1900, 4810.19.2010, 4810.19.2090, 4810.22.1000, 4810.22.50, 4810.22.6000, 4810.22.70, 4810.29.1000, 4810.29.5000, 4810.29.6000, 4810.29.70, 4810.32, 4810.39 and 4810.92. While HTSUS subheadings are provided for convenience and customs purposes, the written description of the scope of the investigation is dispositive.
Scope Comments
Following the Preliminary Determination, on August 3, 2010, the Department issued a decision memorandum addressing three scope issues in this and the concurrent antidumping and countervailing duty investigations on certain coated paper
VerDate Mar<15>2010 17:01 Sep 24, 2010 Jkt 220001 PO 00000 Frm 00019 Fmt 4703 Sfmt 4703 E:\FR\FM\27SEN1.SGM 27SEN1srob
inso
n on
DS
KH
WC
L6B
1PR
OD
with
NO
TIC
ES
59225 Federal Register / Vol. 75, No. 186 / Monday, September 27, 2010 / Notices
6 These investigations include Notice of Final Determination of Sales at Less Than Fair Value: Polyethylene Retail Carrier Bags from Taiwan, 75 FR 14569 (March 26, 2010), Polyethylene Retail Carrier Bags from Indonesia: Final Determination of Sales at Less Than Fair Value, 75 FR 16431 (April 1, 2010), and accompanying Issues and Decision Memorandum at Comment 1; and Certain Oil Country Tubular Goods from the People’s Republic of China: Final Determination of Sales at Less Than Fair Value, Affirmative Final Determination of Critical Circumstances and Final Determination of Targeted Dumping, 75 FR 20335 (April 19, 2010) and accompanying Issues and Decision Memorandum at Comment 2.
from Indonesia and the People’s Republic of China: (1) Whether to clarify the scope of these investigations to exclude multi-ply coated paper and paperboard; (2) whether to modify the scope language by striking the phrase ‘‘suitable for high-quality print graphics;’’ and (3) whether to add three HTSUS numbers which may include in- scope merchandise (i.e., HTSUS 4810.32, 4810.39 and 4810.92). See August 3, 2010 Scope Memorandum. For the reasons explained in the August 3, 2010, Scope Memorandum, the Department determined that: (1) Multi- ply products that otherwise meet the description of the scope of the investigations are not excluded from the scope; (2) the ‘‘suitable for high-quality print graphics’’ language should not be deleted from the scope; and (3) the three HTSUS numbers at issue should be added to the scope.
The Department subsequently provided the interested parties an opportunity to comment on its post- preliminary scope determination. In response, the respondents in these investigations filed a case brief on August 20, 2010, and the petitioners filed a rebuttal brief on August 24, 2010. Based on the Department’s analysis of these comments and the factual records of these investigations, the Department continues to find that multi-ply coated paper and paperboard are not excluded from the scope of the investigations, that the ‘‘suitable for high-quality print graphics’’ language should be maintained, and that the three HTSUS numbers listed above should be added to the scope. For a complete discussion of the parties’ comments and the Department’s position, see ‘‘Issues and Decision Memorandum for the Final Determination in the Countervailing Duty Investigation of Certain Coated Paper Suitable for High-Quality Print Graphics Using Sheet-Fed Presses from the People’s Republic of China,’’ dated concurrently with this notice and incorporated herein by reference.
Analysis of Comments Received All issues (except scope issues) raised
in the case and rebuttal briefs submitted by the parties to this investigation are addressed in the ‘‘Issues and Decision Memorandum for the Final Determination in the Less-Than-Fair- Value Investigation of Certain Coated Paper Suitable for High-Quality Print Graphics Using Sheet-Fed Presses from Indonesia’’ from Susan H. Kuhbach, Acting Deputy Assistant Secretary for Antidumping and Countervailing Duty Operations, to Ronald K. Lorentzen, Deputy Assistant Secretary for Import Administration (Decision Memo), dated
concurrently with this notice, which is hereby adopted by this notice. A list of the issues that parties have raised and to which we have responded, all of which are in the Decision Memo, is attached to this notice as an appendix. Parties can find a complete discussion of all issues raised in this investigation and the corresponding recommendations in the Decision Memo, which is on file in the Central Records Unit, Room 1117 of the Commerce Department. In addition, a complete version of the Decision Memo can be accessed directly on the Web at http://ia.ita.doc.gov/frn. The paper copy and electronic version of the Decision Memo are identical in content.
Verification As provided in section 782(i) of the
Act, we verified the sales and COP information submitted by PD/TK/IK for use in our final determination. We used standard verification procedures including an examination of relevant accounting and production records, and original source documents provided by the respondent. Our sales and cost verification results are outlined in separate verification reports. See ‘‘Background’’ section above for a list of verification reports the Department has issued in this investigation. The verification reports are on file and available in the Central Records Unit, Room 1117 of the Commerce Department.
Changes Since the Preliminary Determination
Based on our analysis of the comments received and our findings at verification, we have made certain changes to the margin calculations for PD/TK/IK. For a discussion of these changes, see the ‘‘Margin Calculations’’ section of the Decision Memo.
Targeted Dumping The statute allows the Department to
employ the average-to-transaction margin calculation methodology under the following circumstances: (1) There is a pattern of export prices that differ significantly among purchasers, regions or periods of time; and (2) the Department explains why such differences cannot be taken into account using the average-to-average or transaction-to-transaction methodology. See section 777A(d)(1)(B) of the Act.
In the Preliminary Determination, we conducted customer, regional, and time- period targeted dumping analyses based on timely allegations of targeted dumping filed by the petitioners, using the methodology adopted in Certain Steel Nails from the United Arab
Emirates: Notice of Final Determination of Sales at Not Less Than Fair Value, 73 FR 33985 (June 16, 2008), and Certain Steel Nails from the People’s Republic of China: Final Determination of Sales at Less Than Fair Value and Partial Affirmative Determination of Critical Circumstances, 73 FR 33977 (June 16, 2008), and applied in more recent investigations.6 As a result, we preliminarily determined that, with respect to sales by PD/TK/IK for certain customers, regions and time periods, there was a pattern of prices that differed significantly. However, we also found that these differences could be taken into account using the average-to- average methodology because the average-to-average methodology did not conceal differences in the patterns of prices between the targeted and non- targeted groups by averaging low-priced sales to the targeted group with high- priced sales to the non-targeted group. We stated further that the standard average-to-average methodology took into account the price difference because the alternative average-to- transaction methodology yielded no difference in the margin or yielded a difference in the margin that was so insignificant relative to the size of the resulting margin as to be immaterial. Therefore, for the preliminary determination, we applied the standard average-to-average methodology to all of PD/TK/IK’s U.S. sales. See Preliminary Determination at 75 FR 24887–24888.
For the final determination, we performed our targeted-dumping analysis following the methodology employed in the Preliminary Determination, after making certain revisions to PD/TK/IK’s reported data based on verification findings and the comments submitted by the parties, as enumerated in the ‘‘Margin Calculations’’ section of the Decision Memo. Because the results of our final targeted-dumping analysis were consistent with those of our preliminary targeted-dumping analysis, we have continued to apply the standard average-to-average methodology to all of PD/TK/IK’s U.S. sales in the final
VerDate Mar<15>2010 17:01 Sep 24, 2010 Jkt 220001 PO 00000 Frm 00020 Fmt 4703 Sfmt 4703 E:\FR\FM\27SEN1.SGM 27SEN1srob
inso
n on
DS
KH
WC
L6B
1PR
OD
with
NO
TIC
ES

59226 Federal Register / Vol. 75, No. 186 / Monday, September 27, 2010 / Notices
determination. For further discussion, see the Decision Memo at Comment 1.
Continuation of Suspension of Liquidation
In accordance with section 735(c)(1)(B) of the Act, we are directing U.S. Customs and Border Protection (CBP) to continue to suspend
liquidation of all imports of subject merchandise that are entered or withdrawn from warehouse, for consumption on or after May 6, 2010, the date of publication of the preliminary determination in the Federal Register. We will instruct CBP to continue to require a cash deposit or the posting of a bond for all companies
based on the estimated weighted- average dumping margins shown below. The suspension of liquidation instructions will remain in effect until further notice.
Final Determination Margins
We determine that the weighted- average dumping margins are as follows:
Manufacturer/Exporter Weighted-Average margin (percent)
PT. Pabrik Kertas Tjiwi Kimia Tbk./PT. Pindo Deli Pulp and Paper/PT. Indah Kiat Pulp and Paper Tbk ......................... 20.13 All Others ............................................................................................................................................................................. 20.13
All-Others Rate Section 735(c)(5)(A) of the Act
provides that the estimated ‘‘All Others’’ rate shall be an amount equal to the weighted average of the estimated weighted-average dumping margins established for exporters and producers individually investigated, excluding any zero and de minimis margins, and any margins determined entirely under section 776 of the Act. PD/TK/IK is the only respondent in this investigation for which the Department calculated a company-specific rate. Therefore, for purposes of determining the all-others rate and pursuant to section 735(c)(5)(A) of the Act, we are using the weighted- average dumping margin calculated for PD/TK/IK, as referenced above. See, e.g., Notice of Final Determination of Sales at Less Than Fair Value: Stainless Steel Sheet and Strip in Coils From Italy, 64 FR 30750, 30755 (June 8, 1999); Coated Free Sheet Paper from Indonesia: Notice of Preliminary Determination of Sales at Less Than Fair Value and Postponement of Final Determination, 72 FR 30753, 30757 (June 4, 2007), unchanged in Notice of Final Determination of Sales at Less Than Fair Value: Coated Free Sheet Paper from Indonesia, 72 FR 60636 (October 25, 2007); and Certain Magnesia Carbon Bricks from Mexico: Notice of Final Determination of Sales at Less Than Fair Value, 75 FR 45097 (August 2, 2010).
Disclosure We will disclose the calculations
performed within five days of the date of publication of this notice to parties in this proceeding in accordance with 19 CFR 351.224(b).
International Trade Commission Notification
In accordance with section 735(d) of the Act, we have notified the International Trade Commission (ITC) of our final determination. As our final determination is affirmative, the ITC will determine within 45 days whether
imports of the subject merchandise are causing material injury, or threat of material injury, to an industry in the United States. If the ITC determines that material injury or threat of injury does not exist, the proceeding will be terminated and all securities posted will be refunded or canceled. If the ITC determines that such injury does exist, the Department will issue an antidumping duty order directing CBP to assess antidumping duties on all imports of the subject merchandise entered, or withdrawn from warehouse, for consumption on or after the effective date of the suspension of liquidation.
Return or Destruction of Proprietary Information
This notice will serve as the only reminder to parties subject to administrative protective order (APO) of their responsibility concerning the destruction of proprietary information disclosed under APO in accordance with 19 CFR 351.305(a)(3). Timely written notification of return/ destruction of APO materials or conversion to judicial protective order is hereby requested. Failure to comply with the regulations and the terms of an APO is a sanctionable violation.
We are issuing and publishing this determination and notice in accordance with sections 735(d) and 777(i) of the Act.
Dated: September 20, 2010. Ronald K. Lorentzen, Deputy Assistant Secretary for Import Administration.
Appendix—Issues in Decision Memo
Comments
Comment 1: Targeted Dumping Comment 2: Capitalization of Foreign
Exchange Losses in Log Costs Comment 3: Market Price for Certain Logs Comment 4: Inclusion of Sawmill Logs in Log
Costs Comment 5: Transfer Price for Logs Comment 6: IK’s Pulp Costs
Comment 7: General and Administrative (G&A) Expenses
Comment 8: Financial Expenses Comment 9: Unreported Sales to Puerto Rico Comment 10: Treatment of Bank Charges,
Loading Fees, Administrative (ADM) Fees, and Automatic Manifest System (AMS) Fees
Comment 11: Billing Adjustments Comment 12: Rebates Comment 13: Freight Revenue Comment 14: International Freight Comment 15: Foreign Inland Freight Comment 16: Treatment of Certain U.S. Sales
[FR Doc. 2010–24160 Filed 9–24–10; 8:45 am]
BILLING CODE 3510–DS–P
DEPARTMENT OF COMMERCE
National Oceanic and Atmospheric Administration
RIN 0648–XZ25
Fisheries of the South Atlantic, Gulf of Mexico, and Caribbean; Southeastern Data, Assessment, and Review (SEDAR); Public Meeting
AGENCY: National Marine Fisheries Service (NMFS), National Oceanic and Atmospheric Administration (NOAA), Commerce. ACTION: Notice of SEDAR Steering Committee Meeting.
SUMMARY: The SEDAR Steering Committee will meet to discuss the SEDAR assessment schedule, budget, and the SEDAR process. See SUPPLEMENTARY INFORMATION. DATES: The SEDAR Steering Committee will meet on Tuesday, October 5 through Thursday, October 7, 2010. See SUPPLEMENTARY INFORMATION for specific dates and times. ADDRESSES: The meeting will be held at the Embassy Suites Historic Charleston, 337 Meeting Street, Charleston, SC 29403. telephone: (843) 723–6900. FOR FURTHER INFORMATION CONTACT: John Carmichael, SEDAR Program Manager, SEDAR/SAFMC, 4055 Faber Place, Suite
VerDate Mar<15>2010 17:01 Sep 24, 2010 Jkt 220001 PO 00000 Frm 00021 Fmt 4703 Sfmt 4703 E:\FR\FM\27SEN1.SGM 27SEN1srob
inso
n on
DS
KH
WC
L6B
1PR
OD
with
NO
TIC
ES
29364 Federal Register / Vol. 75, No. 100 / Tuesday, May 25, 2010 / Notices
1 For purposes of these investigations, the Department of Commerce has defined the subject merchandise as ‘‘certain coated paper and paperboard in sheets suitable for high quality print graphics using sheet-fed presses; coated on one or both sides with kaolin (China or other clay), calcium carbonate, titanium dioxide, and/or other inorganic substances; with or without a binder; having a GE brightness level of 80 or higher; weighing not more than 340 grams per square meter; whether gloss grade, satin grade, matte grade, dull grade, or any other grade of finish; whether or not surface-colored, surface decorated, printed (except as described below), embossed, or perforated; and irrespective of dimensions (‘‘certain coated paper’’). Certain coated paper includes (a) coated free sheet paper and paperboard that meets this scope definition; (b) coated groundwood paper and paperboard produced from bleached chemi- thermo-mechanical pulp (‘‘BCTMP’’) that meets this scope definition; and (c) any other coated paper and paperboard that meets this scope definition. Certain coated paper is typically (but not exclusively) used for printing multicolored graphics for catalogues, books, magazines, envelopes, labels and wraps, greeting cards, and other commercial printing applications requiring high quality print graphics. Specifically excluded from the scope are imports of paper and paperboard printed with final content printed text or graphics.’’
LOUISIANA
Ascension Parish
St. Joseph School, LA 22 and 44 Burnside, 88002651
[FR Doc. 2010–12480 Filed 5–24–10; 8:45 am]
BILLING CODE 4312–51–P
DEPARTMENT OF THE INTERIOR
Bureau of Land Management
[LLCO922000–L13100000–FI0000; COC63019]
Notice of Proposed Reinstatement of Terminated Oil and Gas Lease COC63019
AGENCY: Bureau of Land Management, Interior.
ACTION: Notice of proposed reinstatement of terminated oil and gas lease.
SUMMARY: Under the provisions of 30 U.S.C. 188(d) and (e), and 43 CFR 3108.2–3(a) and (b)(1), the Bureau of Land Management (BLM) received a petition for reinstatement of oil and gas lease COC63019 from Maverick Whitewater, LLC and PHT Whitewater, LLC, for lands in Delta County, Colorado. The petition was filed on time and was accompanied by all the rentals due since the date the lease terminated under the law.
FOR FURTHER INFORMATION CONTACT: BLM, Milada Krasilinec, Land Law Examiner, Branch of Fluid Minerals Adjudication, at (303) 239–3767.
SUPPLEMENTARY INFORMATION: The lessee has agreed to the amended lease terms for rentals and royalties at rates of $10 per acre or fraction thereof, per year and 16 2⁄3 percent, respectively. The lessee has paid the required $500 administrative fee and $163 to reimburse the Department for the cost of this Federal Register notice. The lessee has met all the requirements for reinstatement of the lease as set out in Section 31(d) and (e) of the Mineral Lands Leasing Act of 1920 (30 U.S.C. 188), and the BLM is proposing to reinstate lease COC63019 effective January 1, 2009, under the original terms and conditions of the lease and the increased rental and royalty rates cited above.
Helen M. Hankins, State Director. [FR Doc. 2010–12460 Filed 5–24–10; 8:45 am]
BILLING CODE 4310–JB–P
INTERNATIONAL TRADE COMMISSION
[Investigation Nos. 701–TA–470–471 and 731–TA–1169–1170 (Final)]
Certain Coated Paper Suitable for High-Quality Print Graphics Using Sheet-Fed Presses From China and Indonesia
AGENCY: United States International Trade Commission. ACTION: Scheduling of the final phase of countervailing duty and antidumping investigations.
SUMMARY: The Commission hereby gives notice of the scheduling of the final phase of countervailing duty investigation No. 701–TA–470–471 (Final) under section 705(b) of the Tariff Act of 1930 (19 U.S.C. 1671d(b)) (the Act) and the final phase of antidumping investigation No. 731–TA–1169–1170 (Final) under section 735(b) of the Act (19 U.S.C. 1673d(b)) to determine whether an industry in the United States is materially injured or threatened with material injury, or the establishment of an industry in the United States is materially retarded, by reason of subsidized and less-than-fair- value imports from China and Indonesia of certain coated paper, provided for in subheadings 4810.14.11, 4810.14.1900, 4810.14.2010, 4810.14.2090, 4810.14.5000, 4810.14.6000, 4810.14.70, 4810.19.1100, 4810.19.1900, 4810.19.2010, 4810.19.2090, 4810.22.1000, 4810.22.50, 4810.22.6000, 4810.22.70, 4810.29.1000, 4810.29.5000, 4810.29.6000, 4810.29.70 of the Harmonized Tariff Schedule of the United States.1
For further information concerning the conduct of this phase of the investigations, hearing procedures, and rules of general application, consult the Commission’s Rules of Practice and Procedure, part 201, subparts A through E (19 CFR part 201), and part 207, subparts A and C (19 CFR part 207). DATES: Effective Date: May 6, 2010. FOR FURTHER INFORMATION CONTACT: Christopher J. Cassise (202–708–5408), Office of Investigations, U.S. International Trade Commission, 500 E Street SW., Washington, DC 20436. Hearing-impaired persons can obtain information on this matter by contacting the Commission’s TDD terminal on 202– 205–1810. Persons with mobility impairments who will need special assistance in gaining access to the Commission should contact the Office of the Secretary at 202–205–2000. General information concerning the Commission may also be obtained by accessing its Internet server (http:// www.usitc.gov). The public record for these investigations may be viewed on the Commission’s electronic docket (EDIS) at http://edis.usitc.gov. SUPPLEMENTARY INFORMATION:
Background.—The final phase of these investigations is being scheduled as a result of affirmative preliminary determinations by the Department of Commerce that certain benefits which constitute subsidies within the meaning of section 703 of the Act (19 U.S.C. 1671b) are being provided to manufacturers, producers, or exporters in China and Indonesia of certain coated paper, and that such products are being sold in the United States at less than fair value within the meaning of section 733 of the Act (19 U.S.C. 1673b). The investigations were requested in a petition filed on September 23, 2009, by Appleton Coating, LLC, Kimberly, WI; NewPage Corp., Mianisburg, OH; Sappi Fine Paper North America, Boston, MA; and the United Steel, Paper and Forestry, Rubber Manufacturing, Energy, Allied Industrial and Service Workers International Union (‘‘USW’’).
Participation in the investigations and public service list.—Persons, including industrial users of the subject merchandise and, if the merchandise is sold at the retail level, representative consumer organizations, wishing to participate in the final phase of these investigations as parties must file an entry of appearance with the Secretary to the Commission, as provided in section 201.11 of the Commission’s rules, no later than 21 days prior to the hearing date specified in this notice. A party that filed a notice of appearance during the preliminary phase of the
VerDate Mar<15>2010 18:11 May 24, 2010 Jkt 220001 PO 00000 Frm 00062 Fmt 4703 Sfmt 4703 E:\FR\FM\25MYN1.SGM 25MYN1srob
inso
n on
DS
KH
WC
L6B
1PR
OD
with
NO
TIC
ES
29365 Federal Register / Vol. 75, No. 100 / Tuesday, May 25, 2010 / Notices
investigations need not file an additional notice of appearance during this final phase. The Secretary will maintain a public service list containing the names and addresses of all persons, or their representatives, who are parties to the investigations.
Limited disclosure of business proprietary information (BPI) under an administrative protective order (APO) and BPI service list.—Pursuant to section 207.7(a) of the Commission’s rules, the Secretary will make BPI gathered in the final phase of these investigations available to authorized applicants under the APO issued in the investigations, provided that the application is made no later than 21 days prior to the hearing date specified in this notice. Authorized applicants must represent interested parties, as defined by 19 U.S.C. 1677(9), who are parties to the investigations. A party granted access to BPI in the preliminary phase of the investigations need not reapply for such access. A separate service list will be maintained by the Secretary for those parties authorized to receive BPI under the APO.
Staff report.—The prehearing staff report in the final phase of these investigations will be placed in the nonpublic record on September 2, 2010, and a public version will be issued thereafter, pursuant to section 207.22 of the Commission’s rules.
Hearing.—The Commission will hold a hearing in connection with the final phase of these investigations beginning at 9:30 a.m. on September 16, 2010, at the U.S. International Trade Commission Building. Requests to appear at the hearing should be filed in writing with the Secretary to the Commission on or before September 10, 2010. A nonparty who has testimony that may aid the Commission’s deliberations may request permission to present a short statement at the hearing. All parties and nonparties desiring to appear at the hearing and make oral presentations should attend a prehearing conference to be held at 9:30 a.m. on September 14, 2010, at the U.S. International Trade Commission Building. Oral testimony and written materials to be submitted at the public hearing are governed by sections 201.6(b)(2), 201.13(f), and 207.24 of the Commission’s rules. Parties must submit any request to present a portion of their hearing testimony in camera no later than 7 business days prior to the date of the hearing.
Written submissions.—Each party who is an interested party shall submit a prehearing brief to the Commission. Prehearing briefs must conform with the provisions of section 207.23 of the
Commission’s rules; the deadline for filing is September 10, 2010. Parties may also file written testimony in connection with their presentation at the hearing, as provided in section 207.24 of the Commission’s rules, and posthearing briefs, which must conform with the provisions of section 207.25 of the Commission’s rules. The deadline for filing posthearing briefs is September 23, 2010; witness testimony must be filed no later than three days before the hearing. In addition, any person who has not entered an appearance as a party to the investigations may submit a written statement of information pertinent to the subject of the investigations, including statements of support or opposition to the petition, on or before September 23, 2010. On October 13, 2010, the Commission will make available to parties all information on which they have not had an opportunity to comment. Parties may submit final comments on this information on or before October 15, 2010, but such final comments must not contain new factual information and must otherwise comply with section 207.30 of the Commission’s rules. All written submissions must conform with the provisions of section 201.8 of the Commission’s rules; any submissions that contain BPI must also conform with the requirements of sections 201.6, 207.3, and 207.7 of the Commission’s rules. The Commission’s rules do not authorize filing of submissions with the Secretary by facsimile or electronic means, except to the extent permitted by section 201.8 of the Commission’s rules, as amended, 67 FR 68036 (November 8, 2002). Even where electronic filing of a document is permitted, certain documents must also be filed in paper form, as specified in II (C) of the Commission’s Handbook on Electronic Filing Procedures, 67 FR 68168, 68173 (November 8, 2002).
Additional written submissions to the Commission, including requests pursuant to section 201.12 of the Commission’s rules, shall not be accepted unless good cause is shown for accepting such submissions, or unless the submission is pursuant to a specific request by a Commissioner or Commission staff.
In accordance with sections 201.16(c) and 207.3 of the Commission’s rules, each document filed by a party to the investigations must be served on all other parties to the investigations (as identified by either the public or BPI service list), and a certificate of service must be timely filed. The Secretary will not accept a document for filing without a certificate of service.
Authority: These investigations are being conducted under authority of title VII of the Tariff Act of 1930; this notice is published pursuant to section 207.21 of the Commission’s rules.
By order of the Commission. Issued: May 19, 2010.
Marilyn R. Abbott, Secretary to the Commission. [FR Doc. 2010–12496 Filed 5–24–10; 8:45 am]
BILLING CODE 7020–02–P
DEPARTMENT OF LABOR
Office of the Secretary
Job Corps: Final Finding of No Significant Impact (FONSI) for Small Wind Turbine Installation at the Pine Ridge Job Corps Center Located at 15710 Highway 385, Chadron, NE 69337
AGENCY: Office of the Secretary (OSEC), Department of Labor.
Recovery: This project will be wholly funded under the American Recovery and Reconstruction Act of 2009. ACTION: Final Finding of No Significant Impact (FONSI) for Small Wind Turbine Installation at the Pine Ridge Job Corps Center located at 15710 Highway 385, Chadron, NE 69337.
SUMMARY: Pursuant to the Council on Environmental Quality Regulations (40 CFR part 1500–08) implementing procedural provisions of the National Environmental Policy Act (NEPA), the Department of Labor, Office of the Secretary (OSEC), in accordance with 29 CFR 11.11(d), gives final notice of the proposed construction of a small wind turbine at the Pine Ridge Job Corps Center, and that this project will not have a significant adverse impact on the environment. In accordance with 29 CFR 11.11(d) and 40 CFR 1501.4(e)(2), a preliminary FONSI for the project was published in the April 5, 2010 Federal Register (75 FR 17161). No comments were received regarding the preliminary FONSI. OSEC has reviewed the conclusion of the environmental assessment (EA), and agrees with the finding of no significant impact. This notice serves as the Final Finding of No Significant Impact (FONSI) for Small Wind Turbine Installation at the Pine Ridge Job Corps Center located at 15710 Highway 385, Chadron, NE 69337. The preliminary FONSI and the EA are adopted in final with no change. DATES: Effective Date: These findings are effective as of May 25, 2010. FOR FURTHER INFORMATION CONTACT: William A Dakshaw, Department of Labor, US Department of Labor, 200
VerDate Mar<15>2010 18:11 May 24, 2010 Jkt 220001 PO 00000 Frm 00063 Fmt 4703 Sfmt 4703 E:\FR\FM\25MYN1.SGM 25MYN1srob
inso
n on
DS
KH
WC
L6B
1PR
OD
with
NO
TIC
ES


APPENDIX B
LIST OF HEARING WITNESSES
B-1


CALENDAR OF PUBLIC HEARING
Those listed below appeared as witnesses at the United States International TradeCommission’s hearing:
Subject: Certain Coated Paper Suitable for High-Quality PrintGraphics Using Sheet-Fed Presses from China and Indonesia
Inv. Nos.: 701-TA-470-471 and 731-TA-1169-1170 (Final)
Date and Time: September 16, 2010 - 9:30 a.m.
Sessions were held in connection with these investigations in the Main Hearing Room (room101), 500 E Street, S.W., Washington, D.C.
UNITED STATES SENATE APPEARANCES:
The Honorable John D. Rockefeller IV, United States Senator, West Virginia
The Honorable Herb Kohl, United States Senator, Wisconsin
The Honorable Russell D. Feingold, United States Senator, Wisconsin
The Honorable Olympia J. Snowe, United States Senator, Maine
The Honorable Susan M. Collins, United States Senator, Maine
The Honorable Debbie Stabenow, United States Senator, Michigan
The Honorable Amy Klobuchar, United States Senator, Minnesota
The Honorable Al Franken, United States Senator, Minnesota
STATE GOVERNOR APPEARANCE:
The Honorable Ted Strickland, Governor of Ohio
U.S. HOUSE OF REPRESENTATIVES APPEARANCES:
The Honorable James L. Oberstar, U.S. Representative, 8th District, Minnesota
The Honorable Thomas E. Petri, U.S. Representative, 6th District, Wisconsin
B-3

The Honorable Roscoe G. Bartlett, U.S. Representative, 6th District, Maryland
The Honorable Bart Stupak, U.S. Representative, 1st District, Michigan
The Honorable Ed Whitfield, U.S. Representative, 2st District, Kentucky
The Honorable Mike Ross, U.S. Representative, 4th District, Arkansas
The Honorable Michael H. Michaud, U.S. Representative, 2nd District, Maine
The Honorable Michael R. Turner, U.S. Representative, Ohio
The Honorable Steve L. Kagen, U.S. Representative, 8th District, Wisconsin
The Honorable Chellie Pingree, U.S. Representative, 1st District, Maine
OPENING STATEMENTS:
Petitioner: Terence P. Stewart, Stewart and StewartRespondents: James P. Durling, Winston & Strawn LLP
IN SUPPORT OF THE IMPOSITION OF ANTIDUMPING AND COUNTERVAILINGDUTY ORDERS:
Stewart and StewartWashington, D.C.
and
King & Spalding LLPWashington, D.C.on behalf of
Appleton Coated, LLCNew Page Corp.Sappi Fine Paper North AmericaUnited Steel, Paper and Forestry, Rubber, Manufacturing, Energy, Allied Industrial and ServiceWorkers International Union (“USW”)
George F. Martin, President and CEO, NewPage Corp.
B-4
Barry R. Nelson, Senior Vice President, Sales, NewPage Corp.
Steven DeVoe, General Manager, Sheet and Caliper, NewPage Corp.
Mark Gardner, President and CEO, Sappi Fine Paper North America
Jennifer Miller, Executive Vice President, Strategic Marketing and ChiefSustainability Officer, Sappi Fine Paper North America
Anne Ayer, Vice President, Corporate Development and Chief InformationOfficer, Sappi Fine Paper North America
Sandra Van Ert, President and CEO, Appleton Coated LLC
John Cappy, Former CEO, Appleton Coated LLC
Greg Savage, Vice President, Commercial Sales, Appleton Coated LLC
Leo Gerard, International President, United Steel, Paper and Forestry, Rubber,Manufacturing, Energy, Allied Industrial and Service WorkersInternational Union
Jon Geenen, International Vice President, United Steel, Paper and Forestry,Rubber, Manufacturing, Energy, Allied Industrial and Service WorkersInternational Union
David McGehee, President, Mac Papers, Inc.
Mike Freeland, President, Field Paper Co.
George Schoedinger, Vice President, Universal Printing Co.
Mike Marcian, President, Corporate Press
Dr. Seth Kaplan, Principal, The Brattle Group
Bonnie B. Byers, Trade Consultant, King & Spalding
B-5

Terence P. Stewart )Eric P. Salonen )Philip A. Butler )Elizabeth A. Argenti ) – OF COUNSEL
)Gilbert B. Kaplan )Brian E. McGill )
IN OPPOSITION TO THE IMPOSITION OF ANTIDUMPING AND COUNTERVAILINGDUTY ORDERS:
Winston & Strawn LLPWashington, D.C.on behalf of
Gold East Paper (Jiangsu) Co., Ltd.Gold Huasheng Paper Co., Ltd. (collectively, “APP–China”)PT Pindo Deli Pulp and Paper MillsPT Pabrik Kertas Tjimi Kimia Tbk (collectively, “APP–Indonesia”)
Rui Zheng, Senior Director and Head of Chairman’s Office, APP–China
Andrew Hanscom, Vice President, Eagle Ridge Paper
Ken Harris, Vice President of Operations and Sales, Eagle Ridge Paper
Anthony Atamimi, Sale Manager, Digital Products, Global Paper Solutions
Terry Hunley, Advisor, Global Paper Solutions
Mark Dragoo, Vice President of Paperboard Sales, Global Paper Solutions
Ian Lifshitz, North American Sustainability & Public Outreach Manager, Asia Pulp & Paper
Daniel W. Klett, Economist, Capital Trade, Inc.
Daniel L. Porter )James P. Durling ) – OF COUNSELMatthew P. McCullough )
B-6

CLOSING STATEMENTS:
Petitioners (Gilbert B. Kaplan, King & Spalding LLP)Respondents (Daniel L. Porter, Winston & Strawn LLP)
B-7


APPENDIX C
SUMMARY DATA
C-1


Table C-1
Certain coated paper (other than packaging paperboard): Summary data concerning the U.S. market, 2007-09, January-June 2009, and January-June 2010
(Quantity=short tons, value=1,000 dollars, unit values, unit labor costs, and unit expenses are per short ton; period changes=percent, except where noted)
Reported data Period changes
January-June Jan.-June
Item 2007 2008 2009 2009 2010 2007-09 2007-08 2008-09 2009-10
U.S. consumption quantity:
Amount . . . . . . . . . . . . . . . . . . . . . . . . 2,349,356 2,109,689 1,776,525 836,116 1,026,881 -24.4 -10.2 -15.8 22.8
Producers' share (1) . . . . . . . . . . . . . . 52.1 52.9 56.3 51.3 61.8 4.2 0.8 3.4 10.4
Importers' share (1):
China . . . . . . . . . . . . . . . . . . . . . . . . 14.7 15.6 19.8 22.8 7.0 5.1 0.9 4.2 -15.8
Indonesia . . . . . . . . . . . . . . . . . . . . . 2.2 2.5 3.4 2.4 1.3 1.2 0.3 0.9 -1.1
Subtotal . . . . . . . . . . . . . . . . . . . . . 17.0 18.1 23.3 25.2 8.3 6.3 1.2 5.2 -16.9
All other sources . . . . . . . . . . . . . . . 31.0 29.0 20.5 23.5 30.0 -10.5 -2.0 -8.5 6.5
Total imports . . . . . . . . . . . . . . . . . 47.9 47.1 43.7 48.7 38.2 -4.2 -0.8 -3.4 -10.4
U.S. consumption value:
Amount . . . . . . . . . . . . . . . . . . . . . . . . 2,428,624 2,281,181 1,742,203 848,377 982,225 -28.3 -6.1 -23.6 15.8
Producers' share (1) . . . . . . . . . . . . . . 54.7 55.4 58.8 54.4 63.2 4.1 0.7 3.4 8.8
Importers' share (1):
China . . . . . . . . . . . . . . . . . . . . . . . . 13.1 14.0 17.1 19.5 6.4 4.0 0.9 3.1 -13.0
Indonesia . . . . . . . . . . . . . . . . . . . . . 1.9 2.1 3.0 1.9 1.2 1.1 0.3 0.9 -0.8
Subtotal . . . . . . . . . . . . . . . . . . . . . 15.0 16.1 20.1 21.4 7.6 5.1 1.2 3.9 -13.8
All other sources . . . . . . . . . . . . . . . 30.4 28.5 21.2 24.2 29.2 -9.2 -1.9 -7.3 5.0
Total imports . . . . . . . . . . . . . . . . . 45.3 44.6 41.2 45.6 36.8 -4.1 -0.7 -3.4 -8.8
U.S. imports from:
China:
Quantity . . . . . . . . . . . . . . . . . . . . . . 345,768 329,307 352,555 190,622 71,706 2.0 -4.8 7.1 -62.4
Value . . . . . . . . . . . . . . . . . . . . . . . . 318,066 319,306 297,527 165,213 63,243 -6.5 0.4 -6.8 -61.7
Unit value . . . . . . . . . . . . . . . . . . . . . $920 $970 $844 $867 $882 -8.3 5.4 -13.0 1.8
Ending inventory quantity . . . . . . . . . *** *** *** *** *** *** *** *** ***
Indonesia:
Quantity . . . . . . . . . . . . . . . . . . . . . . 52,541 52,938 61,039 19,883 13,327 16.2 0.8 15.3 -33.0
Value . . . . . . . . . . . . . . . . . . . . . . . . 45,543 48,765 52,384 16,458 11,536 15.0 7.1 7.4 -29.9
Unit value . . . . . . . . . . . . . . . . . . . . . $867 $921 $858 $828 $866 -1.0 6.3 -6.8 4.6
Ending inventory quantity . . . . . . . . . *** *** *** *** *** *** *** *** ***
Subtotal:
Quantity . . . . . . . . . . . . . . . . . . . . . . 398,309 382,245 413,593 210,506 85,033 3.8 -4.0 8.2 -59.6
Value . . . . . . . . . . . . . . . . . . . . . . . . 363,609 368,071 349,911 181,670 74,779 -3.8 1.2 -4.9 -58.8
Unit value . . . . . . . . . . . . . . . . . . . . . $913 $963 $846 $863 $879 -7.3 5.5 -12.1 1.9
Ending inventory quantity . . . . . . . . . *** *** *** *** *** *** *** *** ***
All other sources:
Quantity . . . . . . . . . . . . . . . . . . . . . . 727,306 611,626 363,472 196,512 307,612 -50.0 -15.9 -40.6 56.5
Value . . . . . . . . . . . . . . . . . . . . . . . . 737,251 650,135 368,605 204,901 286,665 -50.0 -11.8 -43.3 39.9
Unit value . . . . . . . . . . . . . . . . . . . . . $1,014 $1,063 $1,014 $1,043 $932 0.0 4.9 -4.6 -10.6
Ending inventory quantity . . . . . . . . . *** *** *** *** *** *** *** *** ***
All sources:
Quantity . . . . . . . . . . . . . . . . . . . . . . 1,125,615 993,872 777,066 407,018 392,645 -31.0 -11.7 -21.8 -3.5
Value . . . . . . . . . . . . . . . . . . . . . . . . 1,100,860 1,018,206 718,516 386,572 361,443 -34.7 -7.5 -29.4 -6.5
Unit value . . . . . . . . . . . . . . . . . . . . . $978 $1,024 $925 $950 $921 -5.5 4.8 -9.7 -3.1
Ending inventory quantity . . . . . . . . . *** *** *** *** *** *** *** *** ***
Table continued on next page.
C-3

Table C-1--Continued
Certain coated paper (other than packaging paperboard): Summary data concerning the U.S. market, 2007-09, January-June 2009, and January-June 2010
(Quantity=short tons, value=1,000 dollars, unit values, unit labor costs, and unit expenses are per short ton; period changes=percent, except where noted)
Reported data Period changes
January-June Jan.-June
Item 2007 2008 2009 2009 2010 2007-09 2007-08 2008-09 2009-10
U.S. producers':
Average capacity quantity . . . . . . . . . 1,395,457 1,266,051 1,354,352 669,847 770,217 -2.9 -9.3 7.0 15.0
Production quantity . . . . . . . . . . . . . . 1,303,273 1,185,322 1,103,889 517,681 714,387 -15.3 -9.1 -6.9 38.0
Capacity utilization (1) . . . . . . . . . . . . 93.4 93.6 81.5 77.3 92.8 -11.9 0.2 -12.1 15.5
U.S. shipments:
Quantity . . . . . . . . . . . . . . . . . . . . . . 1,223,741 1,115,817 999,459 429,098 634,236 -18.3 -8.8 -10.4 47.8
Value . . . . . . . . . . . . . . . . . . . . . . . . 1,327,764 1,262,975 1,023,688 461,806 620,782 -22.9 -4.9 -18.9 34.4
Unit value . . . . . . . . . . . . . . . . . . . . . $1,085 $1,132 $1,024 $1,076 $979 -5.6 4.3 -9.5 -9.1
Export shipments:
Quantity . . . . . . . . . . . . . . . . . . . . . . *** *** *** *** *** *** *** *** ***
Value . . . . . . . . . . . . . . . . . . . . . . . . *** *** *** *** *** *** *** *** ***
Unit value . . . . . . . . . . . . . . . . . . . . . *** *** *** *** *** *** *** *** ***
Ending inventory quantity . . . . . . . . . . 306,146 283,990 309,884 342,037 342,866 1.2 -7.2 9.1 0.2
Inventories/total shipments (1) . . . . . . 23.3 23.5 28.7 37.2 25.2 5.4 0.2 5.2 -12.0
Production workers . . . . . . . . . . . . . . 1,874 1,723 1,614 1,654 1,590 -13.9 -8.0 -6.3 -3.9
Hours worked (1,000s) . . . . . . . . . . . . 3,491 3,099 2,894 1,453 1,528 -17.1 -11.2 -6.6 5.2
Wages paid ($1,000s) . . . . . . . . . . . . 92,464 88,866 84,224 39,811 46,004 -8.9 -3.9 -5.2 15.6
Hourly wages . . . . . . . . . . . . . . . . . . . $26.49 $28.67 $29.10 $27.40 $30.11 9.9 8.3 1.5 9.9
Productivity (tons/1,000 hours) . . . . . 344.0 349.0 350.9 331.9 433.9 2.0 1.5 0.6 30.7
Unit labor costs . . . . . . . . . . . . . . . . . $77.00 $82.15 $82.93 $82.56 $69.40 7.7 6.7 0.9 -15.9
Net sales:
Quantity . . . . . . . . . . . . . . . . . . . . . . 1,346,842 1,245,756 1,106,137 475,950 696,014 -17.9 -7.5 -11.2 46.2
Value . . . . . . . . . . . . . . . . . . . . . . . . 1,439,201 1,374,311 1,124,728 503,326 676,989 -21.9 -4.5 -18.2 34.5
Unit value . . . . . . . . . . . . . . . . . . . . . $1,069 $1,103 $1,017 $1,058 $973 -4.8 3.2 -7.8 -8.0
Cost of goods sold (COGS) . . . . . . . . 1,229,514 1,190,043 1,047,690 474,327 636,470 -14.8 -3.2 -12.0 34.2
Gross profit or (loss) . . . . . . . . . . . . . . 209,686 184,267 77,038 28,999 40,519 -63.3 -12.1 -58.2 39.7
SG&A expenses . . . . . . . . . . . . . . . . . 95,667 100,709 84,322 42,225 43,622 -11.9 5.3 -16.3 3.3
Operating income or (loss) . . . . . . . . 114,020 83,558 (7,284) (13,225) (3,102) (3) -26.7 (3) 76.5
Capital expenditures . . . . . . . . . . . . . 43,275 46,011 28,100 12,650 13,792 -35.1 6.3 -38.9 9.0
Unit COGS . . . . . . . . . . . . . . . . . . . . . $913 $955 $947 $997 $914 3.8 4.6 -0.8 -8.2
Unit SG&A expenses . . . . . . . . . . . . . $71 $81 $76 $89 $63 7.3 13.8 -5.7 -29.4
Unit operating income or (loss) . . . . . $85 $67 ($7) ($28) ($4) (3) -20.8 (3) 84.0
COGS/sales (1) . . . . . . . . . . . . . . . . . 85.4 86.6 93.2 94.2 94.0 7.7 1.2 6.6 -0.2
Operating income or (loss)/
sales (1) . . . . . . . . . . . . . . . . . . . . . . 7.9 6.1 (0.6) (2.6) (0.5) -8.6 -1.8 -6.7 2.2
(1) "Reported data" are in percent and "period changes" are in percentage points.
(2) Not applicable.
(3) Undefined.
Note.--Financial data are reported on a fiscal year basis and may not necessarily be comparable to data reported on a calendar year basis. Because of rounding,
figures may not add to the totals shown. Unit values and shares are calculated from the unrounded figures.
Source: Compiled from data submitted in response to Commission questionnaires and from official Commerce statistics.
C-4

Table C-2
Certain coated paper (packaging paperboard): Summary data concerning U.S. producers, 2007-09, January-June 2009, and January-June 2010
(Quantity=short tons, value=1,000 dollars, unit values, unit labor costs, and unit expenses are per short ton; period changes=percent, except where noted)
Reported data Period changes
January-June Jan.-June
Item 2007 2008 2009 2009 2010 2007-09 2007-08 2008-09 2009-10
U.S. producers':
Average capacity quantity . . . . . . . . . 668,754 676,762 662,891 320,291 277,185 -0.9 1.2 -2.0 -13.5
Production quantity . . . . . . . . . . . . . . 641,740 671,261 561,132 277,639 278,967 -12.6 4.6 -16.4 0.5
Capacity utilization (1) . . . . . . . . . . . . 96.0 99.2 84.6 86.7 100.6 -11.3 3.2 -14.5 14.0
U.S. shipments:
Quantity . . . . . . . . . . . . . . . . . . . . . . 513,481 533,155 477,774 231,671 226,869 -7.0 3.8 -10.4 -2.1
Value . . . . . . . . . . . . . . . . . . . . . . . . 391,568 431,578 411,627 201,694 193,543 5.1 10.2 -4.6 -4.0
Unit value . . . . . . . . . . . . . . . . . . . . . $763 $809 $862 $871 $853 13.0 6.2 6.4 -2.0
Export shipments:
Quantity . . . . . . . . . . . . . . . . . . . . . . *** *** *** *** *** *** *** *** ***
Value . . . . . . . . . . . . . . . . . . . . . . . . *** *** *** *** *** *** *** *** ***
Unit value . . . . . . . . . . . . . . . . . . . . . *** *** *** *** *** *** *** *** ***
Ending inventory quantity . . . . . . . . . . *** *** *** *** *** *** *** *** ***
Inventories/total shipments (1) . . . . . . *** *** *** *** *** *** *** *** ***
Production workers . . . . . . . . . . . . . . 1,157 1,183 1,083 1,101 1,055 -6.4 2.2 -8.5 -4.2
Hours worked (1,000s) . . . . . . . . . . . . 2,113 2,199 1,937 1,010 912 -8.3 4.1 -11.9 -9.7
Wages paid ($1,000s) . . . . . . . . . . . . 59,664 60,064 58,714 29,707 27,779 -1.6 0.7 -2.2 -6.5
Hourly wages . . . . . . . . . . . . . . . . . . . $28.24 $27.31 $30.31 $29.41 $30.46 7.3 -3.3 11.0 3.6
Productivity (tons/1,000 hours) . . . . . 213.0 213.7 195.6 188.6 208.8 -8.2 0.3 -8.4 10.7
Unit labor costs . . . . . . . . . . . . . . . . . $132.54 $127.83 $154.94 $155.96 $145.88 16.9 -3.6 21.2 -6.5
Net sales:
Quantity . . . . . . . . . . . . . . . . . . . . . . 706,382 742,050 631,972 323,343 332,313 -10.5 5.0 -14.8 2.8
Value . . . . . . . . . . . . . . . . . . . . . . . . 505,451 566,907 513,307 262,520 261,861 1.6 12.2 -9.5 -0.3
Unit value . . . . . . . . . . . . . . . . . . . . . $716 $764 $812 $812 $788 13.5 6.8 6.3 -2.9
Cost of goods sold (COGS) . . . . . . . . 450,076 528,161 421,513 214,282 223,016 -6.3 17.3 -20.2 4.1
Gross profit or (loss) . . . . . . . . . . . . . . 55,375 38,746 91,794 48,238 38,845 65.8 -30.0 136.9 -19.5
SG&A expenses . . . . . . . . . . . . . . . . . 25,366 27,234 22,745 12,579 11,830 -10.3 7.4 -16.5 -6.0
Operating income or (loss) . . . . . . . . 30,009 11,512 69,049 35,659 27,015 130.1 -61.6 499.8 -24.2
Capital expenditures . . . . . . . . . . . . . 7,915 6,415 5,748 3,045 5,009 -27.4 -19.0 -10.4 64.5
Unit COGS . . . . . . . . . . . . . . . . . . . . . $637 $712 $667 $663 $671 4.7 11.7 -6.3 1.3
Unit SG&A expenses . . . . . . . . . . . . . $36 $37 $36 $39 $36 0.2 2.2 -1.9 -8.5
Unit operating income or (loss) . . . . . $42 $16 $109 $110 $81 157.2 -63.5 604.3 -26.3
COGS/sales (1) . . . . . . . . . . . . . . . . . 89.0 93.2 82.1 81.6 85.2 -6.9 4.1 -11.0 3.5
Operating income or (loss)/
sales (1) . . . . . . . . . . . . . . . . . . . . . . 5.9 2.0 13.5 13.6 10.3 7.5 -3.9 11.4 -3.3
(1) "Reported data" are in percent and "period changes" are in percentage points.
(2) Not applicable.
Note.--Financial data are reported on a fiscal year basis and may not necessarily be comparable to data reported on a calendar year basis. Because of rounding,
figures may not add to the totals shown. Unit values and shares are calculated from the unrounded figures.
Source: Compiled from data submitted in response to Commission questionnaires.
C-5

Table C-3
Certain coated paper (All U.S. Integrated Producers): Summary data concerning the U.S. market, 2007-09, January-June 2009, and January-June 2010
(Quantity=short tons, value=1,000 dollars, unit values, unit labor costs, and unit expenses are per short ton; period changes=percent, except where noted)
Reported data Period changes
January-June Jan.-June
Item 2007 2008 2009 2009 2010 2007-09 2007-08 2008-09 2009-10
U.S. consumption quantity:
Amount . . . . . . . . . . . . . . . . . . . . 2,862,837 2,642,844 2,254,299 1,067,787 1,253,750 -21.3 -7.7 -14.7 17.4
Producers' share (1) . . . . . . . . . 60.7 62.4 65.5 61.9 68.7 4.8 1.7 3.1 6.8
Importers' share (1):
China . . . . . . . . . . . . . . . . . . . . 12.1 12.5 15.6 17.9 5.7 3.6 0.4 3.2 -12.1
Indonesia . . . . . . . . . . . . . . . . . 1.8 2.0 2.7 1.9 1.1 0.9 0.2 0.7 -0.8
Subtotal . . . . . . . . . . . . . . . . . 13.9 14.5 18.3 19.7 6.8 4.4 0.6 3.9 -12.9
All other sources . . . . . . . . . . . 25.4 23.1 16.1 18.4 24.5 -9.3 -2.3 -7.0 6.1
Total imports . . . . . . . . . . . . . 39.3 37.6 34.5 38.1 31.3 -4.8 -1.7 -3.1 -6.8
U.S. consumption value:
Amount . . . . . . . . . . . . . . . . . . . . 2,820,192 2,712,759 2,153,830 1,050,071 1,175,768 -23.6 -3.8 -20.6 12.0
Producers' share (1) . . . . . . . . . 61.0 62.5 66.6 63.2 69.3 5.7 1.5 4.2 6.1
Importers' share (1):
China . . . . . . . . . . . . . . . . . . . . 11.3 11.8 13.8 15.7 5.4 2.5 0.5 2.0 -10.4
Indonesia . . . . . . . . . . . . . . . . . 1.6 1.8 2.4 1.6 1.0 0.8 0.2 0.6 -0.6
Subtotal . . . . . . . . . . . . . . . . . 12.9 13.6 16.2 17.3 6.4 3.4 0.7 2.7 -10.9
All other sources . . . . . . . . . . . 26.1 24.0 17.1 19.5 24.4 -9.0 -2.2 -6.9 4.9
Total imports . . . . . . . . . . . . . 39.0 37.5 33.4 36.8 30.7 -5.7 -1.5 -4.2 -6.1
U.S. imports from:
China:
Quantity . . . . . . . . . . . . . . . . . . 345,768 329,307 352,555 190,622 71,706 2.0 -4.8 7.1 -62.4
Value . . . . . . . . . . . . . . . . . . . . 318,066 319,306 297,527 165,213 63,243 -6.5 0.4 -6.8 -61.7
Unit value . . . . . . . . . . . . . . . . . $920 $970 $844 $867 $882 -8.3 5.4 -13.0 1.8
Ending inventory quantity . . . . *** *** *** *** *** *** *** *** ***
Indonesia:
Quantity . . . . . . . . . . . . . . . . . . 52,541 52,938 61,039 19,883 13,327 16.2 0.8 15.3 -33.0
Value . . . . . . . . . . . . . . . . . . . . 45,543 48,765 52,384 16,458 11,536 15.0 7.1 7.4 -29.9
Unit value . . . . . . . . . . . . . . . . . $867 $921 $858 $828 $866 -1.0 6.3 -6.8 4.6
Ending inventory quantity . . . . *** *** *** *** *** *** *** *** ***
Subtotal:
Quantity . . . . . . . . . . . . . . . . . . 398,309 382,245 413,593 210,506 85,033 3.8 -4.0 8.2 -59.6
Value . . . . . . . . . . . . . . . . . . . . 363,609 368,071 349,911 181,670 74,779 -3.8 1.2 -4.9 -58.8
Unit value . . . . . . . . . . . . . . . . . $913 $963 $846 $863 $879 -7.3 5.5 -12.1 1.9
Ending inventory quantity . . . . *** *** *** *** *** *** *** *** ***
All other sources:
Quantity . . . . . . . . . . . . . . . . . . 727,306 611,626 363,472 196,512 307,612 -50.0 -15.9 -40.6 56.5
Value . . . . . . . . . . . . . . . . . . . . 737,251 650,135 368,605 204,901 286,665 -50.0 -11.8 -43.3 39.9
Unit value . . . . . . . . . . . . . . . . . $1,014 $1,063 $1,014 $1,043 $932 0.0 4.9 -4.6 -10.6
Ending inventory quantity . . . . *** *** *** *** *** *** *** *** ***
All sources:
Quantity . . . . . . . . . . . . . . . . . . 1,125,615 993,872 777,066 407,018 392,645 -31.0 -11.7 -21.8 -3.5
Value . . . . . . . . . . . . . . . . . . . . 1,100,860 1,018,206 718,516 386,572 361,443 -34.7 -7.5 -29.4 -6.5
Unit value . . . . . . . . . . . . . . . . . $978 $1,024 $925 $950 $921 -5.5 4.8 -9.7 -3.1
Ending inventory quantity . . . . *** *** *** *** *** *** *** *** ***
Table continued on next page.
C-6
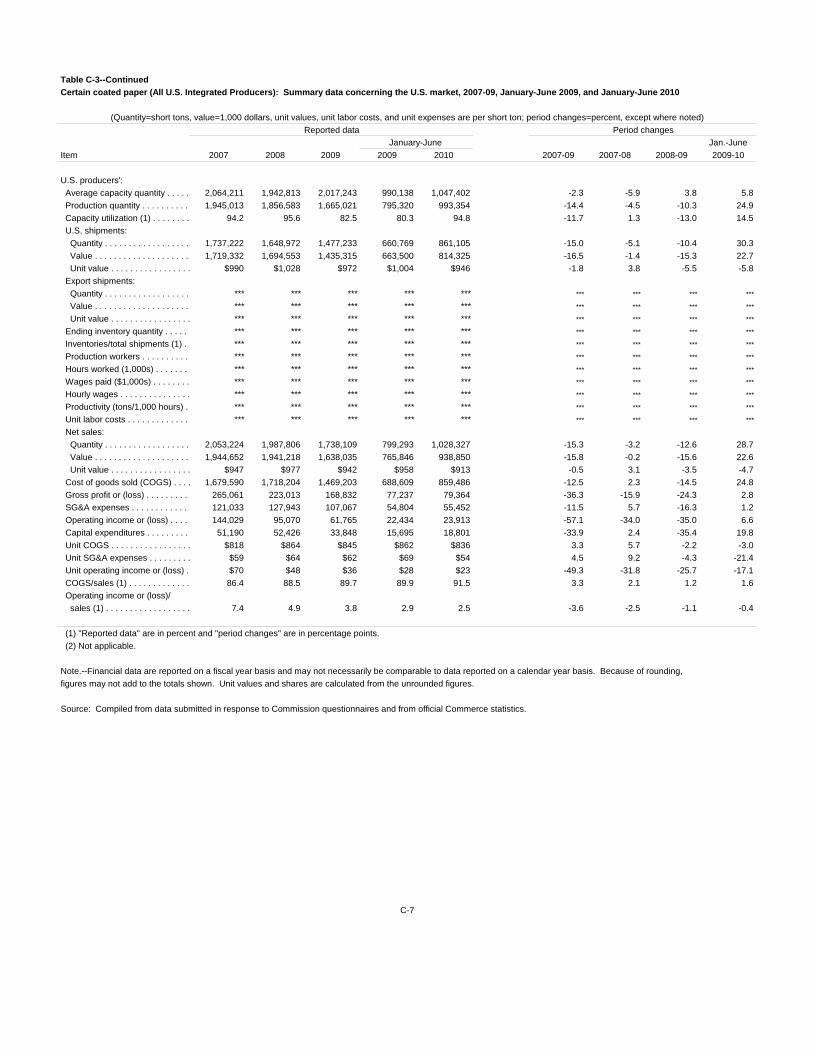
Table C-3--Continued
Certain coated paper (All U.S. Integrated Producers): Summary data concerning the U.S. market, 2007-09, January-June 2009, and January-June 2010
(Quantity=short tons, value=1,000 dollars, unit values, unit labor costs, and unit expenses are per short ton; period changes=percent, except where noted)
Reported data Period changes
January-June Jan.-June
Item 2007 2008 2009 2009 2010 2007-09 2007-08 2008-09 2009-10
U.S. producers':
Average capacity quantity . . . . . 2,064,211 1,942,813 2,017,243 990,138 1,047,402 -2.3 -5.9 3.8 5.8
Production quantity . . . . . . . . . . 1,945,013 1,856,583 1,665,021 795,320 993,354 -14.4 -4.5 -10.3 24.9
Capacity utilization (1) . . . . . . . . 94.2 95.6 82.5 80.3 94.8 -11.7 1.3 -13.0 14.5
U.S. shipments:
Quantity . . . . . . . . . . . . . . . . . . 1,737,222 1,648,972 1,477,233 660,769 861,105 -15.0 -5.1 -10.4 30.3
Value . . . . . . . . . . . . . . . . . . . . 1,719,332 1,694,553 1,435,315 663,500 814,325 -16.5 -1.4 -15.3 22.7
Unit value . . . . . . . . . . . . . . . . . $990 $1,028 $972 $1,004 $946 -1.8 3.8 -5.5 -5.8
Export shipments:
Quantity . . . . . . . . . . . . . . . . . . *** *** *** *** *** *** *** *** ***
Value . . . . . . . . . . . . . . . . . . . . *** *** *** *** *** *** *** *** ***
Unit value . . . . . . . . . . . . . . . . . *** *** *** *** *** *** *** *** ***
Ending inventory quantity . . . . . *** *** *** *** *** *** *** *** ***
Inventories/total shipments (1) . *** *** *** *** *** *** *** *** ***
Production workers . . . . . . . . . . *** *** *** *** *** *** *** *** ***
Hours worked (1,000s) . . . . . . . *** *** *** *** *** *** *** *** ***
Wages paid ($1,000s) . . . . . . . . *** *** *** *** *** *** *** *** ***
Hourly wages . . . . . . . . . . . . . . . *** *** *** *** *** *** *** *** ***
Productivity (tons/1,000 hours) . *** *** *** *** *** *** *** *** ***
Unit labor costs . . . . . . . . . . . . . *** *** *** *** *** *** *** *** ***
Net sales:
Quantity . . . . . . . . . . . . . . . . . . 2,053,224 1,987,806 1,738,109 799,293 1,028,327 -15.3 -3.2 -12.6 28.7
Value . . . . . . . . . . . . . . . . . . . . 1,944,652 1,941,218 1,638,035 765,846 938,850 -15.8 -0.2 -15.6 22.6
Unit value . . . . . . . . . . . . . . . . . $947 $977 $942 $958 $913 -0.5 3.1 -3.5 -4.7
Cost of goods sold (COGS) . . . . 1,679,590 1,718,204 1,469,203 688,609 859,486 -12.5 2.3 -14.5 24.8
Gross profit or (loss) . . . . . . . . . 265,061 223,013 168,832 77,237 79,364 -36.3 -15.9 -24.3 2.8
SG&A expenses . . . . . . . . . . . . 121,033 127,943 107,067 54,804 55,452 -11.5 5.7 -16.3 1.2
Operating income or (loss) . . . . 144,029 95,070 61,765 22,434 23,913 -57.1 -34.0 -35.0 6.6
Capital expenditures . . . . . . . . . 51,190 52,426 33,848 15,695 18,801 -33.9 2.4 -35.4 19.8
Unit COGS . . . . . . . . . . . . . . . . . $818 $864 $845 $862 $836 3.3 5.7 -2.2 -3.0
Unit SG&A expenses . . . . . . . . . $59 $64 $62 $69 $54 4.5 9.2 -4.3 -21.4
Unit operating income or (loss) . $70 $48 $36 $28 $23 -49.3 -31.8 -25.7 -17.1
COGS/sales (1) . . . . . . . . . . . . . 86.4 88.5 89.7 89.9 91.5 3.3 2.1 1.2 1.6
Operating income or (loss)/
sales (1) . . . . . . . . . . . . . . . . . . 7.4 4.9 3.8 2.9 2.5 -3.6 -2.5 -1.1 -0.4
(1) "Reported data" are in percent and "period changes" are in percentage points.
(2) Not applicable.
Note.--Financial data are reported on a fiscal year basis and may not necessarily be comparable to data reported on a calendar year basis. Because of rounding,
figures may not add to the totals shown. Unit values and shares are calculated from the unrounded figures.
Source: Compiled from data submitted in response to Commission questionnaires and from official Commerce statistics.
C-7

Table C-4Certain coated paper: Summary data concerning U.S. converters, 2007-09, January-June 2009, andJanuary-June 2010
* * * * * * *
C-8
APPENDIX DNONSUBJECT PRICING DATA
D-1


Weighted-average sales prices of products imported from nonsubject sources in Austria undersoldthe U.S. producers in 28 of 29 quarterly comparisons. Prices of imports from nonsubject sources inAustria undersold imports from China in 3 of 4 quarterly comparisons. Prices of imports from nonsubjectsources in Austria undersold imports from subject sources in Indonesia in both quarterly comparisons.
Weighted-average sales prices of products imported from nonsubject sources in France oversoldthe U.S. producers in all 14 quarterly comparisons. There were no quarterly comparisons betweenimports from nonsubject sources in France and imports from subject sources.
Weighted-average sales prices of products imported from nonsubject sources in Germanyundersold the U.S. producers in all 28 quarterly comparisons. There were no quarterly comparisonsbetween imports from nonsubject sources in Germany and imports from subject sources.
Weighted-average sales prices of products imported from nonsubject sources in India undersoldthe U.S. producers in both quarterly comparisons. Prices of imports from nonsubject sources in Indiaundersold imports from China in 1 of 2 quarterly comparisons. Prices of imports from nonsubject sourcesin India oversold imports from subject sources in Indonesia in 1 quarterly comparison.
Weighted-average sales prices of products imported from nonsubject sources in Korea undersoldthe U.S. producers in 42 of 54 quarterly comparisons and oversold them in the remaining 12 quarterlycomparisons. Prices of imports from nonsubject sources in Korea oversold imports from China in 21 of26 quarterly comparisons and oversold them in the remaining 5 quarterly comparisons. Prices of importsfrom nonsubject sources in Korea oversold imports from subject sources in Indonesia in 10 of 12quarterly comparisons and undersold them in the remaining 2 quarterly comparisons.
Weighted-average sales prices of products imported from nonsubject sources in Thailandundersold the U.S. producers in 5 of 6 quarterly comparisons. Prices of imports from nonsubject sourcesin Thailand oversold imports from China in 5 of 6 quarterly comparisons. Prices of imports fromnonsubject sources in Thailand undersold imports from subject sources in Indonesia in 4 of 6 quarterlycomparisons and oversold them in the remaining 2 quarterly comparisons.
Figure D-1Certain coated paper: Weighted-average f.o.b prices and quantities of domestic and subject andnonsubject imported product 1, by quarters, January 2007-June 2010
* * * * * * *
Figure D-2Certain coated paper: Weighted-average f.o.b prices and quantities of domestic and nonsubjectimported product 2, by quarters, January 2007-June 2010
* * * * * * *
Figure D-3Certain coated paper: Weighted-average f.o.b prices and quantities of domestic and subject andnonsubject imported product 3, by quarters, January 2007-June 2010
* * * * * * *
Figure D-4Certain coated paper: Weighted-average f.o.b prices and quantities of domestic and subject andnonsubject imported product 4, by quarters, January 2007-June 2010
* * * * * * *
D-3

Figure D-5Certain coated paper: Weighted-average f.o.b prices and quantities of domestic and nonsubjectimported product 5, by quarters, January 2007-June 2010
* * * * * * *
D-4
