certain machine needles - usitc · the commissiori's public report, certain machine needles...
TRANSCRIPT

CERTAIN MACHINE NEEDLE.S
Report to the President on
Investigation No. TA-201-38 ·
Under Section 201 of the Trade Act of 197 4 ;
USITC PUBLICATION 936
FEBRUARY 1979
United States International Trade Commission I Washington, D.C. 20436

UNITED STATES INTERNATIONAL TRADE COMMISSION
COMMISSIONERS
Joseph 0. Parker, Chairman.
Bill Alberger, Vice Chairman
George. M. Moore
Catherine Bedell
Paula Stern
Kenneth R. Mason, Secretary to the Commission
This report was prepared by Larry E. Reavis, Investigator
assisted by Wallace McMillen, Office of Industries
Wallace Fullerton, Office of Economic Research
John M. MacHatton, Supervisory Investigator
Address all communications to
Office of the Secretary United States International Trade Commission .
Washington, D.C. 20436

FOR RELEASE February 7, 1979
CONTACT: Hal Sundstrom (202) 523-0161
USITC 79-004
USITC UNANIMOUSLY DETERMINES MACHINE NEEDLE IMPORTS ARE NOT A SUBSTANTIAL CAUSE OF SERIOUS INJURY TO THE DOMESTIC INDUSTRY
The United States International Trade Commission today reported
to the President its unanimous determination, by a 5-to-O vote,. that
imports of machine needles are not a substantial cause of serious
injury, or the threat thereof, to the domestic industry.
Concurring in the determination were Chairman Joseph 0. Pa~ker,
Vice Chairman Bill Alberger, and Commissioners George M. Moore,
Catherine Bedell, and faula Stern.
The investigation was instituted by the Commission on August 25,
1978, under the authority of section 201 of the Trade Act of 1974,
following receipt of a petition filed by The Torrington Co., Tor-
rington, Conn.
The investigation was undertaken to determine whether needles
for machines for making nonwoven or nonknit fabrics; needles for
knitting, embroidery, and other textile machines; and needles for
sewing machines, except sewing machines designed for household
use, are being imported into the United States in such increas~d
quantities as to be a substantial cause of serious injury, or the
threat thereof, to the domestic industry producing articles like
or directly competitive with the imported articles.
more

USITC UNANIMOUSLY DETERMINES MACHINE NEEDLE IMPORTS ARE NOT A SUBSTANTIAL CAUSE OF SERIOUS INJURY TO THE DOMESTIC INDUSTRY
2
Small and made of steel, machine needles are vital parts of certain
machines used in manufacturing or decorating textiles, or in joining
textiles or other types of material together. At least four domestic
firms produce one or more types of machine needles. The largest firm,
The Torrington Co., which has needle-~ahufacturing plants in several
countries and accounts for the bulk of total U.S. production, and
the Laconia Needle Manufacturing Co., Laconia, N.H., are among the
largest importers of machine needles in the Unite States. Altogether,
approximately 200 firms imported machine needl~s in 1977. Less than
10 of these firms, including the 2 U.S. producers, account for more
than half of all imports.
Most of the imported machine needles are produced in W~st Germany
and Japan. Worldwide, excluding th~ U.S. and non-market economy firms,
there may be as many as 80 firms producing machine needles.
The domestic machine needle market consists almost entirely of
manufacturers of textiles, apparel, and other made-up textile goods.
Most of these plants are located in Southeastern States.
Total imports have decreased from their 1973 and 1974
levels. By 1977, imports fell from 413. 1 million to 366. l million
needles, or by 16 percent. Imports of latch and industrial sewing
.machine needles, which together account for the vast majority of
total imports, also decli~ed. Apparent overall consumption fell
from 724 million machine needles in 1973 to 608 million machine
more

USITG UNANIMOUSLY DETERMINES MACHINE NEEDLE IMPORTS ARE NOT A SUBSTANTIAL CAUSE OF SERIOUS INJURY TO THE DOMESTIC INDUSTRY
3
needles in 1977, while imports as a share of consumption, increased
from 57.0 percent to 60.2 percent. Consumption of individual needle
categories also fell significantly between 1973 and 1977, while im-
ports as a percentage of consumption increased moderately.
The decline in needle consumption is related to declines in
domestic apparel and textile production and to technological in-
novations in the textile machinery industry. Recessionary factors
and overexpansion have added to producers' difficulties.
The Commissiori's public report, Certain Machine Needles (USITC
Publication 936), contains the views of the Commissioners in investi-
gation No. TA-201-38. Copies may be obtained by calling (202) 523-
5178 or from the Office of the Secretary, 701 E Street, NW., Washington,
D.C. 20436.
oOo


i
C 0 N T E N T S
Report to the President---------~----------------------------------------Views of Commissioners George M. Moore and Catherine Bedell--------------Views of Chairman Joseph 0. Parker---------------------------------------Reasons for the negative determination of Commissioner Bill Alberger-----Determination of Commissioner Stern-------------------------------------Informat ion obtained in the investigation:
Surnmary---------------------------------------------------------------1 nt roduc tion----------------------------------------------------------The product:
Description and uses---------------------------------------------U. S. tariff treatment---------------------------------------------
0.S. producers-------------------------------------------------------Importers-------~------------------~---------------------------------
Foreign producers-----------------------------------------------------0. S. market-----------------------------------------------------------The question of increased imports------------------------------------The question of serious injury or threat thereof;
U.S. production, capacity~ and utilization of capacity-----------u.s. producers' shipments and exports-----------------------------Employrnent-------------------------------------------------------Inventories-------------------------------------------------------Financial p.erformance of U.S. producers--------------------------
The question of the causal relationship between increased imports and the all~ged injury:
U.S. consumption and market penetration of imports----------------Lost sales----------------------------------~--------------------Prices------------------------------------------------------------Efforts of U.S. producers to compete with imports----------------Possible causes of serious injury to the domestic industry other
than increased imports-----------------------------------------Appendix A. U.S. International Trade Commission's notice of
1 3
10 16 23
A-1 A-3
A-4 A-6 A-8 A-8
A-11 A-14 A-16
A-17 A-19 A-19 A-22 A-22
A-26 A-27 A-29 A-32
A-33
Appendix B. Appendix C. Appendix D.
investigation and hearing---------------------------------- A-35 Exhibits of certain machine needles-------------------------- A-39 Supplementary tables and figures----------------------------- A-45 Probable economic effects of Tariff changes under title I
1.
2.
and title V of the Trade Act of 1974 for Trade Agreement Digests nos. 60236 and 60237------------------------------- A-75
Tables
Certai~ machine needles: U.S. producers' shipments, by firm, 1973-77, January-June 1977, and January-June 1978---------------------------- A-9
Certain machine n~ed.les: U.S. producers' imports, by firm, 1973-77, January".'"June 1977.," and January-June 1978-·-----~-----------_: _________ A-10

ii
CONTENTS
3. r.ertain machine needles: U.S. imports for consumption, by principal sources, 1973-77, January-June 1977, and January-June 1978---------- A-12
I+. Certain nach:~ne needles: U.S. producers' shipments, imports for consumption, exports of domestic merchandise, and apparent consump-tion, 1973-77, January-June 1977, and January-June 1978------------- A-16
.'.i. Certain machine needles: U.S. production and imports for consunption, 1973-77, January-June 1977, and January-June 1978-----------------..,.,- A-18
G. Certain mac:1ine needles: U.S. production, producers' capacity, and cap::-ccity uti1izction, by firr.i, 1973-77, January-June 1977, and J nnu.qr~1-June 1978-------------------------------------..,.,-----,.-------- A-20
7. r~rtain machine needles: U.S. production, producers' capacity, and capacity utilization, by type of needle, 1973-77, January-June J077, nnd January-June 1978----------------------------------------- A-21
S. Average number of employees in U.S. establishments prod~cing certain mnchine needles, total, and all production anrl related workers eng::i.ged in the manufacture of certain machine needles, by firm, 1·')73-77, J:muary-J1me 1977, and January.,.June 1978-------------------- A-23
~. ~~n-hours worked in U.S. establishments producing certain machine nee~l~s 1)y pro<luction and related workers engaged in the manufac-ture of all products and of certain machine needles, 1973~77,
Ja::uary-June 1977, and January-June 1978---------------------------- A-23 10. Certain machine needles: U.S. producers' inventories pf U.S.-pro
cluced anc! imported machine needles, as of December 31, 1973-77, June 30, 1977, and June 30, 197 8------------------------------------- A-24
11. Certa~n uachine needles: U.S. producers' inventories of U.S.-pro-duced mac]1ine needles, by firm, as of December 31, 1973-77 Jnne 30, 1977, and June 30, 1978------------------------------------ A-24
12. Selected financial data for U.S. producers 9f certain machine needles on their U.S.-produced machine needle operations, by firm,. 1973-77, January-June 1977, and January-June 1978'."'"------------------ A-25
13. Certain machine needles: Apparent consumption, and percentage increase or decrease in apparent consumption, 1973 and 1977, January-June 1977 and J;muary and June 1978-------------------.------ A-28
14. Average weighted prices of certain U.S.-produce<l and imported machine needles, quarterly, January-March 1973 to July-Septe~>er 1978~------ A-30
15. Average unit values of certain machine needles shipped hy u~s. pro-duce!."'S and importers, 1973-77 and January-June 1978-----------,------ 1\-31
16. Certain machine needles: U.S. producers' average unit production costs and average unit selling prices for sales of U.S.-pro<luced machine needles, by firm, 1973-77 and January-June 1978------------- A-33
C-1. Feedles for felting machines: U.S. imports for consumption, by principal sources, 1973-77, January-June 1977, and January-June 1978-------------------------------------------------------------- A-46
C-2. Latch needles (for knitting machines): U.S. imports for consumption, hy principal sources, 1973-77, January-June 1977, and January-June 1978--------------------------------------------- A-47

iii
CONTENTS
C-3. Spring-heard needles (for knitting machines): U.S. imports for consumption, by principal sources, 1973-77, January-June 1977, and January-June 1978--------------------------------------------- A-48
C-4. Needles other than latch needles or spring-beard needles for knitting machines: U.S. imports for consumption, by principal sources, 1973-77, January-June 1977, and January-June 1978-------- A-49
C-5. Needles for embroidery machines: U.S. imports for consumption, by principal sources, 1973-77, January-June 1977, and January-June 1978------------------------------------------------- A-50
C-6. Needles for tufting machines: U.S. imports for consumption, by principal sources, 1973-77, January-June 1977, and January-June 1978-------------------------------------------------------------- A-Sl
C-7. Needles for industrial sewing machines: U.S. imports for consumption, by principal sources 1973-77, January-June 1977, and January-June 1978------------------------------------------------- A-52
C-8. Needles for felting machines: U.S. producers' shipments, imports for consumption, exports of domestic merchandise, and apparent consumption, 1973-77, January-June 1977, and January-June 1978---- A-53
C-9. Latch needles (for knitting machines): U.S. producers' shipments, imports for consumption, exports of domestic merchandise, and apparent consumption, 1973-77, January-June 1977, and January-June 1978--------------------------------------------------------- A-S4
C-10. Spring-beard needles (for knitting machines): U.S. producers' shipments, imports for consumption, exports of domestic merchan-dise, and apparent consumption, 1973-77, January-June 1977, and January-June 1978------------------------------------------------ A-SS
C-11. Needles other than latch or spring-beard for knitting machines: U.S. producers' shipments, imports for consumption, exports of domestic merchandise, and apparent consumption, 1973-77, January-June 1977, and January-June 1978--------------------------------- A-56
C-12. Needles for embroidery machines: U.S. producers' shipments, imports for consumption, exports of domestic merchandise, and apparent consumption, 1973-77, January-June 1977, and January-June 1978-------------------------------------------------------- A-S7
C-13. Needles for turfting machines: U.S. producers' shipments, imports for consumption, exports of domestic merchandise and apparent consumption, 1973-77, January-June 1977, and January-June 1978--- A-S8
C-14. Needles for industrial sewing machines: U.S. producers' shipments, imports for consumption, exports of rlomestic merchandise, and apparent consumption, 1973-77, January-June 1977, and January-June 1978------------------------------------------------------~- A-59

To the President:
United States International Trade Connnission, February 7, 1979.
REPORT TO THE PRESIDENT
In accordance with section 20l(d)(l) of the Trade Act of 1974 (19 U.S.C.
225l(d)(l), 88 Stat. 1978), the United States International Trade Connnission
herein reports the results of an investigation relating to certain machine
needles.
On the basis of the information developed in investigation No. TA-201-38
the Connnission 1/ unanimously determines that needles for machines for making
nonwoven or nonknit fabrics; needles for knitting, embroidery, and other
textile machines; and needles for sewing machines, except sewing machines
designed for household use; provided for in items 670.35; 670.58, 670.60,
670.62, 670.64, and 670.74; and 672.20 of the Tariff Schedules of the United
States (TSUS), are not being imported into the United States in such increased
quantities as to be a substantial cause of serious injury, or the threat
thereof, to the domestic industry producing articles like or directly competi-
tive with the imported articles.
The Commission instituted this investigation under the authority of
section 20l(b)(l) of the Trade Act on August 25, 1978, following receipt on
August 7, 1978, of a petition filed by the Torrington Co., Torrington, Conn.
The investigation was undertaken to determine whether needles for machines
for making nonwoven or nonknit fabrics; needles for knitting, embroidery, and
other textile machines; and needles for sewing machines, except sewing machines
designed for household use; provided for in TSUS items 760.35; 670.58, 670.60,
670.62, 670.64, and 670.74; and 672.20, are being imported into the United
1__/ Chairman Joseph 0. Parker, Vice Chairman Bill Alberger and Connnissioners George M. Moore, Catherine Bedell, and Paula Stern.

2
States in such increased quantities as to be a substantial cause of serious
injury, or the threat thereof, to the domestic industry producing articles
like or directly competitive with. the imported articles.
A public hearing in connection with the investigation was held in the
Commission's hearing room in Washington, D.C., on November 20 and 21, 1978.
All interested persons were afforded the opportunity to be present, to produce
evidence, and to be heard. A transcript of the hearing and copies of briefs
submitted by interested parties in connection with the investigation are
attached. 1./ Notice of the investigation and hearing was duly given by publish-
ing the notice in the Federal Register of August 31, 1978 (43 F.R. 38949).
The information contained in this report was obtained from fieldwork,
from questionnaires sent to domestic producers and importers, and from the
Commission's files, other Government agencies, and information presented at
the hearing and in briefs filed by interested parties.
1_/ Attached to the original report sent to the President, and available for inspection at the U.S. International Trade Commission, except for material submitted in confidence.
3
VIEWS OF COMMISSIONERS GEORGE M. MOORE AND CATHERINE BEDELL
The present investiga~ion, conducted under section 201 of the Trade Act
of 1974 (19 U.S.C. 2251), was instituted by the United States International
Trade Commission on August 25, 1978, to determine whether certain machine
needles,. \>.rovided.for in items 670.35; 67_0.-58, 670.60, 670.62, 670.64, and
670.74; and 672_.20 of th~ T~ri~f Schedules of th~ United States (TSUS), are
being imported into the. United State~ in such i~creased quantities as to be a
substantial cause oJ seriou_s injury, or the threat thereof, to the domestic . . . . .
industry pr,oduci~g an article like or directly competitive with the imported
article •. ·,. ·- .
The Trade Act of 1974 requires that each of following conditions be met
before an affirmativt;!: ~etermina_tion can be made:
(1) There are .increased imports (either actual or relative to domestic productioni o~ an artici~ into the United States;
(2) A domestic industri produ~ing an article like or directly competitive with the imported article is seriously injured, or 'threatened with serious injury; and
(3) Such increased imports of ari article are a substantial cause of serious injury, or the threat thereof, to the domestic industry producing an article like or directly competitive with the imported article.
Determinat.ion
After considering the information obtained in this investigation, we have
determined that increased imports are not·a substantial cause of serious
injury, or the threat of serious injury, to the domestic industry producing.
machine needles which are 11.ke or directly coinpetitive with the imported
articles under investigation~

4
The domestic industrx
In determining what con~titutes the domestic industry, it is generally
appropriate to follow a product-line approach--that is, to consider that each
product line const.itutes a domestic industry. In the present case we are of
the view that the various types of machine needles manufactured by domestic
producers constitute one product line, and we therefore conclude that the
domestic industry producing articles like or directly competitive with the
imported articles consists of the facilities, or appropriate parts thereof, of
the four domestic firms producing machine needles. The Torrington Co.,_ the
petitioner, is the largest of the four domestic producers. The other three
domestic producers are Arrow International. Inc., Laconia Needle Manufacturing
Co., and Foster Needle Co. Torrington is a wholly owned subsidiary of
Ingersoll-Rand Co., and Laconia is owned largely by Theo. Groz & Sohne and
Ernst Beckert (Groz-Beckert), GmbH, of West Germany.
In finding that there is one domestic machine neeqle industry, we note
that several types of needles are often produced in the same plant by workers
employing similar skills. We also find that the domestic firms which produce
more than one type of needle do not maintain separate employment or financial
data for the different types, apparently because they consider all their
machine needles to be the same basic type of product.
Incre~sed imports
Under section 20l(b){2)(C) of the Trade Act of 1974, the requirement of
increased imports is satisfied if the actual quantity of imports has increased
or if the level of import$ is increasing relative to domestic production.

5
In actual terms, imports of machine needles of the type under
investigation appear to be declining. Imports declined considerably between
1973 and 1975 and increased moderately between 1975 and 1977 to a level which
was still 11 percent below the 1973 level. Imports during January-June 1978
were slightly higher than imports during the corresponding period of 1977, but
were still below the level of the corresponding period of 1973. The. ratio of
imports to U.S. production of all needles, however, shows an increase from
121.3 percent to 143.5 percent over the period 1973-77. This growth was not
s_teady, but the trend is definitely upward. Furthermore, this increase is
also evident in each separate product type with the exception of needles for
knitting machines other than latch.or spring-beard needles. Thus, the
statutory requirement that there are increased imports is satisfied.
Serious injury ·
The second criterion concerns the question of whether. the domestic
industry is suffering "serious injury or the threat thereof." The Trade Act
does not define the term "serious injury" but instead provides guidelines in
the form of economic factors which the Commission is to take into account.
Under section 20l(b)(2), the Commission is to take into account "all economic
factors which it considers relevant, including (but not limited to) • • • the
significant idling of productive facilities in the· industry, the inabililty of
a significant number of firms to operate at a reasonable level of profit, and
significant unemployment or underemployment within the industry • "
Producfion.--U.S. production of machine needles dropped from 341 million
needles in 1973 to 212 mii°lion needles in 1975 and grew to only 262 million
needles in 1976 before dropping again in 1977 to 255 million needles. Data on

6
production in January-June of 1978 indicate that production for the year will
still be substantially below the 1973 level. The greatest declines in
production have come in latch needles and in needles for industrial sewing
machines, which account for the vast majority of U.S. machine needle
production.
Capacity.--Capacity has remained relatively constant since 1974 in all
but one of the categories of needles under investigation, declining somewhat
in 1977 and January-June 1978 as one firm relocated production to other
countries and scrapped some machinery. As a re~ult of the relatively constant
level of capacity, cap~c ity utilization has followed .the level of production
closely, falling sharply from 1973.through 1975 and rising in 1976, 1977, and
in January-June 1978. In January-June 1978, at an annual rate, however, it
was still substantially below the levels achieved in 1973 and 1974.
Financial health.--Data provided by the domestic firms show declining
profits. Torrington has shown overall net operating losses on its machine
needle operations in each year since 1973. Laconia has remained consistently
profitable in its machine needle operations throughout the period, but
although its profit pattern has been erratic, it has generally trended
downward since 1973. Arrow did not provide data on its net profits on machine
needles, but the trend for gross profits on machine needles before selling and
administrative expenses has been down since 1973.
Employment.--Employment in the industry declined sharply in 1975 and has
not yet recovered. The average number of production and related workers
producing machine needles dropped from 1,629 in 1973 to a low of 1,068 in 1977
and reached only a slightly higher level in January-June 1978. Man-hours

7
worked in producing machine needles also dropped by 33 percent from 1973 to
1977.
In view of the above, we have found that the domestic machine needle
industry has experienced significant idling of production facilities and
significant unemploym·ent, and Torrington, its dominant producer, has incurred
consistent operating losses on its machine needle operations, while Arrow and
Laconia also appear to have experienced a decline in profits. Consequently,
we have found that the serious injury criterion is satisfied.
Substantial cause
When the above two statutory criteria are met, the Trade Act requires the
Conunission .to examine the statutory requirement relating to the question of
whether increasing imports are a substantial cause of serious injury to the
domestic industry. Section 20l(b)(4) of the Trade Act defines the term
"substantial cause" to mean "a cause which is important and not less than any
other cause.'1 Thus, increased imports must be both an "important" cause of
injury and ~'not less than any other cause."
In determining whether increased imports are a substantial cause of
injury to the domestic machine needle industry, we have considered several
other possible causes of injury. Among these are (1) declining U.S.
consumption of machine needles; (2) the transfer of production by domestic
machine needle producers to foreign facilities; and (3) changes in machine
needle technology and suggestions that domestic producers have not kept up ·
with such changes. After cpnsidering each of these possible causes (including
increased imports), we have concluded that increased imports are not a
substantial cause of serious injury, or the threat thereof, to the domestic

8
industry within the meaning of the Trade Act of 1974. More specifically, we
have concluded that the decline in consumption of machine needles is a more
important cause of serious injury, or the threat thereof, than increased
imports--that is, that the increase in machine needle imports, whether
measured in the aggregate or with respect to any one type, is not sufficient
to equal or outweigh the decline in domestic machine needle consumption as the
most important cause of serious injury, or the threat thereof, to the domestic
industry.
As noted above, imports of machine needles trended downward in actual
terms during the past ~ years but trended moderately upward in terms of the
ratio of imports to production. However, imports as measured in terms of
market share have remained almost constant in recent years. .The ratio of
imports to consumption was 57.0 percent in 1973, 60.8 percent in 1974, 57.8
percent in 1975, 58.8 percent in 1976, and 60.2 in 1977. This ratio was 60.4
percent in January-June 1977 and 61.4 percent in January-June 1978.
Domestic consumption of machine needles fell by 16 percent between 1973
and 1977, from 724 million needles to 608 million needles; both domestic
production and imports of machine needles also fell during this period. There
are three basic reasons for this drop in consumption. First, there has been a
decline in recent years in domestic textile and footwear production, and
textile and footwear producers are by far the most important consumers of
machine needles. Second, technological improvements have increased the
longevity of many types of needles, permitting textile and footwear producers
to manufacture more of an article with a given quantity of needles. And
third, a decline in demand for knit fabrics and an increase in demand for

9
woven fabrics has resulted in a declin~ in consumption of knitting machine
needles. Knitting machine needles account for more than SO percent of
domestic machine needle production, and consumption of such needles declined
by about 20 percent between 1973 and 1977.
Conclusion
Thus, we have concluded that increased imports of machine needles are not
a substantial cause of serious injury, or the threat thereof, to the domestic
machine needle _industry.

10
Views of Chairman Joseph O. Parker
The present investigation was instituted on the basis of a complaint
filed by The Torrington Co., Torrington, Conn., to determine if certain
machine needles, provided for in items 670.35; 670.58, 670.60, 670.62,
670.64, and 670.74; and 672.20 of the Tariff Schedules of the United
States, are being imported in such increased quantities as to be a
substantial cause of serious injury, or the threat thereof, to the
domestic industry producing articles like or directly competitive with
the imported articles.
Domestic industry
In making a determination under section 201, it is necessary to
consider the domestic industry or industries producing articles like or
directly competitive with the imported articles. There are five basic
types of imported ne~dles under consideration in the present investigation:
(1) needles for industrial/commercial sewirl.g machines; (2) needles for
knitting machines; (3) needles for embroidery machines; (4) needles for
tufting machines; and (5) needles for felting machines. Since the functions
and designs of each of the 5 types of needles are distinctly different
from each of the other types, they are not commercially interchangeable.
Domestic producers do not produce any of these five types of needles on
the same machinery, nor is such machinery readily convertible to the
production of a different kind of needle. Several firms produce only
one kind of needle, although Torrington, the largest manufacturer,
produces each of the five types. Whether the production facilities
devoted to the production of these needles are considered as five separate
domestic industries or as one domestic industry, the information obtained

11
in this investigation does not establish that whatever injury is being
suffered is substantially caused by imports.
Injury
Four firms currently produce one or more types of needles under
investigation. The Torrington Co., the petitioner and the only domestic
producer to appear at the hearing in support of its petition, accounts
for all domestic production of industrial sewing, tufting, and embroidery
needles and a large proportion of domestic production of knitting and
felting needles. Torrington reported to the Commission, however, that
it does not keep separate accounting data on the different types of
needles under investigation~ Therefore, the information with respect to
injury or threat of serious injury to Torrington must be examined on a
total needles basis, rather than with respect to the various types of
needles. Laconia Needle Manufacturing Co. testified that it was not
being injured by increased imports, and Arrow International, Inc. and
Foster Needle Co. did not provide the Commission with information which
was specific enough to make a definitive determination of injury with
respect to these firms.
The Torrington Co. experienced decreasing capacity utilization from
1973 to 1975 and then increasing capacity utilization from 1976 through
January-June 1978. The increase in capacity utilization in 1977 and
January-June 1978 was primarily the result of consolidation of some of
its operations in 1977. Its production, shipments, and total sales of
needles generally followed a similar trend, declining from 1973 to 1975
and recovering somewhat thereafter. The Torrington Co. reported that it
had experienced a profit on its needle operations in only 1 year since

12
1972. The number of production and related workers employed by Torrington
in the production of machine needles declined from 1973 to 1977. There
was, however, an increase in such employment at Torrington in January
June 1978. The ratio of Torrington's inventories to shipments increased
from 1973 to 1975 and declined steadily thereafter.
Laconia Needle Manufacturing Co., which manufactures only knitting
needles, experienced fluctuating production and capacity utilization
from 1973 to 1977. Its sales increased slightly over this period and,
despite considerable fluctuation, it remained profitable. Employment
declined from 1973 to 1977 and January-June 1978, and Laconia's inventories
of needles declined moderately throughout the period. In its testimony
before the Commission, Laconia stated that it was not suffering serious
injury or threatened with serious injury. !./
Arrow International Inc., which manufactures both knitting and
felting needles, experienced declining capacity utilization from 1973 to
1975. Thereafter, its capacity utilization increased, and in January
June 1978, it was higher than at any other time in the previous 5 years.
Arrow's production, shipments, and employment declined from 1973 to 1975
and increased somewhat thereafter. However, the company did not provide
the Commission with profit-and-loss information.
Foster Needle Co., which manufactures only felting needles, provided
no information to the Commission except estimates of its shipments, and
production which indicate increasing shipments from 1973 to 1977.
From the above, it may be seen that there are indications that The
Torrington Co. may be suffering serious injury within the meaning of
1/ Transcript of the hearing, Nov. 20, 1978, p. 133.

13
section 201. However, other nee4le-producing firms seemed to have fared
better: Laconia testified that it is not being injured, and information
with respect to the two remaining domestic companies does not indicate
serious injury. In my judgment, whether or not the domestic industry or
industries are suffering serious injury, or a threat of serious injury,
it is clear that increased imports are not a substantial cause of whatever
injury is being suffered.
Substantial cause
Pursuant to section 20l(c)(4), the term "substantial cause" is
defined as a cause which is important and not less than any other cause.
The information in this investigation clearly establishes that the
decline in apparent consumpt~on of needles is a greater cause of any
injury than increased imports.
Consumption of all types of machine needles under investigation
fell from 724 million needles in 1973 to 608 million in 1977, or by 16
percent. This decline is primarily the result of declines in domestic
production of textiles and textile products and footwear.
There are two major kinds of knitting needles consumed in the
United States, latch needles and spring beard needles. Consumption of
both categories of needles declined sharply from 1973 to 1977, During
this period, however, the share of apparent consumption accounted for by
imported latch needles and spring beard needles increased far more
gradually. Domestic producers, particularly Torrington and Laconia,
accounted for a large quantity of total imports of latch and spring
beard needles in the period 1973-77.
The same pattern exists with respect to industrial sewing machine
needles, the second largest type of needle consumed domestically which,

14
together with knitting needles, account for the vast bulk of apparent
U.S. consumption of machine needles. Apparent consumption of these
sewing machine needles declined sharply while the ratio of imports to
consumption increased only gradually. The share of apparent
consumption accounted for by imports by U.S. producers more than doubled
from 1973 to 1977 and continued to increase in 1978. Imports· by firms
which do not produce needles declined in both actual terms and relative
to domestic consumption in this period •. The largest growth in imported
sewing machine needies during the years 1973-77 was in those from Portugal.
Torrington is the only known producer of such needles in Portugal.
Thus, it is clear that, to the limited extent imports have replaced
domestically produced :Lndustrial ~ewing machine needles, it is the
result of imports by domestic producers.
The ratio of imports to consumption of felting needles was lower in
1977 than in any year since 1973. Imports of felting machine needles by
U.S. producers have increased sharply since 1974, while imports by all
others have decreased. With respect to embroidery needles, domestic
production was relatively insignificant in the last 5 years and the
ratio of imports to consumption increased only.marginally during this
period. Domestic production of tufting machine needles was also relatively
insignificant in the period covered by the Commission's investigation.
The ratio of imports of tufting machine needles to domestic production
has not changed significantly since 1975 and actually decreased in
January-June 1978 to a level below that of 1975 levels.
The pricing data obtained by the Commission in this investigation
were based on a small nonrandom sample of producers' and importers'
prices and cannot be used to definitively determine pricing relationships

15
between the two. In addition, the average weighted price information
obtained conceals a broad range of prices among various types of needles.
However, the information does offer some indication that domestic
producers' prices generally kept pace with U.S. producers' costs in the
period 1973 to 1977.
Conclusion
On the basis of this information, I have determined that the needles
of the types under investigation have not been imported in such increased
quantities as to be a substantial cause of serious injury, or the threat
thereof, to the domestic industry or industries producing like or directly
competitive products.

16
REASONS FOR THE NEGATIVE DETERMINATION OF COMMISSIONER BILL ALBERGER
On the basis of information obtained in this investigation, I deter-
mine that certain machine needles of the types described in the notice are
not being imported into the United States in such increased quantities as
to be a substantial cause of serious injury, or the threat thereof, to the
domestic industry producing the like or directly competitive products.
The Trade Act of 1974 (Trade Act) requires that each of the following
conditions be met before an affirmative determination can be made:
(1) There are increased imports (either actual or relative to the domestic production) of an article into the United States;
(2) A domestic industry producing an article like or directly competitive with the imported article is seriously injured, or threatened with serious injury; and
(3) Such increased imports of an article are a substantial cause of serious injury, or the threat thereof, to the domestic industry producing an article like or directly competitive with the imported article.
Specifically, I find that the third criterion under Section 20l(b)(l),
as set forth above, has not been met -- increased imports are not a substantial
cause of serious injury or the threat thereof to the domestic industry as
defined below.
The Domestic Industry
For the purposes of this investigation, I consider the relevant domestic
industry to include all those facilities in the United States producing
machine needles like or directly competitive with those described in the
notice.

17
Of the four firms which account fo~ all domestic production,
only one, the petitioner, the Torrington Co. (Torrington), produces all
the needles covered. Counsel for Torrington urged the Commission to
consider the industry in its broadest sense, rather than breaking it into
four or five distinct industries (which is also a valid approach given the
special characteristics and uses of each needle). I have chosen to use
the broader definition since domestic firms producing more than a single
type of needle do not maintain separate employment and financial data for
each type of needle. My conclusions about injury and causation would be
the same under either approach.
Increased Imports
While imports of all machine needles under investigation have risen
from 1975 through the first 6 months of 1978, they continue to run below lev
els attained in either 1973 or 1974. The overall quantity of imports dropped
from 1973 through 1975 before beginning a gradual climb that has continued
into 1978. In terms of the statute, imports have not actually increased,
but the Commission must look further to determine whether imports have
increased relative to domestic production.
From 1973 through the first half of 1978, the ili1port to production ratio
has increased from 121.3 percent to 138.9 percent. This growth in the import
to production ratio occurs in all product lines with the exception of needles
for knitting machines other than latch or spring-beard. Thus, the require
ments of the statute are met. Imports have increased relative to domestic·
production.

18
Serious Injury
The Trade Act does not define the tenn "serious injury" but does provide·
guidelines in the form of economic factors. Under Section 20l(b)(2) the
Commission is to take into account "all economic factors which it considers
relevant, including (but not limited to) -- ... the significant idling of
productive facilities in the industry, the inability of a significant number
of firms to operate at a reasonable level of profit, and significant unemploy-
ment or underemployment within the industry. II
In addition, I have considered production, shipments, consumption,
inventories and prices as relevant economic factors in arriving at my deter
mina.tion.
Capacity utilization and production -- The behavior of these two factors
are parallel during the period 1973-78. This is due largely to the relatively
stable capacity of the industry since 1974. Both production and utilization
figures were at their peak in 1973, before dropping significantly through
1975. Although these levels have improved somewhat in 1976, 1977 and the
,first half of 1978, neither production nor capacity utilization have returned
to the 1973 levels.
Profit -- Torrington, the major U.S. producer, has not shown a net
operating profit since 1973. This runs in contrast to at least one smaller
U.S. producer, Laconia Needle Manufacturing Co. (Laconia), which has shown
operating profits since 1973. Net operating profits for Laconia and gross
profits for Arrow, however, have exhibited downward trends in recent years
with Laconia's being on the decline since 1976 and Arrow's having been on
the wain since 1973.

19
Employment -- Employment in the industry followed a pattern of steady
decline from 1973 through 1977. The average number of all employees dropped
by over 30 percent and although there was a· slight upswing in employment
in January-June 1978, employment levels are well below 1973 levels.
Shipments and consumption From 1973 through 1977, shipments by all
U.S. producers and consumption of all machine needles declined 20 and 16 per
cent respectively. These declines are, in large part, attributable to
a decline in domestic apparel and textile production and technological
innovations.
Inventories -- Actual year-end inventories for U.S. producers dropped
steadily from 1974 through the first six months of 1978. As a portion of
annual shipments, this downward trend began in December, 1975,and continued
through the first six months of 1978. By the end of June 1978, the
inventory/yearly shipments ratio was some 21 percentase points below
December, 1975, levels.
Prices ~- The pricing data obtained by the Commission is inadequate for
a thorough comparative analysis. However, the information that was obtained
indicates the average selling price and production cost of U.S. produced
machine needles increased at about the same rate between 1973 and 1977. This
amounts to nearly 30 percent in both instances.
Summary -- The economic indicia, for the most part, were highest in
1973, reached lows in the recession year, 1975, and recovered slowly in
1976, 1977 and the first half of 1978. Save for the petitioner, U.S. p~o
ducers are showing profits. Production, capacity utilization, and shipments
figures are up from 1975 but still below 1973 levels. Employment, though

20
up in 1978, remains substantially below 1973 levels. Inventory levels have
been irregular during the period. This is a close call for me, but, on
balance, I believe the serious injury standard is met. However, I must say
this industry appears to be making a limited recovery and the injury should
abate if current trends continue.
Substantial Cause
Section 20l(b)(4) of the Trade Act defines the term "substantial cause"
to mean "a cause which is important and not less than any other cause." Thus,
increased imports must be both an "important" cause of injury and "not less
than any other cause." Section 20l(b)(2) further provides that, in determin
ing "substantial cause", the Commission "shall take into account all economic
factors which it considers relevant, including (but not limited to). . an
increase in imports (either actual or relative to domestic production) and a
reduction in the proportion of the domestic market supplied by domestic
producers."
The fact that imports have not increased in actual terms but have
increased relative to domestic production has been established. In addition,
the evidence in this investigation shows that portion of the market supplied
by domestic producers has dropped. slightly from 43 percent in 1973 to 40 per
cent in 1977. However, in spite of these facts, I cannot escape the conclusion
that the 16 percent drop in overall machine needle consumption was a more
substantial cause of injury than increased imports.
A drop in domestic apparel consumption and textile production bears a
direct relationship to the market for machine needles. The increasingly
strong competition in textile imports from developing nations and the decline

21
in apparel consumption attendant to the recession in 1974-75 played the
major roles in the drop of machine needle consumption.
Evidence of the effect the decline in consumption by user industries
had on the machine needle market is manifested in the sharp drop in consump
tion of latch needles and industrial sewing needles which account for the
vast majority of the market. While this sharp drop was occurring, imports
were only able to increase their share of consumption by 4 percent for
latch needles and less than 10 percent for industrial sewing needles.
Technological innovations in textile machinery have also contributed
to the condition of the domestic industry. The machinery now uses higher
quality needles which last longer, thus reducing demand for replacement
needles. The Commission has some indications of quality problems with certain
domestically produced needles. In addition, a good deal of the mar~ advanced
machinery and needles used therein are of foreign manufacture. When replace
ment needles are needed for these machines most users return to the same
foreign manufacturer, further exacerbating the industry's situation.
The domestic industry itself plays a major role in imports of machine
needles. Torrington and Laconia have accounted for a large portion of total
machine needle imports since 1973 and are among the largest importers of
needles in the United States. Torrington produces abroad for importation
into the United States as well as.foreign consumption. Laconia is a substan
tially owned subsidiary of Groz-Beckert, the largest producer of knitting
needles in Europe.
In 1973, at a time that domestic capacity utilization was 82 percent,
U.S. producers' imports of latch needles were at their highest levels for
the years 1973 through 1977. Thus, it appears that the domestic industry
was unable to satisfy demand at that time solely from facilities located in

22
the United States. As demand declined to its lowest level in 19.75, producer
imports plummeted by more than 50 percent. However, as demand for latch
needles increased from 1975 to 1977_, shipments· of producer imports more
than doubled the modest gains of domestically produced needles reported in
1976 and 1977. Furthermore, although shipments of the domestic product
grew only modestly in the first six months of 1978,. producers' imports
increased substantially. Other importers entered fewer latch needles in
1978 than in the corresponding period of 1977.
With regard to industrial sewing needles, U.S. producers' imports
nearly doubled from 1973 to 1977 while shipments of U.S. produced needles
declined erratically for the same time frame. In addition, it appears that
in 1978 imports by U.S. producers will exceed their 1977 levels. Imports by
others have declined by 24 percent from 1973 and are apparently declining
further in 1978. The only growth to be found is in imports from Japan and
Portugal. The only known producer of needles in Portugal is The Torrington
Company.
From this discussion, there appear to be several possible causes of
serious injury to the domestic machine needle industry. Of these, the sharp
decline in consumption emerges as the most important cause. Therefore, I
do not find that increased imports are a substantial cause of serious injury,
or the threat thereof, to the domestic industry.

23
DETERMINATION OF COMMISSIONER STERN
Having considered all of the infonnation before me in this in
vestigation, I have determined, pursuant to the standards set forth in
Section 10l(b) of the Trade Act of 1974, t~at imports of machine needles . .
are not "being imported into the United States in such increased quanti-. .
ties as to be a· substantial cause of serious injury, or ·threat thereof"
to the industry in the United States producing machine needles. In the ,•
process oi making ~his det~rmination, I found that imports of machine
needles have act'uall'y declined in terms of quantity, while increasing
only moderately relative to domestic production. I have also found that
the domestic. industry, particularly.the petitioner, The Torrington Company . .
(Torrington), is suffering serious injury. However, in my opinion the
substantial cau.se of injury or threat of injury to the machine needles in
dustry is not imports, but the declin.e in domestic demand for machine ...
needles, resulting primarily from .. a ge.neral decline in U.S. production
of textiles and nonrubber footwear.
The Domestic Industry
There are four firms in the domestic industry: Torrington, Laconia
Needle Manufacturing Co. (Laconia), Arrow International, Inc. (Arrow),
and Foster Needle Co. (Foster). Torrington, a subsidiary of Ingersoll-Rand
Co., is the only producer of all.of the types of needles. under investigation
and has accounted for the bulk of all machine needle production in the
United States since 1973. Torrington produces the entire U.S. outp~t of
industrial sewing, tufting and embroidery machine needles, and is a major
producer of needles for felting and knitting machines. (Knitting machine

24
needles include latch and spring beard needles as well as the category
"other knitting needles. 11) Torrington also operates its own needle
production facilities overseas and is a substantial importer. Laconia,
a subsidiary of Theo. Groz and Sohne & Ernst Beckert, GmbH (Groz-Beckert),
a large West German machine needle produ~er, produces only knitting ma
chine needles and also imports .substantial quantities of these neeoles
from ~roz-Beckert. Arrow produces needles for knitting ~nd felting ma
chines, and Foster, the smallest of the firms, produces only felting
machine needles.
There a~e several different categories of mqchine needles and
within each category of machine needles there are hundreds or thousands
of varieties. The question, therefore, arises whether the producers of
machine needles should be treated as q single domestic industry or several
distinct industries. Torrington contended that production of the various
types of needles utilizes similar capital equipment, raw materials, and
labor skills and many similar production processes. Opponents of the pe
tition argued that each category of machine needles represents a separate
industry, pointing to differences in use, physical characteristics, dis
tribution systems and inventory requirements.
Data was available for imports, shipments and production for each
category of machine needles under investigation. I found that review of
machine needles by individual category, when such data was available, pro
vided a clearer understanding of whether imports had actually increased
in quantity or relative to domestic production and whether increased im
ports constituted a substantial cause of serious injury. However,

25
Torrington, which is clearly the dominant domestic producer, does not
maintain separate data on profits and employment. In addition, available
figures for domestic capacity utilization were based on a hypothetical
product mix. As a result, in the final analysis, the available data
dictated that all the machine needles under investigation be treated as
a single domestic industry.
Increased Impor~s
Imports of machine needles declined from a peak of nearly 417 mil
lion in 1974 to 277 million in 1975. (In the base year 1973, imports
were 413 million needles.) Alt.hough imports have increased since 1975,
through the first half of 1978 they are still less than the 1974 level.
Similarly, ~ pattern of decli~e and partial incre~se was also found for
latch needles and industrial sewing machine needles which, together, ac
counted for the vast majority of annual total machine needle imports since
1973, as well as for felting, spring beard needles and the category known
as "other knitting machine needles."· Import figures from 1973 through
the first half c:if 1978 for embroidery and tufting machines show a gradual
increase, but these two categories account for a very sma 11 proportion of
total imports.
In contrast with the actual decline of needle imports as a whole
from 1973 through the first half of 1978, imports have increased relative
to domestic production of machine needles generally over the period of
1973-19j7, from 121.3% to 143.5% and to 138.9% in the first half of 1978.
This relative increase occurred for each product type, except "other
knitting needles."

26
Serious Injury
To determine serious injury, Section 20l(b)(2) of the Trade
Act requires that "the Commission shall take into account all economic
factors which it considers relevant, including (but not limited to) -
"(A) with respect to serious rnJury, the significant idling of productive facilities in the industry, the inability of a significant number of firms to operate at a reasonable level of profit, and significant unemployment or underemployment within the industry;
·"B) with respect to threat of serious injury, a decline in s·ales, a hiqher and growing inventory, and a downward trend in production, profits, wages, or employment (or increasing underemployment) in the domestic industry concerned; 11
Before reviewing these economic factors, however, it is important
to note that Laconia argued vigorously that neither it, nor the U.S.
industry as a whole, has been injured. Laconia explained that it had
earlier reassessed product requirements and recognized that it had to pro-
duce better quality knitting needles. It rebuilt old equipment and pur-
chased new; retrained supervisors, foremen and operators; and instituted
an extensive quality control program. Laconia emphasized that this reorga
nization was accomplished with private capital obtained on its own credit.
In fact, Commission data indicates that Laconia has remained more profitable
than Torringtcn, its major domestic competitor in the knitting machine
needle industry.
The available data for Foster, the smallest domestic producer,
which only manufactures felting needles, tends to support Laconia's position.
Foster did not provide data on profitability, capacity utilization or

27
employment. However, its shipments have increased. ~harply since 1973,
and as a result, its share of the total U.S. market in felting needles
has increased sharply as well.
Torrington, however, is experiencing serious injury. Accordingly,
in considering the statutory indices of injurY·to the entire U.S. industry,
it should be remembered that the figures reflecting the bad health of
the dominant producer, Torrington, have affected the data for the en:tire
industry.
The Commission received information indicating that during the period
of 1973 .through the first ha 1 f of 1970, the production capacity of Arrow
remained virtually constant while Laconia's and Torrington's capacity
dropped slightly. Actual production dropped significant)y for aJl three
firms in 1975~ ~ost significantly fdr Torrington. Actual production in
creased from 1975 levels for all three firms during 1976 and 1977, although
none of the firms returned to the peak 1974 levels. Arrow, however, has
returned to the 1974 level of production during the first six months of
1978. Consequently, taking the three producers' data as a whole, the figures
for capacity utilization (the ratio of actual production to production
capacity) from 1973 through the first half of 1978 show a pattern of decline
and partial recovery. Thus, capacity utilization during the first half of
1978 was the highest since 1974, but still 12% below 1974 levels.
Analysis of capacity utilization for different needle types reveals
that latch needles experienced a similar pattern of decline and partial
recovery, but capacity uti 1 ization for industria 1 sewing machine needles

28
showed far worse results, falling by nearly half from 1973 to 1977 and
falling still further during the first half of 1978. . . .
Data provided by the domestic firms painted a picture of declining
profit. Torrington has shown overall net operating losses for each year
since 1974. ·Laconia has remained consistently.profitable throughout the
period, but its pattern of profits has been erratic. Arrow did not pro-.
vide data on net profits, but the trend for gross profits b~fore selling
and administrative expenses has been down since 1973.
Similarly, employment patterns for Torrington, Arrow and Laconia
declined from peak years of 1973 and 1974 but recovered -- albeit moderately
-- by the first half of 1978.
In sum, the domestic machine needle industry has experienced
idling of production facilities and unemployment, and Torrington, its
dominant producer, has incurred consistent operating losses while Arrow
and Laconia also appear to have experienced financial declines. Consequently,
the industry undoubtedly is suffering serious injury.
Substantial Cause
But the question remains whether imports are a substantial cause
of serious injury to the industry. Section 20l{b)(4) of the Trade Act of
1974 defines the term "substantial cause" to be both an "important" cause
of injury and "not less than any other cause." Section 20l(b)(2){C)
further provides that, in determining "substantial cause," the Commission
"shall take into account all economic factors which it considers relevant,
including (but not limited to) ... an increase in imports (either actual

29
or relative to domestic production) and a decline in the proportion of
the domestic market supplied by domestic producers."
As previously noted, imports of machine needles as a whole
actually declined, while increasing relative to domestic production. In
addition, market share served by domestic production has been reduced.
The ratio of imports to domestic production of all machine needles has
increased from 121 .3% in 1973 to 143.5% in 1977 and 138.9% in the first
half of 1978. The share of the domestic market supplied by domestic
production declined from 43.0% in 1973 to 39.8% in 1977 and 38.6% in
the first six months of 1978. Relative increases in imports and decreased
market shares for domestic production were found for a·ll categories of
machine needles, except the category "other knitting machine needles. 11
However, as I noted at the outset, I have concluded that the
decline of domestic demand for machine needles, primarily resulting from
a decline in U.S. textile and footwear production, is the most important
cause of injury. In short, increased imports are not a "substantial cause"
of injury under the statute. This point can be demonstrated by looking
at several different needle types.
During 1973-1977, the volume of domestic production of knit yard
goods and knit garments, excluding hosiery, decreased by 16%, and declined
still further in the first half of 1978. The combined impact of increased
textile imports, the 1975 recession and changing consumer tastes created
this highly significant decline in the knitting industry which is the
major consumer of knitting machine needles. Furthermore, improved needle
technology has produced more durable needles thereby reducing needle con
sumption on a per-item, per-pound and per-hour basis. As a result, U.S.

30
production of knitting machine needles declined by over 21% in the
period 1973-1977, although it increased somewhat in the first half of
1978.
Declining domestic demand also affected domestic production
of industrial sewing machine needles. The Singer Company, a major in
dustrial sewing machine needle importer, provided data indicating that
the trend in U.S. demand for industrial sewina machine needles was directly
linked to economic activity in the U.S. apparel and nonrubbe1 footwear
producing industries, which respectively consume approximately two-thirds
and 25% of thes~ needles. Singer's data also showed that, while imports
of apparel increased 35% from 1974 to 1977 and increased still further
during the first eight months of 1978 (1973 data was not provided), domestic
production of most major apparel products declined or remained stagnant,
and overall employment in the apparel industry declined by over 10% between
1973 and the first eight months of 1978. In this same period, production
in the footwear industry, which is relatively more important to the U.S.
needle industry than to its foreign competitors, declined even 111ore
almost 20%. Naturally, as the apparel and footwear industries shrunk,
their consumption of industrial sewing machine needles also declined
by over 21% through the first half of 1978. While production trends of
the other categories of needles varied, declining consumption of knitting
and industrial sewing machine needles, accounting for an overwhelming pro
portion of the machine needles industries, resulted in a 16% decline in
consumption of all machine needles between 1973 and 1977, with only a
minor upturn in the first half of 1978. This drastic drop in consumption
31
dwarfs the modest gains of imports relative to consumption described
above.
Another factor contributing to the decline in domestic needle
production was the increase in imports of the machines which use needles.
As might be expected, many of these machines use foreign needles as
original equipment and create a bias in the direction of imports as re
placement needles.
In addition, there were indications that Torrington's business
practices and decisions contributed to the severity of its injury. It
was alleged by ·a·number of parties opposing the petition that Torrington
produced inconsistent and poorer quality needles than its competitors,
that it failed to produce specific types of needles, that it has had a
poor record of customer service, and that it has lagged behind in techno-
logical innovations. Because needles repr~sent only a minor cost item
in the production processes of the industries which use them, while down-
time caused by inferior or unavailable needles or inadequate service can
be extremely costly, quality, technical assistance and service are impor
tant factors in needle selection. Needle consumers, whose market is
fashion conscious and rapidly shifting, submitted affidavits unequivocally
asserting that.Torrington had unsatisfactory needle quality and unresponsive
service whic~ resulted in Torrington lost sales. The Commission investiga-. .
tion confirmed that Torrington had problems with the qua1jty and uniformity
of its knitting machine needles and also revealed that Torrington did not
produce exclusively in the Unite~ States many of its best selling industrial
sewing machine needles an~ produced rlomestically only a small portion of
some of its best selling knitting machine n~edle~.

32
Moreover, Torrington further contributed to its own injury by de
ciding to expand its knitting machine needle producing capacity in the
early 1970's in anticipation of an expanding double-knit market which did
not occur. The precipitous decline in double-knits coupled with decreased
demand resulting from the recession left Torrington with substantial idle
capacity. While Torrington sought to rebut these disclosures, it is clear
that each of Torrington's domestic competitors expanded its market share
at Torrington's expense during the period under investigation.
Complicating the analysis of relative causes of injury is the fact
that Torrington and Laconia are substantial importers of machine needles
into the United States. This is most significant with respect to Torrington's
imports of industrial sewing machine needles. While shipments of Torrington's
industrial sewing machine needles and imports from sources other·than
Torrington declined between 1973 and 1977, imports by Torrington increased
sharply. Imports from !~est Germany, the principal exporting country, de
clined substantially and imports from Japan, the second leading exporter,
increased only moderately during 1973-1977 and declined from 1977 levels
durinq the first half of 1978. The most significant increase in sewing
machine needle imports during this' period, both in actual quantities and
relative to other exporting countries, was from Portugal, where Torrington
is the only known producer of needles. These Portugese imports are also the
low cost needles which Torrington has described as the principal source of
its import injury. While the unit value of both the higher cost West German
and lower cost Japanese needles has. recently increased significantly, the unit
value of Portugese needles has remained virtually unchanged. Further,
Portugal is the only major exporting country whose sewing machine needles

33
are eligible for, an·d have received·, duty free treatment under the
Generalized System of Preferences (G.S.P.). This treatment has made
Portugese needles the least expensive import during the first half of
1978 when Portuga 1 was ·a significant source of a 11 imports:· (Torrington
also produces fuachine n~edles in ·Brazil; whose government has also pe
titioned the United States for G.S.P. status for machine needles.)
Torrington's foreign production clouds the issue of cause of
serious injury in another respect. As production of textiles, apparel
and footwear have shifted overseas during the 1970's, opportunities for
export of machine needles have increased. United States exports of all
machine needles, however, have remained relatively constant since 1973,
with the exception of 1974, and exports of industrial sewing machine
needles have actually declined since 1975. Torrington's decision to expand
and use overseas facilities to fill the demand for machine needles outside
the U.S., which might otherwise have been filled by U.S.-produced needles,
may be appropriate in the context of its overall business operations,
but must be considered another possible cause of injury to its domestic
production facilities.
Conclusion
Therefore, I have concluded that whatever injury may exist in
the machine needles industry is not substantially caused by imports. The
overall decline in domestic demand for machine needles dominates the
list of contributing causes of injury. Moreover, the major producer of
machine needles in the United States, Torrington, may also be suffering

34
from self-inflicted wounds. It is a measure of Torrington's conflicting
situation that had the C0mmission granted the relief requested by
Torrington, Torrington's overseas operation would have b•en most adversely
affected by th~ removal of Portugal's G.S.P. st~tus and the preclusion
of Brazil's obt.aining G.S.P. treatment for its Torrin~ton-made product.
(See, Section 503(c)(2) of the Trade Act of 1974.}

A-1
INFORMATION OBTAINED IN THE INVESTIGATION
Summary
On August 25, 1978, the United States International Trade Commission instituted investigation No. TA-201-38 on certain machine needles following the receipt, on August 7, 1978, of a petition from The Torrington Co., Torrington, Conn. The petitioner submits that increases in machine needle imports are a substantial cause of serious injury to the domestic producers of machine needles and· that an increase in. tariff rates is necessary for U .s. producers' relief. Heretofore, the Commission has not conducted any import relief investigations on machine needles.
Relatively small and made of steel, machine needles are vital parts of certain machines used in manufacturing or decorating textiles, or in joining textiles or other types of material together. Five types of machine needles are under consideration in the present investigation: 1/ (1) needles for knitting machines, including latch needles, spring-beard needles, and other knitting-machine needles; (2) needles for industrial/commercial sewing machines; (3) needles for embroidery machines; (4) needles for tufting machines; and (5) needles for felting machines. Latch needles and industrial sewing machine needles comprise over 75 percent of domestic consumption of the foregoing needles and ~eflect by far the bulk of the data in this investigation. Within each of these basic categories of needles, there are thousands of variations.
At least four firms currently produce one or more types of machine needles within the United States, the largest of which is The Torrington Co., accounting for over * * * percent of total U.S. machine needle production. The Torrington Co., which has needle manufacturing establishments in several countries, and one other U.S. producer, Laconia Needle Manufacturing Co., are also * * * importers of machine needles in the United States. Besides these two producers, nearly 200 firms imported machine needles in 1977, although less than 10 of these, including the U.S. producers, account for well over half of all imports. By far the greatest proportion of imported machine needles is produced in West Germany and Japan. These countries accounted for * * * percent and * * * percent, respectively, of total machine needle imports in 1977. Excluding U.S. and nonmarket economy firms, there may be as many as 80 firms producing machine needles worldwide. West Germany, Japan, the United Kingdom, and Switzerland appear to be the only countries having more than one producer.
The U.S. market for the machine needles under investigation consists almost entirely of manufacturers of textile~, apparel, and other made-up textile goods, most of which are located in the southeastern region of the
ll These include all types of machine needles except household sewing-machine needles and are synonymous with the term "certain machine needles" used throughout the rest of this report.

A-2
United States. A multitude of market segments within this broad category, however, complicate the industry's planning and operations. Since 1972, many of these segments contracted as imports have assumed a greater share of consumption.
Total imports of the machine needles under investigation have clearly decreased from their levels in 1973 and 1974. Between 1973 and 1977, imports fell from 413.1 million to 366.1 million needles, or by 11 percent. Imports of latch needles and industrial sewing machine needles, which together account for about * * * percent of total imports, have fallen similarly. Relative to U.S. production, however, imports of all but one type of machine needle have increased.
For the most part, indices of the U.S. machine needle industry's performance reveal declining trends since 1973. Although annual capacity utilization increased from 48 percent to 58 percent between 1975 and 1977, the 1977 rate was still far below the 1973 level of 84 percent. During JanuaryJune 1978, the U.S. industry was operating at a little over 67 percent of capacity. U.S. production fell from 341 million needles in 1973 to 212 million needles in 1975 and rose to 255 million needles in 1977. Producers' shipments also increased after 1975, but are still.below 1973 levels. From * * * needles in 1973, U.S. producers' shipments fell to * * * needles in 1975, but rose to*** needles in 1977. The average number of U.S. production and related. workers producing machine needles declined by more than 34 percent from 1,629 in 1973 to 1,068 in 1977. U.S. producers' yearend inventories of domestically produced machine needles decreased steadily from more than * * * needles at the end of 1974 to about * * * needles at the end of June 1978. As a percentage of annual shipments, inventories of U.S.-produced machine needles also appear to trend downward, at least since December 1975. According to financial data of the U.S. producers, The Torrington Co. has not shown an annual net operating profit on its machine needle operations since 1973, and the financial performance of the other reporting producers has trended downward.
While overall consumption of the machine needles under investigation fell from 724 million needles in 1973 to 608 million needles in 1977, imports, as a percentage of consumption, increased from 57.0 percent to 60.2 percent. The data for latch needles, spring-beard needles, and needles for industrial sewing machines are similar to the aggregate in that apparent consumption fell significantly between 1973 and 1977, while imports as a percentage of consumption increased moderately.
After contacting purchasers of machine needles, the Commission learned that, if buyers had increased their purchases of imported industrial sewing machine needles relative to U.S.-produced ones, the reason was price. Quality, on the other hand, was the primary reason given for any rejection of U.S.-produced knitting needles. Furthermore, of those knitting needles purchased from U.S. producers which the market rated satisfactory or excellent in quality, many were manufactured outside of the United States.

A-3
Because of extremely small, nonrandom samples, pricing data obtained in this investigation are less than adequate. What data that could be gathered, however, indicate that prices for imported machine needles have in many instances been lower than prices for U.S.-produced machine needles. Prices for all types of needles except.latch needles have risen, and the average selling price and production cost have increased at about the same rate.
All three major producers reported efforts to compete more effectively with imports of machine needles. Strategies have ranged from improving quality control to realigning field sales territories. In addition, U.S. producers indicated several adjustments they would make duririg the period of any relief that would enable them to compete more effectively with imports once such relief was terminated.
Increased imports are only one of several possible causes of serious injury to the domestic industry. The 16-percent drop in overall machine needle consumption between 1973 and 1977 clearly implies the role of demand in the performance of U.S. producers during those years. The decline in needle consumption over the past 5 to 6 years is related to declines in domestic apparel and textile production and to technological innovations in the textile machinery industry. Recessionary factors and overexpansion have added to producers' difficulties. Finally, U.S. producers may not have been able to manufacture certain types of knitting machine needles that meet the market's standards of quality and uniformity.
Introduction
On August 7, 1978, the United States International Trade Commission received a petition from The Torrington Co., Torrington, Conn., for import relief under section 20l{a)(l) of the Trade Act of 1974. Accordingly, on August 25, 1978, the Commission instituted investigation No. TA-201-38 under section 20l(b) of said act to determine whether certain machine needles, provided for in items 670.35; 670.58, 670.60, 670.62, 670.64, and 670.741 and 672.20 of the Tariff Schedules of the United States (TSUS), are being imported into the United States in such increased quantities as to be a substantial cause of serious injury, or the threat thereof, to the domestic industry producing articles like or directly competitive with the imported articles. By statute, the Commission must submit its determination to the President within 6 months of its receipt of the petition--in this case by February 7, 1979.
In connection with the investigation, a public hearing was held in Washington, D.C., on November 20 and 21, 1978. Notice of the institution of the investigation and the public hearing was given by posting copies of the notice at the Office of the Secretary, U.S. International Trade Commission, Washington, D.C., and at the Commission's office in New York City, and by publishing the notice in the Federal Register of August 31, 1978 {43 F.R. 38949). 1/
1/ A copy of the Commission's notice of investigation and hearing is presented in app. A.

A-4
Heretofore, the Commission has not conducted any import relief investigations on machine needles. In July of last ·year, the Government of Brazil, where The Torrington Co. owns a machine-needle producing establishment, petitioned the President's Trade Policy Staff Committee for inclusion of latch needles into the Generalized System of Preferences (CSP). The Office of the Special Representative for Trade Negotiations has advised the Commission that action on this petition is being postponed until the Commission's report on the present investigation is received.
The petitioner submits that the domestic industry is suffering serious injury, particularly in regard to profitability and employment. Alleging that the increase in imports of certain machine needles is a substantial cause of this injury, the petitioner requests an increase in tariff rates for a period of 5 years.
The Product
Description and uses
Machine needles are vital parts of certain machines used in manufacturing or decorating textiles, or in joining textiles or other types of materials together. Relatively small and made of steel, their function is to manipulate fibers, yarn, or thread at high speeds in such a way as to create certain fabrics or to join or decorate fabrics or other types of materials.
Basically, machine needles are classified according to the function of the machine for which they are designed. In the present investigation five types of machine needles are under consideration: (1) needles for knitting machines, including latch needles, spring-beard needles, and other knitting machine needles; (2) needles for industrial/commercial sewing machines; (3) needles for embroidery machines; (4) needles for tufting machines; and (5) needles for felting machines. Latch needles and industrial sewing machine needles comprise over 75 percent of domestic consumption of the foregoing needles and reflect by far the bulk of the data in this investigation.
Latch needles are used to manufacture knitted fabrics and are readily distinguishable from other types of needles by their small moving arm, or latch, that opens and closes over a hook at one end of the needle (see app. B for typical examples of machine needle types). Spring-beard needles function similarly, but without two-piece construction. Other needles for knitting machines are of various configurations, some of which have features of both latch and spring-beard needles. Knitting machines accommodate hundreds or thousands of identical needles at once, all operating simultaneously or _in very rapid sequence. Included in the fabrics or articles manufactured by· such machines are seamless hosiery, double- and single-knit fabrics, men's socks, underwear, and sweaters.
Rather than manufacturing fabrics, needles for sewing machines join fabrics or other types of materials, such as leather, together. Their basic

A-5
configuration is like that of a common hand-sewing needle, except that the eye is nearer the pointed end, they are grooved, and some--like those used in shoe manufacturing--are curved. On initial inspection, tufting needles resemble sewing needles; however, they are generally much larger, have larger eyes in proportion to their bodies, and,· instead of fastening fabric together, they carry loops through woven fabric backing to create carpets and other types of tufted material. Embroidery needles resemble sewing needles even more closely, although their function is to form decorative designs of thread or yarn on fabric surfaces. Ins~ead of an eye, felting needles have barbs spaced regularly along their shafts. Such needles are used to manufacture linings, filters, blankets, and other fabrics that are formed by intertwining a number of small random fibers into a cohesive unit.
Within each of these basic categories of needles, there are hundreds or thousands of variations depending upon: (1) the particular machine for which the needle is designed, (2) the thread, yarn, or fiber it is to manipulate, and (3) the exact nature of the fabric or product it is to produce. A single needle may have 25 or more critical dimensions--such as angle and sharpness of point, diameter and straightness of shank, and width and placement of eye--with tolerances as low as a few ten-thousandths of an inch. The metallurgical properties of the steel used in the manufacture of needles--like the quantity of carbon, size of ferric grains, and tensile strength--and the treatment it receives--like hardening, tempering, buffing, and plating, if any--may also vary slightly from needle to needle according to its particular end use. Tolerances, however, are no less critical. A needle that does not meet certain standards will damage threads and fabrics in the manufacturing process. Thus, controlling a needle's critical dimensions and composition (including metallurgical properties and treatment) and maintaining uniformity within a batch and between batches are matters of extreme importance to each manufacturer. Uniformity is particularly crucial to knitting needle manufacture because of the large number of identical needles used simultaneously in knitting machines. ·
During the last 10 years, the introduction of higher speed knitting and sewing machines, in addition to increased use of synthetic fabrics, has put additional requirements on needles, particularly the need for greater heat dissipation and strength. Needles operating at higher speeds generate more heat, and, unless sufficient means are devised to moderate that heat, fabrics will melt and needles will gum. Needles operating at higher speeds also have a greater tendency to break and wear. In these instances the durability, wear resistance, and elasticity of a needle become paramount considerations. Thus, new technologies for improving needle productivity or longevity have occupied the industry's resources no less than those for improving control and uniformity of dimensions and composition.
The manufacturing process is generally similar throughout the industry, consisting of a number of stations through which needles must pass during the course of their transformation from raw material to finished product. A production sequence for a typical sewing needle, for example, may require more than 30 separate machine and/or hand operations, from inspection of the raw

A-6
material, through various pressing, swaging, milling, straightening, polishing, hardening, and tempering operations, to final inspection and packaging. Because of the number and necessary exactitude of most needles' dimensions, set-up and retooling time for needle manufacturing machinery is extraordinary. Production equipment must be reset each time a needle with different dimensions is produced. For the most part, needle-producing machines are specifically designed and customized for the manufacture of a certain type of needle (i.e., latch, sewing, and so forth) and are thus not readily interchangeable. Converting a machine to the manufacture of another type of needle would require a capital investment comparable to that required for customizing a new machine.
Although no conclusion can be drawn as to the relative overall cost efficiency of U.S. and foreign producers, it is generally agreed that foreign producers are more automated, have newer equipment, and have individual machines that incorporate more operations or stages in production. Set up and retooling time, however, are roughly equivalent. Relative to U.S. producers, it is likely that the cost effectiveness of foreign producers increases directly with the size of a production run, and decreases directly ~ith the number of different production runs, since the larger skilled-labor component of U.S. produce~s allows them greater flexibility in setting up and/or retooling production equipment.
U.S. tariff treatment
The types of needles under investigation are dutiable under the provisions of TSUS items 670.35 (includes needles for felting machines), 670.58 (latch needles), 670.60 (spring-beard needles), 670.62 (other knitting machine needles), 670.64 (needles for embroidery machines), 670.74 (parts of textile machinery not specifically provided for--including tufting needles), and 672.20 (sewing machine needles--including those for industrial and household sewing machines).
The current column 1 or most-favored-nation (MFN) and column 2 or statutory rates of duty are shown in the following table. All rates indicated have been in effect since January 1, 1972, when the final stage of the concessions granted in the Kennedy round of tariff negotiations under the General Agreement on Tariffs and Trade became effective. The Kennedy round provided for a duty reduction of approximately 50 percent between 1968 and 1972 on imports provided for under all the above items in five annual and approximately equal stages. With the exception of needles for knitting machines, imports of all the machine needles under investigation are eligible for duty-free treatment under the provisions of the GSP.

A-7
Certain machine needles: U.S. rates of duty, by TSUS items, as of Jan. 1, 1978
: Ad valorem equivalent TSUS
i. terr !fo.: Description Statutory !"ate
Most-favored- :of Jan. 1, 1978, rnostnation rate :favored-nation rate of
dut 3/ ~~~~--~~~~~~~~~~~~~~~~~~~~~~~~_..;."--'-~~~~~~~~~~~-~-~
670.35
670.58
610.,,2
670. 9,
670.74
672. 20
1-lnchi :ics for making or finishing felt and nonwoven fabrics including bonded fabrics, in the piece or in shapes, including ~elt-hat Making machines and hat-: making blocks; and parts thereof::
Other !/-----------------------: P~rts of textile machinery:
Needles for knitting machines: : Latch needles---------------:
6.5% ad val.
50¢ per 1,000 + 15% ad val.:
Spring-beard needles--------: 37¢ per 1,000 + 12.5% ad val.
Other-----------------------: 57¢ per + 20%
1,000 ad val.: 1,000 ad val.:
Needles for embroidery machines.
Parts not specifically virled for.
pro-
Sewing machines and parts thereof, including furniture specially designed for such machines:
Parts:
37¢ per + 10%
The rate for the machines of which they are parts. Jj
Needles--------------------: 37¢ per 1,000 + 10% ad val.:
ll Other than finishing machines and parts thereof covered under TSUS 670.33.
6.5%
15.4%
13.7%
20.9%
10.6%
6.5%
10.5%
40% .'tr! val.
$2 per 1,000 ... 60% ad val.
$1. so per ] ,000 + 50:'? a,~ val.
$1.15 per 1,000 + 40 % ad val.
Sl.15 per 1,000 +40% ad val.
'I'he rate for the machines of which th.:>y are parts. '!:_/
$1 .15 per 1,000 + 40% ad val.
]j Tufting needles are classified by the U.S. Customs Service as parts of tufting machines, which are classified under TSUS item 670.29, and are thus dutiable at a column I or MFN rates of 6.5% ad valorem and a column 2 or statutory rate of 40% ad valorem.
11 T\ased on tota1 U.S. imports· in 1977:-

A-8
U.S. Producers
At least four firms currently produce one or more types of machine needles within the United States: The Torrington Co. (Torrington), with plants at Torrington, Conn., and Walhalla, S.C.; Arrow International Inc. (Arrow), Reading, Pa.; Laconia Needle Manufacturing Co. (Laconia), Laconia N.H.; and a small producer--Foster Needle Co.(Foster), Manitowoc, Wis. Torrington--a wholly owned subsidiary of Ingersoll-Rand Co., Woodcliff Lake, N.J.--presently accounts for all U.S. production of needles for industrial sewing, tufting, and embroidery machines and about * * * the production of needles for knitting and felting machines. Laconia--owned and licensed by Theo. Groz and Sohne & Ernst Beckert (Groz-Beckert), GmbH, West Germany--and Arrow manufacture needles for knitting machines and needles for knitting and felting machines, respectively, while Foster produces only needles for felting machines. Table 1 shows U.S. producers and their respective quantities, values, and shares of shipments of domestically produced machine needles for recent time periods. During the period this investigation covers, no firm has ceased production of machine needles; however, Torrington is currently transferring its knitting-needle operations in Torrington, Conn., to its plant in Walhalla, S.C.
Both Torrington and Laconia import machine needles in substantial quantities. Torrington owns needle manufacturing facilities in Canada, Brazil, Portugal, and West Germany, and in 1977 its imports of machine needles from these sources amounted to * * * percent of its total needle shipments. Laconia, whose imports accounted for nearly * * * percent of its total needle shipments in 1977, imports needles almost exclusively from Groz-Beckert through its importing affiliate, Groz-Beckert U.S.A., Inc., Union City, N.J. Table 2 shows the machine needle imports of Torrington and Laconia and the ratio of these imports to their total shipments of machine needles, respectively, for recent time periods.
In facilities separate from their machine needle operations, Torrington and Arrow manufacture products other than the needles under investigation, including other types of needles. The Bearing Division of The Torrington Co. accounts for about*** percent of its overall sales, and more than***. percent of Arrow's sales are accounted for by surgical needles and other medical tools in addition to flat parts and elements for knitting machines. With the exception of a few wire products, Laconia's operations are devoted exclusively to the manufacture of latch needles. Most of Torrington's and Arrow's machinery were conceived, if not built, in their own facilities or subsidiaries. Nearly all of Laconia's machinery, on the other hand, is of West German origin.
Importers
There were approximately 200 importers of machine needles in 1977, located primarily on the east coast and heavily concentrated in New York and New Jersey. Of these, fewer than 10, including Torrington and Laconia, have

A-9
Table !.--Certain machine needle~: U.S. producers' shipments,- ?Y firm, 1973-77, Janu~ry-June 1977, arid January-June 1978
Firm
The Torrington Co---------...:.: Arrow International Inc----: Laconia Needle
Nanufacturing Go-"'.'-:------: Foster Needle Co--~~-------:-:
Total------------------:
Torrington Co---~--~-------:. Arrow International Inc~---: ·L~conia Needle
Manufacturing Co-~-------:
. :
1973
*** ***
*** *-1:* '"/(**
1.974 1975
. •. 1976
. .. 1977
Quan"tity ·(million needles)
*** 'k-k* 'I<** *";'::* *** *** *** **",':
*** *** *** *** *** :- . ·k** *** 1r** *** "'k** *"'1:* * ... ':*
Jan.-June--
1977 1978
-k..,':* *•};·,':
*·,':·k ... ':*•-k
*** 1:*~·
1:"k* ... ~;':..,•::
*** ·k;'r-.:-:
Percentage distribution, by quantity
**-I: : *** **~'< *** *** *** ·*** *** : '{(** **'l< *..,':_--,': ***
*** *** *** -I:**' *** ·• '*** . : ":':~':...,'(
*"''*' *** *** *** . ... -:** *** ",,';;':* Foster Nee<ll~ Co-----------: ~-.-:~~~:--~-,---'--""'."'":'-:-~_;_~~~~~~-=-~~.:.__;_~~~
Total~---------"'.'---~---:
. 100.0 100.0 100.0 :100.0 :100.0 :100.0 100.0 . . . ~~~~-::-~~~~~~~~~~~~~~~~~~~~~,.-~~'-"~~_;.;...:.-~_;_
dollars) Value (million
.. . Torrington ·Co--------------: *** *** . *** . . *** •· *** ";':'";'(* **"'k Arro~" Intern~tional Inc----: *** *** *** *** *~'<* *** *** Laconia Nee.cl le . . . . ..• ,•
Hnnufacturing Co---------: 'l<** *** *** *** **'"'.': *** *** Foster Needle .~o:--:-------.--: *** •k** *** *** *;~* *** ***
Total---~---------~------: *** *** ... '(** *** *** **'l< *** Percentage distribution, by value
Torrington Co--------------: *** *** 'k-k* *** *'"* *** ** .. '• Arrow International Inc----: *** *** *** **'k **-!( *** *** Laconia ~:eedle
Manufacturing Co---------: *** *** *** *** *** *** *** Foste!" Needle Co-----------: 1•** *** '"#':··1:* -:(** *** *** **"':
Total------------------: 100.0 100.0 100.0 :100.0 :100.0 :100.0 100.0
}j Estimate.
Source: Compiled from data submitted in response to questionnaries of the U.S. International Trade Commission.

A-10
Table 2.--Certain machine needles: U.S. producer~' imports, by firm, 1973-77, January-June 1977, and January-June 1978
Jan.-June--Item :md fir.m 1973 1974 1975 1976 1977
1977 1978
U.S. prod11ccrs' irnp9rts--Torrington-..-
million needles--: *** *** Groz-Beckert U.S.A.
(L.:icon~.a)--
*** mill ion needles--: "''** ~------------------------------------------------------------~ Tntnl 1/--------do----: *** ***
P.atio of U.S. producers' imports to their total shipments ]j-
Torrin~ton------pcrcent--: Laconia------------<lo----: *** ***
Tot n 1 3 /------.:...--do---- :--*-\ .. -.• ------,..-------------------*-.-k*"""· R:1 t io of U-: S. producers'
h:iports to. totn1 U ~S. im:1orts--
7orrington------p~rcent--: Lac on in------·~-----do----: ***
-:':~· .. ~· *** **\" *--:..·* \h'r*
. . *--"~ \'r·:r* *-!:* **-;,': ~'** *** *** ***
·rote] ---~·--------C:o----: ~------------------------------------------------------------..,...,-\'rO:d: *"k* '{rl-:* -I<** *** *•'•·'· •':6;'~* ••n
!r~\rrow .-ir.d F0s ter do not import. 2/ Includes shipm1'!nts of U.S.-produced and imported m:.ichine needles. }/ "i:ncludes Arrow's ;ind Foster's shipnents.
Source·: Compiled fr.om data submitted in response to questionnaires of the U .8. Tntcrn.:tt·i on.:tl Tr.'!de Commission.

A-11
accounted for well over half of the quantity and value of machine needle imports in recent years. Torrington and Groz-Beckert U.S.A. (Laconia) together h;ive accounted for * * * of the quantity of total machine needle inports since 1973 and are * * * importers of machine needles in the United States. Table 2 shows the quantity of U.S. producers' machine needle imports and the ratio of these imports to total machine needle imports for 1973-77, January-June 1977, and January-June 1978. There are several large impol'.'ter.s in addition to the U.S. producers, including The Singer Co. (industrial sewing, felting, and tufting needles), New York, N.Y.; Schmetz Needle Corp. (industrial sewing machine needles), Leonia, N.J.; Honarch Knitting Machinery Corp. (latch needles), Glendale, N.Y.; Superior Sewing Machine and Supply Corp. (industrial sewing machine needles), New York, N.Y.; and Needle Industrie~ (U.S.A.) Inc. (latch and felting needles), Charlotte, N.C. Machine needles account for a relatively small percentage of most importers' overall sales. With t11e exception of some packaging, importers, including producers, 2dd no value to the imported product.
Foreign Producers
Nost of the machine needles .imported into the United States are produced in West Germany anJ Japan. In 1977, these countries accounted for * * * percent and -I: '': ,•: percent, respectively, of a total of 366 million imported needles. Other najor sources include the United Kingdom; Belgiun, Portugal, Can.'.!da, an<l Switzerland. Table 3 shows the quantity and value of imports of certain machine needles, by principal sources, for 1973-77, January-June 1977, and January-June 1978. (Similar data are presented in appendix tables C-1 through C-7 for each machine needle type.) According to these data, West Germany's share of imports decreased by more than*** percent after 1973, while Japan's share increased moderately from about * * * percent to more than ,·: ,., ,·: percent. Unit values are highest for machine needles from West Gerr.tany and lowest for mach{ne needles from Belgium and Portugal. During the period this investigation covers, unit values of machine needles from all sources have increased, particularly in 1978.
Excluding U.S. and nonmarket-economy firms, there may be as many as 80 firms produd.ng machine needles worldwide. West Germany, Japan, the United Kingdom, and Switzerland appear to be the only countries having more than one p:~oducer. Foreign capacities are unknown.
According to .·wailable data, the West German industry is composed of 2 relatively large manufacturers--Groz-Beckert, GmbH, and Ferd. Schmetz, GmbH, u:i.th a!Jout '': * * and ·:: * * employees, respectively--and perhaps as many as 16 smaller firms, including Torrington, GmbH; Singer, GmbH; Rhein-Na<ll, GmbH.; and Leo Lammertz, GmbH (m·med by Groz-Beckert), each with he tween * -1~ ,•: and * * ~'r
employees. llost are located in or around Aachen, West Germany. Groz-Beckert, located in Albstadt, is reportedly the largest producer of latch needles in tl-.e world, manufacturing approximately*** machine needles of all types annually.

A-12
Table 3.--Certain machine needles: U.S. imports for consumption, by principal sources 1973-77, January-June 1977", and January-June 1978
. . . January-June--Source 1973 1974 1975 1976 1977
1977 1978
Quantity (1,000 needles) . . .
West Germany-----: *** *** *** **,'r *** *** *** Japan------------: 40,387 37,056 37,806 45,338 52,738 29,509 24,521. United Kingdom---: *** *** *** *** : *** *** *** Belgium----------: 37,910 41,460 32,558 29,693 22,633 9,488 12,688 Portugal---------: *** *** *** *** *** *** *** Other------------: *"';* *** *** *** . *** . *** ***
Total--------:413,144 :416 2750 :276 2781 :331 2269 :366 2101 :193 2978 :198 2718
Percentage distribution, by quantity
West Germ::my-----: *** **-Ir *** *** *** *** *** Japan------------: 9.8 8.9 13.6 13.7 14.4 15.2 12.3 United Kingdom---: *** ,'r** *'k* *** *** *** *** Belgium----------: 9.2 10.0 11.8 9.0 6.2 4.9 6.4 Portugal---------: *** *** *** *** *** *** *** Other------------: **";'( *** *** *** *** *** ***
Total--------: 100.0 100.0 100.0 100.0 100.0 100.0 100.0
Value (1,000 dollars) 1/
West Germany-----: *** *** *"k* *** *** *** *** Japan------------: 2,107 2' 117 2,363 2,808 3,387 1,608 2,241 United Kingdom---: *"-':* *** *** *** *** *** *** .. . See footnotes at end of table.

A-13
Table 3.--Certain machine needles: U.S. imports for consumption; by principal sources, 1973-77, January-June 1977 and January-June 1978--Continued
January-June--Sou:::-ce 1973 1974 1975 1976 1977
1977 1978
Value (1,000 dollars)--Continued
Belgium----------: 2,003 1,148 1,315 1,418 1,404 627 929 Portugal---------: *** *** *** *** **>'r *** *** Other------------: *** *** *** *** *** *** ***
Total--------: 30 2062 30 2641 23 2669 28 2780 32 2797 15 2418 22 2024
Percentage distribution, by value
He st Germ.:-my-----: "'1:** *""-':* *** *** *~':* ** ... ': •k** Japar.------------: 7.0 6.9 10.0 9.8 10.3 10.4 10. 2 United Kingdom---: *** *** *-.':* *** **...,': **"'/: *** Belgium----------: 6.7 3.7 5.6 4.9 4.3 •. 4 .1 4. 2 Portugal---------: *** *** *** *** -:':** *** *** Other------------: *** *** *** *** *** *** ";~**
Total--------: 100.0 100.0 100.0 100.0 100.0 100.0 100.0
Unit value (cents per needle)
West Germany-----: *--':* >'r** *** *** *** *** *** Japan------------: 5.2 5.7 6.3 6.2 6.4 5.4 9.1 United Kingdom---: *** *** *** *** *** *** *** Belgium----------: 5.3 2.8 4.0 4.8 6.2 6.6 7.3 Portugal---------: ...,'(-.::* *** *** *** *** *** *** Other------------: ";'(** *** *** *** '"/:*-,': ;':*--:.: •I:**
Total--------: 7.3 7.4 8.6 8.7 9.0 7.9 : 11. l
1/ F.o.b. foreign point of shipment or customs import value.
Source: Imports of all types of knitting needles and needles for embroidery machines were compiled from official statistics of the U.S. Department of Conunerce; imports of felting and tufting needles were compiled from data suhmitted in response to questionnaires of the U.S. International Trade Comni.ssion. For industrial sewing machine needles from Germany and Japan, yearly ratios of industrial sewing machine needle exports to total sewing machine needle exports as derived from official Japanese and German export statistics were applied to official U.S. Department of Commerce import statistics; for all other countries except Portugal, whose imports of industrial sewing machine needles were compiled from data submitted in response to questionnaires of the U.S. International Trade Commission, a fixed percentage oas~d on U.S. Customs Service estimates was applied to official U.S. Department of Connnerce statistics.

A-14
The Japanese industry is composed of perhaps 30 small-scale producers and at least 2 large producers--Organ Needle Co., Ltd. (Organ), and Fukuhara Industrial and Trading Co., Ltd. (Fukuhara)--employing about*** and*** workers, respectively. Between 1973 and 1977, Organ's annual latch needle production declined from * * * to * * * needles, while its annual production of industrial sewing machine needles increased from * * * to almost * * * needles. Fukuhara, which manufactures latch needles only, increased its production from*** needles in 1973 to*** needles in 1977. The plants for both firms were established about 30 years ago, although their production facilities have been renewed periodically.
There may be as many as 11 firms manufacturing 1 or more types of machine needles in the United Kingdom, the largest being Needle Industries Group, Ltd. in Studley, with about * * * employees, and T. Grieve and Co. in Leicester, with about * * * employees. Other significant producers are located in Switzerland, France, Belgium, the Netherlands, Portugal, and Brazil. The establishments in the latter two countries are owned by Torrington.
Several sources mentioned the growing needle production capability of South Korea. Originally licensed by the Organ Needle Co. of Japan, KO Industries, located in Pusan, may produce as many as * * * machine needles of all types per year and employ as many as * * *workers.
U.S. Market
The U.S. market for the machine needles under investigation consists almost entirely of manufacturers of textiles, apparel, and other made-up textile goods, most of which are located in the southeastern region of the United States. Within this broad market, however, are hundreds of smaller segments associated with different products, different production machinery, and, thus, different needles. The latch needle market, for example, consists of at least eight major submarkets, including those for seamless hosiery, double-knit and single-knit fabrics, sweaters, men's socks, ribbed stockings, garment trim, and support garments and lace. In turn, these markets depend largely upon consumer fashion markets, which have been notoriously volatile.
Because of the multitude of market segments in the textile and apparel industry and the frequent changes to which they are susceptible, needle manufacturers must continually project optimum reallocations of their resources so that the capacities to produce certain needles coincide with the times they are demanded. Anticipating changes in consumer markets is further complicated by competition with markets that do not require machine needles at all. Woven goods, for example, compete with knitted fabrics, and, while neither has become particularly dominant over the other in the past 8 years, they hav~ undergone cycles of relative increase or decrease in demand as preferences have changed.
Distribution networks vary with the market segments. Although it may take a considerable amount of time for a needle manufacturer or importer to

A-15
develop a distribution system, competitive pressures rarely allow them to become entrenched. Most industrial sewing needles are purchased through distributors and jobbers, while virtually all knitting needles are· purchased directly from manufacturers and importers through selling agents and company sales forces.
Since 1972, total knit fabric and garment production in the United States has been declining. Although the demand for knitting and sewing needles during the 1970's has declined correspondingly, industry sources expect demand to increase in certain areas, like hosiery and finer gage knit materials. As the need for needles that can withstand high speeds without breaking or overheating has increased, needle productivity--in addition to quality, uniformity, and availability--has become a heavily weighted criterion in the market's purchasing decisions. This has accelerated the decline in the demand for knitting and sewing needles, since more productive needles require fewer replacements. To the extent that machine needles are used in conjunction with complicated production processes, technical service and assistance is also important to needle buyers. Price, of course, remains a primary purchasing criterion, though much more so in the market for straight sewing needles than it is for curved sewing needles or latch needles, where quality is of paramount consideration. Table 4 shows the quantity and value of U.S. producers' shipments, imports, exports, and apparent consumption for certain machine needles for 1973-77, January-June 1977, and January-June 1978. Appendix tables C-8 through C-14 show similar data for each machine needle type.

A-16
Table 4.--Certain machine needles: U.S. producers' shipments, imports for consumption, exports' o'f domestic merchandise·, and apparent consumption, 1973-77, JanuaryJune 1977, and January-June 1978
Pro- Imports : Apparent: Ratio (percent) of
imports to con-
Period : duce rs'· =--.,..--,.....-----------:Exports: consump- :_,,,~.--s_u_m_.p._t_i_· o_n ___ _ ship- U.S. All • • tion . U.S. : All ments : pro- Tqtal pro- : :Total
others others
1973-----------: 1974-----------: 1975-----~---~-: 1976-----------: 1977----------~:
January-June-- : 1977---------: 1978---------:
ducers· : duce rs: :
***
*** *** *** ...,.,**
***
*** *** ***
*** ***
Quantity
413.1 416.8 276.8 331.3 366.1
194.0 198.7
. :
*** 724.2 *** 685.7 *** 479.2 *** 563.9 *** 608.2
*** 321.0 *** :. 323.5
*** *** *** *** *** **-:: *** -J:·.':*
*** .: **"': *** ***
57.0 60.8 57.8 58.8 60.2
60.4 61.4
---------~-~--------------~----------~
1973-----------: 1974-----------: ]975-----------: 1976-----------: 1977--------'---: January-June-- :
1977---------: 1973---------:
*** *** **'': ***
ll Tl Tl ll II
*"lr* : ll *** :Tl *'':* :Tl *** :T.1 *** =II
ll '':** : 11 J] *** :}/
Value
**"': : ll 30.1 *** :Tl 30.1 *"'lr* :Tl 23.7 *** :T./ 28.8 -lrlr* :II 32.8
'k-:n': :1115.4 *** =I/ 22.0
*'':* *** *** *** ***
*** ***
II F.o.h. foreign point of shipment or customs import value.
61.0 60.2 47.6 57.0 62. 1
31.2 36.7
*** *** *** *** -1:**
*** *** **'': *"#'(* ***
*** *'':*
Source: Compiled from data submitted in response to questionnaires of the U.S.
49.3 51.0 49.8 50.5 52.8
49.4 59.9
International Trade Commission and from official statistics of the U.S. Department of· Commerce.
The Question of Increased Imports
Total inports of the machine needles under investigation have clearly decreased from their levels in 1973 and 1974. Between 1973 and 1977 imports fell from 413.1 million to 366.1 million needles, or by 11 percent. Imports of latch needles ~nd industrial sewing machine needles, uhich together account for about * * * percent of total imports, also declined. From 1973 to 1977 imports of latch needles declined from 157.4 million to 133.3 million, or by 15 percent, while needles for industrial sewing machines fell * * * percent, from* * * to * * * needles,· in the same period. Declining imports are also evident for knitting machine needles other than latch or

A-17
spring-beard. Imports of other types of needles increased moderately to substantially between 1973 and 1977, ranging from 5 percent for spring-beard needles to over 600 percent for embroidery needles. From January-June 1977 to January-June 1978, imports of industrial sewing machine needles, tufting needles, and knitting needles ot.her than latch or spring-beard declined by * * * percent, * * * percent, and 54 percent, respectively, while imports of latch needles, spring-beard needles, felting needles, and embroidery needles increased by 18 percent, 10 percent, * * * percent, and 40 percent, respectively.
Relative to U.S~ production, imports of all but one type of machine needle--knitting needles other than latch or spring-beard--increased between 1973 and 1977. As a ratio to production, total imports of all machine needles increased from 121 percent in 1973 to 143 percent in 1977, declining, however, to 139 percent in January-June 1978. A decline in the ratio of imports to production from January-June 1977 to January-June 1978 is evident with respect to latch needles, spring-beard needles, other knitting needles, and embroidery needles, whereas a further increase is associated with felting needles, tufting needles, and needles for industrial sewing machines. Table 5 shows U.S. production, imports, and the ratio of imports to production for each type of needle under investigation for the years 1973-77 and for January-June of 1977 and 1978. Figures 1 through 15 in app. C show statistical regression (trend) lines for imports and for the ratio of imports to production for each needle type between 1973 and 1977.
The Question of Serious Injury or Threat Thereof
U.S. production, capacity, and utilization of·capacity
Because of the many market segments in the needle industry, the many shifts in these markets' requirements, and the many changes in product mix the industry undergoes to adjust to these shi~ts, the industry's capacity is exceedingly hypothethical. A change in product mix within the industry,_such as that that occurred in the early 1970's in anticipation of heavy double-knit needle sales, may increase or decrease overall capacity depending upon the types of machinery the industry has and the resource allocation decisions it makes to accommodate the shift. Then if demand fails to meet the industry's expectations, the industry will suffer excesses or deficiencies in capacity until readjustments can be made.
Cognizant of these reservations, the Commission asked producers to indicate their machine needle capacity based on their 1977 product mix and on operating their facilities at two shifts a day, 5 days a week. The results are shown in table 6. After falling from * * * to * * * needles between .1973 and 1975, annual U.S. production of all types of machine needles by the three producers that reported their production capacities increased moderately to

A-18
Table 5.--Certain machine needles: U.S. production and imports for consumption, 1973-77, January-June 1977, and January-June 1978
January-June--Item 1973 1974 1975 1976 1977
1977 1978 .. . . .
Production: Latch needles--1,000 needles--: *** *** *** *** *** *** *** Spring-beard needles----do----: *** *** *** *** *** . .. *** *** Needles for knitting machines . .
other than latch or spring- . . beard--------1,000 needles--: *** *** *** *** *** *** ***
Needles for felting machines 1,000 needles--: *** *** *** *** *** *** ***
Neel des for embroidery 1,000 needles--: *** *** *** *** *** *** ***
Needles for tufting machines 1,000 needles--: *** *** *** *** *** *** ***
Needles for industrial sewing . . machines-----1,000 needles--: *** *** *** *** *** *** ***
Total---------------do----:340,617 :329,551 :211,737 :261,688 255,083 128,183 :143,030 Imports:
Latch needles--1,000 needles--9157,350 :132,048 87,453 :115,192 133,311 66,974 78,845 Spring-beard needles----do----: 14,631 19,007 15,868 10,635 15,401 8,105 8,924 Needles for knitting machines :
other than latch or spring- : beard--------1,000 needles--: 2,719 1,419 1,747 521 2,342 1,734 794
Needles for felting machines 1,000 needles--: *** *** *** *** *** *** ***
Needles for embroidery 1,000 needles--: 891 1,508 1,186 6,523 6,258 2,748 3,850
Needles for tufting machines 1,000 needles--: *** *** *** *** *** *** ***
Needles for industrial sewing : machines-----1,000 needles--: *** *** *** *** *** *** ***
Total---------------do----:413,144 :416,750 :276,781 :331,269 366, 101 193,978 :198,718 Ratio of imports to production: :
Latch needles--------percent--: *** *** *** *** *** *** *** Spring-beard needles----do----: *** *** *** *** *** *** *** Needles for knitting machines . .
other than latch or spring- . . beard--------------percent--: *** *** *** *** *** *** ***
Needles for felting machines percent--: *** *** *** *** *** *** ***
Needles for embroidery machines-----------percent--: *** *** *** *** *** *** ***
Needles for tufting machines percent--: *** *** *** *** *** *** ***
Needles for industrial sewing : machines-----------percent--: *** *** *** *** *** *** ***
Total---------------do----: 121.3 126.5 130.7 126.6 143.5 151. 3 138.9
Source: Compiled from data submitted in response to questionnaires of the U.S. International Trade Commission and from official statistics of the.u.s. Department of Commerce.

A-19
* * * needles by 1977;_ however, production was still * * * percent· lower than it was in 1973. Production increased.~** percent in January-June 1978 over the corresponding period_i~ 1977. Capacity to produce all types of machine needles increased from * * * in 1973 to * * * needles in 1976, then fe.11 to
.***in 1977, consequent to Torrington's scrapping of old latch needle machines and its shipping of other machines * * *· Capacity declined slightly again in January-June 1978· from the corresponding period in 1977. With the principal exception of latch needle capacity, which has undergone a decline as a result of Torrington's decision to relqcate and scrap its latch needle machinery, the capacities for producing all the types of needles under investigation have remained constant since 1974. Between 1975 and 1977, annual capacity utili7-ation increased from 48 percerit to 58 percent, although this was still far below its 1973 level of 84 percent. Currently (January-June 1978), the U.S •. industry is operating at a little more than 67 percent of capacity. * * *·
The ratio of prod~ction to capacity for each type of needle under investigation. is shown in table .7.. Capacity utilization for embroidery machine needles and knitting needles other· than latch or sprine-beard is considerably higher than the aggregate for 1976 and January-June 1978 and capacity ~tilizatiori for tufting arid indu~trial sewing machine needles is considerably lmyer than the aggre-gate for January-June 1978.
U.S. producers' shipments and exports )
Aggregate data on U.S. producers' shipments of the machine needles urider investigation reveal a decreasing trend from 1973 through 1975 and a .recovering trend thereafter (table 4). Producers' shipments of machine needles fell from a high of * * * needles in 1973 to * * * needles in 1975 and rose agaiQ to ***needles in 1977, still 20 percent lower than the 1973 level. U.S. producers' shi?ments of mach:i.ne needles increased slightly in January-June 1978 from January-June 1977. In terms of value, producers' shipments dropped from* * * in 1973 to * * * in 1975, and then rose to* * * in 1977. U.S. producers' shipments of each of the major types of machine needles in question are shown in appendix tables CB through Cl4. * * *
With the exception of 1974, exports of machine needles remained relatively constant between 1973 and 1977, averaging*** million needles per year. Between January-June 1977 and January-June 1978, however, exports increased by * * * percent. * * * According to industry sources, exports of knittingmachine needles to third-world countries are limited, as these countries tend to favor woven as opposed to knitted fabr~cs.
Employment
From 2,119 in 1973, the average number of all employees in U.S. establishments producing machine needles declined by over 30 percent to 1,480

A-20
Table 6 .--Cer.tain machine needles: U.S. production, producers' capacity, and capacity utili-zation, by firm, 1973-77, January-June 1977, and January-June 1978
January-June--Item and firm !/ 1973 . 1974 1975 1976 1977 . . . 1977
Production: Torrington---1,000 needles--: *** *** *** *** *** *** Arrow 2/--------------do----: *** *** *** *** *** *** Laconia------~--------do--~-: *** *** *** *** *** ***
Total 3/------------do---- *** *** *** . *** *** *** Capacity: 3/
Torrington---1,000 needles--: *** *** *** *** *** *** Arrow 3/--------------do----: *** *** *** *** *** *** Laconia---------------do----: *** *** *** .. *** *** *** ..
Total 3/------------do----: *** *** *** *** *** *** Capacity utilizatiion: Torrington---------percent--: *** *** *** *** *** *** Arrow-----------------do----: *** *** *** *** *** *** Lacon ia---------------do--.--: *** *** ·: *** .. '*** *** *** .
Total•--------------do----: 83.6 79.3 47.7 .. 58.6 57.7 57.6 . 1/ Data on the capacity of Foster Needle Co. are not availab.le; therefore, data on the
production of Foster Needle Co. are not included in this table. 2/ Does not include needles for felting machines. 31 Does not include Foster Needle Co. or felting machine needles produced by Arrow
International, Inc. · !!_/ Based ~n 1977 product mix and operating facilities at 2 shifts a day, 5 days a week.
Source: ·compiled from.data submitted in response to questi~nnaires of the U.S. International Trade Commission.
1978
*** *** *** ***
*** *** *** *** *** *** ***
67.4

A-21
Tahle 7.--Certain machine needles: U.S. production, producers' capacity, and capacity utiliza-ti on, by type of needle, 1973-77' January-June 1977' and January-June 1978
January-June--Item and needle 1973 1974 1975 1976 1977
type 1977 1978
Pror!uc t-! on: Latch needles
1,000 needles--: *** *** *** *** **-!: *"k';,'( -.•:--.':;':
Spring-beard needles 1,000 needles--: •k** *~"* *** *** *** *•'•* ·.'dr~:
Needles for J:nitting nachines other tlrnn latci.1 or spring-beard
1,000 needles--: *-1•* **~· *** '"* ... ': **•': ······ -.·:;':-.':
Needles for felting m.::ichi.nes 1/
i";-ooo needles--: *** Tk* *** *** **''' -!:*'".': '".':·.':*
Needles for ernbro iderY machines
1,000 needles--: *'".':-!: *** ... ":** *** *-..';-]; ... ·:-.':* ·.':** t~eedlcs for tufting
machines 1,000 needles--: '".':** *** *"k* **"k "!d:* *** **'"
Needles for industrial sewi?g mnchines
1,000 needles--: * ... ': ... ': *** *** *** *** *"'.':* **•': Total 1/-------do----: *** *** *** *** -::*·.': ... ·:--.':-.': **".':
C;;pac i ty: '}/ Latch needles------------:
1,000 needles--: ·::·:..-.•: *** *** *** *** -.':*-.·.- **-.': Spring-beard needles ..
l ,000 needles--: *** *** *** *"k;': **-.'• *** -.b'•* Needles for knitting
machines other than latch or spring-beard
1,000 needles--: *** *** ... ··** *** *** **--)...• *** Heedles for Felting :
machines y 1,000 needles--: -1.-k* 'k-k* ..,',** *** **"k '".':*•': ***
Needles for embroidery machines
1,000 needles--: *-!:-.': -.b':* *** *** *-.':* -.';-.':* *-.':* Needles for tufting
machines 1,.000 needles--: *** *** *** *** **":t **".'; -.':**
Needles for industrial sewi.ng machines
1,000 needles--: *** *** *** *** *** *** *** Total 2/-------do----: *** *** *** *** *** *** ***
Ratio ( perce-;:;t) of pro-duct ion to capacity:
Latch needles percent--: *** *** *** *** *** *** *** Spring-beard needles percent--: *** *** *** *** *** *** ·= ***
Needles for kni ttl.ng machines other than latch or spring-beard
percent--: *** *** *** *** *** *** *** Needles for felting
machines _!/---percent--: *** *** *** *** **"':: *** *** Needles for embroidery
machines----7-percent--: *** *** *** *** *** *** :f±/ "** Needles for tufting
machines------percent--: *** *** -:.7* *** *** **-.': "'** Needles for industrial
sewing machines percent--: *** *** *** *** *** *** ***
Total----------do----: 83.6 79.3 47.7 58.6 57.7 57.6 67.4
1/ Does not include Arrow or Foster. 2/ Does not include Foster or felting machine needles produced by Arrow. 3/ Based on 1977 product mix and operating facilities at 2 shifts a day, 5 days a week. °§_/ ***
Source: Compiled from data submitted in response to questionnaires of the U.S. International Trade Connnission.

A-22
in 1977. Data for January-June 1978 show that the average number of employees increased by 9 percent over its January-June 1977 level. Similar trends are evic!ent with regard to all production and related workers and production and r~lated workers producing the types of needles under investiglition. Employment ~~ta, by firm, are shown in table 8. U.S. producers indicated that they were not able to segregate employment according to needle types.
Data with respect to man-hours worked by production and related workers in U.S. estahlishments producing machine needles reflect the trends shown by the ~verage number of emp.1oyees (table 9). Man-hours worked by all production and relatec' workers decreased from over 3.9 million in 1973 to 2.5 million in 1~77, a drop of 34 percent, and then increased slightly hy 9 percent in J<lnuary-June 1978 over the corresponding period in 1977. Han-hours worked liy proJuction ~nd related workers pro~ucing machine needles fell by 33 percent hetueen 1973 and 1977, and then increased by 12 percent between January-June 1977 and January-June 1978.
Inventories
U.S. producers' yearend inventories of domestically produced machine neeclles clecrcnsecl steacily from more than * * * needles at the end of 1974 to .::~i.:m:: ·:: -:: 1'< million needles at the end of June 1978 (ta'-'le 1.0). As a
pe;:centagc of annual shipments, inventories of U.S.-produce<J machine neecHes :ilsa appear to trenil c!o"mward, at least since December 1975. From December :n, I ·:7 ~, to June 30, 1978, the ratio of inventories to yearly shipments de cl inec1 from* * * percent to about * * * percent. U.S. producers' yenrend invent0ri0s of imported nachine needles also decreased after 1974, although a l~rge :;;c.re-:1Se is evident in June 1978 as compared to June 1977. The ratio of i:wentorics to shipments for imported machi.ne · needles is higher than that for U.S. produced ones. Between December 31, 1973, and June 30, 1978, the ratio c;'.' .;_;;ventories of jmported machine needles to annual shipments has rangeil from :1 h:i~l: of over "°!( * '"" percent as of December 31, 1973, to a low of * -:: * D1~;·c1.?:'~ ns of December 31, 1977. Currently, the ratio of imported machine ~~cl'~es to shipl!lents is about ·k * * percen.t. U.S. producers' inventories by fj -:-m .::11~e shown in tab le 1 J.. -.'< -/( ,.,
Fjn:.!ncial performance of U.S. producers
Selectec1 information indicative of the financial performance of U.S. producers of machine needles on their U.S.-produced machine needle operations is ~eporteJ in table 12. * * *
According to its accounting data, the machine needle division of Torr~.ngton )1.:is not shown an annual net operating profit on its U. S .-produced m~chine needle operations since 1973. * * *

A-23
Table 8.--Average number of employees in U.S. establishments producing certain machine needles, total, and all production and ·related workers· engaged in the manufacture of certain machine needles, by firm, 1973-77, January-June 1977, and January-June 1978
Januar:y-June--Item and firm 1973 1974 1975 1976 1977
1977 1978
All employees: Torrington--~------------: *** *** *** *** *** *** *** Arrow--------------------: *** *** *** *** *** *** *** Laconia------------------: *** *** *** *** *** : *** ***
Total------------------: 2~ 119 2,086 1,593 1,671 1,480 1,476 1,608 ·:
All production and related workers: Torrington---------------: *** *** *** *** *** *** *** Arrow--------------------: *** *** *** *** *** *** *** Laconia------------------: *** *** *** *** *** *** *** Total--------------------: 1,919 1,857 1,315 1,397 1,237 \,234 1,342
: Production and related
workers producing cer-tain machine needles: Torrington---------------: ·*** *** *** *** *** *** *** Arrow--------------------: *** *** *** *** *** *** *** Laconia------------------: *** *** *** *** *** *** ***
Total------------------: 1,629 1,584 1,150 1,223 1,068 1,069 1,192
Source: Co~piled ·from data submitted in response to questionnaires of the U.S; International Trade Conmtission.
Table 9.--Man-hours worked in U.S. establishments producing certain machine needles by production and related workers engaged in the manufacture of all products and of certain machine needles, 1973-77, January-June 1977, and January-June 1978
Item 1973
All production and related-._: workers------------------: 3;870.7
Production and related workers producing cer-tain machine needles-----: 3 1 242~0
·(In thousa·nds of man-hours)
1974 1975 1976
3, 729.4 2,383.3 2, 741.5
3, 132.0 2,017.3 2,355.5
January-June--1977
1977 1978
2,541.5 1,300.l 1,414.9
2, 177 .6 1, 118.1 1,248.8
Source: Compiled from data submitted in response to questionnaires of the U.S. International Trade Connnission.

A-24
Table 10.--Certain machine needles: U.S. producers' inventories of U.S.-produced and imported machtne needles, as of .December 31, 1973~77, June 30, 1977, and June 30, 1978
. : U.S. produced !/ Imported
Date ----------------R-a-t-...io---o-f__,i_n_v_e_n_t_o_r_,,i_e_s __ t_o __________________ R_a_t __ i_o __ o_.f __ i_n_v_e_n_t_o __ r~i-e_s __ t_o ___
I • Quantity shipments during the shipments·during the
Qu1mtity preceding 12-month or preceding 12-month or 6-month period 6-month period
Decemher 31--1973-----~-----~~: 1974----~--------:
1975-------------: 197G-----~-------:
1977-------~-----:
June 30-- .. 1~77-------~--~--= 1~78----------~--:
. 1,000 needles
-/:*-)<
*** **-Ir *•.'t-1:
. *** -.':**
***
..
Percent
*** *<fr:* *** *** ***
2/ *** Ii ***
·1,000 needles
**-1< *** *** *** ***
*** ***
Percent
l/ Does not include Fostr.r or Arrow's inventories and shipments of felting needles. Jj Data is based on shipments during the preceding 6-month period at an annual rate.
2/ '"il
**''< *** *** *** 1rn ... •:
*** "l'r"!:*
Source: Compile<l from data submitted in response to questionnaires of the U.S. International Trade Commi·ssion.
·Table '11.--Ce'rtain machine'.needles: U.S. producers' inventories'of U.S • .:.produced machine needies, by firm, as of December 31, 1973-77, June 30, 1977, and June 30, 1978
December 31-- June 30--Item and firm 2_/ ,., 1:
'197'3 •- 1974 1975 1976 1977 1977 :
1978 . . .. ·:'
Inventories: Torr:i ngton . :
1,000 needles--: ·.'rlr-.': : t;,'rlt* *** *** *** *** '!..-.'r-1:
Arrow 2/-~---------<lo----: '"i':**': *'"* *'"* *** *** >'•** *** 1,aconia..: ____ :__.:. ____ do---..: i -:.':"'/:* *** *** *'"* *** *** ***
Total------------do----: **'" *** *** >'•** *"k* *** ***
Patio of inventories to shipments during the preceding 12-month or 6-month period:
Torrington--percent--: *** *** -;':** ;*** *** 3/ *** 3/' *''* ArrCi\·7 1/-------rlo----: *"::* *'":<>'< *** *** w-:~·k 3/ *** 3/ *** Laconia -----.!..-do----: *** -!:** *** *** *** 3/ *** 3/ *-l'*
7otal--~--~~-do~-~-: '-l-1:-.': ~"** *** *** *''<* 1/ *** 1/ ***
1/ Foster not nvailahle. ~/ Does not include felting needles. }/ Data is l>ased on shipments during the preceding 6-rnonth period at an annual rate.
Source: Compner. fr.om data suhmitted in response to questionnaires of the U.S. Inter.national Trade Co:nrrii.ssion.

A-25
Table 12--Selected financial data for U.S. producers of certain machine needles on their U.S.produced machine needle operations, by firm, 1973-77, January-June 1977, and January-June 1978
I tern and firm );./
!:ct Sales: 2/ Torringto;
1,000 dollars--:}/ Laconia------------<lo----:
1973
*** :}/ ***
1974 197.5
*** :}/ *** ";,'(** ***
January-June--1976 1977
1977 1978
:
:}/ **~': :}/ *** :}/ *** 11 *** '"** ***
*''<* **-I<
~~~~~~~~~~~~~~~~~~~~~~~~~~~~~~~~~~~~~~~
Total------------do----: *** *** *** *** *** *** *"'k":.':
Cross profit or (loss): .. Torrington
*** :}/ *** :}/ *** :}/ **-I< :}/ ..,,., .... ':* :}/ *** 11 *"''* *** *** *** *** **'" *"''* *":.':*
1,000 dollars--:}/ Laconia------------do----: Total------------do----:~~~~~-'-~~~~~.;__~~~~~~~~~~-'-~~~~~.;__~~~~.....:~~~~~
~'"** *** *** *** "''*";,'( *-I<* *** ~et operating profit or
(loss): 'Lorrington
;':•k* :}/. ***
1<** :}/ *** :}/ *** *''<*
*>'<* :}/ *** :}/ **'': =11 *";,':":.':
*** •k** *** *'"* 1,000 <lollars--:3/
L3conia-----------do----: Total-----------clo----:~~~-..,.-,-~~~~~~.;._~~-,---.,.~~~~-..,.-,--'-~~~~,.--.;._~~~--.,.--'~~~~--,-
":.':** *** . *** •'<** *** *''<* ";,"'** Ratio of net operating pro-:
fit or (loss) to net sales:
*** Torrington------percent--: *** ~"** ~"**
*** .T.nconia------------do----: '''*''< *** *** *** *** Total.------------do----:~~~**~.-*~~~~-**~*~.;__~~-**~*~~~~-**~~-*--'-'-~~-*-*-*~.;._~~-~-~x-·*~..:.....~~~-*-*~*
Ratio of net operating pro-: cit or (loss) to fixed assets (cost less riepreciatioi:i):
Torri ngton------percent--: *** *** *** *** '*** Laconia------------do---- • *** • · *** *** '"** **'" -:'** 1<··'<>"
Total---~--~-----do----;~~~-~~~*~*~-'-~~~*~*~*,.--~~~-~~~*~*~.~~~~*-*-*~~~~-*-*~~~~~~~~~-~*~*~~~~~*-*~*
P.atio of net operating pro-: fjt or (loss) to fixed : as~ets (cost):
Torrington------percent--: *** *** *** *** ;':*";': >'<*-!: **":.':
*** *** *** *** *** *** *** Laconia------------do~---: Total------------<lo----:~~~~~--'-~~~~~~~~~~~~~~~~--'-~~~~~-'--~~~~--'~~~~~
*** *** *** *** *** *** *** Ratio of net operating pro-:
fit or (loss) to fixed assets (replacement cost):
Torrington------percent-~: *"k* ***
*** ·*** *** ***
*** *** *'"* *** *** *** *** *'"* Laconia------------do----:
Total------------do----:~~~~~--'-~~~~~.;__~~~~.....:~~~~~-=-~~~~~.;__~~~~.....:~~~~~ *** *** *** *** *** *** ***
1/ Data for Arrow and Foster not available. Z/ Includes inter/intra company transfers. J/ Estimate.
Source: Compilec from data submitted in response to questionnaires of the. U.S. In~ernational T~ade Commission.

A-26
While Laconia has continued to show * * * on its U.S.-produced machine-needle operations since * * *, its performance has been far from stable. * * *·
Data for Arrow are not available in the form requested by the Conunission; however, company data indicate that annual gross profits, i.e. profit before administrative and selling expenses, have trended * * *·
Only Torrington 'reported data for machine-needle. import operations. * * * .
. The Question of the Causal Relationship Between Increased Imports and the Alleged Injury
U.S. consumption and market penetration of imports
Overall consumption of the machine needles under investigation fell significantly after 1973. From an aggregate of 724.2 million needles in 1973, apparent consumption fell to 608.2 million in 1977, ~r by more than 16 percent (table 4). Data for January-June 1978 sho~ a slight increase over the corresponding period of the previous yea·r. In terms of value, apparent consumption remained relatively stable, reflecting both inflation· and the demand for higher quality needles. Apparent consumption fell from $61 million in 1973 to $47.6 million in 1975, increased to $62.1 million in 1977, and further increased by 18 percent between January-June 1977 and January-June 1978.
As a percentage of overall consumption, imports rose from 57 percent to 60.2 percent between 1973 and 1977 in terms of quantity and from 49.3 percent to 52.8 percent in terms of value. A further increase is evident in JanuaryJune 1978 over the corresponding period in 1977. If imports by U.S. producers are excluded from total imports, the ratio of imports to consumption increased similarly between 1973 and 1977 but declined in January-June 1978 from January-June 1977. Table 4 on page A-16 shows aggregate data on apparent· consumption, the ratio of imports 'to consumption, and related data on producers' shipments, imports, and exports for all of the types of machine needles under investigation.
Appendix tables C-8 through C-14 show similar data for each major type of machine needle. The data for latch needles, spring-beard needles, and needles for industrial sewing machines are similar to the aggregate in that apparent consumption fell significantly between 1973 and 1977 while imports as a percentage of consumption increased moderately. If imports by U.S. producers are excluded from total imports, however, the ratio of imports to consumption for these types of needles drops considerably in January-June 1978 from the corresponding period in 1977. The apparent consumption of felting, tufting, and embroidery needles increased between 1973 and 1977 and the apparent consumption of felting and embroidery needles further increased in JanuaryJune 1978 from January-June 1977. While the ratio of imports to consumption increased relatively moderately between 1973 and 1977 for embroidery and

A-27
felting needles, that for tufting needles increased significantly-~from * * * percent in 1973 to*** percent in 1977. If U.S. producers' imports of felting needles are excluded from total imports of these needles * * *· Table 13 shows the percentage change in apparent consumption and the change in import~ share (percent) of consumption for all major types of machine needles between 1973 and 1977 and between January-June 1977 and January-June 1978.
Lost sales
Of the reporting producers, only Torrington documented lost sales: * * * latch needles valued at * * *, * * * felting needles valued at * * *, and * * * tufting needles valued at about * * *· Only about * * *worth of the latch needles reported, however, were being made exclusively in the United States at the time of the alleged lost sale. Of these sales, the Commission verified that sales of needles valued at no less than * * * had, indeed, been lost, all to Japanese imports. The reason for lost sales, with one exception, was price. * * *· While Arrow's managerial staff did not provide specific case information on lost sales, they did claim that for the past 2 years much of the market share of their high-volume· items had been replaced by low-priced imports from Japan. For most industrial sewing machine needles and other machine needles that are sold through jobbers and distributors, rather than directly to purchasers, it is virtually impossible for producers to secure lost sales information.
In an effort to ascertain the market's views on machine needle suppliers and their respective products, 10 of the largest distributors and users of industrial sewing machine needles and at leist 30 of the largest purchasers and users of knitting-machine needles were contacted and interviewed. The industrial sewing machine needle distributors and users indicated that, if they had increased their purchases of imported needles relative to U.S.-produced ones during the last 2 years, then price was primarily the reason. * * *· Ten purchasers of knitting-machine needles indicated that during the past several years they had increased their purchases of imported needles relative to domestically produced items, and several others indicated that, after sampling U.S.-produced needles, they did not continue purchasing them. Almost unanimously, the reason given was quality. * * *· Even of certain knitting-machine needles purchased from U.S. producers which the market had found excellent or acceptable in quality, such as Torrington's seamless-hosiery needles, many, according to labels on purchased shipments, were manufactured outside of the United States. * * *· Indeed, it is clear that not only do U.S. manufacturers have limited lines in certain types of U.S.-produced knitting-machine needles, but also that many of their best selling needles are manufactured exclusively or almost exclusively abroad. * * *·

Table 13.--Certain machine needles: Apparent consumption, and percentage increase or decrease in apparent consumption, 1973 and 1977, January-June 1977 and January-June 1978
Apparent consumption Increase or decrease (-) in ratio of--
Quantity :Percentage change-- :Imports to consumption Imports other than
U.S. producers' :imports to consumption Type
1973 • 1977
:Million:Million: :needles:needles:
Latch needles----------------------: Industrial sewing machine needles--: Felting needles--------------------: Spring-beard needles---------------: Embroidery needles----~------------: Tufting needles--------------------: Knitting needles other than latch
*** *** *** *** *** ***
*** . . *** . . *** . . *** : *** : *** . .
:January-June 1978 from
1977 :January-June: from : 1978 from :
1973 1973-77 :January-June: :January-June
1977 : : 1977
Percent . Percent . . . . . . . . . *** *** . *** : *** . . . *** *** : *** : *** : *** *** . *** : *** : . *** *** : *** : *** : *** *** : *** : *** : *** *** ! *** ! *** • -. .
:January-June 1978 from
1973-77 :January-June 1977
Percent : Percent . . *** : *** *** : *** *** : *** *** : *** *** : *** *** : ***
: n~ spring-beard------------------: *** . *** : *** *** : *** : *** . 1/ . *** . .
Total--------------------------: 724.2 608.2 . -16.0 . .8 : 3.2 : 1.0 : 3.5 : -8.4
1.1 Not available.
Source: Compiled from data submitted in response to questionnaires of the U.S. International Trade.Commission.
>, N 00

A-29
Prices
Producers and importers were asked to report, on a quarterly basis, prices and quantities of certain high-volume machine needles shipped to their three principal customers between January 1973 and September 1978. From this information, average weighted prices of U.S.-produced and imported needles for each 3-month period were calculated, the results of which appear in table 14. Because the data are not random and represent extremely small samples of U.S. consumption (less than 3 percent in most cases), their statistical reliability is less than adequate.
According to table 14, prices for U.S.-produced latch needles were between· * * * and * * * cents per needle in 1973, rose to over * * * cents per needle· in 1975, and then decreased again to 1973 levels in 1977. Prices for imported latch needles declined from 14 cents per needle in 1973 to between 11 and 12 cents per needle in April-December 1975, where for the most part they have remained. While prices for U.S.-produced latch needles were lower than imported ones in 1973 and 1974, they were generally higher in 1975, 1976, and 1977. Import prices inc~~ased unexplainably in January-June 1978 before again dropping below those of U.S.-produced needles in July-September 1978.
In addition to having the limitations described above, the data for industrial sewing machine needles are poorly representative. The average weighted prices for imports of these needles conceal a considerable range of prices among them, and, as a consequence of limited.questionnaire returns, they are heavily biased by higher valued West German-produced needles. Thus, while average weighted prices of U.S. industrial sewing machine needles as presented in table 14 were lower than those for imports in nearly every quarterly period since January-March 1973, prices for Japanese-produced needles were consistently*** to*** cents per needle lower than.U.S. producers' prices.
Table 14 also shows average weighted pricing data for felting and tufting needles. During the period under investigation, prices for U.S.-produced tufting needles increased from * * * cents per needle to * * * cents per needle while.remaining consistently below prices for imported tufting needles. Felting needle prices rose only moderately; however, prices for U.S.-produced felting needles rose substantially between 1973 and 1976 before returning to 1973 levels. Between January-March 1973 and October-December 1976, prices for imported felting needles were consistently lower than prices for U.S.-produced needles; after 1976, prices remained roughly equivalent.
In addition to weighted average prices per needle, average values per needle were calculated on the basis of the value and quantity of machine . needles shipped.by U.S. producers and importers. The results are shown in table 15. The data show that while average unit values of both imported and U.S.~produced industrial sewing machine needles increased after 1973, average unit values of imported needles were consistently lower than those for U.S.-produced needles. Average unit values of felting and tufting needles

Table 14. --Average weighted prices 1/ .of certain U. S .-produced and imported machine needles, quarterly, ·January-March 1973 to July-September 1978
(In cents per needle) Latch : Felting : Tufting : Industrial sewing
needles : needles :· needles : machine needles Period : U.S.- :Imported : U.S.- :Imported : U.S.- :Imported: U.S.- :Imported : _.2r_oduced :~_ : ~r~duced: : produced : : produced:
1973: January-March-------------------------: ·*** : 14.0 : *** : *** : *** : *** : *** : *** April-June----------------------------: ~: 14.0 : *** : *** : *** : *** : *** : *** July-September------------------------: *** : 14.0 : *** : *** : *** : *** : *** : '**.* October-December----------------------: *** : 14.0 : . *** : *** . *** • *** • *** • ***
1974: January-March-------------------------: *** : 13.2 : *** : *** : *** : *** : *** : *** April-June----------------------------: ***.: 13.l : *** : *** : *** : *** : *** : *** July-September------------------------: *** : 13.7 : *** : *** : *** : *** : *** : *** October-December----------------------: *** : 14.2 • *** • *** • *** • *** • *** • ***
1975: January-March-------------------------: *** : 14.0 : *** : *** : *** : *** : *** : *** April-June----------------------------: *** : 12.l : *** : *** : *** : *** : *** : *** July-September--------------~---------: *~* : il. l : . *** : *** : *** : *** : *** : *** October-December----------------------: ~: 10.8 • *** • *** • *** • *** • *** • *** 1976: J anuary-Ma·rch-------------------------: *** : 11. 2 : *** : *** : *** : *** : *** : *** April-June----------------------------: *** : 11. 3 : *** : *** : *** : *** : *** : *** July-September------------------------: ·*** : 11.4 : *** : *** : *** : *** : *** : *** October-December-------------------~--; *** : 11. 7 : *** • *** • *** • *** . *** • *** 1977:
·January-March-------------------------: *** : 11. 9 : *** : *** : *** : *** : *** : *** April-June----------------------------: *** : 11.8 : *** : *** : *** : *** : *** : *** July-Se pt ember------------------------.: *** ·: 11.5 : *** : *** : *** : *** : *** : *** October-December----------------------: *** : 11.8 • *** . ·*** • *** • *** . *** . *** 1978: January-March-------------------------: *** : 13.~ : *!<* : *** : *** : *** : *** : *** Apri 1-June----·------------------------: *** : 13.5 : *** : *** : *** : *** : *** : *** July-September------------------------: *** : 11. 6 • *** . *** • *** . *** . *** . ***
ll Weighted on the basis of quantity sold.
Source: Compiled from data submitted in response to questionnaires of the U.S. Interna.tional Trade Commission.
~ w 0

Table 15.--Average unit values of certain machine needles shipped by U.S. producers and importers, 1973-77 and January-June 1978
(In cents per needle) Latch : Felting : Embroidery : Tufting : Industrial sewing
needles : needles : needles : needles : machine needles Year : U.S.- :Imported : U.S.- :Imported : U.S. :Imported: U.S.- :Imported: U.S.- :Imported : ~roduced : :J>roduced_: : produced : : produced: : produced : ..
1973------------------------------------: 13.8 : 16.0 : 3.1 : *** : *** : *** : *** : 1974------------------------------------: 15.4 : 13.5 : 3.5 : *** : *** : *** : *** : 1975--~---------------------------------: 16-.2 : 17 .1 : 3.6 : *** : *** : *** : *** : 1976------------------------------------: 17.9 : 16.5 : 3.6 : *** : *** : *** : *** : 1977------------------------------------: 18.0 : 15.4 : 3.9 : *** : *** : *** : *** : 1978 (January-June)-------·--------------: 16.5 : 16.9 :- 4.4 : tr** ' *** . *** ' *** '
:· : : . . Source: Compiled from data submitted in response. to questionnaires of the U.S. International Trade COUD11ission.
*** :· *** : *** : *** : *** : *** '
*** *** *** *** *** ***
*** *** *** *** *** ***.
:r-w I-'

A-32
also increased, though in these cases the values for u.s .• -produced needles are the lowest. After rising from ~3.8 cents per needle in 1973 to 18 cents per needle in 1977, the average unit value of U.S.-produced latch needles fell to 16.5 cents per needle in January-June 1978. The trend for average unit value of imported latch needles has been erratic, fluctuating above and below that for U.S.-produced needles.
Between 1973 and 1977, the average seiling price and production cost of U.S.-produced machine needles increased at about the same rate. While the· average selling price per needle rose from 9.9 cents to 12.8 cents, the average production cost per needle rose from**·* cents to*** cents, * * * From 1977 to January-June 1978, however, the average unit production cost increased by * * * cents per needle, or by * * * percent, while the average selling price decreased by 0.4 cent per needle, or by 3 percent. U.S. producers' average unit production costs and average unit selling prices for their sales of U.S.-produced machine needles, by firm, for 1973 through January-June 1978 are shown in table 16.
Efforts of U.S. producers to compete with imports
All three major U.S. producers reported efforts to compete more effectively with imports of machine needles, although it is unclear in many instances whether such competitive efforts were directed primarily against imports. * * *·
* * * * * * *
U.S. producers were also asked to indicate what adjustments they would make during the period of any increased tariff, quota, or other means of relief that would enable them to compete more effectively with imports once such relief was terminated. Torrington indicated that it would institute the following improvements:
* * * * * * *
Arrow simply stated that it would probably * * *· In contrast to the other producers, Laconia believes that it would not move more expeditiously if import relief were granted and is seriously concerned that any import relief might result in increased prices to needle purchasers and provoke a further reduction in U.S. manufacture of knitted products.

A-".33
Table 16.--Certain machine needles: U.S. producers' average unit production costs and average unit selling prices for sales of U.S.-produced machine needles, by firm, 1973-77 and January-June 1978
(In cents per needle)
Firm 1973 1974 ~ 1975 1976 1977 :January-June 1978
Torrington----------------: *** Arrow---------------------: 1/ Jj Laconia-------------------: *** ~~~~~~~~~~-,-...,.....,~~~.,---~~~-,....~~~~~~~..,...,.....,..
Aver~ge---------------: *** *** ~~~~--,....~~~~~~~~~~~~~~~~--,....~~~~~~-
Average selling price !/
Torrington--------~-------: *** *~'<* *** *** *** *** Arrow---------------------: *** *** *** *** *** *** Laconia-------------------~ *** . *** **~': *** *** ***
Average-------~-------: 9.9 10.8 11. 9 12.6 12.8 12.4
1/ Weighted by quantity sold. 2! DAta not ~vailable.
Source: Compiled from data submitted in response to questionnaries of the U.S. International Trade Commission.
Possible causes of serious injury to the domestic industry other ,than inc.reased imports
The 16-percent drop in overall machine needle consumption between 1973 3nd 1977 clea~ly impli~s the .role of demand' in the performance of U.S. procluce-i::s during those years. During the same period, imports increased their share of consumption by only 3 percent. For all of the major types of needles under consideration, consumption has decreased by more than import's share of consuraption has increased (table 13). l·:hereas the percentage decrease in latch neecl)e consumption was more than * * * percent between 1973 and 1977, the increase in the ratio of latch needle imports to consumption was only ·:: * * percent. Similarly, while the consumption of industrial sewing machine needles declined by more than*** percent, import's share of consumption increased by only * * * percent.
The decline in neenle consumption over the past 5 to 6 years is related to declines in domestic apparel and textile production and to technological innovations in the textile machinery industry. As imports of textiles and apparel, including nonrubber footwear, have increasingly replaced U.S. produced goods, domestic demand for needles has declined accordingly. The

A-34
decline in demand is generally acknowledged to be worldwide. Within the past 2 years, Torrington has closed it~ plants in Italy and the United Kingdom, and many other overseas producers have curtailed production. Technological innovations have also contributed to the machine needle industry's declining
·shipments. Newer knitting machines reduce needle consumption on a per-item, per-pound, and per-hour basis, resulting in a demand for fewer, but higher quality, needles.
Recessionary factors and overexpansion have added to producers' difficulties. The recession of 1974 and 1975 was occasioned by large cutbacks in consumer spending for clothing, which affected the markets for textiles, apparel, and machine needles to a sizable degree. Even before the recession, the U.S. industry faced a serious readjustment. In the early 1970's, U.S. producers, particularly Torrington, had expanded and converted capacity in anticipation of ·a large demand in double-knit needle sales. When, after 1973, sales failed to meet their expectations, producers were faced with substantial amounts of idle capacity. Furthermore, as indicated earlier, U.S. producers have not been able to manufacture certain types of knitting-machine needles that meet the market's standards of quality and uniformity.
Finally, competitive pressures within the U.S. industry have more than likely contributed to Torrington's poor performance. Although it is not clear to what extent Torrington may have lost sales to other U.S. producers, it is certain that Torrington's share of the U.S. market has declined relative to other U.S. producers. Between 1973 and 1977, Torrington's share of U.S. producers' shipments declined from*** percent to*** percent, while Arrow, Laconia, and Foster increased their shares by * * * percent, * * * percent, and * * * percent, respectively (table 1).

A-JS
APPENDIX A
U.S. INTERNATIONAL TRADE COMMISSION'S K)TICE OF INVESTIGATION AND HEARING

A-36.
UNITED .STATES INTERNATIONAL TRADE COMMISSION
Washington, D.C.
CERTAIN MACHIME NEEDLES
(TA-201-38)
Notice of Investigation and Hearing
Investigation instituted. Following receipt of a petition on August
7, 1978, filed on behalf of The Torrington Co., Torrington, Connecticut, the
United States International Trade Commission on August 25, 1978, instituted an
investigation under section 20l(b) of the Trade Ac.t of 1974 to determine
whether needles for machines for making nonwoven or nonknit fabrics; needles
for knitting, embroidery, and other ~extile machines; and needles· for sewing
machines, except sewing machines designed for household use; provided for in
items 670.35; 670.58, 670.60, 670.62, 670.64, and 670.74; and 672.20 of the
Tariff Schedules of the United States (TSUS), are being imported into the
United States in such increased quantities as to be a substantial cause of
serious injury, or the threat thereof, to the domestic . industry producing an
article like or directly competitive with the imported article.
Public hearing ordered. A public hearing in connection with this
investigation will be held in Washington, D.C., at 10:00 a.m., e.s.t., on
Monday, November 20, 1978, in the Hearing Room,. U.S. International Trade
Commission Building, 701 E Street, N.W. Requests for appearances at the
hearing should be received in writing by the Secretary of the Commission at
his office in Washington not later than noon, Wednesday, November 15, 1978.

A-37
2
There will be a prehearing_conference in connection with this
investigation which will be he~d in Washington, D •. c., at 10:00 a.m., e.s.t.,
on Wednesday, November 15, 19.78, in Room 117, U.S. International Trade
Commission Building, 701 E Street, N.W.
Inspection of petition. The petition filed in this case is available
for public inspection at the Office of the Secretary, U.S. International Trade
Commission, and at the New York City office of the U.S. International Trade
Commission, located at 6 World Trade Center.
By order of .the Commission:
Issued: August 28 , 1978
Kenneth R. Ma"on Secretary

A-38

A-39
APPENDIX B
EXHIBITS OF Cf;RTAIN MACH!l\TE NEEDLES

··• ···· ····· ··-· -··--- . ·-· ····-. --·-·-·· ··-----······--···-·-······-----···-·-·-·· ··-·--· --·---··----------···----···-·· ·,BUTT! ""·-----------------KNITTING LENGTH- ·j~~~~!
~r----LATCHMOTlON- H-r-- r HOOK CHEEK LATCH : HOOK LENGTH 1 l ROUND OUT SHOULDER BUTT
i • 1 ~ '\ I HEIGHT - i HEIGHT THROAT NOUCAT I BLADE ) HEIGHT
.tr ~\ c.2_j_ . _,, I j_, ~ ~ - I I l I .CHEEK HEIGHT ~IVET LATCH STANDING 1 ·
HOOK DIAMETER
-- -----·--------·- ·~r-- . ·----------·-~·-·- .. - .
·--··-··-·· ·-···----·- __ _j ... · -----~-- . ···--··---------···-...,...---PRESSING/THICKNESS
_L
FRICTION BEND HEIGHT OF \_ FRICTION BEND
f;.. ... . ·=~ .. = """":w- l ----.....
HOOK WIRE GROOVE I FRICTION MILL ·--------_:...._:_ _ _],,
SI~- '-----_.;..---------.....,.---.----
- 16 -
........ > ll> rt rt n '< ::r.,O
'"'" ::s o CD Ill CD I-' 0.. ....... CD
-17-
~ ""'" 0

A-41
BASIC NEEDLE DIMENSIONS
A typical industrial eewing machine needle
THE TORRINGTO!~ COMPANY 3

t ! !
r f·
i t1 H f i ~ . ~. t. r \ I t .. I j ! ~
!1 t I
l I.
; •I
. i 'I ! I
VVhy you s.hould specify ·T~.rringlon Tufting Needles
TORRINGTON '~µ" ·-~,Jiil'$':'lt~~ pf :i'li~'r.'
.. :v· ~~ lllP."' l'~';.:;f~~ •":'= __ _
1. .SPECIALLY DRAWN STEEL
2. PRECISE. DIMENSIONAL CONTROL
·. ) .. ~PECIALLY DESIGNED FOR ALL OF '.'FO_DAYS BACKING
. 4;.,~ 1i1G'HLY POLISHED NEEDLE EYES .. 5. Po1'1h~ .. DESJ.G.N:ED. FOR EASE OF PENETRATION
6. TECHNICAL:'. .. _ASSISTANCE
7. AVAILABILITY ..,
The needles illustrated in this brochure represent our most popular types - however our line consists of over 150 different styles .. ·: ·
" ·. ·~ ~ {
NOTE: For ease of selection the needles In this broqhur¢ are arranged in needle bar sizes ranging from. '.060 through .185. .· · ...
. ' To as~·ist you 'furthe~. we ha'{_e dis.played on page 7 the ~ost .popular needle point types Qand take off styles used iA the industry today.
' . ~~ ,. ' . .....
SD - Shank Diameter 4 SL - Shank Length
BD
f
TERMINOLOGY
FOR DIMENSIONS 2 BD - Blade Diameter 5 Right Hand Take-Off
Can be left, right or both 3 OL - Overall Length
6 SUL - Spot Upper Line
NOTE: Use the above terminology whenever requesting a change or a new design in a tufting need le - - it wi II enable us to speed up your request.
I
! l rl l I . I ,.

POINT BARB
1 ~ BLADE .... I
.LCRANI<
, ..... BLAD£ ., ~JNT£RM£0/AT£ .. I
,.., Sl-IANK ..,., BLAD£
CHART SHOWING SINGLE BLADE and DOUBLE BLADE
TYPES
TM~ TnRRIMGTON COMPANY
ROW.3 180°
I
> rt '< "d .... 0 ID ...... H\ 11>. ..... rt .... ~ ::l · 11> 11> 0. ,.... 11>
>. I,
+>VJ

A~44 ..

A..,.45
APPENDIX C
SUPPLEMENTARY TABLES AND FIGURES

A-46
Table C-1.--Needles for felting machines (TSUS item 670.62)': U.S. imports for consumption, by principal sources, 1973-77, January-June 1977, and JanuaryJune 1978
. ... Source· 1973
West Germany----:· ***
1974
*** ***
1975
Quantity
*** ***
January-June--1976 1977
1977 1978
(l ,000.1.needles) . .
*** *** *** *** *** *** *** *** ..
wUr United Kingdom--: ***
Total-------:~~~ili~*~*,........~~-.-.'"'T- iHili iliiliili i'Urili il'iiTiiTi ***·
Percentage distribution, by quantity
West Germany----: *** *** *** *** *** *** *** United Kingdom-~: *** *** *** *** '. *** *** ***
Total-------: 100.0 100 .. 0 100.0 100.0 : 100.0 100.0 100.0
Value (1,000 dollars) !_/
West Germany----: *** *** *** *** *** *** *** United Kingdom--: *** *** *** *1**··: *** *** ***
Total-------: *** *** *** . *** : *** *** *** . Percentage distribution, by value
•· . West Germany----: *** *** *** ·: *** *** *** *** United Kingdom--: *** *** *** : *** *** *** ***
Total-------: 100.0 100.0 100.0 : 100.0 100.0 . 100.0 100.0
Unit value (cents per needle
West Germany----: *** *** *** *** *** *** *** United Kingdom--: *** *** *** *** *** *** ***
Total-------: *** *** *** N** *** *** ***
l/ F.o.b. foreign point of shipment value.
Source: Compiled from data submitted in response to questionnaires of the U.S. Internat~onal Trade Commission.

A-47.
Table C-2.--Latch needles (for knitting machines) (TSUS item 670.58): U.S. imports for consumption, h¥ principal sources, 1973-77, January-June 1977, and January-June 1978
January-June--Source 1973 1974 1975 1976 1977
1977 1978
Quantity (l,000 needles)
West Germany-----: 99,976 70,902 43,575 51,817 65' 133 33,141 40,592 Japan------------: 19,391 18,598 17,161 24,252 28, 727 12,834 16,35T Canada-----------: 17,826 14,391 9,147 10,901 13,691 8,875 10,181 Switzerland------: 3,138 5,112 5,197 14,894 11,324 4,583 4,333 Other------------: 17,019 23,045 12 2 373 13 2 328 14,436 7,541 7,382
Total--------~157,350 132 2048 87,453 115,192 :133,311 66,974 78,845
Percentage distribution, by quantity
West Germany-----: 63.5 53.7 49.8 45.0 48.9 49.5 51.5 Japan------------: 12.3 14.1 .. 19.6 21.1 21.6 19.2 20.8 . Canada-----------: 11. 3 10.9 10.5 9. 5. 10.3 13.3 12.9 Switzerland------: 2.0 3.9 5.9 12.9 8.5 6.8 5.5 Other------------: 10.9 17.4 14. 2 11.5 10.7 11.2 9.3
Total--------: 100.0 100.0 100.0 100.0 100.0 100.0 100.0
Value (1,000 dollars) 1/
West Germany-----: 12,939 10,521 7,612 8,499 10,047 3,825 8,626 Japan------------: 1,445 1,485 1,423 2,025 2,530 1,098 1,751 Canada-----------: 2,103 1,785 1,347 1, 711 1, 715 1,003 1,130 Switzerland------: 355 600 569 1,007 1,398 582 691 Other------------: 12424 22003 1,281 1,333 1 2 254 595 680
Total--------: 18,266 16,394 122232 14 2 575 16 2 944 72 103 12 2 878
Percentage distribution, by value
West Germany-----: 70.8 64.2 62.2 58.3 59.3 53.9 67.0 Japan------------: 7.9 9.1 11.6 13.9 14.9 15.5 13.6 Canada-----------: 11.5 10.9 11.0 11. 7 10.1 14.1 8.8 Switzerland------: 1.9 3.7 4.7 . 6. 9 8.3 8.2 5.4 Other------------: 7.9 12.1 10.5 9.2 7.4 8.3 5.2
Total--------: 100.0 100.0 100.0 100.0 100.0 100.0 100.0
Unit value (cents per needle)
West Germany-----: 12.9 14.8 17.5 16.4 15.4 11.5 21.3 Japan------------: 7.5 8.0 8.3 8.4 8.8 8.6 10.7 Canada-----------: 11.8 12.4 14.7 15.7 12.5 11.3 11.1 Switzerland------: 11.3 11. 7 11.0 6.8 12.4 12.7 16.0 Other------------: 8.4 8.7 10.4 10.0 8.7 7.9 9.2
Total--------: 11.6 12.4 14.0 12.7 12.7 10.6 16.3
1/ Customs import value.
Source: Compiled from official statistics of the U.S. Department of Commerce.

. A'.""48.
Table C-3.--Spring-beard needles (for knitting machines) (TSUS item 670.60): U.S. imports for consunption, by principal Sources, 1973-77, January-June 1977, And January-June 1978
January-June--Source 1973 1974 1975 1976 1977
1977 1978
Quantity (1,000 needles)
United Kingdom---: 2,474 0 0 0 3,819 2,429 1,304 West Germany-----: 12,155 17,521 14,794 .9' 630 11,221 5,453 7,413 Other------------: 2 1,486 1,074 1,005 .361 223 207
Total--------: 14,631 19,007 15,868 10,635 : ·15,401 8,105 8,924
Percentage distribution, .by quantity
United Kingdom---: 16.9 . 24.8 30.0 14.6 - . West Germany-----: 83.l 92.2 93.2 90.6 72.9 67.3 83.1 Other------------: 7.8 6.8 9.4 2.3 2.7 2.3
Total--------: 100.0 100.0 100.0 100.0 100.0 100.0 100.0
Value (1, 000 dollars) l/
United Kingdom---: 47 - . 74 38 40 West Germany-----: 396 613 530 381 372 135 394 Other------------: 45 34 49 28 17 36
Total--------: 443 658 564 430 474 190 470
Percentage distribution, by value
United Kingdom---: 10.6 - : - . - : 15.6 20.0 8.5 . West Germany-----: 89.4 93.2 94.0 88.6 78.5 71.1 83.8 Other------------: 6.8 6.0 11.4 5.9 8.9 7.7
Total--------: 100.0 100.0 100.0 100.0 100.0 100.0 . 100.0
Unit value (cents per needle)
United Kingdom---: 1.9 1.9 1.6 3.1 West Germany-----:· 3.3 3.5 3.6 4.0 3,3 2.5 5.3 Other------------: 3.0 3.2 4.9 7.8 7.6 17.4
Total--------: 3.0 3.5 3.6 4.0 3.1 2.3 5.3
l/ Customs import value.
Source: Compiled from official statistics of the U.S. Department of Commerce.

A-49
Table C-4. -.-Needl.es other than latch. needles or spring-beard needles for knitting machines (TSUS item 670.62): U.S. imports for consumption, by principal.sources, 1Q73-77, January-June 1977, and January-June 1978
. . January-June--Source 1973 1974 1975 1976 1977
1977 1978
Quantity (1,000 needles)
Switzerland------: 6 0 0 0 609 601 2 Spain------------: 18 0 0 0 478 478 4 United Kingdom---: 114 0 0 0 429 299 19 w. Germany-------: 2,335 0 0 0 322 204 158 Irelanj----------: 0 0 0 0 266 0 295 Other------------: 246 1,419 1 2 747 521 238 152 316
Total--------: 22719 1 2 419 1 2 747 521 22342 1,734 794
Percentage distribution, by quantity
Switzerland------: 0.2 - : .,... : 26.0 34. 7 0.3 Spain------------: 0.7 - : - : 20.4 27.6 0.5 United Kingdom---: 4.2 - . - : 18.3 17.2 2.4 . w. Germany------,-: 85.9 - : - : 13. 7 11.8 19.9 Ireland----------: - : - . - : 11.4 37.l . Other------------: 9.0 100 100 lQO 10.2 8.7 39.8
Total--------: 100.0 100 100 100 100.0 100.0 100.0
Value (1,000 dollars) 1)
Switzerland------: 1 - : 39 35 2 Spain------------: 5 - : 1 1 1 United Kingdom---: 13 - : 12 2 3 w. Germany-------: 108 - : 49 34 13 Ireland----------: 0 - : - : 9 0 13 Other------------: 18 29 78 73 38 20 8
Total--------: 145 29 78 73 148 92 40
Percentage distribution, by value
Switzerland------: 0.7 - : - : 26.4 38.0 5.0 Spain------------: 3.4 - : - : 0.7 1.1 2.5 United Kindgom---: 9.0 - : - : 8.1 2.2 7.5 w. Germany-------: 74.5 - : - : 33.l 37.0 32.5 Ireland----------: -+ - : - : 6.1 - : 32.5 Other------------: 12.4 100 100 100 25.6 21. 7 20 .0
Total--------: 100 100 100 100 100.0 100.0 100.0
Unit value (cents per needle)
Switzerland------: 16.7 6.4 5.8 100.0 Spain------------: 27.8 0.2 0.2 25.0 United Kingdom---: 11.4 2.8 0.7 15.8 w. Germany-------: 4.6 15.2 16.7 8.2 Ireland----------: - : 3.4 4.4 Other------------: 7.3 2.0 4.5 14.0 16.0 13.2 2.5
Total--------: 5.3 2.0 4.5 14.0 6.3 5.3 5.0
1./ Customs import value.
Source: Compiled from official statistics of the U.S. Department of Connnerce.

A~5o
Table c-5.--Needles for embroidery machines (TSUS item 670.74): U.S.- imports for consuraption, by principal sources, 1973-77, January-June 1977, and January-June 1978
January-June--Source 1973 1974 1975 1976 1977
1978
West Germany-------: 732 2, 772 Other--------------=~~1~5~9'--~~.;._.;;_-'--'--~_;;;.::;.""--.:.,__~...:...;:....:-...:....;_~..:;..:::..=-..:.._~_=..:::..:__.._~l~,~0~7~8=
Total----------:~~-8_91~~---''--~~~"'--~~~~-""-'-~~=....:'--''--~...:._:...::..,_..:.._~3~,~8~5~0:_
Percentage distribution, by quantity
West Germany-------: 82.2 49.9 72.3 89.3 91.9 91.7 72.0 Other--------------: 17.8 50.1 27.7 10.7 8.1 8.3 28.0
~~~~~~~~~~~~~~~~~~~-'----'~~~-=-~~~~
Total----------: 100.0 100.0 100.0 100.0 100.0 100.0 100.0 ~~-=-.:..-=---'--...=.::...::.....:....:........:...--..::.~~_:_--==..:~---:.--::..:::..:::...:...;:._:---=:.=...:....:::.._..:..__=..:::..::..:~
Value (1,000 dollars) 1./
West Germany-------: 62 78 104 311 351 167 192 Other--------------: 9 27 24 29 35 16 42
Total----------: 71 105 128 340 386 183 234
Percentage distribution, by value
West Germany-------: 87.3 74.3 81.3 91.5 90.9 91. 3 82.1 Other--------------: 12.7 25.7 18.7 8.5 9.1 8.7 17.9
Total----------: 100.0 100.0 100.0 100.0 100.0 100.0 100.0
Unit value (cents per needle)
West Germany-------: 8.5 10.4 12.1 5.3 6.1 6.6 6.9 Other--------------: 5.7 3.6 7.3 4.Z 6.9 7.1 3.9
Total----------: 8.0 7.0 10.8 5.2 6.2 6.7 6.1
1./ Customs import. value.
Source: Compiled from official statistics of the U.S. Department of Commerce.

A-51
Table C-6.--Needles for tufting machines (TSUS item 670.74): U.S. imports for consumption, by principal sources, 1973-77, January-June 1977, and JanuaryJune 1978
Source 1973
West Germany-------: *** Other--------------: ***
Total------------: *** ·•
West Germany-------: *** Other--------------: ***
Total----------: 100.0
West Germany-------: *** Other--------------: ***
Total----------: ***
West Germany-------: *** Other--------------: ***
Total----------: 100.0
West Germany-------: *** Other--------------: ***
Total----------: ***
January-June--1974 1975 1976 1977
1977 1978
Quantity (1,000 needles)
***• *** . ' • *** *** *** *** *** *** *** *** *** *** ***· *** *** *** *** ***
Percentage distribution, by quantity
*** *** *** *** *** *** *** ***
100.0 •. 100.0 100.0 100.0
Value (1,000 dollars) 1/
*** *** ***' *** ***" *** *** *** *** *** *** *** Percentage distribution, by value
*** *** *** *** *** : *** *** ***
100.0 100.0 100.0 100.0
Unit value (cents per needle)
*** *** *** *** *** *** *** *** *** *** *** ***
*** ***
100.0
*** *** ***.:
*** ***
100.0
*** *** ***
*** ***
100.0
*** *** ***
*** ***
100.0
*** ***
1/ F.c.b. foreign point of shipment value.
Source: Compiled from data submitted in response tQ questionnaires of the U.S. International Trade Commission.

A-52
Table C-7.--Needles for industrial sewing machines (TSUS item 672.20): U.S. il::tports for consumption, by principal sources, 1973-77, January-June 1977, and JanuaryJune 1978
January-June--Source 1973 1974 1975 1976 1977
1977 1978
Quantity (1,000 needles)
West Germany-------: 93,521 87,373 47,392 61,410 64,657 36,935 29,609 Japan--------------: 20,813 18,458 20,,64'5 21,086 23,822 16,558 8,128 United Kingdom-----: 41,438 42,254 29,033 : 35,549 32,497 16,147 12,353. Belgium------------: 3 7, 514 41, 4.60 .32, 558 2 9, 693 22, 603 9, 458 12, 166 Portugal-----------: *** *** ~** *** *** *** *** Other--------------: 11,289 9,684 6,837 8;835 11,805 6,454 8,749
Total----------: *** *** .. *** .. *** *** *** *** ~~~~~~~___;;..:._~~~::.;._~~~=--~~~~~~~~__;~.::.:.:.~
Percentage distribution, by quantity
West Germany-------: *** *** *** *** *** *** *** Japan--------------: *** *** *** *** *** *** *** United Kingdom-----: *** **~' *** ***· *** *** *** Belgium------------: *** *** *** *** *** *** *** Portugal-----------: *** *** *** *** *** *** *** Other--------------=~~-*-*-*~'--~-*-*-*~.:.....~-**~*:--'----::-c~·*~*-*:-.:_-:-~*~*-*,,---=--~---*-*~*:......:~~~~*~*:.::*
Total----------: 100.0 100.0 100.0 100.0 100.0 100.0
Value (1,000 dollars) ±_/
West Germany-------: 5,760 6,416 4,575 6,192 6,761 3,599 Japan--------------: 653 632 940 783 832 496 United Kingdom-----: 1,838 1,992 1,698 2,060 1,891 969 Belgium------------: 972 1,148 1,316 1,418 1,399 622 Portugal-----------: *** *** *** *** *** ***
100.0
3,573 486 924 877 ***
Other--------------: 333 347 299 386 538 236 411 Total----------:~~-*-*-*~~~-*~-'-**-'-~~~*~*~*-.:.~~~*~*~*'-'~~~*~*~*::.....::__~~*~*~*::__.:__~~....:::!.*=.=**
West Germany-------: *** Japan--------------: *** United Kingdom-----: *** Belgium------------: *** Portugal-----------: ***
Percentage distribution·, by value
*** *** *** ***. ***
***
*** *** *** *** *** ***
*** *** *** *** *** ***
*** *** *** *** ***• ***
*** *** *** *** *** ***
*** *** *** *** *** *** Other--------------: ***
Total----------:~1~0~0~.~0~~1-o~o-.-o~---:1-o-o-.o-:--'----1-o-o-.o---=~-10-0-.-o--=-~1-o-o-.-o--=-~-1-o-o-.~o
West Germany-------: Japan--------------: United Kingdom-----: Belgium------------: Portugal-----------: Other--------------:
Total----------:
6.2 3.1 4.4 2.6 *** 3.0 *"!:·::
7.3 3.4 4.7 2.8 *** 3.6 ***
Unit value (cents per needle)
9.7 4.6 5.9 4.0 *** 4.4 ***
10.1 3.7 5.8 4.8 *** 4.4 **"
10.5 3.5 5.8 6.2 *** 4.6 ***
1/ F.o·b· foreign point of shipment or customs import value.
9.7 3.0 6.0 6.6 *** 3. 7 ***
12.1 6.0 7.5 7.2 *** 4.7 ***
Source: Fc1r l.ermany and .Japan, vcarly ratios of industrial sewing machine needles t~o 1·:11«1 l sewing machine needles as c:lerived from offj cial t;erman and Japanese export -;tat;.: i.-.·. w~ri: .q'1•l ie•I to offici;1l U.S. Department rof c;,,r.,n•'rce statistics; for all othr.t· counrr.i•_•s \'X• e,•L l'ortugal,whose imports were deri·1"'d from responses to U.S. International Tr-:H;e Con!!li!.i:i ';1 questionnaires, a fixed pen:•:ntage based on U.S. C:11stoms St•rviC'E' ""'' ~r.ialf''l •vas appl:cd to official U.S. Di:: 1,arr!1•·nt of Commerce statistics.

Table C-8.--Needles for felting machines: U.S. producers' shipments, imports for consumption, exports of domestic merchandise, and apparent consumption, 1973-77, ,Tanuary-June 1977, and January-June 1978
Period
(Quantity in millions of needles; value in millions of dollars)
Producers' shipments
Imports
Exports Apparent consumption
Ratio (percent) of imports to consumption
U.S. : All producers · others Total U.S.
producers All
others Total
1973---------------: 1974---------------: 1975---------------: 1976---------------: 1977---------------: January-June--
73.1 76.8 55.8 74.0 82.2
*** *** *** *** ***
*** *** *** *** ***
*** *** *** *** ***
Quantity
*** *** *** *** ***
*** *** *** *** ***
*** *** *** *** .. ***
*** *** *** *** ***
e* 1977-------------: 43. 4 : *** : *** : . *** : *** : *** : *' . .
*** *** *** *** ***
1978-------------: 41. 2 : *** : *** : *** : *** : *** : *** : *** : ***
1973---------------: 1974--~------------: 1975---------------: 1976---------------: 1977---------------: January-June--
1.9 7 7------------- : . 19 7 8------------- :.
2. 3 : 2. 7 : 2 .o : 2. 7 : 3. 2 :
1. 7: 1.8:
*** *** *** *** ***
*** ***
*** ·*** *** *** ***
*** ***
*** *** *** *** ***· *** ***
1/ *** Jj F.o·~·b. foreign point of shipment or customs import value.
Value
*** *** *** *** *** *** ***
*** *** . *** *** ***
*** ***
*** *** *** *** ***
*** ***
*** *** *** *** ***
***-: ***
*** *** *** *** ***
*** ***
Source: Compiled from data submitted in response to questionnaires of the U.S. International Trade Commission and from official statistics of the U.S. Department of Connnerce.
~ Vl VJ

Table C-9.--Latch needles (for knitting machines): U.S. producers' shipments, imports for consumption, exports of domestic merchandise, and apparent consumption, 1973-77, January-June 1977, and January-June 1978
Period
(Quantity in millions of .needles; value in millions of dollars)
Producers' shipments
Imports
Exports Apparent consumption
Ratio (percent) ·of imports to consumption
Total U.S. : All producers · others
U.S. producers
All others Total
1973---------------: 1974---------------: '1975---------------: 1976---------------: 1977---------------: January-June--
1977-------------:
154.6 128.5 105.3 109.8 116.9
*** *** *** ***" ***
*** *** *** *** ***
157.3
132.0 87.5
115.2 133.3
Quantity
*** *** ·*** *** ***
67.0 : ***
'**'* *** *** *** ***
*** *** *** *** ***
**'111 *** *** . *** ***
..
1978-------------: v' • _, : ····-- ; ... ,.. .. ; ,, ...... •' ; ---- ; ; ; ; *** *** 7.8. 8 • ***
*** *'1Ht
59.0 62 ')
*** ***'
*** ***
*** ***
1973---------------: 1974---------------: 197 5--------------- :· 1976---------------: 1977---------------: January-June--
1977--~----------: 1978-------------:
21. 4 19.7 17.1 19.7 21.1
11. 2 10.3
_;c- *** *** *** *** ***
*** ***
. *** .1/18.3 *** ~l/16.4 *** ~T/12.2 . *** ;1;14.6 *** .l/16.9 • .. -.. *** . 1/ 7 .1 *** :-1/12.9 .. _
]:../ F.o.b. foreign point of shipment or customs import value.
Value
*** *** *** *** ***
*~":*
***
*** *** *** *** ***
*** -·· . ***
*** **·* *** *** ***
*** ***
*** *** *** . *** ***
*** ***
.
*** *** *** *** ***
*** ***
*** *** *** *** '***
*** ***
Source: Compiled from data submitted in response to questionnaires of the U.S. International Trade Commission and from official statistics of·the U.S. Department of Commerce.
ii> I
Vt ~

Table G-10.--Spring-beard needles (for knitting machines): U.S. producers' shipments, imports for consumption, exports of domestic merchandise, and apparent consumption, 1973-77, January-June 197~ and January-June 1978
(Qua~tity in millions of needles; value in millions of .dollars)
Period
1973---------------: 1974---------------: 1975---------------: 1976---------------: 1977---------------: January-June--
1977-------------: 1978-------------:
1973---------------: 1974---------------: 1975---------------: 1976---------------: 1977---------------: January-June--
1977-~~---------:
1978-------------: . .
Producers' shipments
*** ***
.. -*** ***
: : . . . *.,..* . .
*** . *** : *** :
*** ·: *** : *** : *** : **~ :
*** : 'titfl : ' < '
Imports
U.S. prod.ucers·
*** . . .
*** . . ***
. . *** . *** . . ***' . *** : *** :
*** : *** : *** : *** : *** :
*** : *** :
All others Total
. : ***
. 14.6 . .
*** . . 19.0 : *** . 15.7 : *** . 10.6 : *** .
*** : 15.4 :
*** : 8.1 : *** : 8.9 :
: , *** : 1/0.4 : - *** : l/ .7 : *** : l/ . 6 : *** : l/ .4 : *** : J.j . 5 =
*** : 1/ • 2 : *** : I_! .5 ;
1/ F.o.b. foreign point of shipment or customs import value. 2.1 ***
Exports
Quantity
*** . . *** . . *** . *** . . *** . *** : *** : ·*** :
Value
*·a,,';* : *** : *** : *** : *** :
*** : *** :
Apparent consumption
*** . *** . *** : . "*** . . *** . . *** . *** : *** :
*** : *** : *** : *** ***
**"' : *** :
Ratio (percent) ·of imports to consumption
U.S. producers
All others Total
*** *** . *** . **-I: . *** . *** . *** . *** . *** *** . *** ~ *** . *** . *** . *'** . . t:** • *** . *** *** : *** : ***
. *** : *** : ***
*** : *** : *** *** : *** : *** *** : *** : -*** *** : *** : *°!'* **-15 • *** . ***
*** : *** : *** *** : *** : ts."lf*
Source: Compiled from data submitted in response to questionnaires of the U.S. International Trade Commission and from official statistics of the U.S. Department of Commerce.
> I·
VI VI

Table C-11.--Needles other than latch or spring-beard for knitting machines: U.S. producers' shipments, imports for consumption, exports of domestic merchandise, and apparent consumption, 1973-77, January-June 1977, and January-June 1978
(Quantity in thousands of needles; value in thousands of ~ollars) ~~~~~~~~~~~~~~~~~~~~-""-~~~- -~~~~--'-~~~--'---~~~~~~~~~~~~
Period Producers' shipments
1973---------------: *** : 1974---------------: *** : 1975---------------: *** : 1976---------------: *** : ·1977---------------: *** : January-June-- : :
1977-------------: *** : 1978-------------: *** :
1973---------------: *** : 1974---------------: *** : 1975---------------: *** : 1976---------------: *** : 1977---------------: *** : January-June--
1977-------------: *** : 1978-------------: *** :
1/ Not available.
Imports Ratio (percent) of imports E . Apparent : to consumption
U.S. : All : T 1
: xports : consumption : U.S. : All : T 1 ota ota
producers _:_~thers _:___ _:_ : : producers : others :
1/ : l/ : I.I :
*** : *** :
:
*** : *** :
]J : 1/ : IJ :
':***' : *** :
2/ : ]) :
1/ : 2, 719 l/ : 1,419 I.I : 1,747
***: 521 *-3-*. 2,342
: ***. 1,734 . ***. 794
1:_/ : !:._/ 145 1/ : 2/ 29 Il : 2./ 78
2/ : 2./ 73 ll : Tl 148
2/ : 2/ 92 It : I/106
Quantity
*** *** *** *** ***
*** ***
Value
**i< *** *** **)~
***
*** ***
*** *** *** *** ***
*** ***
**)~
*** *** *** ***
*** ***
1/ l/ !/
!/ 1/ 1/
: : :
*** : *** :
: *** : *** .
: : :
**k : *** .
*** :
*** :
1/ : *** l/ : *** I! : ***
*** : *** ***' : ***
: *** : *** ***' . *** --
!/ : *** 1/ : *** I/ : ***
***. : *** *** : ***
:
*** : *** *** : ***
""%../ F.o.b. foreign point of shipment or customs import value.
Source: Compiled from data submitted in response to questionnaires of the U.S. International Trade Commission and from official statistics of the U.S. Department of Commerce.
> I
1./1 • Cl'

Table C-12.--Needles for embroidery machines: U.S. producers' shipments, imports for consumption, exports of domestic merchandise, and apparent consumption, 1973-77, January-June 1977, and January-June 1978
Period
(Quanti_ty in thousands of needles; value in thousands of dollars)
Producers' shipments
Imports
U.S. . All producers : others
Exports
Total
Quantity
Apparent consumption
Ratio (percent) ·of imports to consumption
U.S. . All producers.: others Total
1973---------------· *** . *** . *** . ·891 *** *** : *** : *** : *** . . . : . . . 1974---------------. *** . *:~* . *** . 1 508 . *** . *** . *** . *** . *** . . ' ' . . . . .
'1975---------------: ***: *** . ***. 1,18~. ***. ***: ***. ***. *** 1976---------------· *** . *** : *** . 6 523 : *** *** . *** *** . *** . . . . ' . . . . . 1977---------------: *** ~ *** . *** . 6,258 *** *** . *** . *+* . *** January-June-- . . . .
1977-------------· *** . *** . *** . 2 748 : *** *** . *** . *** . *** ~ . . ' . . . . .......-
1978-------------. *** . *** . *** . 3 850 • *** *** . *** . *** . *** '· • • • , • • • • • V1 . . . .........
Value . . .
1973---------------: *** : *** · 1/ *** . 1/ 71 : *** ; ***-" *x* : *** : *** 1974---------------: *** : *** : I! *** : I! 10s : *** . *** . *** : *** : *** 1975---------------· *** . *** . 1/ *** . l/ 128 • *** . *** *** . *** *** • • • - • - . 340 • : : * * . *** 1976---------------: *** : *** : 1/ *** : li : **7- . *** . *** . * 1977---------------: *** : *** : 1/ *** : . l/ 386 : *** . *** . *** . *** . *** January-June-- : : : - : - : : . . .
1977-------------: *** : *** . 1/ *** : 1/ 183 : *** . *** : *** . *** . *** 1978-------------: *** : *** : T.! *** . T.! 234 . *** . *** *** . *** . *** - . ~- . .
1..1 F.o.b. foreign point -of shipment or customs import value.
Source: Compiled from data submitted in response to questionnaires of the U.S. International Trade Commission and from official statistics"of the U.S. Department of Commerce.

Table C-13.--Needles for tufting machines: U.S. producers' shipments imports for consumption exports of domestic merchandis~ and apparent consumption, 1973-77, January-JJne I97~ and January-Jun~ 1978
(Quantity in millions; value in millions of dollars) . . . . Imports ; ; ; Ratio (percent) ·of
• Producers' : • • A t _ imports to consumption Period · Exports • pparen
shipments : U.S. : All : : : consumption • U S . All
d : : Total : : : • • · • Total pro .ucers • others . . producers · others • . . . Quantity
. . . 1973---------------· *** . *** . *** . *** . *** . *** . **fl- . *** . *** . . . . . . . . 1974---------------· *** . *** . *** . *** . *** : *** . ***-. *~· . *** . . . . . . . . . 1975--------------· ~~ . *** . *** . *** *** ***· *** . *** . *** . . . . . . . . 1976---------------· *** . ***'• *** . *** . *** . *** *** . *** . **~
. 1977---------------: *** : *** : *** : *** : *** . *** . *** : ***. : *** . . . . . . : . . . January-June-- . _ _ • • •·
1977-------------· *** . *** . ***'· *** . *** . *** *** *** *** . . . . . . : . . > 1978------4!-----· *** • **~ • ***· • *** . *** . *** *** • *** • *** ·I • • • • • • : : : \Jl•
Value .
1973-----------: *** : *** • 1/ ~** . 11.*** : *** . *** . *** . *** . *** 1974---------------. *tj . *** : l/ *** : l/.***- : **'" : *** . **.* . *** . *** . . . . - .. - )• . : : 1975--------------· *** .. *** . 1/ *** . l/~**" . *** . *** *** *** -*** . . . . . . . 1976--------------: *** ... : *** : l/ *** : l/*** : *** : *** : *~* : *** : *** 1977---------------: *** : *** : Il *** ; l/.,** ;. ~** . *** • *** . *** . *** January-June- : : : : • • •
1977------------· *** • *** . 1/ *** . l/*** : ·k** : ***~: *** . *** *** i918------------; *** ; *** ; I/ •*'* ; . l/*** . ~** . *** *** : *** : ***
ll F.o.b. foretgn point of shipment or customs import value.
Source: Compiled from data submitted in response to questionnaires of the U.S. International Trade Commission and from official statistics of the U.S. Department of Commerce.
00

Table C-14.--Needles for industrial sewing machines (TSUS item 672.20): U.S. producers' shipments, imports for consumption, exports of domestic merchandise, and apparent consumption, 1973-77, January-June 1977, and January-June 1978
Period
. . {Quantity in millions of needles; value in millions of dollars)
Producers' shipments
Imports
Exports Apparent consumption
Ratio (percent) ·of ·' imports to consumption
U.S. . All producers : others Total U.S. : All
producers : others Total
.. . *** . 1973---------------: . *** : 1974---------------: *** . '1975---------------: . *** : 1976-------------~-: *** : 1977-----------~---:
January-June--*** . 1977-------------: .
1978-------------: *** :
1973---------------: *** : 1974---------------: *** . . 1975---------------: *** : 1976---------------: *** . . 1977---------------: *** . . January-June-- . : .
1977--~---------: *** . . 1978-------------: *** :
*** *** *** *** ***
*** ***
1/ l/ ii l/ 1/ 1/ 1/
: . . . . . . . . : :
204 . .5 199.3 136.5 156.6 155.3
85.5 71.0
*** *** *** *** ***
*** ***
: 1./ 9.5 :1_/*** :1/ 10.5 :l/*** :-1/ 8.8 :lf*** :17 lo.a :I./*** : 1/ 11. 4 :ll*** . . . . • 1/ 5. 9 : l/*** . - -• 1/ 6.2 -1/*** . - ·-. . .
~F.o.b. foreign ~oint of ship~ent or custo~s import value.
Quantity
*** : *** : '*** . *** . *** . . : *** *** : *** : *** . *** . : *** *** : *** : *** *** . .
*** : *** *** . *** . *** : . . *** **'Ii.. : *** . *** : **x· .
: . : . *** *** : *** : *** . *** . *** *** ! *** : *** : *** --
Value . .
*** *** : *** : *** : *** *** *** : ***' . *** : *** . *** *** : *** : *** . *** . *** *** : ***
. ***
. *** . .
*** *** : *** : *** : *** : . . . .
*** *** . *** : *** : *** . *** *** : *** : *** : ***
Source: Compiled from data submitted in response to questionnaires of the U.S. International Trade Commission and. from official statistics of"the U.S. Department of Commerce.
:i;. .. ., . Vt l.O

1,000
A-60.
Figure 1.--Latch needles: U.S. imports for consumption, 1973-77.
needles
ll
I!.
II.
I.
' ' ' ' ' \ \
\ k \ /
\ / \ /
\ // y
x-----~-x actual imports
trend line
1------~---+-~----~r----~----t-~----~~
~ ~
Source: Compiled and derived from data presented· in table 6.

1,000 needles
l
ll
l •'"'. J!D
A-61 .. i
Figure 2. --Spring-beard needles: . U.S. imports. for consumption, 1973-77.
,, I '
I '
, . ,.
I ', I '
'
-------- actual imports
---- trend line
\ \
\ .. / \ I
\ I \ I y
Source: Compiled and derived from data presented in table 6.

1,000 needles
l
2. \ \
I.
I.
l
l!J]
\ \ \ \
\ \ \
.4.-62
Figure 3.--Needles for knitting machin~s other than latch or spring-beard: U.S. imports for consumption, 1973-77.
\ \ / \ l/ \ I \ I \ I \
\ I ------ actual imports \ I
trend line \ I \ I \I ~
Ill
I
I I I I I I I
1!11
Source: Compiled and derived from data presented in table 6.
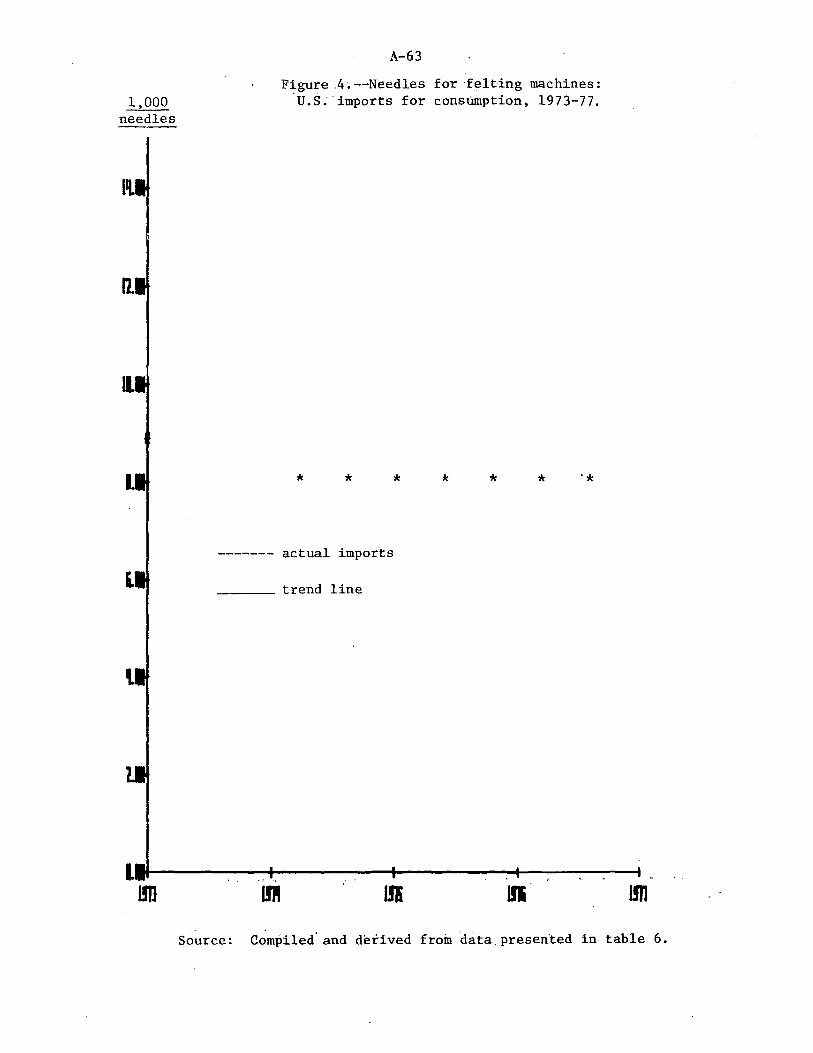
1,000 needles
l'l
11.
I
A-63
Figure .4 ·.--Needles for ·felting machines: U.S. imports for constimption, 1973-77.
* * * * *
------- actual imports
____ trend line
L----~----1----~--__._--~-----4-~~~--4
lJJ] Ill 1!11
Source: Compiled' and derived froin ·data.presen"ted in table 6.

1,000 needles
1.
l
\
1
IJD
A-64· Figure 5.--Needles tor embroidery machines:
U.S. imports for consumption, 1973-77.
x~--~--x actual imports
---- trend line
I I I I I I I I I
~........ I .................... ~
1-- ....... I r I I I I I I
-- ......
Source: Compiled and derived from data presented in table 6.

1.000 needles
I.
I.
l
A-65
Figure 6.--Needles for tufting machines: : '. u. s. imports for. con'Sumption, 197 3-77.
* * * * * *
X-------X actual imports
trend line
IDI
*
Lm
Source: .Compiled and deriv~d from data presented in table 6.

1,000 needles
2ee.1t '
I I ! I
116.l!ll! I
l I
~a.if
I
.A-66
Figure 7._.-Needles for industrial sewing machines: imports for consumption, 1973-77.
* * * * * * *
X-------X actual.imports
---- trend line
U.S.
e.~1--~~--~~+1~~~~~---11~~~~~---l1~~~~~~1 1911 1m 1m 1m 1m
Source: Compiled and derived from data presented in table 6.

1,000 needles
988.
JBB.8H
IHH.lm
Figure 8.--Certain machine needles: U.S. imports for consumption 1973-77.
X-------X actual i~ports
---- trend line
H.rilM---------+------+--------t---------t
191] 1916 l!fTJ
Source: Compiled and derived from data presented in table 6.

Percent
II
I
!
A-68
Figure 9.--Latch needles: Ratio of imports to production, 1973-77.
* * * * *
X-------X actual ratio of imports to production
~~~~- trend line
i--~~~---f.-~~~--t--~~~-+~~~~~
~
Source: Compiled and derived from data presented in table 6.

Percent
l
I.
I
l
A-69
Figure 10.--Spring-beard needles: Ratio of imports to ·productfon, 1973-77.
* * * * * *
X-------X actual ratio of imports to production
trend line
Source: Compi.J._ed and d.erived from .data ·presented ,in table 6 •.

A-70
Figure 11.--Needles for knitting machines other than latch or spring-beard: Ratio of imports to production •. 1973-77.
Percent
2.
I.! ·x------X actual ratio of imports ~o production
---- trend iine
I.
I.!
I. * * * * *' * '' *
I.!
l
l!
1-----------------+------------1-----------........ ---------1 IJll l!PI l!I 1!11
Source: Compiled and derived from data presented in table 6.

Percent
l
({.
A-71
·Figure 12.--Needles for felting machines: Ratio of " imports to production, 1973-77.
* * * * * * *
x-~----..:._X actual ratio of imports to production
~~~~~- trend line
Source: Compil~d and derived from data presented in table 6.

Percent
•
151.
II.
.A-72
Figure 13.--Needles for tufting machines: of imports to production, 1973-77.
X--------X actual ratio of imports to production
trend line
* *· * * * * *
Ratio •
t--~~~~~~~~~-t-~--~--1----------t
~ IB
Source: Compiled and derived from data presented in table 6.

Percent
7DH.Mt
I 681.~
I
I I
~BH.~t i I ! i
I
408.~l I ! j !
.i l
i ! I I
2IDUIDf ! I ;
I lHB.HHt
I I
A-73
Figure 14.--Needles for industrial sewing machines: Ratio of imports to production, 1973-77.
* * * * * * *
X---------X actual ratio of imports to production
---- trend line
ff.~J~·~~~~~----1-1~~~~~~~1~~~--~---'i~~~~~~1 l9iJ 19711 197~ 1976 1971
Source: Compiled and derived from data presented in table 6.

Percent
21H.,
I
l~H.
IHB.B
~B.
--
A-74 Figure 15.--Certain machine needles: Ratio of
· imports to production, 1973-77.
--- -- / . -......-
X--------X actual ratio of imports to production
_____ trend line
B.W-------+-------1-------t--------1
191] I 9711 1976 1971
Source: Compiled and derived from data presented in table 6.

APPENDIX D
PROBABLE ECONOMIC EFFECTS OF TARIFF CHANGES UNDER TITLE I AND TITLE V OF THE TRADE
ACT OF 1974 FOR TRADE AGREEMENT DIGESTS NOS. 60236 AND 60237

.A-76
* * * * * * *
A~75
APPENDIX D
PROBABLE ECONOMIC EFFECTS OF TARIFF CHANGES UNDER TITLE I AND TITLE V OF THE TRADE
ACT OF 1974 FOR TRADE AGREEMENT DIGESTS NOS. 60236 AND 60237

A-76
• • • • • *

Library Cataloging Data
U.S. International Trade Commission. Certain machine needles. Report to
the President on investigation no. TA-201-38 under section 201 of the Trade Act of 1974. Washington, 1979.
34, A-76 p. illus. 28 cm. (USITC Publication 936)
1. Pins and needles. I. Title. II. Title: Machine needles.

UNITED STATES
INTERNATIONAL TRADE COMMISSION WASHINGoTON. O.C. 20436
OFFICIAL BUSINESS
ADDRESS CORRECTION REQUESTED
ADDRESS CHANGE O Remeve from. list O Change as Shown
Please detach address label and mail to address shown above.
Postage And Fees Paid U.S. International Trade Commission ~ --uswa.