certain off-the-road tires from china · u.s. international trade commission publication 4031...
TRANSCRIPT
U.S. International Trade CommissionPublication 4031 August 2008
Washington, DC 20436
Certain Off-The-Road Tires from ChinaInvestigation Nos. 701-TA-448 and 731-TA-1117 (Final)

U.S. International Trade Commission
COMMISSIONERS
Shara L. Aranoff, ChairmanDaniel R. Pearson, Vice Chairman
Deanna Tanner OkunCharlotte R. Lane
Irving A. WilliamsonDean A. Pinkert
Staff assigned
Address all communications toSecretary to the Commission
United States International Trade CommissionWashington, DC 20436
Robert A. Rogowsky
Director of Operations
Elizabeth Haines, InvestigatorRaymond Cantrell, Industry Analyst
Clark Workman, EconomistDavid Boyland, AccountantRhonda Hughes, Attorney
Steven Hudgens, Senior Statistician
James McClure, Supervisor Investigator
Special assistance from
Russell Duncan
U.S. International Trade CommissionWashington, DC 20436
www.usitc.gov
Publication 4031 August 2008
Certain Off-The-Road Tires from ChinaInvestigation Nos. 701-TA-448 and 731-TA-1117 (Final)


i
TABLE OF CONTENTS
Page
Determinations . . . . . . . . . . . . . . . . . . . . . . . . . . . . . . . . . . . . . . . . . . . . . . . . . . . . . . . . . . . . . . . . . 1Views of the Commission . . . . . . . . . . . . . . . . . . . . . . . . . . . . . . . . . . . . . . . . . . . . . . . . . . . . . . . . . 3Additional and dissenting views of Vice Chairman Daniel R. Pearson . . . . . . . . . . . . . . . . . . . . 33
Part I: Introduction . . . . . . . . . . . . . . . . . . . . . . . . . . . . . . . . . . . . . . . . . . . . . . . . . . . . . . . . . . . . I-1Background . . . . . . . . . . . . . . . . . . . . . . . . . . . . . . . . . . . . . . . . . . . . . . . . . . . . . . . . . . . . . . . . . . I-1Statutory criteria and organization of the report . . . . . . . . . . . . . . . . . . . . . . . . . . . . . . . . . . . . . . I-2
Statutory criteria . . . . . . . . . . . . . . . . . . . . . . . . . . . . . . . . . . . . . . . . . . . . . . . . . . . . . . . . . . . I-2Organization of the report . . . . . . . . . . . . . . . . . . . . . . . . . . . . . . . . . . . . . . . . . . . . . . . . . . . . I-3
U.S. market summary . . . . . . . . . . . . . . . . . . . . . . . . . . . . . . . . . . . . . . . . . . . . . . . . . . . . . . . . . . I-3Summary data and data sources . . . . . . . . . . . . . . . . . . . . . . . . . . . . . . . . . . . . . . . . . . . . . . . . . . I-3Previous and related investigations . . . . . . . . . . . . . . . . . . . . . . . . . . . . . . . . . . . . . . . . . . . . . . . . I-4Nature and extent of subsidies and sales at LTFV . . . . . . . . . . . . . . . . . . . . . . . . . . . . . . . . . . . . I-4
Subsidies . . . . . . . . . . . . . . . . . . . . . . . . . . . . . . . . . . . . . . . . . . . . . . . . . . . . . . . . . . . . . . . . . I-4Sales at LTFV . . . . . . . . . . . . . . . . . . . . . . . . . . . . . . . . . . . . . . . . . . . . . . . . . . . . . . . . . . . . . I-5
The subject product . . . . . . . . . . . . . . . . . . . . . . . . . . . . . . . . . . . . . . . . . . . . . . . . . . . . . . . . . . . . I-7Scope . . . . . . . . . . . . . . . . . . . . . . . . . . . . . . . . . . . . . . . . . . . . . . . . . . . . . . . . . . . . . . . . . . . . I-7Tariff treatment . . . . . . . . . . . . . . . . . . . . . . . . . . . . . . . . . . . . . . . . . . . . . . . . . . . . . . . . . . . . I-9
The domestic like product . . . . . . . . . . . . . . . . . . . . . . . . . . . . . . . . . . . . . . . . . . . . . . . . . . . . . . . I-10Physical characteristics and uses . . . . . . . . . . . . . . . . . . . . . . . . . . . . . . . . . . . . . . . . . . . . . . . I-10Manufacturing processes . . . . . . . . . . . . . . . . . . . . . . . . . . . . . . . . . . . . . . . . . . . . . . . . . . . . . I-12Channels of distribution . . . . . . . . . . . . . . . . . . . . . . . . . . . . . . . . . . . . . . . . . . . . . . . . . . . . . . I-16Price . . . . . . . . . . . . . . . . . . . . . . . . . . . . . . . . . . . . . . . . . . . . . . . . . . . . . . . . . . . . . . . . . . . . I-18
Domestic like product issues . . . . . . . . . . . . . . . . . . . . . . . . . . . . . . . . . . . . . . . . . . . . . . . . . . . . I-19Physical characteristics and uses . . . . . . . . . . . . . . . . . . . . . . . . . . . . . . . . . . . . . . . . . . . . . . . I-19Common manufacturing facilities and production employees . . . . . . . . . . . . . . . . . . . . . . . . I-19Interchangeability . . . . . . . . . . . . . . . . . . . . . . . . . . . . . . . . . . . . . . . . . . . . . . . . . . . . . . . . . . I-21Customer and producer perceptions . . . . . . . . . . . . . . . . . . . . . . . . . . . . . . . . . . . . . . . . . . . . I-21Channels of distribution . . . . . . . . . . . . . . . . . . . . . . . . . . . . . . . . . . . . . . . . . . . . . . . . . . . . . . I-22Price . . . . . . . . . . . . . . . . . . . . . . . . . . . . . . . . . . . . . . . . . . . . . . . . . . . . . . . . . . . . . . . . . . . . I-23
Part II: Conditions of competition in the U.S. market . . . . . . . . . . . . . . . . . . . . . . . . . . . . . . . . II-1U.S. market segments/channels of distribution . . . . . . . . . . . . . . . . . . . . . . . . . . . . . . . . . . . . . . . II-1Supply and demand considerations . . . . . . . . . . . . . . . . . . . . . . . . . . . . . . . . . . . . . . . . . . . . . . . . II-1
U.S. supply . . . . . . . . . . . . . . . . . . . . . . . . . . . . . . . . . . . . . . . . . . . . . . . . . . . . . . . . . . . . . . . II-1U.S. demand . . . . . . . . . . . . . . . . . . . . . . . . . . . . . . . . . . . . . . . . . . . . . . . . . . . . . . . . . . . . . . II-3Demand outside of the United States . . . . . . . . . . . . . . . . . . . . . . . . . . . . . . . . . . . . . . . . . . . . II-4
Substitutability issues . . . . . . . . . . . . . . . . . . . . . . . . . . . . . . . . . . . . . . . . . . . . . . . . . . . . . . . . . . II-5U.S. purchasers . . . . . . . . . . . . . . . . . . . . . . . . . . . . . . . . . . . . . . . . . . . . . . . . . . . . . . . . . . . . II-5Factors affecting purchasing decisions . . . . . . . . . . . . . . . . . . . . . . . . . . . . . . . . . . . . . . . . . . II-6Comparisons of domestic products and subject and nonsubject imports . . . . . . . . . . . . . . . . II-9
Elasticity estimates . . . . . . . . . . . . . . . . . . . . . . . . . . . . . . . . . . . . . . . . . . . . . . . . . . . . . . . . . . . . II-11U.S. supply elasticity . . . . . . . . . . . . . . . . . . . . . . . . . . . . . . . . . . . . . . . . . . . . . . . . . . . . . . . . II-11U.S. demand elasticity . . . . . . . . . . . . . . . . . . . . . . . . . . . . . . . . . . . . . . . . . . . . . . . . . . . . . . . II-11Substitution elasticity . . . . . . . . . . . . . . . . . . . . . . . . . . . . . . . . . . . . . . . . . . . . . . . . . . . . . . . II-11
ii
TABLE OF CONTENTS–Continued
Page
Part III: U.S. producers’ production, shipments, and employment . . . . . . . . . . . . . . . . . . . . . . III-1U.S. producers . . . . . . . . . . . . . . . . . . . . . . . . . . . . . . . . . . . . . . . . . . . . . . . . . . . . . . . . . . . . . . . III-1U.S. capacity, production, and capacity utilization . . . . . . . . . . . . . . . . . . . . . . . . . . . . . . . . . . . III-1U.S. producers’ shipments . . . . . . . . . . . . . . . . . . . . . . . . . . . . . . . . . . . . . . . . . . . . . . . . . . . . . . III-5U.S. producers’ inventories . . . . . . . . . . . . . . . . . . . . . . . . . . . . . . . . . . . . . . . . . . . . . . . . . . . . . III-12U.S. producers’ imports and purchases . . . . . . . . . . . . . . . . . . . . . . . . . . . . . . . . . . . . . . . . . . . . . III-12U.S. producers’ employment, wages, and productivity . . . . . . . . . . . . . . . . . . . . . . . . . . . . . . . . III-13U.S. capacity, production, and capacity utilization of nonsubject OTR construction and
mining tires . . . . . . . . . . . . . . . . . . . . . . . . . . . . . . . . . . . . . . . . . . . . . . . . . . . . . . . . . . . . . . . III-14U.S. producers’ shipments of nonsubject OTR construction and mining tires . . . . . . . . . . . . . . . III-14U.S. producers’ inventories of nonsubject OTR construction and mining tires . . . . . . . . . . . . . . III-14U.S. producers’ employment, wages, and productivity of nonsubject OTR construction and
mining tires . . . . . . . . . . . . . . . . . . . . . . . . . . . . . . . . . . . . . . . . . . . . . . . . . . . . . . . . . . . . . . . III-15U.S. capacity, production, and capacity utilization of certain OTR tires and nonsubject OTR
construction and mining tires . . . . . . . . . . . . . . . . . . . . . . . . . . . . . . . . . . . . . . . . . . . . . . . . . III-15U.S. producers’ shipments of certain OTR tires and nonsubject OTR construction and
mining tires . . . . . . . . . . . . . . . . . . . . . . . . . . . . . . . . . . . . . . . . . . . . . . . . . . . . . . . . . . . . . . . III-15U.S. producers’ inventories of certain OTR tires and nonsubject OTR contruction and
mining tires . . . . . . . . . . . . . . . . . . . . . . . . . . . . . . . . . . . . . . . . . . . . . . . . . . . . . . . . . . . . . . . III-16U.S. producers’ employment, wages, and productivity of certain OTR tires and nonsubject
OTR construction and mining tires . . . . . . . . . . . . . . . . . . . . . . . . . . . . . . . . . . . . . . . . . . . . . III-16
Part IV: U.S. imports, apparent U.S. consumption, and market shares . . . . . . . . . . . . . . . . . . IV-1U.S. importers . . . . . . . . . . . . . . . . . . . . . . . . . . . . . . . . . . . . . . . . . . . . . . . . . . . . . . . . . . . . . . . . IV-1U.S. imports . . . . . . . . . . . . . . . . . . . . . . . . . . . . . . . . . . . . . . . . . . . . . . . . . . . . . . . . . . . . . . . . . IV-4Apparent U.S. consumption . . . . . . . . . . . . . . . . . . . . . . . . . . . . . . . . . . . . . . . . . . . . . . . . . . . . . IV-11U.S. market shares . . . . . . . . . . . . . . . . . . . . . . . . . . . . . . . . . . . . . . . . . . . . . . . . . . . . . . . . . . . . IV-12Ratio of imports to U.S. production . . . . . . . . . . . . . . . . . . . . . . . . . . . . . . . . . . . . . . . . . . . . . . . IV-13Critical circumstances . . . . . . . . . . . . . . . . . . . . . . . . . . . . . . . . . . . . . . . . . . . . . . . . . . . . . . . . . . IV-13
Part V: Pricing and related information . . . . . . . . . . . . . . . . . . . . . . . . . . . . . . . . . . . . . . . . . . . . V-1Factors affecting pricing . . . . . . . . . . . . . . . . . . . . . . . . . . . . . . . . . . . . . . . . . . . . . . . . . . . . . . . . V-1
Raw material costs . . . . . . . . . . . . . . . . . . . . . . . . . . . . . . . . . . . . . . . . . . . . . . . . . . . . . . . . . . V-1Transportation costs to the U.S. market . . . . . . . . . . . . . . . . . . . . . . . . . . . . . . . . . . . . . . . . . . V-1U.S. inland transportation costs . . . . . . . . . . . . . . . . . . . . . . . . . . . . . . . . . . . . . . . . . . . . . . . . V-1Exchange rates . . . . . . . . . . . . . . . . . . . . . . . . . . . . . . . . . . . . . . . . . . . . . . . . . . . . . . . . . . . . . V-1
Pricing practices . . . . . . . . . . . . . . . . . . . . . . . . . . . . . . . . . . . . . . . . . . . . . . . . . . . . . . . . . . . . . . V-2Price data . . . . . . . . . . . . . . . . . . . . . . . . . . . . . . . . . . . . . . . . . . . . . . . . . . . . . . . . . . . . . . . . . . . V-3
Price trends . . . . . . . . . . . . . . . . . . . . . . . . . . . . . . . . . . . . . . . . . . . . . . . . . . . . . . . . . . . . . . . V-4Price comparisons . . . . . . . . . . . . . . . . . . . . . . . . . . . . . . . . . . . . . . . . . . . . . . . . . . . . . . . . . . V-6
Lost sales and lost revenues . . . . . . . . . . . . . . . . . . . . . . . . . . . . . . . . . . . . . . . . . . . . . . . . . . . . . V-6
iii
TABLE OF CONTENTS–Continued
Page
Part VI: Financial experience of the U.S. producers . . . . . . . . . . . . . . . . . . . . . . . . . . . . . . . . . . VI-1Background . . . . . . . . . . . . . . . . . . . . . . . . . . . . . . . . . . . . . . . . . . . . . . . . . . . . . . . . . . . . . . . . . . VI-1Operations on certain OTR tires . . . . . . . . . . . . . . . . . . . . . . . . . . . . . . . . . . . . . . . . . . . . . . . . . . VI-2Operations on nonsubject OTR construction and mining tires . . . . . . . . . . . . . . . . . . . . . . . . . . . VI-7Combined operations on certain OTR tires and nonsubject OTR construction and
mining tires . . . . . . . . . . . . . . . . . . . . . . . . . . . . . . . . . . . . . . . . . . . . . . . . . . . . . . . . . . . . . . . VI-10Capital expenditures, research and development expenses, assets, and return on investment . . . VI-12Capital and investment . . . . . . . . . . . . . . . . . . . . . . . . . . . . . . . . . . . . . . . . . . . . . . . . . . . . . . . . . VI-13
Actual negative effects . . . . . . . . . . . . . . . . . . . . . . . . . . . . . . . . . . . . . . . . . . . . . . . . . . . . . . VI-13Anticipated negative effects . . . . . . . . . . . . . . . . . . . . . . . . . . . . . . . . . . . . . . . . . . . . . . . . . . VI-13
Part VII: Threat and Bratsk considerations . . . . . . . . . . . . . . . . . . . . . . . . . . . . . . . . . . . . . . . . . VII-1The industry in China . . . . . . . . . . . . . . . . . . . . . . . . . . . . . . . . . . . . . . . . . . . . . . . . . . . . . . . . . . VII-2U.S. importers’ inventories . . . . . . . . . . . . . . . . . . . . . . . . . . . . . . . . . . . . . . . . . . . . . . . . . . . . . . VII-5U.S. importers’ current orders . . . . . . . . . . . . . . . . . . . . . . . . . . . . . . . . . . . . . . . . . . . . . . . . . . . VII-5Antidumping and countervailing duty orders in third-country markets . . . . . . . . . . . . . . . . . . . . VII-6Information on nonsubject sources . . . . . . . . . . . . . . . . . . . . . . . . . . . . . . . . . . . . . . . . . . . . . . . . VII-6
“Bratsk” considerations . . . . . . . . . . . . . . . . . . . . . . . . . . . . . . . . . . . . . . . . . . . . . . . . . . . . . . VII-6The global tire industry . . . . . . . . . . . . . . . . . . . . . . . . . . . . . . . . . . . . . . . . . . . . . . . . . . . . . . VII-7
AppendixesA. Federal Register notices . . . . . . . . . . . . . . . . . . . . . . . . . . . . . . . . . . . . . . . . . . . . . . . . . . . . . . . . A-1B. Hearing witnesses . . . . . . . . . . . . . . . . . . . . . . . . . . . . . . . . . . . . . . . . . . . . . . . . . . . . . . . . . . . . . B-1C. Summary data . . . . . . . . . . . . . . . . . . . . . . . . . . . . . . . . . . . . . . . . . . . . . . . . . . . . . . . . . . . . . . . . C-1D. Comments regarding like product factors . . . . . . . . . . . . . . . . . . . . . . . . . . . . . . . . . . . . . . . . . . D-1E. Supplemental data . . . . . . . . . . . . . . . . . . . . . . . . . . . . . . . . . . . . . . . . . . . . . . . . . . . . . . . . . . . . . E-1
Note.–Information that would reveal confidential operations of individual concerns may not bepublished and therefore has been deleted from this report. Such deletions are indicated byasterisks.

1 The record is defined in sec. 207.2(f) of the Commission’s Rules of Practice and Procedure (19 CFR § 207.2(f)). 2 Vice Chairman Daniel R. Pearson dissenting. 3 The Commission also finds that imports subject to Commerce’s affirmative critical circumstances determinationare not likely to undermine seriously the remedial effect of the antidumping duty order on China.
UNITED STATES INTERNATIONAL TRADE COMMISSION
Investigation Nos. 701-TA-448 and 731-TA-1117 (Final)
CERTAIN OFF-THE-ROAD TIRES FROM CHINA
DETERMINATION
On the basis of the record1 developed in the subject investigations, the United States InternationalTrade Commission (Commission) determines, pursuant to sections 705(b) and 735(b) of the Tariff Act of1930 (19 U.S.C. § 1671d(b) and 1673d(b)) (the Act), that an industry in the United States is materiallyinjured by reason of imports from China of certain off-the-road tires, provided for in subheadings4011.20.10, 4011.20.50, 4011.61.00, 4011.62.00, 4011.63.00, 4011.69.00, 4011.92.00, 4011.93.40,4011.93.80, 4011.94.40, and 4011.94.80 of the Harmonized Tariff Schedule of the United States, thathave been found by the Department of Commerce (Commerce) to be subsidized by the Government ofChina and sold in the United States at less than fair value (LTFV).2 3
BACKGROUND
The Commission instituted these investigations effective June 18, 2007, following receipt of apetition filed with the Commission and Commerce by Titan Tire Corporation, Des Moines, Iowa, and TheUnited Steel, Paper and Forestry, Rubber, Manufacturing, Energy, Allied Industrial and Service WorkersInternational Union, AFL-CIO-CLC, Pittsburgh, PA. The final phase of the investigations was scheduledby the Commission following notification of a preliminary determination by Commerce that imports ofcertain off-the-road tires from China were being sold at LTFV within the meaning of section 733(b) ofthe Act (19 U.S.C. § 1673b(b)). Notice of the scheduling of the final phase of the Commission’sinvestigations and of a public hearing to be held in connection therewith was given by posting copies ofthe notice in the Office of the Secretary, U.S. International Trade Commission, Washington, DC, and bypublishing the notice in the Federal Register of March 3, 2008 (73 FR 11437). The hearing was held inWashington, DC, on July 8 and 9, 2008, and all persons who requested the opportunity were permitted toappear in person or by counsel.


1 Vice Chairman Pearson finds that the domestic industry is neither materially injured nor threatened withmaterial injury by reason of subject imports. See Additional and Dissenting Views of Vice Chairman Daniel R.Pearson. He joins sections I and II of the Commission’s Views. 2 GPX owns subject foreign producer Hebei Starbright Tire. CR at VII-3 n.7, PR at VII-3 n.7. 3 19 U.S.C. § 1677(10). See Nippon Steel Corp. v. United States, 19 CIT 450, 455 (1995); Timken Co. v. UnitedStates, 913 F. Supp. 580, 584 (Ct. Int’l Trade 1996); Torrington Co. v. United States, 747 F. Supp. 744, 748-49 (Ct.Int’l Trade 1990), aff’d, 938 F.2d 1278 (Fed. Cir. 1991). See also S. Rep. No. 249, 96th Cong., 1st Sess. 90-91(1979).
3
VIEWS OF THE COMMISSION
Based on the record in the final phase of these investigations, we find that an industry in theUnited States is materially injured by reason of imports of certain off-the-road tires (“OTR tires” or“tires”) from China (or “PRC”) that have been found by the U.S. Department of Commerce(“Commerce”) to be subsidized and sold in the United States at less than fair value. We also determinethat critical circumstances do not exist with respect to the subject imports from China covered byCommerce’s affirmative critical circumstances determination.1
I. BACKGROUND
Domestic producer Titan Tire Corporation (“Titan”) and The United Steel, Paper and Forestry,Rubber, Manufacturing, Energy, Allied Industrial and Service Workers International Union, AFL-CIO-CLC (“USW”) filed a petition on behalf of the domestic industry on June 18, 2007. Representatives forpetitioners appeared at the hearing and filed prehearing and posthearing briefs, as did representatives forBridgestone Firestone North American Tire, LLC (“Bridgestone” or “BFNA”), a domestic producer. Respondents also were represented at the hearing and their representatives filed prehearing andposthearing briefs as well. They include the subject importer GPX International Tire Corporation(“GPX”);2 subject producers and importers Aeolus Tyre Co., Ltd.; Guizhou Tyre Co., Ltd.; HangzhouZhongce Rubber Co., Ltd.; Haohua South (Guilin) Rubber Corp., Ltd.; Jiangsu Feichi Co., Ltd.; LaizhouXiongying Rubber Industry Co., Ltd.; Shandong Taishan Tyre Co., Ltd.; Shandong Wanda Boto Tyre Co.Ltd.; Shandong Xingyuan International Trading Co., Ltd.; Techking Tires Limited; Tianjin United Tire &Rubber International Co., Ltd.; Triangle Tyre Co., Ltd.; Wendeng Sanfeng Tyre Co., Ltd.; Zhaoyuan LeoRubber Co., Ltd.; Tire Engineering & Distribution, Inc.; and Guizhou Tyre I/E Corp. (collectively, the“Chinese respondents”); importer Super Grip Corporation (“Super Grip”); importer Trelleborg WheelSystems Americas, Inc. (“Trelleborg”); importer American Pacific Industries (“API”); and purchaserCaterpillar Inc. (“Caterpillar”).
II. DOMESTIC LIKE PRODUCT AND INDUSTRY
A. Domestic Like Product
In making its determination under section 751(c) of the Tariff Act of 1930, as amended (“theTariff Act”), the Commission first defines the “domestic like product.” The Act defines the “domesticlike product” as “a product which is like, or in the absence of like, most similar in characteristics and useswith, the article subject to an investigation.”3
The decision regarding the appropriate domestic like product(s) in an investigation is a factualdetermination, and the Commission has applied the statutory standard of “like” or “most similar in

4 See, e.g., Cleo, Inc. v. United States, 501 F.3d 1291, 1299 (Fed. Cir. 2007); NEC Corp. v. Department ofCommerce, 36 F. Supp. 2d 380, 383 (Ct. Int’l Trade 1998); Nippon Steel Corp. v. United States, 19 CIT 450, 455(1995); Torrington Co. v. United States, 747 F. Supp. 744, 749 n.3 (Ct. Int’l Trade 1990), aff’d, 938 F.2d 1278 (Fed.Cir. 1991) (“every like product determination ‘must be made on the particular record at issue’ and the ‘unique factsof each case’”). The Commission generally considers a number of factors including the following: (1) physicalcharacteristics and uses; (2) interchangeability; (3) channels of distribution; (4) customer and producer perceptionsof the products; (5) common manufacturing facilities, production processes, and production employees; and, whereappropriate, (6) price. See Nippon, 19 CIT at 455 n.4; Timken Co. v. United States, 913 F. Supp. 580, 584 (Ct. Int’lTrade 1996). 5 See, e.g., S. Rep. No. 96-249 at 90-91 (1979). 6 Nippon, 19 CIT at 455; Torrington, 747 F. Supp. at 748-49; see also S. Rep. No. 96-249 at 90-91 (1979)(Congress has indicated that the like product standard should not be interpreted in “such a narrow fashion as topermit minor differences in physical characteristics or uses to lead to the conclusion that the product and article arenot ‘like’ each other, nor should the definition of ‘like product’ be interpreted in such a fashion as to preventconsideration of an industry adversely affected by the imports under consideration.”). 7 See, e.g., USEC, Inc. v. United States, Slip Op. 01-1421 at 9 (Fed. Cir. Apr. 25, 2002) (“The ITC may notmodify the class or kind of imported merchandise examined by Commerce.”); Algoma Steel Corp. v. United States,688 F. Supp. 639, 644 (Ct. Int’l Trade 1988), aff’d, 865 F.3d 240 (Fed. Cir.), cert. denied, 492 U.S. 919 (1989). 8 Hosiden Corp. v. Advanced Display Mfrs., 85 F.3d 1561, 1568 (Fed. Cir. 1996) (Commission may find asingle like product corresponding to several different classes or kinds defined by Commerce); Cleo, 501 F.3d at1298, n.1 (“Commerce’s {scope} finding does not control the Commission’s {like product} determination.”);Torrington, 747 F. Supp. at 748-52 (affirming Commission determination of six like products in investigations whereCommerce found five classes or kinds). 9 Agricultural tractors are dual-axle vehicles that typically are designed to pull farming equipment in the fieldand that may have front tires of a different size than the rear tires. 10 Combine harvesters are used to harvest crops such as corn or wheat. 11 Agricultural sprayers are used to irrigate agricultural fields. 12 Industrial tractors are dual-axle vehicles that typically are designed to pull industrial equipment and that mayhave front tires of a different size than the rear tires. 13 A log-skidder has a grappling lift arm that is used to grasp, lift and move trees that have been cut down to atruck or trailer for transport to a mill or other destination.
4
characteristics and uses” on a case-by-case basis.4 No single factor is dispositive, and the Commissionmay consider other factors it deems relevant based on the facts of a particular investigation.5 TheCommission looks for clear dividing lines among possible like products and disregards minor variations.6 Although the Commission must accept Commerce’s determination as to the scope of the importedmerchandise subsidized or sold at less than fair value,7 the Commission determines the domestic productthat is like the imported articles Commerce has identified.8
In its final determinations, Commerce defined the imported merchandise subject to theseinvestigations as follows:
new pneumatic tires designed for off-the-road (OTR) and off-highway use, subject to exceptionsidentified below. Certain OTR tires are generally designed, manufactured and offered for sale foruse on off-road or off-highway surfaces, including but not limited to, agricultural fields, forests,construction sites, factory and warehouse interiors, airport tarmacs, ports and harbors, mines,quarries, gravel yards, and steel mills. The vehicles and equipment for which certain OTR tiresare designed for use include, but are not limited to: (1) Agricultural and forestry vehicles andequipment, including agricultural tractors,9 combine harvesters,10 agricultural high clearancesprayers,11 industrial tractors,12 log-skidders,13 agricultural implements, highway-towed

14 Skid-steer loaders are four-wheel drive vehicles with the left-side drive wheels independent of the right-sidedrive wheels and lift arms that lie alongside the driver with the major pivot points behind the driver's shoulders. Skid-steer loaders are used in agricultural, construction and industrial settings. 15 Haul trucks, which may be either rigid frame or articulated (i.e., able to bend in the middle) are typically usedin mines, quarries and construction sites to haul soil, aggregate, mined ore, or debris. 16 Front loaders have lift arms in front of the vehicle. They can scrape material from one location to another,carry material in their buckets, or load material into a truck or trailer. 17 A dozer is a large four-wheeled vehicle with a dozer blade that is used to push large quantities of soil, sand,rubble, etc., typically around construction sites. They can also be used to perform “rough grading” in roadconstruction. 18 A straddle carrier is a rigid frame, engine-powered machine that is used to load and offload containers fromcontainer vessels and load them onto (or off of) tractor trailers. 19 A grader is a vehicle with a large blade used to create a flat surface. Graders are typically used to perform“finish grading.” Graders are commonly used in maintenance of unpaved roads and road construction to prepare thebase course onto which asphalt or other paving material will be laid. 20 I.e., “on-site'” mobile cranes designed for off-highway use. 21 A counterbalanced lift truck is a rigid framed, engine-powered machine with lift arms that has additionalweight incorporated into the back of the machine to offset or counterbalance the weight of loads that it lifts so as toprevent the vehicle from overturning. An example of a counterbalanced lift truck is a counterbalanced fork lift truck. Counterbalanced lift trucks may be designed for use on smooth floor surfaces, such as a factory or warehouse, orother surfaces, such as construction sites, mines, etc. 22 While tube-type tires are subject to the scope of this proceeding, tubes and flaps are not subject merchandiseand therefore are not covered by the scope of this proceeding, regardless of the manner in which they are sold (e.g.,sold with or separately from subject merchandise).
5
implements, agricultural logging, and agricultural, industrial, skid-steers/mini-loaders;14 (2)construction vehicles and equipment, including earthmover articulated dump products, rigidframe haul trucks,15 front end loaders,16 dozers,17 lift trucks, straddle carriers,18 graders,19 mobilecranes,20 compactors; and (3) industrial vehicles and equipment, including smooth floor,industrial, mining, counterbalanced lift trucks, industrial and mining vehicles other than smoothfloor, skid-steers/mini-loaders, and smooth floor off-the-road counterbalanced lift trucks.21 Theforegoing list of vehicles and equipment generally have in common that they are used for hauling,towing, lifting, and/or loading a wide variety of equipment and materials in agricultural,construction and industrial settings. Such vehicles and equipment, and the descriptions containedin the footnotes are illustrative of the types of vehicles and equipment that use certain OTR tires,but are not necessarily all-inclusive.
While the physical characteristics of certain OTR tires will vary depending on thespecific applications and conditions for which the tires are designed (e.g., tread pattern anddepth), all of the tires within the scope have in common that they are designed for off-road andoff-highway use. Except as discussed below, OTR tires included in the scope of the proceedingrange in size (rim diameter) generally but not exclusively from 8 inches to 54 inches. The tiresmay be either tube-type22 or tubeless, radial or non-radial, and intended for sale either to originalequipment manufacturers or the replacement market. The subject merchandise is currentlyclassifiable under Harmonized Tariff Schedule of the United States (“HTSUS'”) subheadings: 4011.20.10.25, 4011.20.10.35, 4011.20.50.30, 4011.20.50.50, 4011.61.00.00, 4011.62.00.00,4011.63.00.00, 4011.69.00.00, 4011.92.00.00, 4011.93.40.00, 4011.93.80.00, 4011.94.40.00, and4011.94.80.00. While HTSUS subheadings are provided for convenience and customs purposes,our written description of the scope is dispositive.
23 73 Fed. Reg. 40485, 40490-91 (July 15, 2008) (Final Antidumping Duty & Critical CircumstancesDeterminations); 73 Fed. Reg. 40480, 40483-84 (July 15, 2008 (Final Countervailing Duty & Critical CircumstancesDeterminations). 24 In these views, we use “coterminous” to mean coextensive with the scope of the investigations.
6
Specifically excluded from the scope are new pneumatic tires designed, manufacturedand offered for sale primarily for on-highway or on-road use, including passenger cars, race cars,station wagons, sport utility vehicles, minivans, mobile homes, motorcycles, bicycles, on-road oron-highway trailers, light trucks, and trucks and buses. Such tires generally have in common thatthe symbol “DOT” must appear on the sidewall, certifying that the tire conforms to applicablemotor vehicle safety standards. Such excluded tires may also have the following designationsthat are used by the Tire and Rim Association:
Prefix letter designations:
P--Identifies a tire intended primarily for service on passenger cars; LT--Identifies a tire intended primarily for service on light trucks; and, ST--Identifies a special tire for trailers in highway service.
Suffix letter designations:
TR--Identifies a tire for service on trucks, buses, and other vehicles with rims havingspecified rim diameter of nominal plus 0.156” or plus 0.250”; MH--Identifies tires for Mobile Homes; HC--Identifies a heavy duty tire designated for use on “HC” 15” tapered rims used ontrucks, buses, and other vehicles. This suffix is intended to differentiate among tires forlight trucks, and other vehicles or other services, which use a similar designation. Example: 8R17.5 LT, 8R17.5 HC; LT--Identifies light truck tires for service on trucks, buses, trailers, and multipurposepassenger vehicles used in nominal highway service; and
MC--Identifies tires and rims for motorcycles.
The following types of tires are also excluded from the scope: Pneumatic tires that arenot new, including recycled or retreaded tires and used tires; non-pneumatic tires, including solidrubber tires; tires of a kind designed for use on aircraft, all-terrain vehicles, and vehicles for turf,lawn and garden, golf and trailer applications. Also excluded from the scope are radial and biastires of a kind designed for use in mining and construction vehicles and equipment that have a rimdiameter equal to or exceeding 39 inches. Such tires may be distinguished from other tires ofsimilar size by the number of plies that the construction and mining tires contain (minimum of16) and the weight of such tires (minimum 1500 pounds).23
In the preliminary phase of these investigations, petitioners and Bridgestone proposed defining asingle domestic like product comprising certain OTR tires for agricultural, construction and industrialvehicles and equipment coterminous with the scope of the investigations24 (“coterminous tires”). TheChinese respondents accepted petitioners’ proposed definition of the domestic like product for thepurposes of the preliminary phase of the investigations, but argued that they did not believe there was asubstantial basis to exclude from the definition the larger construction and mining tires that are excludedfrom the scope (i.e., those with a rim diameter equal to or exceeding 39 inches). Based on the evidence inthe record, the Commission found one domestic like product consisting of the coterminous tires. It did
25 Certain Off-the-Road Tires from China, Inv. Nos. 701-TA-448 and 731-TA-1117 (Preliminary), USITC Pub.3943 (Aug. 2007), at 7-9. 26 Petitioners’ Prehearing Brief at 7-8. 27 Bridgestone’s Prehearing Brief at 9. 28 Petitioners’ Prehearing Brief at 8; Petitioners’ Posthearing Brief, Questions from Vice Chairman Pearson,Question 2 at 10; Bridgestone’s Prehearing Brief at 9-10. 29 Petitioners’ Prehearing Brief at 8-9; Petitioners’ Posthearing Brief, Questions from Vice Chairman Pearson,Question 2 at 9.
7
not include the larger construction and mining tires (hereinafter referred to as “C&M tires of 39 inchesand higher”) based on the evidence in the record pertaining to physical characteristics and end uses,production equipment and processes, channels of distribution, price, and lack of interchangeability. TheCommission stated that it would revisit this issue in any final phase of the investigations.25
In this final phase of the investigations, petitioners and Bridgestone continue to argue that theCommission should define the domestic like product to include only the coterminous tires, while severalrespondents assert that the Commission should include C&M tires of 39 inches and higher in thedefinition of the domestic like product, as they argue that there is no clear dividing line at a rim diameterof 39 inches.
Physical Characteristics and Uses. Although petitioners concede that the coterminous tires andC&M tires of 39 inches and higher are both designed for off-road use, they maintain that the similaritieslargely end there. Petitioners state that there are many additional components incorporated into theconstruction of C&M tires of 39 inches and higher that are not used in coterminous agricultural tires withsimilar rim diameters. C&M bias tires of 39 inches and higher typically contain rubber squeegeecomponents between the plies as well as more beads and more plies than coterminous agricultural tireswith the same size rim diameter. C&M radial tires of 39 inches and higher consist of much heaviermaterials than coterminous agricultural tires of similar size rim diameter, and heavy steel ply and belts areused in the former, whereas fabric ply and belts are used in the latter. There are other components used inC&M tires of 39 inches and higher, such as multiple rubber pieces inside the turnup ply, rubber wedgesused around the belt edges and in the sidewall, and multiple fabric chafer components used to protect thebead area that are not used in the coterminous tires.26 Bridgestone concurs with petitioners.27
Petitioners and Bridgestone also assert that the additional components and different materialsused to construct C&M tires of 39 inches and higher result in substantially heavier tires when comparedto agricultural tires with similar rim diameters. The largest coterminous agricultural tires weighapproximately 1,200 pounds according to petitioners, while the largest of the C&M tires of 39 inches andhigher can weigh up to 13,500 pounds. Further, while the coterminous tires generally do not exceed 100inches in outer diameter, the outside diameter of C&M tires of 39 inches and higher can reach up to 13feet.28
Petitioners argue that the differences in composition and size lead to differences in use. There issome variation among the coterminous tires with respect to applications in the agricultural, constructionand industrial sectors. The size and the weight of the coterminous agricultural tires typically limit theirload-bearing capacity to approximately 15,000 pounds, which limits the applications for which the tiresmay be used. C&M tires of 39 inches and higher, on the other hand, are capable of hauling much heavierloads and are subject to less variation in application – they are generally used in the mining industry.29
Respondents essentially argue that the significant characteristics of the tires, i.e., load capacities,plies, tread depths, and weights, vary along a continuum in loose association with rim diameter, and thatthere is no clear dividing line in terms of these characteristics between the coterminous tires and C&M

30 See, e.g., GPX’s Prehearing Brief at 21-32; Chinese Respondents’ Prehearing Brief at 9-22; Caterpillar’sPrehearing Brief at 4-8; GPX’s Posthearing Brief at 2-4; Chinese Respondents’ Posthearing Brief at 2-3 & Answersto the Commission’s Questions at 27-29. 31 See 73 Fed. Reg. at 40484, 73 Fed. Reg. at 40490. 32 Confidential Staff Report (“CR”) at D-3, Public Staff Report (“PR”) at D-3. 33 See CR at D-3, PR at D-3. 34 CR at D-6 - D-7, PR at D-3. 35 GPX’s Prehearing Brief at 2; Tr. at 243-44 (Mr. Mazzola). 36 Caterpillar’s Prehearing Brief at 4-8 & Exh. 2; Tr. at 245 (Mr. Mazzola). 37 GPX’s Prehearing Brief at 38. 38 Caterpillar does not purchase OTR tires with rim diameters between 25 and 29 inches or between 51 and 57inches. Caterpillar’s Prehearing Brief at 5 n.10. As Caterpillar is a purchaser, its views bear on one of six factors weconsider in defining the domestic like product.
8
tires of 39 inches and higher. They add that tires with larger rim sizes are capable of carrying greaterloads and are more suitable for larger machines.30
We are unpersuaded by respondents’ arguments. We note that the coterminous tires includeagricultural tires ranging up to 54 inches in rim diameter, while C&M tires of 39 inches and higher maybe as small as 39 inches in rim diameter.31 Further in this regard, Bridgestone ***. ***.32 Accordingly,the record does not confirm the assertion that differences in OTR tire characteristics are proportional todifferences in rim diameter.33
The record also shows real distinctions between the coterminous tires and C&M tires of 39 inchesand higher. For example, ***, a purchaser, states that ***. ***.34 GPX admits that Titan’s catalogseparates mining and construction tires from agricultural tires.35
There are a number of physical differences between coterminous and C&M tires of 39 inches andhigher that are not dependent upon rim diameter. There are more beads and plies, additional componentsand heavier materials in a C&M tire of 39 inches and higher than in a coterminous tire, all of which resultin a tire that is substantially heavier with a much greater load-bearing capacity. This ultimately affectsend use, even for tires of the same rim diameter.
Caterpillar’s contention that three loaders at the same job site may utilize mining or constructionequipment of various sizes with correspondingly different tire sizes that cross the 39-inch boundary36 is oflimited probative value. First, the example chosen by Caterpillar is not representative of the vast majorityof coterminous and C&M tires of 39 inches and higher, as it shows one application and one type ofequipment, albeit in three sizes. In addition, the simultaneous presence of these OTR tires at a single jobsite does not establish that the tires have similar physical characteristics, even if they are being used in asimilar manner in this particular instance. Moreover, as respondents have reported, Titan alone has morethan 3,000 stock-keeping units (“SKUs”).37 No one contends that all of Titan’s C&M construction tiresof 39 inches and higher are used on the same equipment or in the same applications as its coterminousconstruction tires. Finally, Caterpillar admits that it does not purchase all sizes of the coterminous tiresfor its applications.38
The record contains evidence of significant distinctions in physical characteristics and usesbetween the coterminous tires and C&M tires of 39 inches and higher. We conclude that the coterminoustires and C&M tires of 39 inches and higher generally differ in terms of physical characteristics and uses.
Manufacturing Facilities and Production Employees. Bridgestone’s facility in Des Moines, Iowamakes coterminous OTR tires used in agricultural applications and does not have the physical capabilityto make C&M tires of 39 inches and higher. Its facility in Bloomington, Illinois manufactures bothcoterminous and C&M tires of 39 inches and higher; however, the curing presses generally used to make
39 CR at I-23, PR at I-19-20; Bridgestone’s Prehearing Brief at 12-13. In addition, larger production equipment,with bigger bearings and bigger shafts, is needed to support a 4,000 pound earthmoving tire as opposed to a 1,200pound agricultural tire. The equipment used to produce large agricultural tires having a rim diameter of 42 inches isused to produce mining tires with a rim diameter of 25 inches. The equipment used to produce C&M tires of 39inches and higher is not used to produce any agricultural or industrial tires. Petitioners’ Prehearing Brief at 9. 40 CR at D-9, PR at D-3; Bridgestone’s Prehearing Brief at 13. 41 CR at I-23, PR at I-19-20; Petitioners’ Prehearing Brief at 10. 42 CR at D-9, PR at D-3. 43 See CR at I-24 n.47, PR at I-20 n.47. 44 CR at D-11, PR at D-3. 45 See, e.g., Silicon Metal from Brazil and China, Inv. Nos. 731-TA-471-472 (Second Review), USITC Pub.3892 (Dec. 2006), at 18 n.120 (fact that different method of production/technology exists from that used by foreignproducer not persuasive), aff’d, Globe Metallurgical Inc. v. United States, Ct. No. 07-00011, Slip Op. 08-33 (Mar.19, 2008). 46 Vulcanization is also known as curing. 47 CR at I-23, PR at I-19-20. The record indicates that training requires a matter of months. See Tr. at 200 (Mr.Ivy). 48 CR at I-24, PR at I-20; see also Phone Notes of Ray Cantrell with ***. 49 See, e.g., Carbon and Certain Alloy Steel Wire Rod from China, Germany, and Turkey, Inv. Nos. 731-TA-1099-1101 (Preliminary), USITC Pub. 3832 (Jan. 2006), at 10 (“a lack of interchangeability among productscomprising a continuum is not unexpected and not inconsistent with finding a single like product”). 50 Petitioners argue that the vast majority of C&M tires of 39 inches and higher are shipped directly to the enduser and that only a very small number of distributors have the equipment and trained personnel to handle these tires. In contrast, thousands of distributors and dealers handle the coterminous tires. See CR at I-28, PR at I-22. 51 CR at D-12 - D-14, PR at D-3.
9
coterminous tires cannot be used to make larger C&M tires.39 C&M tires of 39 inches and higher must bemade ***.40 Similarly, Titan ***.41 ***.42
Although the curing process is dependent upon the size of the tire in terms of type of equipmentand time required for curing,43 and the domestic industry ***.44 ***. Whether a process could beperformed differently is of no consequence to our finding, however. Rather, it is how the process isactually performed that is determinative.45 In addition, the fact that eight of 10 manufacturing steps areidentical for all OTR tires does not negate a finding that there is a clear dividing line among possible likeproducts. The steps that are not identical, i.e., tire building and vulcanization,46 are critical to the processand differentiate the coterminous and C&M tires of 39 inches and higher. Employees must be speciallytrained to manufacture C&M tires of 39 inches and higher,47 and special equipment is used to mountthem.48 On balance, while there is some overlap in terms of manufacturing processes and employees,there are also very important differences.
Interchangeability. All parties appear to agree that there is virtually no interchangeabilitybetween the coterminous and C&M tires of 39 inches and higher. This factor is, however, of limited usein assisting the Commission with making its finding because, in an industry in which there are literallythousands of products, each is designed for a specific use. As such the lack of interchangeability does notprovide strong guidance as to whether a clear dividing line exists.49
Channels of Distribution. There is overlap in the channels of distribution for coterminous tiresand C&M tires of 39 inches and higher, i.e., the tires are sold directly to wholesalers or distributors, aswell as directly to the end users.50 There are some distributors that may specialize in the mining andconstruction segments as opposed to agriculture, although these distributors will purchase, resell andservice all tires in a given series, whether of a rim diameter equal to or greater than 39 inches, or a rimdiameter less than 39 inches. Some companies ***.51 However, there is evidence in the record that inMichigan, for example, there are 1,500 to 2,000 OTR tire distributors, and there are only nine that can
52 Petitioners’ Posthearing Brief, Questions from Vice Chairman Pearson, Question 2 at Exh. 2. 53 CR at D-13, PR at D-3. 54 Petitioners’ Posthearing Brief, Questions from Vice Chairman Pearson, Question 2 at Exh. 2. 55 CR at D-14 - D-15, PR at D-3. 56 Petitioners’ Prehearing Brief at 16. 57 CR at D-16 - D-18, PR at D-3. 58 See Caterpillar’s Prehearing Brief at 5. 59 See CR at D-10, D-11 and D-13; PR at D-3 (comments of ***. Additionally, these “giant” tires are generally40 times heavier than coterminous OTR tires, most domestic plants cannot produce them, those that do requirespecial equipment, only distributors with special equipment and specially trained personnel handle sales of them inthe aftermarket, and many giant tires are sold directly to end users and not to OEMs. In addition, the average unitvalue of domestic producers’ U.S. shipments of C&M tires of 39 inches and higher was $17,241 per tire in 2007 ascompared to the average unit value of coterminous tires of $280 in that year. See Tr. at 53-54 (Mr. Stewart); CR/PRat Tables VI-2 & VI-5.
10
service the largest of the C&M tires of 39 inches and higher.52 The largest mining companies ***. ***.53 Six months of specialized training is required for Titan’s employees to learn to mount and service thelargest of the C&M tires of 39 inches and higher, whereas an employee can be trained to mount andservice smaller, coterminous tires in approximately one day.54
Customer and Producer Perceptions. Although producers have separate catalogs for mining andagricultural tires, the catalogs reference tires both under 39 inches in rim diameter and equal to or greaterthan 39 inches in rim diameter. However, the large-volume purchaser Caterpillar ***. ***.55
Price. It is undisputed that the C&M tires of 39 inches and higher cost more to make and arehigher priced than the coterminous tires. The former use more raw materials, the building and curingprocess is longer and transportation of these tires is more expensive and complex due to their size andweight. Titan’s prices for coterminous earthmoving/construction tires range from $*** up to $***, whilethe prices for its C&M earthmoving tires of 39 inches and higher range from approximately $*** up to$***. Thus, Titan’s least expensive C&M earthmoving tire of 39 inches and higher costs approximately*** percent more than its most expensive coterminous earthmoving tire, and the range of prices (fromleast to most expensive) for the C&M earthmoving tires of 39 inches and higher is considerably wider($***) than the range of prices for its coterminous earthmoving tires ($***).56
The worldwide shortage of the C&M tires of 39 inches and higher also affects price. ***.57
Conclusion. Despite the fact that the evidence is mixed with respect to some of the factors wenormally consider in making our like product determination, the evidence is clear that the domestic likeproduct does not include the largest of the C&M tires of 39 inches and higher, i.e., tires that are 57 inchesand 63 inches in rim diameter.58 These tires differ greatly from the coterminous tires in terms of physicalcharacteristics and uses, common manufacturing facilities and employees, channels of distribution, andprice.59 As is evident from the discussion above, the justification for not including in the like productC&M tires that are 39 inches or greater in rim diameter, but smaller than the largest of these non-coterminous C&M tires, is less clear. On balance, however, we find, as we did in the preliminary phaseof these investigations, that there is one domestic like product, coextensive with the scope, that does notinclude C&M tires of 39 inches and higher. We make this finding because of significant differences inphysical characteristics and uses, manufacturing facilities and production employees, channels ofdistribution, customer and producer perceptions, and price. The record as a whole does not persuade usthat we should expand the domestic like product beyond coterminous tires.
60 19 U.S.C. § 1677(4)(A). 61 The petition also identified Trelleborg and GPX as possible U.S. producers of the subject product. During thepreliminary phase of these investigations, both firms indicated that they had not produced OTR tires in the UnitedStates since January 1, 2004. CR/PR at III-1. 62 USITC Pub. 3943 at 10. 63 19 U.S.C. § 1677(4)(B). 64 Because *** has a corporate relationship with an entity in China from which it source its imports, it is also arelated party for that reason. 19 U.S.C. § 1677(4)(B). 65 CR/PR at Table III-9 & n.2.
11
B. Domestic Industry
Section 771(4)(A) of the Act defines the relevant industry as the domestic “producers as a[w]hole of a domestic like product, or those producers whose collective output of a domestic like productconstitutes a major proportion of the total domestic production of the product.”60 In defining the domesticindustry, the Commission’s general practice has been to include in the industry producers of all domesticproduction of the like product, whether toll-produced, captively consumed, or sold in the domesticmerchant market.
There are seven known producers of certain OTR tires in the United States: Bridgestone, CarlisleTire & Wheel Company (“Carlisle”), Denman Tire Corporation (“Denman”), Goodyear, Michelin,Specialty Tires of America, Inc. (“Specialty”), and Titan. The Commission received completedquestionnaire responses from all firms.61 Based on our domestic like product finding, we define a singledomestic industry producing the domestic like product.
C. Related Parties
Because three domestic producers (***, *** and ***) imported subject merchandise during theperiod of investigation, there is an issue as to whether circumstances are appropriate to exclude one ormore of them from the domestic industry. In the preliminary phase of these investigations, we wereaware of only one domestic producer (***) that imported and/or purchased subject merchandise fromChina during the period of investigation. We determined not to exclude *** from the domestic industryunder the related parties provision of the statute.62 That provision allows the Commission, if appropriatecircumstances exist, to exclude from the domestic industry producers that are related to an exporter orimporter of subject merchandise or which are themselves importers.63
By virtue of the fact that ***, *** and *** imported subject merchandise during the period ofinvestigation, they qualify as “related parties” under 19 U.S.C. § 1677(4)(B).64 Thus, the Commissionmust consider whether “appropriate circumstances” exist to exclude any of them from the domesticindustry.
***. *** imported *** subject tires from *** in China in 2007, the only time during the periodof investigation during which it imported any tires. It did not indicate why it imported these products, butstated that no further imports are scheduled. Its ratio of subject imports to production was *** percent in2007.65 *** operating income as a share of net sales was *** percent in 2007, ranking it *** among all
66 CR/PR at Table VI-3. 67 Consistent with her practice in past investigations and reviews, Chairman Aranoff does not rely on individual-company operating income margins, which reflect a domestic producer’s financial operations related to productionof the like product, in assessing whether a related party has benefitted from importation of subject merchandise. Rather, she determines whether to exclude a related party based principally on its ratio of subject imports todomestic production and whether its primary interests lie in domestic production or importation. 68 In the preliminary phase of these investigations, Commissioner Pinkert did not rely upon related partyfinancial performance with respect to U.S. manufacturing operations as a factor in determining whether there wereappropriate circumstances to exclude related parties from the domestic industry. He did so because the record at thattime was insufficient to conclude that related party profitability was linked to any specific benefit derived fromimportation. See USITC Pub. 3943 at 10 n.45. Similarly, the record in the final phase of these investigations isinsufficient to establish such a link. Thus, in these investigations, Commissioner Pinkert has relied on informationunrelated to company profitability in determining whether appropriate circumstances exist to exclude related partiesfrom the domestic industry. 69 CR/PR at Table III-1. 70 CR/PR at Table III-1. 71 CR/PR at Table III-9 & n.3. 72 CR/PR at Table VI-3. 73 CR/PR at Table III-1. 74 CR/PR at Table III-9 n.3. 75 We note that *** ratio of nonsubject imports to production was *** percent for the first two years of theperiod of investigation, declining to *** percent in 2007. CR/PR at Table III-9. 76 CR/PR at Table III-9 & nn.4-5.
12
domestic producers.66 67 68 It accounted for *** percent of domestic production in 2007, and as such wasthe *** largest domestic producer.69 *** opposes the petition.70
We do not find that circumstances are appropriate to exclude *** from the domestic industry. Itsimports relative to production are *** and it has indicated that it has no plans to import subjectmerchandise in the near future. Although it opposes the petition, the *** quantity of subject imports didnot provide it with a financial benefit.
***. *** imported subject tires throughout the period of investigation. It imported *** tires in2005, *** tires in 2006 and *** tires in 2007. It imported *** tires in January-March 2007 and *** tiresin January-March 2008. It reported that it did so “***. ***.” *** currently has no subject merchandiseon order. Its ratio of subject imports to production was *** percent in 2005, *** percent in 2006 and ***percent in 2007; it was *** percent in January-March 2007 and *** percent in January-March 2008.71 Ona relative basis, *** of all the domestic producers during the period. Its operating losses relative to netsales were *** percent in 2005, *** percent in 2006 and *** percent in 2007; it was *** percent inJanuary-March 2007 and *** percent in January-March 2008.72 *** accounted for *** percent ofdomestic production in 2007 and supports the petition.73
We find that circumstances are not appropriate to exclude *** from the domestic industry. Whereas its imports relative to production grew toward the end of the full-year period, they remainedsubstantially below the level of its domestic production. It supports the petition. It does not appear tohave derived a significant financial benefit from its subject imports. Finally, it has no intention to importmore subject merchandise and has indicated that this is ***.74 Thus, its interests appear to lie inproduction and not importation.75
***. *** imported *** subject tires in 2007 “in order to meet constraints in domestic capacity.” Its ratio of subject imports to production was *** percent in that year.76 Its operating income relative to

77 CR/PR at Table VI-3. 78 CR/PR at Table III-1. 79 We note that *** ratio of nonsubject imports to production is higher than its ratio of subject imports toproduction. The former ratio was *** percent throughout the full-year period and was *** percent in 2007. CR/PRat Table III-9. 80 USITC Pub. 3943 at 14 n.85. 81 Prehearing CR/PR at IV-4.
13
net sales was *** percent in 2007, ranking it *** among the domestic producers that year.77 ***’s shareof domestic production was *** percent in 2007 and it *** the petition.78
We find that circumstances are not appropriate to exclude *** from the domestic industry. Theamount of subject tires it imported is *** and, although it did well financially in the year it importedsubject merchandise, the quantity of subject imports is ***. Examination of its subject imports relative toproduction shows that its interests clearly lie in production, not importation.79 In addition, *** thepetition.
D. Conclusion
In conclusion, we define a single domestic industry that includes all seven domestic producers ofthe domestic like product.
III. SELECTION OF METHODOLOGY TO MEASURE IMPORTS
A. Importer Questionnaire Data vs. Adjusted Official Statistics
In every investigation, the Commission must determine the volume of subject merchandise (andnonsubject merchandise) imported into the United States during the period of investigation. Whenimporters representing a large portion of the subject imports respond to the Commission’s questionnaires,then questionnaire data may represent the most reliable measure. Alternatively, when subheadings of theHTS closely align with the scope of the subject merchandise, as defined by Commerce, the official importstatistics may provide the best measure. In the present investigations, the response rate to theCommission’s importer questionnaires was relatively low in the preliminary phase and much improvedbut still incomplete in the final phase. The HTS subheadings under which subject merchandise wasreported are not closely aligned with Commerce’s scope. Accordingly, the Commission was obligated toselect from imperfect data sets when determining the volume of subject and nonsubject imports during theperiod of investigation.
In the preliminary phase of the investigations, the Commission used Customs data that had beenadjusted to exclude imported merchandise falling outside of Commerce’s scope. Compared to the figuresreported for the applicable HTS subheadings, the adjustments resulted in a 71 percent decrease in thenumber of subject imports of OTR tires and a 16 percent reduction in value for 2006. The Commissioninvited the parties to address how the Customs data should be adjusted in any final phase of theinvestigations.80
In the prehearing staff report in this final phase of the investigations, Commission staff modifiedCustoms data to exclude out-of-scope tires by subtracting imports that weigh more than 1,500 pounds pertire and imports of OTR tires with a landed duty value of less than $20 per unit. To avoid double-counting, the adjusted statistics also excluded imports from several firms that import nonsubject OTRtires under some of the same statistical reporting numbers as subject imports.81
At the hearing, petitioners argued that the Customs data should be adjusted to exclude Chinesetires with a landed duty value of less than $25, but that additional adjustments could be necessary in order

82 Tr. at 38, 46 (Mr. Stewart); Petitioners’ Posthearing Brief at 9. 83 Bridgestone’s Prehearing Brief at 31; see id. at Exh. 9. 84 Petitioners’ Posthearing Brief at 9; see Petitioners’ Posthearing Brief, Questions from Vice Chairman Pearson,Question 4 at 28. 85 See, e.g., Tr. at 38 (Mr. Stewart) (importer questionnaire data show domestic producers are losing marketshare to subject imports), 46 (Mr. Stewart) (importer questionnaire data show subject imports have increased);Petitioners’ Posthearing Brief at 11, Questions from Chairman Aranoff, Question 3 at 13-14. 86 GPX’s Prehearing Brief at 92. 87 GPX’s Posthearing Brief at 4 n.6 & Exh. 2 at 3. 88 Chinese Respondents’ Posthearing Brief, Answers to the Commission’s Questions at 2; see ChineseRespondents’ Prehearing Brief at 44. 89 See CR/PR at Table E-2. 90 See CR/PR at Table C-1. 91 See CR/PR at Table E-5. We note that reliance on those data would omit a significant number of subjectimports, as is evident from an examination of the data pertaining to pricing product 4. See, e.g., CR/PR at Table V-4(significant quantities of subject imports under $35 apparent in 2005). 92 Petitioners argue that whether the Commission examines import statistics or importer questionnaire data,subject imports are significant and increased significantly during the period of investigation. Petitioners’Posthearing Brief at 11. 93 CR/PR at IV-1.
14
to better reflect the actual volume of subject imports.82 Bridgestone concurred with this proposal.83 Intheir posthearing brief, however, petitioners contended that the Customs data should be revised again, thistime to exclude imports of Chinese tires with a landed duty value under $35.84 At the hearing and in theirposthearing brief, petitioners continued to argue that the Commission should use these further adjustedCustoms data to arrive at subject import volumes, but they also utilized data culled from the importerquestionnaire responses to support their arguments regarding injury by reason of the subject imports.85
Respondent GPX argues that given the significant problems in estimating imports volumes fromCustoms data, the Commission should use the import volumes reported in the importer questionnaireresponses because the former yields an estimate of import volume that is known to be wrong and the latter“has quite ‘good’ coverage of total imports”86 and “are the most accurate data source.”87 The Chineserespondents agree with GPX and assert that the adjusted Census data are clearly unreliable, whereas thedata provided in the importer questionnaire responses are “both accurate and sufficientlycomprehensive.”88
In the final staff report, prepared after the hearing and after posthearing briefs were submitted,Commission staff presented three alternative data sets for calculating the volume of subject imports: importer questionnaire responses;89 a composite consisting of importer questionnaire responses, CustomsNet Import File (“CNIF”) data adjusted to exclude tires over 1,500 pounds in weight (pursuant to thescope exclusion of tires with a weight of 1,500 pounds or more) and tires with a landed duty value of lessthan $25, and information from any importer responding to the Commission’s importer questionnaires (toavoid double-counting);90 and a second composite that is identical to the first composite, except that itexcludes all OTR tires with a landed duty value of less than $35.91 The record is not clear, nor did theparties reach any consensus, on which methodology for adjusting the Customs data was likely to result inthe smallest margin of either over- or undercounting subject imports. By contrast, GPX and the Chineserespondents endorse the use of the questionnaire data, and petitioners and Bridgestone agree that thequestionnaire data are representative of subject import trends.92
We have determined to rely on data obtained from the importer questionnaire responses inreaching our injury and critical circumstances determinations. While these data represent only anestimated *** percent of subject imports and *** percent of nonsubject imports,93 and are therefore likely

94 Chairman Aranoff, Commissioner Okun, Commissioner Lane, and Commissioner Williamson note that eachof the alternative data sets exhibits the same general trends for the volume of subject imports over the period. Ineach data set from 2005 to 2007, the market share of subject imports increased both by units and value, and the valueof subject imports increased by approximately the same amount, with increases ranging from $92 million to $102million. CR/PR at Tables C-1, E-2 and E-5. Accordingly, reliance on a different data set to measure the volume ofsubject imports would not have altered their analysis in these investigations. 95 USITC Pub. 3943 at 12 n.58. 96 Petitioners’ Posthearing Brief, Questions from Vice Chairman Pearson, Question 3 at 21, 23. 97 Bridgestone’s Prehearing Brief at 29-31 & Exh. 9; Bridgestone’s Posthearing Brief at 6 & App. A at 13. 98 GPX’s Prehearing Brief at 105; GPX’s Posthearing Brief, Answers to Questions at 39. 99 Chinese Respondents’ Posthearing Brief, Answers to the Commission’s Questions at 44. 100 Whereas all responding importers reported subject merchandise in terms of quantity and value, not allreported it in terms of weight. See Importer Questionnaire Responses at Question II-5 for ***.
15
to understate the absolute levels of subject and nonsubject imports, they do represent the trends in suchimports as experienced by the importers responding to the questionnaires.94
B. Units/Value vs. Weight
There are three possible ways to measure the volume of imports in these investigations: weight,units or value. In the preliminary phase of these investigations, the Commission explained that, whereasits normal practice is to consider volume in terms of units rather than value, in these investigations thereappeared to be large variations in unit values both among the subject merchandise and among the articlescomprising the domestic like product. In addition, because an issue arose as to whether the domesticindustry had begun producing and selling more higher-valued products within the domestic like productand, if so, to what extent this was due to the subject imports, the Commission considered volume in termsof both units and value.95
In this final phase of the investigations, petitioners argue that the Commission should continue to use units as a basis to measure the volume of subject imports and may use value as well, albeit withcaution.96 Bridgestone argues that the Commission should rely on unit data and pay little, if any, attentionto the pound or value data.97 GPX, conversely, contends that the Commission should rely on weight.98 The Chinese respondents assert that the Commission should use weight or value as a measure ofvolume.99
We have determined to use both units and value as the most appropriate measures of volume inthese investigations. As indicated above, several of the parties, both supporting and opposing a finding ofmaterial injury by reason of the subject imports, maintain that the Commission should continue to usethese data. In addition, these data are the most complete data on the record.100 However, in certaininstances in our discussion of the domestic industry, i.e., capacity, production, shipments, and the like, wealso have evaluated the data pertaining to weight.

101 Pursuant to Section 771(24) of the Tariff Act, imports from a subject country of merchandise correspondingto a domestic like product that account for less than 3 percent of all such merchandise imported into the UnitedStates during the most recent 12-month period for which data are available preceding the filing of the petition shallbe deemed negligible. 19 U.S.C. §§ 1671b(a), 1673b(a), 1677(24)(A)(i)(I). No party submitted any argument on theissue of negligible imports. For the most recent 12-month period preceding the filing of the petition for which datais available (June 2006 through May 2007), subject imports from China were well above the 3 percent statutorynegligibility threshold. CR/PR at IV-4 n.6. China is the largest foreign supplier of certain OTR tires to the UnitedStates, accounting for 54.7 percent of the quantity of total imports in 2007, and 34.1 percent of the value. CR/PR atTable E-1. Consequently, we find that subject imports from China are not negligible. 102 19 U.S.C. §§ 1671d(a) and 1673d(a). 103 19 U.S.C. § 1677(7)(B)( i). The Commission “may consider such other economic factors as are relevant to thedetermination” but shall “identify each [such] factor . . . [a]nd explain in full its relevance to the determination.” 19U.S.C. § 1677(7)(B); see also Angus Chemical Co. v. United States, 140 F.3d 1478 (Fed. Cir. 1998). 104 19 U.S.C. § 1677(7)(A). 105 19 U.S.C. § 1675a(a)(4). 106 CR/PR at I-3. 107 CR/PR at II-1. 108 See CR at II-6, PR at II-3. 109 See CR/PR at Table E-2 (apparent consumption reached a high of 6.3 million tires and value of $1.6 billion in2007).
16
IV. MATERIAL INJURY BY REASON OF SUBJECT IMPORTS FROM CHINA101
In the final phase of antidumping or countervailing duty investigations, the Commissiondetermines whether an industry in the United States is materially injured by reason of the imports underinvestigation.102 In making this determination, the Commission must consider the volume of subjectimports, their effect on prices for the domestic like product, and their impact on domestic producers of thedomestic like product, but only in the context of U.S. production operations.103 The statute defines“material injury” as “harm which is not inconsequential, immaterial, or unimportant.”104
For the reasons stated below, we determine that the domestic industry producing certain OTRtires is materially injured by reason of subject imports from China.
A. Conditions of Competition and the Business Cycle
In evaluating the likely impact of the subject imports on the domestic industry, the statute directsthe Commission to consider all relevant economic factors “within the context of the business cycle andconditions of competition that are distinctive to the affected industry.”105 The following conditions ofcompetition are relevant to our determination.
Product Considerations. Certain OTR tires are used on a wide variety of vehicles and equipmentemployed in agriculture, forestry, construction, and industrial settings for hauling, towing, lifting, and/orloading. The majority of trade in tires consists of those used for agricultural and industrial applications.106 In addition to different categories of end uses, the market is differentiated to some extent by brand names,which permit certain companies to charge a higher price than others. Certain OTR tires also are dividedinto other segments including the OEM market and the aftermarket (or replacement market).107
Demand Considerations. The parties agree that the demand for certain OTR tires is derived fromthe demand for off-the-road vehicles used in the agricultural, construction, industrial, and mining sectorsof the economy, with some of these sectors being cyclical. In general, demand is considered to be strongand growing.108 Evidence in the record also indicates that 2007 was a boom year in terms of demand,although demand generally was strong in each year of the period of investigation.109

110 CR at II-7, PR at II-3. 111 See Petitioners’ Prehearing Brief at 19; Bridgestone’s Prehearing Brief at 18-19; Bridgestone’s PosthearingBrief at 5; Chinese Producers’ Prehearing Brief at 33; CR at II-8, PR at II-4. 112 See GPX’s Prehearing Brief at 41-42; Chinese Producers’ Prehearing Brief at 33; see also CR at II-7 - II-8,PR at II-4. 113 CR at II-8, PR at II-4; Chinese Producers’ Prehearing Brief at 34-36. 114 GPX’s Prehearing Brief at 41-42; Chinese Producers’ Prehearing Brief at 28-29; API’s Prehearing Brief at 2-3; CR/PR at II-1. 115 Domestic producers supply between 51.4 percent and 52.4 percent, measured in units, of their U.S. shipmentsto the OEM market, compared with 19.2 percent to 21.0 percent of subject imports U.S. shipments. Conversely, amuch higher percentage of subject imports are marketed through distributors that generally serve the replacementmarket (aftermarket). CR/PR at II-1 & Table I-4. Likewise, there are distinct markets for agricultural, constructionand off-the-highway tires, as reflected by separate headings in the Harmonized Tariff Schedule. CR/PR at Tables I-3, III-7 & IV-4. “Off-the-highway” is not a precisely defined term, being described only as “[o]f a kind used onbuses or trucks.” CR/PR at Table I-3. U.S. producers supply between 70.9 percent and 72.8 percent of their outputto the agricultural sector and between 25.0 percent and 26.7 percent of their output to the construction sector. CR/PR at Table III-7. Importers from China supply between 23.7 percent and 37.0 percent of their imports to theagricultural sector and between 58.3 percent and 70.6 percent of their imports to the construction sector. CR/PR atTable IV-4. Lastly, there are different market segments for bias ply and radial tires, each of which has distinctivecharacteristics and price points. It is estimated that 65 percent to 70 percent of the market for OTR tires is made upof bias ply tires. CR at I-17 n.35, III-8; PR at I-15 n.35, III-5. 116 CR/PR at Table E-2. 117 Chairman Aranoff, Commissioner Okun, Commissioner Lane, and Commissioner Williamson note that theapparent consumption figures reported in the text above are based in part on data from importer questionnaireresponses (see CR/PR at Table E-2). The staff report also contains apparent consumption figures based on thealternative data sets proposed by petitioners and by Bridgestone (CR/PR at Tables C-1 and E-5), which show a slightincrease or decline in consumption in units, and increases by value. While most of the larger increases are seen infigures based in part on data from importers’ questionnaire responses, they note that figures from all data sets are
(continued...)
17
The agricultural sector experienced strong demand due to high crop and commodity prices. There is evidence that demand normally tracks trends in U.S. farming and mining sectors with salesincreasing as the farm economy improves and commodity prices increase.110 The construction sector wasvery strong through most of the period of investigation, although the housing crisis that began in 2007 hasresulted in some declines in demand for construction tires. There has been steady growth in demand forOTR tires used in mining, oil and gas production and manufacturing.111
Notwithstanding a slowing U.S. economy, OTR tire demand has recently increased in light ofrising farm income, rising export demand for U.S.-manufactured machines that use certain OTR tires andhigh prices for oil, corn and mining commodities (such as copper, gold and silver).112 Demand hasincreased globally as well as domestically.113
Demand for OTR tires can be broken down into demand for tires to be sold in “original”machinery and equipment and demand for replacement tires, with the replacement market being muchlarger than the original machinery and equipment market. The level of replacement demand is affected bymachine usage, the particular application at issue and the number of recently purchased machines. Original equipment and machinery tires and replacement tires are present within each industry segment.114115
The staff report shows that the overall demand for OTR tires, as measured by apparentconsumption, increased over the period of investigation, from 5.8 million tires in 2005 to 6.3 million tiresin 2007, and totaled 1.5 million tires in January-March 2007 and 1.6 million tires in January-March 2008. As measured by value, apparent domestic consumption increased from $1.2 billion in 2005 to $1.6 billionin 2007, and was $379.6 million in January-March 2007 and $425.3 million in January-March 2008.116 117

117 (...continued)consistent with reports that demand was strong throughout the period of investigation. See Petitioners’ PrehearingBrief at 19, Bridgestone’s Prehearing Brief at 18-19, Bridgestone’s Posthearing Brief at 5, Chinese Producers’Prehearing Brief at 33; CR at II-6 - II-8, PR at II-3 - II-4. 118 CR at IV-4 - IV-5, PR at IV-4. Subject imports totaled 825,000 tires in 2005, rising to 1.4 million tires in2007. They totaled 325,000 tires in January-March 2007 and 237,000 tires in January-March 2008. The value ofsubject imports climbed from $84.9 million in 2005 to $187.3 million in 207. It was $45.2 million in January-March2007 and $32.5 million in January-March 2008. Measured in units, subject import market share increased from 14.2percent in 2005 to 22.3 percent in 2007, and was 21.0 percent in January-March 2007 and 14.9 percent in January-March 2008. Measured in value, subject import market share was 7.0 percent in 2005 and rose to 12.0 percent in2007, and was 11.9 percent in January-March 2007 and 7.6 percent in January-March 2008. CR/PR at Table E-2. 119 See CR/PR at Table IV-4. 120 Petitioners’ Prehearing Brief at 26. 121 See, e.g., CR/PR at Table IV-4. 122 Petitioners’ Prehearing Brief at 26. 123 Bridgestone’s Prehearing Brief at 17. 124 CR at IV-5 n.8, PR at IV-4 n.8. 125 CR/PR at Table E-2. 126 GPX’s Prehearing Brief at 40-41. 127 CR/PR at Table C-1. 128 CR/PR at Table III-2.
18
Supply Considerations. There are three sources of supply for OTR tires: subject imports,nonsubject imports and domestic production. China is the largest foreign supplier of OTR tires to theUnited States.118 A large majority of subject imports consists of bias tires119 and a large majority of theOTR tire market likewise is for bias tires (70 percent).120 Subject imports were present in all marketsegments for which data were gathered during the period of investigation,121 although they wereconcentrated in the aftermarket (80 percent of importers’ U.S. shipments).122 In the first quarter of 2008,however, the concentration in the aftermarket declined and 29.1 percent of subject imports were sold toOEMs.123
The majority of nonsubject imports were from Sri Lanka, Taiwan and Thailand.124 Nonsubjectimports totaled 1.1 million tires in 2005 and 1.2 million tires in 2007, and totaled 308,000 tires inJanuary-March 2007 and 357,000 tires in January-March 2008. Their market share, measured in units,was 18.8 percent in 2005 and 18.5 percent in 2007. It was 19.9 percent in January-March 2007 and 22.4percent in January-March 2008. Measured in value, their market share was 21.9 percent in 2005 and 23.3percent in 2007. It was 21.6 percent in January-March 2007 and 25.0 percent in January-March 2008.125
In terms of domestic supply, one domestic producer, Continental Tire North America, exited theindustry during the period of investigation and sold its facility in Bryan, Ohio to Titan in July 2006. Goodyear also sold its farm tire plant and assets located in Freeport, Illinois to Titan in December 2005. In 2006, Titan decided to convert one-third of its farm tire capacity in Freeport to non-farm OTR tires andto expand non-farm OTR tires output at Bryan. Some of the Freeport production was shifted to Titan’sfacility in Des Moines, Iowa.126
Average domestic capacity to produce OTR tires increased from 10.0 million tires in 2005 to 10.2million tires in 2007, and was 2.6 million tires in January-March 2007 as compared to 2.7 million tires inJanuary-March 2008.127 In terms of weight, capacity was 1.1 billion pounds in 2005 and 2007, and was277.0 million pounds in January-March 2007 as compared to 284.2 million pounds in January-March2008.128 Production declined from 2005 to 2007 in terms of units: from 4.7 million tires in 2005 to 4.0million tires in 2007, but was 923,000 tires in January-March 2007 and 1.1 million tires in January-March
129 CR/PR at Table C-1. 130 CR/PR at Table III-2. We note that GPX argues that the domestic industry’s claims of large excess capacityare difficult to reconcile with the evidence of shortages during the period. See GPX’s Posthearing Brief at 10-11. While the record indicates that there was substantial excess capacity during the period, Titan’s reconfiguration andthe changes in the product mix suggest that actual excess capacity may have been less than the level reported by thedomestic industry. At any rate, the large scope of products reflected in overall capacity limits the utility of thecapacity data. 131 In terms of quantity, subject import market share rose from 14.2 percent in 2005 to 22.3 percent in 2007, andwas 21.0 percent in January-March 2007 and 14.9 percent in January-March 2008. In terms of value, it climbedfrom 7.0 percent in 2005 to 12.0 percent in 2007, and was 11.9 percent in January-March 2007 and 7.6 percent inJanuary-March 2008. CR/PR at Table E-2. 132 In terms of quantity, domestic producers’ market share fell from 67.0 percent in 2005 to 59.2 percent in 2007,and was 59.0 percent in January-March 2007 and 62.7 percent in January-March 2008. In terms of value, it fell from71.1 percent in 2005 to 64.7 percent in 2007, and was 66.5 percent in January-March 2007 and 67.3 percent inJanuary-March 2008. CR/PR at Table E-2. 133 In terms of quantity, nonsubject import market share was 18.8 percent in 2005 and 18.5 percent in 2007, andwas 19.9 percent in January-March 2007 and 22.4 percent in January-March 2008. In terms of value, it was 21.9percent in 2005 and 23.3 percent in 2007, and was 21.6 percent in January-March 2007 and 25.0 percent in January-March 2008. CR/PR at Table E-2. 134 CR at II-3, PR at II-2; Caterpillar’s Prehearing Brief, Exh. 17; Petitioners’ Posthearing Brief, Questions fromCommissioner Okun, Question 1 at 1-2 & Statement of Maurice M. Taylor, Jr.; Bridgestone’s Posthearing Brief at 7;Tr. at 383 (Mr. Ganz). 135 See CR at II-3 - II-6, PR at II-2; see also Tr. at 252, 343, 345, 370 (Mr. Koch), 257 (Mr. Edwards), 260, 383(Mr. Ganz), 281 (Mr. Lammlein), 302, 409 (Mr. Denis), 318, 359, 411, 412-13 (Ms. Koester). 136 See, e.g., Chinese Respondents’ Prehearing Brief at 27; Caterpillar’s Prehearing Brief, Exh. 17; Petitioners’Posthearing Brief, Questions from Commissioner Okun, Question 1 at 1-2 & Statement of Maurice M. Taylor, Jr.;Bridgestone’s Posthearing Brief at 7 & n.26; Tr. at 52 (Mr. Stewart), 58 (Mr. Taylor), 74 (Mr. Rasey), 220 (Mr.Taylor), 383 (Mr. Ganz). 137 See, e.g., Tr. at 254 (Mr. Koch) (Caterpillar was unable to obtain all tires requested in two sizes to satisfymilitary contract), 261 (Mr. Ganz) (older tires for smaller equipment declining in popularity and domestic industry isfocusing on larger tires with longer runs), 284 (Mr. Durling) (domestic industry is making more of the newer, largertires).
19
2008.129 In terms of weight, production increased from 567.1 million pounds in 2005 to 600.9 millionpounds in 2007, and was 143.1 million pounds in January-March 2007 and 159.6 million pounds inJanuary-March 2008.130
As subject imports increased over most of the period of investigation, so did their market share.131 Domestic producers’ market share declined commensurately,132 while nonsubject market share remainedfairly steady.133
Respondents and some purchasers reported shortages during the period of investigation. Three ofthe seven U.S. producers, ***, *** and *** acknowledged that they had refused, declined or been unableto supply coterminous tires during the period. Nine subject importers reported that they also had refused,declined or been unable to supply tires during the period of investigation.134 Some purchasers wereplaced on allocation or did not receive the total quantity of OTR tires they had ordered.135
The Commission received extensive evidence and argument on the nature and extent of thealleged shortages. While the evidence in the record is mixed, shortages appear most acute in C&M tiresof 39 inches and higher, especially very large agricultural and mining tires, due to a very large increase indemand for these products.136 Other tight-supply conditions were observed among certain OTR tires,particularly in product categories in which the need was limited, such as smaller farm tires designed to fitolder model equipment.137 This situation is reflective of both the period of high demand that existed

138 Evidence in the record indicates that 2003 was a low point in the business cycle for agriculture, which thenexperienced growing demand for new tractors and for replacement tires for existing equipment. See, e.g.,Petitioners’ Posthearing Brief, Questions from Commissioner Aranoff, Question 5 at 21. In addition, theconstruction/industrial sector experienced “serious troughs” in demand in 2002-03, and it took time for idledequipment to come back on line, personnel to be hired/rehired, additional raw materials to be acquired to balanceproduction and demand. Petitioners’ Posthearing Brief, Questions from Commissioner Okun, Question 1 at 2. 139 See, e.g., CR/PR at Table III-3 (Titan ***.); Petitioners’ Posthearing Brief, Question 3 from ChairmanAranoff, at 4-5. 140 See Caterpillar’s Prehearing Brief, Exh. 15 (tires listed as critical in 2006, i.e. for which there was a supplygap, resulted from losing shipments from Continental/General and Belshina). 141 We acknowledge that ***. CR/PR at Table III-3. In addition, ***. ***. CR/PR at Table III-3. 142 See Petitioners’ Responses to Posthearing Questions from Vice Chairman Pearson and Commissioner Okunat Exh. 2; Bridgestone’s Responses to Posthearing Questions from Vice Chairman Pearson and Commissioner Okunat Exh. A and B. Vice Chairman Pearson and Commissioner Okun requested data related to inventory, backorders,demand, anticipated production, and when production is anticipated for OTR tires on a quarterly basis dating back toJanuary 1, 2005. These data show that backorders were not prevalent for coterminous tires during the period ofinvestigation. When backorders existed at the end of a quarter for specific tires, the domestic producers generallywere able to eliminate or reduce these backorders in subsequent quarters. Id. 143 See, e.g., Caterpillar’s Prehearing Brief, Exhs. 1, 10, 18; Tr. at 251-54, 343, 345, 370-71 (Mr. Koch). 144 Caterpillar’s Prehearing Brief, Exh. 1 at 4, Exh. 18 at 2; Tr. at 253 (Mr. Koch) (Caterpillar prefers topurchase OTR tires from Michelin, Goodyear and Bridgestone – the “Big 3”). The importance of the brand premiumis explained below. 145 See, e.g., Tr. at 253 (Mr. Koch); Caterpillar’s Prehearing Brief, Exh. 1 at 5-6. 146 See Caterpillar’s Posthearing Brief, Exh. 1. See also CR at II-3, II-2 (***); see also GPX’s Prehearing Briefat 38 (Titan has more than 3,000 distinct SKUs); Tr. at 370 (Mr. Reilly) (not enough warehouse space or capital tokeep large array of tires). Any backorders relative to OTR tires purchased from *** would not be unexpected. 147 CR/PR at Table II-5. 148 CR at II-16 - II-17 & Table II-7, PR at II-11 & Table II-7.
20
throughout the period of investigation138 and the significant time required to reconfigure a plant tomanufacture different types or sizes of tires.139 The domestic industry reconfigured its productioncapacity in order to move into the manufacture of larger, higher-priced tires, contributing to some of thetight supply conditions for certain small tires.140 141 Data from the domestic industry do not indicate thattight supply conditions existed for any length of time across the range of certain OTR tires.142
We have considered the extensive testimony, both oral and written, from Caterpillar regarding itsinability to obtain all of the tires it ordered.143 We note that the tires that Caterpillar ordered are notrepresentative of the entire market, as it generally seeks OTR tires produced by domestic producers underthe three highest priced premium brands144 and concedes that it perceives a shortage if it has to settle fornon-premium brand tires of the same type, even if the latter are more readily available.145 In addition, thetype of tire that Caterpillar found to be in short supply in 2005 differed from the type not available in2006, which is evidence that shortages do not exist in the same categories of tires year after year.146
Substitutability. There is a high degree of substitutability between U.S. and Chinese OTR tires. The majority of U.S. producers, importers and purchasers reported that they were always or frequentlyinterchangeable.147 When comparing U.S. and Chinese OTR tires on the basis of 17 selectedcharacteristics, the majority or plurality of purchasers consider the products comparable in mostcategories.148 Many purchasers require prequalification or certification of subject Chinese tires. Thus, formany purchasers quality is not an issue, and price is likely to be the determining factor in purchasing

149 Bridgestone’s Posthearing Brief at 22. 150 CR at VII-10 & nn.14-15, PR at VII-6 & nn.14-15. 151 GPX’s Prehearing Brief at 37-38. 152 See CR/PR at Table III-7; see also CR/PR at Tables V-1 - V-9 (subject merchandise present in sales of allnine pricing products). 153 CR at II-11, PR at II-___. 154 Caterpillar’s Posthearing Brief at 9. 155 Market participants supplied wide-ranging estimates of the extent of the price premium, from 3 percent to 50percent or more. CR at II-14, PR at II-8. In evaluating the evidence of record, we note that the majority of estimatesranged from 10 percent to 25 percent. Id. We also note that an independent, published source indicated that miningtires of certain premium brands offer a smaller advantage over others, ranging from 5 percent to 10 percent, in termsof lifespan and operating costs. Caterpillar’s Posthearing Brief, Exh. 5 at 22. Considering the above, we concludethat the price premium most commonly ranges from 10 percent to 15 percent, but may also be smaller or greater inparticular instances. 156 Chinese Producers’ Prehearing Brief at 29-30. 157 Chinese Producers’ Prehearing Brief at 30; Caterpillar’s Posthearing Brief at 9-10 & Exh. 9. 158 Chinese Producers’ Prehearing Brief at 31; Caterpillar’s Posthearing Brief at 9; Petitioners’ Posthearing Brief,Questions from Staff at 2; see CR at II-13 - II-14, PR at II-8. 159 See API’s Prehearing Brief at 2-3. 160 CR/PR at V-1. Raw material costs increased from $500.9 million in 2005 to $629.0 million in 2007, andwere $152.1 million in January-March 2007 and $186.5 million in January-March 2008. CR/PR at Table VI-1.
21
decisions.149 OTR tires are not a commodity, however.150 OTR tires vary across many dimensions suchthat there is an extremely wide range of products. Titan alone has more than 3,000 distinct SKUs.151 Whereas the Chinese and U.S. product compete in both the OEM and replacement market, as notedabove, most subject imports are sold in the replacement market, although their role in the OEM market isbecoming more pronounced. The Chinese product competes in all sectors of the market, i.e., agricultural,construction and mining.152
Price is one of the three most important factors involved in purchasing decisions, along withavailability and quality.153 There is a three-tiered hierarchy of brands. The top tier consists of large,international producers having widely recognized brands, such as Goodyear, Bridgestone and Michelin.154 These top brands sell at a premium155 over lower tier products and feature technical and manufacturingsophistication, highly developed manufacturing facilities and product lines, deep dealer and serviceinfrastructures, and substantial marketing and advertising budgets.156 The second tier comprises brandsthat do not have the same brand recognition, market breadth and quality as the top brands. The Titanbrands and some subject imports from China are included among these brands, which appeal toreplacement buyers who do not require the level of quality and service provided by the premium brandsand are positioned below the top-tier brands in price.157 Subject imports also appear among the third tier,composed of so-called private brands or dealer house brands that appeal to economy-minded customers. Purchasers and domestic producers agree that there is a hierarchy of brands.158
We note that lead times vary from a few days to several months depending on inventories,production schedules and shipping schedules.159 Given the high degree of substitutability between theU.S. and Chinese products and the large volumes of subject imports, we do not find that the longer leadtimes for subject merchandise materially limit competition between subject imports and the domestic likeproduct.
Other Considerations. Other supply considerations include rapidly escalating raw material costs,which averaged 58.6 percent of the cost of goods sold (“COGS”) annually between 2005 to 2007.160 A
161 CR/PR at V-1. 162 See CR/PR at Table III-6 (AUV increased from $227.22 per tire in 2005 to $280.17 per tire in 2007, whiletotal quantity of shipments decreased from 4.5 million tires in 2005 to 4.2 million tires in 2007). See also CR/PR atTable III-7 (adjusted to show small vs. large OTR tires and shows small tires have remained a consistent share ofU.S. production). 163 19 U.S.C. § 1677(7)(C)(i). 164 CR/PR at Table E-1. We note that preliminary countervailing duties were imposed in December 2007 andpreliminary antidumping duties were imposed in February 2008. See 72 Fed. Reg. 71360 (Dec. 17, 2007); 73 Fed.Reg. 9278 (Feb. 20, 2008). We find that the decrease in subject imports in the comparison of the interim data is theconsequence of the imposition of the provisional duties. 165 CR/PR at Table E-1. 166 CR/PR at Table E-2. 167 Compare CR/PR at Table E-2 with CR/PR at Table C-1. 168 See CR/PR at Table IV-4. 169 See, e.g., GPX’s Prehearing Brief at 107-09; Caterpillar’s Prehearing Brief at 12-13.
22
major raw material input used in making these products is natural rubber. Other important materialsinclude synthetic rubber, carbon black, various chemicals, textiles, and steel.161
Domestic producers manufactured more of the larger tires with higher average unit values(“AUVs”) as the period of investigation progressed, albeit in lower volumes.162
. B. Volume of the Subject Imports from China
Section 771(7)(C) of the Tariff Act provides that the “Commission shall consider whether thevolume of imports of the merchandise, or any increase in that volume, either in absolute terms or relativeto production or consumption in the United States, is significant.”163
Based on the evidence in the record of these investigations, we find the volume of subject importsfrom China is significant both in absolute terms and relative to consumption and production in the UnitedStates.
The volume of subject imports increased significantly from 2005 to 2007. Subject importstotaled 825,000 tires in 2005, rising to 1.4 million tires in 2007. They totaled 325,000 tires in January-March 2007 and 237,000 tires in January-March 2008.164 In terms of value, subject imports climbed from$84.9 million in 2005 to $187.3 million in 2007. The value of subject imports was $45.2 million inJanuary-March 2007 and $32.5 million in January-March 2008.165
Subject import market share increased as well. In terms of quantity, it was 14.2 percent in 2005and rose to 22.3 percent in 2007. It was 21.0 percent in January-March 2007 and 14.9 percent in January-March 2008. In terms of value, subject import market share increased from 7.0 percent in 2005 to 12.0percent in 2007. It was 11.9 percent in January-March 2007 and 7.6 percent in January-March 2008.166 The ratio of the quantity of subject imports to U.S. production was 17.6 percent in 2005, rising to 35.0percent in 2007. It was 35.2 percent in January-March 2007 and 21.9 percent in January-March 2008.167
Domestic producers faced significant competition from subject imports in both the agriculturalsector, which constituted the largest portion of their sales, and the construction sector. U.S. shipments ofsubject imports of agricultural tires increased by 153 percent from 2005 to 2007, and U.S. shipments ofsubject imports of construction tires increased by 34 percent from 2005 to 2007.168
Respondents argue that the increase in subject imports was due primarily to shortages prevalent inthe domestic industry.169 As explained above, however, reported shortages were primarily among C&Mtires of 39 inches and higher. We note that subject import volumes were relatively concentrated in

170 In 2005, subject imports of smaller, coterminous tires totaled 554,000 tires. They totaled 637,000 tires in2006 and 845,000 tires in 2007. In January-March 2007, they totaled 195,000 tires and in January-March 2008, theytotaled 162,000 tires. As measured by value, subject imports of smaller, coterminous tires totaled $31.5 million in2005, $50.7 million in 2006 and $70.0 million in 2007. They totaled $17.1 million in January-March 2007 and$15.2 million in January-March 2008. Derived from CR/PR at Table IV-4.
C&M tires of 39 inches and higher were much fewer. In 2005, subject imports of these tires totaled ***tires. In 2006, they totaled *** tires, and in 2007 they totaled *** tires. They totaled 615 tires in January-March2007 and *** tires in January-March 2008. As measured by value, subject imports of C&M tires of 39 inches andhigher totaled $*** in 2005, $*** million in 2006 and $*** million in 2007. CR/PR at Table C-2.
We note that Table IV-4 of the staff report presents volume and value of imported subject OTR tiresdivided into three primary end-use categories with further breakouts by size range and tire characteristics such astread pattern and radial or non-radial construction. In order to divide subject tires into large and small categories, thefollowing tire sizes were considered “smaller”: tires specifically designated as less than 16 inches and 24 inches,respectively, as well as a nominal “Other” category for which no size range was reported. The remaining tires,greater than or equal to 16 inches and between 24 inches and 39 inches, were considered “larger.” 171 Domestic producers manufactured more of the larger tires with higher AUVs as the period of investigationprogressed, albeit in lower volumes. See CR/PR at Table III-6 (AUV increased from $227.22 per tire in 2005 to$280.17 per tire in 2007, while total quantity of shipments decreased from 4.5 million tires in 2005 to 4.2 milliontires in 2007). See also CR/PR at Table III-7 (adjusted to show small vs. large OTR tires and shows small tires haveremained a consistent share of U.S. production). 172 See CR/PR at Table IV-4 (subject imports present in all sectors of the market). 173 See Petitioners’ Responses to Posthearing Questions from Vice Chairman Pearson and Commissioner Okunat Exh. 2; Bridgestone’s Responses to Posthearing Questions from Vice Chairman Pearson and Commissioner Okunat Exh. A and B. 174 Id.
23
smaller, coterminous tires in which fewer shortages were reported.170 As subject imports captured largervolumes of this smaller-sized tire segment, domestic producers concluded that they no longer couldcompete in that segment and focused production on larger-sized tires, both those coterminous with thescope and C&M tires of 39 inches and higher.171 While there also were periodic tight supply conditionsfor smaller farm tires designed for older model equipment and other small-volume models, subjectimports were not restricted to or even concentrated in the categories in which there were reportedshortages.172 Furthermore, when purchasers reported tight supply conditions in coterminous tires, datafrom the domestic industry indicate that any backorders were not prevalent for coterminous tires duringthe period of investigation.173 When backorders existed at the end of a quarter for specific coterminoustires, the domestic producers generally were able to eliminate or reduce these backorders in subsequentquarters.174
For the foregoing reasons, we find that the volume of subject imports from China is significant,both in absolute terms and relative to consumption and production in the United States, and we find thatthe increase in the level of subject imports from China between 2005 and 2007 is also significant.
C. Price Effects of the Subject Imports from China
Section 771(7)(C)(ii) of the Act provides that, in evaluating the price effects of the subjectimports, the Commission shall consider whether –
(I) there has been significant price underselling by the imported merchandise ascompared with the price of domestic like products of the United States, and

175 19 U.S.C. § 1677(7)(C)(ii). 176 CR/PR at Table II-2. 177 CR at VII-10 & nn.14-15, PR at VII-6 & nn.14-15. 178 See CR/PR at Table II-5. 179 See CR/PR at Tables V-1 - V-9. 180 Commissioner Lane disagrees, as explained below. 181 Raw material costs increased 25.6 percent over the period of investigation. See CR/PR at Table VI-1. Forpricing product 1 sold in the replacement market, for example, domestic producers increased prices 27.5 percentbetween January-March 2005 and January-March 2008. See CR/PR at Table V-10. 182 CR/PR at Table VI-1. 183 Commissioner Lane has evaluated these data in light of the market conditions and an industry that has arelatively low operating income and arrived at a different conclusion from the majority. Considering that theoperating income percentage to net sales in the first year of the period of investigation was a low 0.1 percent, CR/PRat Table VI-1, and that there is a strong demand for OTR tires, the industry should have been able to raise prices tonot only cover the increased cost of its raw materials, but also to improve its operating income. She finds that theoperating income of the industry, although improved, remained too low and averaged only 1.1 percent for the threefull years of the period of investigation, 2005 through 2007. Id. This indicates that the industry was prevented fromraising prices to levels needed to produce a more reasonable operating income. In light of prevailing conditions ofcompetition, the record indicates that this inability to raise prices is related to the increased subject imports atreduced prices that undersold the domestic industry in a large percentage of pricing products examined. Therefore,Commissioner Lane determines that the record supports a finding that the domestic industry’s prices are beingsuppressed by the subject imports. 184 As noted above, Commissioner Lane does find evidence of price suppression. 185 CR at V-23, PR at V-6.
24
(II) the effect of imports of such merchandise otherwise depresses prices to a significantdegree or prevents price increases, which otherwise would have occurred, to a significantdegree.175
While price was consistently listed by purchasers as one of the most important factors in makingpurchasing decisions, it was not routinely listed as the single most important factor.176 OTR tires also arenot commodity products.177 Brand names command a premium and the hierarchy of brands comprisesthree tiers, as explained above. The Chinese product is found in two of the three tiers and generally ishighly substitutable for domestic OTR tires.178
Prices for all nine pricing products examined generally trended upward over the period, for bothdomestic and subject Chinese OTR tires.179 Thus, we find that there has been no price depression duringthe period of investigation.
We also do not find that the evidence shows that subject imports from China had significantsuppressing effects on prices for the domestic like product.180 Although, as explained above, raw materialcosts increased significantly over the period of investigation, the domestic industry was able to recoupthese costs through price increases.181 Thus, the ratio of COGS to sales decreased slightly over the annualperiods surveyed, from 89.7 percent in 2005 to 88.7 percent in 2007; it was 87.2 percent in both interimperiods.182 183
Notwithstanding the lack of price depression or evidence of significant suppression,184 there waswidespread and significant underselling during the period of investigation, with Chinese productunderselling domestic OTR tires in 147 of 157 quarterly price comparisons. The margins of undersellingranged from 1.5 to 57.0 percent.185 It is apparent that the existence of brand premiums, which most

186 We explain the basis for our estimate of the price premium in Section IV.A. of these views, under the heading“Substitutability.” 187 See CR/PR at Tables V-1 - V-9. 188 See Responses to Domestic Producer Questionnaires at Section IV. 189 CR/PR at Table E-2. 190 In terms of units, the domestic industry’s total net sales declined from 4.5 million tires in 2005 to 4.2 milliontires in 2007, and totaled 1.0 million tires in January-March 2007 and 1.2 million tires in January-March 2008. CR/PR at Table VI-1. In terms of value, the domestic industry’s total net sales rose from $1.0 billion in 2005 to $1.2billion in 2007, and was $288.3 million in January-March 2007 and $341.7 million in January-March 2008. Theincrease in value reflects the domestic industry’s move towards the manufacture of larger-sized tires, as corroboratedby these same data presented by weight: total net sales increased from 539.6 million pounds in 2005 to 639.0 millionpounds in 2007, and was 160.7 million pounds in January-March 2007 and 166.8 million pounds in January-March2008. CR/PR at Table VI-1. 191 CR at V-23 - V-24, PR at V-6 - V-7. 192 CR at V-24, PR at V-7. There was also confirmed lost revenue, as *** lowered its price due to a quotation ona Chinese-produced tire of $*** when the proposed price was $***. CR at V-28, PR at V-7. In the preliminaryphase of these investigations, Titan maintained that it had lost business due to imports from China on 19 customeraccounts. Commission staff contacted these firms, and five responded. Three out of the five stated that theypurchased subject imports due to lower prices. CR at V-28, PR at V-8. 193 We do not compare the domestic like product pricing data with that of the very large earthmoving/miningtires that are outside of the scope of the investigations. We have found that the very large earthmoving/mining tiresare not part of the same domestic like product as certain OTR tires.
25
commonly range from 10 to 15 percent, does not account for all of the underselling that occurred.186 Inthe clear majority of instances, margins of underselling were 15 percent or higher.187 In any event, asubstantial share of sales of domestic pricing products were not first tier brands;188 premium prices do notexplain margins of underselling with respect to these sales of non-first tier products.
We find that the widespread and significant margins of underselling have resulted in a significantloss of the domestic industry’s market share. U.S. producers’ market share, as measured by quantity, fellfrom 67.0 percent in 2005 to 59.2 percent in 2007, and was 59.0 percent in January-March 2007 and 62.7percent in January-March 2008. As measured by value, U.S. producers’ market share fell from 71.1percent in 2005 to 64.7 in 2007, and was 66.5 percent in January-March 2007 and 67.3 percent inJanuary-March 2008.189 Rather than lower its prices to meet underselling by the subject merchandise, theindustry chose to hold firm on prices sufficient to meet rising per unit production costs, at the expense ofsales volume.190 Thus, the domestic industry lost market share despite rising prices and robust demand.
Evidence on the record of confirmed lost sales illustrates this point. *** alleged that it lostannual sales of 14 separate products valued at more than $*** million due to competition from subjectimports. The allegations were confirmed, and it was reported that the quantities were actually far greaterthan those alleged.191 *** also lost sales of *** tires valued at $*** per tire to subject imports.192
As discussed below, consistent price underselling by subject imports has led to significantadverse effects on the condition of the domestic industry. While the domestic industry elected not tolower prices to the level of subject imports, it experienced, as a consequence, lost market share and lowerproduction in an expanding market, as discussed in more detail below.193

194 The statute instructs the Commission to consider the “magnitude of the dumping margin” in an antidumpingproceeding as part of its consideration of the impact of imports. 19 U.S.C. § 1677(7)(C)(iii)(V). In its finaldetermination, Commerce calculated final weighted-average dumping margins ranging from 4.08 percent to 19.15percent for named Chinese producers/exporters of OTR tires, and 210.48 percent for the PRC-wide entity. 73 Fed.Reg. 40485, 40489 (July 15, 2008); CR at Table I-2.
In its final determination, Commerce also found that the following programs provided countervailablesubsidies to producers of OTR tires in China: (1) Government provision of rubber for less than adequateremuneration; (2) Government policy lending; (3) Government debt forgiveness to TUTRIC; (4) Government debtforgiveness and the provision of land to Starbright pursuant to its change in ownership; (5) stamp tax exemption onshare transfers under NTSR; (6) tax subsidies to FIEs in specially designated geographic areas and local income taxexemption and reduction programs for “productive” FIEs; (7) VAT and tariff exemptions for FIEs and certaindomestic enterprises using imported equipment in encouraged industries; and (8) State Key Technology RenovationProject Fund. Consequently, Commerce assigned the following countervailable subsidy rates: Guizhou Tire Co.,Ltd. (2.45 percent); Hebei Starbright Tire Co., Ltd. (14.00 percent); Tianjin United Tire & Rubber International Co.,Ltd. (6.85 percent); and all others (5.62 percent). 73 Fed. Reg. at 40,483; CR/PR at Table I-1. Commerce assignedthe following net countervailable subsidy rates: Guizhou Tire Co., Ltd. (2.45 percent); Hebei Starbright Tire Co.,Ltd. (14.00 percent); Tianjin United Tire & Rubber International Co., Ltd. (6.85 percent); and all others (5.62percent). 73 Fed. Reg. 40480, 40483 (July 15, 2008). 195 Commissioners Lane and Pinkert note that Mr. Christenberry, Chief Executive Officer, Super GripCorporation, testified that his company is a producer and importer of specialty tires, many of which are not produceddomestically, that such tires are not being dumped in the United States, that the tires do not benefit from anysubsidies, and that his company was not provided notice of the petition prior to its filing. He said that by the time hewas made aware of the petition, it was too late for Super Grip Corporation to apply to Commerce for a separate ratein these investigations. Consequently, Super Grip Corporation reports that its imports are subject to the “All others”weighted average dumping margin. Commerce is the agency empowered by the statute to determine the actualdumping margins. See Algoma Steel Corp. v. United States, 688 F. Supp. 639, 644 (Ct. Int'l Trade 1988), aff'd, 865F.2d 240 (Fed. Cir.), cert. denied, 492 US. 919 (1989). Thus, as Super Grip Corporation is aware, it can pursue administrative remedies at Commerce with respect to its concerns. Tr. at 267, 435-36 (Mr.Christenberry). 196 19 U.S.C. § 1677(7)(C)(iii); see also SAA at 851 and 885 (“In material injury determinations, theCommission considers, in addition to imports, other factors that may be contributing to overall injury. While thesefactors, in some cases, may account for the injury to the domestic industry, they also may demonstrate that anindustry is facing difficulties from a variety of sources and is vulnerable to dumped or subsidized imports.”). SAAat 885. 197 19 U.S.C. § 1677(7)(C)(iii); see also SAA at 851, 885; Live Cattle from Canada and Mexico, Inv. Nos. 701-TA-386, 731-TA-812-813 (Prelim.), USITC Pub. 3155 at 25 n.148 (Feb. 1999).
26
D. Impact of the Subject Imports from China on the Domestic Industry194 195
Section 771(7)(C)(iii) of the Act provides that the Commission, in examining the impact of thesubject imports on the domestic industry, “shall evaluate all relevant economic factors which have abearing on the state of the industry.”196 These factors include output, sales, inventories, ability to raisecapital, research and development, and factors affecting domestic prices. No single factor is dispositiveand all relevant factors are considered “within the context of the business cycle and conditions ofcompetition that are distinctive to the affected industry.”197
In the final phase of these investigations, the factors we examine in making our determination asto whether subject imports have had an adverse impact on the domestic industry are mixed. Nevertheless,the overall weight of the factors supports a finding of material injury because several of the indicators thatshow improvement are affected either by the domestic industry’s movement toward larger-sized tires orby the effects of the imposition of the provisional duties (interim 2008 data). As measured by units, U.S.production of subject OTR tires fell by 14.3 percent over the full-year period, but registered an increase

198 U.S. production of subject OTR tires fell from 4.7 million tires in 2005 to 4.0 million tires in 2007. It was923,000 tires in January-March 2007 and 1.1 million tires in January-March 2008. CR/PR at Table C-1. 199 U.S. production of subject OTR tires increased from 567.1 million pounds in 2005 to 600.9 million pounds in2007. It was 143.1 million pounds in January-March 2007 and 159.6 million pounds in January-March 2008. CR/PR at Table III-2. 200 Capacity utilization fell from 46.8 percent in 2005 to 39.3 percent in 2007. It was 35.9 percent in January-March 2007 and 39.8 percent in January-March 2008. CR/PR at Table C-1. 201 U.S. producers’ U.S. shipments decreased from 3.9 million tires in 2005 to 3.7 million tires in 2007. Theytotaled 910,000 tires in January-March 2007 and 995,000 tires in January-March 2008. CR/PR at Table III-6. 202 In terms of pounds, U.S. producers’ U.S. shipments increased from 462.0 million pounds in 2005 to 552.4million pounds in 2007. They totaled 141.7 million pounds in January-March 2007 and 140.8 million pounds inJanuary-March 2008. CR/PR at Table III-6. 203 U.S. producers’ U.S. shipments increased from $861.2 million in 2005 to $1.0 billion in 2007. They totaled$252.4 million in January-March 2007 and $286.4 million in January-March 2008. CR/PR at Table III-6. 204 The total quantity of net sales declined from 4.5 million tires in 2005 to 4.2 million tires in 2007. It was 1.0million tires in January-March 2007 and 1.2 million tires in January-March 2008. CR/PR at Table VI-1. 205 The total quantity of net sales rose from 539.6 million pounds in 2005 to 639.0 million pounds in 2007. Itwas 160.7 million pounds in January-March 2007 and 166.8 million pounds in January-March 2008. CR/PR atTable VI-1. 206 The total value of net sales increased from $1.0 billion in 2005 to 1.2 billion in 2007. It was $288.3 million inJanuary-March 2007 and $341.7 million in January-March 2008. CR/PR at Table VI-1. 207 The number of production and related workers fell from 4,073 in 2005 to 3,856 in 2007. They numbered3,777 in January-March 2007 and 3,853 in January-March 2008. CR/PR at Table III-10. 208 The hours worked by production and related workers decreased from 8.5 million hours in 2005 to 8.1 millionhours in 2007. They totaled 2.0 million hours in January-March 2007 and 2.2 million hours in January-March 2008. CR/PR at Table III-10. 209 Total wages paid decreased from $246.3 million in 2005 to $240.0 million in 2007. Total wages paid were$59.8 million in January-March 2007 and $64.8 million in January-March 2008. CR/PR at Table III-10. 210 Productivity declined from 0.55 tires per hour in 2005 to 0.50 tires per hour in 2007. It was 0.46 tires perhour in January-March 2007 and 0.50 tires per hour in January-March 2008. CR/PR at Table III-10. 211 Productivity rose from 66.5 pounds per hour in 2005 to 74.4 pounds per hour in 2007. It was 71.0 pounds perhour in January-March 2007 and 73.9 pounds per hour in January-March 2008. CR/PR at Table III-10.
27
when comparing interim periods.198 In terms of weight, U.S. production of subject OTR tires increasedover the entire period of investigation; however, domestic producers produced relatively more larger-sized tires, as discussed above.199 Capacity utilization declined over the full-year periods and showed anincrease when comparing interim periods.200
U.S. producers’ U.S. shipments as measured by units decreased as well over the full-year periods,but showed an increase when comparing interim periods.201 When measured by weight, the trend was theopposite.202 U.S. producers’ U.S. shipments rose as well over the entire period of investigation whenmeasured by value.203
The total quantity of net sales as measured by units fell over the full-year periods, then showedrecovery when comparing interim periods.204 As measured by weight, the total quantity of net salesincreased throughout the period of investigation.205 The total value of net sales followed the lattertrend.206
Employment-related indicators were more consistently negative, generally showing downwardtrends during the full-year periods surveyed. The number of production and related workers declinedbetween 2005 and 2007,207 as did their hours worked208 and wages paid.209 Productivity, as measured inunits, declined,210 although it increased as measured by weight.211

212 Operating income rose from $1.5 million in 2005 to $28.0 million in 2007. It was $11.1 million in January-March 2007 and $14.1 million in January-March 2008. CR/PR at Table VI-1. 213 The ratio of operating income to net sales was 0.1 percent in 2005 and rose to 2.4 percent in 2007. It was 3.9percent in January-March 2007 and 4.1 percent in January-March 2008. CR/PR at Table VI-1. 214 COGS climbed from $906.9 million in 2005 to $1.1 billion in 2007. It was $251.4 million in January-March2007 and $298.1 million in January-March 2008. Raw material costs increased from $500.9 million in 2005 to$629.0 million in 2007. It was $152.1 million in January-March 2007 and $186.5 million in January-March 2008. CR/PR at Table VI-1. 215 COGS relative to net sales decreased from 89.7 percent in 2005 to 88.7 percent in 2007. It was 87.2 percentin January-March 2007 and January-March 2008. CR/PR at Table VI-1. 216 CR/PR at Table VI-3. As discussed above, the domestic industry restructured during the period, as certainproducers ceased production of OTR tires and others began to produce more of the larger sized tires. The costsassociated with this restructuring do not negate the adverse impact attributable to the subject imports. See GPX’sPosthearing Brief, Exh. 1 at 56-57, for detailing of these costs. The costs associated with the restructuring areallocable ***. See CR/PR at Table III-3. GPX’s arguments focus on the costs incurred by the industry; however,the domestic industry has also cut costs. It has cut both direct labor and other factory costs as a ratio to net salesover the period of investigation. See CR/PR at Table VI-1. Further, petitioners (one of which is the labor unionUSW) maintain that ***. Petitioners’ Posthearing Brief at 1. 217 See Bridgestone’s Posthearing Brief, App. A at 2-3. 218 See CR/PR at Table IV-4. 219 See CR/PR at Table III-7; CR at VI-16 n.29, PR at VI-7 n.29.
28
In addition, the domestic industry’s financial indicators were mixed. Operating income increasedover the entire period.212 The ratio of operating income to net sales, although improving, was quite low.213 COGS rose substantially over the period, primarily fueled by the rise in raw material costs,214 yet COGSrelative to net sales declined slightly over the full-year periods surveyed and held steady when comparinginterim periods.215 Four of the seven domestic producers experienced operating losses during the period,and two suffered losses every year and during both interim periods.216
As we consider whether these mixed indicators are reflective of a significant adverse impact bysubject imports, we note that demand for certain OTR tires was strong and increasing over the period ofinvestigation – which would ordinarily cause considerable improvement in the indicators – and that thedomestic industry shifted to the production of larger tires, allowing natural efficiency gains.217 Onbalance, we conclude that the subject imports are having a material adverse impact on the condition of thedomestic industry. The absolute and relative volumes of subject imports are significant, and subjectimports have gained significant market share at the expense of the domestic industry. As the volume ofsubject imports undersold the domestic product, the domestic industry experienced a number of adverseeffects on key factors we consider, namely production, capacity utilization, shipments, total quantity ofnet sales, employment, and lost sales and revenue. The trends are sometimes reversed when measured byweight, a fact we attribute to the industry's refocusing of production away from the small tire segment andtoward the larger sizes.
Subject import volumes were concentrated in smaller, coterminous tires.218 As subject importscaptured larger volumes of this smaller-sized tire segment, domestic producers concluded that they nolonger could compete in that segment and focused production on larger-sized tires.219 The record does notsupport respondents’ argument that the domestic industry moved to producing larger tires only because itcould receive higher margins. Indeed, capacity utilization and demand considerations for the smaller-sized tire segment indicate that the domestic industry could have produced both the smaller-sized tiresand the more profitable, larger-sized tires if it had not been for the underselling of subject imports in the
220 Average capacity utilization was below 50 percent throughout the period of investigation. CR/PR at TableC-1. 221 We note that the interim 2008 data indicate that, after provisional measures were imposed in December 2007,subject import volumes decreased, domestic and subject import prices for several certain OTR products rose sharply,and performance indicators for the domestic industry improved. Cf. SAA at 854 (“[t]he imposition of provisionalduties, in particular, can cause a reduction in import volumes and an increase in prices of both the subject importsand the domestic like product.”) They find that these developments constitute additional evidence of a causal linkbetween the subject imports and the material injury experienced by the domestic industry.
Subject import volume, measured both by quantity and value, was lower in interim 2008 than in interim2007. Subject import volume by quantity was 237,000 tires in interim 2008 versus 325,000 in interim 2007. Subjectimport volume by value was $32.5 million in interim 2008 versus $45.2 million in interim 2007. CR/PR at Table E-1.
Domestic and subject import prices for several certain OTR products rose sharply in the first quarter of2008. CR/PR at Tables V-1, V-5, V-6, and V-8 (***.).
The impact of these reduced volumes and increased prices is reflected in improvements from interim 2007to interim 2008 in the following performance indicators: ratio of operating income to sales, shipments, production,capacity utilization, and number of production workers. CR/PR at Table C-1. 222 Commissioner Williamson does not join the preceding footnote. 223 Having reached an affirmative determination by application of the statutorily mandated factors, the FederalCircuit’s decision in Bratsk Aluminum Smelter v. United States requires that we turn to an additional analysis whichcan, in some circumstances, negate an affirmative determination. 444 F.3d 1369 (Fed. Cir. 2006); see alsoCaribbean Ispat, Ltd. v. United States, 450 F.3d 1346 (Fed. Cir. 2006). The Federal Circuit directed the Commissionto undertake an “additional causation inquiry” whenever certain triggering factors are met: “whenever theantidumping investigation is centered on a commodity product, and price competitive non-subject imports are asignificant factor in the market.” Id. at 1375. The additional inquiry required by Bratsk, which we refer to as theBratsk replacement/benefit test, is “whether non-subject imports would have replaced the subject imports withoutany beneficial effect on domestic producers.” Id. As in the preliminary stage of these investigations, all partiesagree that Bratsk does not apply to these investigations. This is principally due to the fact that OTR tires are notcommodity products. See, e.g., CR at VII-10 & n.15. See also Bridgestone’s Prehearing Brief at 63. At least someproducers characterize the market as having commodity type products within it, however. See, e.g., Tr. at 122, 124(Mr. Monthei), 165 (Ms. Lutz), 313 (Mr. Anderson), 386 (Mr. Gantz). In the preliminary phase of theinvestigations, the Commission determined not to apply the analysis dictated by Bratsk because one of the predicatesfor that analysis, a “commodity product,” was not present. The Commission asked that in any final phaseinvestigations, any party holding a contrary view should so indicate and provide a basis for its view when submittingwritten comments on the draft questionnaires. USITC Pub. 3943 at 15 n.97. None of the parties responded. Basedon the record, we find that certain OTR tires are not commodity products and we do not apply the Bratsk analysis inthese investigations. 224 Commissioner Okun discerns two possible interpretations of the Bratsk opinion, which differ substantially. The so-called “replacement/benefit test” is noted above. The second one is that Bratsk is a further restatement of thecausation approach prescribed by Gerald Metals. Under this interpretation, the Bratsk decision stands to remind theCommission of its obligation under Gerald Metals that the Commission may not satisfy the “by reason of” causationrequirement by showing that subject imports contributed only “minimally or tangentially to the material harm.” Inother words, the Bratsk Court’s relatively short discussion of the underlying determination may not have establisheda new and rigid replacement/benefit test. Rather, the Court may have discussed the triggering factors as a reminderthat the Commission, before it makes an affirmative determination, must satisfy itself that it has not attributedmaterial injury to factors other than subject imports. See Separate and Additional Views of Chairman Daniel R.Pearson and Commissioner Deanna Tanner Okun Concerning Bratsk Aluminum v. United States in SodiumHexametaphosphate from China, Inv. No. 731-TA-1110 (Prelim.), USITC Pub. 3912 (Apr. 2007). CommissionerOkun has included this analysis in the Commission’s affirmative causation analysis.
29
smaller-sized tire segment.220 Thus, the domestic industry could have produced more tires and wouldhave experienced better financial returns than it has.221 222 223 224

225 CR at IV-15 - IV-16, PR at IV-13. 226 See 19 U.S.C. § 1673d(b)(4)(A)(i). 227 Trelleborg’s Prehearing Brief at 10. 228 Trelleborg’s Prehearing Brief at 10-11. 229 CR/PR at I-1. 230 CR/PR at Tables VII-2 & VII-3. 231 CR/PR at Table VII-3. 232 CR/PR at Table VII-5.
30
V. CRITICAL CIRCUMSTANCES
On March 11, 2008, petitioners alleged that there was a reasonable basis to believe or suspect thatcritical circumstances exist with respect to imports of certain OTR tires from China. With regard to thecountervailing duty investigation, pursuant to section 705(a)(2) of the Act, Commerce must find that thereare countervailable subsidies that are inconsistent with the World Trade Organization Agreement onSubsidies and Countervailing Measures (“SCM Agreement”) and that there have been massive importsover a relatively short period in order for critical circumstances to exist. Commerce determined in thisinvestigation that none of the respondents received subsidies inconsistent with the SCM Agreement anddid not reach the issue of whether there have been massive imports over a relatively short period of time. Thus, Commerce found in its final determination that critical circumstances do not exist with respect tosubject imports. As pertains to the antidumping duty investigation, Commerce found in its finaldetermination that critical circumstances exist for the PRC entity and found that critical circumstances donot exist for the mandatory respondents or for the remaining “Separate Rate Recipients.” Based on therecord before the Commission and the final Commerce determinations, petitioners are not pursuing theissue of critical circumstances any further.225 Because Commerce made an affirmative criticalcircumstances determination with respect to the PRC entity in its antidumping duty determination,however, we too are obligated to make a finding on that issue.226
As Trelleborg points out, normally the Commission relies on Commerce’s monthly import datafor the comparison periods reported by the exporters whose merchandise was subject to Commerce’saffirmative critical circumstances determination and official import statistics when available.227 Thenecessary data, however, are not present on the record of these investigations. Commerce’s data coveronly the four mandatory respondents that provided export data in response to its request, and it made anegative critical circumstances determination as to each firm. Commerce did not request the monthlyexport data from the 24 separate rate companies, but rendered a negative determination as to them basedon the experience of the four mandatory respondents. As a result, Commerce’s affirmative criticalcircumstances determination was made only as to the residual exports of the “PRC entity,” and thisdetermination was made on the basis of adverse inferences because the PRC entity failed to respond toCommerce’s questionnaire.228
The petitions in these investigations were filed on June 18, 2007.229 As Trelleborg argues, therewere a total of 1.2 million OTR tires exported to the United States in 2007, without excluding the firms asto which Commerce issued a negative critical circumstances determination, valued at $149.1 million.230 Atotal of 1.1 million OTR tires were exported to the United States in 2006, valued at $137.7 million.231 Inaddition, U.S. importers’ end-of-period inventories totaled 142,000 tires in 2006 and 217,000 tires in2007.232 These data do not show a sudden and significant increase in subject imports subsequent to thefiling of the petition that would undermine seriously the remedial effect of the antidumping duty order.
Based on the record, we determine that the imports subject to Commerce’s affirmative criticalcircumstances determination are not likely to undermine seriously the remedial effect of the antidumpingduty order to be issued on certain OTR tires.

31
CONCLUSION
For the reasons stated above, we find that the domestic industry producing certain OTR tires ismaterially injured by reason of subject imports of certain OTR tires from China that are subsidized andsold in the United States at less than fair value.

1 19 U.S.C. §§ 1671d(a), 1673d(b). 2 19 U.S.C. § 1677(7)(B)(i). The Commission “may consider such other economic factors as are relevant to thedetermination” but shall “identify each [such] factor. . . [a]nd explain in full its relevance to the determination.” 19U.S.C. § 1677(7)(B); see also Angus Chem. Co. v. United States, 140 F.3d 1478 (Fed. Cir. 1998). 3 19 U.S.C. § 1677(7)(A). 4 19 U.S.C. § 1677(7)(C)(iii). 5 Id. 6 CR at I-4 to I-5 & n.7, IV-4 & n.5, IV-12; PR at I-3 to I-4 & n.7, IV-4 & n.5, IV-11. 7 See, e.g., CR/PR at Table C-1. 8 CR at I-5 n.6, IV-4 n.4; PR at I-3 to I-4 n.6, IV-4 n.4. I note that at the time of the hearing, both petitioners andBFNA found the $25 per unit cutoff in the hybrid data to be a satisfactory approach. Tr. at 38, 46 (Mr. Stewart);Bridgestone’s Prehearing Brief at 31.
33
ADDITIONAL AND DISSENTING VIEWS OF VICE CHAIRMANDANIEL R. PEARSON
Based on the record in these investigations, I find that an industry in the United States is neithermaterially injured, nor threatened with material injury, by reason of subject imports of OTR tires fromChina that are subsidized and sold in the United States at less than fair value (LTFV). I join the views ofmy colleagues regarding domestic like product and domestic industry, and therefore join, and adopt as myown, sections I and II of their Views.
I. NO MATERIAL INJURY BY REASON OF SUBJECT IMPORTS
In the final phase of antidumping or countervailing duty investigations, the Commissiondetermines whether an industry in the United States is materially injured by reason of the imports underinvestigation.1 In making this determination, the Commission must consider the volume of imports, theireffect on prices for the domestic like product, and their impact on domestic producers of the domestic likeproduct, but only in the context of U.S. production operations.2 The statute defines “material injury” as“harm which is not inconsequential, immaterial, or unimportant.”3 In assessing whether the domesticindustry is materially injured by reason of subject imports, I consider all relevant economic factors thatbear on the state of the industry in the United States.4 No single factor is dispositive, and all relevantfactors are considered “within the context of the business cycle and conditions of competition that aredistinctive to the affected industry.”5
For the reasons discussed below, I determine that the domestic industry producing OTR tires isnot materially injured by reason of subject imports from China found to be subsidized and sold in theUnited States at LTFV.
A. Measurement Issues
The various data sets available in these investigations show more inconsistencies andcontradictions than is normally the case. As is customary, the staff report contains summary tables basedon a hybrid of questionnaire responses and official import statistics,6 which are intended to give areasonably comprehensive overview of apparent consumption, imports, domestic production, marketshares, and financial conditions.7 Staff acknowledges however, those tables may provide an imperfectpicture of the state of the domestic industry, due to the fact that the official import statistics includeimports not subject to investigation and there is a degree of disagreement as to the best way to minimizethe amount of such imports included in the data set.8

9 See, e.g., CR/PR at Table E-2. 10 CR/PR at IV-1 & nn.1 & 2. 11 CR/PR at IV-1. 12 See, e.g., Navneet Publ’ns (India), Ltd. v. United States, ___ F. Supp. 2d ___, Slip Op. 08-22 (Ct. Int’l TradeFeb. 26, 2008), at 6-13; Torrington Co. v. United States, 790 F. Supp. 1161, 1172-73 (Ct. Int’l Trade 1992);Pneumatic Directional Control Valves from Japan, Inv. No. 731-TA-988 (Preliminary), USITC Pub. 3491 (Mar.2002). 13 Color Television Receivers from China, Inv. No. 731-TA-1034 (Final), USITC Pub. 3695 (May 2004), at 7n.36; see also Coated Free Sheet Paper from China, Indonesia, and Korea, Inv. Nos. 701-TA-444-446 (Final) and731-TA-1136-1137 (Final), USITC Pub. 3965 (Dec. 2007), at 8; Certain Lined Paper School Supplies from China,India, and Indonesia, Inv. Nos. 701-TA-442-443 and 731-TA-1095-1097 (Final), USITC Pub. 3884 (Sept. 2006), at19. 14 Petitioners’ Posthearing Brief, Responses to Questions from Vice Chairman Pearson at 21, 23. 15 CR/PR at Table V-10. 16 Respondents’ Prehearing Brief at 105. 17 CR/PR at II-1, IV-12. 18 CR at II-8 to II-9; PR at II-3 to II-4.
34
For that reason, staff has also provided data based solely on responses to the importers’questionnaires.9 Of the 75 firms believed to be importing subject merchandise, 34 firms returned usablequestionnaires, two returned unusable questionnaires, and another nine firms stated that they did notimport the subject merchandise.10 Based on official import statistics, responding importers accounted forabout *** percent by quantity of subject imports.11 In light of this coverage estimate, I am mostcomfortable basing my determinations on the import data based on the hybrid of questionnaire data andthe official import statistics, although my analysis will also address the questionnaire-only data.
Another issue is whether to describe import volume in terms of units, dollar value, or weight inpounds. Although the Commission ordinarily measures volume in terms of quantity, it has discretion tochoose a different methodology when there are significant size and price variations among large numbersof types and configurations of the merchandise at issue.12 Nevertheless, the practice of the Commissionhas been to rely on quantity measures to avoid distortions resulting from product-mix issues.13 Whilenoting that all of these measures are to some extent flawed, my analysis will generally follow therecommendation of petitioners and rely on units, as expressed in the number of tires.14 Prices for OTRtires rose significantly over the period examined,15 thus making it difficult to measure volume accuratelywhen considering values. Nonetheless, I will make reference to value as an indicator of volume, asappropriate, to enable as detailed an analysis as possible.
Volume data presented as weight in pounds have some advantages in that they are able to capture,to some extent, the effects of a change in product mix, for instance a move toward larger tires, that unitsof tires alone would not measure.16 I will address volumes expressed in pounds where appropriate.
B. Conditions of Competition
I have taken the following conditions of competition into account when assessing whether thedomestic industry is materially injured by reason of the subject imports.
1. Demand Conditions
Demand for OTR tires derives mainly from demand for vehicles in agricultural, construction, andindustrial applications.17 The cost share of OTR tires in end-use products is small, with estimates rangingfrom 2 to 9 percent of the cost of the vehicle.18 Evidence on trends in demand is inconclusive, with 59percent of respondents—27 of 45 responding purchasers, 17 of 27 responding importers, and 3 of 7

19 CR at II-7; PR at II-3 to II-4. 20 CR at II-7 to II-8, IV-12; PR at II-4, IV-12. 21 CR/PR at Table C-1. I note that, by contrast, questionnaire-only data show an increase in apparentconsumption both in quantity and value terms with quantity increasing irregularly from 5,793,000 tires in 2005 to6,286,000 tires in 2007, a 8.5 percent increase, and with value increasing from $1.212 billion in 2005 to $1.555billion in 2007, a 28.3 percent increase. In terms of quantity, apparent consumption was 1,588,000 tires in firstquarter 2008, compared with 1,543,000 tires in first quarter 2007. In terms of value, apparent consumption was$425.3 million in first quarter 2008, compared with $379.6 million in first quarter 2007. CR/PR at Table E-2. 22 CR/PR at II-1 & Table I-4. 23 CR/PR at Table III-7. 24 CR/PR at Table IV-4. 25 CR at I-17 n.35, III-8; PR at I-15 n.35, III-5. 26 CR at II-8; PR at II-4. 27 CR/PR at III-1, Tables III-1, III-2.
35
responding domestic producers—stating that demand had increased over the period examined.19 Becauseof strong farm income and high commodity prices, demand appears to have increased for agricultural andmining tires while demand for construction tires was reported to be soft due to problems in the housingmarket.20 The data show that while apparent consumption as expressed in quantity fell irregularly from7,974,000 tires in 2005 to 7,790,000 tires in 2007, a decrease of 2.3 percent, its value increased from$1.420 billion in 2005 to $1.794 billion in 2007, an increase of 26.3 percent. In terms of quantity,apparent consumption was 1,822,000 tires in first quarter 2008, compared with 1,907,000 tires in firstquarter 2007. In terms of value, apparent consumption was $468.9 million in first quarter 2008,compared with $440.3 million in first quarter 2007.21
There are various market segments that comprise overall demand. Demand from end users,largely original equipment manufacturers (OEMs), has been relatively more important for domesticproducers than for subject imports. Domestic producers sent between 51.4 and 52.4 percent, measured inunits, of their U.S. shipments to the OEM market, compared with 19.2 to 21.0 percent of subject Chineseimports. Conversely, a much higher percentage of subject imports are marketed through distributors thatgenerally serve the replacement market (aftermarket).22 Likewise, there are distinct markets foragricultural and construction tires. U.S. producers sent between 70.9 and 72.8 percent of their output tothe agricultural sector and between 25.0 and 26.7 percent of their output to the construction sector.23 Importers from China sent between 23.6 and 37.0 percent of their imports to the agricultural sector andbetween 58.3 and 70.6 percent of their imports to the construction sector.24 Lastly, there are differentmarket segments for bias ply and radial tires, each of which has distinctive characteristics and pricepoints. It is estimated that 65 to 70 percent of the market for OTR tires is made up of bias ply tires.25
2. Supply Conditions
The majority of questionnaire respondents stated that there were no substitutes for OTR tires, butsome producers mentioned retreads as possible substitutes while some purchasers and importersmentioned solid or semi-solid tires as possible substitutes. Some purchasers and importers alsomentioned that tracks could serve as substitutes in some limited applications.26
Domestic supply is *** with the top *** companies comprising *** percent of domesticproduction by quantity.27 There was significant consolidation early in the period examined. In July 2006,Continental General exited the industry, selling its tire facility in Bryan, OH to Titan Tire Corporation
28 CR at III-1 n.3, Table III-3, VI-1 to VI-2 & n.8; PR at III-1 n.3, Table III-3, VI-1 & n.8. 29 CR/PR at Table III-3. 30 Id. 31 Id. 32 CR/PR at Table IV-2. 33 CR/PR at Table IV-1. “The tire industry is multinational in nature; therefore, production plants are situated invirtually every geographic region, particularly in North America, Europe, Japan, other Asian countries, Oceania,Latin America, the Middle East, and Africa.” CR at VII-11; PR at VII-7. 34 Certain Off-the-Road Tires from China, Inv. Nos. 701-TA-448 and 731-TA-1117 (Preliminary), USITC Pub.3943 (August 2007) (“Preliminary report”) at IV-4 & Table IV-2. But see CR at IV-5 n.8; PR at IV-4 n.8 (listing SriLanka, Taiwan, and Thailand). 35 CR at II-3 to II-4; PR at II-2. 36 CR at II-4 to II-5; PR at II-2. 37 CR at II-5; PR at II-3. 38 CR at II-5 to II-6; PR at II-3. 39 CR/PR at III-4 n.5. 40 CR/PR at Table III-6. As petitioners stated “[t]here’s no question that the more larger tires you can build, thebetter off your bottom line is going to be.” Tr. at 116 (Mr. Taylor). This does not appear to have been true forsubject imports as weight per tire measures, constructed using data from the staff report’s Tables IV-4 and E-1, showan increase in unit weights between 2005 and 2006, but a decrease between 2006 and 2007 with unit weights in 2007close to what they were in 2005.
36
(“Titan”) for $***. In December 2005, Goodyear also sold its Freeport, IL farm tire facility to Titan for$100 million.28 ***.29
Along with restructuring, the domestic industry experienced some production disruptions. ***.30 In addition, ***.31
Nonsubject imports accounted for a significant percentage of total imports into the United Statesand exceeded subject Chinese imports in terms of import values, but not in terms of import quantities, inevery year of the period examined.32 Nonsubject imports entered from many different sources, includingfrom foreign companies affiliated with several domestic producers.33 Among the leading nonsubjectsources were, in alphabetical order, Canada, France, India, Japan, Mexico, Sri Lanka, Taiwan, andThailand.34
The record also includes evidence of shortages in the supply of OTR tires. Twenty-two of 50responding purchasers reported that suppliers had refused, declined, or been unable to supply some OTRtires since January 2005, citing a total of 74 instances, 61 of which involved domestic producers and 6 ofwhich involved subject Chinese producers.35 Specifically, ***. ***.36 In addition, ***.37 Finally, ***.38 Domestic producers stated that any shortages of OTR tires were limited to construction and mining tireswith rim diameters of over 39 inches or were related to inventory problems caused by the businesscycle.39
The evidence further suggests that the domestic industry increasingly focused its sales in thelarger tires throughout the period examined. The unit weight of domestic producers’ U.S. shipmentsincreased from 119.0 pounds per tire in 2005 to 148.5 pounds per tire in 2007.40
3. Other Conditions
Purchasers indicated that availability, quality, and price were the most important factors affectingpurchasing decisions. There are many indications in the record that non-price factors play a role equal, ifnot greater, to that of price in purchasers’ decisions. “Quality” was the factor most frequently selected asmost important, selected by 15 of 50 responding purchasers, whereas “price” was the factor most

41 CR/PR at Table II-2. 42 CR at II-11; PR at II-6. 43 CR/PR at Table II-3. 44 CR/PR at Table II-4. 45 CR at II-13 n.11; PR at II-8 n.11. 46 CR at II-13; PR at II-8. 47 CR at II-14; PR at II-8. 48 CR/PR at Table II-5. 49 CR/PR at Table II-6. 50 CR/PR at Table II-7. 51 CR at I-13; PR at I-11. 52 CR at VII-10 & nn.14 & 15; PR at VII-6 & nn.14 & 15. 53 CR at I-12 n.19, VI-4 n.10; PR at I-10 n.19, VI-3 n.10. 54 CR at VI-11 & n.13; PR at VI-5 & n.13.
37
frequently selected as the next most important, selected by 13 of 50 purchasers.41 Only 10 of 50purchasers stated that they “always” or “usually” base their decisions mainly on price.42 While 31 of 49responding purchasers stated that “price” is a “very important” factor in their purchasing decisions, sevenother factors, including “availability” (48 of 50), “product consistency” (44 of 50), “quality meetsindustry standards” (43 of 50), “ability to obtain manufacturer’s support for warranty service” (42 of 50),“reliability of supply” (41 of 49), “delivery time” (34 of 50), and “U.S. transportation costs” (33 of 49),were selected more frequently as “very important.”43
Branding in the OTR tire industry is an important consideration for purchasers; 28 of 49purchasers said that they “always” or “usually” base their purchasing decisions on the producer of the tireand 20 of 50 purchasers said that they “always” or “usually” base their decisions on the brand of theproduct.44 Branding appears to be particularly important to OEMs.45 Reasons given by purchasers as towhy they prefer certain producers or brands include quality, consistent performance of product, specificdesign requirements, competitive prices, payment terms, and customer service.46 Purchasers’questionnaire responses regarding the magnitude of the brand premium contained within the price ofbranded OTR tires were varied, ranging between 3 and 50 percent, but the majority of estimates providedby purchasers were in the range of 10 to 25 percent.47
With regard to interchangeability between domestically produced tires and subject imports fromChina, a strong majority of questionnaire respondents (6 of 6 domestic producers, 15 of 23 importers, and30 of 43 purchasers) stated that the two were either “always” or “frequently” interchangeable.48 Nevertheless, non-price differences between domestically produced OTR tires and subject imports fromChina were “always” or “frequently” important to a majority of questionnaire respondents (1 of 6domestic producers, 13 of 21 importers, and 25 of 43 purchasers).49 While domestically produced OTRtires and subject Chinese imports were found to be “comparable” across a wide range of characteristics bya majority of purchasers (including “packaging,” “extension of credit,” “product consistency,” “discountsoffered,” “U.S. transportation costs,” “quality exceeds industry standards,” “able to source multipleproducts from supplier,” “product range,” and “warranty service”), the domestic product was found to be“superior” by a majority of purchasers with regard to “delivery terms” and “delivery time” and the subjectimports were found to be “superior” by a majority of purchasers only with regard to “price.”50 Whilethere are some industry-wide standards,51 both petitioners and respondents believed that OTR tires are nota commodity product.52
The primary raw material used to manufacture OTR tires is natural rubber, the price of whichincreased from an average of $0.23 per pound in 2001 to an average of $0.97 per pound in 2007. Pricesin 2008 have risen to $1.16 per pound, an unprecedented level.53 The domestic OTR tire industrygenerally purchases natural rubber using short-term contracts.54

55 19 U.S.C. § 1677(7)(C)(i). 56 CR/PR at Table IV-2. Note that questionnaire-only data show that the quantities of subject imports increasedfrom 825,000 in 2005 to 1,403,000 in 2007, an increase of 70 percent over the period examined. CR/PR at Table E-2. 57 CR/PR at Table IV-6. Note that questionnaire-only data show that the share of subject imports in apparentconsumption, in quantity terms, increased from 14.2 percent in 2005 to 22.3 percent in 2007, an increase of 8.1percentage points. CR/PR at Table E-2. 58 CR/PR at Tables IV-2, C-1. Note that questionnaire-only data show that subject imports from China, in valueterms, increased from $84.9 million in 2005 to $187.3 million in 2007, an increase of 120.6 percent over the periodexamined. CR/PR at Table E-2. 59 CR/PR at Table IV-6. Note that questionnaire-only data show that the share of subject imports from China inapparent consumption, in value terms, increased from 7.0 percent in 2005 to 12.0 percent in 2007, an increase of 5.0percentage points over the period examined. CR/PR at Table E-2. 60 CR/PR at Table IV-2. 61 CR/PR at Table IV-6. 62 CR/PR at Table III-6.
38
B. Volume of the Subject Imports
Section 771(7)(C)(i) of the Act provides that the “Commission shall consider whether the volumeof imports of the merchandise, or any increase in that volume, either in absolute terms or relative toproduction or consumption in the United States, is significant.”55
In terms of quantity, subject imports from China increased from 2,333,000 tires in 2005 to2,521,000 in 2006 before falling to 2,337,000 tires in 2007, for an overall increase of 0.2 percent over theperiod examined. The quantity of subject imports was 380,000 tires in first quarter 2008, compared with523,000 tires in first quarter 2007.56 As a share of apparent consumption, subject imports increased, interms of quantity, from 29.3 percent in 2005 to 32.6 percent in 2006 before falling to 30.0 percent in2007, representing an increase of 0.7 percentage points over the period examined. The share of subjectimports in first quarter 2008 was 20.9 percent, compared with 27.4 percent in first quarter 2007.57 Thus,while subject imports from China constitute a significant presence in the U.S. market for OTR tires, theirpresence in the market, when measured in terms of units, has changed little over the period examined.
When measured in value terms, subject imports from China increased from $190.4 million in2005 to $287.3 million in 2006, before declining slightly in 2007 to $282.4 million, an increase of 48.3percent over the period examined. The value of subject imports was $43.7 million in first quarter 2008,compared with $70.0 million in first quarter 2007.58 As a share of the value of apparent consumption,subject imports increased from 13.4 percent in 2005 to 18.4 percent in 2006, then decreased to 15.7percent in 2007, representing an increase of 2.3 percentage points over the period examined. The share ofsubject imports in first quarter 2008 was 9.3 percent, compared with 15.9 percent in first quarter 2007.59
Nonsubject imports, in quantity terms, decreased from 1,760,000 tires in 2005 to 1,733,000 tiresin 2007, a decrease of 1.5 percent. The quantity of nonsubject imports was 447,000 tires in first quarter2008, compared with 473,000 tires in first quarter 2007.60 Nonsubject imports’ share in apparentconsumption, in quantity terms, rose only slightly from 22.1 percent in 2005 to 22.2 percent in 2007, anincrease of 0.1 percentage points. The share of nonsubject imports was 24.5 percent in first quarter 2008,compared with 24.8 percent in first quarter 2007.61
By quantity, the domestic producers’ U.S. shipments decreased irregularly from 3,881,000 tires in2005 to 3,720,000 tires in 2007, a decrease of 4.2 percent. The quantity of U.S. shipments was 995,000tires in first quarter 2008, compared with 910,000 tires in first quarter 2007.62 As a share of apparentconsumption, by quantity, the domestic industry’s market share fell irregularly from 48.7 percent in 2005to 47.8 percent in 2007, a decrease of 0.9 percentage points over the period examined. The domestic

63 CR/PR at Tables IV-6, C-1. I note that, by quantity, exports of the domestic industry declined over the periodfrom 572,000 tires in 2005 to 515,000 tires in 2007, a decline of 10 percent. By value, exports increased over theperiod from $150.6 million in 2005 to $180.5 million in 2007, an increase of 19.9 percent. Over the periodexamined, exports accounted for between 12.2 and 12.8 percent of total shipments. CR/PR at Table III-6. 64 CR/PR at Table III-6. 65 CR/PR at Tables IV-6, C-1. 66 CR/PR at Table III-6. 67 CR/PR at Table E-2. 68 CR/PR at Table C-1. 69 19 U.S.C. § 1677(7)(C)(ii). 70 CR at V-23; PR at V-6. 71 CR at V-5; PR at V-3.
39
industry’s share was 54.6 percent in first quarter 2008, compared with 47.7 percent in first quarter 2007.63 By value, the domestic producers’ U.S. shipments rose from $861.2 million in 2005 to $1,006 million in2007, an increase of 16.8 percent. The value of domestic producers’ U.S. shipments was $286.4 millionin first quarter 2008, compared with $252.4 million in first quarter 2007.64 The domestic industry’smarket share, in terms of value, decreased irregularly over the period, falling from 60.6 percent in 2005 to56.1 percent in 2007, a decrease of 4.6 percentage points over the period examined. The domesticindustry’s share was 61.1 percent in first quarter 2008, compared 57.3 percent in first quarter 2007.65 Byweight, the U.S. shipments of domestic producers rose steadily from 462.0 million pounds in 2005 to552.4 million pounds in 2007, an increase over the period examined of 19.6 percent.66
Because all measures indicate that subject imports have a substantial presence in the U.S. market,I find that the absolute level of subject imports is significant. Evidence as to whether subject importshave increased over the period examined is less clear. While the questionnaire-only data show ameaningful increase in subject imports,67 the data as adjusted by staff do not.68 Thus, I make no finding asto whether the increase in subject imports has been significant.
C. Price Effects of the Subject Imports
Section 771(7)(C)(ii) of the Act provides that, in evaluating the price effects of the subjectimports, the Commission shall consider whether --
(I) there has been significant price underselling by the imported merchandise ascompared with the price of domestic like products of the United States, and
(II) the effect of imports of such merchandise otherwise depresses prices to a significantdegree or prevents price increases, which otherwise would have occurred, to a significantdegree.69
In the quarterly price comparisons between domestic OTR tires and imported Chinese OTR tires,prices of the Chinese OTR tires were lower than those of U.S. OTR tires in 147 out of 157 quarters withmargins of underselling ranging from 1.5 percent to 57.0 percent.70 Yet, even with nine products, thecoverage of pricing data was thin because there are so many varieties and sizes of tires; pricing datacovered only 4.5 percent of the domestic industry’s sales and 7.0 percent of subject import sales.71 Basedon this evidence, I find significant underselling by the imported merchandise.
Nonetheless, at least part of the underselling can be accounted for by the fact that branding,extended delivery times in obtaining tires from China, and quality are important considerations forpurchasers. As discussed above, while the majority of purchasers estimated that the branding premium
72 CR at II-14; PR at II-8. 73 CR/PR at Tables V-1, V-2. 74 CR/PR at Table II-7. 75 API’s Pre-Hearing Brief at 2-3. 76 CR/PR at Table II-3. 77 CR/PR at Table V-10. 78 CR/PR at Table VI-3. 79 CR at V-25, Table V-11; PR at V-6, Table V-11. 80 CR/PR at Table VI-3. 81 CR at V-27 to V-28, Table V-12; PR at V-6 to V-7, Table V-12. 82 CR/PR at Table VI-1. 83 19 U.S.C. § 1677(7)(C)(iii); see also SAA at 851, 885 (“In material injury determinations, the Commissionconsiders, in addition to imports, other factors that may be contributing to overall injury. While these factors, insome cases, may account for the injury to the domestic industry, they also may demonstrate that an industry is facingdifficulties from a variety of sources and is vulnerable to dumped or subsidized imports”).
40
was between 10 and 25 percent, some of the estimates were as high as 50 percent.72 Of the 157 quarterlyprice comparisons, only two quarters had margins of underselling that exceeded 50 percent.73 It ispossible that a branding premium could explain a substantial portion of the observed underselling. Asmentioned above, “delivery time” was one of only two factors in which the domestic OTR tire industryreceived a superior rating from a majority of purchasers when compared to subject imports from China.74 One importer stated that while lead times of domestic producers may be as little as a few days, lead timesfor Chinese producers may be as much as six months.75 That the advantage of domestic producers withregard to delivery time may result in a price premium over subject imports is demonstrated by the factthat purchasers rated this criterion as “very important” more frequently than “price.”76
In addition, the quarterly product-specific data indicate that prices for OTR tires have increasedsubstantially for each product over the period examined.77 Average unit values for shipments by thedomestic industry also increased.78 Accordingly, I do not find any evidence that subject imports havedepressed domestic prices during the period examined.
With regard to lost sales, the Commission staff was only able to confirm one lost sales allegation. That lost sale, alleged by ***, occurred in February 2008 and was valued at more than $***.79 In firstquarter 2008, *** sold OTR tires valued at $*** million.80 The lost sale would amount to less than onepercent of *** sales during that quarter. With respect to lost revenues, a purchaser did confirm one of*** lost revenue allegations from November 2007 in which it claimed to have lowered the price of ***tires from $*** to $*** due to competition from China. Another lost revenue allegation made by ***,also involving *** tires, while not disputed, was claimed by the purchaser to have been an overstockeditem.81 These lost revenue claims are quite small in comparison to the overall level of sales.
Finally, there is no evidence of price suppression. The ratio of cost of goods sold (COGS) to netsales actually fell slightly from 89.7 percent in 2005 to 88.7 percent in 2007,82 demonstrating that therehas been no cost-price squeeze. COGS rose, but prices rose faster.
Accordingly, in light of the role of non-price factors in the market, the domestic industry’sconsistent price increases, the relative lack of confirmed lost sales or lost revenues, and the absence ofany evidence of price suppression, I find that subject imports did not have a significant adverse effect ondomestic prices during the period examined.
D. Impact of the Subject Imports
In examining the impact of the subject imports on the domestic industry, I consider all relevanteconomic factors that bear on the state of the industry in the United States.83 These factors include output,sales, inventories, capacity utilization, market share, employment, wages, productivity, profits, cash flow,

84 19 U.S.C. § 1677(7)(C)(iii); see also SAA at 851, 885; Live Cattle from Canada and Mexico, Invs. Nos. 701-TA-386 and 731-TA-812-813 (Preliminary), USITC Pub. 3155 (Feb. 1999) at 25 n.148. 85 The statute instructs the Commission to consider the “magnitude of the dumping margin” in an antidumpingproceeding as part of its consideration of the impact of imports. 19 U.S.C. § 1677(7)(C)(iii)(V). In its finaldetermination, Commerce calculated final weighted-average dumping margins ranging from 4.08 percent to 19.15percent for named Chinese producers/exporters of OTR tires, and 210.48 percent for the China-wide entity. 73 Fed.Reg. 40,485, 40,489 (July 15, 2008); CR/PR at Table I-2. In its final determination, Commerce also found that the following programs provided countervailable subsidiesto producers of OTR tires in China: (1) Government provision of rubber for less than adequate remuneration; (2)Government policy lending; (3) Government debt forgiveness to TUTRIC; (4) Government debt forgiveness and theprovision of land to Starbright pursuant to its change in ownership; (5) stamp tax exemption on share transfers underNTSR; (6) tax subsidies to FIEs in specially designated geographic areas and local income tax exemption andreduction programs for “productive” FIEs; (7) VAT and tariff exemptions for FIEs and certain domestic enterprisesusing imported equipment in encouraged industries; and (8) State Key Technology Renovation Project Fund. 73Fed. Reg. 40,480, 40,484 (July 15, 2008). Consequently, Commerce assigned the following net countervailablesubsidy rates: Guizhou Tire Co., Ltd. (2.45 percent); Hebei Starbright Tire Co., Ltd. (14.00 percent); Tianjin UnitedTire & Rubber International Co., Ltd. (6.85 percent); and all others (5.62 percent). 73 Fed. Reg. at 40,483; CR/PR atTable I-1. 86 CR/PR at Table VI-1. 87 Id. I note further that the ratio of operating income to sales in 2004, as presented during the preliminary phaseof these investigations, was -0.1 percent. Preliminary report at Table C-1. Even while fully recognizing that theremay have been changes in accounting methodologies between the preliminary and final phases of theseinvestigations, I believe that this indicates that the ratio of operating income to sales in 2004 was not significantlydifferent from the level observed in 2005. 88 CR/PR at Table VI-2. 89 CR/PR at Table VI-3. 90 CR at VI-14 n.21; PR at VI-5 n.21. As discussed in the staff report, *** financial results were verified byCommission staff during plant visits. Id. 91 CR/PR at Table VI-3.
41
return on investment, ability to raise capital, and research and development. No single factor isdispositive and all relevant factors are considered “within the context of the business cycle and conditionsof competition that are distinctive to the affected industry.”84 85
The record indicates that the domestic industry’s financial performance was relatively stable overthe period examined. The domestic industry was profitable in each year of the period, and its profitabilitytrended upward throughout the period.
Operating income of the domestic industry increased during the period from only $1.5 million in2005 to $28.0 million in 2007.86 Operating income in the first quarter of 2008 was $14.1 million,compared to $11.1 million in first quarter 2007. Operating income as a ratio to net sales increased from0.1 percent in 2005 to 2.4 percent in 2007. The ratio of operating income to net sales in first quarter 2008was 4.1 percent, compared to 3.9 percent in first quarter 2007.87 The operating income per tire increasedfrom close to $0 in 2005 to $7 in 2007.88
For this industry, operating margins may not be the best measure of profitability due touncertainties regarding the reporting of SG&A expenses. Among the seven domestic producers, ***, hadthe highest ratio of SG&A expenses to net sales in 2005 and the second-highest ratio in both 2006 and2007. In every year of the period examined, *** ratio of operating expenses to net sales was at leasttwice the ratio for the ***.89 The SG&A expenses allocated by *** to its OTR tire operations changedsignificantly between the preliminary and final phases of these investigations and this turned an operating*** in 2005 into an operating ***90 Because *** accounts for between *** and *** percent of thedomestic industry’s gross profit,91 its methodology for calculating SG&A expenses has a significantinfluence on the financial performance of the domestic industry as a whole. For that reason, I alsoexamine gross profits.

92 CR/PR at Table VI-1. 93 CR/PR at Table VI-1. 94 CR/PR at Table VI-2. 95 CR/PR at Table VI-9. 96 CR/PR at Table III-10. 97 CR/PR at Table III-3. 98 CR/PR at III-1 & Table III-2. 99 CR/PR at III-4. 100 CR/PR at Table III-6. 101 CR/PR at Table C-1.
42
Gross profits declined only slightly from $103.8 million in 2005 to $102.5 million in 2006, andthen improved to $134.1 million in 2007. Gross profits were $43.7 million in first quarter 2008,compared with $36.9 million in first quarter 2007.92 The ratio of gross profits to net sales increased by1.0 percentage points from 10.3 percent in 2005 to 11.3 percent in 2007. The ratio of gross profits to netsales was 12.8 percent in first quarter 2008, as it was in first quarter 2007.93 Gross profit per tireincreased from $23 in 2005 to $32 in 2007.94
Total capital expenditures by the domestic industry increased from $*** in 2005 to $*** in 2007and total R&D expenses increased from $*** in 2005 to $*** in 2007. In addition, average return oninvestment increased from *** percent in 2005 to *** percent in 2007.95 Although these data do notindicate a robust performance by the industry, they reflect generally improving financial conditions in thedomestic industry.
Other indicators, while not as positive, do not portray an industry that is materially injured. Thenumber of production workers in the industry declined moderately from 4,073 in 2005 to 3,856 in 2007, adecrease of 5.3 percent. Likewise, hours worked fell by 5.4 percent between 2005 and 2007.96 Yet, asdiscussed above, the period examined was a period of consolidation within the domestic industry andseveral large production facilities were acquired by the largest producers in the industry.97 Given thisbackdrop, it is not surprising to see a small reduction in total industry employment.
Total production capacity increased by 2.1 percent over the period examined. Capacityutilization dropped irregularly from 46.8 percent in 2005 to 39.3 percent in 2007, a decline of 7.5percentage points.98 Producers report that areas where they have large amounts of unused capacity are forthe production of smaller sized agricultural OTR tires, which is consistent with the evidence showing thatthe domestic industry concentrated its product mix in larger OTR tires throughout the period examined.99 As discussed above, domestic production, when measured in pounds, increased by 19.6 percent over theperiod examined,100 indicating that the overall output of the domestic industry is likely increasing, even ifthe U.S. shipments expressed in units of tires declined by 4.2 percent.101 The domestic industry’sconsolidation and reconfiguration, the strike at Goodyear, and the shift in product mix to larger tiresappears to have had meaningful effects on capacity utilization and employment during the periodexamined.
In sum, even though the volume of subject imports is significant and subject imports consistentlyundersold the products of the domestic industry, I do not find that any injury experienced by the domesticindustry was caused by subject imports. Accordingly, based on the record in the final phase of theseinvestigations, and in light of my analysis of the significance of the volume, price effects, and impact ofthe subject imports, I determine that an industry in the United States is not materially injured by reason ofimports of subject OTR tires from China that are subsidized and sold in the United States at less than fairvalue.

102 19 U.S.C. § 1677(7)(F)(ii). 103 Id. 104 19 U.S.C. § 1677(7)(F)(i). Statutory threat factor (VII) is inapplicable because these investigations do notinvolve imports of both raw and processed agricultural products. Because Commerce found subsidies in theseinvestigations, supra note 85, CR at I-5, Table I-1; PR at I-4, Table I-1, I am required to take into account statutorythreat factor (I). I note that it is not clear how the various programs identified by Commerce might affect theincentives of Chinese producers to export subject OTR tires, among all of the various types of tires produced inChina, nor is it clear how these programs might effect incentives to export specifically to the United States, recallingthat exports to the United States were less than half of total Chinese OTR tire exports, in both quantity and valueterms, in every year of the period examined (CR/PR at Table VII-3). I do not find that these subsidies are likely togenerate substantial additional subject imports from China in the imminent future. 105 CR/PR at Tables VII-1, VII-2. *** commented that because they believe the questionnaire data underestimatethe size of the Chinese OTR tire industry, responding Chinese producers may only constitute one-half of theproduction of OTR tires in China. CR at VII-3 n.5; PR at VII-2 n.5. 106 CR at VII-7, Table VII-3; PR at VII-3, Table VII-3. 107 CR at VII-7 n.10; PR at VII-3 n.10. 108 CR at VII-10 n.11; PR at VII-6 n.11. 109 CR at VII-3, Tables VII-1, VII-3; PR at VII-2, Tables VII-1, VII-3. 110 CR/PR at Table VII-3. 111 CR/PR at Tables VII-1, C-1.
43
II. NO THREAT OF MATERIAL INJURY BY REASON OF SUBJECT IMPORTS
Section 771(F) of the Act directs the Commission to determine whether the U.S. industry isthreatened with material injury by reason of the subject imports by analyzing whether “further dumped orsubsidized imports are imminent and whether material injury by reason of imports would occur unless anorder is issued or a suspension agreement is accepted.”102 The Commission may not make such adetermination “on the basis of mere conjecture or supposition,” and considers the threat factors “as awhole” in making its determination whether dumped or subsidized imports are imminent and whethermaterial injury by reason of imports would occur unless an order is issued.103 In making mydetermination, I considered all statutory factors that are relevant to these investigations.104
A. Production Capacity in China
The Commission sent questionnaires to 95 Chinese firms that produce or export OTR tires andreceived responses from 19 firms that make up an estimated 75.1 percent, by quantity, of Chineseproduction of OTR tires and an estimated 115.1 percent, by quantity, of Chinese exports to the UnitedStates.105 Chinese producers reported that they shipped between 63 and 64 percent of their production tothe home market and that this percentage is expected to increase to 68.8 percent in 2009.106 The Chineseindustry exported between 14.8 and 16.2 percent of its production to the United States and exportedbetween 20.2 and 21.2 percent of its production to other export markets. Chinese OTR tires wereexported to 18 different countries, several of which are relatively close neighbors (e.g., Australia, India,Indonesia, Malaysia, and Russia).107 During the period examined, it was reported that three differentcountries—Argentina in March 2003, Turkey in August 2005, and South Africa in October2006—imposed antidumping duties on tires from China, but it was unclear how the scope of those ordersrelated to the subject merchandise.108 While production capacity increased at a healthy pace (by about 40percent over the period examined), capacity utilization for Chinese producers was over 90 percent duringthe period examined and was approximately 92.4 percent in 2007.109 Production capacity is expected toincrease only a further 5.3 percent over the next two years.110 In 2007, the Chinese industry had less than85 percent of the production capacity, by quantity, of the U.S. OTR tire industry.111 This indicates that
112 CR/PR at Table C-1. I note that the questionnaire-only data show a consistent increasing trend over the periodexamined. CR/PR at Table E-2. 113 CR/PR at I-1. 114 CR at VII-7 n.9; PR at VII-3 n.9. 115 The same pattern is discernible when examining subject imports by value. While the value of subject importsfrom China rose from $190.4 million in 2005 to $287.3 million in 2006, the value of subject imports then dropped by1.7 percent to $282.4 million in 2007. Likewise, subject imports’ share in apparent consumption, in value terms,rose from 13.4 percent in 2005 to 18.4 percent in 2006, only to fall 2.7 percentage points to 15.7 percent in 2007. Comparing the interim periods, we see that the value of subject imports fell by 37.6 percent, from $70.0 million infirst quarter 2007 to $43.7 million in first quarter 2008. As a share of apparent consumption, subject imports lost 6.6percentage points, by value, when comparing first quarter 2008 with first quarter 2007. CR/PR at Table C-1. 116 CR/PR at Table VII-3. 117 CR/PR at Tables V-1 to V-9.
44
there is not a large amount of unused capacity in China, and that there is only a relatively modest amountof exports that are currently being sent to third countries that could be diverted to the United States.
B. Rate of Increase of Subject Imports
In terms of quantity, subject imports from China, after increasing from 2,333,000 tires in 2005 to2,521,000 tires in 2006, actually fell by 7.3 percent to 2,337,000 tires in 2007. This trend is also presentwhen viewing the quantity of subject imports as a share of apparent consumption; after increasing from29.3 percent in 2005 to 32.6 percent in 2006, the share of subject imports fell to 30.0 percent in 2007, adecrease of 2.6 percentage points.112 All measures, whether the hybrid data or the questionnaire-onlydata, show a decline in subject imports between the interim periods.
Because countervailing duties were not imposed until December 17, 2007 and antidumping dutieswere not imposed until February 20, 2008,113 this decrease in the quantity of subject imports appears tohave been caused by factors other than the imposition of the preliminary duties. Other marketdevelopments, such as the 20-percent devaluation of the U.S. dollar relative to the Chinese renminbi sinceJuly 2005, a reduction in the Chinese VAT rebate on OTR tires from 13 percent to 5 percent(implemented on July 1, 2007), a reduction in the Chinese export tax rebate for rubber products, andincreases in ocean transportation costs likely discouraged U.S. imports of subject OTR tires.114 115 Thereis no evidence on the record to suggest changes in these market fundamentals in the reasonablyforeseeable future. Thus, a substantial near-term increase in subject imports, absent the imposition of anorder, seems unlikely.
C. Pricing
In every year of the period examined, AUVs for sales of subject Chinese merchandise to thirdcountries were higher than for subject merchandise exported to the United States. AUVs of Chinese OTRtires exported to other destinations ranged from $103.08 to $207.63 while AUVs of subject merchandiseentering the United States ranged from $99.19 to $129.23.116 These differing AUVs may well represent adifference in product mix. In any case, Chinese producers would likely be reluctant to shift their capacitytoward lower-valued output for sale in the U.S. market.
As discussed above, market fundamentals were shifting in a direction that acted to reduce theprice advantage of Chinese imports. These shifts are reflected in the pricing data for the individuallypriced products. For eight of nine products in the replacement sector, underselling margins declinedbetween fourth quarter 2006 and fourth quarter 2007.117 While pricing data are more sparse for productsmarketed to the OEM sector, underselling margins were lower for two of the four products between

118 Id. 119 CR/PR at Table C-1. I note that the import inventory ratios contained in the staff report, CR/PR at Table VII-5, were calculated using questionnaire-only import data and are therefore higher than the ratios calculated using thehybrid import data. 120 CR at VII-7, Table VII-4; PR at VII-3, Table VII-4.
45
fourth quarter 2006 and fourth quarter 2007.118 In other words, the margin of underselling subject importsbecame smaller as the period progressed. Nothing on the record suggests that a change in this trend islikely.
D. Inventories of Subject Merchandise
Although inventories of subject merchandise held by importers rose moderately over the periodexamined, they amounted to only 9.3 percent of subject imports in 2007.119
E. Product Shifting Potential
Of the 19 responding Chinese producers, 16 stated that they produced only OTR tires. Of theother three who stated that they produced other types of tires, it is clear that they are also highlyspecialized in their production capabilities. Two of the three clearly specialize in OTR tires, with theiroutput devoted 75 percent and 86 percent to OTR tires; the third Chinese company specialized inconsumer tires, with only 2 percent of its output in OTR tires.120
On balance, given that there is little unused capacity in the Chinese industry, that subject importsdecreased by both quantity and value measures between 2006 and 2007, that underselling marginsgenerally declined in 2007, that importers’ inventories are a small percentage of subject Chinese imports,and that there appears to be little ability for Chinese producers to shift production into subject imports, Iconclude that the domestic OTR tires industry is not threatened with material injury by reason of subjectimports from China.
CONCLUSION
For the foregoing reasons, I determine that the domestic OTR tires industry is neither materiallyinjured nor threatened with material injury by reason of subject imports.


1 See the section entitled “The Subject Merchandise” in Part I of this report for a complete description of themerchandise subject to these investigations. 2 Federal Register notices cited in the tabulation are presented in app. A.
I-1
PART I: INTRODUCTION
BACKGROUND
These investigations result from a petition filed with the U.S. Department of Commerce(“Commerce”) and the U.S. International Trade Commission (“USITC” or “Commission”) by Titan TireCorporation (“Titan”), Des Moines, Iowa, and The United Steel, Paper and Forestry, Rubber,Manufacturing, Energy, Allied Industrial and Service Workers International Union, AFL-CIO-CLC(“USW”), Pittsburgh, PA, on June 18, 2007, alleging that an industry in the United States is materiallyinjured and threatened with material injury by reason of subsidized and less-than-fair-value (“LTFV”)imports of certain off-the-road (“OTR”) tires1 from China. Information relating to the background of theinvestigations is provided below.2
Effective date ActionJune 18, 2007 Petition filed with Commerce and the Commission; institution of the
Commission's investigations
August 6, 2007 (AD)August 7, 2007 (CVD)
Commerce’s notices of initiation
August 27, 2007 Commission’s preliminary determinations
December 17, 2007 (CVD)February 20, 2008 (AD)
Commerce’s preliminary determinations; scheduling of final phase ofCommission investigations (73 FR 11437, March 3, 2008); revisedscheduling of final phase of Commission investigations (73 FR 19249, April9, 2008), (73 FR 38467, July 7, 2008), and (73 FR 42594, July 22, 2008)
July 7, 2008 Commerce’s final determinations (73 FR 40480 (CVD), 73 FR 40485 (AD),July 15, 2008)
July 8 and 9, 2008 Commission’s hearing1
August 15, 2008 Commission’s vote
August 28, 2008 Commission’s determinations sent to Commerce 1 A list of witnesses appearing at the Commission’s hearing is presented in app. B.

I-2
STATUTORY CRITERIA AND ORGANIZATION OF THE REPORT
Statutory Criteria
Section 771(7)(B) of the Tariff Act of 1930 (the “Act”) (19 U.S.C. § 1677(7)(B)) provides that inmaking its determinations of injury to an industry in the United States, the Commission--
shall consider (I) the volume of imports of the subject merchandise, (II)the effect of imports of that merchandise on prices in the United Statesfor domestic like products, and (III) the impact of imports of suchmerchandise on domestic producers of domestic like products, but onlyin the context of production operations within the United States; and . . .may consider such other economic factors as are relevant to thedetermination regarding whether there is material injury by reason ofimports.
Section 771(7)(C) of the Act (19 U.S.C. § 1677(7)(C)) further provides that--
In evaluating the volume of imports of merchandise, the Commissionshall consider whether the volume of imports of the merchandise, or anyincrease in that volume, either in absolute terms or relative to productionor consumption in the United States is significant.. . .In evaluating the effect of imports of such merchandise on prices, theCommission shall consider whether . . . (I) there has been significantprice underselling by the imported merchandise as compared with theprice of domestic like products of the United States, and (II) the effect ofimports of such merchandise otherwise depresses prices to a significantdegree or prevents price increases, which otherwise would haveoccurred, to a significant degree.. . .In examining the impact required to be considered under subparagraph(B)(i)(III), the Commission shall evaluate (within the context of thebusiness cycle and conditions of competition that are distinctive to theaffected industry) all relevant economic factors which have a bearing onthe state of the industry in the United States, including, but not limited to. . . (I) actual and potential declines in output, sales, market share, profits,productivity, return on investments, and utilization of capacity, (II)factors affecting domestic prices, (III) actual and potential negativeeffects on cash flow, inventories, employment, wages, growth, ability toraise capital, and investment, (IV) actual and potential negative effectson the existing development and production efforts of the domesticindustry, including efforts to develop a derivative or more advancedversion of the domestic like product, and (V) in {an antidumpinginvestigation}, the magnitude of the margin of dumping.
3 Petitioners’ response to Commerce’s second supplemental questionnaire, June 27, 2007, p. 9. 4 In addition to Titan and BFNA, U.S. producers include CarlisleTire and Wheel Company (“Carlisle”); DenmanTire Corporation (“Denman”); Goodyear Tire and Rubber Company (“Goodyear”); Michelin North America, Inc.(“Michelin”); and Specialty Tires of America, Inc. (“Specialty”). 5 The petition (as revised) excluded from the scope OTR tires used on mining and construction vehicles andequipment that have a rim diameter equal to or exceeding 39 inches, with a weight of 1,500 pounds or more. Petitioners’ response to Commerce’s second supplemental questionnaire, June 27, 2007, pp. 6-9.
I-3
Organization of the Report
Part I of this report presents information on the subject merchandise, subsidy and dumpingmargins, and domestic like product. Part II of this report presents information on conditions ofcompetition and other relevant economic factors. Part III presents information on the condition of theU.S. industry, including data on capacity, production, shipments, inventories, and employment. Parts IVand V present the volume and pricing of imports of the subject merchandise, respectively. Part VIpresents information on the financial experience of U.S. producers. Part VII presents the statutoryrequirements and information obtained for use in the Commission’s consideration of the question of threatof material injury and the judicial requirements and information obtained for use in the Commission’sconsideration of Bratsk issues.
U.S. MARKET SUMMARY
Certain OTR tires are used on a wide variety of vehicles and equipment employed in agriculturaland forestry, construction, and industrial settings for hauling, towing, lifting, and/or loading.3 Themajority of trade in subject tires is comprised of certain OTR tires used for agricultural and industrialapplications. The leading U.S. producers of certain OTR tires are *** and ***, while leading producersin China include ***. The leading U.S. importers of certain OTR tires from China are ***. Leadingimporters of certain OTR tires from nonsubject countries include ***. U.S. purchasers of certain OTRtires include original equipment manufacturers (“OEMs”) and distributors for the aftermarket; leadingpurchasers include ***.
Apparent U.S. consumption of certain OTR tires totaled approximately 7.8 million tires ($1.8billion) in the U.S. market in 2007. Currently, seven firms are known to produce certain OTR tires in theUnited States.4 U.S. producers’ U.S. shipments of certain OTR tires totaled 3.7 million tires ($1.0 billion)in 2007, and accounted for 47.8 percent of apparent U.S. consumption by quantity and 56.1 percent byvalue. U.S. imports from China totaled 2.3 million tires ($282 million) in 2007 and accounted for 30.0percent of apparent U.S. consumption by quantity and 15.7 percent by value. U.S. imports fromnonsubject sources totaled 1.7 million tires ($506 million) in 2007 and accounted for 22.2 percent ofapparent U.S. consumption by quantity and 28.2 percent by value.
SUMMARY DATA AND DATA SOURCES
A summary of data collected in the investigations is presented in appendix C, table C-1. Exceptas noted, U.S. industry data are based on questionnaire responses of seven firms that accounted for 100percent of U.S. production of certain OTR tires during 2007. U.S. imports are based on questionnaireresponses of 34 firms and official Commerce statistics that were modified to exclude: (1) the 34 firms thatreturned usable importer questionnaires, (2) the nine firms that reported they did not import subjectmerchandise or mining/construction tires during the period of investigation, (3) out-of-scope OTR tireimports that weigh more than 1,500 pounds per tire,5 and (4) out-of-scope imports of OTR tires less than
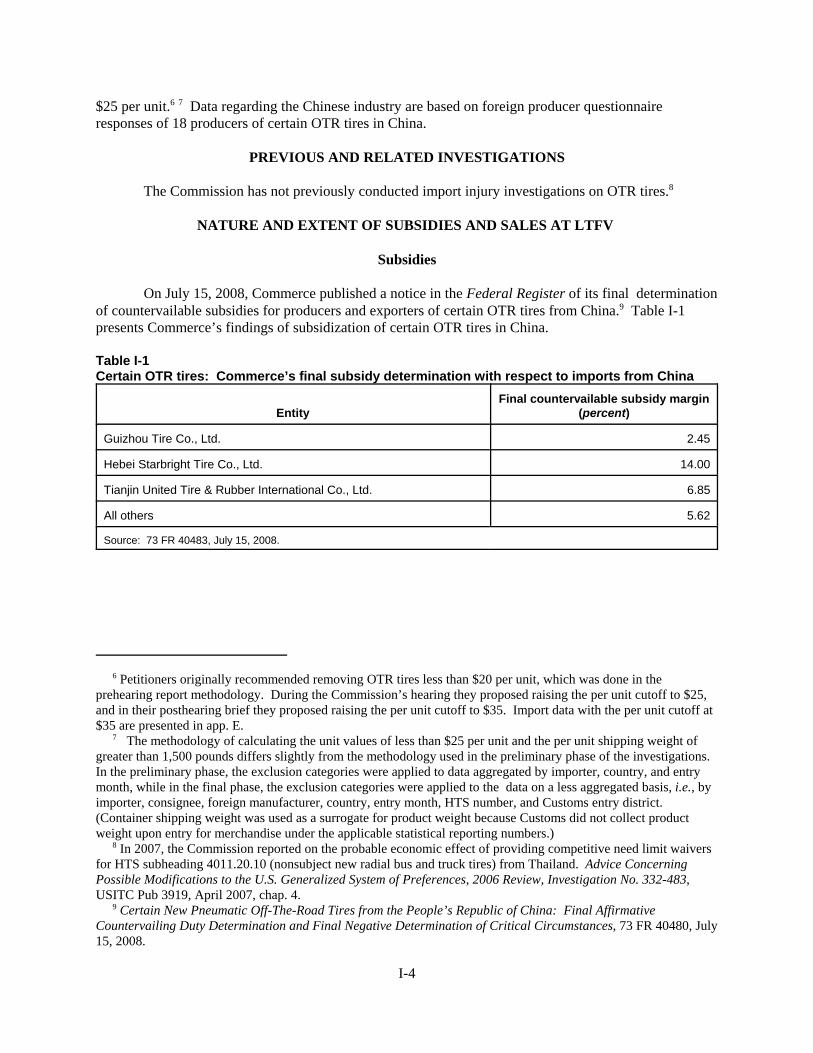
6 Petitioners originally recommended removing OTR tires less than $20 per unit, which was done in theprehearing report methodology. During the Commission’s hearing they proposed raising the per unit cutoff to $25,and in their posthearing brief they proposed raising the per unit cutoff to $35. Import data with the per unit cutoff at$35 are presented in app. E. 7 The methodology of calculating the unit values of less than $25 per unit and the per unit shipping weight ofgreater than 1,500 pounds differs slightly from the methodology used in the preliminary phase of the investigations. In the preliminary phase, the exclusion categories were applied to data aggregated by importer, country, and entrymonth, while in the final phase, the exclusion categories were applied to the data on a less aggregated basis, i.e., byimporter, consignee, foreign manufacturer, country, entry month, HTS number, and Customs entry district. (Container shipping weight was used as a surrogate for product weight because Customs did not collect productweight upon entry for merchandise under the applicable statistical reporting numbers.) 8 In 2007, the Commission reported on the probable economic effect of providing competitive need limit waiversfor HTS subheading 4011.20.10 (nonsubject new radial bus and truck tires) from Thailand. Advice ConcerningPossible Modifications to the U.S. Generalized System of Preferences, 2006 Review, Investigation No. 332-483,USITC Pub 3919, April 2007, chap. 4. 9 Certain New Pneumatic Off-The-Road Tires from the People’s Republic of China: Final AffirmativeCountervailing Duty Determination and Final Negative Determination of Critical Circumstances, 73 FR 40480, July15, 2008.
I-4
$25 per unit.6 7 Data regarding the Chinese industry are based on foreign producer questionnaireresponses of 18 producers of certain OTR tires in China.
PREVIOUS AND RELATED INVESTIGATIONS
The Commission has not previously conducted import injury investigations on OTR tires.8
NATURE AND EXTENT OF SUBSIDIES AND SALES AT LTFV
Subsidies
On July 15, 2008, Commerce published a notice in the Federal Register of its final determinationof countervailable subsidies for producers and exporters of certain OTR tires from China.9 Table I-1presents Commerce’s findings of subsidization of certain OTR tires in China.
Table I-1Certain OTR tires: Commerce’s final subsidy determination with respect to imports from China
EntityFinal countervailable subsidy margin
(percent)
Guizhou Tire Co., Ltd. 2.45
Hebei Starbright Tire Co., Ltd. 14.00
Tianjin United Tire & Rubber International Co., Ltd. 6.85
All others 5.62
Source: 73 FR 40483, July 15, 2008.

10 Certain New Pneumatic Off-The-Road Tires From the People’s Republic of China: Final Determination ofSales at Less Than Fair Value and Partial Affirmative Determination of Critical Circumstances, 73 FR 40485, July15, 2008.
I-5
Sales at LTFV
On July 15, 2008, Commerce published a notice in the Federal Register of its final determinationof sales at LTFV with respect to imports from China.10 Table I-2 presents Commerce’s dumping marginswith respect to imports of certain OTR tires from China.
Table I-2Certain OTR tires: Commerce’s final weighted-average LTFV margins with respect to imports fromChina
Exporter Producer
Final dumping margin
(percent)
Guizhou Tyre Co., Ltd. Guizhou Advance Rubber 4.08
Guizhou Tyre Co., Ltd. Guizhou Tyre Co., Ltd 4.08
Hebei Starbright Co., Ltd./GPX International Tire Corp. Hebei Starbright Co., Ltd . 19.15
Tianjin United Tire & Rubber International Co., Ltd. Tianjin United Tire & Rubber International Co., Ltd. 8.09
Xuzhou Xugong Tyre Company Limited Xuzhou Xugong Tyre Company Limited 0.00
Aeolus Tyre Co., Ltd. Aeolus Tyre Co., Ltd 9.48
Double Coin Holdings Ltd. Double Coin Holdings Ltd 9.48
Double Coin Holdings Ltd. Double Coin Group Rugao Tyre Co., Ltd 9.48
Double Coin Holdings Ltd. Double Coin Group Shanghai Donghai Tyre Co., Ltd 9.48
Double Happiness Tyre Industries Corp., Ltd. Double Happiness Tyre Industries Corp., Ltd 9.48
Jiangsu Feichi Co., Ltd. Jiangsu Feichi Co., Ltd 9.48
Kenda Rubber (China) Co,, Ltd./Kenda Global HoldingCo., Ltd. (Cayman Islands)
Kenda Rubber (China) Co., Ltd.9.48
KS Holding Limited Oriental Tyre Technology Ltd 9.48
KS Holding Limited Shandong Taishan Tyre Co., Ltd 9.48
KS Holding Limited Xu Zhou Xugong Tyres Co., Ltd 9.48
Laizhou Xiongying Rubber Industry Co., Ltd. Laizhou Xiongying Rubber Industry Co., Ltd 9.48
Oriental Tyre Technology Limited Midland Off the Road Tire Co., Ltd 9.48
Oriental Tyre Technology Limited Midland Specialty Tire Co., Ltd 9.48
Oriental Tyre Technology Limited Xuzhou Hanbang Tyres Co., Ltd 9.48
Table continued on next page.
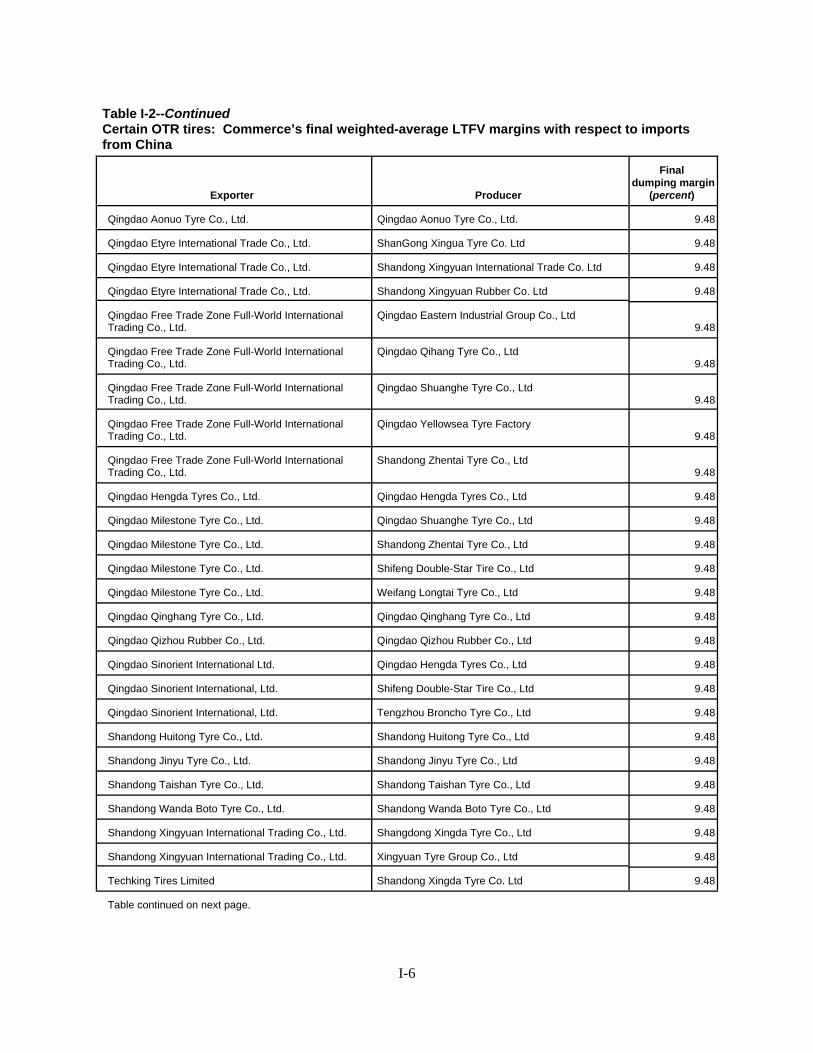
I-6
Table I-2--ContinuedCertain OTR tires: Commerce’s final weighted-average LTFV margins with respect to importsfrom China
Exporter Producer
Final dumping margin
(percent)
Qingdao Aonuo Tyre Co., Ltd. Qingdao Aonuo Tyre Co., Ltd. 9.48
Qingdao Etyre International Trade Co., Ltd. ShanGong Xingua Tyre Co. Ltd 9.48
Qingdao Etyre International Trade Co., Ltd. Shandong Xingyuan International Trade Co. Ltd 9.48
Qingdao Etyre International Trade Co., Ltd. Shandong Xingyuan Rubber Co. Ltd 9.48
Qingdao Free Trade Zone Full-World InternationalTrading Co., Ltd.
Qingdao Eastern Industrial Group Co., Ltd9.48
Qingdao Free Trade Zone Full-World InternationalTrading Co., Ltd.
Qingdao Qihang Tyre Co., Ltd9.48
Qingdao Free Trade Zone Full-World InternationalTrading Co., Ltd.
Qingdao Shuanghe Tyre Co., Ltd 9.48
Qingdao Free Trade Zone Full-World InternationalTrading Co., Ltd.
Qingdao Yellowsea Tyre Factory9.48
Qingdao Free Trade Zone Full-World InternationalTrading Co., Ltd.
Shandong Zhentai Tyre Co., Ltd9.48
Qingdao Hengda Tyres Co., Ltd. Qingdao Hengda Tyres Co., Ltd 9.48
Qingdao Milestone Tyre Co., Ltd. Qingdao Shuanghe Tyre Co., Ltd 9.48
Qingdao Milestone Tyre Co., Ltd. Shandong Zhentai Tyre Co., Ltd 9.48
Qingdao Milestone Tyre Co., Ltd. Shifeng Double-Star Tire Co., Ltd 9.48
Qingdao Milestone Tyre Co., Ltd. Weifang Longtai Tyre Co., Ltd 9.48
Qingdao Qinghang Tyre Co., Ltd. Qingdao Qinghang Tyre Co., Ltd 9.48
Qingdao Qizhou Rubber Co., Ltd. Qingdao Qizhou Rubber Co., Ltd 9.48
Qingdao Sinorient International Ltd. Qingdao Hengda Tyres Co., Ltd 9.48
Qingdao Sinorient International, Ltd. Shifeng Double-Star Tire Co., Ltd 9.48
Qingdao Sinorient International, Ltd. Tengzhou Broncho Tyre Co., Ltd 9.48
Shandong Huitong Tyre Co., Ltd. Shandong Huitong Tyre Co., Ltd 9.48
Shandong Jinyu Tyre Co., Ltd. Shandong Jinyu Tyre Co., Ltd 9.48
Shandong Taishan Tyre Co., Ltd. Shandong Taishan Tyre Co., Ltd 9.48
Shandong Wanda Boto Tyre Co., Ltd. Shandong Wanda Boto Tyre Co., Ltd 9.48
Shandong Xingyuan International Trading Co., Ltd. Shangdong Xingda Tyre Co., Ltd 9.48
Shandong Xingyuan International Trading Co., Ltd. Xingyuan Tyre Group Co., Ltd 9.48
Techking Tires Limited Shandong Xingda Tyre Co. Ltd 9.48
Table continued on next page.
11 Certain New Pneumatic Off-The-Road Tires From the People’s Republic of China: Final Determination ofSales at Less Than Fair Value and Partial Affirmative Determination of Critical Circumstances, 73 FR 40485, July15, 2008. See Commerce’s notice for footnotes describing the machinery and equipment cited in the scope language.
I-7
Table I-2--ContinuedCertain OTR tires: Commerce’s final weighted-average LTFV margins with respect to importsfrom China
Techking Tires Limited Shandong Xingyuan International Trade Co. Ltd 9.48
Techking Tires Limited Shandong Xingyuan Rubber Co. Ltd 9.48
Triangle Tyre Co., Ltd. Triangle Tyre Co., Ltd 9.48
Wendeng Sanfeng Tyre Co., Ltd. Wendeng Sanfeng Tyre Co., Ltd 9.48
Zhaoyuan Leo Rubber Co., Ltd. Zhaoyuan Leo Rubber Co., Ltd 9.48
All others 210.48
Source: 73 FR 40489, July 15, 2008.
THE SUBJECT PRODUCT
Scope
The imported products subject to these investigations include:11
...new pneumatic tires designed for off-the-road and off-highway use, subject toexceptions identified below. Certain OTR tires are generally designed, manufacturedand offered for sale for use on off-road or off-highway surfaces, including but not limitedto, agricultural fields, forests, construction sites, factory and warehouse interiors, airporttarmacs, ports and harbors, mines, quarries, gravel yards, and steel mills. The vehiclesand equipment for which certain OTR tires are designed for use include, but are notlimited to: (1) Agricultural and forestry vehicles and equipment, including agriculturaltractors, combine harvesters, agricultural high clearance sprayers, industrial tractors,log-skidders, agricultural implements, highway-towed implements, agricultural logging,and agricultural, industrial, skid-steers/ mini-loaders; (2) construction vehicles andequipment, including earthmover articulated dump products, rigid frame haul trucks,front end loaders, dozers, lift trucks, straddle carriers, graders, mobile cranes,compactors; and (3) industrial vehicles and equipment, including smooth floor,industrial, mining, counterbalanced lift trucks, industrial and mining vehicles other thansmooth floor, skid-steers/ mini-loaders, and smooth floor off-the-road counterbalancedlift trucks. The foregoing list of vehicles and equipment generally have in common thatthey are used for hauling, towing, lifting, and/or loading a wide variety of equipment andmaterials in agricultural, construction and industrial settings. The foregoingdescriptions are illustrative of the types of vehicles and equipment that use certain OTRtires, but are not necessarily all-inclusive. While the physical characteristics of certainOTR tires will vary depending on the specific applications and conditions for which thetires are designed (e.g., tread pattern and depth), all of the tires within the scope have incommon that they are designed for off-road and off-highway use. Except as discussedbelow, OTR tires included in the scope of the petitions range in size (rim diameter)generally but not exclusively from 8 inches to

I-8
54 inches. The tires may be either tube-type or tubeless, radial or non-radial, andintended for sale either to original equipment manufacturers or the replacement market. Specifically excluded from the scope are new pneumatic tires designed, manufacturedand offered for sale primarily for on-highway or on-road use, including passenger cars,race cars, station wagons, sport utility vehicles, minivans, mobile homes, motorcycles,bicycles, on-road or on-highway trailers, light trucks, and trucks and buses. Such tiresgenerally have in common that the symbol ‘‘DOT’’ must appear on the sidewall,certifying that the tire conforms to applicable motor vehicle safety standards. Suchexcluded tires may also have the following designations that are used by the Tire andRim Association:
Prefix letter designations:
• P—Identifies a tire intended primarily for service on passenger cars;• LT—Identifies a tire intended primarily for service on light trucks; and,• ST—Identifies a special tire for trailers in highway service.
Suffix letter designations:
• TR—Identifies a tire for service on trucks, buses, and other vehicles with rims havingspecified rim diameter of nominal plus 0.156¢ or plus 0.250¢;• MH—Identifies a tire for Mobile Homes;• HC—Identifies a heavy duty tire designated for use on ‘‘HC’’ 15 ° tapered rims used on trucks, buses, and other vehicles. This suffix is intended to differentiate among tiresfor light trucks, and other vehicles or other services, which use a similar designation.• Example: 8R17.5 LT, 8R17.5 HC;• LT—Identifies light truck tires for service on trucks, buses, trailers, and multipurposepassenger vehicles used in nominal highway service; and• M/C—Identifies tires and rims for motorcycles.
The following types of tires are also excluded from the scope: pneumatic tires that arenot new, including recycled or retreaded tires and used tires; non-pneumatic tires,including solid rubber tires; tires of a kind used on aircraft, all-terrain vehicles, andvehicles for turf, lawn and garden, golf and trailer applications; and tires of a kind usedfor mining and construction vehicles and equipment that have a rim diameter equal to orexceeding 39 inches. Such tires may be distinguished from other tires of similar size bythe number of plies that the construction and mining tires contain (minimum of 16) andthe weight of such tires (minimum 1500 pounds).

I-9
Tariff Treatment
Imports of certain OTR tires are entered under statistical reporting numbers or subheadings 4011.20.1025, 4011.20.1035, 4011.20.5030, 4011.20.5050, 4011.61.0000, 4011.62.0000, 4011.63.0000,4011.69.0000, 4011.92.0000, 4011.93.4000, 4011.93.8000, 4011.94.4000, and 4011.94.8000 of theHarmonized Tariff Schedule of the United States (“HTS”). During the course of these investigations, itwas found that certain U.S. imports entering under HTS subheadings 4011.61, 4011.62, 4011.69, and4011.92 were consumer tires that are outside the scope of these investigations. Import data used in thisreport have been adjusted to account for these out-of-scope products.
Table I-3 presents data on the current tariff rates of the subheadings identified above.
Table I-3Certain OTR tires: Tariff treatment, 2008
HTS provision Article descriptionGeneral1 Special2
Column23
Rates (percent ad valorem)4011 4011.20 4011.20.10
4011.20.1025 4011.20.1035 4011.20.50
4011.20.5030 4011.20.5050
4011.61.0000 4011.62.0000
4011.63.0000
4011.69.0000
4011.92.0000 4011.93
4011.93.4000 4011.93.80004011.94
4011.94.8000
New pneumatic tires, of rubber: Of a kind used on buses or trucks:
Radial . . . . . . . . . . . . . . . . . . . . . . . . . . . . . . . . . . . . . . . . . . . . . . Off-the-highway: For use on a rim measuring 40.6 cm or more in diameter . .
Other . . . . . . . . . . . . . . . . . . . . . . . . . . . . . . . . . . . . . . . . . . Other . . . . . . . . . . . . . . . . . . . . . . . . . . . . . . . . . . . . . . . . . . . . . . . Off-the-highway: For use on a rim measuring 40.6 cm or more in diameter . .
Other . . . . . . . . . . . . . . . . . . . . . . . . . . . . . . . . . . . . . . . . . . Other, having a “herring-bone” or similar tread:
Of a kind used on agricultural or forestry vehicles and machines . . Of a kind used on construction or industrial handling vehicles and
machines and having a rim size exceeding 6 cm . . . . . . . . . . . . . . Of a kind used on construction or industrial handling vehicles and
machines and having a rim size exceeding 61 cm . . . . . . . . . . . . .Other . . . . . . . . . . . . . . . . . . . . . . . . . . . . . . . . . . . . . . . . . . . . . . .
Other:Of a kind used on agricultural or forestry vehicles and machines . . Of a kind used on construction or industrial handling vehicles and
machines and having a rim size not exceeding 61 cm:Radial . . . . . . . . . . . . . . . . . . . . . . . . . . . . . . . . . . . . . . . . . . . Other . . . . . . . . . . . . . . . . . . . . . . . . . . . . . . . . . . . . . . . . . . . .
Of a kind used on construction or industrial handling vehicles and machines and having a rim size exceeding 61 cm:
Other . . . . . . . . . . . . . . . . . . . . . . . . . . . . . . . . . . . . . . . . . . . .
4
3.4
Free
Free
FreeFree
Free
43.4
3.4
10
10
Free
10
1010
Free
1010
10 1 Normal trade relations, formerly known as the most-favored-nation duty rate. 2 Special rates not applicable when General rate is free. China is ineligible for special duty rate treatment. 3 Applies to imports from a small number of countries that do not enjoy normal trade relations duty status.
Source: Harmonized Tariff Schedule of the United States (2008).

12 Questionnaire responses regarding certain OTR tires and nonsubject OTR tires with a rim diameter equal to orgreater than 39 inches are presented in app. D. 13 Petitioners’ prehearing brief, p. 7. 14 BFNA, prehearing brief, p. 4. 15 73 FR 40490, July 15, 2008. 16 Hearing transcript, p. 41 (Durling). 17 73 FR 40490- 40491, July 15, 2008. 18 Staff field trip report, BFNA, July 19, 2007. 19 Producer costs for raw materials like natural rubber and for energy are now at all-time record levels. Hearingtranscript, p. 68 (Allen). 20 Titan prehearing brief, p. 4.
I-10
THE DOMESTIC LIKE PRODUCT
The Commission’s determination regarding the appropriate domestic product that is “like” thesubject imported product is based on a number of factors, including (1) physical characteristics and uses;(2) common manufacturing facilities and production employees; (3) interchangeability; (4) customer andproducer perceptions; (5) channels of distribution; and, where appropriate, (6) price.12
Petitioners13 and other supporting parties, including BFNA,14 contend that the Commissionshould find one domestic like product that is co-extensive with the scope of merchandise subject to thefinal phase of the investigations as defined by Commerce.15 Respondents have challenged the petitioners’view that radial and bias OTR tires designed for use in mining and construction applications with a rimdiameter of 39 inches or greater should be excluded from the scope of the final phase of theinvestigations.16 Commerce excludes from its scope definition radial and bias OTR mining andconstruction tires equal to or above 39 inches in rim diameter, stated to be physically distinguishable fromsubject OTR tires by the more extensive use of internal reinforcing materials, and the heavier weight ofsuch tires.17 Additional information is presented in appendix D and in Part I, “Domestic Like ProductIssues.”
Physical Characteristics and Uses
All pneumatic (air pressurized) rubber tires, whether passenger car, truck, or OTR, have the samebasic generic components, but structurally, are markedly different. The basic components of a tire consistinternally of a base rubber inner liner or a rubber inner tube, each impervious to air migration from thetire; rubberized reinforcing tire cord plies and belts that give the tire strength and stability; and arubberized steel bead that provides an airtight seal of the tire with a given metal wheel. The outercomponents of a tire that can be seen on an assembled tire are the tread that runs around the outside of thetire, the sidewall, and the rubber rim. All tires contain varying amounts of natural and synthetic rubber inaddition to several other components such as carbon black reinforcement, sulfur curing agents, nylon andsteel tire cords and belts, and steel bead wire.18
Compared to the more familiar on-the-road passenger and truck tires, most certain OTR tires aredesigned for more rugged use where physical strength is imperative to absorb the abuses experienced inoff-the-road applications, and where heavier load bearing characteristics are required. For this reason, agenerally higher content and ratio of stronger, expensive, and more durable natural rubber19 is used incertain OTR tires relative to the more supple, but lower strength synthetic rubbers which are used inhigher proportions in on-the-road tires. Also, more substantial internal reinforcement is required,including textile and steel tire cords and belts, steel bead, and carbon black pigment reinforcement.20

21 GPX posthearing brief, p. 48 (Ganz). 22 Titan prehearing brief, p. 4. 23 Ibid, p. 3. 24 The scope rim diameter range is generally, but not exclusively, 8 to 54 inches. 73 FR, 40490, July 15, 2008. 25 Titan prehearing brief, p. 3. 26 BFNT revised public posthearing brief, exh. 3. 27 Titan prehearing brief, p.4. 28 Ibid, p. 3. 29 Staff field trip report, BFNA, July 19, 2007. 30 2007 Yearbook, The Tire and Rim Association, Inc. 31 Certain Chinese tire producers are affiliate members of the TRA; 2007 Yearbook, The Tire and RimAssociation, Inc., p. V.
I-11
Certain OTR tire series for a given application having the same rim diameter size and section width canhave very different price points.21
Certain OTR tires are produced in a wide variety of types and sizes, ranging from relatively smallagricultural implement tires, to larger agricultural, construction, and industrial tires found on the morefamiliar farm tractors, earth movers, back hoe loaders, and fork lift trucks, for example.22 The rimdiameter (inside diameter) of certain OTR tires may range from eight to 72 inches,23 24 and the weight of alarge agricultural tire, up to 1,200 pounds.25 Subject OTR mining and construction tires less than 39inches in rim diameter are typically much higher in weight, some more than 3,000 pounds.26 Unlike on-the-road tires, certain OTR tires are typically designed for speeds no higher than 25-30 miles per hour.27 These tires may be of bias ply or radial construction depending upon the end use, and consist of multipletread types depending on the types of equipment and end-use requirements.28 Certain OTR tires may beof the tubeless or tube variety, but are predominately tubeless, while all are pneumatic (air pressurized) innature, as defined in the scope.29
In the United States, OTR producers have generally adopted The Tire and Rim Association(“TRA”), Inc. standards. TRA standards for the subject tires are broken out into three categories: Off-the-Road, Agricultural, and Industrial. TRA standards identify items such as the type of equipment onwhich the tire is used, the tire type and tire-type designation to be molded into the sidewall, the speed andload carrying ply ratings, and several other physical and quantitative descriptions.30 Designations used onforeign tires may or may not conform to TRA standards, but they usually carry a tire size and country- of-origin marking.31 TRA tire standards are described in the following tabulation:
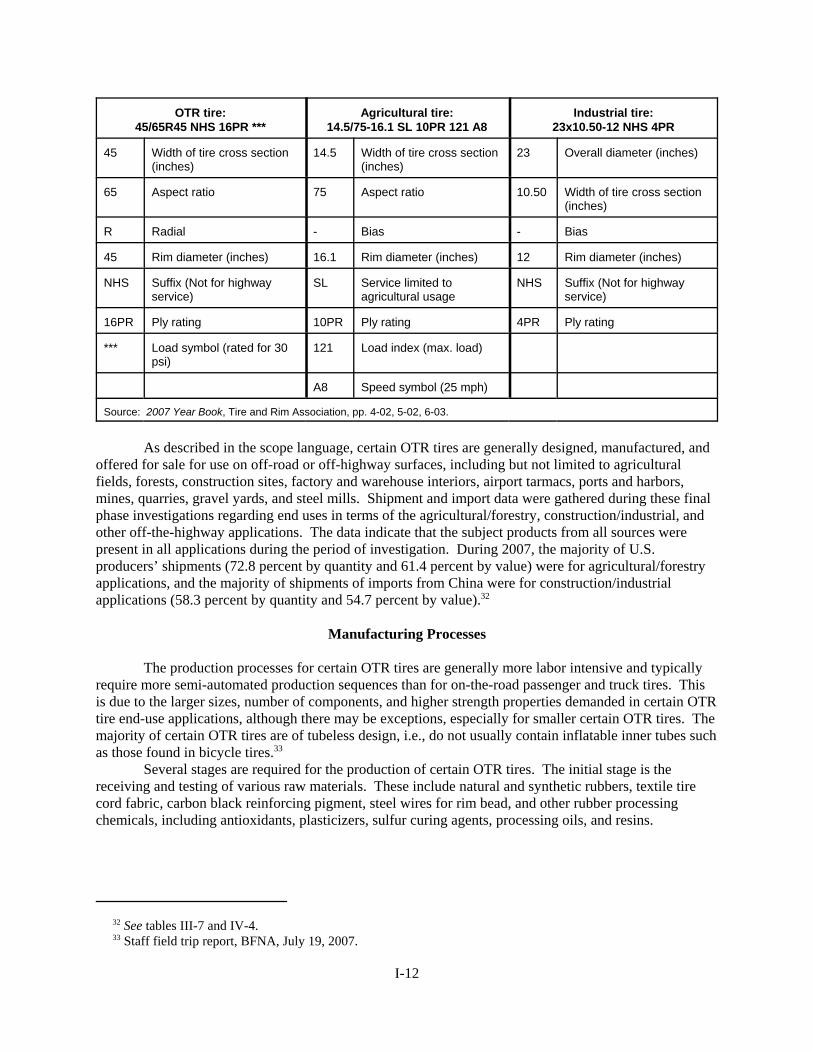
32 See tables III-7 and IV-4. 33 Staff field trip report, BFNA, July 19, 2007.
I-12
OTR tire:45/65R45 NHS 16PR ***
Agricultural tire:14.5/75-16.1 SL 10PR 121 A8
Industrial tire:23x10.50-12 NHS 4PR
45 Width of tire cross section(inches)
14.5 Width of tire cross section(inches)
23 Overall diameter (inches)
65 Aspect ratio 75 Aspect ratio 10.50 Width of tire cross section(inches)
R Radial - Bias - Bias
45 Rim diameter (inches) 16.1 Rim diameter (inches) 12 Rim diameter (inches)
NHS Suffix (Not for highwayservice)
SL Service limited toagricultural usage
NHS Suffix (Not for highwayservice)
16PR Ply rating 10PR Ply rating 4PR Ply rating
*** Load symbol (rated for 30psi)
121 Load index (max. load)
A8 Speed symbol (25 mph)
Source: 2007 Year Book, Tire and Rim Association, pp. 4-02, 5-02, 6-03.
As described in the scope language, certain OTR tires are generally designed, manufactured, andoffered for sale for use on off-road or off-highway surfaces, including but not limited to agriculturalfields, forests, construction sites, factory and warehouse interiors, airport tarmacs, ports and harbors,mines, quarries, gravel yards, and steel mills. Shipment and import data were gathered during these finalphase investigations regarding end uses in terms of the agricultural/forestry, construction/industrial, andother off-the-highway applications. The data indicate that the subject products from all sources werepresent in all applications during the period of investigation. During 2007, the majority of U.S.producers’ shipments (72.8 percent by quantity and 61.4 percent by value) were for agricultural/forestryapplications, and the majority of shipments of imports from China were for construction/industrialapplications (58.3 percent by quantity and 54.7 percent by value).32
Manufacturing Processes
The production processes for certain OTR tires are generally more labor intensive and typically require more semi-automated production sequences than for on-the-road passenger and truck tires. Thisis due to the larger sizes, number of components, and higher strength properties demanded in certain OTRtire end-use applications, although there may be exceptions, especially for smaller certain OTR tires. Themajority of certain OTR tires are of tubeless design, i.e., do not usually contain inflatable inner tubes suchas those found in bicycle tires.33
Several stages are required for the production of certain OTR tires. The initial stage is thereceiving and testing of various raw materials. These include natural and synthetic rubbers, textile tirecord fabric, carbon black reinforcing pigment, steel wires for rim bead, and other rubber processingchemicals, including antioxidants, plasticizers, sulfur curing agents, processing oils, and resins.

I-13
The rubber preparation stage involves the mixing of the various rubbers and selected rawmaterials into several different types of compounds or recipes designed for specific downstream processend uses, as shown in figure I-1. Each batch is placed into a Banbury mixer where the rubber is heated,softened, and thoroughly mixed with the other ingredients under conditions of mixer blade shear and rampressure. Following the discharge of a given rubber compound batch from the mixer, the mass is cooled,and sulfur curing agents are added. Subsequent Banbury mixing is usually required to complete this step.
During the mixing process, heat and friction soften the rubber for several applications, includinga type of rubber compound designed to hold air on the inside of the tubeless tire; various types of rubbercompounds designed to adhere to wire and fabric used to make the casing; and other types of rubbercompounds designed for the outside of the tire; e.g., the steel bead, sidewalls, and tread. Following themixing process, the various rubber compounds or batches are milled into slab form for use in the factory.
Several different types of equipment are used to process the rubber formulations into multiplecertain OTR tire components. Large machines equipped with rollers known as calendars are used toproduce sheets of butyl rubber interlining which prevent the migration of pressurized air through atubeless tire casing. Calendars are also used to coat tire cord fabric or wire with selected rubberformulations for reinforcement of the tire casing which supports the weight of the vehicle.
Machines called wire winders are used to apply a given rubber batch coating to the bead wire andwrap it into an exact circular dimension needed to hold the tubeless tire securely to the steel wheel. Thesmooth rubber pieces that will eventually become treads and sidewalls are produced with machines calledextruders which force various softened rubber compounds through a die to produce the desiredconfigurations.
Figure I-1Rubber mixing process
Source: Staff field trip report, BFNA, July 19, 2007, attachment.
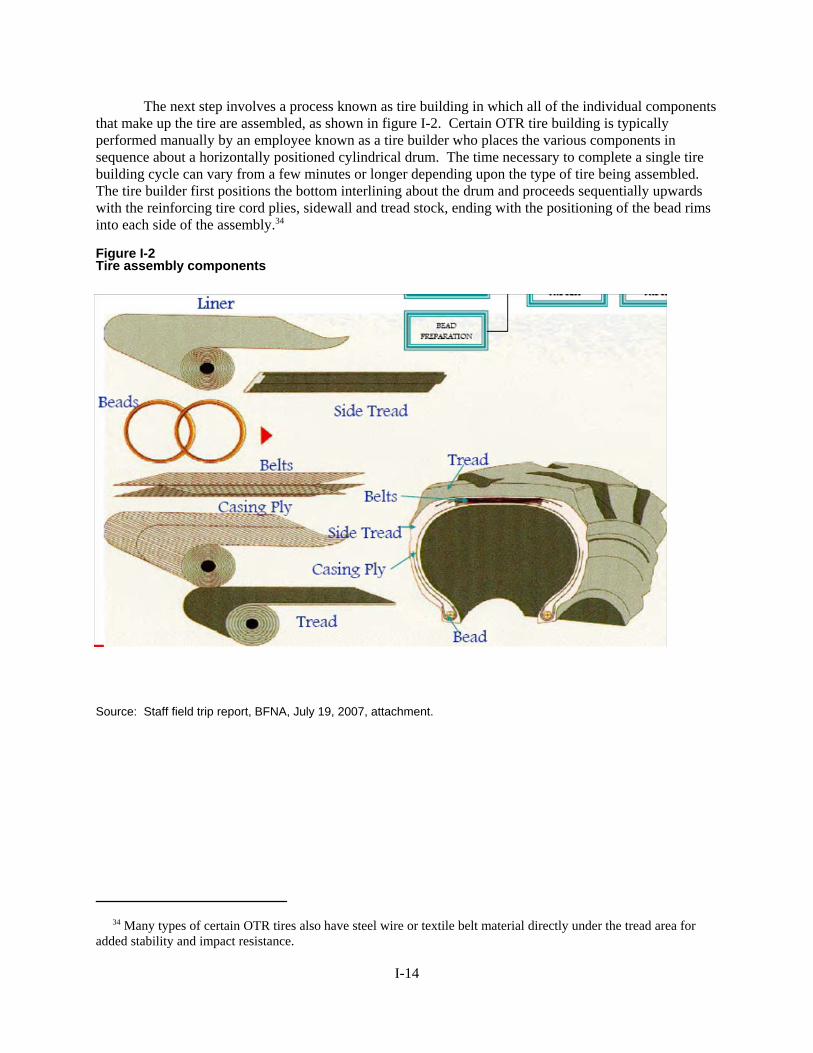
34 Many types of certain OTR tires also have steel wire or textile belt material directly under the tread area foradded stability and impact resistance.
I-14
The next step involves a process known as tire building in which all of the individual componentsthat make up the tire are assembled, as shown in figure I-2. Certain OTR tire building is typicallyperformed manually by an employee known as a tire builder who places the various components insequence about a horizontally positioned cylindrical drum. The time necessary to complete a single tirebuilding cycle can vary from a few minutes or longer depending upon the type of tire being assembled. The tire builder first positions the bottom interlining about the drum and proceeds sequentially upwardswith the reinforcing tire cord plies, sidewall and tread stock, ending with the positioning of the bead rimsinto each side of the assembly.34
Figure I-2Tire assembly components
Source: Staff field trip report, BFNA, July 19, 2007, attachment.
35 Bias ply construction is one in which the reinforcing tire cords run diagonally from rim bead to rim bead, witheach successive ply running at equal, but opposite angles. In radial construction, the reinforcing tire cords runparallel from bead to bead, or perpendicular to the direction of travel and have reinforcing belts directly underneaththe tread. Bias ply tires are popularly used in many OTR applications because of their sidewall strength, stiffness, and toughness, and the ability to carry the heavy loads demanded in the OTR industry. A radial tire will have bettertraction and fuel because of less slippage. Radial tires reportedly have a longer tire life than bias ply tires; higherresistance to cuts, punctures, and tears; excellent traction; improved handling and fuel economy; and a smoother rideand operator comfort.
Bias-type tires are estimated to account for 65 to 70 percent of the U.S. market for certain OTR tires. Hearing transcript, p. 62 (Vasichek). Bias tires, both large and small, are made from the same types of materials andhave the same basic components. The same is true for radial tires, however, the materials may be distinctlydifferent, e.g,. steel ply (GPX posthearing brief p. 43). Both types are used on agricultural, mining and constructionequipment. 36 ***. Staff field trip report, BFNA, July 19, 2007. 37 Both presses and pot heaters can be used to cure subject OTR and out-of-scope OTR tires. GPX posthearingbrief, p. 3; exh. 5 & 13. 38 Pot heaters are multi-functional and can be used to cure both subject OTR and out-of-scope OTR tires at thesame time. Hearing transcript, p. 109 (Taylor).
I-15
In bias ply tire building, the tire cord plies are cut at alternating angles around the drumcircumference as the assembly proceeds; otherwise, radial construction involves placing parallel steel orfabric piles that run “radially” from bead to bead at right angles to the direction of tire travel.35 The green(uncured) tire assembly is removed from the drum in the form of an ***, and positioned with severalothers for transfer to the final molding and curing process.36
The final molding and curing process involves the placement of the green tire assembly about abladder sleeve in a circular curing press tire mold of the appropriate configuration as shown in figure I-3. After the curing press is closed, the bladder is injected with steam and expanded to force the green tireassembly out against the mold walls. The green tire thus takes on the configuration of the tire mold,including that of the sidewall, sidewall size designations, and tread type. Vulcanization or curing of thegreen tire takes place in the mold at elevated temperature and pressure. Curing times vary widelydepending upon the size of the tire, and may vary nominally from a few minutes to several hours; eachtire model requires its own mold. During vulcanization, the original weak green tire rubber becomesstrong and rigid (thermoset), and will not again soften with heat due to molecular cross-linking orbonding of the rubber with the sulfur chemical additives.37 38
Following the molding and curing process, the finished tire is moved to the quality control areafor a final visual and x-ray inspection. The tires that pass inspection are then moved to a warehouse forstorage and shipping. Finished tires are coded to track their whereabouts, and to identify the plant ofmanufacture and that of the individual tire builders.
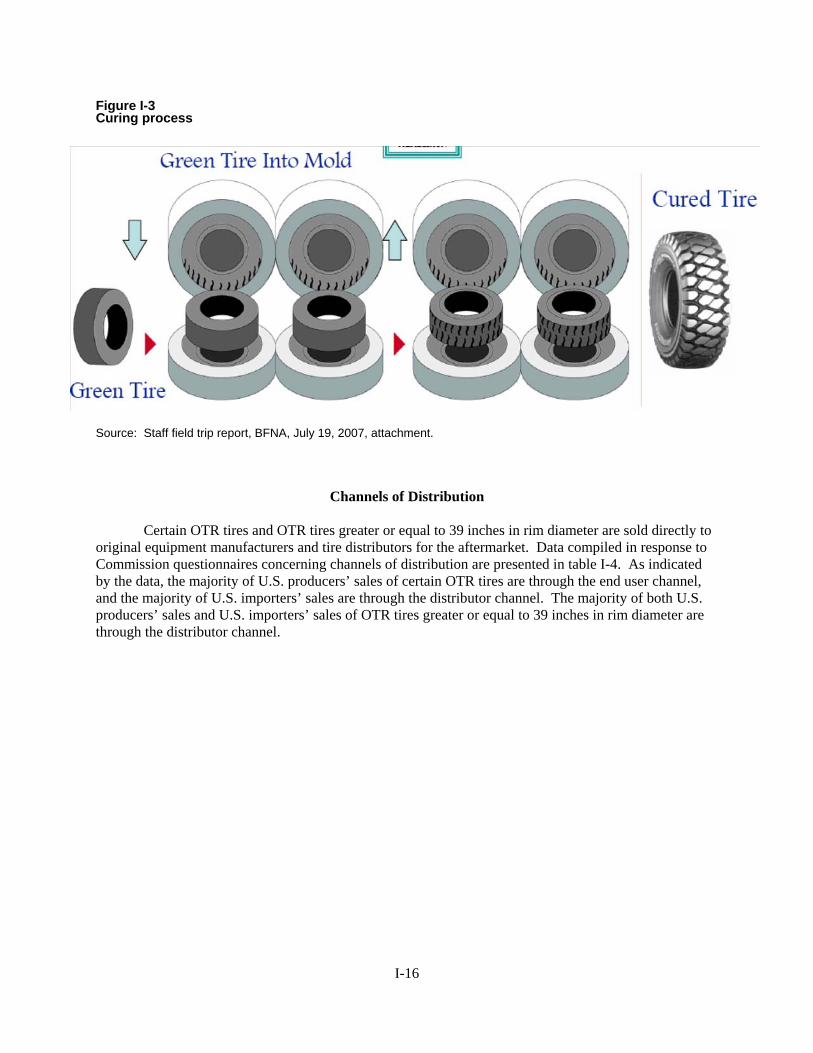
I-16
Figure I-3Curing process
Source: Staff field trip report, BFNA, July 19, 2007, attachment.
Channels of Distribution
Certain OTR tires and OTR tires greater or equal to 39 inches in rim diameter are sold directly tooriginal equipment manufacturers and tire distributors for the aftermarket. Data compiled in response toCommission questionnaires concerning channels of distribution are presented in table I-4. As indicatedby the data, the majority of U.S. producers’ sales of certain OTR tires are through the end user channel,and the majority of U.S. importers’ sales are through the distributor channel. The majority of both U.S.producers’ sales and U.S. importers’ sales of OTR tires greater or equal to 39 inches in rim diameter arethrough the distributor channel.

I-17
Table I-4OTR tires: U.S. producers’ and importers’ shares of reported U.S. shipments, by sources andchannels of distribution, 2005-07, January-March 2007, and January-March 2008
Item
Calendar year January-March
2005 2006 2007 2007 2008
Share of reported shipments, units (percent)
Certain OTR tires
U.S. producers’ U.S. shipments to:
Distributors 47.6 48.4 48.6 50.1 44.6
End users 52.4 51.6 51.4 49.9 55.4
U.S. importers’ U.S. shipments from China to:
Distributors 80.8 79.0 79.4 77.0 70.9
End users 19.2 21.0 20.6 23.0 29.1
U.S. importers’ U.S. shipments from all othercountries to:
Distributors 60.8 63.6 61.4 63.4 70.7
End users 39.2 36.4 38.6 36.6 29.3
Nonsubject OTR tires >= 39 inches in rim diameter
U.S. producers’ U.S. shipments to:
Distributors 69.6 66.0 62.0 74.7 75.5
End users 30.4 34.0 38.0 25.3 24.5
U.S. importers’ U.S. shipments from China to:
Distributors 100.0 86.4 92.4 100.0 73.7
End users 0.0 13.6 7.6 0.0 26.3
U.S. importers’ U.S. shipments from all othercountries to:
Distributors 93.1 86.8 83.8 83.3 79.8
End users 6.9 13.2 16.2 16.7 20.2
Source: Compiled from data submitted in response to Commission questionnaires.
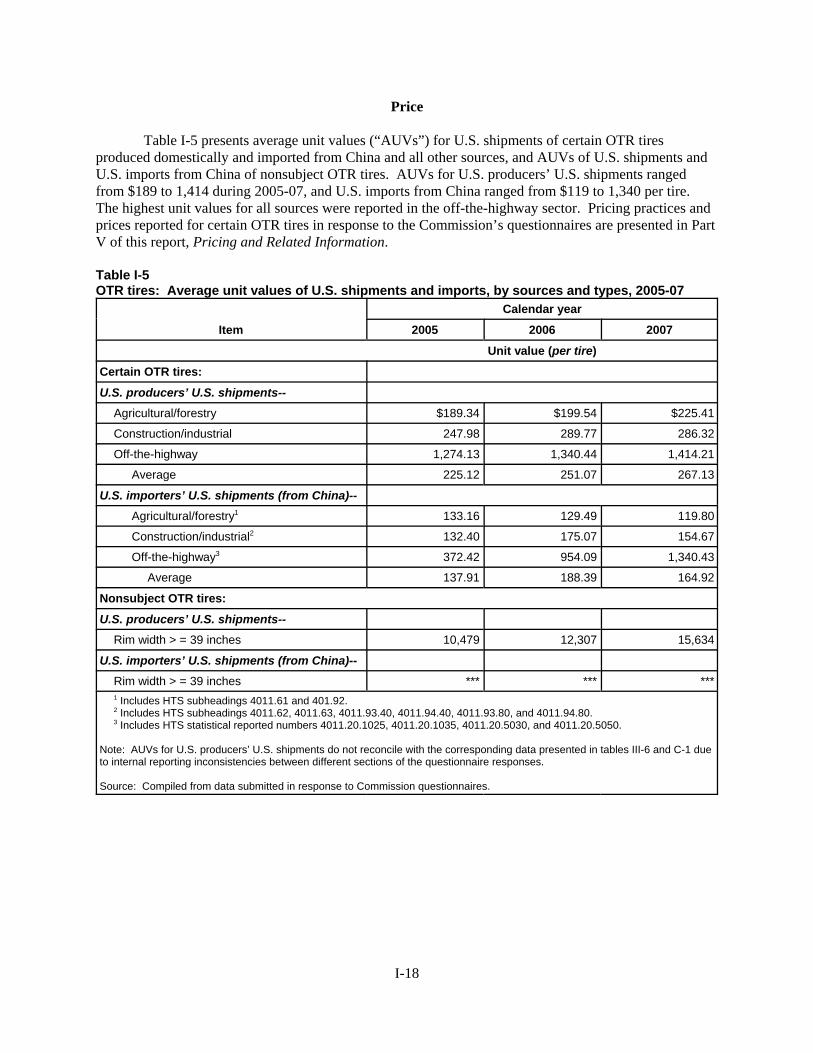
I-18
Price
Table I-5 presents average unit values (“AUVs”) for U.S. shipments of certain OTR tiresproduced domestically and imported from China and all other sources, and AUVs of U.S. shipments andU.S. imports from China of nonsubject OTR tires. AUVs for U.S. producers’ U.S. shipments rangedfrom $189 to 1,414 during 2005-07, and U.S. imports from China ranged from $119 to 1,340 per tire. The highest unit values for all sources were reported in the off-the-highway sector. Pricing practices andprices reported for certain OTR tires in response to the Commission’s questionnaires are presented in PartV of this report, Pricing and Related Information.
Table I-5OTR tires: Average unit values of U.S. shipments and imports, by sources and types, 2005-07
Item
Calendar year
2005 2006 2007
Unit value (per tire)
Certain OTR tires:
U.S. producers’ U.S. shipments--Agricultural/forestry $189.34 $199.54 $225.41
Construction/industrial 247.98 289.77 286.32
Off-the-highway 1,274.13 1,340.44 1,414.21
Average 225.12 251.07 267.13
U.S. importers’ U.S. shipments (from China)--Agricultural/forestry1 133.16 129.49 119.80
Construction/industrial2 132.40 175.07 154.67
Off-the-highway3 372.42 954.09 1,340.43
Average 137.91 188.39 164.92
Nonsubject OTR tires:
U.S. producers’ U.S. shipments-- Rim width > = 39 inches 10,479 12,307 15,634
U.S. importers’ U.S. shipments (from China)--Rim width > = 39 inches *** *** ***1 Includes HTS subheadings 4011.61 and 401.92.2 Includes HTS subheadings 4011.62, 4011.63, 4011.93.40, 4011.94.40, 4011.93.80, and 4011.94.80.3 Includes HTS statistical reported numbers 4011.20.1025, 4011.20.1035, 4011.20.5030, and 4011.20.5050.
Note: AUVs for U.S. producers’ U.S. shipments do not reconcile with the corresponding data presented in tables III-6 and C-1 dueto internal reporting inconsistencies between different sections of the questionnaire responses.
Source: Compiled from data submitted in response to Commission questionnaires.

39 Hearing transcript, p. 41 (Durling). 40 Party views were sourced from prehearing and posthearing briefs, together with the transcript of the Commission hearing held on July 8-9, 2008. Additional information is presented in app. D. 41 BFNA describes nonsubject OTR construction and mining tires as “Giant Earthmoving Tires,” and subjectOTR non-agricultural tires as “Large” tires. BFNA posthearing brief, pp. 1-4. 42 Titan posthearing brief, PEARSON 9-11. 43 Hearing transcript, pp. 220-221 (Taylor). 44 Unless otherwise noted, information under this heading was obtained from Titan’s posthearing brief, pp.PEARSON 11-14.
I-19
DOMESTIC LIKE PRODUCT ISSUES
Petitioner and supporting parties contend that the Commission should define a single domesticlike product of all domestically produced certain OTR tires as coextensive with Commerce’s scope andthat the domestic industry consists of the domestic producers of certain OTR tires. On the other hand,respondents view the like product scope differently, as a continuum of nonagricultural OTR tires with rimsizes both above and below petitioner’s “bright line” of 39 inches (e.g., 33, 39, and 49 inches).39 The parties argued the merits of the various like product issues in accordance with the Commission’straditional six-factor like product analysis, as follows.40
Physical Characteristics and Uses
Petitioner Titan generally describes nonsubject OTR construction and mining tires 39 inches inrim diameter and above as jumbo earthmoving, construction, and mining tires.41 It states that nonsubjectOTR tires are significantly different from subject certain OTR tires in their physical composition, size,weight, and load bearing characteristics. According to Titan, the massive size and weight of these tires isnecessary for them to serve their specific end-use of moving enormous loads for the mining andconstruction industry. A subject certain OTR mining tire with a 35-inch rim is typically 83 inches tall(6.9 feet), 21 inches wide, and weighs about 1,200 pounds, while a nonsubject OTR mining tire with a39-inch rim is eight feet tall, 40 inches wide, and weighs about 5,000 pounds. Thus, the smallestnonsubject OTR construction and mining tire with a 39-inch tire rim diameter would be only 4 inchesabove the largest 35-inch subject certain OTR mining and construction tire, but 13 inches taller, almosttwice as wide, and more than four times heavier. Titan argues that because these significant physicaldifferences arise among mining and construction tires once the rim diameter reaches 39 inches or greater,rim diameter provides a meaningful basis for distinguishing like product.42 The 57 and 63-inch rimdiameter radial mining tires currently in short supply are now produced by Titan, and are 13 to 13.5 feettall, weigh 8,000 to 13,000 pounds, and cost $35,000 to $50,000 each. The only other known producersof the 63-inch radial tire are BFNA and Michelin.43
Common Manufacturing Facilities and Production Employees44
Petitioners contend that due to the significant physical differences, there is little overlap indomestic production facilities for subject certain OTR and nonsubject OTR construction and mining tires. BFNA only has the capability to manufacture nonsubject OTR construction and mining jumboearthmoving tires at its Bloomington, IL, facility; no such nonsubject OTR construction and mining tiresare produced at its other OTR tire facility in Des Moines, IA. Likewise, Titan’s Des Moines, IA, andFreeport, IL, plants are not capable of producing the nonsubject OTR tires because the final product is toolarge to be handled in the physical facilities themselves; nor do these facilities have the necessaryequipment or the employees with the proper training to handle production of jumbo tires. Thus, Titan can
45 In pot molding, two or three individual tire molds can be stacked into the chamber unlike a conventional singleclamshell mold press, so it’s a much different process and investment, as well. Hearing transcript, p. 108 (Rasey). 46 In pot molding, the top is locked, and whether you have a 33 inch tire in there or a 45 inch tire, the one thattakes the longest to cure, that’s how long you have to leave them in there, because you can’t take one out; it’s formulti-use. Hearing transcript, p. 109 (Taylor). 47 Only two steps are size dependent, tire building and curing, which represent only about 20 percent of totalassets value of the plant. The only difference in the tire building process is the size of the equipment. There is aprogression in the size of the building equipment that follows the tire size. Hearing transcript, pp. 245-246(Mazzola). 48 Joel De Glopper is Vice President of Radial Tires for GPX. 49 GPX posthearing brief, pp. 2-4; exh. 5&13. 50 Hearing transcript, p. 246 (Mazzola). 51 The curing process for nonsubject OTR tires is not pot heater dependent; both curing presses and pot heaterscan be used to cure subject certain and nonsubject OTR tires. Pot heaters are a multi-use curing device. Subjectcertain tires and nonsubject OTR tires up to 51 inches can be cured in pot heaters at our {GPX} Starbright factory. Ibid.
I-20
only produce nonsubject OTR tires at its Bryan, OH, facility. Of the remaining U.S. producers ofnonsubject OTR tires, ***.
Titan argues that even where nonsubject OTR and subject certain OTR tires are produced at thesame facility, nonsubject OTR tires require separate equipment, production processes, and employeetraining. At BFNA’s Bloomington, IL, facility, only two of the eight types of tire machines can producenonsubject OTR tires, and that production requires specialized technical know-how and investment. ***.
Subject certain OTR tires are typically cured in conventional curing presses, while nonsubjectOTR tires are cured in pot heaters due to their significantly larger size. Titan’s Chairman stated that thecost of pot heaters required to produce nonsubject OTR construction and mining tires is substantial anddwarfs the costs for most curing equipment used for subject certain OTR tires. According to Titan,nonsubject OTR tires must be placed into the pot heaters using heavy-duty cranes that are not required forcuring subject certain OTR tires.45 46
Respondent GPX argues that contrary to petitioner’s arguments, eight out of ten manufacturingsteps, the equipment, and processes are identical for all OTR tires.47 The affidavit by Joel De Glopper,48 provided at exhibit 5 of GPX’s posthearing brief, explains that both presses and pot heaters can be used tocure OTR tires that straddle both sides of petitioners’ alleged 39 inch bright line. Exhibit 13 of the samebrief provides a BFNA submission to the Illinois EPA that states that pot heaters can cure the full range oftire sizes from less than three feet to greater than 12 feet in diameter. Although there may be specialequipment used for mounting giant OTR tires 57 to 63 inches in rim diameter, much of the manufacturingequipment even for these giant tires is used for all OTR tires. Moreover, GPX argues that specialmounting equipment for giant OTR tires reportedly has nothing to do with whether 39 inches is a clearbright line that justifies carving out an entire segment of the overall industry.49
With regard to the curing process, respondent GPX contends that the petitioners gave theimpression that 39-inch and larger nonsubject OTR tires must be cured in pot heaters. However, GPXstates that there are curing presses that can cure both subject certain OTR and nonsubject OTR tires. Specifically, GPX notes that the GRM Company manufacturers a 122-inch press that is capable of curinga number of 39-inch to 49-inch nonsubject OTR tires, as well as most subject certain OTR tires, 25 to 35inches.50 51

52 Titan posthearing brief, pp. PEARSON 14-15. 53 Hearing transcript, p. 41 (Durling). 54 Caterpillar’s quarry and construction trucks run on tires with diameters that straddle the 39-inch boundary,specifically from 33 to 49 inches. The same is true for the wheel loaders which load the trucks. The medium wheelloaders use 25-inch tires, while its large wheel loaders use tires ranging from 33 inches to 57 inches. Hearingtranscript, pp. 249-250 (Koch). 55 Ibid, p. 138 (Taylor). 56 GPX posthearing brief, pp. 41-42 (Ganz). 57 Titan posthearing brief, PEARSON 16. 58 Ibid. 59 Hearing transcript, pp. 249-251(Koch). 60 Titan posthearing brief, PEARSON 16. 61 Although both petitioners and respondents debated extensively on the merits of product recognition during thehearing, their arguments appeared to be more focused on subject certain OTR product competition and underselling. 62 Goodyear product specification sheets are provided in exh. 6 of the GPX prehearing brief. GPX posthearingbrief, p. 46. 63 Hearing transcript, pp. 322-323 (Ganz).
I-21
Interchangeability
Petitioners contend that there is no interchangeability between nonsubject OTR tires and subjectcertain OTR tires, primarily due to the differences in load-bearing capacity. Nonsubject OTR tires cannotbe installed on the same vehicles and equipment and are not used for the same specific applications. While there is some limited interchangeability among some of the subject certain OTR tires, petitionerargues that the Commission has previously found that “a difference observed between products inside andoutside the scope may provide a sufficient basis not to expand the domestic like product even if the samedifference exists between different products found within the scope.”52
End-users, such as respondent Caterpillar, use OTR tires with rim diameters of 33, 39, and 49inches, all on the same types of equipment.53 54 Respondent GPX argues that the repeated statements fromindustry witnesses and counsel for petitioners at the Commission’s hearing in these investigations weresimply statements of an obvious observation that a mining and construction OTR tire with a rim diameterof 39 inches cannot be used on equipment requiring an OTR tire with a rim diameter of 33 inches.55 GPX contends that such observations are viewed as equally true for all rim diameter sizes within thecontinuum of sizes of the like product definition, and says nothing about why a dividing line at 39 inchesis meaningful.56
Customer and Producer Perceptions
Petitioner states that due to the significantly larger size and weight of nonsubject OTR tires, thereare differences in the production processes, shipping, and handling. Producers reportedly viewnonsubject OTR tires as distinct from subject certain OTR tires. ***.57
Petitioner contends that customers also view nonsubject OTR tires as a distinct product fromsubject OTR tires due to their physical differences, particular end-uses and limited applications, their lackof interchangeability, different channels of distribution, and large price differentials. According topetitioner, *** reports that the high cost of nonsubject OTR tires leads customers to view them differentlyand to track their performance more closely. Similarly, ***.58 ***. ***.59 ***.60 61
Respondent GPX points to the major U.S. OTR tire producers’ product brochures as the bestevidence of producer and customer perceptions of dividing lines among OTR tires.62 63 According toGPX, these brochures demonstrate unequivocally that, in the real-world marketplace, none of the majorU.S. producers consider 39 inches to be a meaningful dividing line. Goodyear is said to use the exact
64 GPX posthearing brief, p. 46 65 Ibid., p. 47. 66 Hearing transcript, p. 251 (Koch). 67 Titan posthearing brief, PEARSON 15. 68 Titan public prehearing brief, pp. 12-13. 69 Hearing transcript, p. 59 (Taylor). 70 Titan public prehearing brief, pp. 13-14. 71 Hearing transcript, pp. 89-90 (Monthei). 72 Certified statement of Mr. Tracy Leslie, Titan posthearing brief, exh. 2. 73 Ibid. 74 Ibid. 75 Hearing transcript, pp. 133-134 (Taylor). 76 GPX posthearing brief, pp. 45-46..
I-22
same language to describe the “features and benefits” of mining and construction tires both above andbelow 39 inches.64
With respect to customer perceptions, in GPX’s view, customers do not perceive that there is abright line distinction between mining, construction, and materials handling tires below 39 inches andmining and construction tires above 39 inches. GPX views the manner in which OEM customers, such asCaterpillar, organize their equipment that use these tires, and the way which distributors purchase thesetires from U.S. producers and offer them for resale, as making the answer to this question self-evident. In GPX’s view, this indicates that customers fully understand and recognize that within a particularproduct series, there is a continuum of sizes.65
Respondent Caterpillar reported that it was incorrect to state that 39-inch tires are not beingshipped together with the equipment on which these tires are installed. In fact, Caterpillar states that machines are sold with OTR tires ranging in rim size from 15 inches to 57 inches. Furthermore, inCaterpillar’s view, there is no significant leap in weight at the 39-inch boundary, and the firm haspurchased some smaller tires that weigh more than the 39-inch tires. Additionally, the firm views the 39-inch boundary as insignificant as reflected in the product materials of the tire manufacturers themselves. According to Caterpillar, at least two tire manufacturers have reportedly organized product groups thatstraddle the 39-inch boundary.66
Channels of Distribution
Petitioner reports that the vast majority of nonsubject OTR tires are shipped direct to the end user,typically an open face mining company, when intended for use on new equipment instead of beingshipped to the OEM for installation at the factory.67 68 69 In addition, the substantially larger size andweight of nonsubject OTR tires requires the use of dedicated equipment for the transport, mounting, andservicing of such tires.70 71 According to petitioners, only a very small number of distributors have theequipment and trained personnel to handle the nonsubject OTR tires versus literally thousands ofdistributors and dealers for subject certain OTR tires.72 Also, the trucks and equipment required to handlenonsubject OTR tires costs significantly more than those used to transport smaller and lighter subjectcertain OTR tires.73 While subject certain OTR tires can be shipped over roads in a haul truck orcontainer, the nonsubject OTR tires may require a flatbed truck for shipping, and must be transportedover particular routes that can handle oversized loads.74 75
Respondent GPX’s view is that petitioner and BFNA made two factual claims to support theirargument that nonsubject OTR tires with rim diameters 39 inches and above are sold through differentchannels of distribution from in-scope OTR tires.76 First, it was claimed that, unlike all subject certainOTR tires, original equipment requiring nonsubject OTR tires is sold and delivered “barefoot,” that is

77 Titan prehearing brief, p. 14. 78 Hearing transcript, p. 251 (Koch). 79 Ibid, p. 53 (Stewart). 80 GPX posthearing brief, p. 46. 81 Titan posthearing brief, PEARSON 17-18. 82 Titan public prehearing brief, p. 16. 83 Staff public prehearing report, I-21. 84 Hearing transcript, p. 247 (Mazzola). 85 BFNA revised public posthearing brief, p.4; exh. 2, 3&4..
I-23
without tires mounted on the equipment prior to delivery.77 GPX argues that this claim was specificallyand pointedly refuted by Caterpillar, the world’s largest manufacturer of mining and constructionequipment that utilizes mining and construction OTR tires.78 Second, petitioners and BFNA claimed thatspecialized equipment is needed to handle and transport nonsubject OTR tires with a rim diameter of 39inches and above. However, GPX argues that industry witnesses and counsel were careful to limit thisfactual claim to only “giant” mining and construction tires. In this regard GPX states that counsel forpetitioners was particularly careful in his argument that “only distributors with special equipment andspecially trained personnel handle sales of giant mining tires in the after-market.”79 GPX claims thatgiven that all industry witnesses fully agreed that “giant” mining tires refer only to those OTR tireshaving rim diameters of 57 inches and above, this particular factual claim provides no support for a cleardividing line at 39 inches.80
Price
Petitioner Titan reports that price is another factor that clearly distinguishes nonsubject OTR tiresfrom subject certain OTR tires.81 For example, the least expensive nonsubject OTR tires are significantlymore expensive than the most costly subject certain OTR tires.82 In 2007, the average unit value for U.S.producers’ U.S. shipments of nonsubject OTR tires was $15,537 per tire, more than 58 times higher thanthe $267.13 average unit value for domestic producers’ shipments of all subject certain OTR tires,including agricultural/forestry tires.83 According to Titan, these large and consistent differences in pricefar outweigh the one isolated example those in opposition to relief have cited where a subject certainOTR tire is listed in a price list at a slightly higher price than one particular model of nonsubject OTRtire.84
BFNA provided a comparison of its largest subject certain OTR and smallest nonsubject OTRtires in the same model series by rim diameter, weight, and price. BFNA designates all of the given tires,whether subject certain OTR or nonsubject OTR tires, as “Mining and Construction” tires, asdistinguished from “agricultural/forestry” tires. Subject certain OTR tires under 39 inches in rimdiameter are designated by BFNA as “Small” or “Large,” and nonsubject OTR tires 39 inches and aboveas “Giant.”
Of the 20 tire models shown by BFNA, all nonsubject OTR tires were larger in both weight andprice, and, of course, rim size. The largest subject certain OTR tire rim sizes varied from 33 to 35 inches,except for one 25-inch tire, while the smallest nonsubject OTR tire rim sizes varied from 39 inches to 57inches. The smallest spread in rim sizes provided was a comparison of four-35 inch subject certain OTRtires with four 39-inch nonsubject OTR tires (4 inch rim size differential). The nonsubject OTR tires inthis category were 31 percent heavier on average, and also 31 percent higher in list price. On a per poundbasis, there was a 2 cents per-pound average price differential between the subject certain OTR 35-inchtires and the nonsubject OTR 39-inch tires of the same model series. For all comparative models shown,BFNA’s nonsubject OTR tires were 83 percent heavier, and 81 percent higher in list price, on average. BFNA argues that these very large differences support separate like products.85

86 GPX posthearing brief, pp. 47-48.
I-24
Respondent GPX’s view on price is that when analyzing the price factor in its like productanalysis, the Commission looks to whether there is a natural or significant price break at the suggesteddividing line, not whether average prices of large categories of products are different. GPX argues thatbased on price data cited at the hearing, the evidence before the Commission is clear that there is nosignificant price break for nonsubject OTR tires 39 inches and above, as indicated by a very similar pricefor two mining and construction OTR tires significantly different in rim size (35 inches vs. 49 inches). GPX further states that the absence of a clear dividing line can also be seen by the fact that mining andconstruction tires having the exact same rim diameter and section width can have very different sellingprices.86

1 Petitioner’s postconference brief, pp. 10-11.
II-1
PART II: CONDITIONS OF COMPETITION IN THE U.S. MARKET
U.S. MARKET SEGMENTS/CHANNELS OF DISTRIBUTION
Certain OTR tires are used on a wide range of vehicles and equipment including those used in agriculture and forestry (e.g. agricultural tractors, combine harvesters, agricultural high clearancesprayers, industrial tractors, log-skidders, agricultural implements, highway-towed implements,agricultural logging, and agricultural, industrial, skid-steer/mini-loaders); construction vehicles andequipment (e.g earthmover articulated dump trucks and rigid frame haul trucks, front end loaders, dozers,lift trucks, straddle carriers, graders, mobile cranes, compactors); and industrial vehicles and equipment(e.g smooth floor industrial, mining, counterbalanced lift trucks, industrial and mining vehicles other thansmooth floor, skid-steers/mini-loaders, and smooth off-the road counterbalanced lift trucks).1
In addition to different categories of end uses, the market is differentiated to some extent bybrand names in which certain companies typically charge a higher price than others. Certain OTR tiresare also divided into other segments including the original equipment market “OEM” and the aftermarketor replacement market. U.S. producers and importers of certain OTR tires from China compete for salesin both market segments. Evidence indicates that there are many tire distributors in the replacementmarket in the United States ranging in size from small local distributors to larger regional distributors andfinally to the largest distributors that have outlets nationwide.
U.S. producer sales have tended be about equally divided between OEMs and distributors during2005-07, while imports from China have been about more focused on distributors as shown in table I-4. However, during January-March 2008, shipments by both U.S. producers and importers from China toOEMs have increased when compared with the same period in the previous year.
All seven U.S. producers and the majority of importers of tires from China sell certain OTR tiresnationally. Among 25 responding importers of product from China, 15 market nationally, while theother10 sell in one or more specific regions in the country. Seven reported sales in the Midwest, fivereported sales in the Southeast, and smaller numbers reporting sales in other regions.
Six of seven U.S. producers reported that the largest share of their sales are made from items ininventories rather than produced to order, while a majority of responding importers (14 of 22) are morelikely to sell items produced to order. Among producers, the lead times for delivery of items ininventories typically range from 2 to 10 days. For items that are specially ordered, producers’ lead timesare as long as 12 weeks. Among importers that sell from inventory, delivery lead times typically rangefrom 1 to 14 days. For items produced to order, lead times can be as long as 6 months.
SUPPLY AND DEMAND CONSIDERATIONS
U.S. Supply
Domestic supply responsiveness depends upon such factors as the level of industry capacityutilization, the level of inventories, the availability of export markets, and the flexibility of shiftingproduction equipment to other products. U.S. producers’ capacity utilization rates ranged from a low of38.0 percent in 2007 to a high of 46.8 percent in 2005. The ratio of U.S. producers’ end-of-periodinventories to their total shipments ranged from a low of 15.6 percent in 2007 to a high of 22.9 percent in2006. During January-March 2008, the ratio was 12.9 percent. U.S. producers’ export shipments, as apercentage of total shipments, ranged between 12 and 13 percent during 2005-07. During January-March2008, the ratio was 14.0 percent.

2 In addition to this question concerning subject imports, purchasers were also asked that same questionconcerning OTR tires with rim diameters equal to or greater than 39 inches. Fourteen firms reported problems inobtaining these nonsubject tires since 2005. However, the majority of these firms did not provide detailedinformation concerning the problems. 3 BFNA reported that *** (BFNA’s response to Post-hearing Questions from Vice Chairman Pearson andCommissioner Okun, Exh. E). 4 Titan’s response to Post-hearing Questions from Vice Chairman Pearson and Commissioner Okun, Tab 1. 5 Two other firms reported refusals, however they did not report which firms refused the sales. 6 ***. 7 In two of these cases, *** rather than U.S. product.
II-2
All seven U.S. producers reported that they have manufactured other products using theequipment used to manufacture certain OTR tires. These products include OTR tires with a rim diameterof 39 inches or more, truck tires, lawn and garden tires, all terrain vehicle tires, and trailer tires.
Industry Shortages
Producers and importers were asked whether they had refused, declined, or been unable to supplycertain OTR tires at any time since January 1, 2005, and purchasers were asked whether their suppliershad at any time refused, declined, or been unable to supply certain OTR tires since January 2005.2 Threeof the seven U.S. producers, *** acknowledged that they had refused, declined, or been unable to supplytires in the specified period. ***. 3 ***.4 ***.
Nine importers of tires from China and one importer of tires from Japan reported that they hadrefused, declined, or been unable to supply tires in the specified period. Among these importers, eightreported that they had delivered shipments later than committed, five reported delivering less thanpromised quantities, one reported not renewing an existing customer, and two reported not accepting anew customer.
Twenty-two of 50 purchasers reported that suppliers had refused, declined, or been unable tosupply some OTR tires since January 2005, reporting a total of 74 instances.5 Sixty-one of the refusalswere reported to be by U.S. producers ***6 ***.7 Other refusals were reported for China (6), Japan (2),Israel (2), Korea (1), Taiwan (1), and one with the producing country unreported. Many of these reporteda number of problems, 29 reported allocations, 4 reported that they were not accepted as new customers, 2reported they were not renewed as existing customers, 14 reported they were delivered less than thepromised quantity, 16 reported shipments were delivered later than committed, and 37 reported otherproblems including territorial restrictions, canceled orders, refusal to sell or take orders from thepurchaser, not given access to certain types or sizes of tires, product not available when ordered/needed,long back orders, back orders canceled, all sales were to OEM, being forced to purchase non-radial tires,and non- delivery. A number of the purchasers reported that they were currently facing these problemsand some reported supply problems in every year from 2004 through 2008.
The three largest OEMs providing purchaser questionnaires, *** all reported that they have haddifficulty in obtaining certain OTR tires since 2005. Together, these three firms accounted for more than*** percent of the total value of purchases from all sources reported by 50 responding purchasers during2007 .
While many of the reports concerning tire shortages were often very general, the largerpurchasers provided more detailed information concerning products and companies. For example, ***.
8 It further stated that ***. 9 Bureau of the Census, Manufacturers’ Shipments, Inventories and Orders, August 2003, pp. 8-10 andBenchmark Report for Manufacturers’ Shipments, Inventories and Orders, May 2007, p. D3 and May 2008, p. D3. 10 Hearing transcript, pp. 111-112 (Dorn).
II-3
The second largest purchaser of tires, ***.8 ***.***, the third largest purchaser of certain OTR tires according to questionnaire responses, ***.
Subject Imports
The supply responsiveness of the Chinese industry to changes in price in the U.S. market dependsupon such factors as capacity utilization rates in China, the availability of home markets, other exportmarkets besides the United States, and inventory levels. The evidence relating to capacity utilizationrates, alternative markets, and inventory levels indicates that Chinese suppliers have some flexibility forexpanding exports to the United States in response to a change in price. Chinese producers reported acapacity utilization rate of 95.6 percent in 2005, 90.9 percent in 2006, and 92.4 percent in 2007. Theprojected capacity utilization rate is 92.1 percent for 2008 and 91.9 percent for 2009. Chinese producers’combined shipments to the home market and to export markets other than the United States consistentlyamounted to between 84 and 85 percent of its total shipments annually during 2005-07. These combinedshipments are projected to amount to about 91 percent of the total annually in 2008 and about 93 percentin 2009. Chinese producers’ inventories as a percentage of total shipments accounted for 6.7 percent in2005, 6.9 percent in 2006, and 7.1 percent in 2007. Projected ratios of inventories to shipments are 5.9percent in 2008 and 5.3 percent in 2009.
U.S. Demand
Demand Characteristics
Since certain OTR tires are used principally in vehicles in agricultural, construction, andindustrial applications, the overall demand in the United States for certain OTR tires depends upondemand in those industries. Annual data for the period 1992-2006 show that manufacturers shipments offarm machinery, construction machinery, and industrial machinery all increased substantially (in valueterms) over this period, contributing to an overall increase in demand for certain OTR tires during thisperiod.9 There is evidence that the demand for certain OTR tires tends to be cyclical and normally trackstrends in U.S. farming and mining sectors with sales increasing as the farm economy and commodityprices increase.10
When purchasers were asked whether demand is stronger or weaker during the first half of theyear as compared to the second half, 28 responding purchasers answered “yes” and 20 answered no.While a majority agreed that seasonal factors do influence demand for OTR tires, there was no consensusamong the purchasers on whether demand is stronger in the first or the second half of the year.
The overall demand for OTR tires, as measured by apparent consumption, decreased during2005-07 from 8.0 million tires in 2005 to 8.6 million in 2006, and then to 7.8 million in 2007. DuringJanuary-March 2008, apparent consumption was 1.8 million tires as compared to 1.9 million in the sameperiod of 2007.
When asked whether demand in the United States has increased, remained the same, or decreasedsince January 1, 2005, responses were varied among producers, while the majority of importers andpurchasers reported that demand had increased. Of the seven U.S. producers, three firms stated that
II-4
demand had increased, two reported that demand had fluctuated, one stated that it had remainedunchanged, and one reported that demand was varied in different market sectors during the period. Among responding importers, 17 reported that demand had increased, 6 reported demand had fluctuated,and 4 reported that it had decreased. Among responding purchasers, 27 reported that demand hadincreased, 12 reported that it had fluctuated, 4 reported that there was no change, and 2 reported that ithad decreased. Among producers, importers, and purchasers that discussed changes in demand in theUnited States, some firms reported that farm income has been strong during the period covered and thishas resulted in increased spending on new equipment with a resulting increase in demand for agriculturaltires. In addition, high commodity prices for oil, copper, iron, gold and silver have resulted in increaseddemand for mining vehicles. However, some firms reported that the decline in the housing market hasresulted in less demand for certain OTR tires in construction equipment.
Demand Outside of the United States
When asked how demand for certain OTR tires outside of the United States had changed sinceJanuary 1, 2005, four of five responding producers reported that this demand had increased while onereported no change. Among responding importers, 14 reported that demand outside of the United Stateshad increased, 2 reported that it had fluctuated, and 1 reported that it had decreased. Those firmsreporting an increase attributed the increase to strong global demand and increasing demand in mining,metals, energy, farming and forestry markets to high commodity and crop prices, and increasedconstruction in developing countries.
Substitute Products
When asked whether other products can be substituted for OTR tires, the majority ofquestionnaire respondents answered no. Among producers, one firm reported that retreaded tires can beused as substitutes, and two reported that tracks can be substituted for tires on skid steers. However, theother four producers reported that substitutes are not available. While the majority of importers andpurchasers indicated that no substitutes exist, some mentioned substitutes including solid and semi-solidtires and tracks.
Cost Share
When producers and importers were asked to estimate the cost share of OTR tires in end-useproducts where they are used, most firms that provided estimates indicated that these relative costs aresmall. One producer estimated that OTR tires account for no more than 5 percent of the cost of a vehiclewhere they are used. Another producer estimated that the cost of OTR tires accounted for less than 2percent of the cost of skid steer vehicles and compact tractors, and from 3 to 6 percent of the cost ofimplement equipment. Among importers, one firm estimated that OTR tires account for between 2 and 5percent of the cost of mining equipment, and another importer estimated the relative cost to be about 5percent of the cost of mechanized irrigation equipment. A third importer reported that the cost share ofOTR tires for OEM equipment is less than 7.5 percent for tractors greater than 100 horsepower, less than5 percent for tractors with horsepower between 40 and 100, less than 5 percent for loaders, telehandlersand skid steers, and less than 4.5 percent for backhoes. Among purchasers, one firm estimated that thecost share of OTR tires is 3 to 9 percent for tractors, 2 to 4 percent of combines, and 2 to 7 percent forconstruction equipment. Another purchaser estimated a cost share of 5.5 percent for agricultural tractorsover 150 horsepower, 5.2 percent for compact tractors, and 7.5 percent for front loaders used inconstruction. Another purchaser estimated a cost share of 1 to 3 percent for backhoe loaders, 3 to 4percent for skid steer loaders, and 7.5 to 9 percent for medium wheel loaders.

II-5
SUBSTITUTABILITY ISSUES
The degree of substitutability between domestic products and subject imports, between domesticproducts and nonsubject imports, between subject imports from different sources, and between subjectand nonsubject imports is discussed in this section. The information is based mainly on questionnaireresponses of producers, importers, and purchasers.
U.S. Purchasers
The 50 purchasers that submitted questionnaires included 43 firms that function as distributors, 4as original equipment manufacturers, one as an independent tire dealer, one as an assembler of tire wheelsfor OEM’s and one as a reseller. Among firms that are distributors, one also functions as a retailer, andtwo also function as resellers. All 50 of the purchasers reported purchases from China during 2005-07, 46of these purchasers also reported buying U.S. produced tires during this period and 41 reported buyingimports from nonsubject sources. The combined value of purchases by the 47 firms that were able tobreak out purchases annually by sources during 2005-07 is presented in table II-1. The nonsubjectcountries mentioned included Belarus, Canada, the Czech Republic, France, Germany, India, Israel, Italy,Korea, Japan, Mexico, Poland, Russia, Spain, Sri Lanka, and Taiwan. Thirteen purchasers reportedbuying nonsubject tires (i.e, tires with a rim diameter greater than or equal to 39 inches). Since January2007, the combined purchases of these 13 purchasers amounted to 1,028 tires.
Table II-1Certain OTR tires: Value of purchases (in thousands of dollars) from U.S. producers and importsources, as reported by responding U.S. purchasers, 2005-07
Purchase source
Year
2005 2006 2007
U.S. producers $509,136 $506,343 $611,340
China 97,380 132,497 134,091
Nonsubject countries 170,973 206,419 260,021
Source: Compiled from data submitted in response to Commission questionnaires.
Purchasers were asked to discuss trends in their purchases of OTR tires from U.S. producers,importers from China, and importers from other sources during 2005-07. The majority of purchasersreported that purchases of imports from China increased while responses relating to purchases of U.S.-produced tires and purchases from other import sources were mixed.
In the case of purchases from U.S. producers, 15 purchasers reported that they had increased, 1reported that they had increased and fluctuated, 11 reported that they had fluctuated, 8 reported that theywere constant, and 11 reported that they had decreased. Firms reporting an increase cited such factors asnew customers, new company locations, growth in construction and agriculture, and improved marketconditions. Firms reporting a decrease cited a lack of availability, and prices that were not competitive.
In the case of purchases of imports from China, 28 purchasers reported that they had increased, 8reported that they had fluctuated, 3 reported that they were constant, and 10 reported that they haddecreased. Firms reporting increased sales, cited such factors, as low Chinese prices, availability of theChinese product, a limited domestic supply, and increased customer demand. Firms reporting decreasescited increased duties, inconsistent quality, and increased purchases from other sources.
In the case of purchases of imports from other sources, 17 purchasers reported that they hadincreased, 10 reported that they had fluctuated, 5 reported that they were constant, and 8 reported that
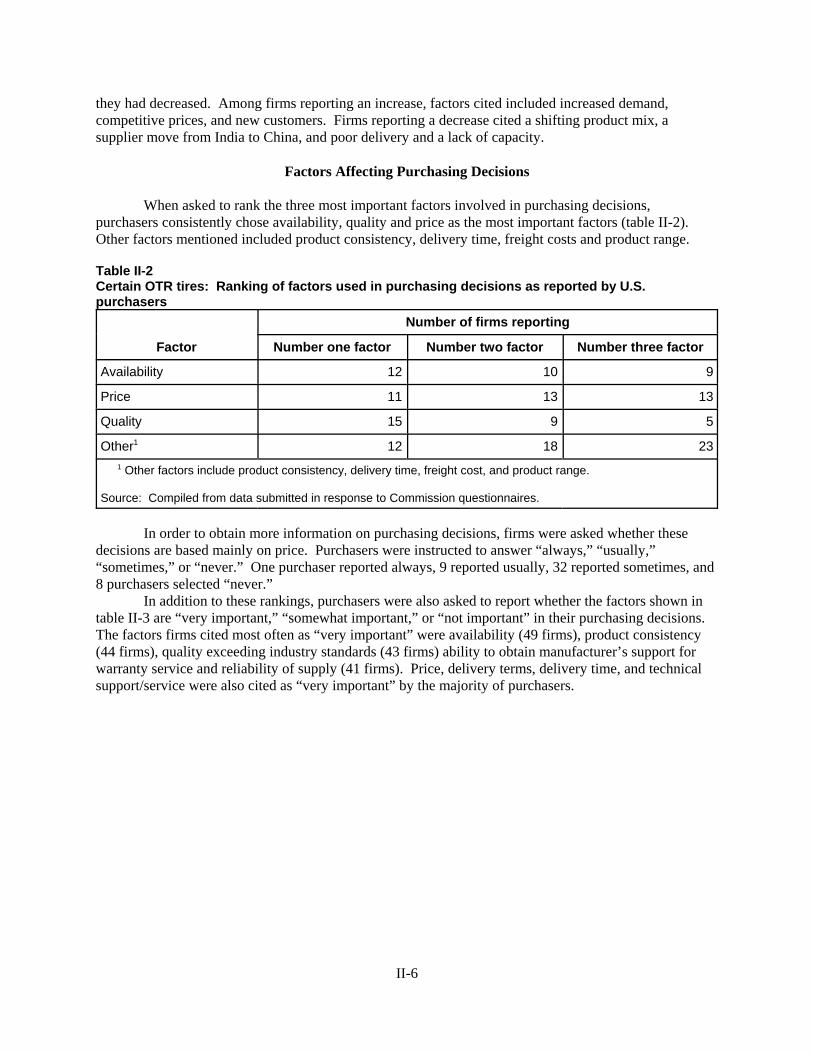
II-6
they had decreased. Among firms reporting an increase, factors cited included increased demand,competitive prices, and new customers. Firms reporting a decrease cited a shifting product mix, asupplier move from India to China, and poor delivery and a lack of capacity.
Factors Affecting Purchasing Decisions
When asked to rank the three most important factors involved in purchasing decisions,purchasers consistently chose availability, quality and price as the most important factors (table II-2). Other factors mentioned included product consistency, delivery time, freight costs and product range.
Table II-2Certain OTR tires: Ranking of factors used in purchasing decisions as reported by U.S.purchasers
Factor
Number of firms reporting
Number one factor Number two factor Number three factor
Availability 12 10 9
Price 11 13 13
Quality 15 9 5
Other1 12 18 23
1 Other factors include product consistency, delivery time, freight cost, and product range.
Source: Compiled from data submitted in response to Commission questionnaires.
In order to obtain more information on purchasing decisions, firms were asked whether thesedecisions are based mainly on price. Purchasers were instructed to answer “always,” “usually,”“sometimes,” or “never.” One purchaser reported always, 9 reported usually, 32 reported sometimes, and8 purchasers selected “never.”
In addition to these rankings, purchasers were also asked to report whether the factors shown intable II-3 are “very important,” “somewhat important,” or “not important” in their purchasing decisions. The factors firms cited most often as “very important” were availability (49 firms), product consistency (44 firms), quality exceeding industry standards (43 firms) ability to obtain manufacturer’s support forwarranty service and reliability of supply (41 firms). Price, delivery terms, delivery time, and technicalsupport/service were also cited as “very important” by the majority of purchasers.
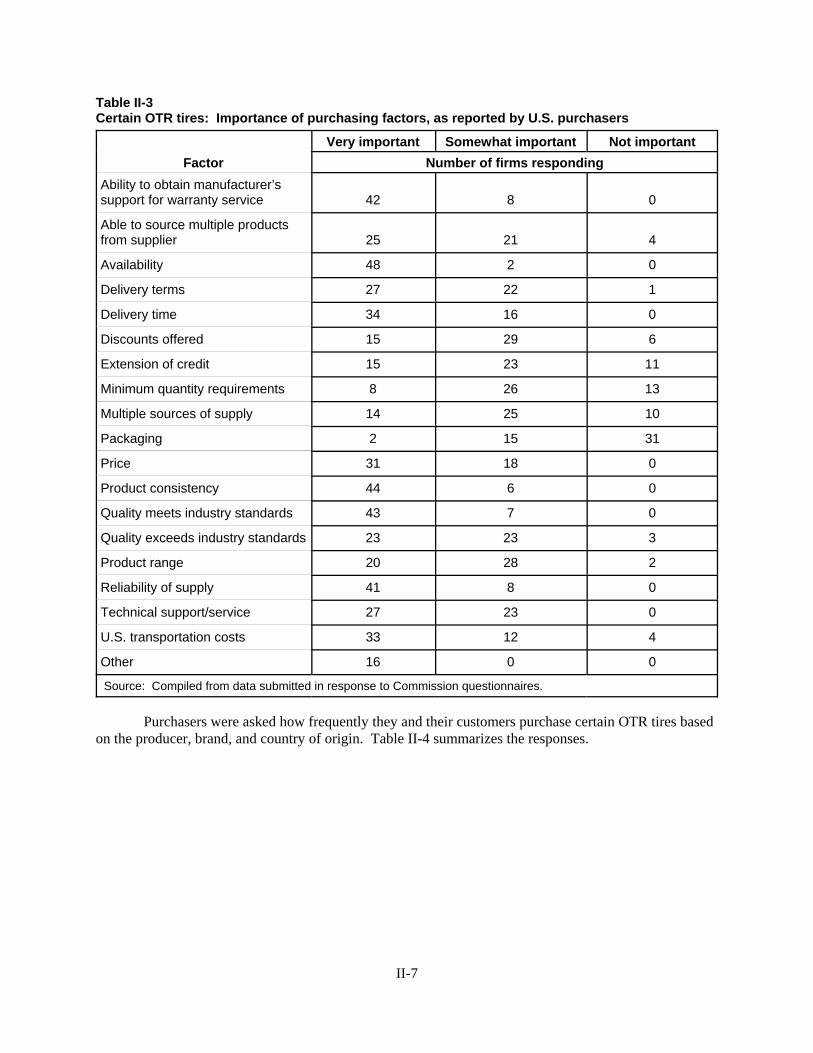
II-7
Table II-3Certain OTR tires: Importance of purchasing factors, as reported by U.S. purchasers
FactorVery important Somewhat important Not important
Number of firms respondingAbility to obtain manufacturer’ssupport for warranty service 42 8 0
Able to source multiple productsfrom supplier 25 21 4
Availability 48 2 0
Delivery terms 27 22 1
Delivery time 34 16 0
Discounts offered 15 29 6
Extension of credit 15 23 11
Minimum quantity requirements 8 26 13
Multiple sources of supply 14 25 10
Packaging 2 15 31
Price 31 18 0
Product consistency 44 6 0
Quality meets industry standards 43 7 0
Quality exceeds industry standards 23 23 3
Product range 20 28 2
Reliability of supply 41 8 0
Technical support/service 27 23 0
U.S. transportation costs 33 12 4
Other 16 0 0
Source: Compiled from data submitted in response to Commission questionnaires.
Purchasers were asked how frequently they and their customers purchase certain OTR tires basedon the producer, brand, and country of origin. Table II-4 summarizes the responses.

11 Evidence indicates that most sales to OEMs are branded tires (see Titan’s posthearing brief, Exh. 1).
II-8
Table II-4Certain OTR tires: Importance of producer, brand, and country of origin as reported by purchasers
Purchaser/customer decisionBasis of decision Always Usually Sometimes Never
Purchaser makes decision based on producer 9 19 14 7
Purchaser’s customer makes decision based on producer 3 15 24 4
Purchaser makes decision based on brand 6 14 21 9
Purchaser’s customer makes decision based on brand 2 18 20 7
Brand names purchased based on country of origin 2 1 13 30
Purchaser makes decision based on country of origin 2 3 20 25
Purchaser’s customer makes decision based on country of origin 0 2 26 19
Source: Compiled from data submitted in response to Commission questionnaires.
Most responding purchasers (28 of 49) reported that they always or usually make purchases basedon the producer of the certain OTR tires. The purchasers that reported that they always make decisionsbased on the producer cited the following reasons: quality; ability to withstand the abusive conditions ofmining; prefer U.S. tires for quality; purchase on a program as opposed to a spot basis; purchase fromcompanies with proven track record; quality must meet *** quality standards; product line, tread designs,price availability warranty customer service, payment terms warehouse locations, existing competition,perception of company; quality at competitive price; and customers look to them to source qualityproducts that can be offered with dependable supply at competitive prices. Most purchasers (39 of 46)reported that their customers usually or sometimes make decisions based on the producer.
The brand of the tire was less important than the producer, for both the purchaser and itscustomers. Nonetheless, 20 of the responding 50 purchasers reported that they always or usually basedpurchases on brand while 20 of the 47 responding purchasers reported that their customers purchasedbased on brand.11 Reasons purchasers always purchased brands included better tires reduce downtime;must be approved program sources; consistent brands; purchase product that perform; tires all branded***; and defined by customer. Almost all purchasers, 45 out of 48 responding, reported thatbranded tires commanded premium prices (not shown in table). When asked to list brand namescommanding a premium, the most commonly cited were Michelin (33 purchasers), BFNA and/orFirestone (30 purchasers), Goodyear (16 purchasers) and Titan (10 purchasers). When asked to estimatethe amount of the premium for specified brands, the estimates ranged widely from 3 percent to as much as50 percent or more. The majority of estimates were in the 10 to 25 percent range.
The country of origin was much less important for both purchasers and their customers than otherfactors. When asked to rank the importance of the country of origin of branded tires 43 of the 46responding firms reported that it was sometimes or never important. For the more general questionsconcerning the importance of the country of origin, 46 of 50 responding purchasers reported that thecountry was only sometimes or never important for their purchases and 45 of the 47 respondingpurchasers reporting that it was sometimes or never important for their customers.

II-9
Comparisons of Domestic Products and Subject and Nonsubject Imports
In order to determine whether U.S.-produced certain OTR tires can generally be used in the sameapplications as imports from China and nonsubject sources, producers and importers were asked whetherthe product can “always,” “frequently,”“sometimes,” or “never” be used interchangeably. As shown intable II-5, the majority of questionnaire respondents that reported that U.S.-produced tires and importsfrom China are always or frequently interchangeable. Similarly, the majority of questionnairerespondents consider U.S.-produced tires and imports from China as always or frequently interchangeablewith nonsubject imports.
One importer of Chinese product which uses tires as a part of its *** considers the U.S.-producedtires to be “sometimes” interchangeable. It considers the failure rate with tires that it has purchased from*** unacceptable. Another importer stated that the top brands of U.S.-produced tires do not compete withChinese value brands. This firm also reported that China does not export large radial tires to the UnitedStates. Another importer stated that the tires that it imports from China are unique products that are notdirectly interchangeable with any other tires.
Table II-5Certain OTR tires: Interchangeability of product from the United States and subject andnonsubject sources1
Country comparison
U.S. producers U.S. importers Purchasers
A F S N A F S N A F S N
U.S. vs. China 5 1 0 0 9 6 7 1 17 13 12 1U.S. vs. nonsubject 5 1 0 0 8 4 7 0 16 9 8 1China vs. nonsubject 5 1 0 0 8 4 7 0 16 8 8 2 1 Producers, importers, and purchasers were asked if certain OTR tires produced in the United States and in other countriesare used interchangeably.
Note: “A” = Always, “F” = Frequently, “S” = Sometimes, and “N” = Never.
Source: Compiled from data submitted in response to Commission questionnaires.
Among purchasers, one firm reported that domestic USA brands, *** and *** have establishedmarket share, brand recognition and high quality, and that state-of-the art products are generally notavailable from sources other than such companies as ***. One end user that allows customers to pick tirebrands for some of its machines reported that tires from China are sometimes viewed as inferior. However, for other machines, tires are not as large an issue for customers, and in these cases the Chinesetires may be considered interchangeable with tires from other sources.
In addition to questions concerning interchangeability, producers and importers were also askedto compare U.S.-produced products with imports from China and nonsubject imports in terms of productdifferences other than price such as quality, availability, product range, and other characteristics, as afactors in their sales of certain OTR tires (table II-6). The majority of producers consistently reported thatproduct differences are never or sometimes important when comparing the U.S.-produced product withimports from China, while the majority of importers and purchasers reported that the differences arealways or frequently important. One importer reported that the quality of the Chinese product is lower,and ocean freight is expensive. However, another importer reported that the quality and performance ofChinese tires is very good and that some Chinese brands have a better reputation than major brands suchas *** and ***. Another importer reported that it shifted to imports from China because it was unable toobtain *** tires and small industrial tires from U.S. producers. Another importer stated that producers indeveloping countries do not have the presence, R&D capability, and marketing staffs to be significantsuppliers to the OEM segment.
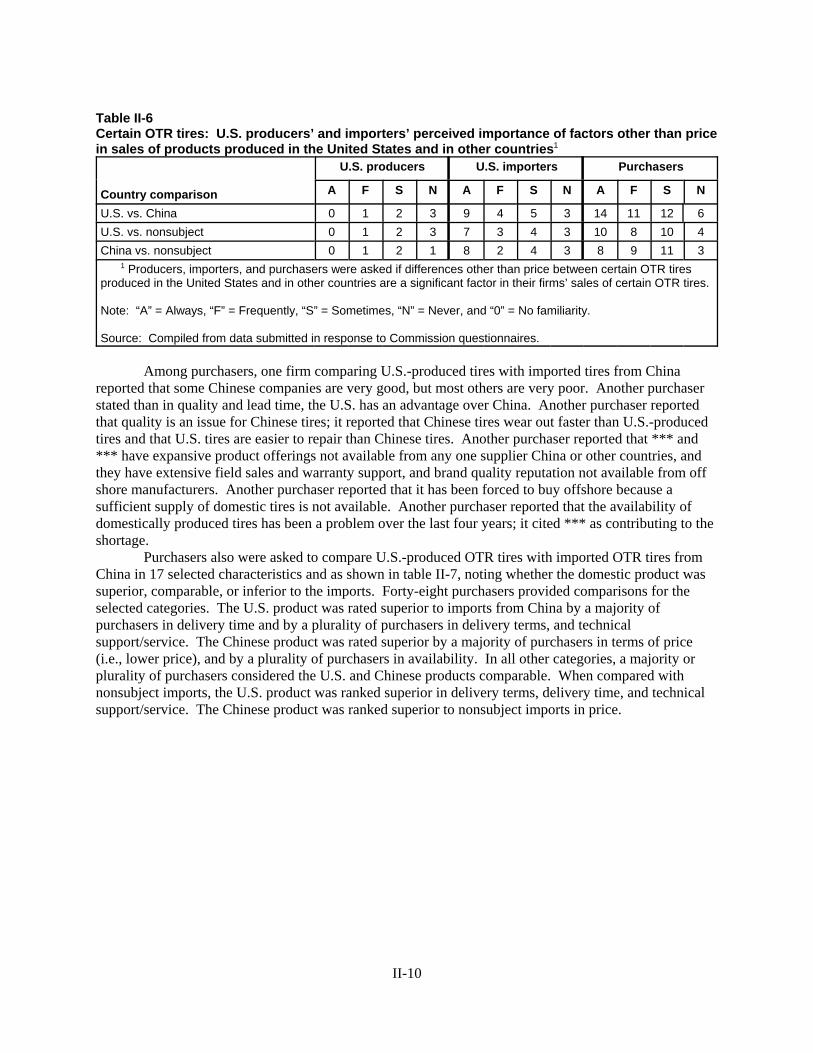
II-10
Table II-6Certain OTR tires: U.S. producers’ and importers’ perceived importance of factors other than pricein sales of products produced in the United States and in other countries1
Country comparison
U.S. producers U.S. importers Purchasers
A F S N A F S N A F S N
U.S. vs. China 0 1 2 3 9 4 5 3 14 11 12 6U.S. vs. nonsubject 0 1 2 3 7 3 4 3 10 8 10 4China vs. nonsubject 0 1 2 1 8 2 4 3 8 9 11 3 1 Producers, importers, and purchasers were asked if differences other than price between certain OTR tiresproduced in the United States and in other countries are a significant factor in their firms’ sales of certain OTR tires.
Note: “A” = Always, “F” = Frequently, “S” = Sometimes, “N” = Never, and “0” = No familiarity.
Source: Compiled from data submitted in response to Commission questionnaires.
Among purchasers, one firm comparing U.S.-produced tires with imported tires from Chinareported that some Chinese companies are very good, but most others are very poor. Another purchaserstated than in quality and lead time, the U.S. has an advantage over China. Another purchaser reported that quality is an issue for Chinese tires; it reported that Chinese tires wear out faster than U.S.-producedtires and that U.S. tires are easier to repair than Chinese tires. Another purchaser reported that *** and*** have expansive product offerings not available from any one supplier China or other countries, andthey have extensive field sales and warranty support, and brand quality reputation not available from offshore manufacturers. Another purchaser reported that it has been forced to buy offshore because asufficient supply of domestic tires is not available. Another purchaser reported that the availability ofdomestically produced tires has been a problem over the last four years; it cited *** as contributing to theshortage.
Purchasers also were asked to compare U.S.-produced OTR tires with imported OTR tires fromChina in 17 selected characteristics and as shown in table II-7, noting whether the domestic product wassuperior, comparable, or inferior to the imports. Forty-eight purchasers provided comparisons for the selected categories. The U.S. product was rated superior to imports from China by a majority ofpurchasers in delivery time and by a plurality of purchasers in delivery terms, and technicalsupport/service. The Chinese product was rated superior by a majority of purchasers in terms of price (i.e., lower price), and by a plurality of purchasers in availability. In all other categories, a majority orplurality of purchasers considered the U.S. and Chinese products comparable. When compared with nonsubject imports, the U.S. product was ranked superior in delivery terms, delivery time, and technicalsupport/service. The Chinese product was ranked superior to nonsubject imports in price.

12 Prehearing brief of BFNA pp. 23-24. 13 A supply function is not defined in the case of a non-competitive market.
II-11
Table II-7Certain OTR tires: Comparisons between U.S.-produced and subject products from China, andsubject and nonsubject products as reported by U.S. purchasers
Factor
U.S. vs ChinaU.S. vs
nonsubject China vs
nonsubjectS C I S C I S C I
Number of firms responding Able to source multiple products from supplier 16 26 5 8 17 1 6 16 2Availability 13 15 19 9 13 4 5 15 5Delivery terms 22 17 8 15 10 1 3 18 4Delivery time 24 14 9 15 8 3 3 17 5Discounts offered 6 29 11 4 17 5 3 21 1Extension of credit 15 31 0 6 19 1 1 22 2
Minimum quantity requirements 16 24 7 9 15 1 1 20 4
Packaging 4 42 0 2 22 0 0 23 1Price1 3 14 30 3 5 18 12 9 2Product consistency 15 29 3 7 15 2 6 14 4Product range 20 25 2 12 11 2 7 15 3Quality exceeds industry standards 20 27 0 12 10 3 6 15 3Quality meets industry standards 14 33 0 5 18 2 6 16 3Reliability of supply 10 20 15 8 11 5 8 16 1Technical support/service 23 18 5 15 9 2 5 18 2U.S. transportation costs 13 29 2 8 18 0 3 21 1Warranty Service 20 25 1 8 14 1 6 18 1Other 0 0 1 0 0 0 0 0 0Note.--S=first listed country’s product is superior; C=both countries’ products are comparable; I=first listed country’s product isinferior.
1A rating of superior on price and U.S. transportation costs indicates that the first country generally has lower prices/U.S.transportation costs than the second country.
Source: Compiled from data submitted in response to Commission questionnaires.
ELASTICITY ESTIMATES
This section discusses the elasticity estimates. Parties were encouraged to comment on theseestimates in their prehearing brief. In their prehearing brief, one of the petitioners agreed with the staffestimate discussed below that the U.S. demand for certain OTR tires is price inelastic. No othercomments on the estimates were provided by any of the parties in their briefs.12
U.S. Supply Elasticity13
The domestic supply elasticity for certain OTR tires measures the sensitivity of the quantitysupplied by U.S. producers to changes in the U.S. market price for these products. The elasticity ofdomestic supply depends on several factors, including the level of excess capacity, the existence ofinventories, and the availability of alternative markets for certain OTR tires. The low rate of industry

14 The substitution elasticity measures the responsiveness of the relative U.S. consumption levels of the subjectimports and the domestic like products to changes in their relative prices. This reflects how easily purchasers switchfrom the U.S. product to the subject products (or vice versa) when prices change.
II-12
capacity utilization and the availability of inventories suggest that the domestic supply elasticity isrelatively high. A range of 5 to 10 was proposed at the prehearing stage of this investigation. However,evidence of shortages indicates that the supply elasticity may be in the lower end of this range.
U.S. Demand Elasticity
The U.S. demand elasticity for certain OTR tires measures the sensitivity of the overall quantitydemanded to a change in the U.S. market price of this product. This estimate depends on factorsdiscussed earlier such as the existence, availability, and commercial viability of substitute products, aswell as the component cost of the certain OTR tires in the production of downstream products. Becauseof a lack of close substitute products as reported by questionnaire respondents, and the relatively smallcost share of certain OTR tires in final products, the aggregate demand for certain OTR tires is likely tobe inelastic; a range of -0.01 to -0.5 is suggested.
Substitution Elasticity
The elasticity of substitution depends upon the extent of product differentiation between thedomestic and imported products.14 Product differentiation, in turn, depends upon such factors as quality(e.g., chemistry, appearance, etc.) and conditions of sale (availability, sales terms/discounts/promotions,etc.). Based on available information, the elasticity of substitution between U.S.-produced certain OTRand imported certain OTR is likely to be in the range of 3 to 5.
1 Petition, pp. 25-26 and amendment to the petition, June 22, 2007, attach. 1. 2 The petition also identified Trelleborg Wheel Systems and GPX as possible U.S. producers of the subjectproduct. During the preliminary phase of these investigations, both firms responded to the Commission’s U.S.producers’ questionnaire indicating that they had not produced certain OTR tires in the United States since January1, 2004. 3 Since 2005, the certain OTR tires industry has experienced several mergers and acquisitions. In December2005, Titan acquired Goodyear’s American farm tire plant and assets located in Freeport, IL, for approximately $***million in cash proceeds. In July 2006, Titan acquired Continental Tire North America’s construction tire plant andassets located in Bryan, OH, for approximately $*** million in cash proceeds. 4 Hearing transcript, p. 48 (Stewart) and p. 58 (Taylor). Titan and USW’s posthearing brief, p. Okun-6.Respondents argue that this idle machinery is older equipment used to manufacture older, smaller tires that are not inhigh demand. GPX posthearing brief, pp. 95-86.
III-1
PART III: U.S. PRODUCERS’ PRODUCTION, SHIPMENTS, AND EMPLOYMENT
U.S. PRODUCERS
The Commission sent producer questionnaires to seven firms identified in the petition asdomestic producers of certain OTR tires.1 The Commission received completed producer questionnaireresponses from seven firms accounting for 100 percent of U.S. production of certain OTR tires during2007.2 Presented in table III-1 is a list of current domestic certain OTR tires producers, each company’sposition on the petition, production locations, related and/or affiliated firms, and their shares of 2007reported domestic production of certain OTR tires.3 Two firms, *** and ***, accounted for *** percentof reported 2007 domestic production.
U.S. CAPACITY, PRODUCTION, AND CAPACITY UTILIZATION
U.S. producers’ capacity, production, and capacity utilization data for certain OTR tires arepresented in table III-2. These data show an increase in the capacity to produce certain OTR tires of 2.1percent from 2005 to 2007, and a decrease of 5.8 percent from January-March 2007 to January-March2008. *** accounted for a majority of the increase in capacity from 2005 to 2007, and in the interimperiods. *** also reported an increase in capacity. *** reported a decrease in capacity from 2005 to2007, and then an increase in the interim periods. Production of certain OTR tires decreased 14.3 percentfrom 2005 to 2007, then increased 17.3 percent from January-March 2007 to January-March 2008. ***accounted for a majority of the decreased production of certain OTR tires from 2005 to 2007. ***accounted for a majority of the increase of production from January-March 2007 to January-March2008. Capacity utilization decreased 7.5 percentage points from 2005 to 2007 and increased 3.9percentage points from January-March 2007 to January-March 2008. U.S. producers report that areaswhere they have large amounts of unused capacity are for the production of smaller sized agriculturalcertain OTR tires, which cannot be used to produce larger certain OTR tires.4

III-2
Table III-1Certain OTR tires: U.S. producers, positions on the petition, plant locations, shares of totalreported U.S. production in 2007, ownership, and affiliated foreign producers
Firm
Positionon
petitionU.S. production
location(s) Related and/or affiliated firms
Share of2007
production(percent)
BFNA Supports Des Moines, IABloomington, IL
Bridgestone Americas Holding, Inc.Bridgestone Corporation (Japan) Bridgestone Firestone Argentina S.A.I.C.Bridgestone Firestone do Brazil Industria e Comercia LTDABridgestone Firestone de Costa Rica, S.A.P.T. Bridgestone Tire IndonesiaBridgestone Firestone de Mexico, S.A. de C.V.Bridgestone South Africa Holdings (Pty) Ltd.Bridgestone Hispania, S.A. (Spain)Brisa Bridgestone Sebanci Lastik Sanayi ve Ticaret A.S. (Turkey)
***
Carlisle Opposes Aiken, SCCarlisle, PAClinton, TN
Carlisle Companies, Inc.Carlisle (Meizhou) Rubber Manufacturing Co., Ltd.
***
Denman Supports Leavittsburg, OH Pensler Capital Corp. ***
Goodyear *** Topeka, KS Goodyear International Corp.Nippon Giant Tire K.K. (Japan) P.T. Goodyear Indonesia Tbk. Goodyear do Brasil Productos de Borracha Ltd.Goodyear S.A. (Luxembourg)
***
Michelin *** Greenville, SC Michelin CorporationMichelin North America (Canada) Inc. Manufacture Franqaise des Pneumatiques Michelin(France)Michelin Hungaria Tyre Manufacture Ltd. (Hungary)Michelin Polska S.A. (Poland)Silvania S.A. (Romania)Michelin Espana Portugal, S.A. (Spain)
***
Specialty Supports Indiana, PAUnicoi, TN
Polymer Enterprises, Inc. ***
Titan Petitioner Des Moines, IAFreeport, ILBryan, OH
Titan International, Inc. ***
Source: Compiled from data submitted in response to Commission questionnaires.

III-3
Table III-2Certain OTR tires: U.S. capacity, production, and capacity utilization, 2005-07, January-March 2007, andJanuary-March 2008
ItemCalendar year January-March Calendar year January-March
2005 2006 2007 2007 2008 2005 2006 2007 2007 2008Capacity (1,000 tires) Capacity1 (1,000 pounds)
BFNA *** *** *** *** *** *** *** *** *** ***
Carlisle *** *** *** *** *** *** *** *** *** ***
Denman *** *** *** *** *** *** *** *** *** ***
Goodyear *** *** *** *** *** *** *** *** *** ***
Michelin *** *** *** *** *** *** *** *** *** ***
Specialty *** *** *** *** *** *** *** *** *** ***
Titan *** *** *** *** *** *** *** *** *** *** Total 9,996 10,049 10,202 2,569 2,718 1,088,628 1,084,680 1,104,329 276,995 284,183
Production (1,000 tires) Production (1,000 pounds)BFNA *** *** *** *** *** *** *** *** *** ***
Carlisle *** *** *** *** *** *** *** *** *** ***
Denman *** *** *** *** *** *** *** *** *** ***
Goodyear *** *** *** *** *** *** *** *** *** ***
Michelin *** *** *** *** *** *** *** *** *** ***
Specialty *** *** *** *** *** *** *** *** *** ***
Titan *** *** *** *** *** *** *** *** *** *** Total 4,676 3,818 4,009 923 1,083 567,053 547,006 600,885 143,061 159,562
Capacity utilization (percent)BFNA *** *** *** *** *** *** *** *** *** ***
Carlisle *** *** *** *** *** *** *** *** *** ***
Denman *** *** *** *** *** *** *** *** *** ***
Goodyear *** *** *** *** *** *** *** *** *** ***
Michelin *** *** *** *** *** *** *** *** *** ***
Specialty *** *** *** *** *** *** *** *** *** ***
Titan *** *** *** *** *** *** *** *** *** *** Average 46.8 38.0 39.3 35.9 39.8 52.1 50.4 54.4 51.6 56.1
Average production weight (pounds per tire)BFNA *** *** *** *** ***
Carlisle *** *** *** *** ***
Denman *** *** *** *** ***
Goodyear *** *** *** *** ***
Michelin *** *** *** *** ***
Specialty *** *** *** *** ***
Titan *** *** *** *** *** Total 121.3 143.3 149.9 155.0 147.3Source: Compiled from data submitted in response to Commission questionnaires.
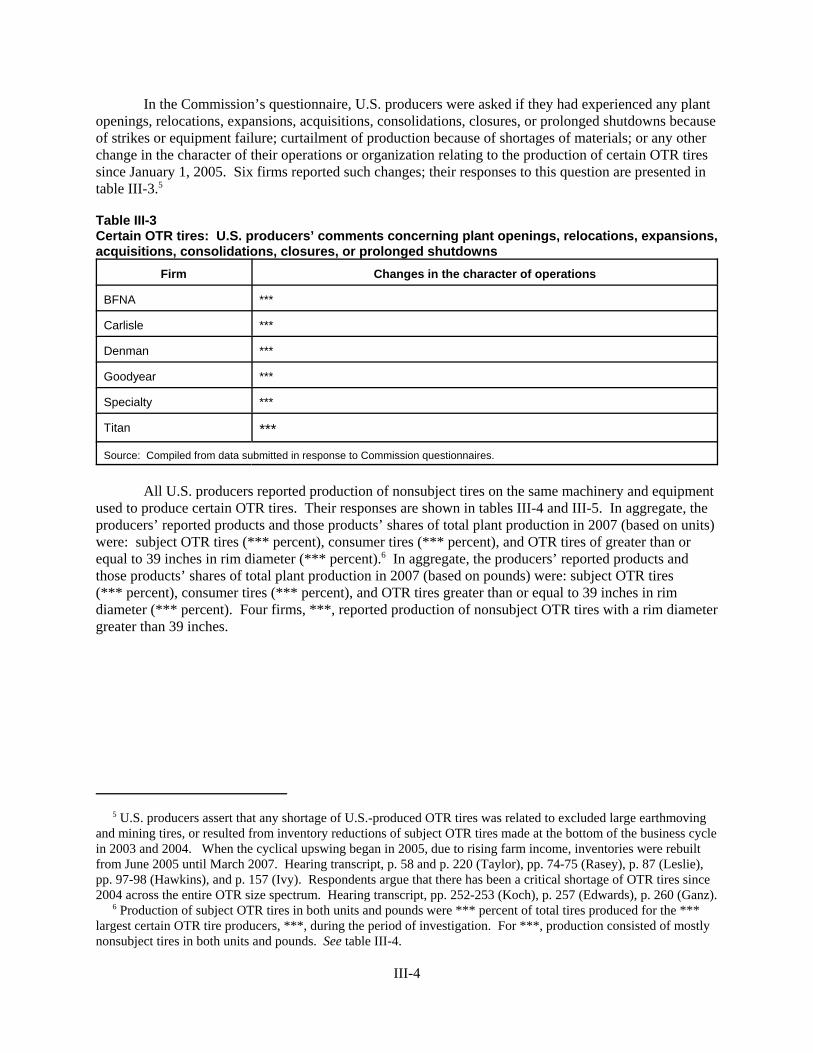
5 U.S. producers assert that any shortage of U.S.-produced OTR tires was related to excluded large earthmovingand mining tires, or resulted from inventory reductions of subject OTR tires made at the bottom of the business cyclein 2003 and 2004. When the cyclical upswing began in 2005, due to rising farm income, inventories were rebuiltfrom June 2005 until March 2007. Hearing transcript, p. 58 and p. 220 (Taylor), pp. 74-75 (Rasey), p. 87 (Leslie),pp. 97-98 (Hawkins), and p. 157 (Ivy). Respondents argue that there has been a critical shortage of OTR tires since2004 across the entire OTR size spectrum. Hearing transcript, pp. 252-253 (Koch), p. 257 (Edwards), p. 260 (Ganz). 6 Production of subject OTR tires in both units and pounds were *** percent of total tires produced for the ***largest certain OTR tire producers, ***, during the period of investigation. For ***, production consisted of mostlynonsubject tires in both units and pounds. See table III-4.
III-4
In the Commission’s questionnaire, U.S. producers were asked if they had experienced any plantopenings, relocations, expansions, acquisitions, consolidations, closures, or prolonged shutdowns becauseof strikes or equipment failure; curtailment of production because of shortages of materials; or any otherchange in the character of their operations or organization relating to the production of certain OTR tiressince January 1, 2005. Six firms reported such changes; their responses to this question are presented intable III-3.5
Table III-3Certain OTR tires: U.S. producers’ comments concerning plant openings, relocations, expansions,acquisitions, consolidations, closures, or prolonged shutdowns
Firm Changes in the character of operations
BFNA ***
Carlisle ***
Denman ***
Goodyear ***
Specialty ***
Titan ***
Source: Compiled from data submitted in response to Commission questionnaires.
All U.S. producers reported production of nonsubject tires on the same machinery and equipmentused to produce certain OTR tires. Their responses are shown in tables III-4 and III-5. In aggregate, theproducers’ reported products and those products’ shares of total plant production in 2007 (based on units)were: subject OTR tires (*** percent), consumer tires (*** percent), and OTR tires of greater than orequal to 39 inches in rim diameter (*** percent).6 In aggregate, the producers’ reported products andthose products’ shares of total plant production in 2007 (based on pounds) were: subject OTR tires (*** percent), consumer tires (*** percent), and OTR tires greater than or equal to 39 inches in rimdiameter (*** percent). Four firms, ***, reported production of nonsubject OTR tires with a rim diametergreater than 39 inches.

7 Titan and USW’s posthearing brief, p. 5. 8 Titan and USW’s posthearing brief, p. 7.
III-5
Table III-4Tires: U.S. producers’ total plant capacity and production, by products, 2005-07, January-March2007, and January-March 2008
* * * * * * *
Table III-5Tires: Production of tires using the same machinery and equipment, 2007
* * * * * * *
U.S. PRODUCERS’ SHIPMENTS
Table III-6 presents information on U.S. producers’ shipments of certain OTR tires. U.S.producers’ U.S. shipments fell from 2005 to 2007 by 4.2 percent based on quantity, while the averageunit value increased by 21.9 percent and unit weight increased by 24.8 percent. From January-March2007 to January-March 2008, U.S. shipments increased by 9.3 percent, average unit value increased by3.8 percent, and the unit weight increased by 9.1 percent. Petitioners report that the increase in averageunit value reflects a combination of some price increase to cover part of the increase in raw material costsand an evolving product mix of larger tires as domestic producers lost market share (particularly in thesmaller-sized certain OTR tires).7 U.S. producers’ exports decreased in share of total shipments in unitsfrom 12.8 to 12.2 percent during 2005 to 2007. This share increased to 13.7 percent in units duringinterim 2008 when compared to the same period in 2007.
Table III-7 presents information on U.S. producers’ shipments of certain OTR tires by end-useapplication. The majority of U.S. shipments were for agricultural/forestry applications which accountedfor 72.8 percent based on quantity (units) and 61.4 percent based on value of total U.S. shipments during2007. Petitioners report that while there is increasing demand for radial certain OTR tires, bias certainOTR tires continue to account for the vast majority of demand in the farm, construction, and industrialsectors.8
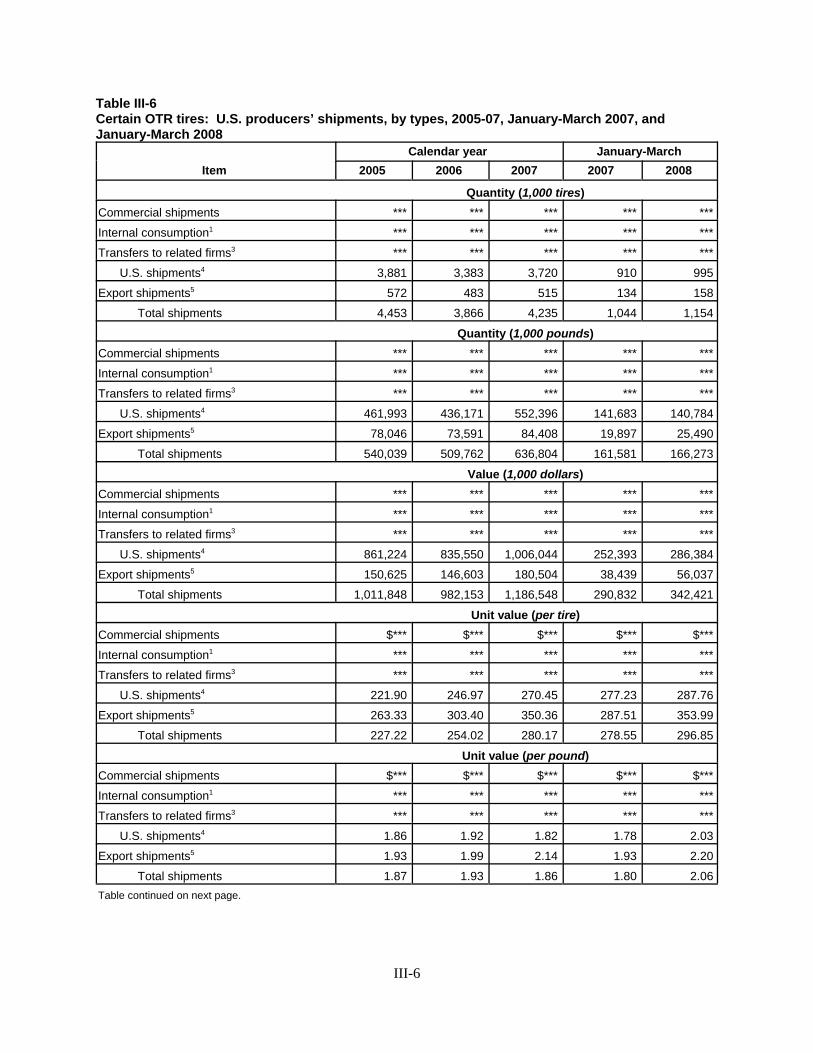
III-6
Table III-6Certain OTR tires: U.S. producers’ shipments, by types, 2005-07, January-March 2007, andJanuary-March 2008
ItemCalendar year January-March
2005 2006 2007 2007 2008
Quantity (1,000 tires)Commercial shipments *** *** *** *** ***
Internal consumption1 *** *** *** *** ***
Transfers to related firms3 *** *** *** *** ***
U.S. shipments4 3,881 3,383 3,720 910 995
Export shipments5 572 483 515 134 158
Total shipments 4,453 3,866 4,235 1,044 1,154
Quantity (1,000 pounds)Commercial shipments *** *** *** *** ***
Internal consumption1 *** *** *** *** ***
Transfers to related firms3 *** *** *** *** ***
U.S. shipments4 461,993 436,171 552,396 141,683 140,784
Export shipments5 78,046 73,591 84,408 19,897 25,490
Total shipments 540,039 509,762 636,804 161,581 166,273
Value (1,000 dollars)Commercial shipments *** *** *** *** ***
Internal consumption1 *** *** *** *** ***
Transfers to related firms3 *** *** *** *** ***
U.S. shipments4 861,224 835,550 1,006,044 252,393 286,384
Export shipments5 150,625 146,603 180,504 38,439 56,037
Total shipments 1,011,848 982,153 1,186,548 290,832 342,421
Unit value (per tire)Commercial shipments $*** $*** $*** $*** $***
Internal consumption1 *** *** *** *** ***
Transfers to related firms3 *** *** *** *** ***
U.S. shipments4 221.90 246.97 270.45 277.23 287.76
Export shipments5 263.33 303.40 350.36 287.51 353.99
Total shipments 227.22 254.02 280.17 278.55 296.85
Unit value (per pound)Commercial shipments $*** $*** $*** $*** $***
Internal consumption1 *** *** *** *** ***
Transfers to related firms3 *** *** *** *** ***
U.S. shipments4 1.86 1.92 1.82 1.78 2.03
Export shipments5 1.93 1.99 2.14 1.93 2.20
Total shipments 1.87 1.93 1.86 1.80 2.06Table continued on next page.

III-7
Table III-6--ContinuedCertain OTR tires: U.S. producers’ shipments, by types, 2005-07, January-March 2007, andJanuary-March 2008
ItemCalendar year January-March
2005 2006 2007 2007 2008
Unit weight (pounds per tire)Commercial shipments *** *** *** *** ***
Internal consumption1 *** *** *** *** ***
Transfers to related firms3 *** *** *** *** ***
U.S. shipments4 119.0 128.9 148.5 155.6 141.5
Export shipments5 136.4 152.3 163.8 149.0 161.0
Total shipments 121.3 131.8 150.4 154.8 144.1
Share of quantity, units (percent)Commercial shipments *** *** *** *** ***
Internal consumption1 *** *** *** *** ***
Transfers to related firms3 *** *** *** *** ***
U.S. shipments4 87.2 87.5 87.8 87.2 86.3
Export shipments5 12.8 12.5 12.2 12.8 13.7
Total shipments 100.0 100.0 100.0 100.0 100.0
Share of quantity, weight (percent)Commercial shipments *** *** *** *** ***
Internal consumption1 *** *** *** *** ***
Transfers to related firms3 *** *** *** *** ***
U.S. shipments4 85.5 85.6 86.7 87.7 84.7
Export shipments5 14.5 14.4 13.3 12.3 15.3
Total shipments 100.0 100.0 100.0 100.0 100.0
Share of value (percent)Commercial shipments *** *** *** *** ***
Internal consumption1 *** *** *** *** ***
Transfers to related firms3 *** *** *** *** ***
U.S. shipments4 85.1 85.1 84.8 86.8 83.6
Export shipments5 14.9 14.9 15.2 13.2 16.4
Total shipments 100.0 100.0 100.0 100.0 100.0 1 ***. 2 Less than 500 tires. 3 ***. 4 With respect to military/Buy America sales, ***. 5 Export destinations included Australia, Canada, Latin America, Mexico, and South Africa.
Source: Compiled from data submitted in response to Commission questionnaires.

III-8
Table III-7Certain OTR tires: U.S. producers’ U.S. shipments, by application and types, 2005-07, January-March 2007,and January-March 2008
ItemCalendar year January-March
2005 2006 2007 2007 2008Quantity (1,000 tires)
Agricultural/forestry:Herringbone or similar tread >= 40.6 cm (16") *** *** *** *** ***Herringbone or similar tread < 40.6 cm (16") *** *** *** *** ***Not herringbone >= 40.6 cm (16") *** *** *** *** ***Not herringbone < 40.6 cm (16") *** *** *** *** ***
Subtotal 2,829 2,405 2,708 648 695Construction/industrial:
Herringbone < 61 cm (24") *** *** *** *** ***Herringbone >= 61 cm (24") < 99.06 cm (39") *** *** *** *** ***Radial less than 61 cm (24") *** *** *** *** ***Radial >= to 61 cm (24") < 99.06 cm (39") *** *** *** *** ***Other < 61 cm (24") *** *** *** *** ***Other >= 61 cm (24") < 99.06 cm (39") *** *** *** *** ***
Subtotal 985 906 931 235 277Off-the-highway:
Radial >= 40.6 cm (16") *** *** *** *** ***Radial < 40.6 cm (16") *** *** *** *** ***Other >= 40.6 cm (16") *** *** *** *** ***Other < 40.6 cm (16") *** *** *** *** ***
Subtotal 75 82 83 27 24Other 0 0 0 0 0
Total 3,889 3,393 3,722 910 996Quantity (1,000 pounds)
Agricultural/forestry:Herringbone or similar tread >= 40.6 cm (16") *** *** *** *** ***Herringbone or similar tread < 40.6 cm (16") *** *** *** *** ***Not herringbone >= 40.6 cm (16") *** *** *** *** ***Not herringbone < 40.6 cm (16") *** *** *** *** ***
Subtotal 305,270 274,723 368,657 92,522 95,663Construction/industrial:
Herringbone < 61 cm (24") *** *** *** *** ***Herringbone >= 61 cm (24") < 99.06 cm (39") *** *** *** *** ***Radial less than 61 cm (24") *** *** *** *** ***Radial >= to 61 cm (24") < 99.06 cm (39") *** *** *** *** ***Other < 61 cm (24") *** *** *** *** ***Other >= 61 cm (24") < 99.06 cm (39") *** *** *** *** ***
Subtotal 128,207 125,283 131,771 34,187 35,223Off-the-highway:
Radial >= 40.6 cm (16") *** *** *** *** ***Radial < 40.6 cm (16") *** *** *** *** ***Other >= 40.6 cm (16") *** *** *** *** ***Other < 40.6 cm (16") *** *** *** *** ***
Subtotal 32,349 41,236 51,720 14,980 9,833Other 0 0 0 0 0
Total 465,825 441,242 552,148 141,689 140,719Table continued on next page.

III-9
Table III-7-ContinuedCertain OTR tires: U.S. producers’ U.S. shipments, by application and type, 2005-07, January-March 2007,and January-March 2008
ItemCalendar year January-March
2005 2006 2007 2007 2008Value ($1,000)
Agricultural/forestry:Herringbone or similar tread >= 40.6 cm (16") *** *** *** *** ***Herringbone or similar tread < 40.6 cm (16") *** *** *** *** ***Not herringbone >= 40.6 cm (16") *** *** *** *** ***Not herringbone < 40.6 cm (16") *** *** *** *** ***
Subtotal 535,578 479,931 610,315 147,321 184,139Construction/industrial:
Herringbone < 61 cm (24") *** *** *** *** ***Herringbone >= 61 cm (24") < 99.06 cm (39") *** *** *** *** ***Radial less than 61 cm (24") *** *** *** *** ***Radial >= to 61 cm (24") < 99.06 cm (39") *** *** *** *** ***Other < 61 cm (24") *** *** *** *** ***Other >= 61 cm (24") < 99.06 cm (39") *** *** *** *** ***
Subtotal 244,339 262,537 266,629 69,052 73,703Off-the-highway:
Radial >= 40.6 cm (16") *** *** *** *** ***Radial < 40.6 cm (16") *** *** *** *** ***Other >= 40.6 cm (16") *** *** *** *** ***Other < 40.6 cm (16") *** *** *** *** ***
Subtotal 95,560 109,380 117,238 34,008 24,360Other 0 0 0 0 0
Total 875,478 851,848 994,182 250,381 282,202Unit value (per tire)
Agricultural/forestry:Herringbone or similar tread >= 40.6 cm (16") $*** $*** $*** $*** $***Herringbone or similar tread < 40.6 cm (16") *** *** *** *** ***Not herringbone >= 40.6 cm (16") *** *** *** *** ***Not herringbone < 40.6 cm (16") *** *** *** *** ***
Average 189.34 199.54 225.41 227.21 265.06Construction/industrial:
Herringbone < 61 cm (24") *** *** *** *** ***Herringbone >= 61 cm (24") < 99.06 cm (39") *** *** *** *** ***Radial less than 61 cm (24") *** *** *** *** ***Radial >= to 61 cm (24") < 99.06 cm (39") *** *** *** *** ***Other < 61 cm (24") *** *** *** *** ***Other >= 61 cm (24") < 99.06 cm (39") *** *** *** *** ***
Average 247.98 289.77 286.32 293.28 265.76Off-the-highway:
Radial >= 40.6 cm (16") *** *** *** *** ***Radial < 40.6 cm (16") *** *** *** *** ***Other >= 40.6 cm (16") *** *** *** *** ***Other < 40.6 cm (16") *** *** *** *** ***
Average 1,274.13 1,340.44 1,414.21 1,280.42 999.59Other 0 0 0 0 0
Average 225.12 251.07 267.13 275.02 283.22Table continued on next page.

III-10
Table III-7-ContinuedCertain OTR tires: U.S. producers’ U.S. shipments, by application and type, 2005-07, January-March 2007,and January-March 2008
ItemCalendar year January-March
2005 2006 2007 2007 2008Unit value (per pound)
Agricultural/forestry:Herringbone or similar tread >= 40.6 cm (16") $*** $*** $*** $*** $***Herringbone or similar tread < 40.6 cm (16") *** *** *** *** ***Not herringbone >= 40.6 cm (16") *** *** *** *** ***Not herringbone < 40.6 cm (16") *** *** *** *** ***
Average 1.75 1.75 1.66 1.59 1.92Construction/industrial:
Herringbone < 61 cm (24") *** *** *** *** ***Herringbone >= 61 cm (24") < 99.06 cm (39") *** *** *** *** ***Radial less than 61 cm (24") *** *** *** *** ***Radial >= to 61 cm (24") < 99.06 cm (39") *** *** *** *** ***Other < 61 cm (24") *** *** *** *** ***Other >= 61 cm (24") < 99.06 cm (39") *** *** *** *** ***
Average 1.91 2.10 2.02 2.02 2.09Off-the-highway:
Radial >= 40.6 cm (16") *** *** *** *** ***Radial < 40.6 cm (16") *** *** *** *** ***Other >= 40.6 cm (16") *** *** *** *** ***Other < 40.6 cm (16") *** *** *** *** ***
Average 2.95 2.65 2.27 2.27 2.48Other 0.0 0.0 0.0 0.0 0.0
Average 1.88 1.93 1.80 1.77 2.01Share of quantity, units (percent)
Agricultural/forestry:Herringbone or similar tread >= 40.6 cm (16") *** *** *** *** ***Herringbone or similar tread < 40.6 cm (16") *** *** *** *** ***Not herringbone >= 40.6 cm (16") *** *** *** *** ***Not herringbone < 40.6 cm (16") *** *** *** *** ***
Subtotal 72.7 70.9 72.8 71.2 69.7Construction/industrial:
Herringbone < 61 cm (24") *** *** *** *** ***Herringbone >= 61 cm (24") < 99.06 cm (39") *** *** *** *** ***Radial less than 61 cm (24") *** *** *** *** ***Radial >= to 61 cm (24") < 99.06 cm (39") *** *** *** *** ***Other < 61 cm (24") *** *** *** *** ***Other >= 61 cm (24") < 99.06 cm (39") *** *** *** *** ***
Subtotal 25.3 26.7 25.0 25.9 27.8Off-the-highway:
Radial >= 40.6 cm (16") *** *** *** *** ***Radial < 40.6 cm (16") *** *** *** *** ***Other >= 40.6 cm (16") *** *** *** *** ***Other < 40.6 cm (16") *** *** *** *** ***
Subtotal 1.9 2.4 2.2 2.9 2.4Other 0.0 0.0 0.0 0.0 0.0
Total 100.0 100.0 100.0 100.0 100.0Table continued on next page.
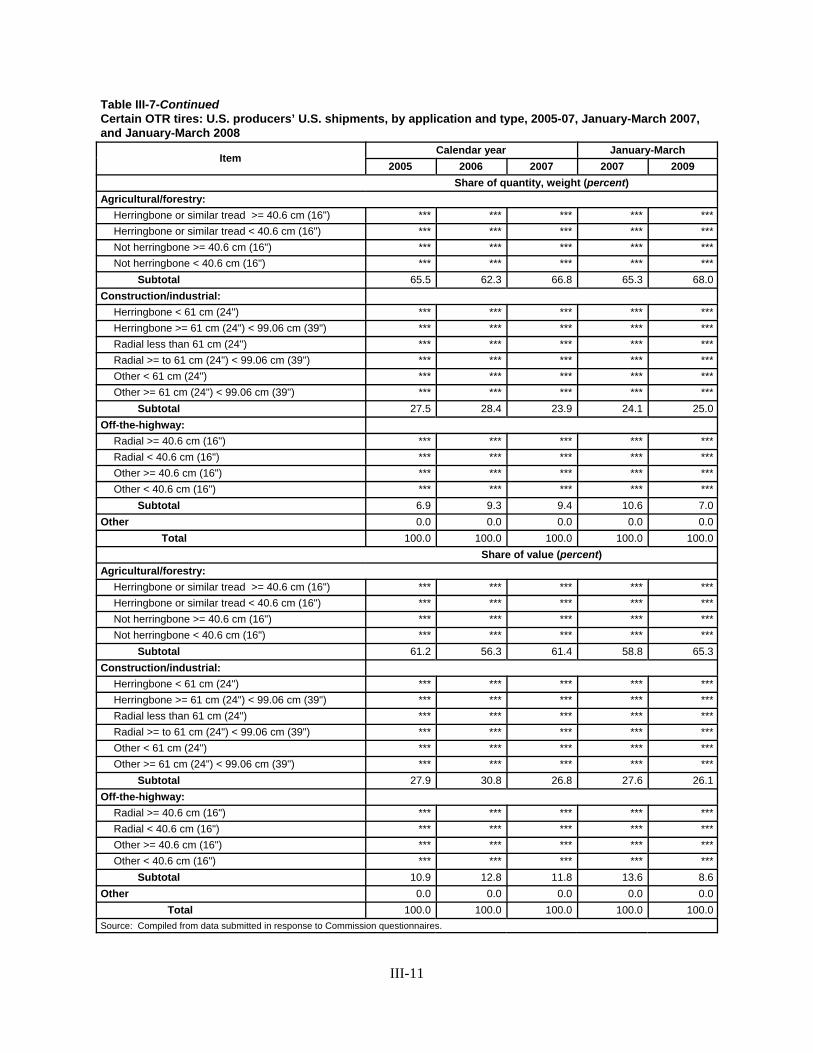
III-11
Table III-7-ContinuedCertain OTR tires: U.S. producers’ U.S. shipments, by application and type, 2005-07, January-March 2007,and January-March 2008
ItemCalendar year January-March
2005 2006 2007 2007 2009Share of quantity, weight (percent)
Agricultural/forestry:Herringbone or similar tread >= 40.6 cm (16") *** *** *** *** ***Herringbone or similar tread < 40.6 cm (16") *** *** *** *** ***Not herringbone >= 40.6 cm (16") *** *** *** *** ***Not herringbone < 40.6 cm (16") *** *** *** *** ***
Subtotal 65.5 62.3 66.8 65.3 68.0Construction/industrial:
Herringbone < 61 cm (24") *** *** *** *** ***Herringbone >= 61 cm (24") < 99.06 cm (39") *** *** *** *** ***Radial less than 61 cm (24") *** *** *** *** ***Radial >= to 61 cm (24") < 99.06 cm (39") *** *** *** *** ***Other < 61 cm (24") *** *** *** *** ***Other >= 61 cm (24") < 99.06 cm (39") *** *** *** *** ***
Subtotal 27.5 28.4 23.9 24.1 25.0Off-the-highway:
Radial >= 40.6 cm (16") *** *** *** *** ***Radial < 40.6 cm (16") *** *** *** *** ***Other >= 40.6 cm (16") *** *** *** *** ***Other < 40.6 cm (16") *** *** *** *** ***
Subtotal 6.9 9.3 9.4 10.6 7.0Other 0.0 0.0 0.0 0.0 0.0
Total 100.0 100.0 100.0 100.0 100.0Share of value (percent)
Agricultural/forestry:Herringbone or similar tread >= 40.6 cm (16") *** *** *** *** ***Herringbone or similar tread < 40.6 cm (16") *** *** *** *** ***Not herringbone >= 40.6 cm (16") *** *** *** *** ***Not herringbone < 40.6 cm (16") *** *** *** *** ***
Subtotal 61.2 56.3 61.4 58.8 65.3Construction/industrial:
Herringbone < 61 cm (24") *** *** *** *** ***Herringbone >= 61 cm (24") < 99.06 cm (39") *** *** *** *** ***Radial less than 61 cm (24") *** *** *** *** ***Radial >= to 61 cm (24") < 99.06 cm (39") *** *** *** *** ***Other < 61 cm (24") *** *** *** *** ***Other >= 61 cm (24") < 99.06 cm (39") *** *** *** *** ***
Subtotal 27.9 30.8 26.8 27.6 26.1Off-the-highway:
Radial >= 40.6 cm (16") *** *** *** *** ***Radial < 40.6 cm (16") *** *** *** *** ***Other >= 40.6 cm (16") *** *** *** *** ***Other < 40.6 cm (16") *** *** *** *** ***
Subtotal 10.9 12.8 11.8 13.6 8.6Other 0.0 0.0 0.0 0.0 0.0
Total 100.0 100.0 100.0 100.0 100.0Source: Compiled from data submitted in response to Commission questionnaires.
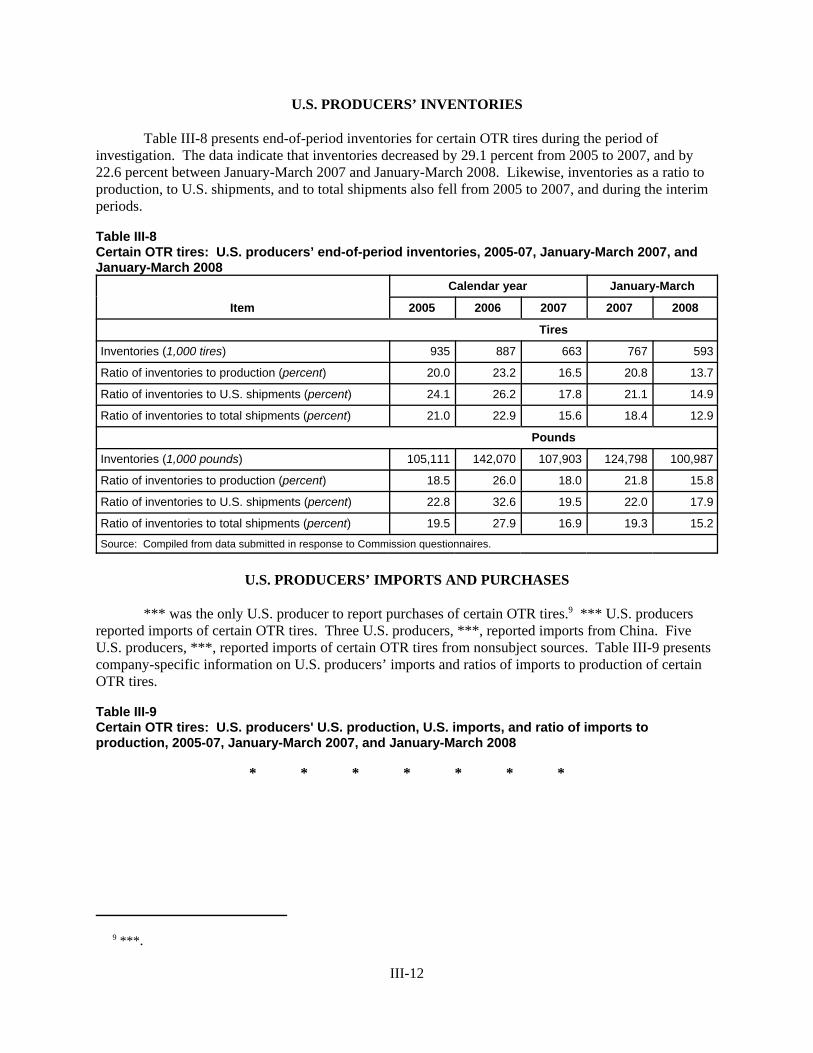
9 ***.
III-12
U.S. PRODUCERS’ INVENTORIES
Table III-8 presents end-of-period inventories for certain OTR tires during the period ofinvestigation. The data indicate that inventories decreased by 29.1 percent from 2005 to 2007, and by22.6 percent between January-March 2007 and January-March 2008. Likewise, inventories as a ratio toproduction, to U.S. shipments, and to total shipments also fell from 2005 to 2007, and during the interimperiods.
Table III-8Certain OTR tires: U.S. producers’ end-of-period inventories, 2005-07, January-March 2007, andJanuary-March 2008
Item
Calendar year January-March
2005 2006 2007 2007 2008
Tires
Inventories (1,000 tires) 935 887 663 767 593
Ratio of inventories to production (percent) 20.0 23.2 16.5 20.8 13.7
Ratio of inventories to U.S. shipments (percent) 24.1 26.2 17.8 21.1 14.9
Ratio of inventories to total shipments (percent) 21.0 22.9 15.6 18.4 12.9
Pounds
Inventories (1,000 pounds) 105,111 142,070 107,903 124,798 100,987
Ratio of inventories to production (percent) 18.5 26.0 18.0 21.8 15.8
Ratio of inventories to U.S. shipments (percent) 22.8 32.6 19.5 22.0 17.9
Ratio of inventories to total shipments (percent) 19.5 27.9 16.9 19.3 15.2
Source: Compiled from data submitted in response to Commission questionnaires.
U.S. PRODUCERS’ IMPORTS AND PURCHASES
*** was the only U.S. producer to report purchases of certain OTR tires.9 *** U.S. producersreported imports of certain OTR tires. Three U.S. producers, ***, reported imports from China. FiveU.S. producers, ***, reported imports of certain OTR tires from nonsubject sources. Table III-9 presentscompany-specific information on U.S. producers’ imports and ratios of imports to production of certainOTR tires.
Table III-9Certain OTR tires: U.S. producers' U.S. production, U.S. imports, and ratio of imports toproduction, 2005-07, January-March 2007, and January-March 2008
* * * * * * *
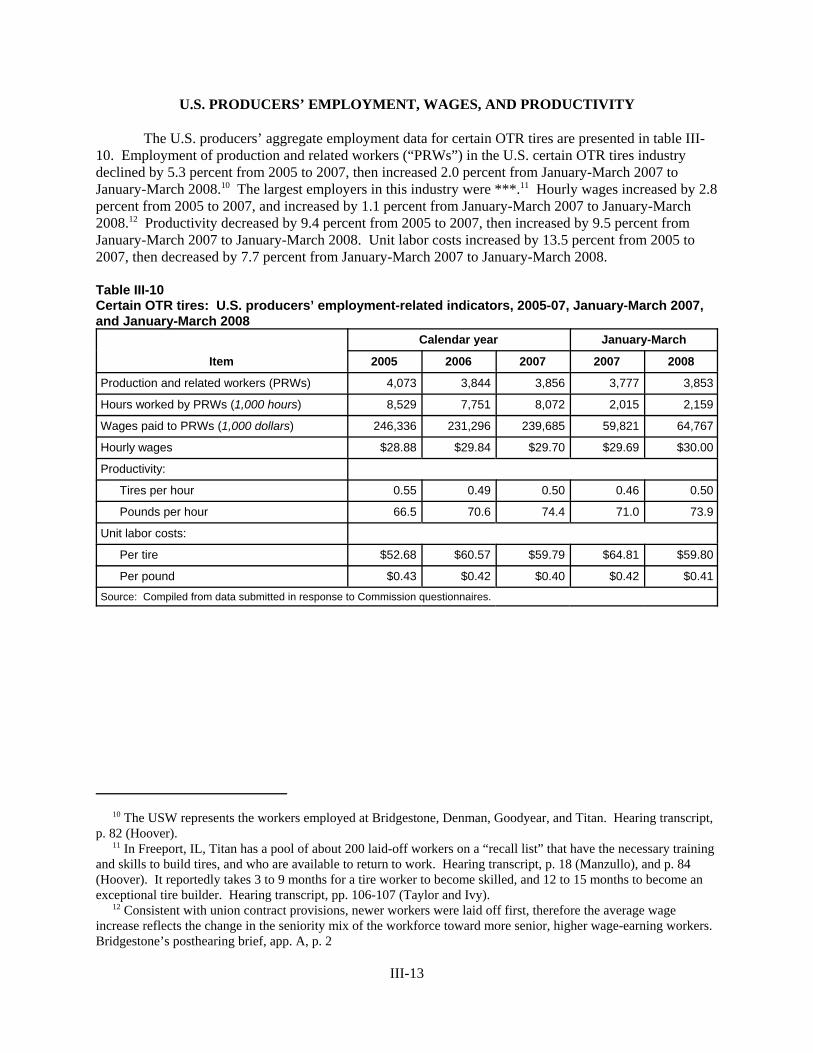
10 The USW represents the workers employed at Bridgestone, Denman, Goodyear, and Titan. Hearing transcript,p. 82 (Hoover). 11 In Freeport, IL, Titan has a pool of about 200 laid-off workers on a “recall list” that have the necessary trainingand skills to build tires, and who are available to return to work. Hearing transcript, p. 18 (Manzullo), and p. 84(Hoover). It reportedly takes 3 to 9 months for a tire worker to become skilled, and 12 to 15 months to become anexceptional tire builder. Hearing transcript, pp. 106-107 (Taylor and Ivy). 12 Consistent with union contract provisions, newer workers were laid off first, therefore the average wageincrease reflects the change in the seniority mix of the workforce toward more senior, higher wage-earning workers. Bridgestone’s posthearing brief, app. A, p. 2
III-13
U.S. PRODUCERS’ EMPLOYMENT, WAGES, AND PRODUCTIVITY
The U.S. producers’ aggregate employment data for certain OTR tires are presented in table III-10. Employment of production and related workers (“PRWs”) in the U.S. certain OTR tires industrydeclined by 5.3 percent from 2005 to 2007, then increased 2.0 percent from January-March 2007 toJanuary-March 2008.10 The largest employers in this industry were ***.11 Hourly wages increased by 2.8percent from 2005 to 2007, and increased by 1.1 percent from January-March 2007 to January-March2008.12 Productivity decreased by 9.4 percent from 2005 to 2007, then increased by 9.5 percent fromJanuary-March 2007 to January-March 2008. Unit labor costs increased by 13.5 percent from 2005 to2007, then decreased by 7.7 percent from January-March 2007 to January-March 2008.
Table III-10Certain OTR tires: U.S. producers’ employment-related indicators, 2005-07, January-March 2007,and January-March 2008
Item
Calendar year January-March
2005 2006 2007 2007 2008
Production and related workers (PRWs) 4,073 3,844 3,856 3,777 3,853
Hours worked by PRWs (1,000 hours) 8,529 7,751 8,072 2,015 2,159
Wages paid to PRWs (1,000 dollars) 246,336 231,296 239,685 59,821 64,767
Hourly wages $28.88 $29.84 $29.70 $29.69 $30.00
Productivity:
Tires per hour 0.55 0.49 0.50 0.46 0.50
Pounds per hour 66.5 70.6 74.4 71.0 73.9
Unit labor costs:
Per tire $52.68 $60.57 $59.79 $64.81 $59.80
Per pound $0.43 $0.42 $0.40 $0.42 $0.41
Source: Compiled from data submitted in response to Commission questionnaires.

III-14
U.S. CAPACITY, PRODUCTION, AND CAPACITY UTILIZATION OFNONSUBJECT OTR CONSTRUCTION AND MINING TIRES
Four U.S. producers of certain OTR tires reported production of OTR tires of greater than orequal to 39 inches in rim diameter, ***. U.S. producers’ capacity, production, and capacity utilizationdata for OTR tires of greater than or equal to 39 inches in rim diameter are presented in table III-11. These data show an increase in the capacity to produce OTR tires of greater than or equal to 39 inches inrim diameter (based on units) of *** percent from 2005 to 2007, and an increase of *** percent fromJanuary-March 2007 to January-March 2008. Production of OTR tires of greater than or equal to 39inches in rim diameter (based on units) increased by *** percent from 2005 to 2007, and increased by ***percent from January-March 2007 to January-March 2008. Capacity utilization (based on units)increased by *** percentage points from 2005 to 2007 and decreased by *** percentage point fromJanuary-March 2007 to January-March 2008.
Table III-11OTR tires >= 39 inches in rim diameter: U.S. capacity, production, and capacity utilization, 2005-07, January-March 2007, and January-March 2008
* * * * * * *
U.S. PRODUCERS’ SHIPMENTS OF NONSUBJECT OTR CONSTRUCTION AND MINING TIRES
Table III-12 presents information on U.S. producers’ shipments of OTR tires of greater than orequal to 39 inches in rim diameter. U.S. producers’ U.S. shipments increased by *** percent from 2005to 2007 based on units, while the average unit value increased by *** percent and unit weight increasedby *** percent. From January-March 2007 to January-March 2008, U.S. shipments (in units) decreasedby *** percent, average unit value increased by *** percent, and the unit weight increased by ***percent.
Table III-12OTR tires >= 39 inches in rim diameter: U.S. producers’ shipments, by types, 2005-07, January-March 2007, and January-March 2008
* * * * * * *
U.S. PRODUCERS’ INVENTORIES OFNONSUBJECT OTR CONSTRUCTION AND MINING TIRES
Table III-13 presents end-of-period inventories of OTR tires of greater than or equal to 39 inchesin rim diameter during the period of investigation. The data indicate that inventories (in units) increasedby *** percent from 2005 to 2007, and by *** percent between January-March 2007 and January-March2008. Likewise, inventories (in units) as a ratio to production, to U.S. shipments, and to total shipmentsalso increased from 2005 to 2007, and during the interim periods.
Table III-13OTR tires >= 39 inches of rim diameter: U.S. producers’ end-of-period inventories, 2005-07,January-March 2007, and January-March 2008
* * * * * * *
III-15
U.S. PRODUCERS’ EMPLOYMENT, WAGES, AND PRODUCTIVITY OFNONSUBJECT OTR CONSTRUCTION AND MINING TIRES
The U.S. producers’ aggregate employment data for OTR tires of greater than or equal to 39inches in rim diameter are presented in table III-14. Employment of production and related workers(“PRWs”) in the U.S. certain OTR tires industry increased by *** percent from 2005 to 2007, andincreased by *** percent from January-March 2007 to January-March 2008. Hourly wages increased by*** percent from 2005 to 2007, and decreased by *** percent from January-March 2007 to January-March 2008. Unit labor costs (per tire) decreased by *** percent from 2005 to 2007, then increased by*** percent from January-March 2007 to January-March 2008.
Table III-14OTR tires >= 39 inches in rim diameter: U.S. producers’ employment-related indicators, 2005-07,January-March 2007, and January-March 2008
* * * * * * *
U.S. CAPACITY, PRODUCTION, AND CAPACITY UTILIZATION OFCERTAIN OTR TIRES AND NONSUBJECT OTR CONSTRUCTION AND MINING TIRES
U.S. producers’ capacity, production, and capacity utilization data for certain OTR tires and OTRtires of greater than or equal to 39 inches in rim diameter are presented in table III-15.
Table III-15Certain OTR tires and OTR tires >= 39 inches in rim diameter: U.S. capacity, production, andcapacity utilization, 2005-07, January-March 2007, and January-March 2008
* * * * * * *
U.S. PRODUCERS’ SHIPMENTS OF CERTAIN OTR TIRES AND NONSUBJECT OTR CONSTRUCTION AND MINING TIRES
Table III-16 presents information on U.S. producers’ shipments of certain OTR tires and OTRtires of greater than or equal to 39 inches in rim diameter.
Table III-16Certain OTR tires and OTR tires >= 39 inches in rim diameter: U.S. producers’ shipments, bytypes, 2005-07, January-March 2007, and January-March 2008
* * * * * * *
III-16
U.S. PRODUCERS’ INVENTORIES OFCERTAIN OTR TIRES AND NONSUBJECT OTR CONSTRUCTION AND MINING TIRES
Table III-17 presents end-of-period inventories for certain OTR tires and OTR tires of greaterthan or equal to 39 inches in rim diameter during the period of investigation.
Table III-17Certain OTR tires and OTR tires >= 39 inches of rim diameter: U.S. producers’ end-of-periodinventories, 2005-07, January-March 2007, and January-March 2008
* * * * * * *
U.S. PRODUCERS’ EMPLOYMENT, WAGES, AND PRODUCTIVITY OFCERTAIN OTR TIRES AND NONSUBJECT OTR CONSTRUCTION AND MINING TIRES
The U.S. producers’ aggregate employment data for certain OTR tires and OTR tires of greaterthan or equal to 39 inches in rim diameter are presented in table III-18.
Table III-18Certain OTR tires and OTR tires >= 39 inches in rim diameter: U.S. producers’ employment-relatedindicators, 2005-07, January-March 2007, and January-March 2008
* * * * * * *

1 Nine firms, *** reported that they did not import the subject merchandise during the period of investigation. 2 The Commission received an incomplete questionnaire response from ***.
IV-1
PART IV: U.S. IMPORTS, APPARENT U.S. CONSUMPTION, AND MARKET SHARES
U.S. IMPORTERS
The Commission sent importer questionnaires to 75 firms believed to be importers of certainOTR tires as well as all U.S. producers of certain OTR tires.1 Usable questionnaire responses werereceived from 34 companies that are believed to account for *** percent of the quantity of U.S. importsfrom China, and *** percent of U.S. imports from other countries during the period for which data werecollected.2 In 2007, *** was the largest importer of certain OTR tires from China and the largest importerof certain OTR tires from other sources. Presented in table IV-1 are the responding 36 U.S. importers and2007 coverage based on responses to Commission questionnaires.
Table IV-1Certain OTR tires: U.S. importers, locations, related and/or affiliated firms, and shares of importsfrom China and other sources in 2007
Firm name Location Related/affiliated firm(s)
Share of 2007 reported U.S. importsfrom--
China(percent)
Othersources(percent)
Allsources(percent)
Allied Wheel Garden Grove,CA
None. *** *** ***
American KendaRubber Ind., Co.
Chicago, IL Kenda Rubber Ind. Co., Ltd. (Taiwan) *** *** ***
American OmniTrading Company
Houston, TX None. *** *** ***
American PacificIndustries, Inc.
Valencia, CA Xuzhou Xugong Tyres (China)Xuzhou Armour Rubber (China)
*** *** ***
BlueOcean Rubber &Chemicals Inc.
Missouri City,TX
None. *** *** ***
BridgestoneFirestone NorthAmerican Tire, LLC
Nashville, TN Bridgestone Americas Holding, Inc (USA).GCR Tire CentersBridgestone Corporation (Japan)Bridgestone Firestone Argentina S.A.I.C.(Argentina)Bridgestone Firestone Do Brasil Industria EComercio Ltda. (Brazil)Bridgestone Firestone De Costa Rica, S.A.(Costa Rica)P.T. Bridgestone Tire Indonesia (Indonesia)Bridgestone Firestone de Mexico, S.A. DE C.V.(Mexico)Bridgestone South Africa Holdings (Pty) Ltd.(South Africa)Bridgestone Hispania, S.A. (Spain)Brisa Bridgestone Sabanci Lastik Sanayi VeTicaret A.S. (Turkey)
*** *** ***
Table continued on next page.

IV-2
Table IV-1--ContinuedCertain OTR tires: U.S. importers, locations, related and/or affiliated firms, and shares of importsfrom China and other sources in 2007
Firm name Location Related/affiliated firm(s)
Share of 2007 reported U.S.imports from--
China(percent)
Othersources(percent)
Allsources(percent)
BridgestoneFirestone Retailand CommercialOperations, LLC(“GCR Tire”)
Austin, TX Bridgestone Americas Holding, Inc.Bridgestone Firestone North AmericanTireBridgestone Corporation (Japan)Bridgestone Firestone Argentina S.A.I.C.(Argentina)Bridgestone Firestone Do Brasil IndustriaE Comercio Ltda. (Brazil)Bridgestone Firestone De Costa Rica,S.A. (Costa Rica)P.T. Bridgestone Tire Indonesia(Indonesia)Bridgestone Firestone de Mexico, S.A. DEC.V. (Mexico)Bridgestone South Africa Holdings (Pty)Ltd. (South Africa)Bridgestone Hispania, S.A. (Spain)Brisa Bridgestone Sabanci Lastik SanayiVe Ticaret A.S. (Turkey)
*** *** ***
Carlisle Tire &Wheel Company
Aiken, SC Carlisle Companies Inc. (USA) Carlisle (Meizhou) Rubber ManufacturingCompany Ltd (China)
*** *** ***
CGS Tires US, Inc. Charlotte, NC Ceska Gumarenska Spolencnosj, a.s.(The Czech Republic)
*** *** ***
Cheng ShinRubber USA(“Maxxis”)
Suwanee, GA Cheng Shin Rubber Ind., Co., Ltd.(Taiwan) (“Cheng Shin”)Cheng Shin Toyo Tire & Rubber Ind., Co.,Ltd. (China)Cheng Shin Petrel Tire Co., Ltd. (China)
*** *** ***
ChinaManufacturersAlliance, LLC
Monrovia, CA Double Coin Holdings (China)
International New Market (China)*** *** ***
Denman TireCorporation
Leavittsburg,OH
*** *** *** ***
Dunlap and KyleCo., Inc.
Batesville,MS
None. *** *** ***
Duramax, Inc. City ofIndustry, CA
None. *** *** ***
Equipment Finders Ft. Lupton,CO
W.W.F., Inc. (USA) *** *** ***
Foreign Tire Sales Union, NJ None. *** *** ***Goodyear Tire &Rubber Company
Akron, OH Goodyear International Corp. *** *** ***
GPX InternationalTire Corporation
Malden, MA Sterling Investment Partners, LPHebei StarBright Tire Co., Ltd. (China)
*** *** ***
Greenball Corp. Long Beach,CA
None. *** *** ***
Table continued on next page.

IV-3
Table IV-1--ContinuedCertain OTR tires: U.S. importers, locations, related and/or affiliated firms, and shares of importsfrom China and other sources in 2007
Firm name Location Related/affiliated firm(s)
Share of 2007 reported U.S.imports from--
China(percent)
Othersources(percent)
Allsources(percent)
Guizhou Tyre I/ECorp. NorthAmerica
Gyiyan,Guizhou
Guizhou Tyre Co., Ltd. (China)Tire Engineerign & DistributionGuizhou Advance Rubber
*** *** ***
LQJ Global Tyre,Inc
City ofIndustry, CA
None. *** *** ***
Michelin NorthAmerica
Greenville,SC
Michelin CorporationMichelin North America (Canada) Inc.(Canada)Manufacture Francaise desPneumatiques Michelin (France)Michelin Hungaria Tyre Manufacture Ltd.(Hungary)Michelin Polska S.A. (Poland)Silvania S.A. (Romania)Michelin Espana Portugal, S.A. (Portugal)
*** *** ***
National Logisticsand Support LCC
Salt LakeCity, UT
None. *** *** ***
OTR WheelEngineering, Inc.
Rome, GA Blackstone OTR, LLC. *** *** ***
Paska, Inc. Kenner, LA None. *** *** ***Solideal USA Charlotte, NC Swan International
World Tyres Ltd. (Hong Kong)*** *** ***
Strategic ImportSupply
Minnetonka,MN
None. *** *** ***
Super GripCorporation
Piney Flats,TN
None. *** *** ***
Sutong China TireResources, Inc.
Houston, TX None. *** *** ***
Tire Engineering &Distribution, Inc.
NorthLawrence,OH
Guizhou Tyre Co., Ltd. (China)Guizhou Advance Rubber
*** *** ***
Titan TireCorporation
Des Moines,IA
Titan International *** *** ***
Toyo TireInternational, Inc.
Cypress, CA Toyo Tire & Rubber Co., Ltd. (Japan) *** *** ***
Trelleborg WheelSystems Americas,Inc.
Hartville, OH
Trelleborg Corporation (USA)
*** *** ***
The Trillium Group Akron, OH None. *** *** ***Tyres International,Inc.
Stow, OH None. *** *** ***
Valmont Industries,Inc.
Omaha, NE None. *** *** ***
Total 100.0 100.0 100.0Source: Compiled from data submitted in response to Commission questionnaires and official Commerce statistics, adjusted.

3 The petition (as revised) excluded from the scope OTR tires used on mining and construction vehicles andequipment that have a rim diameter equal to or exceeding 39 inches, with a weight of 1,500 pounds or more. Petitioners’ response to Commerce’s second supplemental questionnaire, June 27, 2007, pp. 6-9. 4 Petitioners originally recommended removing OTR tires less than $20 per unit, which was done in theprehearing report methodology. During the Commission’s hearing they proposed raising the per-unit cutoff to $25,and in their posthearing brief they proposed raising the per-unit cutoff to $35. Import data adjusted as describedabove, with the per-unit cutoff at $35 (as well as apparent consumption using import data with the per-unit cutoff at$35) is presented in app. E. 5 The methodology of calculating the unit values of less than $25 per unit and the per unit shipping weight ofgreater than 1,500 pounds differs slightly from the methodology used in the preliminary phase of the investigation. In the preliminary phase, the exclusion categories were applied to data aggregated by importer, country, and entrymonth, while in the final phase, the exclusion categories were applied to the data on a less aggregated basis, i.e., byimporter, consignee, foreign manufacturer, country, entry month, HTS number, and Customs entry district. (Container shipping weight was used as a surrogate for product weight because Customs did not collect productweight upon entry for merchandise under the applicable statistical reporting numbers.) 6 With respect to the question of negligible imports (section 771(24)(A)(i) of the Act), the share of total importsof certain OTR tires from China during the most recent 12-month period for which data are available that precedesthe filing of the petition (June 2006 through May 2007), was well above the 3-percent negligibility threshold. 7 Import data from questionnaire responses (as well as apparent consumption using import data fromquestionnaires) are presented in app. E. 8 A majority of the remainder comes from Sri Lanka, Taiwan, and Thailand.
IV-4
U.S. IMPORTS
U.S. imports represent the sum of data from questionnaire responses of 34 importers and officialCommerce statistics that were modified to exclude: (1) the 34 firms that returned usable importerquestionnaires, (2) the nine firms that reported they did not import subject merchandise ormining/construction tires during the period of investigation, (3) out-of-scope imports of OTR tires thatweigh more than 1,500 pounds per tire,3 and (4) out-of-scope imports of OTR tires less than $25 per unit.4 5 6 U.S. imports of certain OTR tires are presented in table IV-2.7 China is the largest foreignsupplier of certain OTR tires to the United States, accounting for 57.4 percent of the quantity of totalimports in 2007, and 35.8 percent of the value.8 Table IV-3 presents imports of certain OTR tires withquestionnaire data and adjusted CNIF data presented separately.
The quantity of imports of certain OTR tires from China increased by 0.2 percent from 2005 to2007, and decreased by 27.3 percent in January-March 2008 compared with January-March 2007. Thevalue of imports of certain OTR tires from China increased by 48.3 percent from 2005 to 2007, and decreased by 37.6 percent in January-March 2008 compared with January-March 2007. The unit value ofimports of certain OTR tires from China increased by 48.0 percent from 2005 to 2007, and decreased by14.2 percent in January-March 2008 compared with January-March 2007. The quantity of imports ofcertain OTR tires from other countries decreased by 1.6 percent from 2005 to 2007, and decreased by 5.6percent in January-March 2008 compared with January-March 2007. The value of imports of certainOTR tires from other countries increased by 37.3 percent from 2005 to 2007, and increased by 17.8percent in January-March 2008 compared with January-March 2007. The unit value of imports of certainOTR tires from other countries increased by 39.4 percent from 2005 to 2007, and increased by 24.8percent in January-March 2008 compared with January-March 2007.
U.S. imports of certain OTR tires by industry applications are presented in table IV-4. Themajority of U.S. imports from China were for construction/industrial applications which accounted for58.3 percent based on quantity (units) and 54.7 percent based on value of total U.S. imports from Chinaduring 2007.

IV-5
Table IV-2Certain OTR tires: U.S. imports, by sources, 2005-07, January-March 2007, and January-March2008
ItemCalendar year January-March
2005 2006 2007 2007 2008Quantity (1,000 tires)
China 2,333 2,521 2,337 523 380Nonsubject sources 1,760 1,831 1,733 473 447
Total 4,093 4,352 4,070 997 827Value (1,000 dollars)1
China 190,444 287,316 282,390 70,037 43,692Nonsubject sources 368,629 435,633 505,975 117,896 138,851
Total 559,073 722,949 788,365 187,933 182,543Unit value (per tire)
China $81.63 $113.97 $120.84 $133.82 $114.88Nonsubject sources 209.41 237.89 292.00 248.99 310.77
Average 136.59 166.11 193.72 188.52 220.69Share of quantity (percent)
China 57.0 57.9 57.4 52.5 46.0Nonsubject sources 43.0 42.1 42.6 47.5 54.0
Total 100.0 100.0 100.0 100.0 100.0Share of value (percent)
China 34.1 39.7 35.8 37.3 23.9Nonsubject sources 65.9 60.3 64.2 62.7 76.1
Total 100.0 100.0 100.0 100.0 100.01 Landed, duty-paid.
Source: Compiled from data submitted in response to Commission questionnaires and from official Commerce statistics,adjusted.

IV-6
Table IV-3Certain OTR tires: U.S. imports, by sources, 2005-07, January-March 2007, and January-March2008
ItemCalendar year January-March
2005 2006 2007 2007 2008Quantity (1,000 tires)
China:Commission questionnaires 825 1,079 1,403 325 237Adjusted CNIF data 1,508 1,442 934 199 144
Total 2,333 2,521 2,337 523 380Nonsubject sources:
Commission questionnaires 1,087 1,183 1,163 308 357Adjusted CNIF data 673 649 569 166 90
Total 1,760 1,831 1,733 473 447Total:
Commission questionnaires 1,912 2,262 2,567 632 593Adjusted CNIF data 2,181 2,091 1,503 365 234
Total 4,093 4,352 4,070 997 827Value (1,000 dollars)1
China:Commission questionnaires 84,907 175,618 187,347 45,216 32,505Adjusted CNIF data 105,537 111,698 95,043 24,821 11,187
Total 190,444 287,316 282,390 70,037 43,692Nonsubject sources:
Commission questionnaires 265,426 294,816 362,099 81,983 106,441Adjusted CNIF data 103,203 140,816 143,876 35,913 32,411
Total 368,629 435,633 505,975 117,896 138,851Total:
Commission questionnaires 350,333 470,435 549,446 127,199 138,946Adjusted CNIF data 208,739 252,514 238,919 60,734 43,598
Total 559,073 722,949 788,365 187,933 182,543Unit value (per tire)
China:Commission questionnaires $102.89 $162.78 $133.52 $139.30 $137.27Adjusted CNIF data 70.00 77.45 101.79 124.86 77.93
Average 81.63 113.97 120.84 133.82 114.88Nonsubject sources:
Commission questionnaires 244.15 249.28 311.25 266.51 298.56Adjusted CNIF data 153.31 217.13 252.68 216.49 358.99
Averagel 209.41 237.89 292.00 248.99 310.77Total:
Commission questionnaires 183.20 208.02 214.08 201.20 234.19Adjusted CNIF data 95.71 120.78 158.95 166.54 186.45
Average 136.59 166.11 193.72 188.52 220.691 Landed, duty-paid.
Source: Compiled from data submitted in response to Commission questionnaires and from official Commerce statistics,adjusted.
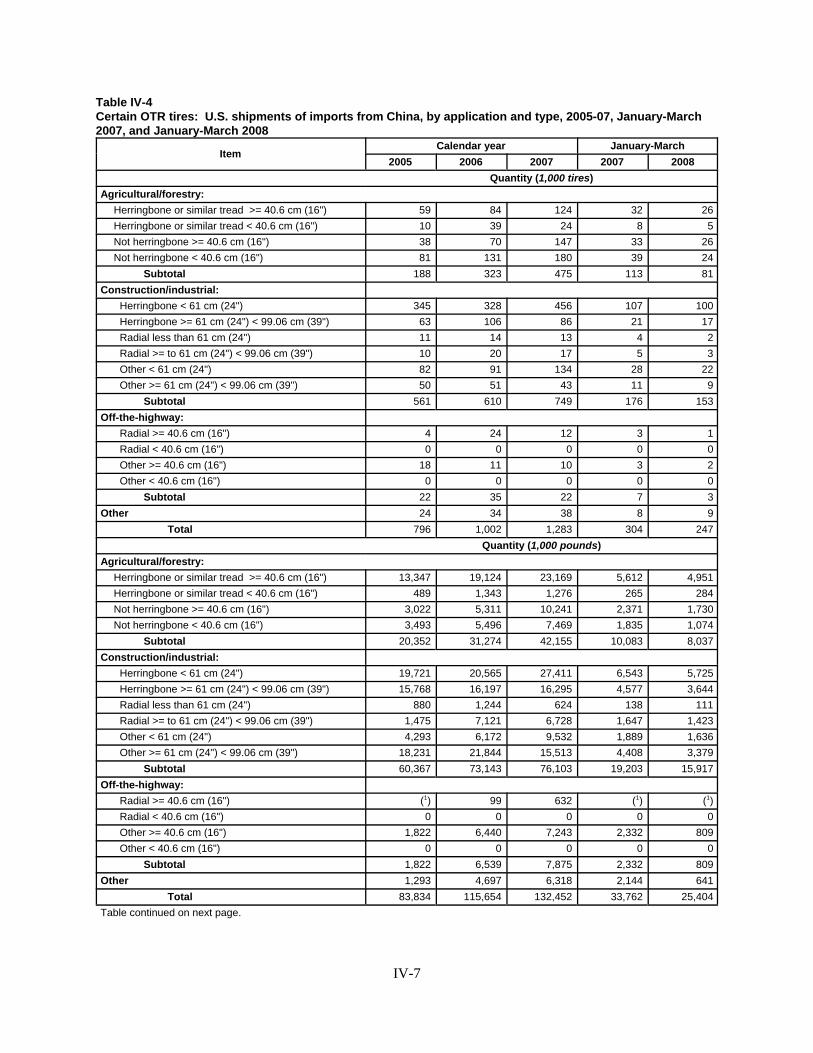
IV-7
Table IV-4Certain OTR tires: U.S. shipments of imports from China, by application and type, 2005-07, January-March2007, and January-March 2008
ItemCalendar year January-March
2005 2006 2007 2007 2008Quantity (1,000 tires)
Agricultural/forestry:Herringbone or similar tread >= 40.6 cm (16") 59 84 124 32 26Herringbone or similar tread < 40.6 cm (16") 10 39 24 8 5Not herringbone >= 40.6 cm (16") 38 70 147 33 26Not herringbone < 40.6 cm (16") 81 131 180 39 24
Subtotal 188 323 475 113 81Construction/industrial:
Herringbone < 61 cm (24") 345 328 456 107 100Herringbone >= 61 cm (24") < 99.06 cm (39") 63 106 86 21 17Radial less than 61 cm (24") 11 14 13 4 2Radial >= to 61 cm (24") < 99.06 cm (39") 10 20 17 5 3Other < 61 cm (24") 82 91 134 28 22Other >= 61 cm (24") < 99.06 cm (39") 50 51 43 11 9
Subtotal 561 610 749 176 153Off-the-highway:
Radial >= 40.6 cm (16") 4 24 12 3 1Radial < 40.6 cm (16") 0 0 0 0 0Other >= 40.6 cm (16") 18 11 10 3 2Other < 40.6 cm (16") 0 0 0 0 0
Subtotal 22 35 22 7 3Other 24 34 38 8 9
Total 796 1,002 1,283 304 247Quantity (1,000 pounds)
Agricultural/forestry:Herringbone or similar tread >= 40.6 cm (16") 13,347 19,124 23,169 5,612 4,951Herringbone or similar tread < 40.6 cm (16") 489 1,343 1,276 265 284Not herringbone >= 40.6 cm (16") 3,022 5,311 10,241 2,371 1,730Not herringbone < 40.6 cm (16") 3,493 5,496 7,469 1,835 1,074
Subtotal 20,352 31,274 42,155 10,083 8,037Construction/industrial:
Herringbone < 61 cm (24") 19,721 20,565 27,411 6,543 5,725Herringbone >= 61 cm (24") < 99.06 cm (39") 15,768 16,197 16,295 4,577 3,644Radial less than 61 cm (24") 880 1,244 624 138 111Radial >= to 61 cm (24") < 99.06 cm (39") 1,475 7,121 6,728 1,647 1,423Other < 61 cm (24") 4,293 6,172 9,532 1,889 1,636Other >= 61 cm (24") < 99.06 cm (39") 18,231 21,844 15,513 4,408 3,379
Subtotal 60,367 73,143 76,103 19,203 15,917Off-the-highway:
Radial >= 40.6 cm (16") (1) 99 632 (1) (1)Radial < 40.6 cm (16") 0 0 0 0 0Other >= 40.6 cm (16") 1,822 6,440 7,243 2,332 809Other < 40.6 cm (16") 0 0 0 0 0
Subtotal 1,822 6,539 7,875 2,332 809Other 1,293 4,697 6,318 2,144 641
Total 83,834 115,654 132,452 33,762 25,404Table continued on next page.

IV-8
Table IV-4-ContinuedCertain OTR tires: U.S. shipments of imports from China, by application and type, 2005-07, January-March2007, and January-March 2008
ItemCalendar year January-March
2005 2006 2007 2007 2008Value ($1,000)
Agricultural/forestry:Herringbone or similar tread >= 40.6 cm (16") 17,831 26,450 33,985 7,877 8,319Herringbone or similar tread < 40.6 cm (16") 725 3,212 2,065 760 381Not herringbone >= 40.6 cm (16") 3,108 5,682 10,773 2,455 2,210Not herringbone < 40.6 cm (16") 3,407 6,491 10,119 2,666 1,727
Subtotal 25,072 41,834 56,943 13,758 12,637Construction/industrial:
Herringbone < 61 cm (24") 19,681 24,239 34,535 7,558 9,114Herringbone >= 61 cm (24") < 99.06 cm (39") 17,732 20,237 21,826 5,923 5,294Radial less than 61 cm (24") 1,262 2,019 1,992 520 313Radial >= to 61 cm (24") < 99.06 cm (39") 2,830 17,899 15,899 3,883 3,460Other < 61 cm (24") 4,340 7,645 11,621 2,330 2,480Other >= 61 cm (24") < 99.06 cm (39") 28,493 34,831 29,912 8,196 6,468
Subtotal 74,337 106,871 115,785 28,411 27,129Off-the-highway:
Radial >= 40.6 cm (16") 2,674 24,494 19,394 5,300 1,710Radial < 40.6 cm (16") 0 0 0 0 0Other >= 40.6 cm (16") 5,523 8,486 9,895 3,189 1,062Other < 40.6 cm (16") 0 0 0 0 0
Subtotal 8,197 32,980 29,288 8,489 2,772Other 2,112 7,064 9,647 3,233 1,152
Total 109,718 188,749 211,663 53,891 43,690Unit value (per tire)
Agricultural/forestry:Herringbone or similar tread >= 40.6 cm (16") $304.02 $316.57 $274.70 $244.79 $324.72Herringbone or similar tread < 40.6 cm (16") 69.84 82.85 84.58 91.87 74.42Not herringbone >= 40.6 cm (16") 81.45 81.05 73.24 73.45 84.16Not herringbone < 40.6 cm (16") 42.02 49.68 56.19 67.79 70.73
Average 133.16 129.49 119.80 121.54 155.23Construction/industrial:
Herringbone < 61 cm (24") 57.06 73.82 75.71 70.57 91.38Herringbone >= 61 cm (24") < 99.06 cm (39") 280.50 191.67 254.97 285.82 303.31Radial less than 61 cm (24") 110.18 144.93 154.08 120.12 207.48Radial >= to 61 cm (24") < 99.06 cm (39") 283.34 877.89 934.41 735.85 1,085.51Other < 61 cm (24") 52.75 84.01 86.81 84.13 110.34Other >= 61 cm (24") < 99.06 cm (39") 574.06 680.51 695.20 757.67 737.74
Average 132.40 175.07 154.67 161.47 177.16Off-the-highway:
Radial >= 40.6 cm (16") 639.78 1,021.85 1,682.03 1,610.94 1,692.77Radial < 40.6 cm (16") (2) (2) (2) (2) (2)Other >= 40.6 cm (16") 309.75 800.84 958.78 986.79 467.83Other < 40.6 cm (16") (2) (2) (2) (2) (2)
Average 372.42 954.09 1,340.43 1,301.64 844.91Other 88.54 208.75 256.22 408.21 131.91
Average 137.91 188.39 164.92 177.52 177.20Table continued on next page.

IV-9
Table IV-4-ContinuedCertain OTR tires: U.S. shipments of imports from China, by application and type, 2005-07, January-March2007, and January-March 2008
ItemCalendar year January-March
2005 2006 2007 2007 2008Unit value (per pound)
Agricultural/forestry:Herringbone or similar tread >= 40.6 cm (16") $1.34 $1.38 $1.47 $1.40 $1.68Herringbone or similar tread < 40.6 cm (16") 1.48 2.39 1.62 2.87 1.34Not herringbone >= 40.6 cm (16") 1.03 1.07 1.05 1.04 1.28Not herringbone < 40.6 cm (16") 0.98 1.18 1.35 1.45 1.61
Average 1.23 1.34 1.35 1.36 1.57Construction/industrial:
Herringbone < 61 cm (24") 1.00 1.18 1.26 1.16 1.59Herringbone >= 61 cm (24") < 99.06 cm (39") 1.12 1.25 1.34 1.29 1.45Radial less than 61 cm (24") 1.43 1.62 3.19 3.77 2.82Radial >= to 61 cm (24") < 99.06 cm (39") 1.92 2.51 2.36 2.36 2.43Other < 61 cm (24") 1.01 1.24 1.22 1.23 1.52Other >= 61 cm (24") < 99.06 cm (39") 1.56 1.59 1.93 1.86 1.91
Average 1.23 1.46 1.52 1.48 1.70Off-the-highway:
Radial >= 40.6 cm (16") (2) 247.41 30.69 (2) (2)Radial < 40.6 cm (16") (2) (2) (2) (2) (2)Other >= 40.6 cm (16") 3.03 1.32 1.37 1.37 1.31Other < 40.6 cm (16") (2) (2) (2) (2) (2)
Average 4.50 5.04 3.72 3.64 3.43Other 1.63 1.50 1.53 1.51 1.80
Average 1.31 1.63 1.60 1.60 1.72Share of quantity, units (percent)
Agricultural/forestry:Herringbone or similar tread >= 40.6 cm (16") 7.4 8.3 9.6 10.6 10.4Herringbone or similar tread < 40.6 cm (16") 1.3 3.9 1.9 2.7 2.1Not herringbone >= 40.6 cm (16") 4.8 7.0 11.5 11.0 10.7Not herringbone < 40.6 cm (16") 10.2 13.0 14.0 13.0 9.9
Subtotal 23.7 32.2 37.0 37.3 33.0Construction/industrial:
Herringbone < 61 cm (24") 43.4 32.8 35.5 35.3 40.5Herringbone >= 61 cm (24") < 99.06 cm (39") 7.9 10.5 6.7 6.8 7.1Radial less than 61 cm (24") 1.4 1.4 1.0 1.4 0.6Radial >= to 61 cm (24") < 99.06 cm (39") 1.3 2.0 1.3 1.7 1.3Other < 61 cm (24") 10.3 9.1 10.4 9.1 9.1Other >= 61 cm (24") < 99.06 cm (39") 6.2 5.1 3.4 3.6 3.6
Subtotal 70.6 60.9 58.3 58.0 62.1Off-the-highway:
Radial >= 40.6 cm (16") 0.5 2.4 0.9 1.1 0.4Radial < 40.6 cm (16") 0.0 0.0 0.0 0.0 0.0Other >= 40.6 cm (16") 2.2 1.1 0.8 1.1 0.9Other < 40.6 cm (16") 0.0 0.0 0.0 0.0 0.0
Subtotal 2.8 3.5 1.7 2.1 1.3Other 3.0 3.4 2.9 2.6 3.5
Total 100.0 100.0 100.0 100.0 100.0Table continued on next page.

IV-10
Table IV-4-ContinuedCertain OTR tires: U.S. shipments of imports from China, by application and type, 2005-07, January-March2007, and January-March 2008
ItemCalendar year January-March
2005 2006 2007 2007 2009Share of quantity, weight (percent)
Agricultural/forestry:Herringbone or similar tread >= 40.6 cm (16") 15.9 16.5 17.5 16.6 19.5Herringbone or similar tread < 40.6 cm (16") 0.6 1.2 1.0 0.8 1.1Not herringbone >= 40.6 cm (16") 3.6 4.6 7.7 7.0 6.8Not herringbone < 40.6 cm (16") 4.2 4.8 5.6 5.4 4.2
Subtotal 24.3 27.0 31.8 29.9 31.6Construction/industrial:
Herringbone < 61 cm (24") 23.5 17.8 20.7 19.4 22.5Herringbone >= 61 cm (24") < 99.06 cm (39") 18.8 14.0 12.3 13.6 14.3Radial less than 61 cm (24") 1.0 1.1 0.5 0.4 0.4Radial >= to 61 cm (24") < 99.06 cm (39") 1.8 6.2 5.1 4.9 5.6Other < 61 cm (24") 5.1 5.3 7.2 5.6 6.4Other >= 61 cm (24") < 99.06 cm (39") 21.7 18.9 11.7 13.1 13.3
Subtotal 72.0 63.2 57.5 56.9 62.7Off-the-highway:
Radial >= 40.6 cm (16") 0.0 0.1 0.5 0.0 0.0Radial < 40.6 cm (16") 0.0 0.0 0.0 0.0 0.0Other >= 40.6 cm (16") 2.2 5.6 5.5 6.9 3.2Other < 40.6 cm (16") 0.0 0.0 0.0 0.0 0.0
Subtotal 2.2 5.7 5.9 6.9 3.2Other 1.5 4.1 4.8 6.4 2.5
Total 100.0 100.0 100.0 100.0 100.0Share of value (percent)
Agricultural/forestry:Herringbone or similar tread >= 40.6 cm (16") 16.3 14.0 16.1 14.6 19.0Herringbone or similar tread < 40.6 cm (16") 0.7 1.7 1.0 1.4 0.9Not herringbone >= 40.6 cm (16") 2.8 3.0 5.1 4.6 5.1Not herringbone < 40.6 cm (16") 3.1 3.4 4.8 4.9 4.0
Subtotal 22.9 22.2 26.9 25.5 28.9Construction/industrial:
Herringbone < 61 cm (24") 17.9 12.8 16.3 14.0 20.9Herringbone >= 61 cm (24") < 99.06 cm (39") 16.2 10.7 10.3 11.0 12.1Radial less than 61 cm (24") 1.1 1.1 0.9 1.0 0.7Radial >= to 61 cm (24") < 99.06 cm (39") 2.6 9.5 7.5 7.2 7.9Other < 61 cm (24") 4.0 4.1 5.5 4.3 5.7Other >= 61 cm (24") < 99.06 cm (39") 26.0 18.5 14.1 15.2 14.8
Subtotal 67.8 56.6 54.7 52.7 62.1Off-the-highway:
Radial >= 40.6 cm (16") 2.4 13.0 9.2 9.8 3.9Radial < 40.6 cm (16") 0.0 0.0 0.0 0.0 0.0Other >= 40.6 cm (16") 5.0 4.5 4.7 5.9 2.4Other < 40.6 cm (16") 0.0 0.0 0.0 0.0 0.0
Subtotal 7.5 17.5 13.8 15.8 6.3Other 1.9 3.7 4.6 6.0 2.6
Total 100.0 100.0 100.0 100.0 100.01 Less than 500 pounds.2 Not applicable.
Source: Compiled from data submitted in response to Commission questionnaires.

IV-11
APPARENT U.S. CONSUMPTION
Data concerning apparent U.S. consumption of certain OTR tires, presented in table IV-5, arebased on U.S. producers’ U.S. shipments of certain OTR tires provided in response to Commissionquestionnaires, and the sum of U.S. imports of certain OTR tires provided in response to Commissionquestionnaires and U.S. imports from official statistics, adjusted to exclude (1) data for 34 firms thatprovided usable questionnaire responses, (2) data for nine firms that reported they did not import subjectmerchandise or mining/construction tires during the period of investigation, (3) OTR tires with a rimdiameter greater than or equal to 39 inches (i.e., having an average weight greater than 1,500 pounds),and (4) OTR tires for retail consumer use (i.e., having an average unit LDP value of less than $25). Thequantity of apparent U.S. consumption decreased by 2.3 percent from 2005 to 2007, and decreased by 4.5percent in January-March 2008 compared with January-March 2007. The value of apparent consumptionincreased by 26.3 percent from 2005 to 2007, and increased by 6.5 percent in January-March 2008compared with January-March 2007.
Table IV-5Certain OTR tires: U.S. producers’ U.S. shipments, U.S. imports (adjusted), by sources, andapparent U.S. consumption, 2005-07, January-March 2007, and January-March 2008
Item
Calendar year January-March
2005 2006 2007 2007 2008
Quantity (1,000 tires)
U.S. producers’ U.S. shipments 3,881 3,383 3,720 910 995
U.S. imports from--
China 2,333 2,521 2,337 523 380
Nonsubject countries 1,760 1,831 1,733 473 447
Total U.S. imports 4,093 4,352 4,070 997 827
Apparent U.S. consumption 7,974 7,735 7,790 1,907 1,822
Value (1,000 dollars)
U.S. producers’ U.S. shipments 861,224 835,550 1,006,044 252,393 286,384
U.S. imports from--
China 190,444 287,316 282,390 70,037 43,692
Nonsubject countries 368,629 435,633 505,975 117,896 138,851
Total U.S. imports 559,073 722,949 788,365 187,933 182,543
Apparent U.S. consumption 1,420,296 1,558,498 1,794,409 440,326 468,927
Source: Compiled from data submitted in response to Commission questionnaires and official Commerce statistics, adjusted.

9 Titan and USW’s prehearing brief, p. 19. 10 Titan and USW’s prehearing brief, p. 22.
IV-12
U.S. producers report that the demand for certain OTR tires is derived from the demand for certainOTR vehicles and equipment used in the agricultural, construction, industrial, and mining sectors of theeconomy, and that these sectors are cyclical. Due to high crop and commodity prices, the agriculturalsector is widely viewed as approaching the peak of the current business cycle.9 Demand in theconstruction sector was also strong recently but has weakened due to the housing crisis.10
U.S. MARKET SHARES
U.S. market share data are presented in table IV-6. The quantity of the U.S. producers’ marketshare decreased by 0.9 percentage point from 2005 to 2007, and increased by 6.9 percentage points inJanuary-March 2008 compared with January-March 2007. The share of imports from China increased by0.7 percentage point from 2005 to 2007, and decreased by 6.6 percentage points in January-March 2008compared with January-March 2007. Nonsubject imports’ market share increased by 0.2 percentage pointfrom 2005 to 2007, and decreased by 0.3 percentage point in January-March 2008 compared withJanuary-March 2007.
Table IV-6Certain OTR tires: Apparent U.S. consumption and market shares, 2005-07, January-March 2007,and January-March 2008
Item
Calendar year January-March
2005 2006 2007 2007 2008
Quantity (1,000 tires)
Apparent U.S. consumption 7,974 7,735 7,790 1,907 1,822
Value (1,000 dollars)
Apparent U.S. consumption 1,420,296 1,558,498 1,794,409 440,326 468,927
Share of quantity (percent)
U.S. producers’ U.S. shipments 48.7 43.7 47.8 47.7 54.6
U.S. imports from--
China 29.3 32.6 30.0 27.4 20.9
Nonsubject countries 22.1 23.7 22.2 24.8 24.5
Total imports 51.3 56.3 52.2 52.3 45.4
Share of value (percent)
U.S. producers’ U.S. shipments 60.6 53.6 56.1 57.3 61.1
U.S. imports from--
China 13.4 18.4 15.7 15.9 9.3
Nonsubject countries 26.0 28.0 28.2 26.8 29.6
Total imports 39.4 46.4 43.9 42.7 38.9
Source: Compiled from data submitted in response to Commission questionnaires and official Commerce statistics, adjusted.

11 (73 FR 40481, July 15, 2008) 12 (73 FR 40488, July 15, 2008) 13 Titan and USW’s posthearing brief, p. Aranoff-20.
IV-13
RATIO OF IMPORTS TO U.S. PRODUCTION
Information concerning the ratio of imports to U.S. production of certain OTR tires is presentedin table IV-7. Imports from China were equivalent to 49.9 percent of U.S. production during 2005. Thislevel increased irregularly to 58.3 percent during 2007 and decreased to 35.1 percent in January-March2008 compared with 56.7 percent in January-March 2007.
Table IV-7Certain OTR tires: U.S. producers’ imports and ratios to U.S. production, by sources, 2005-07,January-March 2007, and January-March 2008
ItemCalendar year January-March
2005 2006 2007 2007 2008Quantity (1.000 tires)
U.S. production 4,676 3,818 4,009 923 1,083Ratio of U.S. imports to production (percent)
China 49.9 66.0 58.3 56.7 35.1Nonsubject sources 37.6 48.0 43.2 51.3 41.3
Total imports 87.5 114.0 101.5 108.0 76.4Source: Compiled from data submitted in response to Commission questionnaires and official Commerce statistics, adjusted.
CRITICAL CIRCUMSTANCES
On March 11, 2008, petitioners alleged that there was a reasonable basis to believe or suspect thatcritical circumstances exist with respect to imports of certain OTR tires from China. With regard to thecountervailing duty investigation, pursuant to section 705(a)(2) of the Tariff Act of 1930, as amended (theAct), in order for critical circumstances to exist, Commerce must find that there are countervailablesubsidies that are inconsistent with the World Trade Organization Agreement on Subsidies andCountervailing Measures (SCM Agreement), and that there have been massive imports over a relativelyshort period. Commerce determined that none of the respondents received subsidies inconsistent with theSCM Agreement, therefore Commerce need not reach the issue of whether there have been massiveimports over a relatively short period of time. Since the requirements of section 705 (a)(2) of the Acthave not been met, Commerce’s final determinations found that critical circumstances do not exist with respect to imports of OTR tires from the PRC.11 With regard to the antidumping investigation,Commerce’s final determination found critical circumstances exist for the PRC entity, and found thatcritical circumstances do not exist for the mandatory respondents or the remaining “Separate RateRecipients.”12 Based on the record before the Commission and the final Commerce determinations,petitioners are not further pursuing the critical circumstances issue.13


1 Hearing transcript p. 64 (Vasichek). 2 The estimated cost was obtained by subtracting the customs value from the c.i.f. value of the imports for 2006and then dividing by the customs value. 3 Real exchange rates are calculated by adjusting the nominal rates for movements in producer prices in theUnited States and other countries.
V-1
PART V: PRICING AND RELATED INFORMATION
FACTORS AFFECTING PRICING
Raw Material Costs
Raw material costs account for a large share of the cost of certain OTR tires. During 2005-07,these costs averaged 58.6 percent of the cost of goods sold annually. A major raw material input used inmaking these products is natural rubber. Other important materials include synthetic rubber, carbonblack, various chemicals, and textiles and steel.1
Transportation Costs to the U.S. Market
Ocean transportation costs for certain OTR tires shipped from China to the United States(excluding U.S. inland costs) averaged 9.2 percent of the customs value of these imports during 2007.2 These estimates are derived from official import data and represent the transportation and other chargeson imports.
U.S. Inland Transportation Costs
Transportation costs on U.S. inland shipments of certain OTR tires generally account for a smallto moderate share of the delivered price of these products. The majority of U.S. producers reported thatthese costs ranged from 3 percent to as much as 8 percent of the delivered price. Among importers, themajority of estimates for U.S. inland transportation costs ranged from 1 percent to 10 percent of thedelivered price.
Producers were asked to estimate the shares of their sales that occurred within 100 miles of theirstorage or production facility, between 101 and 1,000 miles, and over 1,000 miles. Among the six U.S.producers that responded to the question, most shipments were for distances of 101 miles or more. Thelargest share of producer shipments was within the 101 to 500 mile range with reported shipments of thesix firms ranging from 60 percent to 96 percent their totals. In the case of importers, the majority ofresponding firms also reported that the largest share of their shipments were for distances of over 101miles.
Exchange Rates
Nominal exchange rates for the Chinese yuan in relation to the U.S. dollar are shown on aquarterly basis in figure V-1 for the period January-March 2005 through January-March 2008. The datashow that the yuan has appreciated relative to the dollar since 2005. Real exchange rates could not becomputed because of the lack of producer price indices for China.3
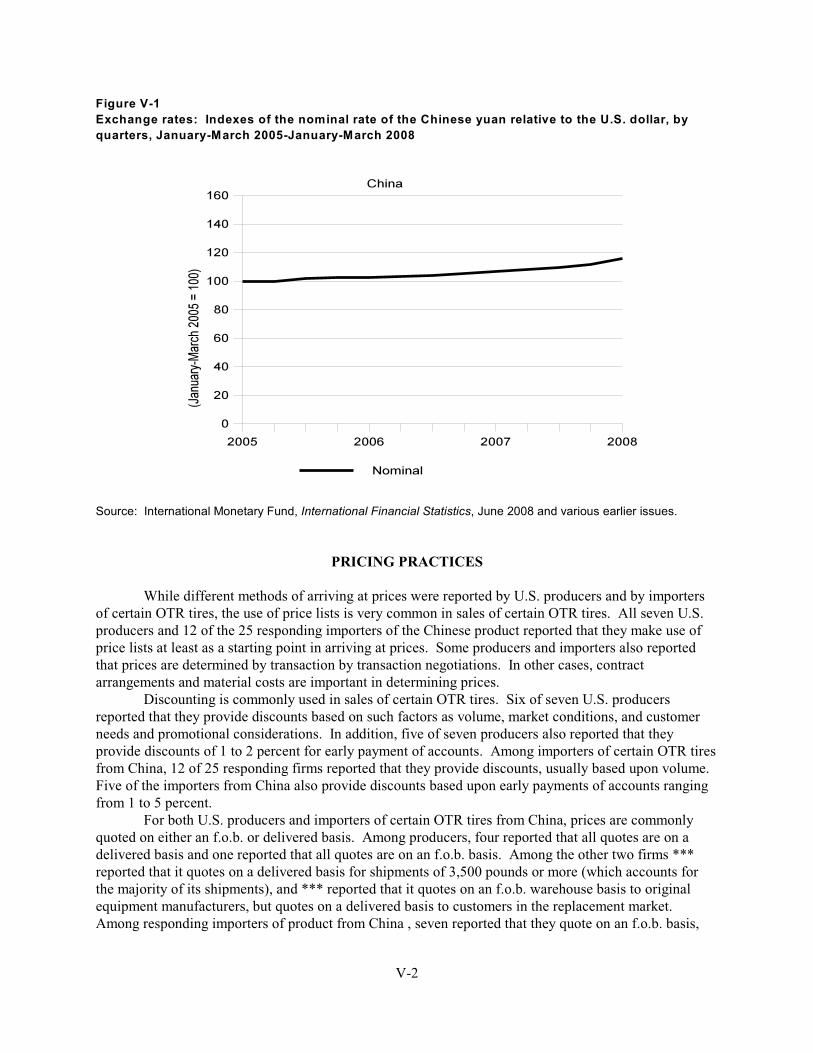
V-2
Figure V-1
Exchange rates: Indexes of the nominal rate of the Chinese yuan relative to the U.S. dollar, by
quarters, January-March 2005-January-March 2008
Source: International Monetary Fund, International Financial Statistics, June 2008 and various earlier issues.
PRICING PRACTICES
While different methods of arriving at prices were reported by U.S. producers and by importersof certain OTR tires, the use of price lists is very common in sales of certain OTR tires. All seven U.S.producers and 12 of the 25 responding importers of the Chinese product reported that they make use ofprice lists at least as a starting point in arriving at prices. Some producers and importers also reportedthat prices are determined by transaction by transaction negotiations. In other cases, contractarrangements and material costs are important in determining prices.
Discounting is commonly used in sales of certain OTR tires. Six of seven U.S. producersreported that they provide discounts based on such factors as volume, market conditions, and customerneeds and promotional considerations. In addition, five of seven producers also reported that theyprovide discounts of 1 to 2 percent for early payment of accounts. Among importers of certain OTR tiresfrom China, 12 of 25 responding firms reported that they provide discounts, usually based upon volume. Five of the importers from China also provide discounts based upon early payments of accounts rangingfrom 1 to 5 percent.
For both U.S. producers and importers of certain OTR tires from China, prices are commonlyquoted on either an f.o.b. or delivered basis. Among producers, four reported that all quotes are on adelivered basis and one reported that all quotes are on an f.o.b. basis. Among the other two firms ***reported that it quotes on a delivered basis for shipments of 3,500 pounds or more (which accounts forthe majority of its shipments), and *** reported that it quotes on an f.o.b. warehouse basis to originalequipment manufacturers, but quotes on a delivered basis to customers in the replacement market. Among responding importers of product from China , seven reported that they quote on an f.o.b. basis,
4 The seventh producer, ***.
V-3
that it varies from case to case. All seven U.S. producers and 23 of 26 responding importers from Chinaand other sources reported that they arrange transportation for their customers while two importersreported that their customers arrange transportation and one reported that both arrange transportation. None of the U.S. producers and most of the importers reported that they do not sell certain OTR tires overthe internet. One importer reported that its internet sales accounts for less than one percent of its totalsales.
Producers and importers of certain OTR tires from China were asked to estimate the percentagesof their sales that are on a spot basis, a short-term contract basis of up to 12 months, or a long-termcontract of 12 months or more. Most sales of OTR tires are on a spot basis. Two of six respondingproducers reported that all of their sales are on a spot basis, and the others reported that a majority of theirsales are on a spot basis. Among 25 responding importers of certain OTR tires from China, 14 sellentirely on a spot basis, 4 sell principally on a spot basis, and others sell principally or entirely on acontract basis. Among producers that reported using short-term contracts, contract periods range from 6months to one year. Prices may or may not be fixed during the contract period. Long-term contracts forproducers range from 3 to 5 years with prices and quantities sometimes subject to adjustment during theperiod. Among importers that reported the used of short-term contracts, contract periods reportedly rangein length to as much as one year with prices and in some cases quantities fixed during the period. Longterm contracts for importers range from 1 to 5 years. Prices and quantities may be fixed or adjustableduring the contract period.
PRICE DATA
The Commission requested U.S. producers and importers of certain OTR tires from China toprovide quarterly data for the total quantity and f.o.b value of certain OTR tires that were shipped tounrelated purchasers in the U.S. market during 2005-07 and January-March 2008. The products forwhich pricing data were requested are as follows:
Six 4 U.S. producers and 16 importers of Chinese product provided varying amounts of usablepricing data for sales of the requested products. Sales of the nine representative products accounted for afairly small percentage of total sales for both producers and importers, since a broad range of products aresold by both. In the case of U.S. producers, price data accounted for about 4.5 percent of sales, and in thecase of importers of product from China it accounted for about 7.0 percent of sales in 2007.
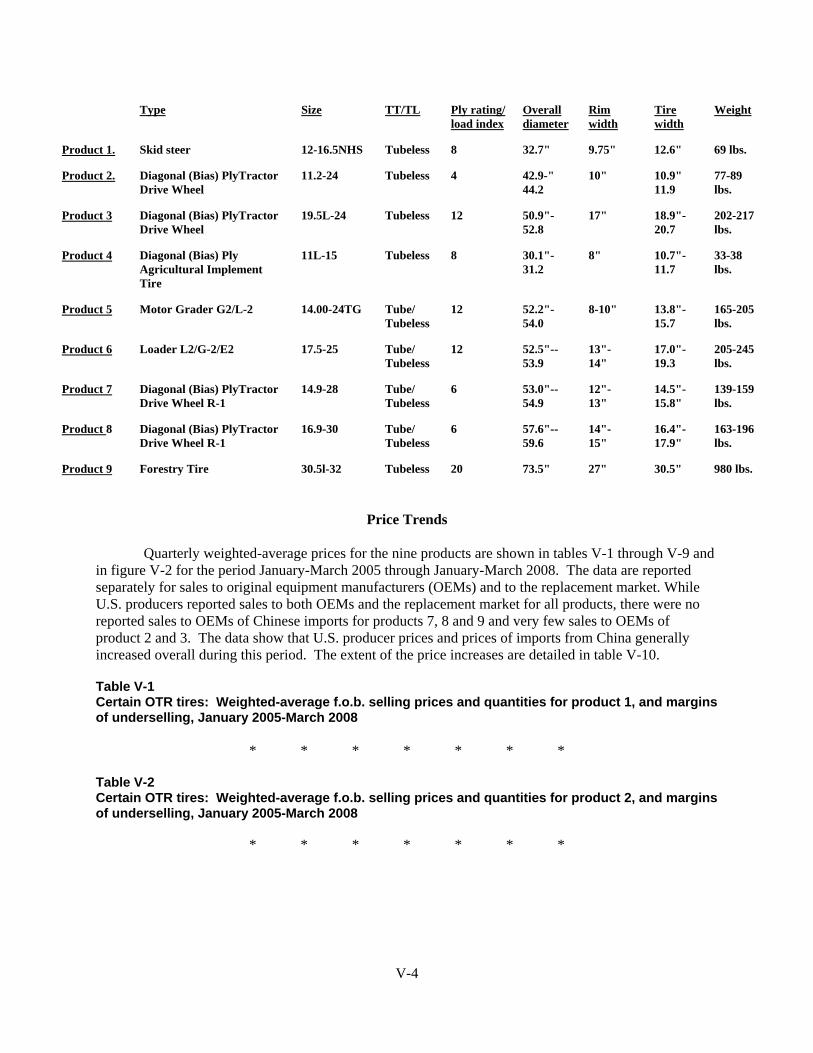
V-4
Type Size TT/TL Ply rating/load index
Overalldiameter
Rimwidth
Tirewidth
Weight
Product 1. Skid steer 12-16.5NHS Tubeless 8 32.7" 9.75" 12.6" 69 lbs.
Product 2. Diagonal (Bias) PlyTractorDrive Wheel
11.2-24 Tubeless 4 42.9-"44.2
10" 10.9"11.9
77-89lbs.
Product 3 Diagonal (Bias) PlyTractorDrive Wheel
19.5L-24 Tubeless 12 50.9"-52.8
17" 18.9"-20.7
202-217lbs.
Product 4 Diagonal (Bias) PlyAgricultural ImplementTire
11L-15 Tubeless 8 30.1"-31.2
8" 10.7"-11.7
33-38lbs.
Product 5 Motor Grader G2/L-2 14.00-24TG Tube/Tubeless
12 52.2"-54.0
8-10" 13.8"-15.7
165-205lbs.
Product 6 Loader L2/G-2/E2 17.5-25 Tube/Tubeless
12 52.5"--53.9
13"-14"
17.0"-19.3
205-245lbs.
Product 7 Diagonal (Bias) PlyTractorDrive Wheel R-1
14.9-28 Tube/Tubeless
6 53.0"--54.9
12"-13"
14.5"-15.8"
139-159lbs.
Product 8 Diagonal (Bias) PlyTractorDrive Wheel R-1
16.9-30 Tube/Tubeless
6 57.6"--59.6
14"-15"
16.4"-17.9"
163-196lbs.
Product 9 Forestry Tire 30.5l-32 Tubeless 20 73.5" 27" 30.5" 980 lbs.
Price Trends
Quarterly weighted-average prices for the nine products are shown in tables V-1 through V-9 andin figure V-2 for the period January-March 2005 through January-March 2008. The data are reportedseparately for sales to original equipment manufacturers (OEMs) and to the replacement market. WhileU.S. producers reported sales to both OEMs and the replacement market for all products, there were noreported sales to OEMs of Chinese imports for products 7, 8 and 9 and very few sales to OEMs ofproduct 2 and 3. The data show that U.S. producer prices and prices of imports from China generallyincreased overall during this period. The extent of the price increases are detailed in table V-10.
Table V-1Certain OTR tires: Weighted-average f.o.b. selling prices and quantities for product 1, and marginsof underselling, January 2005-March 2008
* * * * * * *
Table V-2Certain OTR tires: Weighted-average f.o.b. selling prices and quantities for product 2, and marginsof underselling, January 2005-March 2008
* * * * * * *
V-5
Table V-3Certain OTR tires: Weighted-average f.o.b. selling prices and quantities for product 3, and marginsof underselling, January 2005-March 2008
* * * * * * *
Table V-4Certain OTR tires: Weighted-average f.o.b. selling prices and quantities for product 4, and marginsof underselling/(overselling), January 2005-March 2008
* * * * * * *
Table V-5Certain OTR tires: Weighted-average f.o.b. selling prices and quantities for product 5, and marginsof underselling, January 2005-March 2008
* * * * * * *
Table V-6Certain OTR tires: Weighted-average f.o.b. selling prices and quantities for product 6, and marginsof underselling, January 2005-March 2008
* * * * * * *
Table V-7Certain OTR tires: Weighted-average f.o.b. selling prices and quantities for product 7, and marginsof underselling, January 2005-March 2008
* * * * * * *
Table V-8Certain OTR tires: Weighted-average f.o.b. selling prices and quantities for product 8, and marginsof underselling, January 2005-March 2008
* * * * * * *
Table V-9Certain OTR tires: Weighted-average f.o.b. selling prices and quantities for product 9, and marginsof underselling/(overselling), January 2005-March 2008
* * * * * * *
Figure V-2 Certain OTR tires: Weighted-average f.o.b. selling prices for products 1-9, January 2005-March2008
* * * * * * *
5 ***.
V-6
Price Comparisons
In the 157 quarterly price comparisons between U.S.-produced and imported Chinese products, prices for the Chinese OTR tires were lower than those for U.S. OTR tires in 147 quarters and higher in10 quarters. For all comparisons, margins of underselling ranged from 1.5 percent to 57.0 percent andmargins of overselling ranged from 2.1 to 92.6 percent. A survey of maximum and minimum prices foreach product, by source, on sales to OEMs and the replacement market is presented in table V-10.
Table V-10Certain OTR tires: Summary of weighted-average f.o.b. prices for products 1-9, by country,January 2005-March 2008
* * * * * * *
LOST SALES AND LOST REVENUES
One U.S. producer, ***, provided detailed lost sales allegations. *** allegations concernedtransactions involving a total of *** tires that it valued at more than $*** (see table V-11).
*** alleged that it lost annual sales of 14 separate products to *** in February of 2008 that itvalued at more than $*** million due to competition from imports from China.5 *** agreed with all ofthe lost sales allegations and reported that the quantity numbers are actually far greater than those allegedby ***. *** further stated that the Chinese have offered low quality tires at cheap prices.
*** alleged that it lost combined annual sales of *** irrigation tires to *** that it valued at over$*** to competition from imports from China in October of 2007. The allegation alleged that theChinese imports were valued at about $***. *** disagreed with the allegation. They reported that theactual purchases of Chinese imports amounted to just *** irrigation tires rather than the quantity allegedby the petitioner. They also reported that the actual price per tire of the Chinese product was $*** ratherthan the price of less than $*** alleged by ***. *** further stated that for 2007 its annual sales of U.S.manufactured tires for this size amounted to *** tires, and for imports from China they amounted to ***tires. It reported that sales are expected to be similar for 2008.
*** also alleged that it lost combined annual sales of *** irrigation tires to *** that it valued atnearly $*** to competition from imports from China in October of 2007. The allegation alleged that theChinese imports were valued at about $***. The staff contacted *** to investigate the allegation, but ***did not respond.
Table V-11Certain OTR tires: U.S. producers’ lost sales allegations
* * * * * * *Titan alleged that it lost revenue on sales to several customers of its *** skid steer tire in
December 2007 due to competition from imports from China. It reported that it was forced to lower itsprice on sales to all customers from $*** per tire to between $*** and $***. In this regard, Titanprovided names of contact persons and quantities sold to 13 individual companies, but did not provideinformation on alleged prices of imports from China for competing products. The staff has contacted thefirms to investigate the allegations. The general responses of the seven firms that answered the inquirywith date of alleged quantities, and rejected price and accepted price are presented in table V-12.

6 The companies responding were ***.
V-7
The detailed responses of the seven purchasers were widely varied. *** stated that the price ofthe tire was lowered by *** because it reported that it was overstocked. *** reported that they had neverpurchased the specified tire. *** reported that Titan told them that it had an excess inventory of thespecified tire. *** also reported that it made an offer for the tire and Titan accepted. *** reported thatthe price was lowered, but that *** lowered the price on its own with no counteroffer being made. ***reported that *** lowered the price on the specified product because it had become obsolete and was nolonger easily marketable. *** reported that it never did see a quote from *** of $***. It said that theprice that it paid was much closer to the initial price offer of $*** than to the alleged final quote of $***.
In the one case where a purchaser generally agreed with the allegation, *** reported that Titanlowered its price on the tire due to a quotation on a Chinese-produced tire price of $***. *** also statedthat this was an overstocked item for ***.
Table V-12Certain OTR tires: U.S. producers’ lost revenue allegations
* * * * * * *
Results from the Preliminary Phase of the Investigations
Detailed lost sales and lost revenue allegations were generally not available in the preliminaryphase of the investigations. Titan reported in the petition that it did not have information available on lostsales and lost revenues relating to certain OTR tires on a transaction-by-transaction basis. Titan didprovide a list of 19 customer accounts where it believed that it had lost business to imports from China. While company telephone numbers and fax numbers were provided, the list did not include any detailedprice and quantity data on specific transactions and did not include names of contact persons. Therefore,staff attempted to contact all of these firms with some general questions concerning price competitionfrom China. Five of the firms provided responses.6
Two of the questions dealt specifically with the firms’ activities since January 2004. When askedwhether they had shifted from U.S.-produced certain OTR tires to imports of these products from China,three firms answered “yes” and two answered “no.” When asked if the lower price of the imports fromChina was the reason for shifting, all three of the firms that had shifted answered “yes.” However, onepurchaser qualified the answer by also attributing the shift to an inadequate U.S. supply and a failure toadjust with changing market conditions.
Two other questions dealt with the U.S. industry as a whole. Firms were asked whether U.S.producers had reduced their prices of OTR tires in order to compete with imports since January 2004. Three firms answered “yes” and two answered “no.” One firm that answered “yes” was not sure about allU.S. producers, but believed that some reduced prices because of foreign and domestic competition. Another firm reported that some producers reduced their prices because they were not competitive.
One U.S. producer, ***, provided one lost sale allegation and one lost revenue allegation. ***alleged that it lost a sale of *** tires for use on *** valued at $*** million to imports from China ***. The staff contacted *** concerning this allegation, but the company did not respond to the request forinformation. *** also alleged that it was forced to lower its quote on sales of *** tires from $*** to *** due to imports from China. However, *** reported that it did not have informationconcerning this transaction.

1 Michelin, whose parent company is headquartered in France, reported its financial results based on InternationalFinancial Reporting Standards (“IFRS”). 2 Associated volume information was reported on the basis of tires and pounds. ***. E-mail with attachmentfrom Covington and Burling on behalf of Goodyear, May 21, 2008. ***. 3 BFNA and Titan verification reports. 4 ***. 5 ***. 6 ***. Titan verification report. 7 With the exception of selected pro forma financial information, the above-referenced acquisitions are reflectedin Titan’s public consolidated financial results prospectively from the date of acquisition. As such and in addition totypical differences such as out-of-scope product included in a company’s overall financial results, the consolidatedfinancial results reported in Titan’s 10-K are not directly comparable to the financial results reported to theCommission. 8 ***. E-mail with attachment from Covington and Burling on behalf of Goodyear, May 21, 2008.
VI-1
PART VI: FINANCIAL EXPERIENCE OF THE U.S. PRODUCERS
BACKGROUND
Seven U.S. producers reported their certain OTR tires financial results. With the exception ofMichelin, U.S. producers reported their financial results on the basis of U.S. generally acceptedaccounting principles (“GAAP”) for calendar-year periods.1 Financial results are presented in this sectionfor the following categories: operations on certain OTR tires, operations on nonsubject OTR constructionand mining tires, and operations on combined certain OTR tires and nonsubject OTR construction andmining tires.2 Due to changes in product mix during the period, as noted below, corresponding varianceanalyses are not presented. On June 2 through June 4, 2008 and June 11 through June 12, 2008, staffverified the U.S. producer questionnaire responses of Titan and BFNA, respectively. Changes pursuant toverification are reflected in this and other affected sections of this report.3
While certain OTR tire revenue primarily represents commercial sales, *** also reported arelatively small volume of transfers.4 Internal consumption was reported by ***.5 6 As discussed in thetrade section of this report, Titan acquired the OTR farm production and related assets of Goodyear at theend of 2005 and the OTR construction/industrial production and related assets of Continental in mid2006. As presented in this and other sections of this report, Titan’s OTR tire operations include therelevant Goodyear and Continental OTR tire operations prior and subsequent to Titan’s acquisition.7 Thefinancial results reported by Goodyear represent that company’s remaining OTR operations in Topeka,KS.8
OPERATIONS ON CERTAIN OTR TIRES
Income-and-loss data for producers of certain OTR tires are presented in table VI-1 and on anaverage unit basis in table VI-2. Table VI-3 presents selected company-specific financial information.
BFNA and Titan account for the *** of sales presented in table VI-1: ***, of cumulative salesvalue. Goodyear, with ***. The remaining producers Specialty, Denman, Carlisle, and Michelinaccounted for *** percent, respectively, of cumulative sales value.

VI-2
Table VI-1Certain OTR tires: Results of operations, 2005-07, January-March 2007, and January-March 2008
Item
Calendar year January-March
2005 2006 2007 2007 2008
Quantity (1,000 tires)Commercial sales *** *** *** *** ***
Internal consumption *** *** *** *** ***
Transfers *** *** *** *** ***
Total net sales quantity 4,453 3,868 4,235 1,044 1,160
Quantity (1,000 pounds)Commercial sales *** *** *** *** ***
Internal consumption *** *** *** *** ***
Transfers *** *** *** *** ***
Total net sales quantity 539,589 509,767 638,980 160,732 166,830
Value ($1,000)Commercial sales *** *** *** *** ***
Internal consumption *** *** *** *** ***
Transfers *** *** *** *** ***
Total net sales value 1,010,778 980,611 1,184,627 288,291 341,719
Cost of goods sold:
Raw material 500,918 518,653 629,009 152,057 186,470
Direct labor 168,999 151,798 184,338 44,675 48,260
Other factory costs 237,029 207,707 237,229 54,671 63,337
Total cost of goods sold 906,946 878,158 1,050,576 251,403 298,067
Gross profit 103,832 102,453 134,051 36,888 43,652
SG&A expenses 102,358 96,213 106,011 25,784 29,582
Operating income 1,474 6,240 28,040 11,104 14,070
Interest expense 956 3,482 4,190 1,312 793
Other expenses 2,730 2,936 6,799 387 1,265
Other income items 5,636 3,712 (117) (15) 67
Net income 3,424 3,534 16,934 9,390 12,079
Depreciation/amortization 23,799 23,447 25,021 5,690 6,755
Estimated cash flow 27,223 26,981 41,955 15,080 18,834
Table continued on next page.
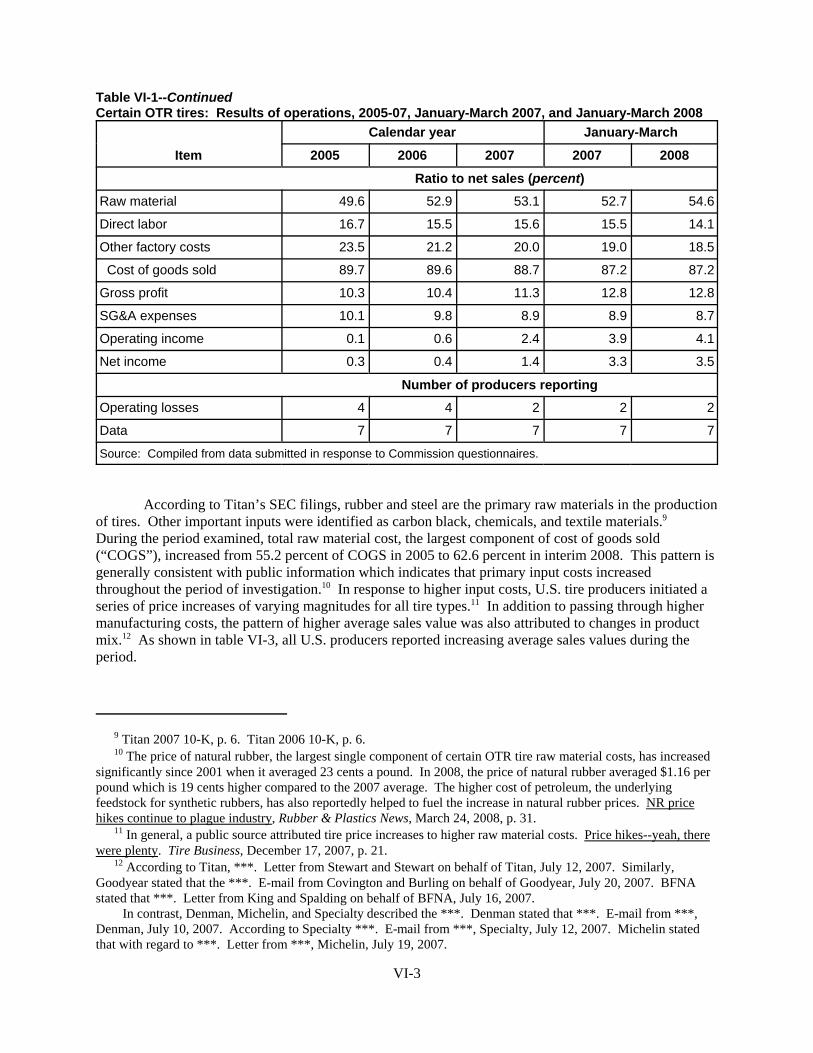
9 Titan 2007 10-K, p. 6. Titan 2006 10-K, p. 6. 10 The price of natural rubber, the largest single component of certain OTR tire raw material costs, has increasedsignificantly since 2001 when it averaged 23 cents a pound. In 2008, the price of natural rubber averaged $1.16 perpound which is 19 cents higher compared to the 2007 average. The higher cost of petroleum, the underlyingfeedstock for synthetic rubbers, has also reportedly helped to fuel the increase in natural rubber prices. NR pricehikes continue to plague industry, Rubber & Plastics News, March 24, 2008, p. 31. 11 In general, a public source attributed tire price increases to higher raw material costs. Price hikes--yeah, therewere plenty. Tire Business, December 17, 2007, p. 21. 12 According to Titan, ***. Letter from Stewart and Stewart on behalf of Titan, July 12, 2007. Similarly,Goodyear stated that the ***. E-mail from Covington and Burling on behalf of Goodyear, July 20, 2007. BFNAstated that ***. Letter from King and Spalding on behalf of BFNA, July 16, 2007. In contrast, Denman, Michelin, and Specialty described the ***. Denman stated that ***. E-mail from ***,Denman, July 10, 2007. According to Specialty ***. E-mail from ***, Specialty, July 12, 2007. Michelin statedthat with regard to ***. Letter from ***, Michelin, July 19, 2007.
VI-3
Table VI-1--ContinuedCertain OTR tires: Results of operations, 2005-07, January-March 2007, and January-March 2008
Item
Calendar year January-March
2005 2006 2007 2007 2008
Ratio to net sales (percent)Raw material 49.6 52.9 53.1 52.7 54.6
Direct labor 16.7 15.5 15.6 15.5 14.1
Other factory costs 23.5 21.2 20.0 19.0 18.5
Cost of goods sold 89.7 89.6 88.7 87.2 87.2
Gross profit 10.3 10.4 11.3 12.8 12.8
SG&A expenses 10.1 9.8 8.9 8.9 8.7
Operating income 0.1 0.6 2.4 3.9 4.1
Net income 0.3 0.4 1.4 3.3 3.5
Number of producers reportingOperating losses 4 4 2 2 2
Data 7 7 7 7 7
Source: Compiled from data submitted in response to Commission questionnaires.
According to Titan’s SEC filings, rubber and steel are the primary raw materials in the productionof tires. Other important inputs were identified as carbon black, chemicals, and textile materials.9 During the period examined, total raw material cost, the largest component of cost of goods sold(“COGS”), increased from 55.2 percent of COGS in 2005 to 62.6 percent in interim 2008. This pattern isgenerally consistent with public information which indicates that primary input costs increasedthroughout the period of investigation.10 In response to higher input costs, U.S. tire producers initiated aseries of price increases of varying magnitudes for all tire types.11 In addition to passing through highermanufacturing costs, the pattern of higher average sales value was also attributed to changes in productmix.12 As shown in table VI-3, all U.S. producers reported increasing average sales values during theperiod.
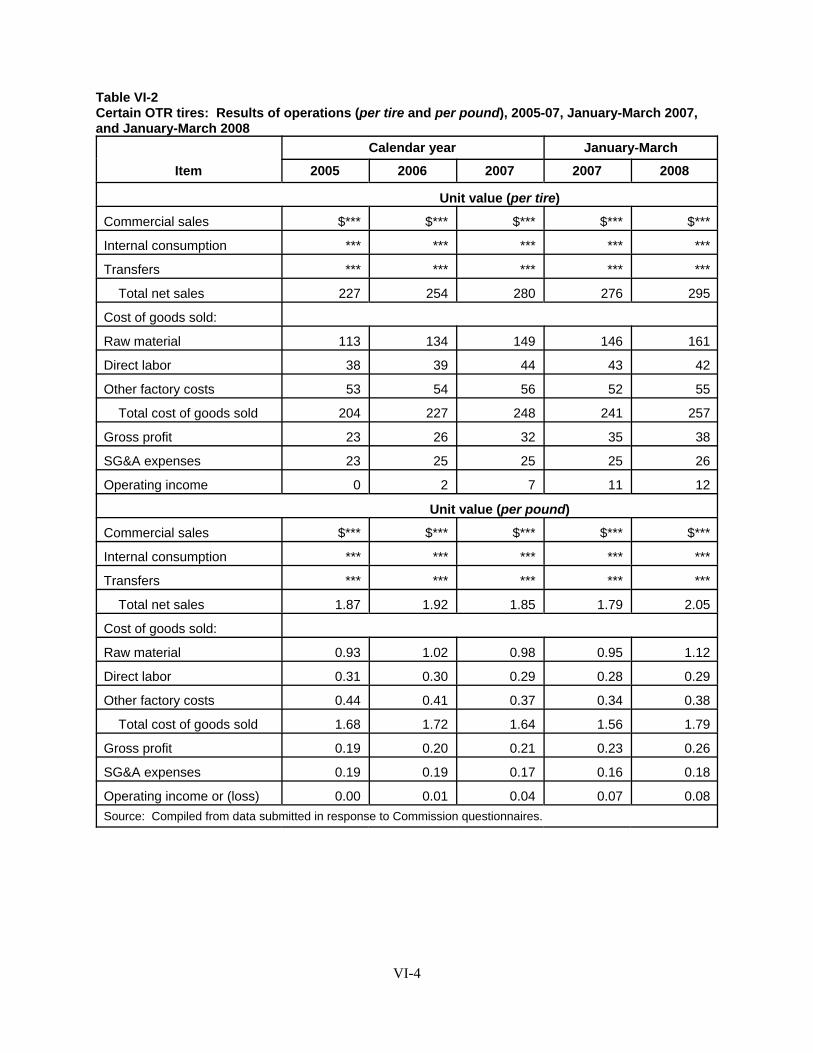
VI-4
Table VI-2Certain OTR tires: Results of operations (per tire and per pound), 2005-07, January-March 2007,and January-March 2008
Item
Calendar year January-March
2005 2006 2007 2007 2008
Unit value (per tire)
Commercial sales $*** $*** $*** $*** $***
Internal consumption *** *** *** *** ***
Transfers *** *** *** *** ***
Total net sales 227 254 280 276 295
Cost of goods sold:
Raw material 113 134 149 146 161
Direct labor 38 39 44 43 42
Other factory costs 53 54 56 52 55
Total cost of goods sold 204 227 248 241 257
Gross profit 23 26 32 35 38
SG&A expenses 23 25 25 25 26
Operating income 0 2 7 11 12
Unit value (per pound)
Commercial sales $*** $*** $*** $*** $***
Internal consumption *** *** *** *** ***
Transfers *** *** *** *** ***
Total net sales 1.87 1.92 1.85 1.79 2.05
Cost of goods sold:
Raw material 0.93 1.02 0.98 0.95 1.12
Direct labor 0.31 0.30 0.29 0.28 0.29
Other factory costs 0.44 0.41 0.37 0.34 0.38
Total cost of goods sold 1.68 1.72 1.64 1.56 1.79
Gross profit 0.19 0.20 0.21 0.23 0.26
SG&A expenses 0.19 0.19 0.17 0.16 0.18
Operating income or (loss) 0.00 0.01 0.04 0.07 0.08Source: Compiled from data submitted in response to Commission questionnaires.
13 According to Carlisle, ***. E-mail with attachment from ***, May 21, 2008. Goodyear stated that ***. E-mail with attachment from Covington and Burling on behalf of Goodyear, May23, 2008.
According to Michelin, it ***. E-mail with attachment from ***, Michelin, May 27, 2008. Titan stated that ***. Letter from Stewart and Stewart on behalf of Titan, May 23, 2008.
***. E-mail with attachment from ***, Denman, May 22, 2008. According to BFNA, it ***. Letter from King and Spalding on behalf of BFNA, June 5, 2008. 14 According to Titan, “{a}s is customary in the industry, the Company does not have long-term contracts for thepurchase of steel or rubber and, therefore, purchases are subject to price fluctuations.” Titan 2007 10-K, p. 6. Titanfurther states that it “. . . does not generally enter into long-term commodity contracts and does not use derivativecommodity instruments to hedge its exposures to commodity market price fluctuations. Therefore, the Company isexposed to price fluctuations of its key commodities, which consist primarily of steel and rubber. The Companyattempts to pass on certain material price increases and decreases to its customers, depending on market conditions.” Titan 2007 10-K, p. 32. 15 With respect to certain OTR tire production, a U.S. industry witness at the staff conference stated that “. . . it'sextremely difficult to automate completely because of the size changes . . . it's hard to get one machine to doeverything, although we've done a very good job of a lot of the semi-automation, and I know that Firestone has aswell. There are portions of it that you can get some labor out of, but it's not going to look anything like a passengerplant.” Conference transcript, p. 105 (Kramer). 16 “As the size of the OTR tire increases you generally will go from a single B, to a twin B, to a three Bconstruction or even to a four B construction, all of which creates more processes internal to the plant both in themaking bands component, making beads, as well as assembling them, as well as the curing of these tires will bedramatically longer.” Conference transcript, pp. 95-96 (Steltman). 17 Conference transcript, p. 47 (Burchfield), p. 96 (Kramer), and p. 194 (Ganz). While there are company-specific differences in terms of how certain OTR tires are manufactured, these differences are generally notconsidered fundamental. Conference transcript, pp. 99-100 (Pensler).
VI-5
Table VI-3Certain OTR tires: Results of operations by firm, 2005-07, January-March 2007, and January-March2008
* * * * * * *
Based on responses to a follow-up question, the industry’s use of contracts to ensure the supplyand/or price of important raw material inputs such as natural rubber appears to be generally limited toshort-term contracts.13 Titan’s 2007 10-K, for example, states that long-term contracts for the purchaseof rubber, as well as steel, are not customary in the industry.14
Direct labor costs as a share of certain OTR tire COGS were the second largest component afterraw material cost during the full-year periods, ranging from 16.2 percent of total COGS in interim 2008 to18.6 percent in 2005. At the staff conference it was noted that the production of certain OTR tires is lessautomated compared to the production of passenger tires15 and that direct labor costs generally increasealong with the size of the certain OTR tire diameter.16 Larger certain OTR tires also reportedly reflectsmaller production runs and increased manufacturing overhead costs associated with more frequentchangeover of equipment.17

18 ***. E-mail from ***, Denman, July 10, 2007. ***. E-mail with attachment from ***, Denman, May 13,2008. 19 ***. E-mail from ***, Specialty, May 14, 2008. ***. Ibid. 20 ***. E-mail with attachment from Covington and Burling on behalf of Goodyear, May 21, 2008. 21 ***. Letter from King & Spalding on behalf of BFNA, May 15, 2008. ***. Letter from King and Spalding on behalf of BFNA, July 16, 2007. ***. BFNA verification report. 22 ***. E-mail from Covington and Burling on behalf of Goodyear, June 2, 2008. ***. 23 With regard to the ***, Titan stated that this pattern was in part ***. Letter from Stewart and Stewart onbehalf of Titan, July 12, 2007. The company also noted that ***. Ibid. Notwithstanding the factors specified byTitan regarding the ***, public information *** indicates that Titan’s 2006 sales were lower in part due to lowerdemand in the agriculture market; e.g., “. . . the company {Titan} expects to report its 2006 farm tire business-tireand wheel revenues combined fell at least $75 million from 2005 because of a down agricultural market.” Titanboosting capacity for OTR tires of two sites, Tire Business, February 12, 2007, p. 3. The article further noted that,according to a Titan executive, a “. . . combination of reorganizing and a lighter farm market probably left Titanshort on its expectation of $720 million to $735 million in corporate sales for 2006.” Ibid. In its 2006 AnnualReport, Titan noted that “{t}he agriculture tire and wheel market was down 12-13 percent in 2006 with results belowthe strong level we experienced in 2004 and 2005.” Titan 2006 Annual Report, p. 7. 24 The *** in Titan’s *** with favorable demand conditions described in Titan’s 2007 10-K. According to thecompany, “{i}n 2007, Titan experienced strong demand for {its} agricultural and earthmoving/constructionproducts. This strong demand is expected to continue into 2008. The strength in the agricultural market is the resultof high commodity prices, which have resulted from the continuing increase in the use of biofuels. High prices formetals, oil and gas have created a large demand for the Company’s earthmoving and mining products.” Titan 200710-K, p. 5. The 12 percent increase in Titan’s 1st quarter 2008 overall establishment sales, reportedly a record saleslevel, compared to 1st quarter 2007 overall establishment sales “. . . was attributed to exceptionally strong demand inthe Company’s agricultural market.” Titan 1st quarter 2008 10-Q, p. 17. 25 ***. In 2006, the company stated that “. . . realignment costs of approximately $9 million to $11 millionlowered the Company’s gross profit for the fourth quarter of 2006, as labor costs that are normally dedicated tomaking products were instead used for retooling, retraining and movement of equipment. These costs resulted in anapproximate 2% reduction in the annual {2006} gross profit percentage.” Titan 2006 10-K, p. 20. In 2007, thecompany stated that realignment costs were approximately $22 million and $24 million. Unlike the 2006 10-K,Titan’s 2007 10-K did not estimate the impact of realignment costs on annual gross profit margin. Titan 2007 10-K,p. 17. 26 ***. BFNA verification report. 27 Letter from King & Spalding on behalf of BFNA, May 15, 2008. 28 Letter from Stewart and Stewart on behalf of Titan, May 23, 2008.
VI-6
As shown in table VI-3, company-specific financial results varied considerably. ***,18 19 while***.20 ***.21 ***.22
As shown in table VI-3, Titan’s ***.23 24 ***.25
As shown in table VI-3, ***.26
As shown in table VI-1, total interest expense increased notably in 2006 and remained at a higherlevel for the rest of the period. ***.27 Higher total other expenses in 2007 was ***.28

29 Letter from Stewart and Stewart on behalf of Titan, May 23, 2008. E-mail with attachment from Covington &Burling, May 23, 2008. E-mail with attachment from ***, Michelin, May 27, 2008. BFNA also stated that ***. Letter from King and Spalding on behalf of BFNA, June 5, 2008. 30 ***. Titan verification report. 31 ***. Staff telephone interview with ***, June 20, 2008.
VI-7
OPERATIONS ON NONSUBJECT OTR CONSTRUCTION AND MINING TIRES
Income-and-loss data for producers of nonsubject OTR construction and mining tires arepresented in table VI-4 and on an average unit basis in table VI-5. Table VI-6 presents selected company-specific financial information.
The information presented in table VI-4 represents the nonsubject OTR construction and miningtire operations of BFNA, Goodyear, Michelin, and Titan. While nonsubject OTR tires represent asubstantially smaller level of total sales volume and revenue compared to certain OTR tires, nonsubjectOTR tires generated consistently higher operating income in absolute terms and as a percent of salesthroughout the period. In addition to lower overall SG&A expense ratios attributed to nonsubject OTRtires, the difference in financial results between certain OTR tires and nonsubject OTR construction andmining tires is primarily due to higher gross margins generated by nonsubject OTR tires. In addition tohigher initial levels of gross profitability, overall gross margins on nonsubject OTR construction andmining tires widened considerably during the period: from 20.3 percent in 2005 to 39.7 percent ininterim 2008. In contrast, gross margins on subject OTR only increased modestly from 10.3 percent in2005 to 12.8 percent in interim 2008. Similar to the pattern reported for certain OTR tires, U.S. producersgenerally indicated that higher average sales values for nonsubject OTR tires were due to shifts in productmix to larger-size tires, as well as increases in underlying prices.29
As shown in table VI-6, company-specific results on nonsubject OTR mining and constructiontires varied somewhat during the period. Similar to the pattern of financial results for its operations oncertain OTR tires, ***. ***.30 In absolute terms, *** than those of the other companies. *** nonsubjectOTR construction and mining tires activity, unlike the other U.S. producers, was also *** compared to itscorresponding certain OTR tires operations.31
Table VI-4Nonsubject OTR construction and mining tires: Results of operations, 2005-07, January-March2007, and January-March 2008
Item
Calendar year January-March
2005 2006 2007 2007 2008
Quantity (1,000 tires)Commercial sales *** *** *** *** ***
Transfers *** *** *** *** ***
Total net sales quantity 23 25 26 7 7
Quantity (1,000 pounds)Commercial sales *** *** *** *** ***
Transfers *** *** *** *** ***
Total net sales quantity 137,895 156,322 169,847 43,151 51,458
Table continued on next page.
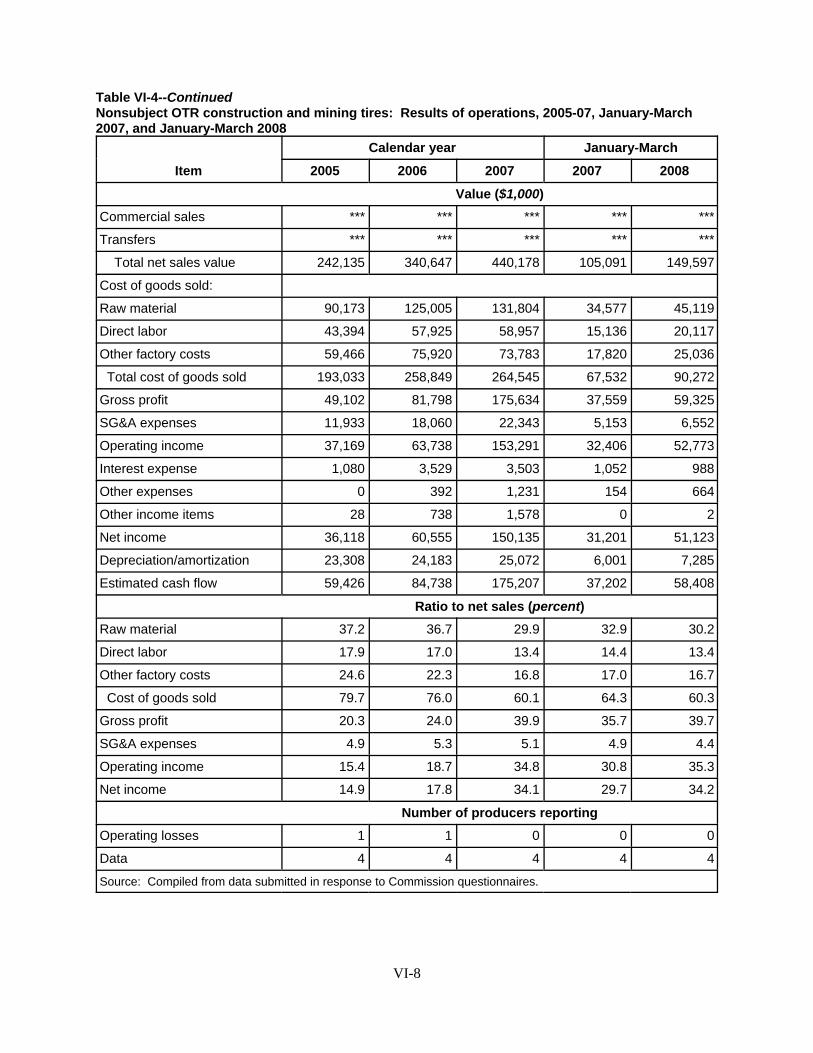
VI-8
Table VI-4--ContinuedNonsubject OTR construction and mining tires: Results of operations, 2005-07, January-March2007, and January-March 2008
Item
Calendar year January-March
2005 2006 2007 2007 2008
Value ($1,000)Commercial sales *** *** *** *** ***
Transfers *** *** *** *** ***
Total net sales value 242,135 340,647 440,178 105,091 149,597
Cost of goods sold:
Raw material 90,173 125,005 131,804 34,577 45,119
Direct labor 43,394 57,925 58,957 15,136 20,117
Other factory costs 59,466 75,920 73,783 17,820 25,036
Total cost of goods sold 193,033 258,849 264,545 67,532 90,272
Gross profit 49,102 81,798 175,634 37,559 59,325
SG&A expenses 11,933 18,060 22,343 5,153 6,552
Operating income 37,169 63,738 153,291 32,406 52,773
Interest expense 1,080 3,529 3,503 1,052 988
Other expenses 0 392 1,231 154 664
Other income items 28 738 1,578 0 2
Net income 36,118 60,555 150,135 31,201 51,123
Depreciation/amortization 23,308 24,183 25,072 6,001 7,285
Estimated cash flow 59,426 84,738 175,207 37,202 58,408
Ratio to net sales (percent)Raw material 37.2 36.7 29.9 32.9 30.2
Direct labor 17.9 17.0 13.4 14.4 13.4
Other factory costs 24.6 22.3 16.8 17.0 16.7
Cost of goods sold 79.7 76.0 60.1 64.3 60.3
Gross profit 20.3 24.0 39.9 35.7 39.7
SG&A expenses 4.9 5.3 5.1 4.9 4.4
Operating income 15.4 18.7 34.8 30.8 35.3
Net income 14.9 17.8 34.1 29.7 34.2
Number of producers reportingOperating losses 1 1 0 0 0
Data 4 4 4 4 4
Source: Compiled from data submitted in response to Commission questionnaires.
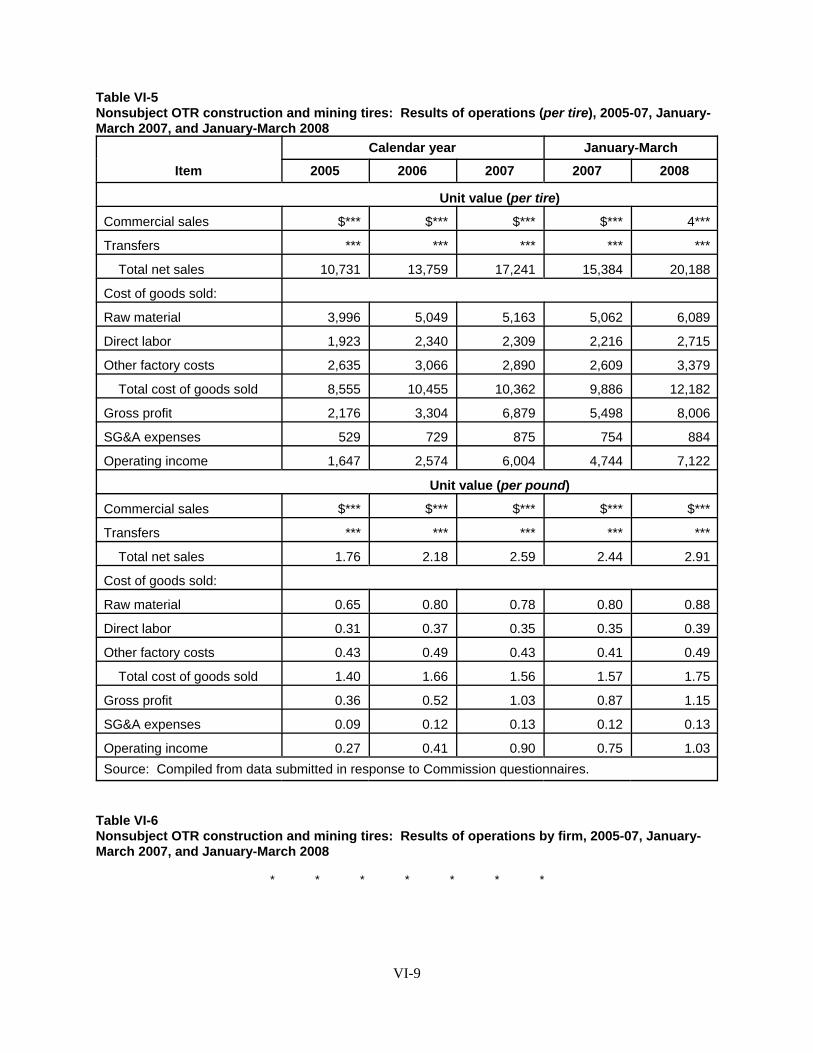
VI-9
Table VI-5Nonsubject OTR construction and mining tires: Results of operations (per tire), 2005-07, January-March 2007, and January-March 2008
Item
Calendar year January-March
2005 2006 2007 2007 2008
Unit value (per tire)
Commercial sales $*** $*** $*** $*** 4***
Transfers *** *** *** *** ***
Total net sales 10,731 13,759 17,241 15,384 20,188
Cost of goods sold:
Raw material 3,996 5,049 5,163 5,062 6,089
Direct labor 1,923 2,340 2,309 2,216 2,715
Other factory costs 2,635 3,066 2,890 2,609 3,379
Total cost of goods sold 8,555 10,455 10,362 9,886 12,182
Gross profit 2,176 3,304 6,879 5,498 8,006
SG&A expenses 529 729 875 754 884
Operating income 1,647 2,574 6,004 4,744 7,122
Unit value (per pound)
Commercial sales $*** $*** $*** $*** $***
Transfers *** *** *** *** ***
Total net sales 1.76 2.18 2.59 2.44 2.91
Cost of goods sold:
Raw material 0.65 0.80 0.78 0.80 0.88
Direct labor 0.31 0.37 0.35 0.35 0.39
Other factory costs 0.43 0.49 0.43 0.41 0.49
Total cost of goods sold 1.40 1.66 1.56 1.57 1.75
Gross profit 0.36 0.52 1.03 0.87 1.15
SG&A expenses 0.09 0.12 0.13 0.12 0.13
Operating income 0.27 0.41 0.90 0.75 1.03Source: Compiled from data submitted in response to Commission questionnaires.
Table VI-6Nonsubject OTR construction and mining tires: Results of operations by firm, 2005-07, January-March 2007, and January-March 2008
* * * * * * *
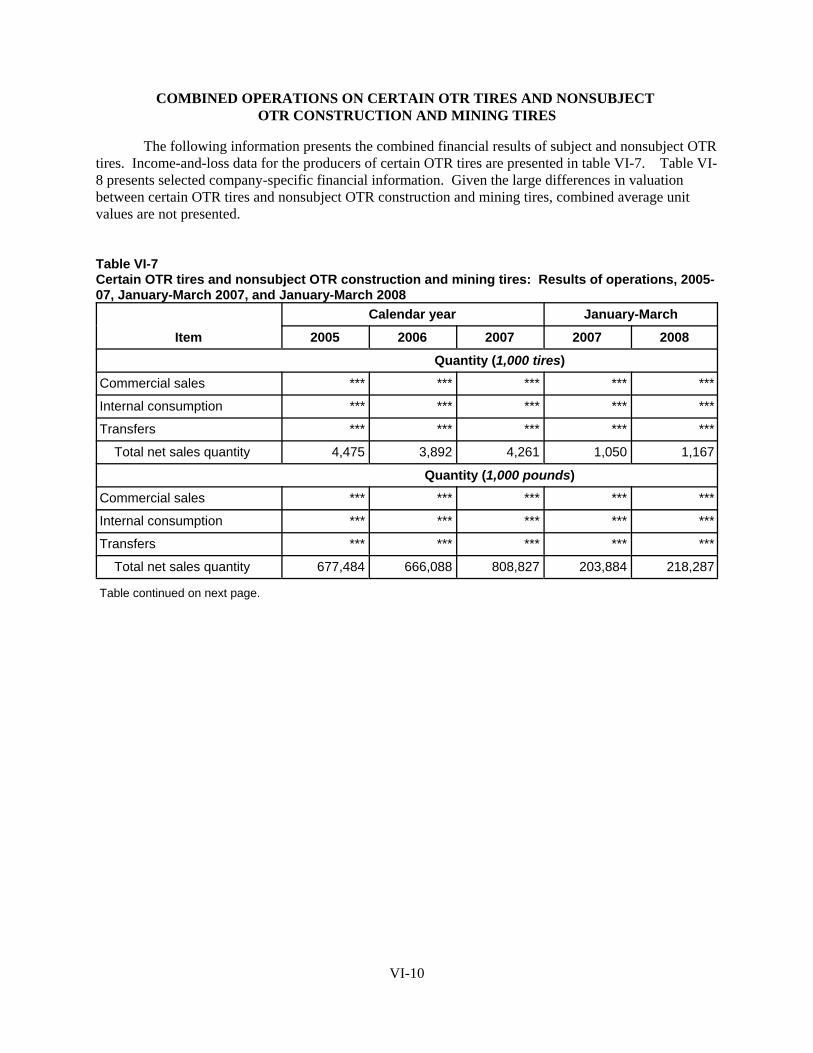
VI-10
COMBINED OPERATIONS ON CERTAIN OTR TIRES AND NONSUBJECT OTR CONSTRUCTION AND MINING TIRES
The following information presents the combined financial results of subject and nonsubject OTRtires. Income-and-loss data for the producers of certain OTR tires are presented in table VI-7. Table VI-8 presents selected company-specific financial information. Given the large differences in valuationbetween certain OTR tires and nonsubject OTR construction and mining tires, combined average unitvalues are not presented.
Table VI-7Certain OTR tires and nonsubject OTR construction and mining tires: Results of operations, 2005-07, January-March 2007, and January-March 2008
Item
Calendar year January-March
2005 2006 2007 2007 2008
Quantity (1,000 tires)Commercial sales *** *** *** *** ***
Internal consumption *** *** *** *** ***
Transfers *** *** *** *** ***
Total net sales quantity 4,475 3,892 4,261 1,050 1,167
Quantity (1,000 pounds)Commercial sales *** *** *** *** ***
Internal consumption *** *** *** *** ***
Transfers *** *** *** *** ***
Total net sales quantity 677,484 666,088 808,827 203,884 218,287
Table continued on next page.

VI-11
Table VI-7--ContinuedCertain OTR tires and nonsubject OTR construction and mining tires: Results of operations, 2005-07, January-March 2007, and January-March 2008
Item
Calendar year January-March
2005 2006 2007 2007 2008
Value ($1,000)Commercial sales *** *** *** *** ***
Internal consumption *** *** *** *** ***
Transfers *** *** *** *** ***
Total net sales quantity 1,252,913 1,321,258 1,624,805 393,382 491,316
Cost of goods sold:
Raw material 591,091 643,658 760,813 186,634 231,589
Direct labor 212,393 209,723 243,295 59,811 68,377
Other factory costs 296,495 283,627 311,012 72,491 88,373
Total cost of goods sold 1,099,979 1,137,007 1,315,121 318,935 388,339
Gross profit 152,934 184,251 309,685 74,447 102,977
SG&A expenses 114,291 114,273 128,354 30,937 36,134
Operating income 38,643 69,978 181,331 43,510 66,843
Interest expense 2,036 7,011 7,693 2,364 1,781
Other expenses 2,730 3,328 8,030 541 1,929
Other income items 5,664 4,450 1,461 (15) 69
Net income 39,542 64,089 167,069 40,591 63,202
Depreciation/amortization 47,107 47,630 50,093 11,691 14,040
Estimated cash flow 86,649 111,719 217,162 52,282 77,242
Ratio to net sales (percent)
Raw material 47.2 48.7 46.8 47.4 47.1
Direct labor 17.0 15.9 15.0 15.2 13.9
Other factory costs 23.7 21.5 19.1 18.4 18.0
Cost of goods sold 87.8 86.1 80.9 81.1 79.0
Gross profit 12.2 13.9 19.1 18.9 21.0
SG&A expenses 9.1 8.6 7.9 7.9 7.4
Operating income 3.1 5.3 11.2 11.1 13.6
Net income 3.2 4.9 10.3 10.3 12.9
Number of producers reportingOperating losses 4 3 2 2 2
Data 7 7 7 7 7
Source: Compiled from data submitted in response to Commission questionnaires.
32 According to ***. E-mail with attachment from ***, Michelin, May 27, 2008. 33 ***, Titan stated in its 2007 10-K that “{i}n 2008, Titan plans to enter the giant off-the-road (OTR) tiremarket, which will include 57-inch and 63-inch giant radial tires, the largest tires in the world. To enter the giantOTR tire market, the Company is investing in a large capital expansion project at its Bryan, Ohio, location. TheCompany has also worked on adding OTR tire capacity through a production realignment of aligning synergiesthrough retooling, retraining personnel and redistribution of equipment.” Titan 2007 10-K, p. 3. ***. E-mail from***, Titan, May 13, 2008. 34 ***. E-mail with attachment from ***, Denman, May 13, 2008. ***. E-mail from ***, Specialty, May 14,2008.
VI-12
Table VI-8Certain OTR tires and nonsubject OTR construction and mining tires: Results of operations byfirm, 2005-07, January-March 2007, and January-March 2008
* * * * * * *
CAPITAL EXPENDITURES, RESEARCH AND DEVELOPMENT EXPENSES, ASSETS, AND RETURN ON INVESTMENT
Data on capital expenditures, research and development (“R&D”) expenses, acquisitionexpenditures, assets, and return on investment for certain OTR tires, nonsubject OTR construction andmining tires, and combined certain OTR tires and nonsubject OTR construction and mining tires arepresented in table VI-9, table VI-10, and table VI-11, respectively.
*** both reported notable increases in nonsubject OTR construction and mining tire capitalexpenditures,32 33 while the majority of *** capital expenditures were attributed to certain OTR tires.34
***. As noted previously, Titan’s acquisition of Continental and Goodyear OTR assets arereflected in the financial information reported to the Commission as if Titan owned these assetsthroughout the period.
Table VI-9Certain OTR tires: Capital expenditures, acquisition expenditures, R&D expenses, assets, andreturn on investment, by firms, 2005-07, January-March 2007, and January-March 2008
* * * * * * *
Table VI-10Nonsubject OTR construction and mining tires: Capital expenditures, acquisition expenditures,R&D expenses, assets, and return on investment, by firms, 2005-07, January-March 2007, andJanuary-March 2008
* * * * * * *

VI-13
Table VI-11Combined certain OTR tires and nonsubject OTR construction and mining tires: Capitalexpenditures, acquisition expenditures, R&D expenses, assets, and return on investment, by firms, 2005-07, January-March 2007, and January-March 2008
* * * * * * *
CAPITAL AND INVESTMENT
The Commission requested U.S. producers to describe any actual or anticipated negative effectsof imports of certain OTR tires from China on their firms’ growth, investment, and ability to raise capitalor development and production efforts (including efforts to develop a derivative or more advancedversion of the product).
Actual Negative Effects
BFNA ***.Carlisle ***.Denman ***. Goodyear ***.Michelin ***.Specialty ***.Titan ***.
Anticipated Negative Effects
BFNA ***.Carlisle ***.Denman ***. Goodyear ***. Michelin ***.Specialty ***.Titan ***.


1 Section 771(7)(F)(ii) of the Act (19 U.S.C. § 1677(7)(F)(ii)) provides that “The Commission shall consider[these factors] . . . as a whole in making a determination of whether further dumped or subsidized imports areimminent and whether material injury by reason of imports would occur unless an order is issued or a suspensionagreement is accepted under this title. The presence or absence of any factor which the Commission is required toconsider . . . shall not necessarily give decisive guidance with respect to the determination. Such a determinationmay not be made on the basis of mere conjecture or supposition.”
VII-1
PART VII: THREAT AND BRATSK CONSIDERATIONS
Section 771(7)(F)(I) of the Act (19 U.S.C. § 1677(7)(F)(I)) provides that–
In determining whether an industry in the United States is threatenedwith material injury by reason of imports (or sales for importation) ofthe subject merchandise, the Commission shall consider, among otherrelevant economic factors1--
(I) if a countervailable subsidy is involved, such information as may bepresented to it by the administering authority as to the nature of thesubsidy (particularly as to whether the countervailable subsidy is asubsidy described in Article 3 or 6.1 of the Subsidies Agreement), andwhether imports of the subject merchandise are likely to increase,
(II) any existing unused production capacity or imminent, substantialincrease in production capacity in the exporting country indicating thelikelihood of substantially increased imports of the subject merchandiseinto the United States, taking into account the availability of other exportmarkets to absorb any additional exports,
(III) a significant rate of increase of the volume or market penetration ofimports of the subject merchandise indicating the likelihood ofsubstantially increased imports,
(IV) whether imports of the subject merchandise are entering at pricesthat are likely to have a significant depressing or suppressing effect ondomestic prices, and are likely to increase demand for further imports,
(V) inventories of the subject merchandise,
(VI) the potential for product-shifting if production facilities in theforeign country, which can be used to produce the subject merchandise,are currently being used to produce other products,
(VII) in any investigation under this title which involves imports of botha raw agricultural product (within the meaning of paragraph (4)(E)(iv))and any product processed from such raw agricultural product, thelikelihood that there will be increased imports, by reason of productshifting, if there is an affirmative determination by the Commissionunder section 705(b)(1) or 735(b)(1) with respect to either the raw

2 Section 771(7)(F)(iii) of the Act (19 U.S.C. § 1677(7)(F)(iii)) further provides that, in antidumpinginvestigations, “. . . the Commission shall consider whether dumping in the markets of foreign countries (asevidenced by dumping findings or antidumping remedies in other WTO member markets against the same class orkind of merchandise manufactured or exported by the same party as under investigation) suggests a threat of materialinjury to the domestic industry.” 3 Petition, exh. 4. 4 One firm, ***, reported that it did not produce the subject merchandise. 5 Counsel for the Chinese respondents assert that the foreign producer questionnaire data for the responding firms“account for the substantial majority of subject OTR tires exported from China to the United Statess” based onsurveys of the Chinese Rubber Industry Association. Chinese respondents posthearing brief, p. 7. Counsel forBFNA argue that the foreign producer questionnaire data submitted to the Commission significantly understates thesize of the Chinese OTR industry, citing Chinese producers identified in U.S. importer questionnaires, Chineseproducers that were separate rate applicants at Commerce, and Chinese producers identified on the web. BFNA’sposthearing brief, p. 7, and exh. 23A and 23B. BFNA reported that industry data published in China suggest thatresponding Chinese producers of certain OTR tires account for half of Chinese production of certain OTR tires in2006. BFNA’s posthearing brief, p. 48.
VII-2
agricultural product or the processed agricultural product (but notboth),
(VIII) the actual and potential negative effects on the existingdevelopment and production efforts of the domestic industry, includingefforts to develop a derivative or more advanced version of the domesticlike product, and
(IX) any other demonstrable adverse trends that indicate the probabilitythat there is likely to be material injury by reason of imports (or sale forimportation) of the subject merchandise (whether or not it is actuallybeing imported at the time).2
Information on the nature of the subsidies is presented in Part I. Information on the volume andpricing of imports of the subject merchandise is presented in Parts IV and V. Information on the effectsof imports of the subject merchandise on U.S. producers’ existing development and production efforts ispresented in Part VI. Information on inventories of the subject merchandise; foreign producers’operations, including the potential for “product-shifting;” any other threat indicators, if applicable; andany dumping in third-country markets, follows.
THE INDUSTRY IN CHINA
The petition in these investigations identified approximately 100 producers and/or exporters ofcertain OTR tires in China.3 The Commission sent foreign producer questionnaires to 95 firms, andreceived 19 foreign producer questionnaire responses.4 5 Table VII-1 presents the responding subjectproducers in China, and quantities and shares of reported 2007 capacity and production. *** is the largestproducer followed by ***.
Table VII-1Certain OTR tires: Chinese producers’ reported capacity, production, shares of reported capacityand production, and estimated shares of total production in China, 2007.
* * * * * * *
6 Several firms recently began production of certain OTR tires: ***. 7 Several firms reported expansions: ***. 8 ***. 9 Respondents report certain factors that will discourage Chinese producers and exporters from maintainingand/or increasing their exports of certain OTR tires to the United States: the Chinese renminbi has appreciated byapproximately 20 percent against the U.S. dollar since July 2005; the July 1, 2007, VAT rebate reduction on subjectproducts from 13 percent to 5 percent; the recent rise in ocean transportation costs, increases in global competition,and the reduction of the export tax rebates for rubber products. Chinese respondents’ postchearing brief, Answers tothe Commission’s Questions, p. 4, and pp. 24-25. Hearing transcript, pp. 362-363 (Reilly), and p. 444 (Murphy). GPX posthearing brief, p. 13. 10 Counsel for respondents argued that the Chinese producers are focused on the home market and exports to thirdcountries. Chinese respondents’ posthearing brief, Answers to the Commission’s Questions, p. 23. Other exportmarkets reported by Chinese producers include: Australia, Brazil, Canada, Chile, Egypt, European Union, India,Indonesia, Liberia, Malaysia, Mexico, Morocco, New Zealand, Russia, South Africa, Turkey, United Arab Emirates,and Yemen.
VII-3
Table VII-2 presents data on the shares of 2007 reported exports to the United States for eachrespondent and their estimated shares of total exports to the United States from China in 2007. *** is thelargest exporter of certain OTR tires to the United States, followed by ***.
Table VII-2Certain OTR tires: Chinese producers’ production, shares of reported production, and shares ofreported exports to the United States, 2007
* * * * * * *
Table VII-3 presents information on Chinese producers’ certain OTR tires operations as compiledfrom responses to the Commission’s questionnaire. Chinese capacity grew throughout the period ofinvestigation, and is projected to increase in 2008 and 2009.6 7 Production increased from 2005 to 2007,fell slightly in January-March 2008, but is projected to increase in 2008 and 2009. Capacity utilizationrates registered approximately 90 percent throughout the period.8
Home market sales accounted for approximately 63-64 percent of total shipments of certain OTRtires during the period of investigation, and are projected to increase by an additional 3 to 5 percentagepoints in 2008 and 2009. Exports as a share of total shipments decreased slightly from 2005 to 2007 andare projected to decrease further in 2008 and 2009.9 Exports to third-country markets as a share of totalshipments increased slightly from 20.8 percent to 21.2 percent from 2005 to 2007, and are projected toincrease to 23.8 percent of total exports in 2009.10 In addition to certain OTR tires, a small number of Chinese producers produce nonsubject OTRtires and truck tires on the same equipment and machinery used to produce certain OTR tires. Of the 19Chinese producers that submitted questionnaire responses, all but three producers reported devotingproduction exclusively to certain OTR tires. Table VII-4 presents Chinese producers’ share of subjectand nonsubject tire production using the same equipment and machinery.
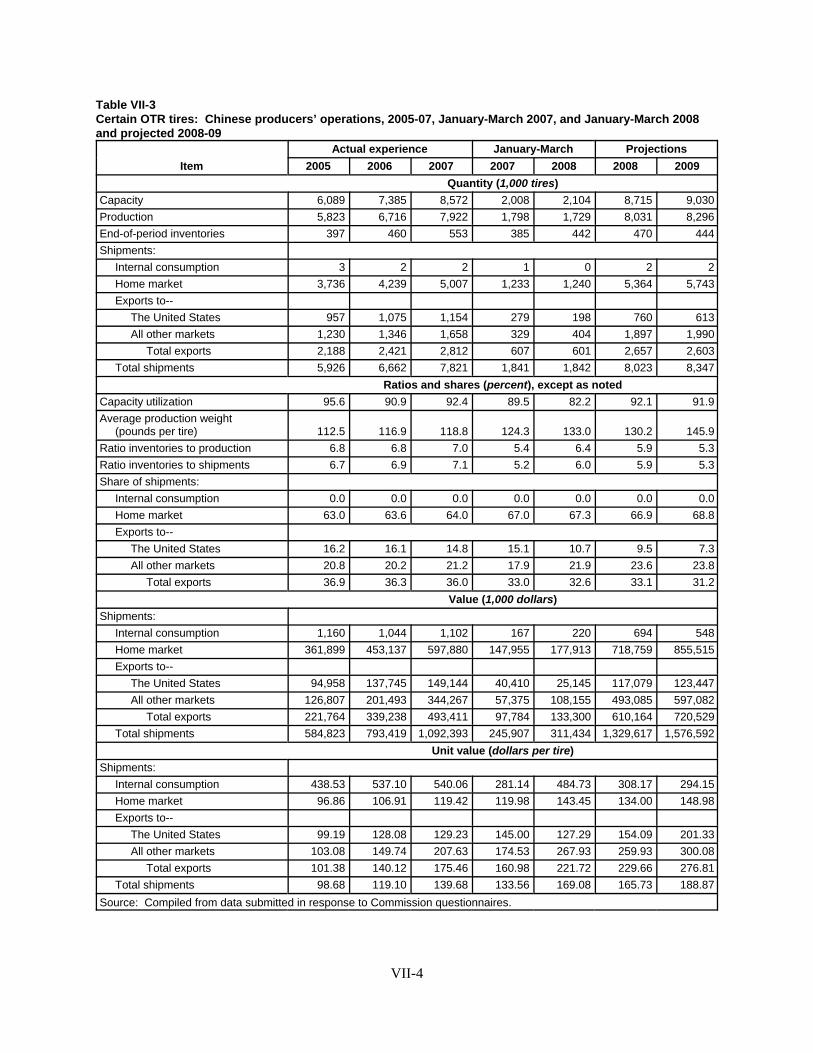
VII-4
Table VII-3Certain OTR tires: Chinese producers’ operations, 2005-07, January-March 2007, and January-March 2008and projected 2008-09
ItemActual experience January-March Projections
2005 2006 2007 2007 2008 2008 2009Quantity (1,000 tires)
Capacity 6,089 7,385 8,572 2,008 2,104 8,715 9,030Production 5,823 6,716 7,922 1,798 1,729 8,031 8,296End-of-period inventories 397 460 553 385 442 470 444Shipments: Internal consumption 3 2 2 1 0 2 2 Home market 3,736 4,239 5,007 1,233 1,240 5,364 5,743 Exports to-- The United States 957 1,075 1,154 279 198 760 613 All other markets 1,230 1,346 1,658 329 404 1,897 1,990 Total exports 2,188 2,421 2,812 607 601 2,657 2,603 Total shipments 5,926 6,662 7,821 1,841 1,842 8,023 8,347
Ratios and shares (percent), except as notedCapacity utilization 95.6 90.9 92.4 89.5 82.2 92.1 91.9Average production weight (pounds per tire) 112.5 116.9 118.8 124.3 133.0 130.2 145.9Ratio inventories to production 6.8 6.8 7.0 5.4 6.4 5.9 5.3Ratio inventories to shipments 6.7 6.9 7.1 5.2 6.0 5.9 5.3Share of shipments: Internal consumption 0.0 0.0 0.0 0.0 0.0 0.0 0.0 Home market 63.0 63.6 64.0 67.0 67.3 66.9 68.8 Exports to-- The United States 16.2 16.1 14.8 15.1 10.7 9.5 7.3 All other markets 20.8 20.2 21.2 17.9 21.9 23.6 23.8 Total exports 36.9 36.3 36.0 33.0 32.6 33.1 31.2
Value (1,000 dollars)Shipments: Internal consumption 1,160 1,044 1,102 167 220 694 548 Home market 361,899 453,137 597,880 147,955 177,913 718,759 855,515 Exports to-- The United States 94,958 137,745 149,144 40,410 25,145 117,079 123,447 All other markets 126,807 201,493 344,267 57,375 108,155 493,085 597,082 Total exports 221,764 339,238 493,411 97,784 133,300 610,164 720,529 Total shipments 584,823 793,419 1,092,393 245,907 311,434 1,329,617 1,576,592
Unit value (dollars per tire)Shipments: Internal consumption 438.53 537.10 540.06 281.14 484.73 308.17 294.15 Home market 96.86 106.91 119.42 119.98 143.45 134.00 148.98 Exports to-- The United States 99.19 128.08 129.23 145.00 127.29 154.09 201.33 All other markets 103.08 149.74 207.63 174.53 267.93 259.93 300.08 Total exports 101.38 140.12 175.46 160.98 221.72 229.66 276.81 Total shipments 98.68 119.10 139.68 133.56 169.08 165.73 188.87Source: Compiled from data submitted in response to Commission questionnaires.

VII-5
Table VII-4Tires: Shares of Chinese production of tires using the same equipment and machinery, 2007
* * * * * * *
U.S. IMPORTERS’ INVENTORIES
Data collected in these investigations on U.S. importers’ end-of-period inventories of certainOTR tires are presented table VII-5. U.S. importers’ reported inventories of certain OTR tires from Chinaincreased by 122.8 percent from 2005 to 2007, and increased by 83.3 percent in January-March 2008compared with January-March 2007. These inventories from China, as a share of imports, rose from 11.8percent in 2005 to 15.4 percent in 2007, and rose from 10.2 percent in January-March 2007 to 25.7 percent in January-March 2008. U.S. importers’ reported inventories of certain OTR tires from othersources decreased by 34.0 percent from 2005 to 2007, and decreased by 24.8 percent in January-March2008 compared with January-March 2007. These inventories from other sources, as a share of imports,fell from 26.1 percent in 2005 to 16.1 percent in 2007, and fell from 18.1 percent in January-March 2007to 11.8 percent in January-March 2008.
Table VII-5Certain OTR tires: U.S. importers’ end-of-period inventories of imports, by source, 2005-07,January-March 2007, and January-March 2008
ItemCalendar year January-March
2005 2006 2007 2007 2008China:
Inventories (1,000 tires) 97 142 217 133 243Ratio of inventories to imports (percent) 11.8 13.2 15.4 10.2 25.7Ratio to U.S. shipments of imports (percent) 11.4 14.1 16.7 9.5 24.9
Nonsubject sources:Inventories (1,000 tires) 284 243 187 223 168Ratio of inventories to imports (percent) 26.1 20.5 16.1 18.1 11.8Ratio to U.S. shipments of imports (percent) 26.8 20.8 16.5 18.3 12.2
All sources:Inventories (1,000 tires) 381 385 404 356 411Ratio of inventories to imports (percent) 19.9 17.0 15.7 14.1 17.3Ratio to U.S. shipments of imports (percent) 19.9 17.7 16.6 13.6 17.5
Source: Compiled from data submitted in response to Commission questionnaires.
U.S. IMPORTERS’ CURRENT ORDERS
Thirteen U.S. importers reported that they had placed orders for certain OTR tires from China fordelivery into the United States after March 31, 2008. Table VII-6 presents U.S. importers’ orders for theApril 2008-March 2009 period of certain OTR tires from China.
Table VII-6Certain OTR tires: U.S. importers’ orders after March 31, 2008
* * * * * * *
11 One firm, ***, reported that Argentina, Turkey, and South Africa all have antidumping duties on tires fromChina, but it is unclear at this time as to whether the tires involved are certain OTR tires. In Argentina, antidumpingduties on imports of tires from China, Indonesia, and Thailand were imposed on March 21, 2003 and antidumpingduties on imports of tires from Brazil were imposed on June 14, 2005. In South Africa, provisional antidumpingduties on imports of tires from China were imposed on October 20, 2006. In Turkey, antidumping duties on importsof new rubber pneumatic tires from China were imposed on August 20, 2005. *** importer questionnaire response,section I-10. 12 Silicon Metal from Russia, Inv. No. 731-TA-991 (Second Remand), USITC Publication 3910, March 2007, p. 2;citing Bratsk Aluminum Smelter v. United States, 444 F.3d at 1375. 13 In the silicon metal remand, Chairman Pearson noted “consistent with his views in Lined Paper SchoolSupplies From China, India, and Indonesia, Inv. Nos. 701-TA-442-443 and 731-TA-1095-1097 (Final), USITC Pub.3884 (Sept. 2006) at 51, that while he agrees with the Commission that the Federal Circuit’s opinion suggests areplacement/benefit test, he also finds that the Federal Circuit’s opinion could be read, not as requiring a new test,but rather as a reminder that the Commission, before it makes an affirmative determination, must satisfy itself that ithas not attributed material injury to factors other than subject imports.” Silicon Metal from Russia, Inv. No. 731-TA-991 (Second Remand), USITC Publication 3910, March 2007, p. 2, fn. 17. Commissioner Okun joined in thoseseparate and dissenting views in Lined Paper. 14 Certain Off-the-Road Tires From China, Inv. Nos. 701-TA-448 and 731-TA-1117 (Preliminary), USITC Pub.3943 (Aug. 2007), p. 15, fn. 97. The Commission invited any party to indicate a contrary view during the finalphase of the investigations and none did. 15 Tires are not a commodity but are “highly engineered technical goods designed to meet a myriad ofapplications and uses.” Hearing transcript, p. 264 (Ganz).
VII-6
ANTIDUMPING AND COUNTERVAILING DUTY ORDERS IN THIRD-COUNTRY MARKETS
Based on questionnaire responses of U.S. producers, U.S. importers, and Chinese producers, noknown antidumping or countervailing duties on subject OTR tires exist in third-country markets.11
INFORMATION ON NONSUBJECT SOURCES
“Bratsk” Considerations
As a result of the Court of Appeals for the Federal Circuit (“CAFC”) decision in BratskAluminum Smelter v. United States (“Bratsk”), the Commission is directed to:12 13
undertake an “additional causation inquiry” whenever certain triggering factors aremet: “whenever the antidumping investigation is centered on a commodity product, andprice competitive non-subject imports are a significant factor in the market.” Theadditional inquiry required by the Court, which we refer to as the Bratskreplacement/benefit test, is “whether non-subject imports would have replaced thesubject imports without any beneficial effect on domestic producers.
All parties agreed during the preliminary phase of these investigations that the Bratskconsiderations do not apply to certain OTR tires because such tires are not commodity products and theCommission determined not to apply Bratsk.14 15

16 Retrieved from www.rubbernews.com on July 27, 2007. 17 International Rubber Study Group, Wembley, U.K., 2007.
VII-7
The Global Tire Industry
The tire industry is multinational in nature; therefore, production plants are situated in virtuallyevery geographic region, particularly in North America, Europe, Japan, other Asian countries, Oceania,Latin America, the Middle East, and Africa.16 Strategic supplies of natural rubber integral to theproduction of certain OTR tires are situated near the equator in many of the Asian countries, includingMalaysia, Indonesia, Thailand, India, China, and Sri Lanka; there is also significant production in Brazil,and several West African countries.17 Tire plants of one form or another are also found in all of thesecountries. Large global tire plants in many regions of the world have the capability to produce a varietyof tires, including passenger car, truck and bus, and certain OTR tires, variably dependent upon logistics,demand, and affiliation.
Based on 2006 new tire sales of all types, Bridgestone is the largest tire manufacturer in theworld, followed by Michelin and Goodyear. Among them, they accounted for $56 billion, or about 67percent of the aggregate $84 billion total of new tire sales by the top 10 global leaders.


A-1
APPENDIX A
FEDERAL REGISTER NOTICES


11437 Federal Register / Vol. 73, No. 42 / Monday, March 3, 2008 / Notices
1 For purposes of these investigations, the Department of Commerce has defined the subject merchandise as new pneumatic tires designed for off-the-road (‘‘OTR’’) and off-highway use, subject to exceptions identified in Commerce’s Preliminary Determination of Sales at Less Than Fair Value and Postponement of Final Determination (73 FR 9278, February 20, 2008). Certain OTR tires are generally designed, manufactured and offered for sale for use on off-road or off-highway surfaces, including but not limited to, agricultural fields, forests, construction sites, factory and warehouse interiors, airport tarmacs, ports and harbors, mines, quarries, gravel yards, and steel mills. The vehicles and equipment for which certain OTR tires are designed are used in hauling, towing, lifting, and/or loading a wide variety of equipment and materials in agricultural, construction and industrial settings.
5204 as soon as possible. In order to allow sufficient time to process requests, please call Mr. Hubbard no later than one week before the meeting. Information regarding this project is available in alternative formats upon request.
Dated: February 13, 2008. John F. Davis, Deputy Regional Director, Mid-Pacific Region. [FR Doc. 08–912 Filed 2–29–08; 8:45 am] BILLING CODE 4310–MN–M
INTERNATIONAL TRADE COMMISSION
[Investigation Nos. 701–TA–448 and 731– TA–1117 (Final)]
Certain Off-the-Road Tires From China
AGENCY: United States International Trade Commission. ACTION: Scheduling of the final phase of countervailing duty and antidumping investigations.
SUMMARY: The Commission hereby gives notice of the scheduling of the final phase of countervailing duty investigation No. 701–TA–448 (Final) under section 705(b) of the Tariff Act of 1930 (19 U.S.C. 1671d(b)) (the Act) and the final phase of antidumping investigation No. 731–TA–1117 (Final) under section 735(b) of the Act (19 U.S.C. 1673d(b)) to determine whether an industry in the United States is materially injured or threatened with material injury, or the establishment of an industry in the United States is materially retarded, by reason of subsidized and less-than-fair-value imports from China of certain off-the- road tires, provided for in subheading 4011.20.10, 4011.20.50, 4011.61.00, 4011.62.00, 4011.63.00, 4011.69.00, 4011.92.00, 4011.93.40, 4011.93.80, 4011.94.40, and 4011.94.80 of the Harmonized Tariff Schedule of the United States.1
For further information concerning the conduct of this phase of the
investigations, hearing procedures, and rules of general application, consult the Commission’s Rules of Practice and Procedure, part 201, subparts A through E (19 CFR part 201), and part 207, subparts A and C (19 CFR part 207). EFFECTIVE DATE: February 20, 2008. FOR FURTHER INFORMATION CONTACT: Elizabeth Haines (202–205–3200), Office of Investigations, U.S. International Trade Commission, 500 E Street, SW., Washington, DC 20436. Hearing- impaired persons can obtain information on this matter by contacting the Commission’s TDD terminal on 202– 205–1810. Persons with mobility impairments who will need special assistance in gaining access to the Commission should contact the Office of the Secretary at 202–205–2000. General information concerning the Commission may also be obtained by accessing its Internet server (http:// www.usitc.gov). The public record for these investigations may be viewed on the Commission’s electronic docket (EDIS) at http://edis.usitc.gov. SUPPLEMENTARY INFORMATION:
Background.—The final phase of these investigations is being scheduled as a result of affirmative preliminary determinations by the Department of Commerce that certain benefits which constitute subsidies within the meaning of section 703 of the Act (19 U.S.C. 1671b) are being provided to manufacturers, producers, or exporters in China of certain off-the-road tires, and that such products are being sold in the United States at less than fair value within the meaning of section 733 of the Act (19 U.S.C. 1673b). The investigations were requested in a petition filed on June 18, 2007, by Titan Tire Corporation (Des Moines, IA) and The United Steelworkers (Pittsburgh, PA)
Participation in the investigations and public service list.—Persons, including industrial users of the subject merchandise and, if the merchandise is sold at the retail level, representative consumer organizations, wishing to participate in the final phase of these investigations as parties must file an entry of appearance with the Secretary to the Commission, as provided in section 201.11 of the Commission’s rules, no later than 21 days prior to the hearing date specified in this notice. A party that filed a notice of appearance during the preliminary phase of the investigations need not file an additional notice of appearance during this final phase. The Secretary will maintain a public service list containing the names and addresses of all persons,
or their representatives, who are parties to the investigations.
Limited disclosure of business proprietary information (BPI) under an administrative protective order (APO) and BPI service list.—Pursuant to section 207.7(a) of the Commission’s rules, the Secretary will make BPI gathered in the final phase of these investigations available to authorized applicants under the APO issued in the investigations, provided that the application is made no later than 21 days prior to the hearing date specified in this notice. Authorized applicants must represent interested parties, as defined by 19 U.S.C. 1677(9), who are parties to the investigations. A party granted access to BPI in the preliminary phase of the investigations need not reapply for such access. A separate service list will be maintained by the Secretary for those parties authorized to receive BPI under the APO.
Staff report.—The prehearing staff report in the final phase of these investigations will be placed in the nonpublic record on June 18, 2008, and a public version will be issued thereafter, pursuant to section 207.22 of the Commission’s rules.
Hearing.—The Commission will hold a hearing in connection with the final phase of these investigations beginning at 9:30 a.m. on July 2, 2008, at the U.S. International Trade Commission Building. Requests to appear at the hearing should be filed in writing with the Secretary to the Commission on or before June 25, 2008. A nonparty who has testimony that may aid the Commission’s deliberations may request permission to present a short statement at the hearing. All parties and nonparties desiring to appear at the hearing and make oral presentations should attend a prehearing conference to be held at 9:30 a.m. on June 30, 2008, at the U.S. International Trade Commission Building. Oral testimony and written materials to be submitted at the public hearing are governed by sections 201.6(b)(2), 201.13(f), and 207.24 of the Commission’s rules. Parties must submit any request to present a portion of their hearing testimony in camera no later than 7 business days prior to the date of the hearing.
Written submissions.—Each party who is an interested party shall submit a prehearing brief to the Commission. Prehearing briefs must conform with the provisions of section 207.23 of the Commission’s rules; the deadline for filing is June 25, 2008. Parties may also file written testimony in connection with their presentation at the hearing, as provided in section 207.24 of the
VerDate Aug<31>2005 15:33 Feb 29, 2008 Jkt 214001 PO 00000 Frm 00057 Fmt 4703 Sfmt 4703 E:\FR\FM\03MRN1.SGM 03MRN1rmaj
ette
on
PR
OD
1PC
64 w
ith N
OT
ICE
S
11438 Federal Register / Vol. 73, No. 42 / Monday, March 3, 2008 / Notices
Commission’s rules, and posthearing briefs, which must conform with the provisions of section 207.25 of the Commission’s rules. The deadline for filing posthearing briefs is July 10, 2008; witness testimony must be filed no later than three days before the hearing. In addition, any person who has not entered an appearance as a party to the investigations may submit a written statement of information pertinent to the subject of the investigations, including statements of support or opposition to the petition, on or before July 10, 2008. On July 31, 2008, the Commission will make available to parties all information on which they have not had an opportunity to comment. Parties may submit final comments on this information on or before August 4, 2008, but such final comments must not contain new factual information and must otherwise comply with section 207.30 of the Commission’s rules. All written submissions must conform with the provisions of section 201.8 of the Commission’s rules; any submissions that contain BPI must also conform with the requirements of sections 201.6, 207.3, and 207.7 of the Commission’s rules. The Commission’s rules do not authorize filing of submissions with the Secretary by facsimile or electronic means, except to the extent permitted by section 201.8 of the Commission’s rules, as amended, 67 FR 68036 (November 8, 2002). Even where electronic filing of a document is permitted, certain documents must also be filed in paper form, as specified in II (C) of the Commission’s Handbook on Electronic Filing Procedures, 67 FR 68168, 68173 (November 8, 2002).
Additional written submissions to the Commission, including requests pursuant to section 201.12 of the Commission’s rules, shall not be accepted unless good cause is shown for accepting such submissions, or unless the submission is pursuant to a specific request by a Commissioner or Commission staff.
In accordance with sections 201.16(c) and 207.3 of the Commission’s rules, each document filed by a party to the investigations must be served on all other parties to the investigations (as identified by either the public or BPI service list), and a certificate of service must be timely filed. The Secretary will not accept a document for filing without a certificate of service.
Authority: These investigations are being conducted under authority of title VII of the Tariff Act of 1930; this notice is published pursuant to section 207.21 of the Commission’s rules.
By order of the Commission.
Issued: February 27, 2008. Marilyn R. Abbott,
Secretary to the Commission. [FR Doc. E8–3991 Filed 2–29–08; 8:45 am] BILLING CODE 7020–02–P
INTERNATIONAL TRADE COMMISSION
[Investigation No. 337–TA–602]
In the Matter of Certain GPS Devices and Products Containing Same; Notice of Commission Determination Not To Review an Initial Determination Granting Complainant’s Motion To Amend the Complaint and Notice of Investigation
AGENCY: U.S. International Trade Commission. ACTION: Notice.
SUMMARY: Notice is hereby given that the U.S. International Trade Commission has determined not to review an initial determination (‘‘ID’’) (Order No. 16) issued by the presiding administrative law judge (‘‘ALJ’’) granting complainant’s motion to amend the complaint and notice of investigation. FOR FURTHER INFORMATION CONTACT: Michelle Walters, Office of the General Counsel, U.S. International Trade Commission, 500 E Street, SW., Washington, DC 20436, telephone (202) 708–5468. Copies of non-confidential documents filed in connection with this investigation are or will be available for inspection during official business hours (8:45 a.m. to 5:15 p.m.) in the Office of the Secretary, U.S. International Trade Commission, 500 E Street, SW., Washington, DC 20436, telephone (202) 205–2000. General information concerning the Commission may also be obtained by accessing its Internet server at http://www.usitc.gov. The public record for this investigation may be viewed on the Commission’s electronic docket (EDIS) at http:// edis.usitc.gov. Hearing-impaired persons are advised that information on this matter can be obtained by contacting the Commission’s TDD terminal on (202) 205–1810. SUPPLEMENTARY INFORMATION: The Commission instituted this investigation on May 7, 2007, based on a complaint filed by Global Locate, Inc. (‘‘Global Locate’’). 72 FR 25777 (May 7, 2007). The complaint alleges violations of section 337 of the Tariff Act of 1930 (19 U.S.C. 1337) in the importation into the United States, the sale for importation, and the sale within the United States after importation of certain GPS devices
and products containing the same by reason of infringement of claims 1 and 17 of United States Patent No. 6,417,801 (‘‘the ‘801 patent’’); claims 1, 3–5, 8–17, 19–21, and 23 of United States Patent No. 6,606,346 (‘‘the ‘346 patent’’); and various other claims of United States Patent Nos. 6,651,000, 6,704,651, 6,937,187, and 7,158,080. The complaint names five respondents: SiRF Technology, Inc.; Pharos Science & Applications, Inc.; MiTAC International Corp.; Mio Technology Ltd., USA; and E–TEN Information Systems Co., Ltd. (collectively, ‘‘respondents’’).
On December 17, 2007, Global Locate moved to amend the complaint and notice of investigation by terminating the investigation with regard to claims 1, 3, 8, 9, 10, and 23 of the ‘346 patent and by adding claims 2, 6, 11, 14, 18, and 19 of the ‘801 patent. Global Locate also sought to add Broadcom Corporation (‘‘Broadcom’’) as a complainant, because Broadcom recently acquired Global Locate. Respondents did not oppose termination of the investigation as to the claims of the ‘346 patent, but did oppose the addition of the claims of the ‘801 patent and the addition of Broadcom to the investigation. The Commission investigative attorney supported Global Locate’s motion.
On February 5, 2008, the ALJ granted Global Locate’s motion, finding that, pursuant to Commission Rule 210.14(b)(1) (19 CFR **210.14(b)(1)), there was good cause to amend the complaint and notice of investigation. No petitions for review of this ID were filed.
The Commission has determined not to review the ID.
The authority for the Commission’s determination is contained in section 337 of the Tariff Act of 1930, as amended (19 U.S.C. 1337), and in section 210.42 of the Commission’s Rules of Practice and Procedure (19 CFR 210.42).
By order of the Commission.
Issued: February 25, 2008.
Marilyn R. Abbott, Secretary to the Commission. [FR Doc. E8–3979 Filed 2–29–08; 8:45 am]
BILLING CODE 7020–02–P
VerDate Aug<31>2005 15:33 Feb 29, 2008 Jkt 214001 PO 00000 Frm 00058 Fmt 4703 Sfmt 4703 E:\FR\FM\03MRN1.SGM 03MRN1rmaj
ette
on
PR
OD
1PC
64 w
ith N
OT
ICE
S

19249 Federal Register / Vol. 73, No. 69 / Wednesday, April 9, 2008 / Notices
Public Law 108–430 was passed by Congress and signed by the President in December 2004. This Act expanded Petrified Forest National Park boundaries by approximately 125,000 acres, and directed the NPS to prepare a management plan for the new park lands within three years. Planning for the new lands is the focus of this GMP amendment and associated EIS.
The GMP amendment will establish the overall direction for park addition lands, setting broad management goals for the area for the next 15 to 20 years. Among the topics that will be addressed are protection of natural and cultural resources, protection of riparian resources, appropriate range of visitor uses, impacts of visitor uses, adequacy of park infrastructure, visitor access to the park additions area, education and interpretive efforts, and external pressures on the park. Management zones that were established in the current GMP will be applied to addition lands. These zones outline the kinds of resource management activities, visitor activities, and developments that would be appropriate in the addition lands.
A range of reasonable alternatives for managing the park, including a no- action alternative and a preferred alternative, will be developed through the planning process and included in the EIS. The EIS will evaluate the potential environmental impacts of the alternatives.
As the first phase of the planning and EIS process, the National Park Service is beginning to scope the issues to be addressed in the GMP amendment. All interested persons, organizations, and agencies are encouraged to submit comments and suggestions regarding the issues or concerns the GMP amendment should address, including a suitable range of alternatives and appropriate mitigating measures, and the nature and extent of potential environmental impacts.
DATES: Written comments on the scope of the GMP amendment/EIS will be accepted for 60 days beyond the publication of this Notice of Intent. In addition, a public scoping session will be held in Holbrook, Arizona in the Spring of 2008. The location, date, and time of this meeting will be provided in local and regional newspapers, and on the Internet at http://parkplanning/ nps.gov/pefo. ADDRESSES: Written comments or requests to be added to the project mailing list should be directed to: Cliff Spencer, Superintendent, Petrified Forest National Park, P.O. Box 2217, Petrified Forest, AZ 86028; telephone
(928) 524–6228; e-mail: http:// parkplanning/nps.gov/pefo. FOR FURTHER INFORMATION CONTACT: Contact Cliff Spencer, Superintendent, Petrified Forest National Park, P.O. Box 2217, Petrified Forest, AZ 86028; telephone (928) 524–6228. General information about Petrified Forest National Park is available on the Internet at http://www.nps.gov/pefo. SUPPLEMENTARY INFORMATION: Please submit Internet comments as a text file, avoiding the use of special characters and any form of encryption. Before including your address, phone number, e-mail address, or other personal identifying information in your comment, you should be aware that your entire comment—including your personal identifying information—may be made publicly available at any time. While you can ask us in your comment to withhold your personal identifying information from public review, we cannot guarantee that we will be able to do so.
Dated: March 21, 2008. Michael D. Snyder, Regional Director, Intermountain Region, National Park Service. [FR Doc. E8–7409 Filed 4–8–08; 8:45 am] BILLING CODE 4310–7V–M
INTERNATIONAL TRADE COMMISSION
[Investigation Nos. 701–TA–448 and 731– TA–1117 (Final)]
Certain Off-the-Road Tires From China
AGENCY: United States International Trade Commission. ACTION: Revised schedule for the subject investigations.
DATES: Effective Date: April 3, 2008. FOR FURTHER INFORMATION CONTACT: Elizabeth Haines (202–205–3200), Office of Investigations, U.S. International Trade Commission, 500 E Street, SW., Washington, DC 20436. Hearing- impaired persons can obtain information on this matter by contacting the Commission’s TDD terminal on 202– 205–1810. Persons with mobility impairments who will need special assistance in gaining access to the Commission should contact the Office of the Secretary at 202–205–2000. General information concerning the Commission may also be obtained by accessing its Internet server (http:// www.usitc.gov). The public record for these investigations may be viewed on the Commission’s electronic docket (EDIS) at http://edis.usitc.gov.
SUPPLEMENTARY INFORMATION: Effective February 20, 2008, the Commission established a schedule for the conduct of the final phase of the subject investigations (73 FR 11437, March 3, 2008). One party to these investigations has identified a substantial conflict with respect to its ability to participate in the hearing. Accordingly, at the request of that party and after consideration of the positions of the other parties to the investigations, the Commission is revising its schedule.
The Commission’s new schedule for the investigations is as follows: requests to appear at the hearing must be filed with the Secretary to the Commission not later than June 27, 2008; the prehearing conference will be held at the U.S. International Trade Commission Building at 9:30 a.m. on July 3, 2008; the prehearing staff report will be placed in the nonpublic record on June 20, 2008; the deadline for filing prehearing briefs is June 27, 2008; the hearing will be held at the U.S. International Trade Commission Building at 9:30 a.m. on July 8, 2008; the deadline for filing posthearing briefs is July 15, 2008; the Commission will make its final release of information on August 5, 2008; and final party comments are due on August 7, 2008.
For further information concerning these investigations see the Commission’s notice cited above and the Commission’s Rules of Practice and Procedure, part 201, subparts A through E (19 CFR part 201), and part 207, subparts A and C (19 CFR part 207).
Authority: These investigations are being conducted under authority of title VII of the Tariff Act of 1930; this notice is published pursuant to section 207.21 of the Commission’s rules.
By order of the Commission. Dated: April 3, 2008.
Marilyn R. Abbott, Secretary to the Commission. [FR Doc. E8–7426 Filed 4–8–08; 8:45 am] BILLING CODE 7020–02–P
DEPARTMENT OF JUSTICE
Notice of Lodging Proposed Consent Decree
In accordance with Departmental Policy, 28 CFR 50.7, notice is hereby given that a proposed Consent Decree in United States v. Freeway Land Co., Civ. No. 07–1819–JO (D. Or.) was lodged with the United States District Court for the District of Oregon on March 27, 2008.
This proposed Consent Decree concerns a complaint filed by the
VerDate Aug<31>2005 18:06 Apr 08, 2008 Jkt 214001 PO 00000 Frm 00064 Fmt 4703 Sfmt 4703 E:\FR\FM\09APN1.SGM 09APN1mst
ocks
till o
n P
RO
D1P
C66
with
NO
TIC
ES

38467 Federal Register / Vol. 73, No. 130 / Monday, July 7, 2008 / Notices
1 The record is defined in sec. 207.2(f) of the Commission’s Rules of Practice and Procedure (19 CFR § 207.2(f)).
2 Commissioner Okun did not participate in this determination.
ADDRESSES: Copies of the exploration plan are available for review during normal business hours in the following offices (serialized under number WYW177016): Bureau of Land Management, Wyoming State Office, 5353 Yellowstone Road, P.O. Box 1828, Cheyenne, WY 82003; and, Bureau of Land Management, Casper Field Office, 2987 Prospector Drive, Casper, WY 82604. The written notice should be sent to the following addresses: Kiewit Mining Properties Inc., Attn: Greg Todd, Project Engineer, Buckskin Mining Co., P.O. Box 3027, Gillette, WY 82717– 3027, and the Bureau of Land Management, Wyoming State Office, Branch of Solid Minerals, Attn: Julie Weaver, P.O. Box 1828, Cheyenne, WY 82003. SUPPLEMENTARY INFORMATION: All of the coal in the above-described land consists of unleased Federal coal within the Powder River Basin Known Coal Leasing Area. The purpose of the exploration program is to obtain geological and other pertinent data concerning the coal deposits.
This notice of invitation will be published in News-Record of Gillette, WY once each week for two consecutive weeks beginning the week of July 7, 2008, and in the Federal Register.
The foregoing is published in the Federal Register pursuant to 43 CFR 3410.2–1(c)(1).
Dated: June 24, 2008. Larry Claypool, Deputy State Director, Minerals and Lands. [FR Doc. E8–14853 Filed 7–3–08; 8:45 am] BILLING CODE 4310–22–P
DEPARTMENT OF THE INTERIOR
Bureau of Land Management
[WY–920–1430–FR; WYW–138016]
Corrected Notice of Realty Action: Recreation and Public Purposes Act Classification of Public Lands in Sweetwater County, WY
AGENCY: Bureau of Land Management, Interior. ACTION: Notice.
SUMMARY: This notice corrects the legal description of the Notice of Realty Action published on May 23, 2002, which classified land under the Recreation and Public Purposes Act in Sweetwater County for a county jail facility. FOR FURTHER INFORMATION CONTACT: Tamara Gertsch, Realty Officer, Bureau of Land Management, Wyoming State Office, at (307) 775-6115.
SUPPLEMENTARY INFORMATION: The Notice of Realty Action published on May 23, 2002 (FR 67 36223), had an incomplete legal description. The correct legal description is:
Sixth Principal Meridian, Wyoming
T. 18 N., R. 105 W., Sec. 18, lot 7, NE1⁄4SW1⁄4, NW1⁄4SE1⁄4 The land described contains 105.00 acres,
more or less.
All other aspects of the notice remain in effect as published.
Dated: June 27, 2008. Tamara J. Gertsch, Realty Officer. [FR Doc. E8–15373 Filed 7–3–08; 8:45 am] BILLING CODE 4310–22–P
INTERNATIONAL TRADE COMMISSION
[Investigation Nos. 701–TA–448 and 731– TA–1117 (Final)]
Certain Off-the-Road Tires From China
AGENCY: United States International Trade Commission. ACTION: Revised schedule for the subject investigations.
DATES: Effective Date: June 27, 2008. FOR FURTHER INFORMATION CONTACT: Elizabeth Haines (202–205–3200), Office of Investigations, U.S. International Trade Commission, 500 E Street, SW., Washington, DC 20436. Hearing- impaired persons can obtain information on this matter by contacting the Commission’s TDD terminal on 202– 205–1810. Persons with mobility impairments who will need special assistance in gaining access to the Commission should contact the Office of the Secretary at 202–205–2000. General information concerning the Commission may also be obtained by accessing its Internet server (http:// www.usitc.gov). The public record for these investigations may be viewed on the Commission’s electronic docket (EDIS) at http://edis.usitc.gov. SUPPLEMENTARY INFORMATION: Effective April 3, 2008, the Commission established a revised schedule for the conduct of the final phase of the subject investigations (73 FR 19249, April 9, 2008).
The Commission has decided to revise its schedule with respect to the starting time of the hearing and the date for filing posthearing briefs. The hearing will begin at 1 p.m., Tuesday, July 8, 2008. At that time, the Commission will hear the presentation of those in support of the imposition of countervailing and antidumping duties and will question
that panel. At the conclusion of questioning by the Commission and others, the hearing will be recessed and will reconvene at 9:30 a.m., Wednesday, July 9, 2008. At that time, the Commission will hear the presentation of those in opposition to the imposition of countervailing and antidumping duties, to be followed by questioning of that panel. As a result of this change, posthearing briefs will be due Wednesday, July 16, 2008.
For further information concerning these investigations see the Commission’s notice cited above and the Commission’s Rules of Practice and Procedure, part 201, subparts A through E (19 CFR part 201), and part 207, subparts A and C (19 CFR part 207).
Authority: These investigations are being conducted under authority of title VII of the Tariff Act of 1930; this notice is published pursuant to section 207.21 of the Commission’s rules.
By order of the Commission. Issued: June 30, 2008.
Marilyn R. Abbott, Secretary to the Commission. [FR Doc. E8–15139 Filed 7–3–08; 8:45 am] BILLING CODE 7020–02–P
INTERNATIONAL TRADE COMMISSION
[Investigation No. 731–TA–991 (Review)]
Silicon Metal From Russia
Determination On the basis of the record 1 developed
in the subject five-year review, the United States International Trade Commission (Commission) determines,2 pursuant to section 751(c) of the Tariff Act of 1930 (19 U.S.C. 1675(c)), that revocation of the antidumping duty order on silicon metal from Russia would be likely to lead to continuation or recurrence of material injury to an industry in the United States within a reasonably foreseeable time.
Background The Commission instituted this
review on February 1, 2008 (73 FR 6204) and determined on May 6, 2008 that it would conduct an expedited review (73 FR 28153, May 15, 2008).
The Commission transmitted its determination in this review to the Secretary of Commerce on June 30, 2008. The views of the Commission are contained in USITC Publication 4018
VerDate Aug<31>2005 18:42 Jul 03, 2008 Jkt 214001 PO 00000 Frm 00079 Fmt 4703 Sfmt 4703 E:\FR\FM\07JYN1.SGM 07JYN1mst
ocks
till o
n P
RO
D1P
C66
with
NO
TIC
ES
42594 Federal Register / Vol. 73, No. 141 / Tuesday, July 22, 2008 / Notices
ADDRESSES: Documents and other information submitted with these applications are available for review, subject to the requirements of the Privacy Act and Freedom of Information Act, by any party who submits a written request for a copy of such documents within 30 days of the date of publication of this notice to: U.S. Fish and Wildlife Service, Division of Management Authority, 4401 North Fairfax Drive, Room 212, Arlington, Virginia 22203; fax 703/358–2281. FOR FURTHER INFORMATION CONTACT: Division of Management Authority, telephone 703/358–2104. SUPPLEMENTARY INFORMATION:
Endangered Species
The public is invited to comment on the following applications for a permit to conduct certain activities with endangered species. This notice is provided pursuant to Section 10(c) of the Endangered Species Act of 1973, as amended (16 U.S.C. 1531 et seq.). Written data, comments, or requests for copies of these complete applications should be submitted to the Director (address above).
Applicant: Molecular Anthropology Laboratory, Arizona State University, Tempe, AZ, PRT–185767.
The applicant requests a permit to acquire from Coriell Cell Repositories, Camden, NJ, in interstate commerce thirteen DNA samples from gorillas (Gorilla gorilla) and one DNA sample from red-capped mangabey (Cercocebus torquatus) for the purpose of scientific research.
Applicant: Byron G. Sadler, Lake Jackson, TX, PRT–187324.
The applicant requests a permit to import the sport-hunted trophy of one male bontebok (Damaliscus pygargus pygargus) culled from a captive herd maintained under the management program of the Republic of South Africa, for the purpose of enhancement of the survival of the species.
Applicant: Hollis B. Higginbothan, McMurray, PA, PRT–185730.
The applicant requests a permit to import the sport-hunted trophy of one male bontebok (Damaliscus pygargus pygargus) culled from a captive herd maintained under the management program of the Republic of South Africa, for the purpose of enhancement of the survival of the species.
Endangered Marine Mammals
The public is invited to comment on the following application for a permit to conduct certain activities with endangered marine mammals and/or marine mammals. The application was
submitted to satisfy requirements of the Endangered Species Act of 1973, as amended (16 U.S.C. 1531 et seq.) and the Marine Mammal Protection Act of 1972, as amended (16 U.S.C. 1361 et seq.), and the regulations governing endangered species (50 CFR Part 17) and marine mammals (50 CFR Part 18). Written data, comments, or requests for copies of the complete applications or requests for a public hearing on these applications should be submitted to the Director (address above). Anyone requesting a hearing should give specific reasons why a hearing would be appropriate. The holding of such a hearing is at the discretion of the Director.
Applicant: ABR, Inc.-Environmental Research & Services, Fairbanks, AK, PRT–187053.
The applicant requests a permit to conduct on-shore, boat-based and aerial surveys of northern sea otters (Enhydra lutris kenyoni) at various locations in the coastal waters of Alaska for the purpose of scientific research. This notification covers activities to be conducted by the applicant over a five- year period.
Concurrent with the publication of this notice in the Federal Register, the Division of Management Authority is forwarding copies of the above applications to the Marine Mammal Commission and the Committee of Scientific Advisors for their review.
Dated: June 27, 2008. Michael L. Carpenter, Senior Permit Biologist, Branch of Permits, Division of Management Authority. [FR Doc. E8–16712 Filed 7–21–08; 8:45 am] BILLING CODE 4310–55–P
INTERNATIONAL TRADE COMMISSION
[Investigation Nos. 701–TA–448 and 731– TA–1117 (Final)]
Certain Off-the-Road Tires From China
AGENCY: United States International Trade Commission. ACTION: Revised schedule for the subject investigations.
DATES: Effective Date: July 17, 2008. FOR FURTHER INFORMATION CONTACT: Elizabeth Haines (202–205–3200), Office of Investigations, U.S. International Trade Commission, 500 E Street, SW., Washington, DC 20436. Hearing- impaired persons can obtain information on this matter by contacting the Commission’s TDD terminal on 202– 205–1810. Persons with mobility impairments who will need special
assistance in gaining access to the Commission should contact the Office of the Secretary at 202–205–2000. General information concerning the Commission may also be obtained by accessing its internet server (http:// www.usitc.gov). The public record for these investigations may be viewed on the Commission’s electronic docket (EDIS) at http://edis.usitc.gov. SUPPLEMENTARY INFORMATION: Effective April 3, 2008, the Commission established a revised schedule for the conduct of the final phase of the subject investigations (73 FR 19249, April 9, 2008).
The Commission has decided to revise its schedule with respect to the date for its final release of information and the date for final party comments. The Commission will make its final release of information on August 7, 2008 and final party comments are due on August 11, 2008.
For further information concerning these investigations see the Commission’s notice cited above and the Commission’s Rules of Practice and Procedure, part 201, subparts A through E (19 CFR part 201), and part 207, subparts A and C (19 CFR part 207).
Authority: These investigations are being conducted under authority of title VII of the Tariff Act of 1930; this notice is published pursuant to section 207.21 of the Commission’s rules.
By order of the Commission. Issued: July 17, 2008.
Marilyn R. Abbott, Secretary to the Commission. [FR Doc. E8–16764 Filed 7–21–08; 8:45 am] BILLING CODE 7020–02–P
DEPARTMENT OF JUSTICE
Notice of Lodging of Consent Decree Under the Safe Drinking Water Act
Notice is hereby given that on July 16, 2008, a proposed Consent Decree (the ‘‘Decree’’) in United States v. City of Middletown, New York, Civil Action No. 08 Civ. 6369 (SCR) (LMS) was lodged with the United States District Court for the Southern District of New York.
In a complaint, filed simultaneously with the Decree, the United States charged that the City of Middletown (the ‘‘City’’) violated the Safe Drinking Water Act, 42 U.S.C. 300f, et seq., by violating the Interim Enhanced Surface Water Treatment Rule, found at 40 CFR part 141, subpart P; 40 CFR 141.170– 141.175 (‘‘IESWTR’’), and specifically failing to comply with the February 28, 2006 deadline, set in an Administrative Order issued by EPA against the City on
VerDate Aug<31>2005 19:47 Jul 21, 2008 Jkt 214001 PO 00000 Frm 00053 Fmt 4703 Sfmt 4703 E:\FR\FM\22JYN1.SGM 22JYN1srob
erts
on
PR
OD
1PC
70 w
ith N
OT
ICE
S
40480 Federal Register / Vol. 73, No. 136 / Tuesday, July 15, 2008 / Notices
1 An extension of 30 days from the current deadline of August 2, 2008, would result in a new deadline of September 1, 2008. However, since September 1, 2008, is a federal holiday, the deadline will be the next business day, September 2, 2008.
BROADCASTING BOARD OF GOVERNORS
Sunshine Act Meeting
DATE AND TIME: Wednesday, July 16, 2008, 2:45 p.m.–4 p.m. PLACE: Cohen Building, Room 3321, 330 Independence Ave., SW., Washington, DC 20237. CLOSED MEETING: The members of the Broadcasting Board of Governors (BBG) will meet in closed session to review and discuss a number of issues relating to U.S. Government-funded non- military international broadcasting. They will address internal procedural, budgetary, and personnel issues, as well as sensitive foreign policy issues relating to potential options in the U.S. international broadcasting field. This meeting is closed because if open it likely would either disclose matters that would be properly classified to be kept secret in the interest of foreign policy under the appropriate executive order (5 U.S.C. 552b.(c)(1)) or would disclose information the premature disclosure of which would be likely to significantly frustrate implementation of a proposed agency action. (5 U.S.C. 552b.(c)(9)(B)) In addition, part of the discussion will relate solely to the internal personnel and organizational issues of the BBG or the International Broadcasting Bureau. (5 U.S.C. 552b.(c)(2) and (6)) CONTACT PERSON FOR MORE INFORMATION: Persons interested in obtaining more information should contact Timi Nickerson Kenealy at (202) 203–4545.
Timi Nickerson Kenealy, Acting Legal Counsel. [FR Doc. 08–1432 Filed 7–11–08; 8:57 am] BILLING CODE 8610–01–P
DEPARTMENT OF COMMERCE
International Trade Administration
[A–570–836]
Notice of Extension of Time Limit for Final Results of the Antidumping Duty Administrative Review: Glycine from the People’s Republic of China
AGENCY: Import Administration, International Trade Administration, Department of Commerce. EFFECTIVE DATE: July 15, 2008. FOR FURTHER INFORMATION CONTACT: Erin Begnal or Toni Dach, AD/CVD Operations, Office 9, Import Administration, International Trade Administration, U.S. Department of Commerce, 14th Street and Constitution Avenue, NW, Washington, DC 20230;
telephone: (202) 482–1442 and (202) 482–1655, respectively. SUPPLEMENTARY INFORMATION:
Background On April 4, 2008, the Department of
Commerce (‘‘the Department’’) published the preliminary results of the antidumping duty administrative review of glycine from the People’s Republic of China, covering the period March 1, 2006, through February 28, 2007. See Glycine from the People’s Republic of China: Preliminary Results of Antidumping Duty Administrative Review and Partial Rescission, 73 FR 18503 (April 4, 2008).
Extension of Time Limits for Final Results
Pursuant to section 751(a)(3)(A) of the Tariff Act of 1930, as amended (‘‘the Act’’), and section 351.213(h)(1) of the Department’s regulations, the Department shall issue the preliminary results of an administrative review within 245 days after the last day of the anniversary month of the date of publication of the order. The Act and the regulations further provide that the Department shall issue the final results of review within 120 days after the date on which the notice of the preliminary results was published in the Federal Register. See section Error! Main Document Only.751(a)(3)(A) of the Act and section 351.213(h)(1) of the Department’s regulations. However, if the Department determines that it is not practicable to complete the review within this time period, section 751(a)(3)(A) of the Act and section 351.213(h)(2) of the Department’s regulations allow the Department to extend the 245-day period to 365 days and the 120-day period to 180 days.
The Department extended the deadline for parties to submit case briefs and rebuttal briefs in order to address several issues raised by interested parties. As a result of these extensions and to allow more time to analyze issues raised in the case briefs and rebuttal briefs, the Department has determined that it is not practicable to complete the administrative review within the current time limit.
Section 751(a)(3)(A) of the Act and section 351.213(h)(2) of the Department’s regulations allow the Department to extend the deadline for the final results of a review to a maximum of 180 days from the date on which the notice of the preliminary results was published. For the reasons noted above, the Department is extending the time limit for the completion of these final results by 30 days, from the current deadline of
August 2, 2008, until no later than September 2, 2008.1
This notice is issued and published in accordance with sections 751(a)(3)(A) and 777(i) of the Act.
Dated: July 8, 2008. Stephen J. Claeys, Deputy Assistant Secretary for Import Administration. [FR Doc. E8–16155 Filed 7–14–08; 8:45 am] BILLING CODE 3510–DS–S
DEPARTMENT OF COMMERCE
International Trade Administration
[C–570–913]
Certain New Pneumatic Off-the-Road Tires From the People’s Republic of China: Final Affirmative Countervailing Duty Determination and Final Negative Determination of Critical Circumstances
AGENCY: Import Administration, International Trade Administration, Department of Commerce. SUMMARY: The Department of Commerce (the Department) has reached a final determination that countervailable subsidies are being provided to producers/exporters of certain new pneumatic off-the-road tires (OTR tires) from the People’s Republic of China (PRC). For information on the final subsidy rates, see the ‘‘Final Determination’’ section of this notice. DATES: Effective Date: July 15, 2008. FOR FURTHER INFORMATION CONTACT: Mark Hoadley, Jun Jack Zhao, Nicholas Czajkowski, or Toni Page, AD/CVD Operations, Office 6, Import Administration, International Trade Administration, U.S. Department of Commerce, Room 7866, 14th Street and Constitution Avenue, NW., Washington, DC 20230; telephone: (202) 482–3148, (202) 482–1396, (202) 482–1395, or (202) 482–1398, respectively. SUPPLEMENTARY INFORMATION:
Case History
Since the publication of the preliminary determination in the Federal Register on December 17, 2007, the following events have occurred. See Certain New Pneumatic Off-the-Road Tires From the People’s Republic of China: Preliminary Affirmative Countervailing Duty Determination, 72 FR 71360 (December 17, 2007)
VerDate Aug<31>2005 16:42 Jul 14, 2008 Jkt 214001 PO 00000 Frm 00002 Fmt 4703 Sfmt 4703 E:\FR\FM\15JYN1.SGM 15JYN1mst
ocks
till o
n P
RO
D1P
C66
with
NO
TIC
ES

40481 Federal Register / Vol. 73, No. 136 / Tuesday, July 15, 2008 / Notices
1 Titan Tire Corporation and United Steel, Paper and Forestry, Rubber, Manufacturing, Energy Allied Industrial and Service Workers International Union, AFL-CIO-CLC (collectively, Petitioners). The domestic interested party is Bridgestone Americas Holding, Inc. and its subsidiary, Bridgestone Firestone North America Tire, LLC (collectively, Bridgestone).
2 The Government of The People’s Republic of China (GOC), Guizhou Tire Co., Ltd. (GTC), Hebei Starbright Tire Co., Ltd. (Starbright), and Tianjin United Tire & Rubber International Co., Ltd. (TUTRIC) (collectively, Respondents).
(Preliminary Determination). At the request of Petitioners,1 the Department aligned the final determination in this countervailing duty investigation with the final determination in the companion antidumping duty investigation. See Certain New Pneumatic Off-the-Road Tires from the People’s Republic of China: Alignment of Final Countervailing Duty Determination With Final Antidumping Duty Determination, 73 FR 3238 (January 17, 2008).
In the Preliminary Determination, we invited Petitioners, Bridgestone, and all of the Respondents 2 to comment on land use rights. We received comments from all parties regarding this issue on January 7, 2008. The Petitioners, Bridgestone and the Respondents also submitted factual information and arguments prior to the final determination based on various deadlines for submissions of factual information and/or arguments established by the Department subsequent to the Preliminary Determination.
On January 9, 2008, the Department issued supplemental questionnaires to the GOC, GTC, Starbright, and TUTRIC. We received responses to our January 9, 2008 supplemental questionnaire from all Respondents on February 6, 2008. We issued another supplemental questionnaire to all respondent parties on January 25, 2008 for which we received responses from all Respondents on February 15, 2008. The Department issued a supplemental questionnaire to the GOC on February 13, 2008 for which the GOC filed a response on February 27, 2008. The Department issued a supplemental questionnaire to GTC on February 15, 2008 for which GTC filed a response on February 28, 2008. The Department also issued supplemental questionnaires to TUTRIC and Starbright on February 19, 2008, pursuant to which the companies filed responses on February 27, 2008.
The Department received requests for a hearing from the Petitioners, Bridgestone, the GOC, Starbright, and GTC on January 9, 2008 and on January 16, 2008 from TUTRIC. The Department had scheduled the hearing for June 19,
2008; however, on June 16, 2008 the Department received a letter from Bridgestone stating that all interested parties agreed that a hearing was not necessary. See Letter to the Department, ‘‘New Pneumatic Off-the-Road Tires From the People’s Republic of China: Consent Withdrawal of All Hearing Requests’’ (June 16, 2008), on file in the Department’s Central Records Unit (CRU) (Room 1117 in the HCHB Building).
From March 3 through March 13, 2008, we conducted verification of the questionnaire responses submitted by the GOC, including the national, provincial, and local governments, GTC, and TUTRIC. The Department issued verification reports on April 22, 2008 and April 24, 2008. See Memorandum to Thomas Gilgunn, Program Manager, Countervailing Duty Investigation: New Pneumatic Off-the-Road Tires from the People’s Republic of China: Verification of the Questionnaire Responses Submitted by the Government of the People’s Republic of China (GOC) (GOC Verification Report); Memorandum to Thomas Gilgunn, Program Manager, Countervailing Duty Investigation: New Pneumatic Off-the-Road Tires from the People’s Republic of China: Verification of the Questionnaire Responses Submitted by GTC Co., Ltd. (GTC Verification Report); Memorandum to Thomas Gilgunn, Program Manager, Countervailing Duty Investigation: New Pneumatic Off-the-Road Tires from the People’s Republic of China: Meetings with the Government of the Guizhou Province Regarding GTC Co., Ltd. and Affiliates (Guizhou Province Verification Report); Memorandum to Thomas Gilgunn, Program Manager, Countervailing Duty Investigation: New Pneumatic Off-the-Road Tires from the People’s Republic of China: Verification of the Questionnaire Responses Submitted by Tianjin United Tire & Rubber International Co., Ltd. (TUTRIC Verification Report); and Memorandum to Thomas Gilgunn, Program Manager, Countervailing Duty Investigation: New Pneumatic Off-the-Road Tires from the People’s Republic of China: Meetings with the Government of Tianjin Municipality Regarding Tianjin United Tire & Rubber International Co., Ltd. and Affiliates (Tianjin Government Verification Report).
On March 7, 2008, the Department decided not to verify Starbright because the company had repeatedly declined to provide requested information. See Letter to Starbright, Countervailing Duty Investigation: New Pneumatic Off-the- Road Tires from the People’s Republic of China (March 7, 2008), on file in the Department’s CRU. On March 11 and
March 12, 2008, Starbright and the GOC, respectively, filed letters objecting to the Department’s decision. On March 12, 2008, Petitioners and Bridgestone filed letters stating that the Department should not verify Starbright. The Department held several meetings with Starbright officials and GOC officials. See Memoranda to the File, ‘‘Ex-parte Meeting with Representatives of Hebei Starbright Tire Co., Ltd.’’ (March 11, 2008), ‘‘Meeting with Chinese Ministry of Commerce Bureau of Fair Trade Director General Li Ling’’ (March 12, 2008), ‘‘Ex-Parte Meeting with Representatives of Hebei Starbright Tire Co., Ltd.’’ (March 24, 2008), on file in the Department’s CRU.
After evaluating all of the parties’ submissions and arguments on the matter, the Department stated that it would conduct a limited verification of Starbright’s recurring subsidies received after Starbright’s change in ownership. See Letter to Starbright, Countervailing Duty Investigation of New Pneumatic Off-the-Road Tires from the People’s Republic of China (March 12, 2008). The Department then issued the GOC and Starbright a supplemental questionnaire providing them a final opportunity to provide the information previously requested. See the Department’s questionnaires to the GOC and Starbright (March 24, 2008). The Department stated that it would reconsider its decision not to verify Starbright and the local governments that have jurisdiction over the company if Starbright and the GOC provided complete responses to the Department’s March 24, 2008 questionnaire concerning Starbright’s change in ownership. In the cover letter to the questionnaire, we stated that we needed the information regarding Starbright’s purchase of Hebei Tire Co., Ltd. to analyze fully Starbright’s claim that the sale at issue was at arm’s length and for fair market value. The Department informed Starbright that, if the company or the GOC decided not to provide the information requested, the Department would use facts otherwise available with possible adverse inferences. See the Cover Letter of the Department’s March 24, 2008 Questionnaire to Starbright. The GOC and Starbright filed responses to these questionnaires, respectively, on April 8 and April 9, 2008.
Based on our examination of these responses, the Department decided to verify. See Letter to the GOC, Countervailing Duty Investigation: New Pneumatic Off-the-Road Tires from the People’s Republic of China (April 18, 2008) and Letter to Starbright, Countervailing Duty Investigation: New
VerDate Aug<31>2005 16:42 Jul 14, 2008 Jkt 214001 PO 00000 Frm 00003 Fmt 4703 Sfmt 4703 E:\FR\FM\15JYN1.SGM 15JYN1mst
ocks
till o
n P
RO
D1P
C66
with
NO
TIC
ES

40482 Federal Register / Vol. 73, No. 136 / Tuesday, July 15, 2008 / Notices
Pneumatic Off-the-Road Tires from the People’s Republic of China (April 21, 2008) to which the verification outlines were attached, on file in the Department’s CRU. The Department then verified Starbright as well as the governments of Hebei province and the city of Xingtai from April 24 through May 1, 2008. We issued verification reports on May 13, 2008 and May 14, 2008. See Memorandum to Thomas Gilgunn, Program Manager, Countervailing Duty Investigation: New Pneumatic Off-the-Road Tires from the People’s Republic of China: Meetings with the Government of Hebei Province and Xingtai Municipality Regarding Hebei Starbright Tire Co., Ltd. (Starbright) and Hebei Tire Co., Ltd. (Hebei Tire) (Hebei Province Verification Report) and Memorandum to Thomas Gilgunn, Program Manager, Countervailing Duty Investigation: New Pneumatic Off-the-Road Tires from the People’s Republic of China: Verification of the Questionnaire Responses Submitted by Hebei Starbright Tire Co., Ltd. (Starbright) (Starbright Verification Report).
On May 2, 2008, we issued our post- preliminary analysis for certain programs for which the Department stated in the Preliminary Determination additional information was needed. See Memorandum to David M. Spooner, Assistant Secretary for Import Administration, Countervailing Duty Investigation of New Pneumatic Off-the- Road Tires from the People’s Republic of China; Post-Preliminary Analysis of Non-Tradable Share Reform; Provision of Water to FIEs for Less than Adequate Remuneration; Grants to the Tire Industry for Electricity; and Various Provincial/Municipal Programs (May 2, 2008) (Post-Preliminary Analysis), on file in the Department’s CRU. The Department then issued a post- preliminary analysis regarding the change in ownership for Starbright. See Memorandum to David M. Spooner, Assistant Secretary for Import Administration, Countervailing Duty Investigation of Certain New Pneumatic Off-the-Road Tires (OTR Tires) from the People’s Republic of China; Analysis of Change in Ownership (May 28, 2008) (CIO Memorandum).
Due to the decision to conduct verification of Starbright, the Department set up two separate briefing schedules: one for all issues except Starbright-specific issues and one for Starbright issues. See Memorandum to the File, Countervailing Duty Investigation of Certain New Pneumatic Off-the-Road Tires from the People’s Republic of China: Briefing and Hearing Schedules (April 3, 2008) and
Memorandum to the File, Countervailing Duty Investigation of Certain New Pneumatic Off-the-Road Tires from the People’s Republic of China: Briefing and Hearing Schedules (May 28, 2008). In accordance with the briefing schedules, we received case briefs from Petitioners, Bridgestone, the GOC, GTC, and TUTRIC on May 9 and 12, 2008. The same parties submitted rebuttal briefs on May 15, 2008. The Department then received case briefs regarding Starbright-specific issues on June 4 and June 5, 2008 from Petitioners, Bridgestone, the GOC, and Starbright. On June 6, 2008, the Department determined that Starbright’s brief contained untimely new factual information and requested that Starbright submit replacement pages with all references to this information removed. See Letter to Starbright, New Factual Information (June 6, 2008). Starbright submitted replacement pages without the untimely filed new factual information on June 9, 2008. Petitioners, Bridgestone, the GOC, and Starbright submitted rebuttal briefs pertaining to Starbright-specific issues on June 9 and June 10, 2008.
On June 10, 2008, both Bridgestone and Starbright filed letters with the Department alleging that the other party had included new factual information on the record in both the case briefs and the rebuttal briefs. On June 13, 2008, the Department issued a memorandum to the file addressing all allegations of new factual information. See Memorandum to the File, Various Allegations Concerning Case and Rebuttal Briefs Regarding Hebei Starbright Tire Co., Ltd. (Starbright), on file in the Department’s CRU. In the June 13, 2008 memorandum, the Department: (1) Determined that we would not address Petitioners’ or Bridgestone’s uncreditworthiness allegation against Starbright that both raised in their respective briefs; (2) determined that information in Starbright’s rebuttal brief was not new factual information; (3) determined that information submitted by Bridgestone in its rebuttal brief was not new factual information; and (4) clarified that Bridgestone’s comments regarding market distortions in its June 9, 2008 rebuttal brief were allowed as part of the arguments concerning whether the sale of Hebei Tire was for fair market value.
Period of Investigation
The period of investigation (POI) for which we are measuring subsidies is calendar year 2006.
Scope of the Investigation
The products covered by the scope of this investigation are new pneumatic tires designed for off-the-road (OTR) and off-highway use, subject to certain exceptions. In the Preliminary Determination, we stated that we had received comments on the scope of the investigation from a number of parties and that all comments raised by the parties would be addressed in the companion antidumping investigation. On May 14, 2008, the Department issued a memorandum regarding the scope of both the AD and CVD Investigations on OTR Tires from the PRC, addressing the scope comments submitted by multiple interested parties. See Preliminary Determination: Comments on the Scope of the Investigations (Preliminary Scope Determination).
In the Preliminary Scope Determination, we made certain modifications to the scope of the investigation and invited interested parties to comment on these modifications. Interested parties submitted comments on the Preliminary Scope Determination on May 22, 2008 and rebuttal comments on May 27, 2008. Based on these comments, we have made certain clarifications to the scope of the investigation. These clarifications, as well as a complete description of all products covered by the scope of this investigation, and a list of excluded products, are reflected in the Final Scope of the Investigation which is appended to this notice at Appendix I.
All comments submitted on the Preliminary Scope Determination are addressed in the Scope Comments section of the Issues and Decision Memorandum for the Final Affirmative Countervailing Duty Determination: Certain New Pneumatic Off-the-Road Tires from the People’s Republic of China (Issues and Decision Memorandum), which is issued concurrently with this notice.
Critical Circumstances
On March 11, 2008, Petitioners submitted a timely critical circumstances allegation. On April 22, 2008, the Department preliminarily determined that critical circumstances did not exist for imports of OTR tires from the PRC. See Notice of Preliminary Negative Determination of Critical Circumstances: Certain New Pneumatic Off-the-Road Tires From the People’s Republic of China, 73 FR 21588 (April 22, 2008) (Critical Circumstances Notice). Pursuant to section 705(a)(2) of the Tariff Act of 1930, as amended (the
VerDate Aug<31>2005 16:42 Jul 14, 2008 Jkt 214001 PO 00000 Frm 00004 Fmt 4703 Sfmt 4703 E:\FR\FM\15JYN1.SGM 15JYN1mst
ocks
till o
n P
RO
D1P
C66
with
NO
TIC
ES

40483 Federal Register / Vol. 73, No. 136 / Tuesday, July 15, 2008 / Notices
3 Agricultural tractors are dual-axle vehicles that typically are designed to pull farming equipment in the field and that may have front tires of a different size than the rear tires.
4 Combine harvesters are used to harvest crops such as corn or wheat.
5 Agricultural sprayers are used to irrigate agricultural fields
6 Industrial tractors are dual-axle vehicles that typically are designed to pull industrial equipment and that may have front tires of a different size than the rear tires.
7 A log-skidder has a grappling lift arm that is used to grasp, lift and move trees that have been cut down to a truck or trailer for transport to a mill or other destination.
8 Skid-steer loaders are four-wheel drive vehicles with the left-side drive wheels independent of the right-side drive wheels and lift arms that lie alongside the driver with the major pivot points behind the driver’s shoulders. Skid-steer loaders are used in agricultural, construction and industrial settings.
9 Haul trucks, which may be either rigid frame or articulated (i.e., able to bend in the middle) are typically used in mines, quarries and construction sites to haul soil, aggregate, mined ore, or debris.
10 Front loaders have lift arms in front of the vehicle. They can scrape material from one location to another, carry material in their buckets, or load material into a truck or trailer.
11 A dozer is a large four-wheeled vehicle with a dozer blade that is used to push large quantities of soil, sand, rubble, etc., typically around construction sites. They can also be used to perform ‘‘rough grading’’ in road construction.
Act), in order for critical circumstances to exist, the Department must find that there are countervailable subsidies that are inconsistent with the World Trade Organization Agreement on Subsidies and Countervailing Measures (SCM Agreement ) (i.e., import substitution subsidies or export subsidies), and that there have been massive imports over a relatively short period (i.e., whether there was a surge in imports). Based on our analyses of the results of verification and the comments submitted by the parties, we have determined that none of the respondents have received subsidies inconsistent with the SCM Agreement. We therefore need not reach the issue of whether there have been massive imports over a relatively short period of time. Since the requirements of section 705(a)(2) of the Act have not been met, we determine that critical circumstances do not exist with respect to imports of OTR tires from the PRC.
Analysis of Subsidy Programs and Comments Received
The subsidy programs under investigation and the issues raised by interested parties in their case briefs and rebuttal briefs on the Preliminary Determination, the Post-Preliminary Analysis, and the CIO Memorandum, are discussed in the Issues and Decision Memorandum. A list of the subsidy programs and of the issues that parties have raised is attached to this notice as Appendix II. Parties can find a complete discussion of all of the subsidy programs and issues raised in this investigation and the corresponding recommendations in this public memorandum, which is on file in the Department’s CRU. A complete version of the Issues and Decision Memorandum is available at http:// www.trade.gov/ia under the heading ‘‘Federal Register Notices.’’ The paper copy and the electronic version of the Issues and Decision Memorandum are identical in content.
Final Determination
In accordance with section 705(c)(1)(B)(i) of the Act, we determine the total net countervailable subsidy rates to be:
Producer/Exporter Net subsidy
rate (percent)
Guizhou Tire Co., Ltd. (GTC) ... 2.45 Hebei Starbright Tire Co., Ltd.
(Starbright) ............................ 14.00 Tianjin United Tire & Rubber
International Co., Ltd. (TUTRIC) ............................... 6.85
All-Others .................................. 5.62
In accordance with section 705(c)(5)(A)(ii) of the Act, we have calculated the all others rate based on a weighted average of the three mandatory respondents’ calculated rates.
Suspension of Liquidation In accordance with sections
703(d)(1)(B) and (2) of the Act, we directed U.S. Customs and Border Protection (CBP) to suspend liquidation of all entries of OTR tires from the PRC that were entered, or withdrawn from warehouse, for consumption on or after December 17, 2007. In accordance with section 703(d) of the Act, we instructed CBP to discontinue the suspension of liquidation for countervailing duty purposes for subject merchandise entered, or withdrawn from warehouse, on or after April 15, 2008, but to continue the suspension of liquidation of all entries from December 17, 2007 through April 14, 2008.
If the ITC issues a final affirmative determination of injury, we will issue a countervailing duty order, reinstate suspension of liquidation under section 706(a) of the Act for all entries, and require a cash deposit of estimated countervailing duties for such entries of merchandise at the rates indicated above. If the ITC determines that material injury to, threat of material injury to, or material retardation of, the domestic industry does not exist, this proceeding will be terminated and all estimated duties deposited or securities posted as a result of the suspension of liquidation will be refunded or canceled.
ITC Notification In accordance with section 705(d) of
the Act, we will notify the ITC of our determination. In addition, we are making available to the ITC all non- privileged and non-proprietary information related to this investigation. We will allow the ITC access to all privileged and business proprietary information in our files, provided the ITC confirms it will not disclose such information, either publicly or under an administrative protective order (APO), without the written consent of the Assistant Secretary for Import Administration.
Return or Destruction of Proprietary Information
In the event that the ITC issues a final negative injury determination, this notice will serve as the only reminder to parties subject to APO of their responsibility concerning the destruction of proprietary information disclosed under APO in accordance with section 351.305(a)(3) of the
Department’s regulations. Failure to comply is a violation of the APO.
This determination is issued and published pursuant to sections 705(d) and 777(i) of the Act.
Dated: July 7, 2008.
David M. Spooner, Assistant Secretary for Import Administration.
Appendix I: Final Scope of the Investigation
The products covered by the scope are new pneumatic tires designed for off-the-road (OTR) and off-highway use, subject to exceptions identified below. Certain OTR tires are generally designed, manufactured and offered for sale for use on off-road or off- highway surfaces, including but not limited to, agricultural fields, forests, construction sites, factory and warehouse interiors, airport tarmacs, ports and harbors, mines, quarries, gravel yards, and steel mills. The vehicles and equipment for which certain OTR tires are designed for use include, but are not limited to: (1) Agricultural and forestry vehicles and equipment, including agricultural tractors,3 combine harvesters,4 agricultural high clearance sprayers,5 industrial tractors,6 log-skidders,7 agricultural implements, highway-towed implements, agricultural logging, and agricultural, industrial, skid-steers/mini- loaders;8 (2) construction vehicles and equipment, including earthmover articulated dump products, rigid frame haul trucks,9 front end loaders,10 dozers,11 lift trucks,
VerDate Aug<31>2005 15:01 Jul 14, 2008 Jkt 214001 PO 00000 Frm 00005 Fmt 4703 Sfmt 4703 E:\FR\FM\15JYN1.SGM 15JYN1mst
ocks
till o
n P
RO
D1P
C66
with
NO
TIC
ES

40484 Federal Register / Vol. 73, No. 136 / Tuesday, July 15, 2008 / Notices
12 A straddle carrier is a rigid frame, engine- powered machine that is used to load and offload containers from container vessels and load them onto (or off of) tractor trailers.
13 A grader is a vehicle with a large blade used to create a flat surface. Graders are typically used to perform ‘‘finish grading.’’ Graders are commonly used in maintenance of unpaved roads and road construction to prepare the base course onto which asphalt or other paving material will be laid.
14 i.e., ‘‘on-site’’ mobile cranes designed for off- highway use.
15 A counterbalanced lift truck is a rigid framed, engine-powered machine with lift arms that has additional weight incorporated into the back of the machine to offset or counterbalance the weight of loads that it lifts so as to prevent the vehicle from overturning. An example of a counterbalanced lift truck is a counterbalanced fork lift truck. Counterbalanced lift trucks may be designed for use on smooth floor surfaces, such as a factory or warehouse, or other surfaces, such as construction sites, mines, etc.
16 While tube-type tires are subject to the scope of this proceeding, tubes and flaps are not subject merchandise and therefore are not covered by the scope of this proceeding, regardless of the manner in which they are sold (e.g. sold with or separately from subject merchandise).
straddle carriers,12 graders,13 mobile cranes,14 compactors; and (3) industrial vehicles and equipment, including smooth floor, industrial, mining, counterbalanced lift trucks, industrial and mining vehicles other than smooth floor, skid-steers/mini-loaders, and smooth floor off-the-road counterbalanced lift trucks.15 The foregoing list of vehicles and equipment generally have in common that they are used for hauling, towing, lifting, and/or loading a wide variety of equipment and materials in agricultural, construction and industrial settings. Such vehicles and equipment, and the descriptions contained in the footnotes are illustrative of the types of vehicles and equipment that use certain OTR tires, but are not necessarily all- inclusive.
While the physical characteristics of certain OTR tires will vary depending on the specific applications and conditions for which the tires are designed (e.g., tread pattern and depth), all of the tires within the scope have in common that they are designed for off-road and off-highway use. Except as discussed below, OTR tires included in the scope of the proceeding range in size (rim diameter) generally but not exclusively from 8 inches to 54 inches. The tires may be either tube-type 16 or tubeless, radial or non-radial, and intended for sale either to original equipment manufacturers or the replacement market. The subject merchandise is currently classifiable under Harmonized Tariff Schedule of the United States (‘‘HTSUS’’) subheadings: 4011.20.10.25, 4011.20.10.35, 4011.20.50.30, 4011.20.50.50, 4011.61.00.00, 4011.62.00.00, 4011.63.00.00, 4011.69.00.00, 4011.92.00.00, 4011.93.40.00, 4011.93.80.00, 4011.94.40.00, and 4011.94.80.00. While HTSUS subheadings are provided for convenience and customs purposes, our written description of the scope is dispositive.
Specifically excluded from the scope are new pneumatic tires designed, manufactured and offered for sale primarily for on-highway or on-road use, including passenger cars, race cars, station wagons, sport utility vehicles,
minivans, mobile homes, motorcycles, bicycles, on-road or on-highway trailers, light trucks, and trucks and buses. Such tires generally have in common that the symbol ‘‘DOT’’ must appear on the sidewall, certifying that the tire conforms to applicable motor vehicle safety standards. Such excluded tires may also have the following designations that are used by the Tire and Rim Association:
Prefix letter designations: • P—Identifies a tire intended primarily
for service on passenger cars; • LT—Identifies a tire intended primarily
for service on light trucks; and, • ST—Identifies a special tire for trailers in
highway service. Suffix letter designations: • TR—Identifies a tire for service on
trucks, buses, and other vehicles with rims having specified rim diameter of nominal plus 0.156’’ or plus 0.250’’;
• MH—Identifies tires for Mobile Homes; • HC—Identifies a heavy duty tire
designated for use on ‘‘HC’’ 15’’ tapered rims used on trucks, buses, and other vehicles. This suffix is intended to differentiate among tires for light trucks, and other vehicles or other services, which use a similar designation.
• Example: 8R17.5 LT, 8R17.5 HC; • LT—Identifies light truck tires for service
on trucks, buses, trailers, and multipurpose passenger vehicles used in nominal highway service; and
• MC—Identifies tires and rims for motorcycles.
The following types of tires are also excluded from the scope: Pneumatic tires that are not new, including recycled or retreaded tires and used tires; non-pneumatic tires, including solid rubber tires; tires of a kind designed for use on aircraft, all-terrain vehicles, and vehicles for turf, lawn and garden, golf and trailer applications. Also excluded from the scope are radial and bias tires of a kind designed for use in mining and construction vehicles and equipment that have a rim diameter equal to or exceeding 39 inches. Such tires may be distinguished from other tires of similar size by the number of plies that the construction and mining tires contain (minimum of 16) and the weight of such tires (minimum 1500 pounds).
Appendix II: Issues and Decision Memorandum
I. Summary II. Background III. Subsidies Valuation IV. Analysis of Programs
A. Programs Determined To Be Countervailable
1. Government Provision of Rubber for Less than Adequate Remuneration.
2. Government Policy Lending 3. Government Debt Forgiveness to
TUTRIC 4. Government Debt Forgiveness and the
Provision of Land to Starbright Pursuant to Its Change in Ownership
5. Stamp Tax Exemption on Share Transfers under NTSR
6. Tax Subsidies to FIEs in Specially Designated Geographic Areas, and Local Income Tax Exemption and Reduction Programs for ‘‘Productive’’ FIEs
7. VAT and Tariff Exemptions for FIEs and Certain Domestic Enterprises Using Imported Equipment in Encouraged Industries
8. State Key Technology Renovation Project Fund
B. Programs Determined To Be Not Countervailable
C. Programs Determined To Not Confer a Benefit During the POI
D. Programs Determined To Be Not Used E. Program Determined To Be Terminated
V. Analysis of Comments A. General Issues including Applicability
of the CVD Law to the PRC, Cut-Off Date, and Double Remedies
Comment A.1: Application of the CVD Law to Non-Market Economies, Including the PRC
Comment A.2: Application of the CVD Law to the PRC is Consistent With the APA
Comment A.3: Whether Simultaneous Application of CVD Law in This Investigation and NME Methodology in the Parallel Antidumping Investigation Imposes Double Trade Remedies
Comment A.4: Whether December 11, 2001, is the Appropriate Date From Which the Department May Measure Subsidies in the PRC
B. Attribution of Subsidies and Cross- Ownership
Comment B.1: Attribution of Subsidies to, and Cross-Ownership of, TUTRIC/DCB
C. Whether GTC and TUTRIC Are SOEs Comment C.1: Whether GTC Is an SOE Comment C.2: Whether TUTRIC Is an SOE D. Government Provision of Rubber for Less
Than Adequate Remuneration Comment D.1: Whether the GOC’s
Provision of Rubber Is Specific Comment D.2: Whether the GOC’s
Provision of Rubber Confers a Financial Contribution
Comment D.3: GOC Control of the Rubber Market
Comment D.4: Purchases of SOE-Produced Rubber Through Private Trading Companies
Comment D.5: Whether Imported Rubber Is Countervailable
Comment D.6: Rubber Benchmark Comment D.7: Adjustments to Rubber
Calculation E. Government Policy Lending and
Government Debt Forgiveness Comment E.1: Specificity Comment E.2: SOCBs and Financial
Contribution Comment E.3: Role of the GOC in the PRC
Banking System and Whether To Use an Internal or External Benchmark
Comment E.4: Issues Regarding Building an External Benchmark
Comment E.5: Whether Government Policy Lending to GTC Is Countervailable
Comment E.6: Whether There Was a Financial Contribution to TUTRIC
Comment E.7: Whether TUTRIC’s Loans From Certain Other Banks Were Forgiven
F. Starbright-Specific Issues Comment F.1: Due Process Comment F.2: Application of Total
Adverse Facts Available Comment F.3: Application of the CIO
Methodology
VerDate Aug<31>2005 15:01 Jul 14, 2008 Jkt 214001 PO 00000 Frm 00006 Fmt 4703 Sfmt 4703 E:\FR\FM\15JYN1.SGM 15JYN1mst
ocks
till o
n P
RO
D1P
C66
with
NO
TIC
ES
40485 Federal Register / Vol. 73, No. 136 / Tuesday, July 15, 2008 / Notices
1 See Verification of the Factors Response of Hebei Starbright Co., Ltd. in the Antidumping Duty Investigation of Certain New Pneumatic Off-The- Road Tires from the People’s Republic of China, dated May 5, 2008 (‘‘Starbright Verification Report’’); and Verification of Constructed Export Sales (‘‘CEP’’) for Hebei Starbright Tire Co., Ltd. (‘‘Starbright’’) at GPX International Tire Corporation (‘‘GPX7rdquo;), dated May 15, 2008 (‘‘Starbright CEP Verification Report’’).
2 See Verification of the Sales and Factors Response of TUTRIC in the Antidumping Investigation of Certain New Pneumatic Off-The- Road Tires from the People’s Republic of China, dated May 2, 2008 (‘‘TUTRIC Verification Report’’).
3 See Verification of the Sales and Factors Response of Xuzhou Xugong Tyres Co., Ltd. in the Antidumping Duty Investigation of Certain New Pneumatic Off-The-Road Tires from the People’s Republic of China dated May 12, 2008 (‘‘Xugong Verification Report’’).
4 See Verification of the Sales and Factors Response of Guizhou Tyre in the Antidumping Investigation of Certain New Pneumatic Off-The- Road Tires from the People’s Republic of China dated May 9, 2008 (‘‘Guizhou Tyre Verification Report’’).
Comment F.4: The Arm’s Length Nature of the Transaction
Comment F.5: The Purchase of Hebei Tire’s Assets Was for Fair Market Value
Comment F.6: Whether Starbright Purchased ‘‘Substantially All’’ of Hebei Tire’s Assets
Comment F.7: Whether the Department Erred in Finding that Hebei Tire’s Non- Recurring Subsidies Pass Through to Starbright
Comment F.8: Whether Any Benefit Found by the Department Should Be Limited to the Difference Between the Appraised Value and the Value Paid
Comment F.9: Debt Forgiveness—Unpaid Loans and Other Primary Debt
Comment F.10: Debt Forgiveness—Loan Guarantee Obligations
Comment F.11: The Countervailability of Starbright’s Granted Land Use Rights
Comment F.12: The Countervailability of Starbright’s Land Leased From Local Villages
Comment F.13: Submission of New Factual Information
G. Other Countervailable Programs Comment G.1: Whether Non-Tradeable
Share Reform (NTSR) Is Specific Comment G.2: Whether GTC Received a
Benefit From the Transfer of Bonus Shares to Its Tradeable Shareholders Under NTSR
Comment G.3: Whether GTC Received a Benefit From the GOC’s Exemption of Stamp Taxes on Share Transfers Under NTSR
Comment G.4: Whether GTC Received a Benefit From the GOC’s Exemption of Income Taxes on Income Derived Under NTSR
Comment G.5: FIE Tax Exemptions Comment G.6: Value Added Tax and Tariff
Exemptions on Imported Equipment Comment G.7: State Key Technology
Renovation Project Fund H. Government Provision of Land Comment H.1: Whether the GOC’s
Provision of Land Is a Financial Contribution
Comment H.2: Cut-Off Date for Acquisition of Land-Use Rights
Comment H.3: Whether the GOC’s Provision of Land Is a Recurring Benefit
Comment H.4: TUTRIC Land Countervailability
Comment H.5: Whether the GOC’s Provision of Land to TUTRIC and GTC Is Specific
Comment H.6: Whether the GOC’s Land- Use Rights System Operated on Market Principles During the POI
Comment H.7: Land Benchmark I. Not Countervailable Programs Comment I.1: VAT Export Rebates J. Scope Comments Comment J.1: Imported Wheel Mounted
Tires Certifications Comment J.2: OTR Agricultural Tires,
Including for Highway-Towed Implements
Comment J.3: Tubes and Flaps Comment J.4: Earthmoving, Mining, and
Construction Tires
VI. Recommendation
[FR Doc. E8–16154 Filed 7–14–08; 8:45 am] BILLING CODE 3510–DS–P
DEPARTMENT OF COMMERCE
International Trade Administration
[A–570–912]
Certain New Pneumatic Off–The-Road Tires from the People’s Republic of China: Final Affirmative Determination of Sales at Less Than Fair Value and Partial Affirmative Determination of Critical Circumstances
AGENCY: Import Administration, International Trade Administration, Department of Commerce. EFFECTIVE DATE: July 15, 2008. SUMMARY: On February 20, 2008, the Department of Commerce (the ‘‘Department’’) published its preliminary determination of sales at less than fair value (‘‘LTFV’’) in the antidumping investigation of certain new pneumatic off–the-road tires (‘‘OTR tires’’) from the People’s Republic of China (‘‘PRC’’). The period of investigation (‘‘POI’’) is October 1, 2006, to March 31, 2007. We invited interested parties to comment on our preliminary determination of sales at LTFV and the post–preliminary determinations. Based on our analysis of the comments we received, we have made changes to our calculations for the mandatory respondents. We determine that OTR tires from the PRC are being, or are likely to be, sold in the United States at LTFV as provided in section 735 of the Tariff Act of 1930, as amended (‘‘the Act’’). The estimated margins of sales at LTFV are shown in the ‘‘Final Determination Margins’’ section of this notice. FOR FURTHER INFORMATION CONTACT: Lilit Astvatsatrian or Charles Riggle, AD/CVD Operations, Office 8, Import Administration, International Trade Administration, U.S. Department of Commerce, 14th Street and Constitution Avenue, NW, Washington, DC 20230; telephone: (202) 482–6412 or (202) 482– 0650, respectively. SUPPLEMENTARY INFORMATION:
Case History
The Department published its preliminary determination of sales at LTFV on February 20, 2008. See Certain New Pneumatic Off–The-Road Tires from the People’s Republic of China: Preliminary Determination of Sales at Less Than Fair Value and Postponement of Final Determination, 73 FR 9278 (February 20, 2008) (‘‘Preliminary
Determination’’). The Department issued a ministerial error allegation memorandum, in which it agreed to correct several ministerial errors for the final determination. See Memorandum entitled ‘‘Preliminary Determination of Antidumping Duty Investigation on Certain New Pneumatic Off–The-Road Tires from the People’s Republic of China: Allegations of Ministerial Errors,’’ dated March 28, 2008 (‘‘Ministerial Error Memo’’). On April 21, 2008, the Department published an affirmative preliminary determination of critical circumstances. See Certain New Pneumatic Off–The-Road Tires from the People’s Republic of China: Affirmative Preliminary Determination of Critical Circumstances, 73 FR 21312, (April 21, 2008), (‘‘Affirmative Preliminary Determination of Critical Circumstances’’).
Between March 25 and April 25, 2008, the Department conducted verifications of Starbright,1 Tianjin United Tire & Rubber International Co., Ltd. (‘‘TUTRIC’’),2 Xugong,3 and Guizhou Tyre Co., Ltd. (‘‘Guizhou Tyre’’).4 See the ‘‘Verification’’ section below for additional information.
On May 14, 2008, the Department issued a memorandum regarding the scope of both the AD and CVD Investigations on OTR Tires from the PRC, addressing the scope comments submitted by multiple interested parties. See Preliminary Determination: Comments on the Scope of the Investigations (‘‘Preliminary Scope Determination’’).
The Department issued a post– preliminary determination on May 19, 2008, in which it applied a new targeted dumping methodology. See Memorandum entitled ‘‘Post– Preliminary Determinations on Targeted
VerDate Aug<31>2005 15:01 Jul 14, 2008 Jkt 214001 PO 00000 Frm 00007 Fmt 4703 Sfmt 4703 E:\FR\FM\15JYN1.SGM 15JYN1mst
ocks
till o
n P
RO
D1P
C66
with
NO
TIC
ES

40486 Federal Register / Vol. 73, No. 136 / Tuesday, July 15, 2008 / Notices
Dumping,’’ dated May 19, 2008 (‘‘Targeted Dumping Determination’’).
On May 19, 2008, the Department also preliminarily granted separate–rate status to two separate rate applicants, Qingdao Aonuo Tyre Co., Ltd. (‘‘Aonuo’’) and Kenda Rubber (China) Co., Ltd. (‘‘Kenda China’’). See Memorandum entitled ‘‘Preliminary Determination of Separate–Rate Status of Qingdao Aonuo Tyre Co., Ltd. and Kenda Rubber (China) Co., Ltd. in the Antidumping Investigation of Certain New Pneumatic Off–the-Road Tires from the People’s Republic of China,’’ dated May 19, 2008.
We invited interested parties to comment on the Preliminary Determination, Affirmative Preliminary Determination of Critical Circumstances, and the post– preliminary scope, targeted dumping, and separate rate determinations. On May 22, 2008, multiple interested parties filed case briefs with respect to the scope of the AD and concurrent countervailing duty (CVD) proceeding. On May 27, 2008, many of these same parties filed rebuttal comments regarding the scope of these two proceedings. In addition, on May 27, 2008, multiple interested parties filed case briefs with respect to issues specific to the AD proceeding. These same parties filed rebuttal briefs on June 2, 2008. The Department held two hearings on June 12, 2008, one solely related to the scope of the AD and CVD proceedings and the second to address issues related solely to the AD investigation.
Verification As provided in section 782(i) of the
Act, we verified the information submitted by Starbright, Guizhou Tyre, TUTRIC, and Xugong for use in our final determination. See the Department’s verification reports on the record of this investigation in the Central Records Unit (‘‘CRU’’), Room 1117 of the main Department building, with respect to these entities. For all verified companies, we used standard verification procedures, including examination of relevant accounting and production records, as well as original source documents provided by respondents.
Analysis of Comments Received All issues raised in the case and
rebuttal briefs by parties to this investigation are addressed in the ‘‘Investigation of Certain New Pneumatic Off–The-Road Tires from the People’s Republic of China: Issues and Decision Memorandum,’’ dated concurrently with this notice and,
which is hereby adopted by this notice (‘‘Issues and Decision Memorandum’’). A list of the issues which parties raised and to which we respond in the Issues and Decision Memorandum is attached to this notice as Appendix II. The Issues and Decision Memorandum is a public document and is on file in the CRU, and is accessible on the Web at ia.ita.doc.gov/frn. The paper copy and electronic version of the memorandum are identical in content.
Changes Since the Preliminary Determination
Based on our analysis of information on the record of this investigation, we have made changes to the margin calculations for the final determination for all mandatory respondents.
General Issues • We have updated the wholesale
price index adjustor for the POI, which modified the inflated values for steam, water, electricity, brokerage and handling, marine insurance, and truck freight rate. See ‘‘Certain New Pneumatic Off– The-Road Tires from the People’s Republic of China: Surrogate Value Memorandum,’’ dated July 7, 2008 (‘‘Final SV Memo’’).
• We have corrected linking errors in the inflator adjustments for marine insurance and Essar Steel’s brokerage and handling. See Final SV Memo.
• We corrected an averaging error in the calculation of the surrogate value for water. See Final SV Memo.
• We corrected the rail rate used in the company–specific rail freight to be based on metric ton. See Analysis Memorandum for the Final Determination: Xuzhou Xugong Tyres Co., Ltd. (‘‘Xugong’’), dated July 7, 2008 (‘‘Xugong Final Analysis Memo’’) and Analysis Memorandum for the Final Determination: Guizhou Tyre and its affiliates, dated July 7, 2008 (‘‘Guizhou Tyre Final Analysis Memo’’).
• We have updated the PRC labor wage rate. See Final SV Memo.
• We have used the following four financial statements to calculate the surrogate financial ratios: CEAT Limited (‘‘Ceat’’); Falcon Tyres Ltd. (‘‘Falcon’’); Goodyear India Limited (‘‘Goodyear’’); and TVS Srichakra (‘‘TVS’’). See Comments 17.A and 17.B in the Issues and Decision Memo dated concurrently with this notice.
• We have valued steam using the natural gas price reported in a May
2005 publication of Financial Express. We have inflated the resulting steam value by applying the appropriate WPI inflator.
• We have made the following changes to the surrogate financial ratio calculations:
»CEAT: 1) We treated a) Sale of Scrap and b) Miscellaneous income as SG&A; and 2) we excluded Rebates and Discounts from the surrogate ratio calculations. See Final SV Memo, and Issues and Decision Memorandum at Comments 18.B and 18.C.
»Falcon: 1) We treated a) Sale of Scrap and b) Miscellaneous income as SG&A; and 2) we excluded Discount from the surrogate ratio calculations. See Final SV Memo and Issues and Decision Memorandum at Comments 18.B and 18.C.
»Goodyear: 1) We treated a) Scrap Sale, b) One time settlement from vendor(s), and c) Unidentified Miscellaneous Income as SG&A; 2) we excluded Target Plus Export Incentives from the surrogate ratio calculations; 3) we treated Retirement Gratuities as direct labor; and 4) we included Purchase of Finished Goods in the denominator of Goodyear’s SG&A and profit ratio calculations. See Final SV Memo, and Ministerial Error Memorandum, and Issues and Decision Memorandum at Comments 18.B and 18.G.
»TVS: 1) We treated a) Miscellaneous Sales and b) Miscellaneous Income as part of SG&A; and 2) we treated Gratuity as direct labor. See Final SV Memo and Issues and Decision Memorandum at Comment 18.B and 18.G.
• We have revised the calculation of U.S. price for Guizhou Tyre and Starbright to include a deduction for warehousing expenses based on the average days subject merchandise is in inventory. See Final SV Memo, Guizhou Tyre Final Analysis Memo, and Starbright Final Analysis Memo.
Company–Specific Changes Since the Preliminary Determination
Xugong: See Xugong Final Analysis Memo.
Guizhou Tyre: See Guizhou Tyre Final Analysis Memo.
Starbright: See Analysis Memorandum for the Final Determination: Hebei Starbright Co., Ltd., dated July 7, 2008.
TUTRIC: See Analysis Memorandum for the Final Determination: Tianjin United Tire & Rubber International
VerDate Aug<31>2005 15:01 Jul 14, 2008 Jkt 214001 PO 00000 Frm 00008 Fmt 4703 Sfmt 4703 E:\FR\FM\15JYN1.SGM 15JYN1mst
ocks
till o
n P
RO
D1P
C66
with
NO
TIC
ES
40487 Federal Register / Vol. 73, No. 136 / Tuesday, July 15, 2008 / Notices
Co., Ltd., dated July 7, 2008.
Scope of Investigation
The products covered by the scope of this investigation are new pneumatic tires designed for off–the-road (OTR) and off–highway use, subject to certain exceptions. In the Preliminary Determination, we stated that we had received comments on the scope of the investigation from a number of parties and that all comments raised by the parties would be addressed in a post– preliminary scope determination. On May 14, 2008, the Department issued a memorandum regarding the scope of both the AD and CVD Investigations on OTR Tires from the PRC, addressing the scope comments submitted by multiple interested parties. See Preliminary Scope Determination.
In the Preliminary Scope Determination, we made certain modifications to the scope of the investigation and invited interested parties to comment on these modifications. Interested parties submitted comments on the Preliminary Scope Determination on May 22, 2008 and rebuttal comments on May 27, 2008. Based on these comments, we have made certain clarifications to the scope of the investigation. These clarifications, as well as a complete description of all products covered by the scope of this investigation, and a list of excluded products, are reflected in the Final Scope of the Investigation which is appended to this notice at Appendix I. All comments submitted on the Preliminary Scope Determination are addressed in the Scope Comments section of the Issues and Decision.
Targeted Dumping
We have analyzed the case and rebuttal briefs with respect to targeted dumping issues submitted for the record in this investigation. As a result of our analysis, we made certain changes in the targeted dumping test we applied for purposes of the final determination. These changes result in a finding of targeted dumping for Xugong, but not for Guizhou Tyre, Starbright, and TUTRIC. For further discussion, see Comments 23.A through 23.H in the Issues and Decision Memorandum. As indicated below, for Guizhou Tyre, Starbright, and TUTRIC, we continue to find overall dumping margins above de minimis. See Guizhou Tyre Final Analysis Memo, Starbright Final Analysis Memo, and TUTRIC Final Analysis Memo, respectively. Further, as indicated below, we find that Xugong’s overall margin is zero. See Xugong Final Analysis Memo.
Surrogate Country
In the Preliminary Determination, we stated that we had selected India as the appropriate surrogate country to use in this investigation for the following reasons: (1) it is a significant producer of comparable merchandise; (2) it is at a similar level of economic development comparable to that of the PRC; and (3) we have reliable data from India that we can use to value the factors of production. See Preliminary Determination. For the final determination, we received no comments and made no changes to our findings with respect to the selection of a surrogate country.
Separate Rates
In proceedings involving non–market- economy (‘‘NME’’) countries, the Department begins with a rebuttable presumption that all companies within the country are subject to government control and, thus, should be assigned a single antidumping duty deposit rate. It is the Department’s policy to assign all exporters of merchandise subject to an investigation in an NME country this single rate unless an exporter can demonstrate that it is sufficiently independent so as to be entitled to a separate rate. See Final Determination of Sales at Less Than Fair Value: Sparklers from the People’s Republic of China, 56 FR 20588 (May 6, 1991) (‘‘Sparklers’’), as amplified by Notice of Final Determination of Sales at Less Than Fair Value: Silicon Carbide from the People’s Republic of China, 59 FR 22585 (May 2, 1994) (‘‘Silicon Carbide’’), and 19 CFR 351.107(d).
In the Preliminary Determination, we found that Starbright, Guizhou Tyre, TUTRIC, Xugong and 23 separate rate– applicants demonstrated their eligibility for separate–rate status (collectively, ‘‘Separate–Rate Recipients’’). On May 19, 2008, as discussed above, we granted separate–rate status to two additional applicants, Aonuo and Kenda China; thus, they are now part of the pool of Separate–Rate Recipients. For the final determination, we continue to find that the evidence placed on the record of this investigation by Starbright, Guizhou Tyre, TUTRIC, Xugong and the remaining Separate Rate Recipients demonstrate both a de jure and de facto absence of government control, with respect to their respective exports of the merchandise under investigation, and, thus are eligible for separate rate status.
Additionally, based on comments received from certain Separate Rate Recipients, and a review of the record, we found that the combination rates or
the spelling of names for certain exporters were not properly included in the Preliminary Determination. Because these errors pertain to the identification of the proper separate rates recipients for this investigation, the Department is making these corrections effective as of February 20, 2008, the date of the Preliminary Determination. The companies whose names have been corrected are identified with an ‘‘=’’ in the ‘‘Final Determination Margins’’ section, below. Any liquidation instructions for the provisional measures period will reflect these corrections.
Use of Facts Available Section 776(a)(2) of the Act, provides
that, if an interested party: (A) withholds information that has been requested by the Department; (B) fails to provide such information in a timely manner or in the form or manner requested subject to sections 782(c)(1) and (e) of the Act; (C) significantly impedes a proceeding under the antidumping statute; or (D) provides such information but the information cannot be verified, the Department shall, subject to subsection 782(d) of the Act, use facts otherwise available in reaching the applicable determination.
Section 782(c)(1) of the Act provides that if an interested party ‘‘promptly after receiving a request from {the Department} for information, notifies {the Department} that such party is unable to submit the information requested in the requested form and manner, together with a full explanation and suggested alternative forms in which such party is able to submit the information,’’ the Department may modify the requirements to avoid imposing an unreasonable burden on that party.
Section 782(d) of the Act provides that, if the Department determines that a response to a request for information does not comply with the request, the Department will inform the person submitting the response of the nature of the deficiency and shall, to the extent practicable, provide that person the opportunity to remedy or explain the deficiency. If that person submits further information that continues to be unsatisfactory, or this information is not submitted within the applicable time limits, the Department may, subject to section 782(e), disregard all or part of the original and subsequent responses, as appropriate.
Section 782(e) of the Act states that the Department shall not decline to consider information deemed ‘‘deficient’’ under section 782(d) if: (1) the information is submitted by the
VerDate Aug<31>2005 15:01 Jul 14, 2008 Jkt 214001 PO 00000 Frm 00009 Fmt 4703 Sfmt 4703 E:\FR\FM\15JYN1.SGM 15JYN1mst
ocks
till o
n P
RO
D1P
C66
with
NO
TIC
ES
40488 Federal Register / Vol. 73, No. 136 / Tuesday, July 15, 2008 / Notices
established deadline; (2) the information can be verified; (3) the information is not so incomplete that it cannot serve as a reliable basis for reaching the applicable determination; (4) the interested party has demonstrated that it acted to the best of its ability; and (5) the information can be used without undue difficulties.
Furthermore, section 776(b) of the Act states that if the Department ‘‘finds that an interested party has failed to cooperate by not acting to the best of its ability to comply with a request for information from the administering authority or the Commission, the administering authority or the Commission ..., in reaching the applicable determination under this title, may use an inference that is adverse to the interests of that party in selecting from among the facts otherwise available.’’ See also Statement of Administrative Action (SAA) accompanying the Uruguay Round Agreements Act (URAA), H.R. Rep. No. 103–316, Vol. 1 at 870 (1994).
For this final determination, in accordance with sections 773(c)(3)(A) and (B) of the Act and section s776(a)(2)(A), (B) and (D) and 776(b) of the Act, we have determined that the use of adverse facts available (‘‘AFA’’) is warranted for the PRC entity, as discussed below.
The PRC–Wide Rate Because we begin with the
presumption that all companies within an NME country are subject to government control and because only the companies listed under the ‘‘Final Determination Margins’’ section below have overcome that presumption, we are applying a single antidumping rate - the PRC–wide rate - to all other exporters of subject merchandise from the PRC. See, e.g., Synthetic Indigo from the People’s Republic of China: Notice of Final Determination of Sales at Less Than Fair Value, 65 FR 25706 (May 3, 2000). The PRC–wide rate applies to all entries of subject merchandise except for entries from the respondents identified as receiving a separate rate in the ‘‘Final Determination Margins’’ section below. In the Preliminary Determination, the Department found that the PRC–wide entity did not respond to our requests for information because record evidence
indicates there were more exporters of OTR tires from the PRC during the POI than those that responded to the Q&V questionnaire or the full antidumping questionnaire. Therefore, in the Preliminary Determination we treated these PRC producers/exporters as part of the PRC–wide entity because they did not demonstrate that they operate free of government control over their export activities. No additional information was placed on the record with respect to these entities after the Preliminary Determination. In addition, because the PRC–wide entity has not provided the Department with the requested information; pursuant to section 776(a)(2)(A) and (C) of the Act, the Department continues to find that the use of facts available is appropriate to determine the PRC–wide rate. Section 776(b) of the Act provides that, in selecting from among the facts otherwise available, the Department may employ an adverse inference if an interested party fails to cooperate by not acting to the best of its ability to comply with requests for information. See Notice of Final Determination of Sales at Less Than Fair Value: Certain Cold– Rolled Flat–Rolled Carbon–Quality Steel Products from the Russian Federation, 65 FR 5510, 5518 (February 4, 2000). See also, SAA at 870. We have determined that, because the PRC–wide entity did not respond to our request for information, it has failed to cooperate to the best of its ability. Therefore, the Department finds that, in selecting from among the facts otherwise available, an adverse inference is warranted.
Corroboration Section 776(c) of the Act provides
that, when the Department relies on secondary information in using the facts otherwise available, it must, to the extent practicable, corroborate that information from independent sources that are reasonably at its disposal. We have interpreted ‘‘corroborate’’ to mean that we will, to the extent practicable, examine the reliability and relevance of the information submitted. See Notice of Final Determination of Sales at Less Than Fair Value: Certain Cold–Rolled Flat–Rolled Carbon–Quality Steel Products From Brazil, 65 FR 5554, 5568 (February 4, 2000); see, e.g., Tapered Roller Bearings and Parts Thereof,
Finished and Unfinished, From Japan, and Tapered Roller Bearings, Four Inches or Less in Outside Diameter, and Components Thereof, From Japan; Preliminary Results of Antidumping Duty Administrative Reviews and Partial Termination of Administrative Reviews, 61 FR 57391, 57392 (November 6, 1996).
At the Preliminary Determination, in accordance with section 776(c) of the Act, we corroborated our adverse facts available (‘‘AFA’’) margin by comparing the U.S. prices and normal values from the petition to the U.S. price and normal values for the respondents. See Memorandum ‘‘Corroboration of the PRC–Wide Facts Available Rate for the Preliminary Determination,’’ dated February 5, 2008. Similarly, for the final determination, we have also compared the U.S. prices and normal values from the petition to the U.S. prices and normal values for the respondents. We found that the U.S. prices and normal values used to calculate the petition margin were within the range of net U.S. prices and normal values, respectively, used in our margin calculations for the mandatory respondents in this investigation.
Because no parties commented on the selection of the PRC–wide rate, we continue to find that the margin of 210.48 percent has probative value. Accordingly, we find that the rate of 210.48 percent is corroborated within the meaning of section 776(c) of the Act.
Critical Circumstances
In the Preliminary Determination, we found that critical circumstances exist for the PRC entity, however, we did not find that critical circumstances exist with respect to the mandatory respondents or the Separate Rate Recipients. We continue to find that critical circumstances exist for the PRC entity, and we continue to find that critical circumstances do not exist for the mandatory respondents or the remaining Separate Rate Recipients. See Issues and Decision Memorandum at Comment 24.
Final Determination Margins
We determine that the following percentage weighted–average margins exist for the POI:
VerDate Aug<31>2005 15:01 Jul 14, 2008 Jkt 214001 PO 00000 Frm 00010 Fmt 4703 Sfmt 4703 E:\FR\FM\15JYN1.SGM 15JYN1mst
ocks
till o
n P
RO
D1P
C66
with
NO
TIC
ES

40489 Federal Register / Vol. 73, No. 136 / Tuesday, July 15, 2008 / Notices
OTR TIRES FROM THE PRC
Exporter Producer
Weighted– Average Margin
(Percent)
Guizhou Tyre Co., Ltd.* ...................................................................................... Guizhou Advance Rubber ........................................ 4.08 Guizhou Tyre Co., Ltd.* ...................................................................................... Guizhou Tyre Co., Ltd. ............................................ 4.08 Hebei Starbright Co., Ltd./GPX International Tire Corporation, Ltd. ∧ ............... Hebei Starbright Co., Ltd. ........................................ 19.15 Tianjin United Tire & Rubber International Co., Ltd. (‘‘TUTRIC’’)* ..................... Tianjin United Tire & Rubber International Co., Ltd.
(‘‘TUTRIC’’).8.09
Xuzhou Xugong Tyres Co., Ltd. * = ................................................................... Xuzhou Xugong Tyres Co., Ltd. = ........................... 0.00 Aeolus Tyre Co., Ltd. * ....................................................................................... Aeolus Tyre Co., Ltd. ............................................... 9.48 Double Coin Holdings Ltd. * ............................................................................... Double Coin Holdings Ltd. ....................................... 9.48 Double Coin Holdings Ltd. * ............................................................................... Double Coin Group Rugao Tyre Co., Ltd. ............... 9.48 Double Coin Holdings Ltd. * ............................................................................... Double Coin Group Shanghai Donghai Tyre Co.,
Ltd..9.48
Double Happiness Tyre Industries Corp., Ltd. * ................................................. Double Happiness Tyre Industries Corp., Ltd. ........ 9.48 Jiangsu Feichi Co., Ltd. * ................................................................................... Jiangsu Feichi Co., Ltd. ........................................... 9.48 Kenda Rubber (China) Co., Ltd./Kenda Global Holding Co., Ltd (Cayman Is-
lands).Kenda Rubber (China) Co., Ltd. .............................. 9.48
KS Holding Limited ∧ .......................................................................................... Oriental Tyre Technology Ltd. ................................. 9.48 KS Holding Limited ∧ .......................................................................................... Shandong Taishan Tyre Co., Ltd. ........................... 9.48 KS Holding Limited ∧ .......................................................................................... Xu Zhou Xugong Tyres Co., Ltd. ............................. 9.48 Laizhou Xiongying Rubber Industry Co., Ltd. * .................................................. Laizhou Xiongying Rubber Industry Co., Ltd. .......... 9.48 Oriental Tyre Technology Limited + ................................................................... Midland Off the Road Tire Co., Ltd. ........................ 9.48 Oriental Tyre Technology Limited + ................................................................... Midland Specialty Tire Co., Ltd. .............................. 9.48 Oriental Tyre Technology Limited + ................................................................... Xuzhou Hanbang Tyres Co., Ltd. ............................ 9.48 Qingdao Aonuo Tyre Co., Ltd. ............................................................................ Qingdao Aonuo Tyre Co., Ltd. ................................. 9.48 Qingdao Etyre International Trade Co., Ltd. * .................................................... Shandong Xingda Tyre Co. Ltd. .............................. 9.48 Qingdao Etyre International Trade Co., Ltd. * .................................................... Shandong Xingyuan International Trade Co. Ltd. ... 9.48 Qingdao Etyre International Trade Co., Ltd. * .................................................... Shandong Xingyuan Rubber Co. Ltd. ...................... 9.48 Qingdao Free Trade Zone Full–World International Trading Co., Ltd. * ............ Qingdao Eastern Industrial Group Co., Ltd. ............ 9.48 Qingdao Free Trade Zone Full–World International Trading Co., Ltd. * ............ Qingdao Qihang Tyre Co., Ltd. ............................... 9.48 Qingdao Free Trade Zone Full–World International Trading Co., Ltd. * ............ Qingdao Shuanghe Tyre Co., Ltd. ........................... 9.48 Qingdao Free Trade Zone Full–World International Trading Co., Ltd. * ............ Qingdao Yellowsea Tyre Factory ............................ 9.48 Qingdao Free Trade Zone Full–World International Trading Co., Ltd. * ............ Shandong Zhentai Tyre Co., Ltd. ............................ 9.48 Qingdao Hengda Tyres Co., Ltd. * ..................................................................... Qingdao Hengda Tyres Co., Ltd. ............................. 9.48 Qingdao Milestone Tyre Co., Ltd.* ..................................................................... Qingdao Shuanghe Tyre Co., Ltd. ........................... 9.48 Qingdao Milestone Tyre Co., Ltd.* ..................................................................... Shandong Zhentai Tyre Co., Ltd. ............................ 9.48 Qingdao Milestone Tyre Co., Ltd.* ..................................................................... Shifeng Double–Star Tire Co., Ltd. ......................... 9.48 Qingdao Milestone Tyre Co., Ltd.* ..................................................................... Weifang Longtai Tyre Co., Ltd. ................................ 9.48 Qingdao Qihang Tyre Co., Ltd. * ........................................................................ Qingdao Qihang Tyre Co., Ltd. ............................... 9.48 Qingdao Qizhou Rubber Co., Ltd. * ................................................................... Qingdao Qizhou Rubber Co., Ltd. ........................... 9.48 Qingdao Sinorient International Ltd. * ................................................................ Qingdao Hengda Tyres Co., Ltd. ............................. 9.48 Qingdao Sinorient International Ltd. * ................................................................ Shifeng Double–Star Tire Co., Ltd. ......................... 9.48 Qingdao Sinorient International Ltd. * ................................................................ Tengzhou Broncho Tyre Co., Ltd.= ......................... 9.48 Shandong Huitong Tyre Co., Ltd. * .................................................................... Shandong Huitong Tyre Co., Ltd. ............................ 9.48 Shandong Jinyu Tyre Co., Ltd. * ........................................................................ Shandong Jinyu Tyre Co., Ltd. ................................ 9.48 Shandong Taishan Tyre Co., Ltd. *= .................................................................. Shandong Taishan Tyre Co., Ltd. = ........................ 9.48 Shandong Wanda Boto Tyre Co., Ltd.* .............................................................. Shandong Wanda Boto Tyre Co., Ltd. .................... 9.48 Shandong Xingyuan International Trading Co., Ltd. * ........................................ Shangdong Xingda Tyre Co., Ltd. ........................... 9.48 Shandong Xingyuan International Trading Co., Ltd. * ........................................ Xingyuan Tyre Group Co., Ltd. ................................ 9.48 Techking Tires Limited *= ................................................................................... Shandong Xingda Tyre Co. Ltd. .............................. 9.48 Techking Tires Limited *= ................................................................................... Shandong Xingyuan International Trade Co. Ltd. ... 9.48 Techking Tires Limited *= ................................................................................... Shandong Xingyuan Rubber Co. Ltd. ...................... 9.48 Triangle Tyre Co., Ltd. * ..................................................................................... Triangle Tyre Co., Ltd. ............................................. 9.48 Wendeng Sanfeng Tyre Co., Ltd.* ..................................................................... Wendeng Sanfeng Tyre Co., Ltd. ............................ 9.48 Zhaoyuan Leo Rubber Co., Ltd. * ...................................................................... Zhaoyuan Leo Rubber Co., Ltd. .............................. 9.48 PRC–Entity .......................................................................................................... .................................................................................. 210.48
Disclosure We will disclose the calculations
performed within five days of the date of publication of this notice to parties in this proceeding in accordance with 19 CFR 351.224(b).
Continuation of Suspension of Liquidation
In accordance with section 735(c)(1)(B) of the Act, we are directing
U.S. Customs and Border Protection (CBP) to continue to suspend liquidation of all imports of subject merchandise entered or withdrawn from warehouse, for consumption on or after the following dates: (1) for Starbright, TUTRIC, Guizhou Tyre and the separate rate companies, on or after February 20, 2008, the date of publication of the Preliminary Determination in the Federal Register, (2) for the PRC–wide
entity, on or after November 22, 2007, which is 90 days prior to the publication of the Preliminary Determination (consistent with our finding that critical circumstances exist for the PRC–wide entity). We will instruct CBP to continue to require a cash deposit or the posting of a bond for all companies based on the estimated weighted–average dumping margins shown above. The suspension of
VerDate Aug<31>2005 15:01 Jul 14, 2008 Jkt 214001 PO 00000 Frm 00011 Fmt 4703 Sfmt 4703 E:\FR\FM\15JYN1.SGM 15JYN1mst
ocks
till o
n P
RO
D1P
C66
with
NO
TIC
ES

40490 Federal Register / Vol. 73, No. 136 / Tuesday, July 15, 2008 / Notices
5 Agricultural tractors are dual-axle vehicles that typically are designed to pull farming equipment in the field and that may have front tires of a different size than the rear tires.
6 Combine harvesters are used to harvest crops such as corn or wheat.
7 Agricultural sprayers are used to irrigate agricultural fields
8 Industrial tractors are dual-axle vehicles that typically are designed to pull industrial equipment and that may have front tires of a different size than the rear tires.
9 A log-skidder has a grappling lift arm that is used to grasp, lift and move trees that have been cut down to a truck or trailer for transport to a mill or other destination.
10 Skid-steer loaders are four-wheel drive vehicles with the left-side drive wheels independent of the right-side drive wheels and lift arms that lie alongside the driver with the major pivot points behind the driver’s shoulders. Skid-steer loaders are used in agricultural, construction and industrial settings.
11 Haul trucks, which may be either rigid frame or articulated (i.e., able to bend in the middle) are typically used in mines, quarries and construction sites to haul soil, aggregate, mined ore, or debris.
12 Front loaders have lift arms in front of the vehicle. They can scrape material from one location to another, carry material in their buckets, or load material into a truck or trailer.
13 A dozer is a large four-wheeled vehicle with a dozer blade that is used to push large quantities of soil, sand, rubble, etc., typically around construction sites. They can also be used to perform ‘‘rough grading’’ in road construction.
14 A straddle carrier is a rigid frame, engine- powered machine that is used to load and offload containers from container vessels and load them onto (or off of) tractor trailers.
15 A grader is a vehicle with a large blade used to create a flat surface. Graders are typically used to perform ‘‘finish grading.’’ Graders are commonly used in maintenance of unpaved roads and road construction to prepare the base course onto which asphalt or other paving material will be laid.
16 i.e., ‘‘on-site’’ mobile cranes designed for off- highway use.
17 A counterbalanced lift truck is a rigid framed, engine-powered machine with lift arms that has additional weight incorporated into the back of the machine to offset or counterbalance the weight of loads that it lifts so as to prevent the vehicle from overturning. An example of a counterbalanced lift truck is a counterbalanced fork lift truck. Counterbalanced lift trucks may be designed for use on smooth floor surfaces, such as a factory or warehouse, or other surfaces, such as construction sites, mines, etc.
18 While tube-type tires are subject to the scope of this proceeding, tubes and flaps are not subject merchandise and therefore are not covered by the scope of this proceeding, regardless of the manner in which they are sold (e.g. sold with or separately from subject merchandise).
liquidation instructions will remain in effect until further notice.
Because the Department found that the weighted–average dumping margin for subject merchandise produced and exported by Xugong is zero, we are instructing CBP to terminate suspension of liquidation of all imports of subject merchandise produced and exported by Xugong, entered, or withdrawn from warehouse, for consumption on or after February 20, 2008, the date of publication of the Preliminary Determination. CBP shall refund any cash deposit and release any bond or other security previously posted in connection with merchandise produced and exported by Xugong. These suspension of liquidation instructions will remain in effect until further notice.
ITC Notification
In accordance with section 735(d) of the Act, we have notified the International Trade Commission (‘‘ITC’’) of our final determination of sales at LTFV. As our final determination is affirmative, in accordance with section 735(b)(2) of the Act, within 45 days the ITC will determine whether the domestic industry in the United States is materially injured, or threatened with material injury, by reason of imports or sales (or the likelihood of sales) for importation of the subject merchandise. If the ITC determines that material injury or threat of material injury does not exist, the proceeding will be terminated and all securities posted will be refunded or canceled. If the ITC determines that such injury does exist, the Department will issue an antidumping duty order directing CBP to assess antidumping duties on all imports of the subject merchandise entered, or withdrawn from warehouse, for consumption on or after the effective date of the suspension of liquidation.
Notification Regarding APO
This notice also serves as a reminder to the parties subject to administrative protective order (‘‘APO’’) of their responsibility concerning the disposition of proprietary information disclosed under APO in accordance with 19 CFR 351.305. Timely notification of return or destruction of APO materials or conversion to judicial protective order is hereby requested. Failure to comply with the regulations and the terms of an APO is a sanctionable violation.
This determination and notice are issued and published in accordance with sections 735(d) and 777(i)(1) of the Act.
Dated: July 7, 2008. David M. Spooner, Assistant Secretary for Import Administration.
Appendix I
Scope of the Proceeding Antidumping and Countervailing Duty Investigations On Off–The-Road Tires from the PRC
The products covered by the scope are new pneumatic tires designed for off– the-road (OTR) and off–highway use, subject to exceptions identified below. Certain OTR tires are generally designed, manufactured and offered for sale for use on off–road or off–highway surfaces, including but not limited to, agricultural fields, forests, construction sites, factory and warehouse interiors, airport tarmacs, ports and harbors, mines, quarries, gravel yards, and steel mills. The vehicles and equipment for which certain OTR tires are designed for use include, but are not limited to: (1) agricultural and forestry vehicles and equipment, including agricultural tractors,5 combine harvesters,6 agricultural high clearance sprayers,7 industrial tractors,8 log–skidders,9 agricultural implements, highway– towed implements, agricultural logging, and agricultural, industrial, skid–steers/ mini–loaders;10 (2) construction vehicles and equipment, including earthmover articulated dump products, rigid frame haul trucks,11 front end loaders,12 dozers,13 lift trucks, straddle
carriers,14 graders,15 mobile cranes,16 compactors; and (3) industrial vehicles and equipment, including smooth floor, industrial, mining, counterbalanced lift trucks, industrial and mining vehicles other than smooth floor, skid–steers/ mini–loaders, and smooth floor off–the- road counterbalanced lift trucks.17 The foregoing list of vehicles and equipment generally have in common that they are used for hauling, towing, lifting, and/or loading a wide variety of equipment and materials in agricultural, construction and industrial settings. Such vehicles and equipment, and the descriptions contained in the footnotes are illustrative of the types of vehicles and equipment that use certain OTR tires, but are not necessarily all–inclusive. While the physical characteristics of certain OTR tires will vary depending on the specific applications and conditions for which the tires are designed (e.g., tread pattern and depth), all of the tires within the scope have in common that they are designed for off– road and off–highway use. Except as discussed below, OTR tires included in the scope of the proceeding range in size (rim diameter) generally but not exclusively from 8 inches to 54 inches. The tires may be either tube–type18 or tubeless, radial or non–radial, and intended for sale either to original equipment manufacturers or the replacement market. The subject merchandise is currently classifiable under Harmonized Tariff Schedule of the United States (‘‘HTSUS’’) subheadings: 4011.20.10.25, 4011.20.10.35, 4011.20.50.30, 4011.20.50.50, 4011.61.00.00, 4011.62.00.00, 4011.63.00.00, 4011.69.00.00, 4011.92.00.00,
VerDate Aug<31>2005 15:01 Jul 14, 2008 Jkt 214001 PO 00000 Frm 00012 Fmt 4703 Sfmt 4703 E:\FR\FM\15JYN1.SGM 15JYN1mst
ocks
till o
n P
RO
D1P
C66
with
NO
TIC
ES

40491 Federal Register / Vol. 73, No. 136 / Tuesday, July 15, 2008 / Notices
4011.93.40.00, 4011.93.80.00, 4011.94.40.00, and 4011.94.80.00. While HTSUS subheadings are provided for convenience and customs purposes, our written description of the scope is dispositive. Specifically excluded from the scope are new pneumatic tires designed, manufactured and offered for sale primarily for on–highway or on–road use, including passenger cars, race cars, station wagons, sport utility vehicles, minivans, mobile homes, motorcycles, bicycles, on–road or on–highway trailers, light trucks, and trucks and buses. Such tires generally have in common that the symbol ‘‘DOT’’ must appear on the sidewall, certifying that the tire conforms to applicable motor vehicle safety standards. Such excluded tires may also have the following designations that are used by the Tire and Rim Association:
Prefix letter designations:
• P – Identifies a tire intended primarily for service on passenger cars;
• LT – Identifies a tire intended primarily for service on light trucks; and,
• ST – Identifies a special tire for trailers in highway service.
Suffix letter designations:
• TR – Identifies a tire for service on trucks, buses, and other vehicles with rims having specified rim diameter of nominal plus 0.156″ or plus 0.250″;
• MH – Identifies tires for Mobile Homes;
• HC – Identifies a heavy duty tire designated for use on ‘‘HC’’ 15’’ tapered rims used on trucks, buses, and other vehicles. This suffix is intended to differentiate among tires for light trucks, and other vehicles or other services, which use a similar designation.
• Example: 8R17.5 LT, 8R17.5 HC; • LT – Identifies light truck tires for
service on trucks, buses, trailers, and multipurpose passenger vehicles used in nominal highway service; and
• MC – Identifies tires and rims for motorcycles.
The following types of tires are also excluded from the scope: pneumatic tires that are not new, including recycled or retreaded tires and used tires; non–pneumatic tires, including solid rubber tires; tires of a kind designed for use on aircraft, all–terrain vehicles, and vehicles for turf, lawn and garden, golf and trailer applications. Also excluded from the scope are radial and bias tires of a kind designed for use
in mining and construction vehicles and equipment that have a rim diameter equal to or exceeding 39 inches. Such tires may be distinguished from other tires of similar size by the number of plies that the construction and mining tires contain (minimum of 16) and the weight of such tires (minimum 1500 pounds).
Appendix II
I. General Issues
Comment 1: Whether the Department Should Apply Market–Economy Calculation Methodologies in this Investigation Comment 2: Whether the Dual Application of the Non–Market Economy AD Methodology and the Market–Economy CVD Methodology Results in Double Remedies Comment 3: Treatment of Corrections from Verifications Comment 4: Ministerial Error Corrections Comment 5: Wage Rate Methodology Comment 6: Adjustment for Un– refunded Value Added Taxes Comment 7: Treatment of Respondents’ Packing Labor
General Surrogate Value Issues
Comment 8: Standard for Accepting Respondents’ Proposed HTS Categories Comment 9: Treatment of Aberrational Data in Certain Surrogate Values Comment 10: Reliability of Infodrive India Data
Comment 11: Surrogate Value Source for Steam Comment 12: Natural Rubber Surrogate Value Comment 13: Steam Coal Surrogate Value Comment 14: Carbon Black Surrogate Value Comment 15: Surrogate Value Source for Electricity Comment 16: Use of Electricity–Specific Inflation Index
Surrogate Financial Statements
Comment 17: Selection of Surrogate Financial Statements Comment 17.A: Use of Financial Statements of Surrogate Companies That May Have Received Government Subsidies Comment 17.B: Use of TVS’s Financial Statement Comment 18: Calculation of Surrogate Financial Ratios Comment 18.A: Treatment of Rental Receipts in TVS’s Financial Statement Comment 18.B: Treatment of ‘‘Miscellaneous Income’’ in Goodyear’s Financial Statements Comment 18.C: Treatment of Discounts and Rebates in the SG&A Ratio
Calculation based on CEAT’s Financial Statement Comment 18.D: Offset for Interest Revenue in Goodyear’s Financial Statement Comment 18.E: Treatment of ‘‘Less transfer from revaluation reserve’’ in Falcon’s Financial Statement Comment 18.F: Treatment of ‘‘Conversion Charges’’ in CEAT, Falcon, and Goodyear’s Financial Statements Comment 18.G: Treatment of ‘‘Labor Costs’’ in CEAT, Falcon, Goodyear and TVS’s Financial Statements Comment 18.H: Treatment of Non– Production-Related Energy and Utility Consumption
II. Scope Issues Comment 19: Imported Wheel Mounted Tires Certifications Comment 20: OTR Agricultural Tires, Including for Highway–Towed Implements Comment 21: Tubes and Flaps Comment 22: Earthmoving, Mining, and Construction Tires
III. Targeted Dumping Issues Comment 23:Targeted Dumping Comment 23.A: Whether the Department Should Reject the Targeted Dumping Allegation Filed by Bridgestone Comment 23.B: Whether the Targeted Dumping Test Used by the Department is Flawed and Should be Replaced Comment 23.C: Whether the Department Should Use the ‘‘P/2 Test’’ to Test for Targeted Dumping Comment 23.D: Whether the Department Should Use the ‘‘T–Test’’ to Test for Targeted Dumping Comment 23.E: If the Department Continues to Use its Nails Test, Whether it Should Permit Certain Margins to be Offset with Negative Margins Comment 23.F: Treatment of Xugong’s Sales Comment 23.G: Programming Errors Comment 23.H: Changes based on TD Methodology
IV. Critical Circumstances Comment 24: Critical Circumstances
V. Issues Specific to Guizhou Tyre Comment 25: Guizhou Tyre’s Eligibility for a Separate Rate Comment 26: Treatment of Guizhou Tyre’s Guangzhou Warehouse Expenses Comment 27: Treatment of Guizhou Tyre’s Reported Manufacturing Overhead Materials Comment 28: Calculation of Guizhou Tyre’s Domestic Movement Expenses Comment 29: Treatment of Guizhou Tyre’s Demurrage Charge Comment 30: Distance from Guizhou Tyre’s Factory to the Guangzhou Warehouse
VerDate Aug<31>2005 15:01 Jul 14, 2008 Jkt 214001 PO 00000 Frm 00013 Fmt 4703 Sfmt 4703 E:\FR\FM\15JYN1.SGM 15JYN1mst
ocks
till o
n P
RO
D1P
C66
with
NO
TIC
ES

40492 Federal Register / Vol. 73, No. 136 / Tuesday, July 15, 2008 / Notices
1 This figure does not include those companies for which the Department is rescinding the administrative review.
Comment 31: Appropriate Unit of Measure for Guizhou Tyre’s Reported Water Consumption Comment 32: Treatment of Guizhou Tyre’s Unreported Labor Hours Discovered at Verification Comment 33: Classification of Guizhou Tyre’s Sales Made to a Certain U.S. Customer Comment 34: Byproduct Offset for Guizhou Tyre Comment 35: Treatment of Guizhou Tyre’s International Freight Costs Comment 36: Appropriate Classification for Certain Guizhou Tyre Material Inputs Comment 37: Calculation of Value of Guizhou Tyre’s Carbon Black Comment 38: Treatment of Guizhou Tyre’s Sales Made Through TED Comment 39: Whether to Include Licenses and Taxes in Guizhou Tyre’s Indirect Selling Expense Ratio Comment 40: Treatment of Guizhou Tyre’s Billing Adjustment for Tubes and Flaps
VI. Issues Specific to Xugong
Comment 41: Treatment of Xugong and Its Chinese Affiliates as a Single Entity Comment 42: Treatment of Xugong’s Sales to API Comment 43: Use of Xugong’s Upstream Inputs Comment 43.A: Rejection of Armour Rubber’s Upstream Inputs Comment 43.B: Adjustments of Xugong’s Upstream Inputs Comment 44: Valuation of Xugong’s FOPs from Intermediate Inputs Database Comment 45: Valuation of Xugong’s FOPs from Upstream Inputs Database Comment 46: Treatment of Sales with Improperly Reported Tread Code Comment 47: Treatment of Xugong’s Factor as Wood Tar or Pine Oil
VII. Issues Common to Starbright and TUTRIC
Comment 48.A: Whether TUTRIC and GPX are Affiliated Comment 48.B: Whether TUTRIC and Starbright Should be Collapsed Comment 49: Surrogate Value Sources for Scrap Rubber, Reclaimed Rubber, Rubber Powder and Wire Comment 50: The Application of AFA for Sales of Tires Greater Than 39 Inches for Starbright and TUTRIC
VIII. Issues Specific to Starbright
Comment 51: Start–Up Adjustment for Starbright Comment 52: Starbright Argues that the Department Should Adjust Normal Value for a CEP Offset and Differences in Circumstances of Sale Comment 53: Investigation of Starbright’s Sales Below Cost Should
the Department Determines that Starbright Warrants MOE Treatment Comment 54: Treatment of Unreported Sales of Subject Merchandise Comment 55: Reliability of Starbright’s Reported U.S. Sales Prices Comment 56: Treatment of Starbright’s Early Payment Discounts Comment 57: Treatment of Tanggu Warehouse Expenses as an Adjustment to U.S. Price Comment 58: Minor Correction to Freight–In Expenses Comment 59: The Nature of WARR2U Comment 60: Expenses Included in U.S. Duty Comment 61: U.S. Warehousing Expenses Comment 62: Dutiable Assists Comment 63: Direct Labor Hours Comment 64: Starbright’s Indirect Labor Hours Comment 65: Ministerial Errors With Respect to U.S. Credit Expenses Comment 66: Marine Insurance Comment 67: Correct Names for Certain Separate Rates Parties for Customs Instructions Comment 68: Time Period for Measuring Starbright’s U.S. Indirect Selling Expenses Comment 69: Inclusion of Post–POI Credit Notes in the Section C Database Comment 70: Purchases of Market– Economy Inputs from PRC Trading Companies as Market Economy Purchases Comment 71: Allocation Methodology for U.S. Indirect Selling Expenses Comment 72: Expenses Excluded from the Calculation of ISE Comment 73: Starbright’s U.S. Inland Freight Expense Comment 74: The Adequacy of Starbright’s Reported Material Consumption Standards, Variance Calculations and FOP Consumption Rate Comment 75: Market–Economy Methodology for Starbright Comment 76: Time Period For Determining ICC For Starbright’s Retail Stores
IX. Issues Specific to TUTRIC
Comment 77: TUTRIC’s Eligibility for a Separate Rate Comment 78: TUTRIC’s Sales to GPX Delivered to the Tanggu Warehouse Comment 79: Sales and FOPs for Tubes and Flaps for TUTRIC Comment 80: Treatment of Indirect Labor Hours for TUTRIC Comment 81: Additional Calculation Errors With Respect to TUTRIC Comment 82: The Adequacy of TUTRIC’s Reported Material Consumption Standards, Variance
Calculations and FOP Consumption Rate [FR Doc. E8–16156 Filed 7–14–08; 8:45 am] BILLING CODE 3510–DS–S
DEPARTMENT OF COMMERCE
International Trade Administration
[A–533–840]
Certain Frozen Warmwater Shrimp From India: Final Results and Partial Rescission of Antidumping Duty Administrative Review
AGENCY: Import Administration, International Trade Administration, Department of Commerce. SUMMARY: On March 6, 2008, the Department of Commerce (the Department) published the preliminary results of the administrative review of the antidumping duty order on certain frozen warmwater shrimp (shrimp) from India. This review covers 201 producers/exporters of the subject merchandise to the United States. The period of review (POR) is February 1, 2006, through January 31, 2007. We are rescinding the review with respect to four companies because these companies had no reportable shipments of subject merchandise during the POR.
Based on our analysis of the comments received, we have made certain changes in the margin calculations. Therefore, the final results differ from the preliminary results. The final weighted-average dumping margins for the reviewed firms are listed below in the section entitled ‘‘Final Results of Review.’’ DATES: Effective Date: July 15, 2008. FOR FURTHER INFORMATION CONTACT: Elizabeth Eastwood, AD/CVD Operations, Office 2, Import Administration, International Trade Administration, U.S. Department of Commerce, 14th Street and Constitution Avenue, NW., Washington, DC 20230; telephone (202) 482–3874. SUPPLEMENTARY INFORMATION:
Background
This review covers 201 producers/ exporters.1 The respondents which the Department selected for individual review are Devi Sea Foods Limited (Devi) and Falcon Marine Exports Limited (Falcon). The respondents which were not selected for individual review are listed in the ‘‘Final Results of Review’’ section of this notice.
VerDate Aug<31>2005 15:01 Jul 14, 2008 Jkt 214001 PO 00000 Frm 00014 Fmt 4703 Sfmt 4703 E:\FR\FM\15JYN1.SGM 15JYN1mst
ocks
till o
n P
RO
D1P
C66
with
NO
TIC
ES
B-1
APPENDIX B
HEARING WITNESSES

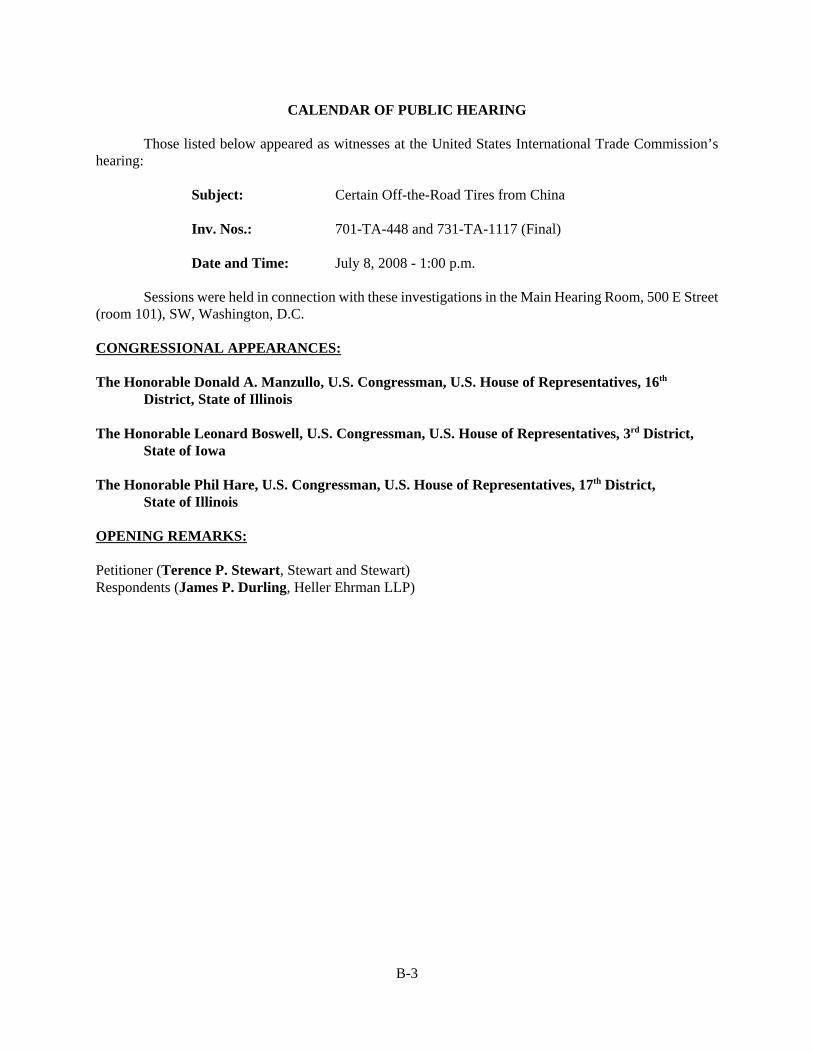
B-3
CALENDAR OF PUBLIC HEARING
Those listed below appeared as witnesses at the United States International Trade Commission’shearing:
Subject: Certain Off-the-Road Tires from China
Inv. Nos.: 701-TA-448 and 731-TA-1117 (Final)
Date and Time: July 8, 2008 - 1:00 p.m.
Sessions were held in connection with these investigations in the Main Hearing Room, 500 E Street(room 101), SW, Washington, D.C.
CONGRESSIONAL APPEARANCES:
The Honorable Donald A. Manzullo, U.S. Congressman, U.S. House of Representatives, 16th
District, State of Illinois
The Honorable Leonard Boswell, U.S. Congressman, U.S. House of Representatives, 3rd District,State of Iowa
The Honorable Phil Hare, U.S. Congressman, U.S. House of Representatives, 17th District,State of Illinois
OPENING REMARKS:
Petitioner (Terence P. Stewart, Stewart and Stewart)Respondents (James P. Durling, Heller Ehrman LLP)

B-4
In Support of the Imposition of the Antidumping and Countervailing Duty Orders:
Stewart and StewartWashington, D.C.on behalf of
Titan Tire Corporation (“Titan”)United Steel, Paper and Forestry, Rubber,
Manufacturing, Energy, Allied Industrialand Service Workers International Union,AFL-CIO-CLC (“USW”)
Maurice M. Taylor, Jr., Chairman and Chief ExecutiveOfficer, Titan
Jeff Vasichek, Vice President, Marketing, Titan
Paul Hawkins, Vice President, Operations, Titan
Ron Hoover, Executive Vice President, Rubber andPlastic Industry Conference, USW
Linda Andros, Legislative Representative, USW
Don Mateer, III, President, Speciality Tires of America
Tracy Leslie, President, Leslie Tire Service andExecutive Vice President, Michigan TireDistributors
Kelly Monthei, Owner and General Manger, Graham Tire
Terence P. Stewart )Eric P. Salonen ) – OF COUNSELElizabeth A. Argenti )

B-5
In Support of the Imposition of the Antidumping and Countervailing Duty Orders (continued):
King & Spalding, LLPWashington, D.C.on behalf of
Bridgestone Firestone North American Tire, LLC
Kenneth Allen, Vice President, Firestone North AmericanTire, LLC, Firestone Agricultural Tire
T. Shawn Rasey, Vice President North America, Bridgestone Firestone Off-Road Tire Division
Joseph Ivy, Director, Manufacturing, FirestoneFarm Tires
Kenneth R. Button. Ph.D., Consultant, Economic ConsultingServices, LLC
Jennifer Lutz, Consultant, Economic Consulting Services, LLC
Michael G. Szustakowski, Consultant, King & Spalding LLP
Joseph W. Dorn )Stephen A. Jones ) – OF COUNSELStephen J. Narkin )

B-6
CALENDAR OF PUBLIC HEARING
Those listed below appeared as witnesses at the United States International Trade Commission’shearing:
Subject: Certain Off-the-Road Tires from China
Inv. Nos.: 701-TA-448 and 731-TA-1117 (Final)
Date and Time: July 9, 2008 - 9:30 a.m.
Sessions were held in connection with this investigation in the Main Hearing Room, 500 E Street(room 101), SW, Washington, D.C.
CONGRESSIONAL APPEARANCES:
The Honorable Sherrod Brown, United States Senator, United States Senate, State of Ohio
The Honorable Lincoln Davis, U.S. Congressman, U.S. House of Representatives, 4th District, Stateof Tennessee
In Opposition to the Imposition of Antidumping and Countervailing Duties:
Heller Ehrman LLPWashington, D.C.on behalf of
GPX International Tire Group (“GPX”)
Bryan S. Ganz, Chairman, Board of Directors, GPX
M. William Macey, Member, Board of Directors, GPX
Domenic E. Mazzola, Executive Vice President, GPX
Joel De Glopper, Vice President, Ridal Tire Engineering, GPX
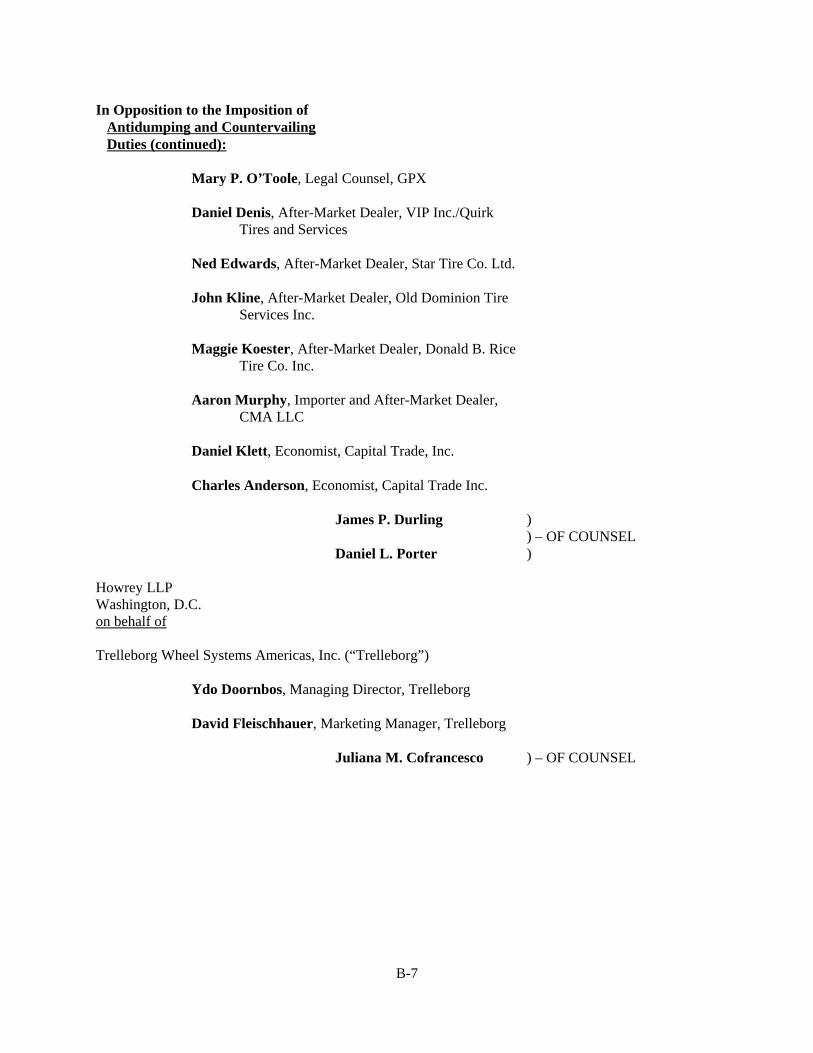
B-7
In Opposition to the Imposition of Antidumping and Countervailing Duties (continued):
Mary P. O’Toole, Legal Counsel, GPX
Daniel Denis, After-Market Dealer, VIP Inc./QuirkTires and Services
Ned Edwards, After-Market Dealer, Star Tire Co. Ltd.
John Kline, After-Market Dealer, Old Dominion TireServices Inc.
Maggie Koester, After-Market Dealer, Donald B. RiceTire Co. Inc.
Aaron Murphy, Importer and After-Market Dealer,CMA LLC
Daniel Klett, Economist, Capital Trade, Inc.
Charles Anderson, Economist, Capital Trade Inc.
James P. Durling )) – OF COUNSEL
Daniel L. Porter )
Howrey LLPWashington, D.C.on behalf of
Trelleborg Wheel Systems Americas, Inc. (“Trelleborg”)
Ydo Doornbos, Managing Director, Trelleborg
David Fleischhauer, Marketing Manager, Trelleborg
Juliana M. Cofrancesco ) – OF COUNSEL

B-8
In Opposition to the Imposition of Antidumping and Countervailing Duties (continued):
Greenberg Traurig LLPWashington, D.C.on behalf of
American Pacific Industries Inc. (“API”)
Jeff Kreitzman, President, API
Philippe M. Bruno )) – OF COUNSEL
Rosa S. Jeong )
Hogan & Hartson LLPWashington, D.C.on behalf of
Aeolus Tyre Co., Ltd.; Guizhou Tyre Co., Ltd.;Hangzhou Zhongce Rubber Co., Ltd.; Haohua South Rubber Corp., Ltd.;Jiangsu Feichi Co., Ltd.; Laizhou Xiongying Rubber Industry Co., Ltd.; Shandong Taishan Tyre Co., Ltd.; Shandong Wanda Boto Tyre Co., Ltd.; Shandong Xingyuan International Trading Co., Ltd.; Techking Tires Limited, Tianjin United Tire & RubberInternational Co., Ltd.; Triangle Tyre Co., Ltd.; Wendeng Sanfeng Tyre Co., Ltd.; Zhaoyuan Leo Rubber Co., Ltd.; Tire Engineering & Distribution, Inc.; and Guizhou Tyre I/E Corp(collectively the “Chinese Respondents”)
Mark Lammlein, Vice President, Sales andMarketing, Great Lakes Tire Company
Paul Copen, Director, Sales, Great LakesTire Company

B-9
In Opposition to the Imposition of Antidumping and Countervailing Duties (continued):
John Reilly, Economist, Nathan Associates, Inc.
Craig A. Lewis )) – OF COUNSEL
Jonathan T. Stoel )
Sidley Austin LLPWashington, D.C.on behalf of
Caterpiller Inc. (“Caterpillar”)
Jack M. Koch, Indirect/Direct Manager, Caterpillar
Neil R. Ellis )) – OF COUNSEL
Yvonne M. Hilst )
Rodriguez O’Donnell Gonzalez & Williams, P.C.Chicago, ILon behalf of
Super Grip Corporation
Dexter Christenberry, Chief Executive Officer, SuperGrip Corporation
Nick Sticklin, General Manager, Appalachian Tire Products
R. Kevin Williams )) – OF COUNSEL
Thomas J. O’Donnell )
REBUTTAL/CLOSING REMARKS:
Petitioner (Joseph W. Dorn, King & Spalding, LLP )Respondents (Craig A. Lewis, Hogan & Hartson LLP)


C-1
APPENDIX C
SUMMARY DATA

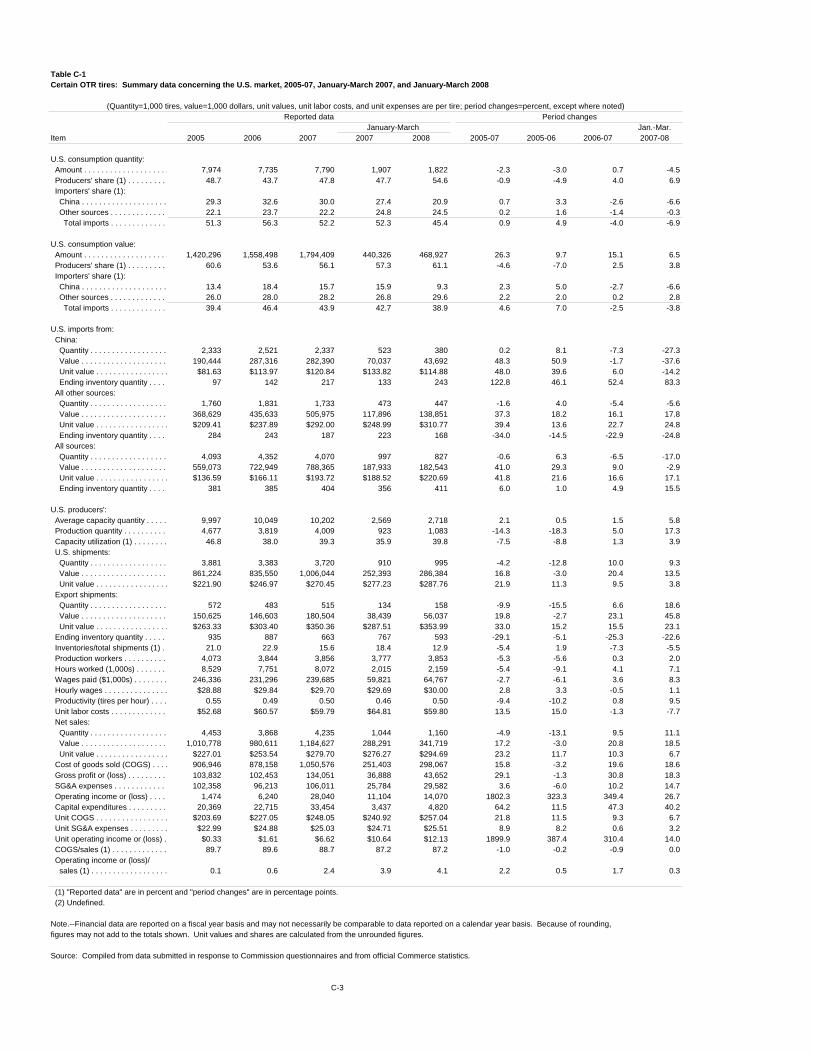
Table C-1Certain OTR tires: Summary data concerning the U.S. market, 2005-07, January-March 2007, and January-March 2008
(Quantity=1,000 tires, value=1,000 dollars, unit values, unit labor costs, and unit expenses are per tire; period changes=percent, except where noted)Reported data Period changes
January-March Jan.-Mar.Item 2005 2006 2007 2007 2008 2005-07 2005-06 2006-07 2007-08
U.S. consumption quantity: Amount . . . . . . . . . . . . . . . . . . . . 7,974 7,735 7,790 1,907 1,822 -2.3 -3.0 0.7 -4.5 Producers' share (1) . . . . . . . . . 48.7 43.7 47.8 47.7 54.6 -0.9 -4.9 4.0 6.9 Importers' share (1): China . . . . . . . . . . . . . . . . . . . . 29.3 32.6 30.0 27.4 20.9 0.7 3.3 -2.6 -6.6 Other sources . . . . . . . . . . . . . 22.1 23.7 22.2 24.8 24.5 0.2 1.6 -1.4 -0.3 Total imports . . . . . . . . . . . . . 51.3 56.3 52.2 52.3 45.4 0.9 4.9 -4.0 -6.9
U.S. consumption value: Amount . . . . . . . . . . . . . . . . . . . . 1,420,296 1,558,498 1,794,409 440,326 468,927 26.3 9.7 15.1 6.5 Producers' share (1) . . . . . . . . . 60.6 53.6 56.1 57.3 61.1 -4.6 -7.0 2.5 3.8 Importers' share (1): China . . . . . . . . . . . . . . . . . . . . 13.4 18.4 15.7 15.9 9.3 2.3 5.0 -2.7 -6.6 Other sources . . . . . . . . . . . . . 26.0 28.0 28.2 26.8 29.6 2.2 2.0 0.2 2.8 Total imports . . . . . . . . . . . . . 39.4 46.4 43.9 42.7 38.9 4.6 7.0 -2.5 -3.8
U.S. imports from: China: Quantity . . . . . . . . . . . . . . . . . . 2,333 2,521 2,337 523 380 0.2 8.1 -7.3 -27.3 Value . . . . . . . . . . . . . . . . . . . . 190,444 287,316 282,390 70,037 43,692 48.3 50.9 -1.7 -37.6 Unit value . . . . . . . . . . . . . . . . . $81.63 $113.97 $120.84 $133.82 $114.88 48.0 39.6 6.0 -14.2 Ending inventory quantity . . . . 97 142 217 133 243 122.8 46.1 52.4 83.3 All other sources: Quantity . . . . . . . . . . . . . . . . . . 1,760 1,831 1,733 473 447 -1.6 4.0 -5.4 -5.6 Value . . . . . . . . . . . . . . . . . . . . 368,629 435,633 505,975 117,896 138,851 37.3 18.2 16.1 17.8 Unit value . . . . . . . . . . . . . . . . . $209.41 $237.89 $292.00 $248.99 $310.77 39.4 13.6 22.7 24.8 Ending inventory quantity . . . . 284 243 187 223 168 -34.0 -14.5 -22.9 -24.8 All sources: Quantity . . . . . . . . . . . . . . . . . . 4,093 4,352 4,070 997 827 -0.6 6.3 -6.5 -17.0 Value . . . . . . . . . . . . . . . . . . . . 559,073 722,949 788,365 187,933 182,543 41.0 29.3 9.0 -2.9 Unit value . . . . . . . . . . . . . . . . . $136.59 $166.11 $193.72 $188.52 $220.69 41.8 21.6 16.6 17.1 Ending inventory quantity . . . . 381 385 404 356 411 6.0 1.0 4.9 15.5
U.S. producers': Average capacity quantity . . . . . 9,997 10,049 10,202 2,569 2,718 2.1 0.5 1.5 5.8 Production quantity . . . . . . . . . . 4,677 3,819 4,009 923 1,083 -14.3 -18.3 5.0 17.3 Capacity utilization (1) . . . . . . . . 46.8 38.0 39.3 35.9 39.8 -7.5 -8.8 1.3 3.9 U.S. shipments: Quantity . . . . . . . . . . . . . . . . . . 3,881 3,383 3,720 910 995 -4.2 -12.8 10.0 9.3 Value . . . . . . . . . . . . . . . . . . . . 861,224 835,550 1,006,044 252,393 286,384 16.8 -3.0 20.4 13.5 Unit value . . . . . . . . . . . . . . . . . $221.90 $246.97 $270.45 $277.23 $287.76 21.9 11.3 9.5 3.8 Export shipments: Quantity . . . . . . . . . . . . . . . . . . 572 483 515 134 158 -9.9 -15.5 6.6 18.6 Value . . . . . . . . . . . . . . . . . . . . 150,625 146,603 180,504 38,439 56,037 19.8 -2.7 23.1 45.8 Unit value . . . . . . . . . . . . . . . . . $263.33 $303.40 $350.36 $287.51 $353.99 33.0 15.2 15.5 23.1 Ending inventory quantity . . . . . 935 887 663 767 593 -29.1 -5.1 -25.3 -22.6 Inventories/total shipments (1) . 21.0 22.9 15.6 18.4 12.9 -5.4 1.9 -7.3 -5.5 Production workers . . . . . . . . . . 4,073 3,844 3,856 3,777 3,853 -5.3 -5.6 0.3 2.0 Hours worked (1,000s) . . . . . . . 8,529 7,751 8,072 2,015 2,159 -5.4 -9.1 4.1 7.1 Wages paid ($1,000s) . . . . . . . . 246,336 231,296 239,685 59,821 64,767 -2.7 -6.1 3.6 8.3 Hourly wages . . . . . . . . . . . . . . . $28.88 $29.84 $29.70 $29.69 $30.00 2.8 3.3 -0.5 1.1 Productivity (tires per hour) . . . . 0.55 0.49 0.50 0.46 0.50 -9.4 -10.2 0.8 9.5 Unit labor costs . . . . . . . . . . . . . $52.68 $60.57 $59.79 $64.81 $59.80 13.5 15.0 -1.3 -7.7 Net sales: Quantity . . . . . . . . . . . . . . . . . . 4,453 3,868 4,235 1,044 1,160 -4.9 -13.1 9.5 11.1 Value . . . . . . . . . . . . . . . . . . . . 1,010,778 980,611 1,184,627 288,291 341,719 17.2 -3.0 20.8 18.5 Unit value . . . . . . . . . . . . . . . . . $227.01 $253.54 $279.70 $276.27 $294.69 23.2 11.7 10.3 6.7 Cost of goods sold (COGS) . . . . 906,946 878,158 1,050,576 251,403 298,067 15.8 -3.2 19.6 18.6 Gross profit or (loss) . . . . . . . . . 103,832 102,453 134,051 36,888 43,652 29.1 -1.3 30.8 18.3 SG&A expenses . . . . . . . . . . . . . 102,358 96,213 106,011 25,784 29,582 3.6 -6.0 10.2 14.7 Operating income or (loss) . . . . 1,474 6,240 28,040 11,104 14,070 1802.3 323.3 349.4 26.7 Capital expenditures . . . . . . . . . 20,369 22,715 33,454 3,437 4,820 64.2 11.5 47.3 40.2 Unit COGS . . . . . . . . . . . . . . . . . $203.69 $227.05 $248.05 $240.92 $257.04 21.8 11.5 9.3 6.7 Unit SG&A expenses . . . . . . . . . $22.99 $24.88 $25.03 $24.71 $25.51 8.9 8.2 0.6 3.2 Unit operating income or (loss) . $0.33 $1.61 $6.62 $10.64 $12.13 1899.9 387.4 310.4 14.0 COGS/sales (1) . . . . . . . . . . . . . 89.7 89.6 88.7 87.2 87.2 -1.0 -0.2 -0.9 0.0 Operating income or (loss)/ sales (1) . . . . . . . . . . . . . . . . . . 0.1 0.6 2.4 3.9 4.1 2.2 0.5 1.7 0.3
(1) "Reported data" are in percent and "period changes" are in percentage points. (2) Undefined.
Note.--Financial data are reported on a fiscal year basis and may not necessarily be comparable to data reported on a calendar year basis. Because of rounding,figures may not add to the totals shown. Unit values and shares are calculated from the unrounded figures.
Source: Compiled from data submitted in response to Commission questionnaires and from official Commerce statistics.
C-3

Table C-2OTR tires > 39": Summary data concerning the U.S. market, 2005-07, January-March 2007, and January-March 2008
* * * * * * *
Table C-3OTR tires (including tires > 39"): Summary data concerning the U.S. market, 2005-07, January-March 2007, and January-March 2008
* * * * * * *
C-4
D-1
APPENDIX D
COMMENTS REGARDING LIKE PRODUCT FACTORS


D-3
Comparability of Certain OTR Tires and OTR Tires For Mining And Construction With A Rim Diameter >= 39"
* * * * * * *

E-1
APPENDIX E
SUPPLEMENTAL DATA


Table E-1Certain OTR tires: U.S. imports, by sources, 2005-07, January-March 2007, and January-March 200
January-March Item 2005 2006 2007 2007 2008
Quantity (1,000 tires)
China . . . . . . . . . . . . . . . . . . . . 825 1,079 1,403 325 237All other sources . . . . . . . . . . . . 1,087 1,183 1,163 308 357 Total . . . . . . . . . . . . . . . . . . . . 1,912 2,262 2,567 632 593
Quantity (1,000 pounds)
China . . . . . . . . . . . . . . . . . . . . 74,503 124,587 130,418 29,806 21,670All other sources . . . . . . . . . . . . 194,807 197,418 228,429 53,404 70,035 Total . . . . . . . . . . . . . . . . . . . . 269,310 322,005 358,847 83,210 91,705
Value ($1,000)
China . . . . . . . . . . . . . . . . . . . . 84,907 175,618 187,347 45,216 32,505All other sources . . . . . . . . . . . . 265,426 294,816 362,099 81,983 106,441 Total . . . . . . . . . . . . . . . . . . . . 350,333 470,435 549,446 127,199 138,946
Unit value (dollars per tire)
China . . . . . . . . . . . . . . . . . . . . 102.89 162.78 133.52 139.30 137.28All other sources . . . . . . . . . . . . 244.15 249.28 311.25 266.51 298.56 Average . . . . . . . . . . . . . . . . . 183.20 208.02 214.08 201.20 234.19
Share of quantity [based on tires] (percent)
China . . . . . . . . . . . . . . . . . . . . 43.2 47.7 54.7 51.3 39.9All other sources . . . . . . . . . . . . 56.8 52.3 45.3 48.7 60.1 Total . . . . . . . . . . . . . . . . . . . . 100.0 100.0 100.0 100.0 100.0
Share of value (percent)
China . . . . . . . . . . . . . . . . . . . . 24.2 37.3 34.1 35.5 23.4All other sources . . . . . . . . . . . . 75.8 62.7 65.9 64.5 76.6 Total . . . . . . . . . . . . . . . . . . . . 100.0 100.0 100.0 100.0 100.0
Ratio of imports to U.S. production quantity (percent)
China . . . . . . . . . . . . . . . . . . . . 17.6 28.3 35.0 35.2 21.9All other sources . . . . . . . . . . . . 23.2 31.0 29.0 33.3 32.9 Total . . . . . . . . . . . . . . . . . . . . 40.9 59.2 64.0 68.5 54.8
Note.--Firms not providing data on weight include Allied Wheel, Super Grip, Goodyear, China Manufactureand Sutong China Tire.
Source: Compiled from data submitted in response to Commission questionnaires.
E-3
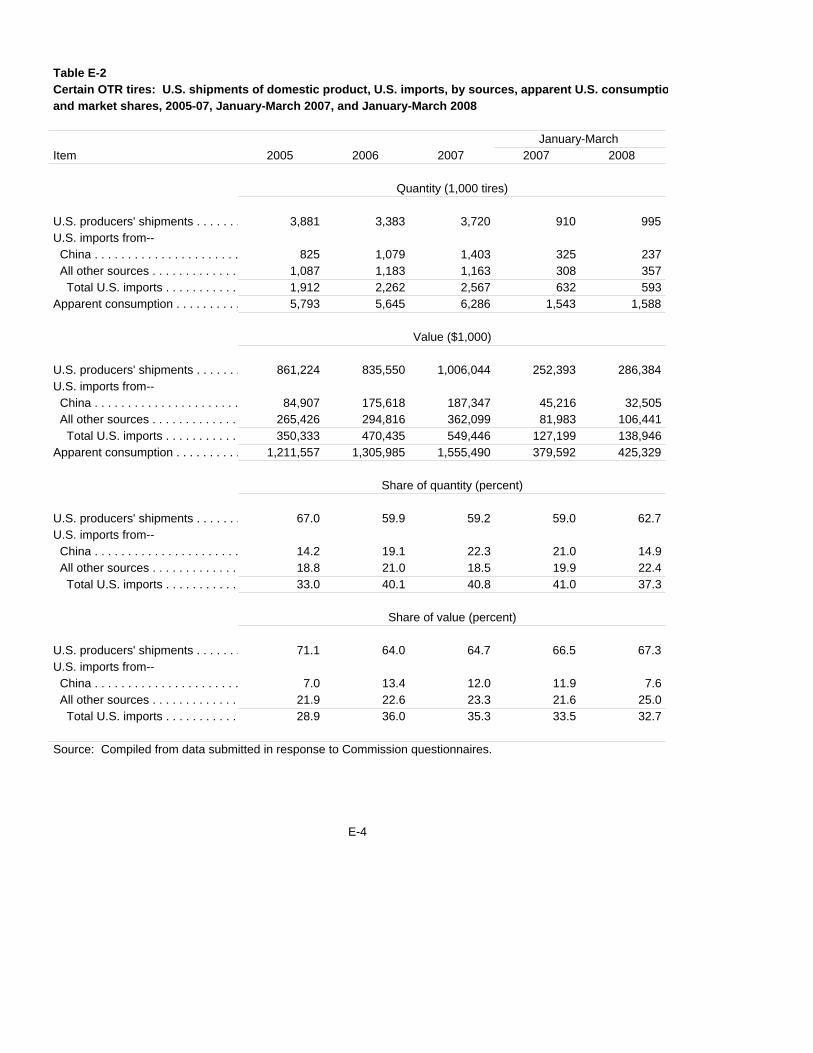
Table E-2Certain OTR tires: U.S. shipments of domestic product, U.S. imports, by sources, apparent U.S. consumptioand market shares, 2005-07, January-March 2007, and January-March 2008
January-March Item 2005 2006 2007 2007 2008
Quantity (1,000 tires)
U.S. producers' shipments . . . . . . . 3,881 3,383 3,720 910 995U.S. imports from-- China . . . . . . . . . . . . . . . . . . . . . . 825 1,079 1,403 325 237 All other sources . . . . . . . . . . . . . 1,087 1,183 1,163 308 357 Total U.S. imports . . . . . . . . . . . 1,912 2,262 2,567 632 593Apparent consumption . . . . . . . . . . 5,793 5,645 6,286 1,543 1,588
Value ($1,000)
U.S. producers' shipments . . . . . . . 861,224 835,550 1,006,044 252,393 286,384U.S. imports from-- China . . . . . . . . . . . . . . . . . . . . . . 84,907 175,618 187,347 45,216 32,505 All other sources . . . . . . . . . . . . . 265,426 294,816 362,099 81,983 106,441 Total U.S. imports . . . . . . . . . . . 350,333 470,435 549,446 127,199 138,946Apparent consumption . . . . . . . . . . 1,211,557 1,305,985 1,555,490 379,592 425,329
Share of quantity (percent)
U.S. producers' shipments . . . . . . . 67.0 59.9 59.2 59.0 62.7U.S. imports from-- China . . . . . . . . . . . . . . . . . . . . . . 14.2 19.1 22.3 21.0 14.9 All other sources . . . . . . . . . . . . . 18.8 21.0 18.5 19.9 22.4 Total U.S. imports . . . . . . . . . . . 33.0 40.1 40.8 41.0 37.3
Share of value (percent)
U.S. producers' shipments . . . . . . . 71.1 64.0 64.7 66.5 67.3U.S. imports from-- China . . . . . . . . . . . . . . . . . . . . . . 7.0 13.4 12.0 11.9 7.6 All other sources . . . . . . . . . . . . . 21.9 22.6 23.3 21.6 25.0 Total U.S. imports . . . . . . . . . . . 28.9 36.0 35.3 33.5 32.7
Source: Compiled from data submitted in response to Commission questionnaires.
E-4

Table E-3Certain OTR tires: U.S. imports, by sources, 2005-07, January-March 2007, and January-March 2008
January-March Item 2005 2006 2007 2007 2008
Quantity (1,000 tires)
China . . . . . . . . . . . . . . . . . . . . . . . 1,768 2,086 2,116 479 334All other sources . . . . . . . . . . . . . . . 1,699 1,796 1,709 471 436 Total . . . . . . . . . . . . . . . . . . . . . . . 3,467 3,882 3,825 951 770
Value ($1,000)
China . . . . . . . . . . . . . . . . . . . . . . . 173,903 274,410 275,907 68,699 42,380All other sources . . . . . . . . . . . . . . . 366,909 434,630 505,282 117,831 138,548 Total . . . . . . . . . . . . . . . . . . . . . . . 540,812 709,040 781,189 186,531 180,929
Unit value (dollars per tire)
China . . . . . . . . . . . . . . . . . . . . . . . 98.35 131.53 130.41 143.33 126.90All other sources . . . . . . . . . . . . . . . 215.97 241.98 295.68 250.05 317.44 Average . . . . . . . . . . . . . . . . . . . . 155.98 182.63 204.26 196.24 234.85
Share of quantity (percent)
China . . . . . . . . . . . . . . . . . . . . . . . 51.0 53.7 55.3 50.4 43.3All other sources . . . . . . . . . . . . . . . 49.0 46.3 44.7 49.6 56.7 Total . . . . . . . . . . . . . . . . . . . . . . . 100.0 100.0 100.0 100.0 100.0
Share of value (percent)
China . . . . . . . . . . . . . . . . . . . . . . . 32.2 38.7 35.3 36.8 23.4All other sources . . . . . . . . . . . . . . . 67.8 61.3 64.7 63.2 76.6 Total . . . . . . . . . . . . . . . . . . . . . . . 100.0 100.0 100.0 100.0 100.0
Ratio of imports to U.S. production quantity (percent)
China . . . . . . . . . . . . . . . . . . . . . . . 37.8 54.6 52.8 51.9 30.8All other sources . . . . . . . . . . . . . . . 36.3 47.0 42.6 51.1 40.3 Total . . . . . . . . . . . . . . . . . . . . . . . 74.1 101.7 95.4 103.0 71.1
Source: Compiled from data submitted in response to Commission questionnaires and from official Commerce statistics(adjusted using proprietary Customs data). [Questionnaire data + adjusted Customs data using $35 UV cutoff for nonresponding firms
E-5
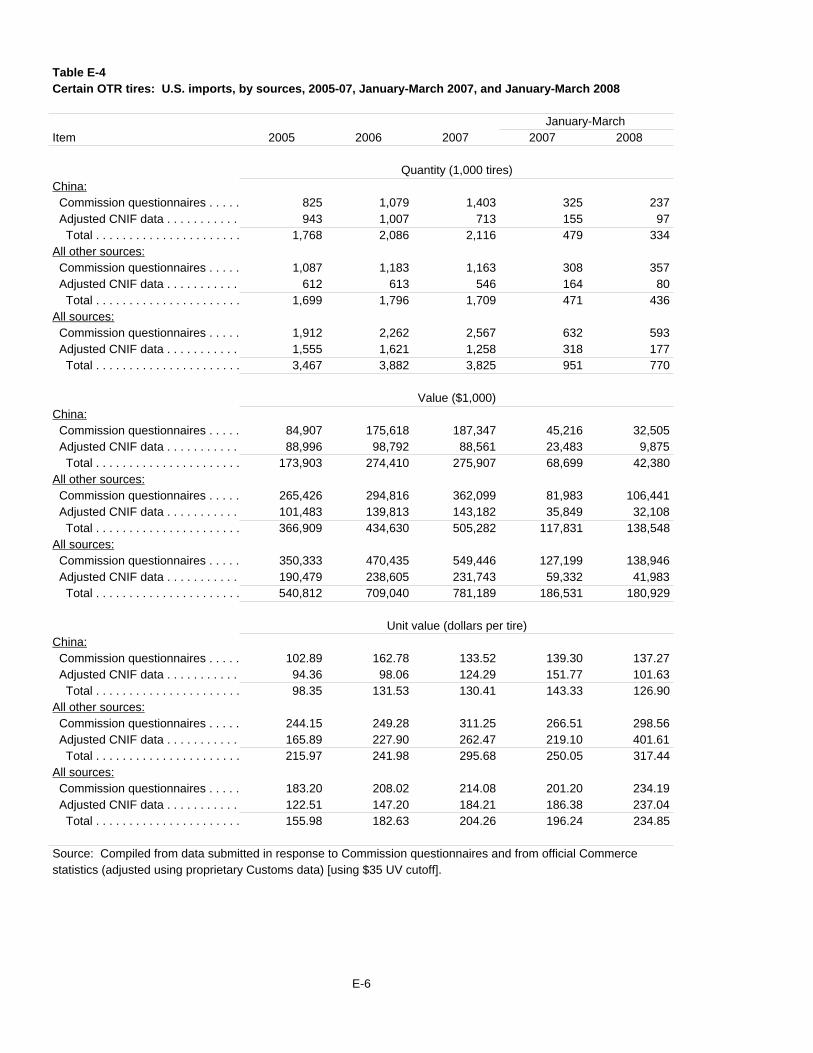
Table E-4Certain OTR tires: U.S. imports, by sources, 2005-07, January-March 2007, and January-March 2008
January-March Item 2005 2006 2007 2007 2008
Quantity (1,000 tires)China: Commission questionnaires . . . . . 825 1,079 1,403 325 237 Adjusted CNIF data . . . . . . . . . . . 943 1,007 713 155 97 Total . . . . . . . . . . . . . . . . . . . . . . 1,768 2,086 2,116 479 334All other sources: Commission questionnaires . . . . . 1,087 1,183 1,163 308 357 Adjusted CNIF data . . . . . . . . . . . 612 613 546 164 80 Total . . . . . . . . . . . . . . . . . . . . . . 1,699 1,796 1,709 471 436All sources: Commission questionnaires . . . . . 1,912 2,262 2,567 632 593 Adjusted CNIF data . . . . . . . . . . . 1,555 1,621 1,258 318 177 Total . . . . . . . . . . . . . . . . . . . . . . 3,467 3,882 3,825 951 770
Value ($1,000)China: Commission questionnaires . . . . . 84,907 175,618 187,347 45,216 32,505 Adjusted CNIF data . . . . . . . . . . . 88,996 98,792 88,561 23,483 9,875 Total . . . . . . . . . . . . . . . . . . . . . . 173,903 274,410 275,907 68,699 42,380All other sources: Commission questionnaires . . . . . 265,426 294,816 362,099 81,983 106,441 Adjusted CNIF data . . . . . . . . . . . 101,483 139,813 143,182 35,849 32,108 Total . . . . . . . . . . . . . . . . . . . . . . 366,909 434,630 505,282 117,831 138,548All sources: Commission questionnaires . . . . . 350,333 470,435 549,446 127,199 138,946 Adjusted CNIF data . . . . . . . . . . . 190,479 238,605 231,743 59,332 41,983 Total . . . . . . . . . . . . . . . . . . . . . . 540,812 709,040 781,189 186,531 180,929
Unit value (dollars per tire)China: Commission questionnaires . . . . . 102.89 162.78 133.52 139.30 137.27 Adjusted CNIF data . . . . . . . . . . . 94.36 98.06 124.29 151.77 101.63 Total . . . . . . . . . . . . . . . . . . . . . . 98.35 131.53 130.41 143.33 126.90All other sources: Commission questionnaires . . . . . 244.15 249.28 311.25 266.51 298.56 Adjusted CNIF data . . . . . . . . . . . 165.89 227.90 262.47 219.10 401.61 Total . . . . . . . . . . . . . . . . . . . . . . 215.97 241.98 295.68 250.05 317.44All sources: Commission questionnaires . . . . . 183.20 208.02 214.08 201.20 234.19 Adjusted CNIF data . . . . . . . . . . . 122.51 147.20 184.21 186.38 237.04 Total . . . . . . . . . . . . . . . . . . . . . . 155.98 182.63 204.26 196.24 234.85
Source: Compiled from data submitted in response to Commission questionnaires and from official Commercestatistics (adjusted using proprietary Customs data) [using $35 UV cutoff].
E-6

Table E-5Certain OTR tires: U.S. shipments of domestic product, U.S. imports, by sources, apparent U.S. consumption,and market shares, 2005-07, January-March 2007, and January-March 2008
January-March Item 2005 2006 2007 2007 2008
Quantity (1,000 tires)
U.S. producers' shipments . . . . . . . 3,881 3,383 3,720 910 995U.S. imports from-- China . . . . . . . . . . . . . . . . . . . . . . 1,768 2,086 2,116 479 334 All other sources . . . . . . . . . . . . . . 1,699 1,796 1,709 471 436 Total U.S. imports . . . . . . . . . . . . 3,467 3,882 3,825 951 770Apparent consumption . . . . . . . . . . 7,348 7,266 7,544 1,861 1,766
Value ($1,000)
U.S. producers' shipments . . . . . . . 861,224 835,550 1,006,044 252,393 286,384U.S. imports from-- China . . . . . . . . . . . . . . . . . . . . . . 173,903 274,410 275,907 68,699 42,380 All other sources . . . . . . . . . . . . . . 366,909 434,630 505,282 117,831 138,548 Total U.S. imports . . . . . . . . . . . . 540,812 709,040 781,189 186,531 180,929Apparent consumption . . . . . . . . . . 1,402,035 1,544,590 1,787,233 438,924 467,312
Share of quantity (percent)
U.S. producers' shipments . . . . . . . 52.8 46.6 49.3 48.9 56.4U.S. imports from-- China . . . . . . . . . . . . . . . . . . . . . . 24.1 28.7 28.0 25.8 18.9 All other sources . . . . . . . . . . . . . . 23.1 24.7 22.7 25.3 24.7 Total U.S. imports . . . . . . . . . . . . 47.2 53.4 50.7 51.1 43.6
Share of value (percent)
U.S. producers' shipments . . . . . . . 61.4 54.1 56.3 57.5 61.3U.S. imports from-- China . . . . . . . . . . . . . . . . . . . . . . 12.4 17.8 15.4 15.7 9.1 All other sources . . . . . . . . . . . . . . 26.2 28.1 28.3 26.8 29.6 Total U.S. imports . . . . . . . . . . . . 38.6 45.9 43.7 42.5 38.7
Source: Compiled from data submitted in response to Commission questionnaires and from official Commerce statistics(adjusted using proprietary Customs data). [Calculated using $35 UV cutoff for nonresponding firms.]
Consumption Q check (0) 0 0 0 0Consumption V check 0 0 0 0 0
E-7
