certificate of calibration - odin metrologyodinmetrology.com/reports/831_filters-full.pdfodin...
TRANSCRIPT

CERTIFICATE OF CALIBRATION # N/A
FOR LARSON DAVIS PRECISION INTEGRATING SOUND LEVEL METER
Model 831 Serial No XXX
ID No. N/A With Microphone 377B20 Serial No. XXX With Preamplifier PRM831 Serial No.XXX
P.O. # N/A Customer: Odin Metrology, Inc.
Thousand Oaks, CA 91320
was tested and met factory specifications at the points tested. Complies to: ANSI S1.4-1983 (R2006) Type 1; IEC 61672-2002 Class1; 60651-2001 Type 1
on 31 MAR 2011 BY HAROLD LYNCH Service Manager
As received condition: Within Specification. Re-calibration due on: 31 MAR 2012
Certified References* Mfg. Type Serial No. Cal Date Due Date B&K 1049 1288946 07 NOV 2011 07 NOV 2012 B&K 2636 1601487 23 MAY 2012 23 MAY 2013 B&K 4226 1774068 15 MAR 2012 15 MAR 2013 B&K 4231 2094472 28 FEB 2012 28 FEB 2013 HP 34401A MY41031678 30 DEC 2011 30 DEC 2012 HP 3458A 2823A17713 13 JUL 2011 13 JUL 2012
Performed in Compliance with ANSI, NCSL Z-540-1, 1994
and ISO 17025, ISO 9001:2008 Certification NQA No. 11252 *References are traceable to NIST (National Institute of Standards and Technology).
Note: For calibration data see enclosed pages. The data represent both “as found” and “as left” conditions.
Reference Test Procedure: ACCT Procedure 831 Version 2.4.
Temperature Relative Humidity Barometric Pressure 23°C 38% 989.68 hPa Note: This calibration report shall not be reproduced, except in full, without written consent by Odin Metrology, Inc.. Signed:
ODIN METROLOGY, INC. .
CALIBRATION OF SOUND & VIBRATION INSTRUMENTS 3533 OLD CONEJO ROAD; SUITE 125 THOUSAND OAKS CA 91320
PHONE: (805) 375-0830 FAX: (805) 375-0405

Odin Metrology, Inc. 3533 Old Conejo Road, Suite 125
Thousand Oaks, CA 91320Phone: (805) 375-0830, Fax: (805) 375-0405
www.OdinMetrology.com
Environmental ConditionsPO#: N/A Relative humidity: 38%Certificate#: N/A Ambient temperature: 23°CCalibration performed by: HL Ambient pressure: 989.68 hPa
Page No. Test IEC Section Result
2 Internal Clock Reference Only See Data2 Sensitivity Verification with Acoustic Calibrator 3 § 9 See Data2 Acoustic Frequency Response with Microphone 3 § 11 Pass2 Self-Generated Noise 3 § 10 See Data3 Output Impedance with Shorted Output 2 § 9.18 Pass3 AC Full Scale Output Voltage Reference Only See Data3 DC Full Scale Output Voltage Reference Only See Data3 Reset 2 § 9.17 Pass3 Overload Indication 3 § 18 Pass4 DC Linearity Reference Only See Data4 Peak-C Sound Level 3 § 17 Pass4 Decay Time Constants for Time Weightings Fast and Slow 2 § 9.11 Pass5 Difference in Indication 3 § 13 Pass
Frequency Response 3 § 12 —————5 A-Weighted Pass6 C-Weighted Pass7 Z-Weighted Pass
Single Toneburst Response - Fast Time Weighting 3 § 16 —————8 A-Weighted Pass8 C-Weighted Pass8 Z-Weighted Pass
Single Toneburst Response - Slow Time Weighting 3 § 16 —————9 A-Weighted Pass9 C-Weighted Pass9 Z-Weighted Pass10 SEL Response to Repeated Tonebursts 1 § 5.9 Pass11 Level Linearity 3 § 14, 1 § 5.5.6 Pass
Level Verification of Filter+SLM Reference Only —————13 1/1 Octave Pass14 1/3 Octave Pass
Filter Check Reference Only —————15 1/1 Octave Pass16 1/3 Octave Pass
17-64 Relative Attenuation 61260 § 5.3 Pass
The expanded uncertainties stated in this document are the maximum expanded uncertainties permitted by IEC 61672-1. Odin Metrology's actual expanded uncertainties are less than or equal to the values stated herein.
The following calibration was performed per ACCT Pr ocedure 831 Version 2.4.The data represent both the "As Found" and the "As Left" conditions.
forOdin Metrology, Inc.
RTA Octave Filter (IEC 61260 Class 0)
Sound Level Meter (IEC 61672 Class 1)
Calibration data for
Larson Davis Precision Integrating Sound Level MeterType 831# XXX, ID# N/A
Performed on March 31, 2011With Preamplifier PRM831# XXX and Microphone 377B02# XXX
TEST-SYSTEM-2 Page 1 of 64

Calibration Data for831# XXXID# N/A
Odin Metrology, Inc. Odin Metrology, Inc.Report# N/A
March 31, 2011
UTC Offset DaylightDate Time (Hr:Min) Saving Time Date Time Date Time
3/31/2011 9:17:26 AM California -8:00 Yes 3/25/2010 6:04:12 PM 3/31/2011 9:17:28 AM
Calibrator Calibrator SLM SPL SLM SPL UncertaintyFrequency (Hz) SPL (dB) Before (dB) After (dB) (dB)
1,000.0 114.0 114.13 114.00 0.40
Frequency Data FF Corr. Corrected Nominal Uncertainty Deviation (Hz) Found (dB C) (dB) Response (dB) Value (dB C) Minimum Maximum (dB) (dB)31.5 110.75 0.00 110.75 110.99 109.49 112.49 -0.24 Pass63.0 113.21 0.00 113.21 113.18 112.18 114.18 0.50 0.03 Pass
125.0 113.84 0.00 113.84 113.83 112.83 114.83 0.01 Pass250.0 114.00 0.00 114.00 114.00 113.00 115.00 0.00 Pass500.0 114.02 0.04 114.06 114.03 113.03 115.03 0.02 Pass
1,000.02,000.0 113.72 0.31 114.03 113.83 112.83 114.83 0.20 Pass4,000.0 112.42 1.00 113.42 113.18 112.18 114.18 0.60 0.24 Pass8,000.0 108.09 3.39 111.48 110.99 108.49 112.49 0.49 Pass12,500.0 101.47 6.77 108.24 107.76 102.76 109.76 0.48 Pass16,000.0 97.78 8.35 106.13 105.47 89.47 107.97 0.67 Pass
Frequency Typical Data UncertaintyWeighting Noise (dB) Found (dB) (dB)
A 17.00 15.50C 12.00 12.20 0.003Z 19.00 21.22
LocationLocal (Pacific Daylight Time) SLM Clock Before Set SLM Clock After Set
Sensitivity Verification with Acoustic Calibrator ( IEC 61672-3 § 9)
0.40
Typical Noise: the typical self-generated noise level according to the manufacturerData Found: the 30-second Leq value the sound level meter indicatesUncertainty: maximum expanded uncertainty of measurement with approximately 95% confidence level (coverage factor k=2)
Deviation: the difference between the nominal value and the data foundPerformed with microphone 377B02# XXX, preamplifier PRM831# XXX, and calibrator 4226# 1774068.
For A-weighting, the noise is measured with the microphone installed and an acoustic chamber on the microphone which eliminates ambientnoise. For C- and Z-weighting, the input is terminated with a shorted dummy microphone of equal capacitance.Frequency Weighting: the frequency weighting setting on the sound level meter
Self-Generated Noise (61672-3 § 10)
————————————————————————Reference—————————————————— ————————
Pass/Fail
1.00
Corrected Response: SLM's reading plus the correction indicatedNominal Value: what the sound level meter should indicate according to IEC 61672Tolerance: the acceptable range, including the stated uncertainty, for what the sound level meter should indicate according to IEC 61672Uncertainty: maximum expanded uncertainty of measurement according to IEC with approximately 95% confidence level (coverage factor
FF Corr: free-field correction for microphone to be added to displayed SLM (pressure) value
Acoustic Frequency Response with Microphone (61672- 3 § 11)
Performed with microphone 377B02# XXX, preamplifier PRM831# XXX, and calibrator 4231# 1770857.
The acoustical frequency response is tested using a multifunction acoustical calibrator type 4226 in C frequency weighting. If a windscreenis used, these data are to be corrected.
SLM SPL After: SLM indication after internal calibration sequenceUncertainty: maximum expanded uncertainty of measurement with approximately 95% confidence level (coverage factor k=2)
Frequency: the frequency of the signal to the sound level meter (frequency of 4226 multifunction acoustic calibrator)Data Found: the value the sound level meter actually indicates (this is a pressure measurement)
Internal ClockDate and time are transferred from SLM, then the SLM date and time are set according to Odin Metrology's clock and the date and time aretransferred from the SLM a second time. Time zones (with minor simplifications) and DST are obeyed.Local Date/Time: Date and time according to Odin Metrology's clock (Pacific Daylight Time) at the time of the clock settingLocation: US state or other location for which the SLM clock is set (some time zone simplifications are made)
Calibrator Frequency: the frequency of the signal generated by the sound level calibratorCalibrator SPL: the SPL of the signal generated by the sound level calibratorSLM SPL Before: SLM indication before internal calibration sequence
UTC Offset: UTC offset for the given locationDaylight Saving Time: whether DST is currently observed for the given location
Tolerance (dB)
SLM Clock Before Set: readouts of the SLM's system date and time before any changes are madeSLM Clock After Set: readouts of the SLM's system date and time after setting
A sound level calibrator is mounted on the sound level meter and the internal calibration is started. The SLM indication is recorded beforeand after calibration.
Page 2 of 64

Calibration Data for831# XXXID# N/A
Odin Metrology, Inc. Odin Metrology, Inc.Report# N/A
March 31, 2011
Frequency Input Nominal Tolerance Data Uncertainty Deviation(kHz) Level (dB) Value (dB) (± dB) Found (dB) (dB) (dB)1.0 90.0 90.0 0.2 90.01 0.10 0.01 Pass
SPL Data UncertaintyReading (dB) Found (mV) (mV)
140.02 2438.61 0.10
SPL Data UncertaintyReading (dB) Found (mV) (mV)
140.02 1198.23 0.10
Before After Tolerance Uncertainty(dB) (dB) (< dB) (dB)
140.19 24.91 50.0 0.003 Pass
Difference Tolerance UncertaintyPositive Negative (dB) (≤ dB) (dB)117.82 117.81 0.01 1.5 0.3 Pass
The first Leq indication of overload at a level higher than FSD-1 dB is recorded for both positive- and negative-one-half-cycle signals at 4.0kHz. The difference between the two levels may not exceed the specified tolerance. +20 dB gain option is used.Overload Level: input signal level (amplitude) at which the meter was found to overload for the specified input signal typeDifference: difference between the overload levels for the positive and negative half-cycle signal inputsTolerance: the acceptable difference, including the stated uncertainty, between positive and negative overload levels according to IEC
Before: displayed value before pressing the reset keyAfter: displayed value after pressing the reset keyTolerance: the acceptable range, including the stated uncertainty, for what the sound level meter should indicateUncertainty: maximum expanded uncertainty of measurement with approximately 95% confidence level (coverage factor k=2)
Uncertainty: maximum expanded uncertainty of measurement with approximately 95% confidence level (coverage factor k=2)
It is verified that the display resets after pressing the reset button on the SLM. The initial input level is FSD.
DC Full Scale Output VoltageThe sound level meter is set up to indicate full-scale on the display and the DC output is measured. Input frequency is 1,000 Hz.SPL Reading: the input to the sound level meter is adjusted so that it indicates this full-scale valueData Found: the value the sound level meter actually indicatesUncertainty: maximum expanded uncertainty of measurement with approximately 95% confidence level (coverage factor k=2)
Reset (IEC 61672-2 § 9.17)
SPL Reading: the input to the sound level meter is adjusted so that it indicates this full-scale valueData Found: the value the sound level meter actually indicates
Pass/Fail
Data Found: the value the sound level meter actually indicatesUncertainty: maximum expanded uncertainty of measurement with approximately 95% confidence level (coverage factor k=2)Deviation: the difference between the nominal value and the data found
The sound level meter is set up to indicate full-scale on the display and the AC output is measured. Input frequency is 1,000 Hz.AC Full Scale Output Voltage
Frequency: the frequency of the signal to the sound level meterInput Level: the level (amplitude) of the signal to the sound level meterNominal Value: the value the sound level meter should indicateTolerance: the acceptable difference from nominal, including the stated uncertainty, for what the sound level meter should indicate
When the output on the meter is shorted, the SPL may not change by more than the specified tolerance. This test is not performed at 114.0dB due to a characteristic of the 831 to turn off with the output shorted (see page A-8 in the 831 reference manual).
Output Impedance with Shorted Output (61672-2 § 9.1 8)
Uncertainty: maximum expanded uncertainty of measurement with approximately 95% confidence level (coverage factor k=2)
Pass/FailOverload Level (dB)
Pass/Fail
Overload Indication (IEC 61672-3 § 18)
Page 3 of 64

Calibration Data for831# XXXID# N/A
Odin Metrology, Inc. Odin Metrology, Inc.Report# N/A
March 31, 2011
Rel. Input Data Uncertainty SensitivityLevel (dB) Found (mV) (mV) (mV/dB)
0.0 1398.29-10.0 1298.28-20.0 1198.29-30.0 1098.28-40.0 998.33-50.0 898.43-60.0 798.52 9.94-70.0 698.64-80.0 598.78-90.0 498.93
-100.0 399.10-110.0 299.59 0.05-120.0 205.28
Input Level Cycles in Frequency Nominal Tolerance LCpeak Data Uncertainty Deviation(dB C) Test Signal (Hz) Value (dB) (± dB) Found (dB) Found (dB) (dB) (dB)
One 8,000.00 3.40 2.00 134.69 2.69 -0.71 Pass132.00 Positive ½ 134.13 2.13 0.40 -0.27 Pass
Negative ½ 134.14 2.14 -0.26 Pass
Time Nominal Measured Uncertainty DeviationWeighting Rate (dB/s) Minimum Maximum Rate (dB/s) (dB/s) (dB/s)
Fast N/A 27.00 N/A 34.03 2.00 N/A PassSlow 4.35 3.80 4.90 4.24 0.40 -0.11 Pass
0.40
Nominal Rate: the decay rate the sound level meter should exhibit according to IEC 61672Tolerance: the acceptable range, including the stated uncertainty, for what the sound level meter should indicate according to IEC 61672
500.00 2.40 1.00
The decay rate of the display value on the sound level meter is measured after a steady 4.0 kHz signal is removed.Time Weighting: the time weighting setting on the sound level meter
Decay Time Constants for Time Weightings Fast and S low (IEC 61672-2 § 9.11)
Nominal Value: what the sound level meter should indicate according to IEC 61672Tolerance: the acceptable difference from nominal for what the sound level meter should indicate according to IEC 61672LCpeak Found: the peak-C sound level value indicated on the sound level meterData Found: the difference between the peak-C sound level and the steady-state C-weighted sound level as indicated by the sound level Uncertainty: maximum expanded uncertainty of measurement with approximately 95% confidence level (coverage factor k=2)Deviation: the difference between the nominal value and the data found; extended: extended by the expanded uncertainty of measurement
Pass/Fail
Uncertainty: maximum expanded uncertainty of measurement with approximately 95% confidence level (coverage factor k=2)Sensitivity: the calculated sensitivity based on the DC-outputs at the highest and lowest levels indicated
The sound level meter's peak-C response to single one-cycle and positive- and negative-going half-cycle sinusoidal signals is measured.Input Level: the steady-state level (amplitude) of the signal to the sound level meter from which the one- and half-cycle signals are extracted
Peak-C Sound Level (IEC 61672-3 §17)
Cycles in Test Signal: the type of burst used (one period, positive half period, or negative half period)Frequency: the frequency of the signal to the sound level meter
Rel. Input Level: the level (amplitude) of the signal to the sound level meter relative to the reference of full-scaleData Found: the measured DC-output from the SLM
The sound level meter is set up to indicate full-scale on the display and the DC-output voltage is recorded in decreasing 10-dB steps.DC Linearity
Tolerance (dB/s)Pass/Fail
Measured Rate: the actual decay rate measured on the sound level meterUncertainty: maximum expanded uncertainty of measurement with approximately 95% confidence level (coverage factor k=2)Deviation: the difference between the nominal value and the data found
Page 4 of 64

Calibration Data for831# XXXID# N/A
Odin Metrology, Inc. Odin Metrology, Inc.Report# N/A
March 31, 2011
Time Frequency Input Nominal Tolerance Data Uncertainty DeviationWeighting Weighting Level (dB) Value (dB) (± dB) Found (dB) (dB) (dB)
AFast C 114.02 0.1 0.02 Pass
Z 114.01 0.01 PassA 114.0 114.02 0.02 Pass
Slow C 0.1 114.02 0.1 0.02 PassZ 114.01 0.01 Pass
Frequency Nominal Data Uncertainty Deviation(Hz) Value (dB) Minimum Maximum Found (dB) (dB) (dB)10.0 -70.4 N/A -67.4 -70.07 0.36 Pass12.6 -63.4 N/A -60.9 -63.49 -0.12 Pass15.8 -56.7 -60.7 -54.7 -56.85 -0.16 Pass20.0 -50.5 -52.5 -48.5 -50.64 -0.19 Pass25.1 -44.7 -46.2 -42.7 -44.89 -0.19 Pass31.6 -39.4 -40.9 -37.9 -39.60 -0.16 Pass39.8 -34.6 -35.6 -33.6 -34.80 -0.17 Pass50.1 -30.2 -31.2 -29.2 -30.47 -0.24 Pass63.1 -26.2 -27.2 -25.2 -26.41 -0.21 Pass79.4 -22.5 -23.5 -21.5 -22.68 -0.18 Pass
100.0 -19.1 -20.1 -18.1 -19.29 -0.15 Pass125.9 -16.1 -17.1 -15.1 -16.26 -0.16 Pass158.5 -13.4 -14.4 -12.4 -13.47 -0.12 Pass199.5 -10.9 -11.9 -9.9 -10.99 -0.12 Pass251.2 -8.6 -9.6 -7.6 -8.75 -0.12 Pass316.2 -6.6 -7.6 -5.6 -6.68 -0.07 Pass398.1 -4.8 -5.8 -3.8 -4.86 -0.06 Pass501.2 -3.2 -4.2 -2.2 -3.28 -0.05 Pass631.0 -1.9 -2.9 -0.9 -1.94 -0.04 Pass794.3 -0.8 -1.8 0.2 -0.81 0.01 Pass
1,000.0 0.01,258.9 0.6 -0.4 1.6 0.59 0.40 0.00 Pass1,584.9 1.0 0.0 2.0 1.02 0.04 Pass1,995.3 1.2 0.2 2.2 1.22 0.02 Pass2,511.9 1.3 0.3 2.3 1.29 0.02 Pass3,162.3 1.2 0.2 2.2 1.26 0.06 Pass3,981.1 1.0 0.0 2.0 1.03 0.60 0.06 Pass5,011.9 0.5 -1.0 2.0 0.60 0.05 Pass6,309.6 -0.1 -2.1 1.4 -0.07 0.05 Pass7,943.3 -1.1 -3.6 0.4 -1.05 0.06 Pass10,000.0 -2.5 -5.5 -0.5 -2.45 0.05 Pass12,589.3 -4.3 -9.3 -2.3 -4.26 0.06 Pass15,848.9 -6.6 -22.6 -4.1 -6.44 1.00 0.16 Pass19,952.6 -9.3 N/A -6.3 -9.63 -0.31 Pass
Uncertainty: maximum expanded uncertainty of measurement with approximately 95% confidence level (coverage factor k=2)Deviation: the difference between the nominal value and the data found
A-Frequency-Weighted Frequency Response (61672-3 § 12)
Tolerance: the acceptable range, including the stated uncertainty, for what the sound level meter should indicate according to IEC 61672
—————————————————Reference—————————————————
Uncertainty: maximum expanded uncertainty of measurement with approximately 95% confidence level (coverage factor k=2)
Pass/Fail
Time Weighting: time weighting setting on the SLMFrequency Weighting: frequency weighting setting on the SLM
Deviation: the difference between the nominal value and the data found
Input Level: the level (amplitude) of the signal to the sound level meterNominal Value: the value the sound level meter should indicate according to IEC 61672
Difference in Indication (IEC 61672-3 § 13)With reference to fast time weighting and A frequency weighting at the SLM reference level indicated, the measurements of all otherfrequency weighting parameters and all other time weighting parameters may not differ by more than the specified tolerance.
————————Reference————————
114.00.2
Tolerance (dB)
Data Found: the value the sound level meter actually indicates
————Reference————
Pass/Fail
The SLM's frequency response is recorded by varying the frequency as specified. The reference level is FSD-45 dB at 1.0 kHz. IEC 61672defines this test from 63 Hz to 16 kHz; "N/A" is reported instead of "Fail" for frequencies outside of this range.
Tolerance: the acceptable difference from nominal, including the stated uncertainty, for what the sound level meter should indicate Data Found: the value the sound level meter actually indicates
Frequency: the frequency of the signal to the sound level meterNominal Value: the value the sound level meter should indicate according to IEC 61672 (this is relative to the reference value at 1.0 kHz)
0.40
0.50
Page 5 of 64

Calibration Data for831# XXXID# N/A
Odin Metrology, Inc. Odin Metrology, Inc.Report# N/A
March 31, 2011
Frequency Nominal Data Uncertainty Deviation(Hz) Value (dB) Minimum Maximum Found (dB) (dB) (dB)10.0 -14.3 N/A -11.3 -14.58 -0.25 Pass12.6 -11.2 N/A -8.7 -11.47 -0.22 Pass15.8 -8.5 -12.5 -6.5 -8.71 -0.18 Pass20.0 -6.2 -8.2 -4.2 -6.43 -0.19 Pass25.1 -4.4 -5.9 -2.4 -4.59 -0.19 Pass31.6 -3.0 -4.5 -1.5 -3.17 -0.16 Pass39.8 -2.0 -3.0 -1.0 -2.17 -0.17 Pass50.1 -1.3 -2.3 -0.3 -1.55 -0.26 Pass63.1 -0.8 -1.8 0.2 -1.03 -0.22 Pass79.4 -0.5 -1.5 0.5 -0.68 -0.17 Pass
100.0 -0.3 -1.3 0.7 -0.45 -0.15 Pass125.9 -0.2 -1.2 0.8 -0.32 -0.16 Pass158.5 -0.1 -1.1 0.9 -0.21 -0.12 Pass199.5 0.0 -1.0 1.0 -0.17 -0.14 Pass251.2 0.0 -1.0 1.0 -0.12 -0.12 Pass316.2 0.0 -1.0 1.0 -0.05 -0.07 Pass398.1 0.0 -1.0 1.0 -0.03 -0.06 Pass501.2 0.0 -1.0 1.0 -0.01 -0.05 Pass631.0 0.0 -1.0 1.0 -0.01 -0.04 Pass794.3 0.0 -1.0 1.0 0.03 0.01 Pass
1,000.0 0.01,258.9 0.0 -1.0 1.0 -0.03 0.40 0.00 Pass1,584.9 -0.1 -1.1 0.9 -0.05 0.04 Pass1,995.3 -0.2 -1.2 0.8 -0.15 0.02 Pass2,511.9 -0.3 -1.3 0.7 -0.27 0.02 Pass3,162.3 -0.5 -1.5 0.5 -0.44 0.06 Pass3,981.1 -0.8 -1.8 0.2 -0.76 0.60 0.06 Pass5,011.9 -1.3 -2.8 0.2 -1.24 0.06 Pass6,309.6 -2.0 -4.0 -0.5 -1.95 0.05 Pass7,943.3 -3.0 -5.5 -1.5 -2.95 0.06 Pass10,000.0 -4.4 -7.4 -2.4 -4.36 0.05 Pass12,589.3 -6.2 -11.2 -4.2 -6.18 0.06 Pass15,848.9 -8.5 -24.5 -6.0 -8.37 1.00 0.16 Pass19,952.6 -11.2 N/A -8.2 -11.56 -0.31 Pass
Uncertainty: maximum expanded uncertainty of measurement with approximately 95% confidence level (coverage factor k=2)
C-Frequency-Weighted Frequency Response (61672-3 § 12)The SLM's frequency response is recorded by varying the frequency as specified. The reference level is FSD-45 dB at 1.0 kHz. IEC 61672defines this test from 63 Hz to 16 kHz; "N/A" is reported instead of "Fail" for frequencies outside of this range.Frequency: the frequency of the signal to the sound level meterNominal Value: the value the sound level meter should indicate according to IEC 61672 (this is relative to the reference value at 1.0 kHz)
—————————————————Reference—————————————————
Pass/FailTolerance (dB)
0.40
0.50
Tolerance: the acceptable range, including the stated uncertainty, for what the sound level meter should indicate according to IEC 61672Data Found: the value the sound level meter actually indicates
Deviation: the difference between the nominal value and the data found
Page 6 of 64

Calibration Data for831# XXXID# N/A
Odin Metrology, Inc. Odin Metrology, Inc.Report# N/A
March 31, 2011
Frequency Nominal Data Uncertainty Deviation(Hz) Value (dB) Minimum Maximum Found (dB) (dB) (dB)10.0 N/A 3.0 -0.38 -0.38 Pass12.6 N/A 2.5 -0.36 -0.36 Pass15.8 -4.0 2.0 -0.28 -0.28 Pass20.0 -2.0 2.0 -0.27 -0.27 Pass25.1 -1.5 2.0 -0.25 -0.25 Pass31.6 -1.5 1.5 -0.21 -0.21 Pass39.8 -1.0 1.0 -0.21 -0.21 Pass50.1 -1.0 1.0 -0.19 -0.19 Pass63.1 -1.0 1.0 -0.24 -0.24 Pass79.4 -1.0 1.0 -0.19 -0.19 Pass
100.0 -1.0 1.0 -0.18 -0.18 Pass125.9 -1.0 1.0 -0.17 -0.17 Pass158.5 -1.0 1.0 -0.13 -0.13 Pass199.5 -1.0 1.0 -0.14 -0.14 Pass251.2 -1.0 1.0 -0.12 -0.12 Pass316.2 -1.0 1.0 -0.07 -0.07 Pass398.1 -1.0 1.0 -0.07 -0.07 Pass501.2 -1.0 1.0 -0.05 -0.05 Pass631.0 -1.0 1.0 -0.04 -0.04 Pass794.3 -1.0 1.0 0.00 0.00 Pass
1,000.01,258.9 -1.0 1.0 -0.01 0.40 -0.01 Pass1,584.9 -1.0 1.0 0.03 0.03 Pass1,995.3 -1.0 1.0 0.01 0.01 Pass2,511.9 -1.0 1.0 0.01 0.01 Pass3,162.3 -1.0 1.0 0.04 0.04 Pass3,981.1 -1.0 1.0 0.03 0.60 0.03 Pass5,011.9 -1.5 1.5 0.03 0.03 Pass6,309.6 -2.0 1.5 0.04 0.04 Pass7,943.3 -2.5 1.5 0.09 0.09 Pass10,000.0 -3.0 2.0 0.10 0.10 Pass12,589.3 -5.0 2.0 0.06 0.06 Pass15,848.9 -16.0 2.5 0.02 1.00 0.02 Pass19,952.6 N/A 3.0 -0.23 -0.23 Pass
Nominal Value: the value the sound level meter should indicate according to IEC 61672 (this is relative to the reference value at 1.0 kHz)Frequency: the frequency of the signal to the sound level meter
—————————————————Reference—————————————————
Tolerance: the acceptable range, including the stated uncertainty, for what the sound level meter should indicate according to IEC 61672Data Found: the value the sound level meter actually indicatesUncertainty: maximum expanded uncertainty of measurement with approximately 95% confidence level (coverage factor k=2)
Z-Frequency-Weighted Frequency Response (61672-3 § 12)The SLM's frequency response is recorded by varying the frequency as specified. The reference level is FSD-45 dB at 1.0 kHz. IEC 61672defines this test from 63 Hz to 16 kHz; "N/A" is reported instead of "Fail" for frequencies outside of this range.
Tolerance (dB)Pass/Fail
0.0 0.40
0.50
Deviation: the difference between the nominal value and the data found
Page 7 of 64

Calibration Data for831# XXXID# N/A
Odin Metrology, Inc. Odin Metrology, Inc.Report# N/A
March 31, 2011
Toneburst Nominal Data Uncertainty DeviationDuration (ms) Value (dB) Minimum Maximum Found (dB) (dB) (dB)
1,000.00 0.0 -0.5 0.5 -0.04 -0.04 Pass500.00 -0.1 -0.6 0.4 -0.12 -0.02 Pass200.00 -1.0 -1.5 -0.5 -1.09 -0.09 Pass100.00 -2.6 -3.6 -1.6 -2.78 -0.18 Pass50.00 -4.8 -5.8 -3.8 -4.96 -0.16 Pass20.00 -8.3 -9.3 -7.3 -8.40 -0.10 Pass10.00 -11.1 -12.1 -10.1 -11.53 -0.43 Pass5.00 -14.1 -15.1 -13.1 -14.23 -0.13 Pass2.00 -18.0 -19.5 -17.0 -18.21 -0.21 Pass1.00 -21.0 -23.0 -20.0 -21.21 -0.21 Pass0.50 -24.0 -26.5 -23.0 -24.21 -0.21 Pass0.25 -27.0 -30.0 -26.0 -27.51 -0.51 Pass
Toneburst Nominal Data Uncertainty DeviationDuration (ms) Value (dB) Minimum Maximum Found (dB) (dB) (dB)
1,000.00 0.0 -0.5 0.5 -0.04 -0.04 Pass500.00 -0.1 -0.6 0.4 -0.13 -0.03 Pass200.00 -1.0 -1.5 -0.5 -1.06 -0.06 Pass100.00 -2.6 -3.1 -2.1 -2.70 -0.10 Pass50.00 -4.8 -5.3 -4.3 -5.12 -0.32 Pass20.00 -8.3 -8.8 -7.8 -8.58 -0.28 Pass10.00 -11.1 -11.6 -10.6 -11.36 -0.26 Pass5.00 -14.1 -14.6 -13.6 -14.47 -0.37 Pass2.00 -18.0 -18.5 -17.5 -18.37 -0.37 Pass1.00 -21.0 -21.5 -20.5 -21.34 -0.34 Pass0.50 -24.0 -24.5 -23.5 -24.24 -0.24 Pass0.25 -27.0 -27.5 -26.5 -27.20 -0.20 Pass
Toneburst Nominal Data Uncertainty DeviationDuration (ms) Value (dB) Minimum Maximum Found (dB) (dB) (dB)
1,000.00 0.0 -0.5 0.5 -0.01 -0.01 Pass500.00 -0.1 -0.6 0.4 -0.09 0.01 Pass200.00 -1.0 -1.5 -0.5 -1.02 -0.02 Pass100.00 -2.6 -3.1 -2.1 -2.73 -0.13 Pass50.00 -4.8 -5.3 -4.3 -5.05 -0.25 Pass20.00 -8.3 -8.8 -7.8 -8.49 -0.19 Pass10.00 -11.1 -11.6 -10.6 -11.28 -0.18 Pass5.00 -14.1 -14.6 -13.6 -14.30 -0.20 Pass2.00 -18.0 -18.5 -17.5 -18.28 -0.28 Pass1.00 -21.0 -21.5 -20.5 -21.25 -0.25 Pass0.50 -24.0 -24.5 -23.5 -24.24 -0.24 Pass0.25 -27.0 -27.5 -26.5 -27.19 -0.19 Pass
Deviation: the difference between the nominal value and the data found
Uncertainty: maximum expanded uncertainty of measurement with approximately 95% confidence level (coverage factor k=2)Deviation: the difference between the nominal value and the data found
Data Found: the value the sound level meter actually indicates; equal to LZFmax(toneburst)-LZF(steady-state)Tolerance: the acceptable range, including the stated uncertainty, for what the sound level meter should indicate according to IEC 61672
The sound level meter's response to single tonebursts at 4.0 kHz is measured. The baseline input level is 3 dB less than full scale.Toneburst Duration: the length of time each burst lasts
Data Found: the value the sound level meter actually indicates; equal to LAFmax(toneburst)-LAF(steady-state)Uncertainty: maximum expanded uncertainty of measurement with approximately 95% confidence level (coverage factor k=2)Deviation: the difference between the nominal value and the data found
Data Found: the value the sound level meter actually indicates; equal to LCFmax(toneburst)-LCF(steady-state)
Single Toneburst Response (Fast Time Weighting, C F requency Weighting) (61672-3 § 16)The sound level meter's response to single tonebursts at 4.0 kHz is measured. The baseline input level is 3 dB less than full scale.Toneburst Duration: the length of time each burst lasts
0.20
The sound level meter's response to single tonebursts at 4.0 kHz is measured. The baseline input level is 3 dB less than full scale.
Nominal Value: the value sound level meter should indicate according to IEC 61672Toneburst Duration: the length of time each burst lasts
Single Toneburst Response (Fast Time Weighting, A F requency Weighting) (61672-3 § 16)
Tolerance: the acceptable range, including the stated uncertainty, for what the sound level meter should indicate according to IEC 61672
0.20
Tolerance (dB)Pass/Fail
Pass/FailTolerance (dB)
Single Toneburst Response (Fast Time Weighting, Z F requency Weighting) (61672-3 § 16)
Nominal Value: the value sound level meter should indicate according to IEC 61672
Uncertainty: maximum expanded uncertainty of measurement with approximately 95% confidence level (coverage factor k=2)
0.20
Nominal Value: the value sound level meter should indicate according to IEC 61672Tolerance: the acceptable range, including the stated uncertainty, for what the sound level meter should indicate according to IEC 61672
Tolerance (dB)Pass/Fail
Page 8 of 64

Calibration Data for831# XXXID# N/A
Odin Metrology, Inc. Odin Metrology, Inc.Report# N/A
March 31, 2011
Toneburst Nominal Data Uncertainty DeviationDuration (ms) Value (dB) Minimum Maximum Found (dB) (dB) (dB)
1,000.0 -2.0 -2.5 -1.5 -2.09 -0.09 Pass500.0 -4.1 -4.6 -3.6 -4.19 -0.09 Pass200.0 -7.4 -7.9 -6.9 -7.56 -0.16 Pass100.0 -10.2 -10.7 -9.7 -10.36 -0.16 Pass50.0 -13.1 -13.6 -12.6 -13.26 0.20 -0.16 Pass20.0 -17.0 -17.5 -16.5 -17.21 -0.21 Pass10.0 -20.0 -20.5 -19.5 -20.19 -0.19 Pass5.0 -23.0 -23.5 -22.5 -23.17 -0.17 Pass2.0 -27.0 -27.5 -26.5 -27.16 -0.16 Pass
Toneburst Nominal Data Uncertainty DeviationDuration (ms) Value (dB) Minimum Maximum Found (dB) (dB) (dB)
1,000.0 -2.0 -2.5 -1.5 -2.09 -0.09 Pass500.0 -4.1 -4.6 -3.6 -4.19 -0.09 Pass200.0 -7.4 -7.9 -6.9 -7.56 -0.16 Pass100.0 -10.2 -10.7 -9.7 -10.36 -0.16 Pass50.0 -13.1 -13.6 -12.6 -13.26 0.20 -0.16 Pass20.0 -17.0 -17.5 -16.5 -17.21 -0.21 Pass10.0 -20.0 -20.5 -19.5 -20.19 -0.19 Pass5.0 -23.0 -23.5 -22.5 -23.16 -0.16 Pass2.0 -27.0 -27.5 -26.5 -27.13 -0.13 Pass
Toneburst Nominal Data Uncertainty DeviationDuration (ms) Value (dB) Minimum Maximum Found (dB) (dB) (dB)
1,000.0 -2.0 -2.5 -1.5 -2.06 -0.06 Pass500.0 -4.1 -4.6 -3.6 -4.14 -0.04 Pass200.0 -7.4 -7.9 -6.9 -7.54 -0.14 Pass100.0 -10.2 -10.7 -9.7 -10.34 -0.14 Pass50.0 -13.1 -13.6 -12.6 -13.24 0.20 -0.14 Pass20.0 -17.0 -17.5 -16.5 -17.15 -0.15 Pass10.0 -20.0 -20.5 -19.5 -20.13 -0.13 Pass5.0 -23.0 -23.5 -22.5 -23.14 -0.14 Pass2.0 -27.0 -27.5 -26.5 -27.12 -0.12 Pass
Deviation: the difference between the nominal value and the data foundTolerance (dB)
Nominal Value: the value sound level meter should indicate according to IEC 61672Tolerance: the acceptable range, including the stated uncertainty, for what the sound level meter should indicate according to IEC 61672Data Found: the value the sound level meter actually indicates; equal to LZFmax(toneburst)-LZF(steady-state)Uncertainty: maximum expanded uncertainty of measurement with approximately 95% confidence level (coverage factor k=2)
Deviation: the difference between the nominal value and the data found
Single Toneburst Response (Slow Time Weighting, Z F requency Weighting) (61672-3 § 16)The sound level meter's response to single tonebursts at 4.0 kHz is measured. The baseline input level is 3 dB less than full scale.Toneburst Duration: the length of time each burst lasts
Pass/FailTolerance (dB)
Deviation: the difference between the nominal value and the data found
Single Toneburst Response (Slow Time Weighting, C F requency Weighting) (61672-3 § 16)
Tolerance (dB)Pass/Fail
Nominal Value: the value sound level meter should indicate according to IEC 61672Tolerance: the acceptable range, including the stated uncertainty, for what the sound level meter should indicate according to IEC 61672Data Found: the value the sound level meter actually indicates; equal to LAFmax(toneburst)-LAF(steady-state)Uncertainty: maximum expanded uncertainty of measurement with approximately 95% confidence level (coverage factor k=2)
Single Toneburst Response (Slow Time Weighting, A F requency Weighting) (61672-3 § 16)The sound level meter's response to single tonebursts at 4.0 kHz is measured. The baseline input level is 3 dB less than full scale.Toneburst Duration: the length of time each burst lasts
Nominal Value: the value sound level meter should indicate according to IEC 61672Tolerance: the acceptable range, including the stated uncertainty, for what the sound level meter should indicate according to IEC 61672
Pass/Fail
Data Found: the value the sound level meter actually indicates; equal to LCFmax(toneburst)-LCF(steady-state)Uncertainty: maximum expanded uncertainty of measurement with approximately 95% confidence level (coverage factor k=2)
The sound level meter's response to single tonebursts at 4.0 kHz is measured. The baseline input level is 3 dB less than full scale.Toneburst Duration: the length of time each burst lasts
Page 9 of 64

Calibration Data for831# XXXID# N/A
Odin Metrology, Inc. Odin Metrology, Inc.Report# N/A
March 31, 2011
Toneburst Nominal Data Uncertainty DeviationDuration (ms) Value (dB) Minimum Maximum Found (dB) (dB) (dB)
1000.0 0.0 -0.5 0.5 -0.04 -0.04 Pass500.0 -3.0 -3.5 -2.5 -2.94 0.06 Pass200.0 -7.0 -7.5 -6.5 -6.80 0.20 Pass100.0 -10.0 -10.5 -9.5 -9.88 0.12 Pass50.0 -13.0 -13.5 -12.5 -12.86 0.14 Pass20.0 -17.0 -17.5 -16.5 -16.87 0.13 Pass10.0 -20.0 -20.5 -19.5 -19.78 0.22 Pass5.0 -23.0 -23.5 -22.5 -22.63 0.37 Pass2.0 -27.0 -27.5 -26.5 -27.10 -0.10 Pass1.0 -30.0 -30.5 -29.5 -29.93 0.07 Pass0.5 -33.0 -33.5 -32.5 -32.98 0.02 Pass0.25 -36.0 -36.5 -35.5 -35.94 0.06 Pass
Uncertainty: maximum expanded uncertainty of measurement with approximately 95% confidence level (coverage factor k=2)Deviation: the difference between the nominal value and the data found
SEL Response to Repeated Tonebursts (61672-1 § 5.9)
Nominal Value: the value the sound level meter should indicate according to IEC 61672
Data Found: the value the sound level meter actually indicates; equal to LAE(toneburst)-LAF(steady-state)
Pass/FailTolerance (dB)
0.20
The sound level meter's sound exposure level (SEL) response to repeated tonebursts at 4.0 kHz is measured. The baseline input level is 3 Toneburst Duration: the length of time each burst lasts
Tolerance: the acceptable range, including the stated uncertainty, for what the sound level meter should indicate according to IEC 61672
Page 10 of 64

Calibration Data for831# XXXID# N/A
Odin Metrology, Inc. Odin Metrology, Inc.Report# N/A
March 31, 2011
Input Nominal Tolerance Data Found UncertaintyLevel (dB) Value (dB) (± dB) (dB) (dB) Measured Differential
114.0119.0 119.0 119.02 0.02 N/A Pass124.0 124.0 124.01 0.01 -0.01 Pass129.0 129.0 129.01 0.01 0.00 Pass134.0 134.0 134.01 0.01 0.00 Pass139.0 139.0 138.98 -0.02 -0.02 Pass140.0 140.0 Overload N/A N/A N/A141.0 141.0142.0 142.0143.0 143.0144.0 144.0145.0 145.0146.0 146.0147.0 147.0148.0 148.0 0.8 0.3149.0 149.0150.0 150.0151.0 151.0152.0 152.0153.0 153.0154.0 154.0155.0 155.0156.0 156.0157.0 157.0158.0 158.0159.0 159.0160.0 160.0161.0 161.0
Input Nominal Tolerance Data Found UncertaintyLevel (dB) Value (dB) (± dB) (dB) (dB) Measured Differential
139.0134.0 134.0 134.02 0.02 N/A Pass129.0 129.0 129.02 0.02 0.00 Pass124.0 124.0 124.02 0.02 0.00 Pass119.0 119.0 119.02 0.02 0.01 Pass114.0 114.0 114.01 0.01 -0.02 Pass109.0 109.0 109.04 0.04 0.04 Pass104.0 104.0 104.04 0.04 0.00 Pass99.0 99.0 99.04 0.04 0.00 Pass94.0 94.0 94.05 0.05 0.01 Pass89.0 89.0 89.02 0.02 -0.03 Pass84.0 84.0 84.02 0.02 0.00 Pass79.0 79.0 79.03 0.03 0.01 Pass74.0 74.0 74.00 0.00 -0.02 Pass69.0 69.0 0.8 69.04 0.3 0.04 0.04 Pass64.0 64.0 64.04 0.04 -0.01 Pass59.0 59.0 59.04 0.04 0.01 Pass54.0 54.0 54.05 0.05 0.01 Pass49.0 49.0 49.02 0.02 -0.03 Pass44.0 44.0 44.02 0.02 0.00 Pass39.0 39.0 39.05 0.05 0.03 Pass34.0 34.0 34.06 0.06 0.01 Pass29.0 29.0 29.15 0.15 0.10 Pass28.0 28.0 28.20 0.20 0.05 Pass27.0 27.0 27.24 0.24 0.04 Pass26.0 26.0 Underrange N/A N/A N/A
Data Found: the value the sound level meter actually indicatesUncertainty: maximum expanded uncertainty of measurement with approximately 95% confidence level (coverage factor k=2)Deviation: the difference between the nominal value and the data found; differential: current and previous measurement is not allowed toexceed 0.5 dB according to IEC 61672-1 § 5.5.6
Nominal Value: the value the sound level meter should indicate according to IEC 61672Tolerance: the acceptable difference, including the stated uncertainty, from nominal according to IEC 61672
Level linearity is tested at in A-weighting at 8.0 kHz. Increasing input levels continue up to the first indication of overload. The test iscontinued with decreasing input levels down to the lower limit or the first indication of underrange.Input Level: the level (amplitude) of the signal to the sound level meter
Level Linearity (IEC 61672-3 § 14, IEC 61672-1 § 5. 5.6)
Part 1: Increasing Input Levels
Pass/FailDeviation (dB)
—————————————————————Reference 1——————————————————— ————
—————————————————————Reference 2——————————————————— ————
Part 2: Decreasing Input Levels
Pass/FailDeviation (dB)
Page 11 of 64

Calibration Data for831# XXXID# N/A
Odin Metrology, Inc. Odin Metrology, Inc.Report# N/A
March 31, 2011
A-Weighted Frequency Response
-75.00
-55.00
-35.00
-15.00
5.00
10.0
20.0
39.8
79.4
158.
531
6.2
631.
0
1,25
8.9
2,51
1.9
5,01
1.9
10,0
00.0
19,9
52.6
Frequency (Hz)
Res
po
nse
(d
B)
Response (A)
Minimum Tolerance
Maximum Tolerance
C-Weighted Frequency Response
-20.00
-10.00
0.00
10.0
20.0
39.8
79.4
158.
531
6.2
631.
0
1,25
8.9
2,51
1.9
5,01
1.9
10,0
00.0
19,9
52.6
Frequency (Hz)
Res
po
nse
(d
B)
Response (C)
Minimum Tolerance
Maximum Tolerance
Z-Weighted Frequency Response
-20.00
-10.00
0.00
10.0
20.0
39.8
79.4
158.
531
6.2
631.
0
1,25
8.9
2,51
1.9
5,01
1.9
10,0
00.0
19,9
52.6
Frequency (Hz)
Res
po
nse
(d
B)
Response (Z)
Minimum Tolerance
Maximum Tolerance
Page 12 of 64

Calibration Data for831# XXXID# N/A
Odin Metrology, Inc. Odin Metrology, Inc.Report# N/A
March 31, 2011
Filter Center Input Tolerance DataFreq. (Hz) Freq. (Hz) (± dB) Found (dB)
7.9 7.9 0.00 Pass15.8 15.8 -0.01 Pass31.6 31.6 0.00 Pass63.1 63.1 0.5 0.00 Pass125.9 125.9 0.00 Pass251.2 251.2 0.00 Pass501.2 501.2 0.00 Pass
1,000.0 1,000.01,995.3 1,995.3 0.00 Pass3,981.1 3,981.1 0.01 Pass7,943.3 7,943.3 0.00 Pass15,848.9 15,848.9 0.00 Pass
Level Verification of Filter+SLM (1/1 Octave)
————————Reference————————
Relative to 94 dB at 1,000 Hz, it is verified that for each filter center frequency, if the input frequency matches thatof the center frequency, the meter should indicate within the tolerance shown.
Result
Filter Center Frequency: center frequency setting on the filterInput Frequency: frequency of the input signal to the filterTolerance: the acceptable range for what the filter should indicate according to Odin Metrology, Inc.Data Found: the level the sound level meter indicates
0.5
Page 13 of 64

Calibration Data for831# XXXID# N/A
Odin Metrology, Inc. Odin Metrology, Inc.Report# N/A
March 31, 2011
Filter Center Input Tolerance DataFreq. (Hz) Freq. (Hz) (± dB) Found (dB)
6.3 6.3 0.03 Pass7.9 7.9 0.01 Pass10.0 10.0 -0.01 Pass12.6 12.6 -0.01 Pass15.8 15.8 -0.01 Pass20.0 20.0 -0.02 Pass25.1 25.1 -0.01 Pass31.6 31.6 0.00 Pass39.8 39.8 -0.01 Pass50.1 50.1 -0.01 Pass63.1 63.1 -0.01 Pass79.4 79.4 -0.01 Pass100.0 100.0 0.00 Pass125.9 125.9 -0.01 Pass158.5 158.5 0.00 Pass199.5 199.5 -0.01 Pass251.2 251.2 0.00 Pass316.2 316.2 0.00 Pass398.1 398.1 0.00 Pass501.2 501.2 -0.01 Pass631.0 631.0 -0.01 Pass794.3 794.3 -0.01 Pass
1,000.0 1,000.01,258.9 1,258.9 -0.01 Pass1,584.9 1,584.9 0.00 Pass1,995.3 1,995.3 -0.01 Pass2,511.9 2,511.9 0.00 Pass3,162.3 3,162.3 0.00 Pass3,981.1 3,981.1 -0.01 Pass5,011.9 5,011.9 0.5 -0.01 Pass6,309.6 6,309.6 -0.01 Pass7,943.3 7,943.3 -0.01 Pass10,000.0 10,000.0 -0.02 Pass12,589.3 12,589.3 -0.03 Pass15,848.9 15,848.9 -0.03 Pass19,952.6 19,952.6 -0.04 Pass
Level Verification of Filter+SLM (1/3 Octave)
0.5
Input Frequency: frequency of the input signal to the filterTolerance: the acceptable range for what the filter should indicate according to Odin Metrology, Inc.Data Found: the level the sound level meter indicates
Filter Center Frequency: center frequency setting on the filter
Relative to 94 dB at 1,000 Hz, it is verified that for each filter center frequency, if the input frequency matches thatof the center frequency, the meter should indicate within the tolerance shown.
Result
————————Reference————————
Page 14 of 64

Calibration Data for831# XXXID# N/A
Odin Metrology, Inc. Odin Metrology, Inc.Report# N/A
March 31, 2011
Filter CenterFreq. (Hz) -1/2 Octave +1/2 Octave Minimum Maximum -1/2 Octave +1/2 Octave
7.9 5.6 11.2 -3.21 -3.05 Pass15.8 11.2 22.4 -3.19 -3.09 Pass31.6 22.4 44.7 -3.16 -3.12 Pass63.1 44.7 89.1 -3.14 -3.13 Pass125.9 89.1 177.8 -3.14 -3.14 Pass251.2 177.8 354.8 -3.11 -3.11 Pass501.2 354.8 707.9 -3.12 -3.11 Pass
1,000.0 707.9 1,412.5 -3.12 -3.11 Pass1,995.3 1,412.5 2,818.4 -3.13 -3.12 Pass3,981.1 2,818.4 5,623.4 -3.13 -3.12 Pass7,943.3 5,623.4 11,220.2 -3.14 -3.13 Pass15,848.9 11,220.2 22,387.2 -3.04 -3.80 Pass
-1.2
Tolerance: the acceptable range for what the filter should indicate according to Odin Metrology, Inc.Data Found: the level the sound level meter indicates
Input Frequency (Hz) Tolerance (dB) Data Found (dB)Result
At each center frequency in 1/1 octave step size mode, frequencies equaling the center frequency plus and minusone half octave shall cause the filter to respond with attenuation within the limits stated below.
Input Frequency: the input frequency to the filter calculated as plus and minus one half octave from the center Filter Center Frequency: center frequency setting on the filter
Filter Check (1/1 Octave)
-5.7
Page 15 of 64

Calibration Data for831# XXXID# N/A
Odin Metrology, Inc. Odin Metrology, Inc.Report# N/A
March 31, 2011
Filter CenterFreq. (Hz) -1/6 Octave +1/6 Octave Minimum Maximum -1/6 Octave +1/6 Octave
6.3 5.6 7.1 -3.2 -3.1 Pass7.9 7.1 8.9 -3.0 -2.9 Pass10.0 8.9 11.2 -3.0 -2.9 Pass12.6 11.2 14.1 -3.0 -2.9 Pass15.8 14.1 17.8 -3.0 -2.9 Pass20.0 17.8 22.4 -3.0 -2.9 Pass25.1 22.4 28.2 -3.0 -2.9 Pass31.6 28.2 35.5 -3.0 -3.0 Pass39.8 35.5 44.7 -3.0 -2.9 Pass50.1 44.7 56.2 -3.0 -2.9 Pass63.1 56.2 70.8 -3.0 -2.9 Pass79.4 70.8 89.1 -3.0 -3.0 Pass100.0 89.1 112.2 -3.0 -2.9 Pass125.9 112.2 141.3 -3.0 -2.9 Pass158.5 141.3 177.8 -3.0 -3.0 Pass199.5 177.8 223.9 -3.0 -2.9 Pass251.2 223.9 281.8 -3.0 -3.0 Pass316.2 281.8 354.8 -3.0 -3.0 Pass398.1 354.8 446.7 -3.0 -2.9 Pass501.2 446.7 562.3 -3.0 -2.9 Pass631.0 562.3 707.9 -3.0 -2.9 Pass794.3 707.9 891.3 -3.0 -3.0 Pass
1,000.0 891.3 1,122.0 -3.0 -2.9 Pass1,258.9 1,122.0 1,412.5 -3.0 -2.9 Pass1,584.9 1,412.5 1,778.3 -3.0 -3.0 Pass1,995.3 1,778.3 2,238.7 -3.0 -2.9 Pass2,511.9 2,238.7 2,818.4 -3.0 -3.0 Pass3,162.3 2,818.4 3,548.1 -3.0 -3.0 Pass3,981.1 3,548.1 4,466.8 -3.0 -2.9 Pass5,011.9 4,466.8 5,623.4 -3.0 -2.9 Pass6,309.6 5,623.4 7,079.5 -3.0 -2.9 Pass7,943.3 7,079.5 8,912.5 -3.0 -3.0 Pass10,000.0 8,912.5 11,220.2 -3.0 -3.0 Pass12,589.3 11,220.2 14,125.4 -3.0 -3.0 Pass15,848.9 14,125.4 17,782.8 -2.9 -3.1 Pass19,952.6 17,782.8 22,387.2 -2.8 -3.4 Pass
Filter Check (1/3 Octave)
-5.7 -1.2
Tolerance (dB) Data Found (dB)Result
Input Frequency: the input frequency to the filter calculated as plus and minus one sixth octave from the center
Data Found: the level the sound level meter indicatesTolerance: the acceptable range for what the filter should indicate according to Odin Metrology, Inc.
At each center frequency in 1/3 octave step size mode and 1/3 octave bandwidth, frequencies equaling the centerfrequency plus and minus one sixth octave shall cause the filter to respond with attenuation within the limitsstated below.Filter Center Frequency: center frequency setting on the filter
Input Frequency (Hz)
Page 16 of 64

Calibration Data for831# XXXID# N/A
Odin Metrology, Inc. Odin Metrology, Inc.Report# N/A
March 31, 2011
Octaves from Input DataCenter Freq. Freq. (Hz) Minimum Maximum Found (dB)
-4 0.5 N/A -70.0 -96.52 Pass-3 1.0 N/A -61.0 -95.08 Pass-2 2.0 N/A -42.0 -80.83 Pass-1 4.0 N/A -17.5 -75.55 Pass- 1/2 5.6 -5.0 -2.0 -3.26 Pass- 3/8 6.1 -1.3 0.3 -0.29 Pass- 1/4 6.7 -0.6 0.3 -0.05 Pass- 1/8 7.3 -0.4 0.3 -0.02 Pass0 7.9 -0.3 0.3 0.00 Pass1/8 8.7 -0.4 0.3 0.02 Pass1/4 9.4 -0.6 0.3 0.06 Pass3/8 10.3 -1.3 0.3 0.09 Pass1/2 11.2 -5.0 -2.0 -3.01 Pass
1 15.8 N/A -17.5 -104.73 Pass2 31.6 N/A -42.0 -104.41 Pass3 63.1 N/A -61.0 -104.61 Pass4 125.9 N/A -70.0 -106.35 Pass
1/1 Octave - 8 HzTolerance (dB)
Pass/Fail
Octaves from Center Frequency: the difference, in octaves, between the selected center frequency and thecurrent input frequencyInput Frequency: the input frequency to the filterTolerance: the acceptable range for what the filter should indicate according to IEC 61260Data Found: the level the sound level meter indicates
The attenuation of the filter at the given frequencies shall be within the stated tolerance. The frequencies arecalculated as octaves from the center frequency. The factors defined by IEC 61260 (Table 1) are: ±4, ±3, ±2, ±1,±1/2, ±3/8, ±1/4, ±1/8 and 0.
Relative Attenuation (IEC 61260 § 5.3)
Relative Attenuation
-120-110-100-90-80-70-60-50-40-30-20-10
0
-4 -3 -2 -1 - 1/2 - 3/8 - 1/4 - 1/8 0 1/8 1/4 3/8 1/2 1 2 3 4
Octaves from Center Frequency
Res
pons
e (d
B)
Minimum Tolerance
Maximum Tolerance
Data Found
Relative Attenuation (Detail)
-6
-4
-2
0
-4 -3 -2 -1 - 1/2 - 3/8 - 1/4 - 1/8 0 1/8 1/4 3/8 1/2 1 2 3 4
Octaves from Center Frequency
Res
pons
e (d
B)
Minimum Tolerance
Maximum Tolerance
Data Found
Page 17 of 64

Calibration Data for831# XXXID# N/A
Odin Metrology, Inc. Odin Metrology, Inc.Report# N/A
March 31, 2011
Octaves from Input DataCenter Freq. Freq. (Hz) Minimum Maximum Found (dB)
-4 1.0 N/A -70.0 -101.70 Pass-3 2.0 N/A -61.0 -100.94 Pass-2 4.0 N/A -42.0 -85.98 Pass-1 7.9 N/A -17.5 -75.33 Pass- 1/2 11.2 -5.0 -2.0 -3.20 Pass- 3/8 12.2 -1.3 0.3 -0.26 Pass- 1/4 13.3 -0.6 0.3 -0.04 Pass- 1/8 14.5 -0.4 0.3 -0.01 Pass0 15.8 -0.3 0.3 0.00 Pass1/8 17.3 -0.4 0.3 0.00 Pass1/4 18.8 -0.6 0.3 0.03 Pass3/8 20.5 -1.3 0.3 0.04 Pass1/2 22.4 -5.0 -2.0 -3.09 Pass
1 31.6 N/A -17.5 -105.38 Pass2 63.1 N/A -42.0 -105.37 Pass3 125.9 N/A -61.0 -106.39 Pass4 251.2 N/A -70.0 -105.59 Pass
1/1 Octave - 16 HzTolerance (dB)
Pass/Fail
Relative Attenuation (IEC 61260 § 5.3)The attenuation of the filter at the given frequencies shall be within the stated tolerance. The frequencies arecalculated as octaves from the center frequency. The factors defined by IEC 61260 (Table 1) are: ±4, ±3, ±2, ±1,±1/2, ±3/8, ±1/4, ±1/8 and 0.Octaves from Center Frequency: the difference, in octaves, between the selected center frequency and thecurrent input frequencyInput Frequency: the input frequency to the filterTolerance: the acceptable range for what the filter should indicate according to IEC 61260Data Found: the level the sound level meter indicates
Relative Attenuation
-120-110-100-90-80-70-60-50-40-30-20-10
0
-4 -3 -2 -1 - 1/2 - 3/8 - 1/4 - 1/8 0 1/8 1/4 3/8 1/2 1 2 3 4
Octaves from Center Frequency
Res
pons
e (d
B)
Minimum Tolerance
Maximum Tolerance
Data Found
Relative Attenuation (Detail)
-6
-4
-2
0
-4 -3 -2 -1 - 1/2 - 3/8 - 1/4 - 1/8 0 1/8 1/4 3/8 1/2 1 2 3 4
Octaves from Center Frequency
Res
pons
e (d
B)
Minimum Tolerance
Maximum Tolerance
Data Found
Page 18 of 64

Calibration Data for831# XXXID# N/A
Odin Metrology, Inc. Odin Metrology, Inc.Report# N/A
March 31, 2011
Octaves from Input DataCenter Freq. Freq. (Hz) Minimum Maximum Found (dB)
-4 2.0 N/A -70.0 -101.79 Pass-3 4.0 N/A -61.0 -101.35 Pass-2 7.9 N/A -42.0 -87.12 Pass-1 15.8 N/A -17.5 -75.14 Pass- 1/2 22.4 -5.0 -2.0 -3.17 Pass- 3/8 24.4 -1.3 0.3 -0.25 Pass- 1/4 26.6 -0.6 0.3 -0.04 Pass- 1/8 29.0 -0.4 0.3 -0.06 Pass0 31.6 -0.3 0.3 0.00 Pass1/8 34.5 -0.4 0.3 0.00 Pass1/4 37.6 -0.6 0.3 -0.01 Pass3/8 41.0 -1.3 0.3 0.02 Pass1/2 44.7 -5.0 -2.0 -3.12 Pass
1 63.1 N/A -17.5 -104.56 Pass2 125.9 N/A -42.0 -104.93 Pass3 251.2 N/A -61.0 -104.98 Pass4 501.2 N/A -70.0 -105.80 Pass
Tolerance (dB)Pass/Fail
Data Found: the level the sound level meter indicates
Input Frequency: the input frequency to the filterTolerance: the acceptable range for what the filter should indicate according to IEC 61260
1/1 Octave - 31.5 Hz
Octaves from Center Frequency: the difference, in octaves, between the selected center frequency and thecurrent input frequency
Relative Attenuation (IEC 61260 § 5.3)The attenuation of the filter at the given frequencies shall be within the stated tolerance. The frequencies arecalculated as octaves from the center frequency. The factors defined by IEC 61260 (Table 1) are: ±4, ±3, ±2, ±1,±1/2, ±3/8, ±1/4, ±1/8 and 0.
Relative Attenuation
-120-110-100-90-80-70-60-50-40-30-20-10
0
-4 -3 -2 -1 - 1/2 - 3/8 - 1/4 - 1/8 0 1/8 1/4 3/8 1/2 1 2 3 4
Octaves from Center Frequency
Res
pons
e (d
B)
Minimum Tolerance
Maximum Tolerance
Data Found
Relative Attenuation (Detail)
-6
-4
-2
0
-4 -3 -2 -1 - 1/2 - 3/8 - 1/4 - 1/8 0 1/8 1/4 3/8 1/2 1 2 3 4
Octaves from Center Frequency
Res
pons
e (d
B)
Minimum Tolerance
Maximum Tolerance
Data Found
Page 19 of 64

Calibration Data for831# XXXID# N/A
Odin Metrology, Inc. Odin Metrology, Inc.Report# N/A
March 31, 2011
Octaves from Input DataCenter Freq. Freq. (Hz) Minimum Maximum Found (dB)
-4 4.0 N/A -70.0 -100.89 Pass-3 7.9 N/A -61.0 -95.33 Pass-2 15.8 N/A -42.0 -85.24 Pass-1 31.6 N/A -17.5 -75.29 Pass- 1/2 44.7 -5.0 -2.0 -3.11 Pass- 3/8 48.7 -1.3 0.3 -0.20 Pass- 1/4 53.1 -0.6 0.3 0.04 Pass- 1/8 57.9 -0.4 0.3 0.03 Pass0 63.1 -0.3 0.3 0.00 Pass1/8 68.8 -0.4 0.3 0.04 Pass1/4 75.0 -0.6 0.3 0.03 Pass3/8 81.8 -1.3 0.3 0.01 Pass1/2 89.1 -5.0 -2.0 -3.10 Pass
1 125.9 N/A -17.5 -101.61 Pass2 251.2 N/A -42.0 -103.34 Pass3 501.2 N/A -61.0 -104.44 Pass4 1,000.0 N/A -70.0 -103.86 Pass
The attenuation of the filter at the given frequencies shall be within the stated tolerance. The frequencies arecalculated as octaves from the center frequency. The factors defined by IEC 61260 (Table 1) are: ±4, ±3, ±2, ±1,±1/2, ±3/8, ±1/4, ±1/8 and 0.Octaves from Center Frequency: the difference, in octaves, between the selected center frequency and thecurrent input frequencyInput Frequency: the input frequency to the filterTolerance: the acceptable range for what the filter should indicate according to IEC 61260Data Found: the level the sound level meter indicates
1/1 Octave - 63 HzTolerance (dB)
Pass/Fail
Relative Attenuation (IEC 61260 § 5.3)
Relative Attenuation
-120-110-100-90-80-70-60-50-40-30-20-10
0
-4 -3 -2 -1 - 1/2 - 3/8 - 1/4 - 1/8 0 1/8 1/4 3/8 1/2 1 2 3 4
Octaves from Center Frequency
Res
pons
e (d
B)
Minimum Tolerance
Maximum Tolerance
Data Found
Relative Attenuation (Detail)
-6
-4
-2
0
-4 -3 -2 -1 - 1/2 - 3/8 - 1/4 - 1/8 0 1/8 1/4 3/8 1/2 1 2 3 4
Octaves from Center Frequency
Res
pons
e (d
B)
Minimum Tolerance
Maximum Tolerance
Data Found
Page 20 of 64

Calibration Data for831# XXXID# N/A
Odin Metrology, Inc. Odin Metrology, Inc.Report# N/A
March 31, 2011
Octaves from Input DataCenter Freq. Freq. (Hz) Minimum Maximum Found (dB)
-4 7.9 N/A -70.0 -100.53 Pass-3 15.8 N/A -61.0 -98.87 Pass-2 31.6 N/A -42.0 -85.54 Pass-1 63.1 N/A -17.5 -75.43 Pass- 1/2 89.1 -5.0 -2.0 -3.18 Pass- 3/8 97.2 -1.3 0.3 -0.28 Pass- 1/4 105.9 -0.6 0.3 -0.04 Pass- 1/8 115.5 -0.4 0.3 0.00 Pass0 125.9 -0.3 0.3 0.00 Pass1/8 137.2 -0.4 0.3 0.01 Pass1/4 149.6 -0.6 0.3 0.00 Pass3/8 163.1 -1.3 0.3 0.00 Pass1/2 177.8 -5.0 -2.0 -3.13 Pass
1 251.2 N/A -17.5 -102.85 Pass2 501.2 N/A -42.0 -102.63 Pass3 1,000.0 N/A -61.0 -102.54 Pass4 1,995.3 N/A -70.0 -102.99 Pass
The attenuation of the filter at the given frequencies shall be within the stated tolerance. The frequencies arecalculated as octaves from the center frequency. The factors defined by IEC 61260 (Table 1) are: ±4, ±3, ±2, ±1,±1/2, ±3/8, ±1/4, ±1/8 and 0.Octaves from Center Frequency: the difference, in octaves, between the selected center frequency and thecurrent input frequencyInput Frequency: the input frequency to the filterTolerance: the acceptable range for what the filter should indicate according to IEC 61260Data Found: the level the sound level meter indicates
1/1 Octave - 125 HzTolerance (dB)
Pass/Fail
Relative Attenuation (IEC 61260 § 5.3)
Relative Attenuation
-120-110-100-90-80-70-60-50-40-30-20-10
0
-4 -3 -2 -1 - 1/2 - 3/8 - 1/4 - 1/8 0 1/8 1/4 3/8 1/2 1 2 3 4
Octaves from Center Frequency
Res
pons
e (d
B)
Minimum Tolerance
Maximum Tolerance
Data Found
Relative Attenuation (Detail)
-6
-4
-2
0
-4 -3 -2 -1 - 1/2 - 3/8 - 1/4 - 1/8 0 1/8 1/4 3/8 1/2 1 2 3 4
Octaves from Center Frequency
Res
pons
e (d
B)
Minimum Tolerance
Maximum Tolerance
Data Found
Page 21 of 64

Calibration Data for831# XXXID# N/A
Odin Metrology, Inc. Odin Metrology, Inc.Report# N/A
March 31, 2011
Octaves from Input DataCenter Freq. Freq. (Hz) Minimum Maximum Found (dB)
-4 15.8 N/A -70.0 -98.65 Pass-3 31.6 N/A -61.0 -97.69 Pass-2 63.1 N/A -42.0 -85.26 Pass-1 125.9 N/A -17.5 -75.09 Pass- 1/2 177.8 -5.0 -2.0 -3.09 Pass- 3/8 193.9 -1.3 0.3 -0.18 Pass- 1/4 211.3 -0.6 0.3 0.03 Pass- 1/8 230.4 -0.4 0.3 0.01 Pass0 251.2 -0.3 0.3 0.00 Pass1/8 273.8 -0.4 0.3 -0.01 Pass1/4 298.5 -0.6 0.3 -0.03 Pass3/8 325.5 -1.3 0.3 0.02 Pass1/2 354.8 -5.0 -2.0 -3.09 Pass
1 501.2 N/A -17.5 -100.61 Pass2 1,000.0 N/A -42.0 -100.48 Pass3 1,995.3 N/A -61.0 -100.78 Pass4 3,981.1 N/A -70.0 -100.79 Pass
The attenuation of the filter at the given frequencies shall be within the stated tolerance. The frequencies arecalculated as octaves from the center frequency. The factors defined by IEC 61260 (Table 1) are: ±4, ±3, ±2, ±1,±1/2, ±3/8, ±1/4, ±1/8 and 0.Octaves from Center Frequency: the difference, in octaves, between the selected center frequency and thecurrent input frequencyInput Frequency: the input frequency to the filterTolerance: the acceptable range for what the filter should indicate according to IEC 61260Data Found: the level the sound level meter indicates
1/1 Octave - 250 HzTolerance (dB)
Pass/Fail
Relative Attenuation (IEC 61260 § 5.3)
Relative Attenuation
-120-110-100-90-80-70-60-50-40-30-20-10
0
-4 -3 -2 -1 - 1/2 - 3/8 - 1/4 - 1/8 0 1/8 1/4 3/8 1/2 1 2 3 4
Octaves from Center Frequency
Res
pons
e (d
B)
Minimum Tolerance
Maximum Tolerance
Data Found
Relative Attenuation (Detail)
-6
-4
-2
0
-4 -3 -2 -1 - 1/2 - 3/8 - 1/4 - 1/8 0 1/8 1/4 3/8 1/2 1 2 3 4
Octaves from Center Frequency
Res
pons
e (d
B)
Minimum Tolerance
Maximum Tolerance
Data Found
Page 22 of 64

Calibration Data for831# XXXID# N/A
Odin Metrology, Inc. Odin Metrology, Inc.Report# N/A
March 31, 2011
Octaves from Input DataCenter Freq. Freq. (Hz) Minimum Maximum Found (dB)
-4 31.6 N/A -70.0 -97.47 Pass-3 63.1 N/A -61.0 -95.55 Pass-2 125.9 N/A -42.0 -84.16 Pass-1 251.2 N/A -17.5 -75.08 Pass- 1/2 354.8 -5.0 -2.0 -3.13 Pass- 3/8 386.8 -1.3 0.3 -0.20 Pass- 1/4 421.7 -0.6 0.3 -0.01 Pass- 1/8 459.7 -0.4 0.3 -0.01 Pass0 501.2 -0.3 0.3 0.00 Pass1/8 546.4 -0.4 0.3 -0.01 Pass1/4 595.7 -0.6 0.3 0.01 Pass3/8 649.4 -1.3 0.3 -0.01 Pass1/2 707.9 -5.0 -2.0 -3.12 Pass
1 1,000.0 N/A -17.5 -98.58 Pass2 1,995.3 N/A -42.0 -98.18 Pass3 3,981.1 N/A -61.0 -97.91 Pass4 7,943.3 N/A -70.0 -97.94 Pass
The attenuation of the filter at the given frequencies shall be within the stated tolerance. The frequencies arecalculated as octaves from the center frequency. The factors defined by IEC 61260 (Table 1) are: ±4, ±3, ±2, ±1,±1/2, ±3/8, ±1/4, ±1/8 and 0.Octaves from Center Frequency: the difference, in octaves, between the selected center frequency and thecurrent input frequencyInput Frequency: the input frequency to the filterTolerance: the acceptable range for what the filter should indicate according to IEC 61260Data Found: the level the sound level meter indicates
1/1 Octave - 500 HzTolerance (dB)
Pass/Fail
Relative Attenuation (IEC 61260 § 5.3)
Relative Attenuation
-120-110-100-90-80-70-60-50-40-30-20-10
0
-4 -3 -2 -1 - 1/2 - 3/8 - 1/4 - 1/8 0 1/8 1/4 3/8 1/2 1 2 3 4
Octaves from Center Frequency
Res
pons
e (d
B)
Minimum Tolerance
Maximum Tolerance
Data Found
Relative Attenuation (Detail)
-6
-4
-2
0
-4 -3 -2 -1 - 1/2 - 3/8 - 1/4 - 1/8 0 1/8 1/4 3/8 1/2 1 2 3 4
Octaves from Center Frequency
Res
pons
e (d
B)
Minimum Tolerance
Maximum Tolerance
Data Found
Page 23 of 64

Calibration Data for831# XXXID# N/A
Odin Metrology, Inc. Odin Metrology, Inc.Report# N/A
March 31, 2011
Octaves from Input DataCenter Freq. Freq. (Hz) Minimum Maximum Found (dB)
-4 63.1 N/A -70.0 -95.15 Pass-3 125.9 N/A -61.0 -93.66 Pass-2 251.2 N/A -42.0 -84.18 Pass-1 501.2 N/A -17.5 -75.11 Pass- 1/2 707.9 -5.0 -2.0 -3.16 Pass- 3/8 771.8 -1.3 0.3 -0.23 Pass- 1/4 841.4 -0.6 0.3 -0.03 Pass- 1/8 917.3 -0.4 0.3 -0.02 Pass0 1,000.0 -0.3 0.3 0.00 Pass1/8 1,090.2 -0.4 0.3 -0.03 Pass1/4 1,188.5 -0.6 0.3 -0.02 Pass3/8 1,295.7 -1.3 0.3 0.01 Pass1/2 1,412.5 -5.0 -2.0 -3.14 Pass
1 1,995.3 N/A -17.5 -95.35 Pass2 3,981.1 N/A -42.0 -95.35 Pass3 7,943.3 N/A -61.0 -94.99 Pass4 15,848.9 N/A -70.0 -93.11 Pass
Input Frequency: the input frequency to the filterTolerance: the acceptable range for what the filter should indicate according to IEC 61260
Relative Attenuation (IEC 61260 § 5.3)
Data Found: the level the sound level meter indicates1/1 Octave - 1 kHz
Tolerance (dB)Pass/Fail
The attenuation of the filter at the given frequencies shall be within the stated tolerance. The frequencies arecalculated as octaves from the center frequency. The factors defined by IEC 61260 (Table 1) are: ±4, ±3, ±2, ±1,±1/2, ±3/8, ±1/4, ±1/8 and 0.Octaves from Center Frequency: the difference, in octaves, between the selected center frequency and thecurrent input frequency
Relative Attenuation
-120-110-100-90-80-70-60-50-40-30-20-10
0
-4 -3 -2 -1 - 1/2 - 3/8 - 1/4 - 1/8 0 1/8 1/4 3/8 1/2 1 2 3 4
Octaves from Center Frequency
Res
pons
e (d
B)
Minimum Tolerance
Maximum Tolerance
Data Found
Relative Attenuation (Detail)
-6
-4
-2
0
-4 -3 -2 -1 - 1/2 - 3/8 - 1/4 - 1/8 0 1/8 1/4 3/8 1/2 1 2 3 4
Octaves from Center Frequency
Res
pons
e (d
B)
Minimum Tolerance
Maximum Tolerance
Data Found
Page 24 of 64

Calibration Data for831# XXXID# N/A
Odin Metrology, Inc. Odin Metrology, Inc.Report# N/A
March 31, 2011
Octaves from Input DataCenter Freq. Freq. (Hz) Minimum Maximum Found (dB)
-4 125.9 N/A -70.0 -92.44 Pass-3 251.2 N/A -61.0 -91.80 Pass-2 501.2 N/A -42.0 -83.48 Pass-1 1,000.0 N/A -17.5 -75.07 Pass- 1/2 1,412.5 -5.0 -2.0 -3.13 Pass- 3/8 1,539.9 -1.3 0.3 -0.21 Pass- 1/4 1,678.8 -0.6 0.3 0.03 Pass- 1/8 1,830.2 -0.4 0.3 -0.01 Pass0 1,995.3 -0.3 0.3 0.00 Pass1/8 2,175.2 -0.4 0.3 0.02 Pass1/4 2,371.4 -0.6 0.3 -0.03 Pass3/8 2,585.2 -1.3 0.3 -0.02 Pass1/2 2,818.4 -5.0 -2.0 -3.14 Pass
1 3,981.1 N/A -17.5 -92.43 Pass2 7,943.3 N/A -42.0 -92.14 Pass3 15,848.9 N/A -61.0 -89.88 Pass4 31,622.8 N/A -70.0 -92.33 Pass
The attenuation of the filter at the given frequencies shall be within the stated tolerance. The frequencies arecalculated as octaves from the center frequency. The factors defined by IEC 61260 (Table 1) are: ±4, ±3, ±2, ±1,±1/2, ±3/8, ±1/4, ±1/8 and 0.Octaves from Center Frequency: the difference, in octaves, between the selected center frequency and thecurrent input frequencyInput Frequency: the input frequency to the filterTolerance: the acceptable range for what the filter should indicate according to IEC 61260Data Found: the level the sound level meter indicates
1/1 Octave - 2 kHzTolerance (dB)
Pass/Fail
Relative Attenuation (IEC 61260 § 5.3)
Relative Attenuation
-120-110-100-90-80-70-60-50-40-30-20-10
0
-4 -3 -2 -1 - 1/2 - 3/8 - 1/4 - 1/8 0 1/8 1/4 3/8 1/2 1 2 3 4
Octaves from Center Frequency
Res
pons
e (d
B)
Minimum Tolerance
Maximum Tolerance
Data Found
Relative Attenuation (Detail)
-6
-4
-2
0
-4 -3 -2 -1 - 1/2 - 3/8 - 1/4 - 1/8 0 1/8 1/4 3/8 1/2 1 2 3 4
Octaves from Center Frequency
Res
pons
e (d
B)
Minimum Tolerance
Maximum Tolerance
Data Found
Page 25 of 64

Calibration Data for831# XXXID# N/A
Odin Metrology, Inc. Odin Metrology, Inc.Report# N/A
March 31, 2011
Octaves from Input DataCenter Freq. Freq. (Hz) Minimum Maximum Found (dB)
-4 251.2 N/A -70.0 -89.44 Pass-3 501.2 N/A -61.0 -88.84 Pass-2 1,000.0 N/A -42.0 -83.48 Pass-1 1,995.3 N/A -17.5 -74.78 Pass- 1/2 2,818.4 -5.0 -2.0 -3.17 Pass- 3/8 3,072.6 -1.3 0.3 -0.24 Pass- 1/4 3,349.7 -0.6 0.3 0.01 Pass- 1/8 3,651.7 -0.4 0.3 0.03 Pass0 3,981.1 -0.3 0.3 0.00 Pass1/8 4,340.1 -0.4 0.3 0.01 Pass1/4 4,731.5 -0.6 0.3 0.03 Pass3/8 5,158.2 -1.3 0.3 0.03 Pass1/2 5,623.4 -5.0 -2.0 -3.09 Pass
1 7,943.3 N/A -17.5 -88.76 Pass2 15,848.9 N/A -42.0 -86.35 Pass3 31,622.8 N/A -61.0 -88.54 Pass4 63,095.7 N/A -70.0 -86.88 Pass
The attenuation of the filter at the given frequencies shall be within the stated tolerance. The frequencies arecalculated as octaves from the center frequency. The factors defined by IEC 61260 (Table 1) are: ±4, ±3, ±2, ±1,±1/2, ±3/8, ±1/4, ±1/8 and 0.Octaves from Center Frequency: the difference, in octaves, between the selected center frequency and thecurrent input frequencyInput Frequency: the input frequency to the filterTolerance: the acceptable range for what the filter should indicate according to IEC 61260Data Found: the level the sound level meter indicates
1/1 Octave - 4 kHzTolerance (dB)
Pass/Fail
Relative Attenuation (IEC 61260 § 5.3)
Relative Attenuation
-120-110-100-90-80-70-60-50-40-30-20-10
0
-4 -3 -2 -1 - 1/2 - 3/8 - 1/4 - 1/8 0 1/8 1/4 3/8 1/2 1 2 3 4
Octaves from Center Frequency
Res
pons
e (d
B)
Minimum Tolerance
Maximum Tolerance
Data Found
Relative Attenuation (Detail)
-6
-4
-2
0
-4 -3 -2 -1 - 1/2 - 3/8 - 1/4 - 1/8 0 1/8 1/4 3/8 1/2 1 2 3 4
Octaves from Center Frequency
Res
pons
e (d
B)
Minimum Tolerance
Maximum Tolerance
Data Found
Page 26 of 64

Calibration Data for831# XXXID# N/A
Odin Metrology, Inc. Odin Metrology, Inc.Report# N/A
March 31, 2011
Octaves from Input DataCenter Freq. Freq. (Hz) Minimum Maximum Found (dB)
-4 501.2 N/A -70.0 -85.95 Pass-3 1,000.0 N/A -61.0 -85.70 Pass-2 1,995.3 N/A -42.0 -83.40 Pass-1 3,981.1 N/A -17.5 -74.20 Pass- 1/2 5,623.4 -5.0 -2.0 -3.15 Pass- 3/8 6,130.6 -1.3 0.3 -0.22 Pass- 1/4 6,683.4 -0.6 0.3 -0.02 Pass- 1/8 7,286.2 -0.4 0.3 -0.01 Pass0 7,943.3 -0.3 0.3 0.00 Pass1/8 8,659.6 -0.4 0.3 -0.02 Pass1/4 9,440.6 -0.6 0.3 -0.01 Pass3/8 10,292.0 -1.3 0.3 0.00 Pass1/2 11,220.2 -5.0 -2.0 -3.15 Pass
1 15,848.9 N/A -17.5 -82.31 Pass2 31,622.8 N/A -42.0 -83.64 Pass3 63,095.7 N/A -61.0 -83.26 Pass4 125,892.5 N/A -70.0 -88.98 Pass
Octaves from Center Frequency: the difference, in octaves, between the selected center frequency and thecurrent input frequencyInput Frequency: the input frequency to the filterTolerance: the acceptable range for what the filter should indicate according to IEC 61260Data Found: the level the sound level meter indicates
1/1 Octave - 8 kHz
Relative Attenuation (IEC 61260 § 5.3)
Tolerance (dB)Pass/Fail
The attenuation of the filter at the given frequencies shall be within the stated tolerance. The frequencies arecalculated as octaves from the center frequency. The factors defined by IEC 61260 (Table 1) are: ±4, ±3, ±2, ±1,±1/2, ±3/8, ±1/4, ±1/8 and 0.
Relative Attenuation
-120-110-100-90-80-70-60-50-40-30-20-10
0
-4 -3 -2 -1 - 1/2 - 3/8 - 1/4 - 1/8 0 1/8 1/4 3/8 1/2 1 2 3 4
Octaves from Center Frequency
Res
pons
e (d
B)
Minimum Tolerance
Maximum Tolerance
Data Found
Relative Attenuation (Detail)
-6
-4
-2
0
-4 -3 -2 -1 - 1/2 - 3/8 - 1/4 - 1/8 0 1/8 1/4 3/8 1/2 1 2 3 4
Octaves from Center Frequency
Res
pons
e (d
B)
Minimum Tolerance
Maximum Tolerance
Data Found
Page 27 of 64

Calibration Data for831# XXXID# N/A
Odin Metrology, Inc. Odin Metrology, Inc.Report# N/A
March 31, 2011
Octaves from Input DataCenter Freq. Freq. (Hz) Minimum Maximum Found (dB)
-4 1,000.0 N/A -70.0 -80.02 Pass-3 1,995.3 N/A -61.0 -79.56 Pass-2 3,981.1 N/A -42.0 -78.35 Pass-1 7,943.3 N/A -17.5 -73.86 Pass- 1/2 11,220.2 -5.0 -2.0 -3.04 Pass- 3/8 12,232.1 -1.3 0.3 -0.13 Pass- 1/4 13,335.2 -0.6 0.3 0.08 Pass- 1/8 14,537.8 -0.4 0.3 0.04 Pass0 15,848.9 -0.3 0.3 0.00 Pass1/8 17,278.3 -0.4 0.3 -0.06 Pass1/4 18,836.5 -0.6 0.3 -0.17 Pass3/8 20,535.3 -1.3 0.3 -0.30 Pass1/2 22,387.2 -5.0 -2.0 -3.80 Pass
1 31,622.8 N/A -17.5 -66.61 Pass2 63,095.7 N/A -42.0 -77.04 Pass3 125,892.5 N/A -61.0 -83.59 Pass4 251,188.6 N/A -70.0 N/A N/A
Data Found: the level the sound level meter indicates
The attenuation of the filter at the given frequencies shall be within the stated tolerance. The frequencies arecalculated as octaves from the center frequency. The factors defined by IEC 61260 (Table 1) are: ±4, ±3, ±2, ±1,±1/2, ±3/8, ±1/4, ±1/8 and 0.Octaves from Center Frequency: the difference, in octaves, between the selected center frequency and thecurrent input frequencyInput Frequency: the input frequency to the filterTolerance: the acceptable range for what the filter should indicate according to IEC 61260
Relative Attenuation (IEC 61260 § 5.3)
1/1 Octave - 16 kHzTolerance (dB)
Pass/Fail
Relative Attenuation
-120-110-100-90-80-70-60-50-40-30-20-10
0
-4 -3 -2 -1 - 1/2 - 3/8 - 1/4 - 1/8 0 1/8 1/4 3/8 1/2 1 2 3 4
Octaves from Center Frequency
Res
pons
e (d
B)
Minimum Tolerance
Maximum Tolerance
Data Found
Relative Attenuation (Detail)
-6
-4
-2
0
-4 -3 -2 -1 - 1/2 - 3/8 - 1/4 - 1/8 0 1/8 1/4 3/8 1/2 1 2 3 4
Octaves from Center Frequency
Res
pons
e (d
B)
Minimum Tolerance
Maximum Tolerance
Data Found
Page 28 of 64

Calibration Data for831# XXXID# N/A
Odin Metrology, Inc. Odin Metrology, Inc.Report# N/A
March 31, 2011
Octaves from Input DataCenter Freq. Freq. (Hz) Minimum Maximum Found (dB)
-4 1.2 N/A -70.0 N/A N/A-3 2.1 N/A -61.0 N/A N/A-2 3.4 N/A -42.0 -63.51 Pass-1 4.9 N/A -17.5 -48.27 Pass- 1/2 5.6 -5.0 -2.0 -3.56 Pass- 3/8 5.8 -1.3 0.3 -0.40 Pass- 1/4 6.0 -0.6 0.3 0.06 Pass- 1/8 6.1 -0.4 0.3 0.02 Pass0 6.3 -0.3 0.3 0.01 Pass1/8 6.5 -0.4 0.3 0.00 Pass1/4 6.7 -0.6 0.3 -0.01 Pass3/8 6.9 -1.3 0.3 -0.24 Pass1/2 7.1 -5.0 -2.0 -2.70 Pass
1 8.2 N/A -17.5 -42.64 Pass2 11.9 N/A -42.0 -51.43 Pass3 19.3 N/A -61.0 N/A N/A4 34.0 N/A -70.0 N/A N/A
1/3 Octave - 6.3 HzTolerance (dB)
Pass/Fail
The attenuation of the filter at the given frequencies shall be within the stated tolerance. The frequencies arecalculated as octaves from the center frequency. The factors defined by IEC 61260 (Table 1) are: ±4, ±3, ±2, ±1,±1/2, ±3/8, ±1/4, ±1/8 and 0.Octaves from Center Frequency: the difference, in octaves, between the selected center frequency and thecurrent input frequencyInput Frequency: the input frequency to the filterTolerance: the acceptable range for what the filter should indicate according to IEC 61260Data Found: the level the sound level meter indicates
Relative Attenuation (IEC 61260 § 5.3)
Relative Attenuation
-120-110-100-90-80-70-60-50-40-30-20-10
0
-4 -3 -2 -1 - 1/2 - 3/8 - 1/4 - 1/8 0 1/8 1/4 3/8 1/2 1 2 3 4
Octaves from Center Frequency
Res
pons
e (d
B)
Minimum Tolerance
Maximum Tolerance
Data Found
Relative Attenuation (Detail)
-6
-4
-2
0
-4 -3 -2 -1 - 1/2 - 3/8 - 1/4 - 1/8 0 1/8 1/4 3/8 1/2 1 2 3 4
Octaves from Center Frequency
Res
pons
e (d
B)
Minimum Tolerance
Maximum Tolerance
Data Found
Page 29 of 64

Calibration Data for831# XXXID# N/A
Odin Metrology, Inc. Odin Metrology, Inc.Report# N/A
March 31, 2011
Octaves from Input DataCenter Freq. Freq. (Hz) Minimum Maximum Found (dB)
-4 1.5 N/A -70.0 N/A N/A-3 2.6 N/A -61.0 N/A N/A-2 4.2 N/A -42.0 -81.64 Pass-1 6.1 N/A -17.5 -64.30 Pass- 1/2 7.1 -5.0 -2.0 -3.14 Pass- 3/8 7.3 -1.3 0.3 -0.41 Pass- 1/4 7.5 -0.6 0.3 -0.01 Pass- 1/8 7.7 -0.4 0.3 -0.02 Pass0 7.9 -0.3 0.3 0.00 Pass1/8 8.2 -0.4 0.3 0.02 Pass1/4 8.4 -0.6 0.3 0.03 Pass3/8 8.6 -1.3 0.3 -0.18 Pass1/2 8.9 -5.0 -2.0 -2.88 Pass
1 10.3 N/A -17.5 -67.91 Pass2 14.9 N/A -42.0 -77.89 Pass3 24.3 N/A -61.0 N/A N/A4 42.8 N/A -70.0 N/A N/A
Relative Attenuation (IEC 61260 § 5.3)The attenuation of the filter at the given frequencies shall be within the stated tolerance. The frequencies arecalculated as octaves from the center frequency. The factors defined by IEC 61260 (Table 1) are: ±4, ±3, ±2, ±1,±1/2, ±3/8, ±1/4, ±1/8 and 0.Octaves from Center Frequency: the difference, in octaves, between the selected center frequency and thecurrent input frequencyInput Frequency: the input frequency to the filterTolerance: the acceptable range for what the filter should indicate according to IEC 61260Data Found: the level the sound level meter indicates
1/3 Octave - 8 HzTolerance (dB)
Pass/Fail
Relative Attenuation
-120-110-100-90-80-70-60-50-40-30-20-10
0
-4 -3 -2 -1 - 1/2 - 3/8 - 1/4 - 1/8 0 1/8 1/4 3/8 1/2 1 2 3 4
Octaves from Center Frequency
Res
pons
e (d
B)
Minimum Tolerance
Maximum Tolerance
Data Found
Relative Attenuation (Detail)
-6
-4
-2
0
-4 -3 -2 -1 - 1/2 - 3/8 - 1/4 - 1/8 0 1/8 1/4 3/8 1/2 1 2 3 4
Octaves from Center Frequency
Res
pons
e (d
B)
Minimum Tolerance
Maximum Tolerance
Data Found
Page 30 of 64

Calibration Data for831# XXXID# N/A
Odin Metrology, Inc. Odin Metrology, Inc.Report# N/A
March 31, 2011
Octaves from Input DataCenter Freq. Freq. (Hz) Minimum Maximum Found (dB)
-4 1.9 N/A -70.0 N/A N/A-3 3.3 N/A -61.0 N/A N/A-2 5.3 N/A -42.0 -95.28 Pass-1 7.7 N/A -17.5 -76.47 Pass- 1/2 8.9 -5.0 -2.0 -3.04 Pass- 3/8 9.2 -1.3 0.3 -0.42 Pass- 1/4 9.5 -0.6 0.3 -0.01 Pass- 1/8 9.7 -0.4 0.3 -0.03 Pass0 10.0 -0.3 0.3 0.00 Pass1/8 10.3 -0.4 0.3 0.01 Pass1/4 10.6 -0.6 0.3 0.01 Pass3/8 10.9 -1.3 0.3 -0.18 Pass1/2 11.2 -5.0 -2.0 -2.88 Pass
1 12.9 N/A -17.5 -95.29 Pass2 18.8 N/A -42.0 -107.32 Pass3 30.5 N/A -61.0 N/A N/A4 53.9 N/A -70.0 N/A N/A
1/3 Octave - 10 Hz
Input Frequency: the input frequency to the filterTolerance: the acceptable range for what the filter should indicate according to IEC 61260Data Found: the level the sound level meter indicates
Relative Attenuation (IEC 61260 § 5.3)
Tolerance (dB)Pass/Fail
Octaves from Center Frequency: the difference, in octaves, between the selected center frequency and thecurrent input frequency
The attenuation of the filter at the given frequencies shall be within the stated tolerance. The frequencies arecalculated as octaves from the center frequency. The factors defined by IEC 61260 (Table 1) are: ±4, ±3, ±2, ±1,±1/2, ±3/8, ±1/4, ±1/8 and 0.
Relative Attenuation
-120-110-100-90-80-70-60-50-40-30-20-10
0
-4 -3 -2 -1 - 1/2 - 3/8 - 1/4 - 1/8 0 1/8 1/4 3/8 1/2 1 2 3 4
Octaves from Center Frequency
Res
pons
e (d
B)
Minimum Tolerance
Maximum Tolerance
Data Found
Relative Attenuation (Detail)
-6
-4
-2
0
-4 -3 -2 -1 - 1/2 - 3/8 - 1/4 - 1/8 0 1/8 1/4 3/8 1/2 1 2 3 4
Octaves from Center Frequency
Res
pons
e (d
B)
Minimum Tolerance
Maximum Tolerance
Data Found
Page 31 of 64

Calibration Data for831# XXXID# N/A
Odin Metrology, Inc. Odin Metrology, Inc.Report# N/A
March 31, 2011
Octaves from Input DataCenter Freq. Freq. (Hz) Minimum Maximum Found (dB)
-4 2.3 N/A -70.0 -101.63 Pass-3 4.1 N/A -61.0 -86.29 Pass-2 6.7 N/A -42.0 -91.97 Pass-1 9.7 N/A -17.5 -76.29 Pass- 1/2 11.2 -5.0 -2.0 -2.99 Pass- 3/8 11.6 -1.3 0.3 -0.41 Pass- 1/4 11.9 -0.6 0.3 0.01 Pass- 1/8 12.3 -0.4 0.3 0.02 Pass0 12.6 -0.3 0.3 0.00 Pass1/8 12.9 -0.4 0.3 0.02 Pass1/4 13.3 -0.6 0.3 0.04 Pass3/8 13.7 -1.3 0.3 -0.19 Pass1/2 14.1 -5.0 -2.0 -2.88 Pass
1 16.3 N/A -17.5 -96.06 Pass2 23.7 N/A -42.0 -110.71 Pass3 38.4 N/A -61.0 -111.09 Pass4 67.9 N/A -70.0 -109.99 Pass
Data Found: the level the sound level meter indicates1/3 Octave - 12.5 Hz
Tolerance (dB)Pass/Fail
The attenuation of the filter at the given frequencies shall be within the stated tolerance. The frequencies arecalculated as octaves from the center frequency. The factors defined by IEC 61260 (Table 1) are: ±4, ±3, ±2, ±1,±1/2, ±3/8, ±1/4, ±1/8 and 0.Octaves from Center Frequency: the difference, in octaves, between the selected center frequency and thecurrent input frequencyInput Frequency: the input frequency to the filterTolerance: the acceptable range for what the filter should indicate according to IEC 61260
Relative Attenuation (IEC 61260 § 5.3)
Relative Attenuation
-120-110-100-90-80-70-60-50-40-30-20-10
0
-4 -3 -2 -1 - 1/2 - 3/8 - 1/4 - 1/8 0 1/8 1/4 3/8 1/2 1 2 3 4
Octaves from Center Frequency
Res
pons
e (d
B)
Minimum Tolerance
Maximum Tolerance
Data Found
Relative Attenuation (Detail)
-6
-4
-2
0
-4 -3 -2 -1 - 1/2 - 3/8 - 1/4 - 1/8 0 1/8 1/4 3/8 1/2 1 2 3 4
Octaves from Center Frequency
Res
pons
e (d
B)
Minimum Tolerance
Maximum Tolerance
Data Found
Page 32 of 64

Calibration Data for831# XXXID# N/A
Odin Metrology, Inc. Odin Metrology, Inc.Report# N/A
March 31, 2011
Octaves from Input DataCenter Freq. Freq. (Hz) Minimum Maximum Found (dB)
-4 2.9 N/A -70.0 -105.48 Pass-3 5.2 N/A -61.0 -87.71 Pass-2 8.4 N/A -42.0 -90.46 Pass-1 12.2 N/A -17.5 -76.11 Pass- 1/2 14.1 -5.0 -2.0 -3.03 Pass- 3/8 14.6 -1.3 0.3 -0.42 Pass- 1/4 15.0 -0.6 0.3 -0.02 Pass- 1/8 15.4 -0.4 0.3 -0.01 Pass0 15.8 -0.3 0.3 0.00 Pass1/8 16.3 -0.4 0.3 -0.02 Pass1/4 16.7 -0.6 0.3 0.00 Pass3/8 17.2 -1.3 0.3 -0.20 Pass1/2 17.8 -5.0 -2.0 -2.95 Pass
1 20.5 N/A -17.5 -95.94 Pass2 29.8 N/A -42.0 -112.79 Pass3 48.4 N/A -61.0 -111.49 Pass4 85.5 N/A -70.0 -111.34 Pass
Data Found: the level the sound level meter indicates1/3 Octave - 16 Hz
Tolerance (dB)Pass/Fail
The attenuation of the filter at the given frequencies shall be within the stated tolerance. The frequencies arecalculated as octaves from the center frequency. The factors defined by IEC 61260 (Table 1) are: ±4, ±3, ±2, ±1,±1/2, ±3/8, ±1/4, ±1/8 and 0.Octaves from Center Frequency: the difference, in octaves, between the selected center frequency and thecurrent input frequencyInput Frequency: the input frequency to the filterTolerance: the acceptable range for what the filter should indicate according to IEC 61260
Relative Attenuation (IEC 61260 § 5.3)
Relative Attenuation
-120-110-100-90-80-70-60-50-40-30-20-10
0
-4 -3 -2 -1 - 1/2 - 3/8 - 1/4 - 1/8 0 1/8 1/4 3/8 1/2 1 2 3 4
Octaves from Center Frequency
Res
pons
e (d
B)
Minimum Tolerance
Maximum Tolerance
Data Found
Relative Attenuation (Detail)
-6
-4
-2
0
-4 -3 -2 -1 - 1/2 - 3/8 - 1/4 - 1/8 0 1/8 1/4 3/8 1/2 1 2 3 4
Octaves from Center Frequency
Res
pons
e (d
B)
Minimum Tolerance
Maximum Tolerance
Data Found
Page 33 of 64

Calibration Data for831# XXXID# N/A
Odin Metrology, Inc. Odin Metrology, Inc.Report# N/A
March 31, 2011
Octaves from Input DataCenter Freq. Freq. (Hz) Minimum Maximum Found (dB)
-4 3.7 N/A -70.0 -99.75 Pass-3 6.5 N/A -61.0 -87.07 Pass-2 10.6 N/A -42.0 -88.90 Pass-1 15.4 N/A -17.5 -76.44 Pass- 1/2 17.8 -5.0 -2.0 -3.02 Pass- 3/8 18.3 -1.3 0.3 -0.40 Pass- 1/4 18.9 -0.6 0.3 0.03 Pass- 1/8 19.4 -0.4 0.3 0.01 Pass0 20.0 -0.3 0.3 0.00 Pass1/8 20.5 -0.4 0.3 0.02 Pass1/4 21.1 -0.6 0.3 0.02 Pass3/8 21.7 -1.3 0.3 -0.18 Pass1/2 22.4 -5.0 -2.0 -2.91 Pass
1 25.8 N/A -17.5 -97.12 Pass2 37.5 N/A -42.0 -110.60 Pass3 60.9 N/A -61.0 -109.19 Pass4 107.6 N/A -70.0 -108.59 Pass
Input Frequency: the input frequency to the filterTolerance: the acceptable range for what the filter should indicate according to IEC 61260
Relative Attenuation (IEC 61260 § 5.3)
Data Found: the level the sound level meter indicates1/3 Octave - 20 Hz
Tolerance (dB)Pass/Fail
The attenuation of the filter at the given frequencies shall be within the stated tolerance. The frequencies arecalculated as octaves from the center frequency. The factors defined by IEC 61260 (Table 1) are: ±4, ±3, ±2, ±1,±1/2, ±3/8, ±1/4, ±1/8 and 0.Octaves from Center Frequency: the difference, in octaves, between the selected center frequency and thecurrent input frequency
Relative Attenuation
-120-110-100-90-80-70-60-50-40-30-20-10
0
-4 -3 -2 -1 - 1/2 - 3/8 - 1/4 - 1/8 0 1/8 1/4 3/8 1/2 1 2 3 4
Octaves from Center Frequency
Res
pons
e (d
B)
Minimum Tolerance
Maximum Tolerance
Data Found
Relative Attenuation (Detail)
-6
-4
-2
0
-4 -3 -2 -1 - 1/2 - 3/8 - 1/4 - 1/8 0 1/8 1/4 3/8 1/2 1 2 3 4
Octaves from Center Frequency
Res
pons
e (d
B)
Minimum Tolerance
Maximum Tolerance
Data Found
Page 34 of 64
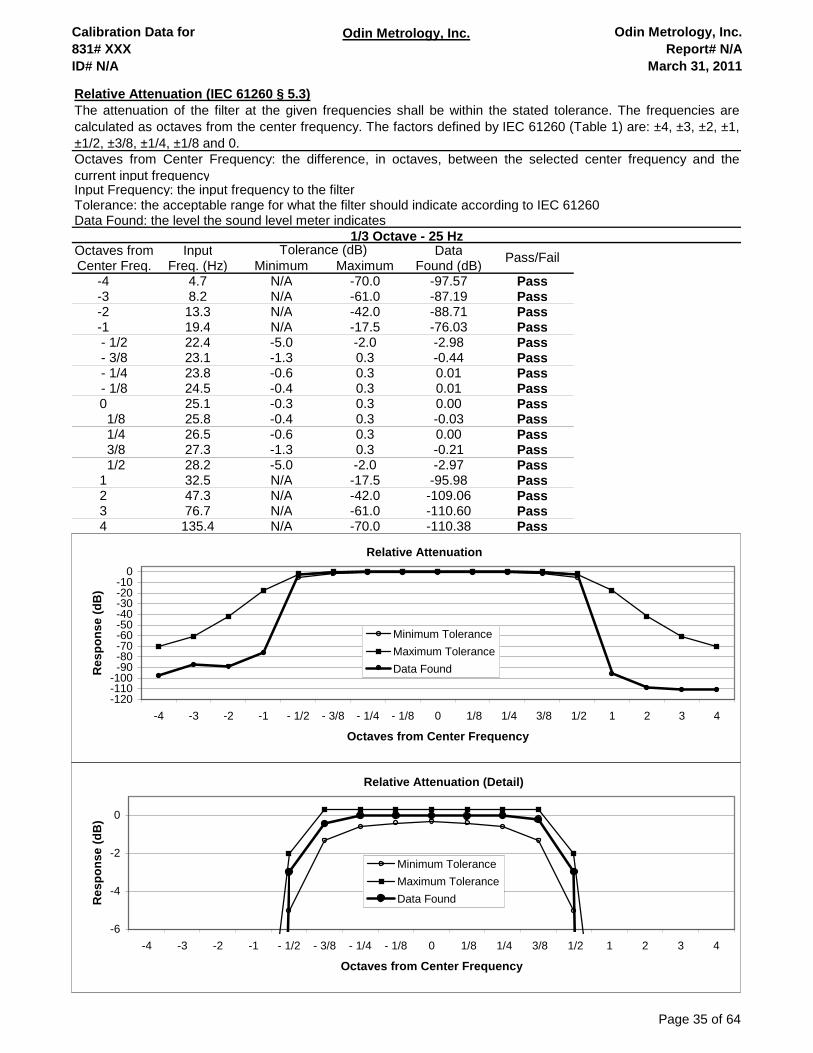
Calibration Data for831# XXXID# N/A
Odin Metrology, Inc. Odin Metrology, Inc.Report# N/A
March 31, 2011
Octaves from Input DataCenter Freq. Freq. (Hz) Minimum Maximum Found (dB)
-4 4.7 N/A -70.0 -97.57 Pass-3 8.2 N/A -61.0 -87.19 Pass-2 13.3 N/A -42.0 -88.71 Pass-1 19.4 N/A -17.5 -76.03 Pass- 1/2 22.4 -5.0 -2.0 -2.98 Pass- 3/8 23.1 -1.3 0.3 -0.44 Pass- 1/4 23.8 -0.6 0.3 0.01 Pass- 1/8 24.5 -0.4 0.3 0.01 Pass0 25.1 -0.3 0.3 0.00 Pass1/8 25.8 -0.4 0.3 -0.03 Pass1/4 26.5 -0.6 0.3 0.00 Pass3/8 27.3 -1.3 0.3 -0.21 Pass1/2 28.2 -5.0 -2.0 -2.97 Pass
1 32.5 N/A -17.5 -95.98 Pass2 47.3 N/A -42.0 -109.06 Pass3 76.7 N/A -61.0 -110.60 Pass4 135.4 N/A -70.0 -110.38 Pass
The attenuation of the filter at the given frequencies shall be within the stated tolerance. The frequencies arecalculated as octaves from the center frequency. The factors defined by IEC 61260 (Table 1) are: ±4, ±3, ±2, ±1,±1/2, ±3/8, ±1/4, ±1/8 and 0.Octaves from Center Frequency: the difference, in octaves, between the selected center frequency and thecurrent input frequencyInput Frequency: the input frequency to the filterTolerance: the acceptable range for what the filter should indicate according to IEC 61260Data Found: the level the sound level meter indicates
1/3 Octave - 25 HzTolerance (dB)
Pass/Fail
Relative Attenuation (IEC 61260 § 5.3)
Relative Attenuation
-120-110-100-90-80-70-60-50-40-30-20-10
0
-4 -3 -2 -1 - 1/2 - 3/8 - 1/4 - 1/8 0 1/8 1/4 3/8 1/2 1 2 3 4
Octaves from Center Frequency
Res
pons
e (d
B)
Minimum Tolerance
Maximum Tolerance
Data Found
Relative Attenuation (Detail)
-6
-4
-2
0
-4 -3 -2 -1 - 1/2 - 3/8 - 1/4 - 1/8 0 1/8 1/4 3/8 1/2 1 2 3 4
Octaves from Center Frequency
Res
pons
e (d
B)
Minimum Tolerance
Maximum Tolerance
Data Found
Page 35 of 64

Calibration Data for831# XXXID# N/A
Odin Metrology, Inc. Odin Metrology, Inc.Report# N/A
March 31, 2011
Octaves from Input DataCenter Freq. Freq. (Hz) Minimum Maximum Found (dB)
-4 5.9 N/A -70.0 -95.60 Pass-3 10.4 N/A -61.0 -86.97 Pass-2 16.8 N/A -42.0 -90.62 Pass-1 24.4 N/A -17.5 -75.90 Pass- 1/2 28.2 -5.0 -2.0 -3.08 Pass- 3/8 29.1 -1.3 0.3 -0.47 Pass- 1/4 30.0 -0.6 0.3 -0.10 Pass- 1/8 30.8 -0.4 0.3 -0.08 Pass0 31.6 -0.3 0.3 0.00 Pass1/8 32.5 -0.4 0.3 -0.02 Pass1/4 33.4 -0.6 0.3 -0.01 Pass3/8 34.4 -1.3 0.3 -0.20 Pass1/2 35.5 -5.0 -2.0 -2.98 Pass
1 40.9 N/A -17.5 -95.82 Pass2 59.5 N/A -42.0 -109.54 Pass3 96.6 N/A -61.0 -109.27 Pass4 170.5 N/A -70.0 -109.94 Pass
The attenuation of the filter at the given frequencies shall be within the stated tolerance. The frequencies arecalculated as octaves from the center frequency. The factors defined by IEC 61260 (Table 1) are: ±4, ±3, ±2, ±1,±1/2, ±3/8, ±1/4, ±1/8 and 0.Octaves from Center Frequency: the difference, in octaves, between the selected center frequency and thecurrent input frequencyInput Frequency: the input frequency to the filterTolerance: the acceptable range for what the filter should indicate according to IEC 61260Data Found: the level the sound level meter indicates
1/3 Octave - 31.5 HzTolerance (dB)
Pass/Fail
Relative Attenuation (IEC 61260 § 5.3)
Relative Attenuation
-120-110-100-90-80-70-60-50-40-30-20-10
0
-4 -3 -2 -1 - 1/2 - 3/8 - 1/4 - 1/8 0 1/8 1/4 3/8 1/2 1 2 3 4
Octaves from Center Frequency
Res
pons
e (d
B)
Minimum Tolerance
Maximum Tolerance
Data Found
Relative Attenuation (Detail)
-6
-4
-2
0
-4 -3 -2 -1 - 1/2 - 3/8 - 1/4 - 1/8 0 1/8 1/4 3/8 1/2 1 2 3 4
Octaves from Center Frequency
Res
pons
e (d
B)
Minimum Tolerance
Maximum Tolerance
Data Found
Page 36 of 64

Calibration Data for831# XXXID# N/A
Odin Metrology, Inc. Odin Metrology, Inc.Report# N/A
March 31, 2011
Octaves from Input DataCenter Freq. Freq. (Hz) Minimum Maximum Found (dB)
-4 7.4 N/A -70.0 -96.14 Pass-3 13.0 N/A -61.0 -86.93 Pass-2 21.2 N/A -42.0 -87.27 Pass-1 30.8 N/A -17.5 -76.28 Pass- 1/2 35.5 -5.0 -2.0 -3.02 Pass- 3/8 36.6 -1.3 0.3 -0.40 Pass- 1/4 37.7 -0.6 0.3 -0.01 Pass- 1/8 38.8 -0.4 0.3 -0.03 Pass0 39.8 -0.3 0.3 0.00 Pass1/8 40.9 -0.4 0.3 0.01 Pass1/4 42.0 -0.6 0.3 0.00 Pass3/8 43.3 -1.3 0.3 -0.20 Pass1/2 44.7 -5.0 -2.0 -2.93 Pass
1 51.5 N/A -17.5 -96.48 Pass2 74.9 N/A -42.0 -112.09 Pass3 121.6 N/A -61.0 -109.41 Pass4 214.7 N/A -70.0 -110.16 Pass
The attenuation of the filter at the given frequencies shall be within the stated tolerance. The frequencies arecalculated as octaves from the center frequency. The factors defined by IEC 61260 (Table 1) are: ±4, ±3, ±2, ±1,±1/2, ±3/8, ±1/4, ±1/8 and 0.Octaves from Center Frequency: the difference, in octaves, between the selected center frequency and thecurrent input frequencyInput Frequency: the input frequency to the filterTolerance: the acceptable range for what the filter should indicate according to IEC 61260Data Found: the level the sound level meter indicates
1/3 Octave - 40 HzTolerance (dB)
Pass/Fail
Relative Attenuation (IEC 61260 § 5.3)
Relative Attenuation
-120-110-100-90-80-70-60-50-40-30-20-10
0
-4 -3 -2 -1 - 1/2 - 3/8 - 1/4 - 1/8 0 1/8 1/4 3/8 1/2 1 2 3 4
Octaves from Center Frequency
Res
pons
e (d
B)
Minimum Tolerance
Maximum Tolerance
Data Found
Relative Attenuation (Detail)
-6
-4
-2
0
-4 -3 -2 -1 - 1/2 - 3/8 - 1/4 - 1/8 0 1/8 1/4 3/8 1/2 1 2 3 4
Octaves from Center Frequency
Res
pons
e (d
B)
Minimum Tolerance
Maximum Tolerance
Data Found
Page 37 of 64

Calibration Data for831# XXXID# N/A
Odin Metrology, Inc. Odin Metrology, Inc.Report# N/A
March 31, 2011
Octaves from Input DataCenter Freq. Freq. (Hz) Minimum Maximum Found (dB)
-4 9.3 N/A -70.0 -93.91 Pass-3 16.4 N/A -61.0 -87.12 Pass-2 26.6 N/A -42.0 -88.15 Pass-1 38.7 N/A -17.5 -76.37 Pass- 1/2 44.7 -5.0 -2.0 -2.94 Pass- 3/8 46.1 -1.3 0.3 -0.39 Pass- 1/4 47.5 -0.6 0.3 0.04 Pass- 1/8 48.8 -0.4 0.3 0.02 Pass0 50.1 -0.3 0.3 0.00 Pass1/8 51.5 -0.4 0.3 0.04 Pass1/4 52.9 -0.6 0.3 0.04 Pass3/8 54.5 -1.3 0.3 -0.18 Pass1/2 56.2 -5.0 -2.0 -2.89 Pass
1 64.9 N/A -17.5 -97.21 Pass2 94.3 N/A -42.0 -110.45 Pass3 153.0 N/A -61.0 -108.66 Pass4 270.2 N/A -70.0 -108.30 Pass
Input Frequency: the input frequency to the filterTolerance: the acceptable range for what the filter should indicate according to IEC 61260
Relative Attenuation (IEC 61260 § 5.3)
Data Found: the level the sound level meter indicates1/3 Octave - 50 Hz
Tolerance (dB)Pass/Fail
The attenuation of the filter at the given frequencies shall be within the stated tolerance. The frequencies arecalculated as octaves from the center frequency. The factors defined by IEC 61260 (Table 1) are: ±4, ±3, ±2, ±1,±1/2, ±3/8, ±1/4, ±1/8 and 0.Octaves from Center Frequency: the difference, in octaves, between the selected center frequency and thecurrent input frequency
Relative Attenuation
-120-110-100-90-80-70-60-50-40-30-20-10
0
-4 -3 -2 -1 - 1/2 - 3/8 - 1/4 - 1/8 0 1/8 1/4 3/8 1/2 1 2 3 4
Octaves from Center Frequency
Res
pons
e (d
B)
Minimum Tolerance
Maximum Tolerance
Data Found
Relative Attenuation (Detail)
-6
-4
-2
0
-4 -3 -2 -1 - 1/2 - 3/8 - 1/4 - 1/8 0 1/8 1/4 3/8 1/2 1 2 3 4
Octaves from Center Frequency
Res
pons
e (d
B)
Minimum Tolerance
Maximum Tolerance
Data Found
Page 38 of 64

Calibration Data for831# XXXID# N/A
Odin Metrology, Inc. Odin Metrology, Inc.Report# N/A
March 31, 2011
Octaves from Input DataCenter Freq. Freq. (Hz) Minimum Maximum Found (dB)
-4 11.7 N/A -70.0 -94.57 Pass-3 20.7 N/A -61.0 -86.79 Pass-2 33.5 N/A -42.0 -89.92 Pass-1 48.7 N/A -17.5 -76.31 Pass- 1/2 56.2 -5.0 -2.0 -2.93 Pass- 3/8 58.0 -1.3 0.3 -0.36 Pass- 1/4 59.8 -0.6 0.3 0.03 Pass- 1/8 61.5 -0.4 0.3 0.04 Pass0 63.1 -0.3 0.3 0.00 Pass1/8 64.8 -0.4 0.3 0.03 Pass1/4 66.6 -0.6 0.3 0.05 Pass3/8 68.6 -1.3 0.3 -0.15 Pass1/2 70.8 -5.0 -2.0 -2.91 Pass
1 81.7 N/A -17.5 -96.47 Pass2 118.7 N/A -42.0 -106.17 Pass3 192.7 N/A -61.0 -107.88 Pass4 340.2 N/A -70.0 -107.62 Pass
The attenuation of the filter at the given frequencies shall be within the stated tolerance. The frequencies arecalculated as octaves from the center frequency. The factors defined by IEC 61260 (Table 1) are: ±4, ±3, ±2, ±1,±1/2, ±3/8, ±1/4, ±1/8 and 0.Octaves from Center Frequency: the difference, in octaves, between the selected center frequency and thecurrent input frequencyInput Frequency: the input frequency to the filterTolerance: the acceptable range for what the filter should indicate according to IEC 61260Data Found: the level the sound level meter indicates
1/3 Octave - 63 HzTolerance (dB)
Pass/Fail
Relative Attenuation (IEC 61260 § 5.3)
Relative Attenuation
-120-110-100-90-80-70-60-50-40-30-20-10
0
-4 -3 -2 -1 - 1/2 - 3/8 - 1/4 - 1/8 0 1/8 1/4 3/8 1/2 1 2 3 4
Octaves from Center Frequency
Res
pons
e (d
B)
Minimum Tolerance
Maximum Tolerance
Data Found
Relative Attenuation (Detail)
-6
-4
-2
0
-4 -3 -2 -1 - 1/2 - 3/8 - 1/4 - 1/8 0 1/8 1/4 3/8 1/2 1 2 3 4
Octaves from Center Frequency
Res
pons
e (d
B)
Minimum Tolerance
Maximum Tolerance
Data Found
Page 39 of 64

Calibration Data for831# XXXID# N/A
Odin Metrology, Inc. Odin Metrology, Inc.Report# N/A
March 31, 2011
Octaves from Input DataCenter Freq. Freq. (Hz) Minimum Maximum Found (dB)
-4 14.7 N/A -70.0 -94.54 Pass-3 26.0 N/A -61.0 -87.33 Pass-2 42.2 N/A -42.0 -93.07 Pass-1 61.4 N/A -17.5 -76.06 Pass- 1/2 70.8 -5.0 -2.0 -3.00 Pass- 3/8 73.0 -1.3 0.3 -0.39 Pass- 1/4 75.2 -0.6 0.3 -0.01 Pass- 1/8 77.4 -0.4 0.3 -0.01 Pass0 79.4 -0.3 0.3 0.00 Pass1/8 81.6 -0.4 0.3 -0.03 Pass1/4 83.9 -0.6 0.3 0.01 Pass3/8 86.4 -1.3 0.3 -0.18 Pass1/2 89.1 -5.0 -2.0 -2.96 Pass
1 102.8 N/A -17.5 -96.48 Pass2 149.5 N/A -42.0 -107.64 Pass3 242.6 N/A -61.0 -109.69 Pass4 428.3 N/A -70.0 -108.67 Pass
The attenuation of the filter at the given frequencies shall be within the stated tolerance. The frequencies arecalculated as octaves from the center frequency. The factors defined by IEC 61260 (Table 1) are: ±4, ±3, ±2, ±1,±1/2, ±3/8, ±1/4, ±1/8 and 0.Octaves from Center Frequency: the difference, in octaves, between the selected center frequency and thecurrent input frequencyInput Frequency: the input frequency to the filterTolerance: the acceptable range for what the filter should indicate according to IEC 61260Data Found: the level the sound level meter indicates
1/3 Octave - 80 HzTolerance (dB)
Pass/Fail
Relative Attenuation (IEC 61260 § 5.3)
Relative Attenuation
-120-110-100-90-80-70-60-50-40-30-20-10
0
-4 -3 -2 -1 - 1/2 - 3/8 - 1/4 - 1/8 0 1/8 1/4 3/8 1/2 1 2 3 4
Octaves from Center Frequency
Res
pons
e (d
B)
Minimum Tolerance
Maximum Tolerance
Data Found
Relative Attenuation (Detail)
-6
-4
-2
0
-4 -3 -2 -1 - 1/2 - 3/8 - 1/4 - 1/8 0 1/8 1/4 3/8 1/2 1 2 3 4
Octaves from Center Frequency
Res
pons
e (d
B)
Minimum Tolerance
Maximum Tolerance
Data Found
Page 40 of 64

Calibration Data for831# XXXID# N/A
Odin Metrology, Inc. Odin Metrology, Inc.Report# N/A
March 31, 2011
Octaves from Input DataCenter Freq. Freq. (Hz) Minimum Maximum Found (dB)
-4 18.5 N/A -70.0 -94.33 Pass-3 32.7 N/A -61.0 -87.45 Pass-2 53.1 N/A -42.0 -89.58 Pass-1 77.3 N/A -17.5 -76.20 Pass- 1/2 89.1 -5.0 -2.0 -2.98 Pass- 3/8 92.0 -1.3 0.3 -0.39 Pass- 1/4 94.7 -0.6 0.3 0.01 Pass- 1/8 97.4 -0.4 0.3 -0.03 Pass0 100.0 -0.3 0.3 0.00 Pass1/8 102.7 -0.4 0.3 -0.01 Pass1/4 105.6 -0.6 0.3 -0.02 Pass3/8 108.7 -1.3 0.3 -0.17 Pass1/2 112.2 -5.0 -2.0 -2.90 Pass
1 129.4 N/A -17.5 -96.87 Pass2 188.2 N/A -42.0 -108.20 Pass3 305.4 N/A -61.0 -108.09 Pass4 539.2 N/A -70.0 -108.85 Pass
The attenuation of the filter at the given frequencies shall be within the stated tolerance. The frequencies arecalculated as octaves from the center frequency. The factors defined by IEC 61260 (Table 1) are: ±4, ±3, ±2, ±1,±1/2, ±3/8, ±1/4, ±1/8 and 0.Octaves from Center Frequency: the difference, in octaves, between the selected center frequency and thecurrent input frequencyInput Frequency: the input frequency to the filterTolerance: the acceptable range for what the filter should indicate according to IEC 61260Data Found: the level the sound level meter indicates
1/3 Octave - 100 HzTolerance (dB)
Pass/Fail
Relative Attenuation (IEC 61260 § 5.3)
Relative Attenuation
-120-110-100-90-80-70-60-50-40-30-20-10
0
-4 -3 -2 -1 - 1/2 - 3/8 - 1/4 - 1/8 0 1/8 1/4 3/8 1/2 1 2 3 4
Octaves from Center Frequency
Res
pons
e (d
B)
Minimum Tolerance
Maximum Tolerance
Data Found
Relative Attenuation (Detail)
-6
-4
-2
0
-4 -3 -2 -1 - 1/2 - 3/8 - 1/4 - 1/8 0 1/8 1/4 3/8 1/2 1 2 3 4
Octaves from Center Frequency
Res
pons
e (d
B)
Minimum Tolerance
Maximum Tolerance
Data Found
Page 41 of 64

Calibration Data for831# XXXID# N/A
Odin Metrology, Inc. Odin Metrology, Inc.Report# N/A
March 31, 2011
Octaves from Input DataCenter Freq. Freq. (Hz) Minimum Maximum Found (dB)
-4 23.3 N/A -70.0 -94.03 Pass-3 41.2 N/A -61.0 -86.17 Pass-2 66.9 N/A -42.0 -92.62 Pass-1 97.3 N/A -17.5 -76.27 Pass- 1/2 112.2 -5.0 -2.0 -2.96 Pass- 3/8 115.8 -1.3 0.3 -0.40 Pass- 1/4 119.2 -0.6 0.3 0.02 Pass- 1/8 122.6 -0.4 0.3 0.02 Pass0 125.9 -0.3 0.3 0.00 Pass1/8 129.3 -0.4 0.3 0.02 Pass1/4 132.9 -0.6 0.3 0.04 Pass3/8 136.9 -1.3 0.3 -0.19 Pass1/2 141.3 -5.0 -2.0 -2.95 Pass
1 163.0 N/A -17.5 -96.81 Pass2 236.9 N/A -42.0 -107.49 Pass3 384.4 N/A -61.0 -107.11 Pass4 678.8 N/A -70.0 -108.17 Pass
Input Frequency: the input frequency to the filterTolerance: the acceptable range for what the filter should indicate according to IEC 61260
Relative Attenuation (IEC 61260 § 5.3)
Data Found: the level the sound level meter indicates1/3 Octave - 125 Hz
Tolerance (dB)Pass/Fail
The attenuation of the filter at the given frequencies shall be within the stated tolerance. The frequencies arecalculated as octaves from the center frequency. The factors defined by IEC 61260 (Table 1) are: ±4, ±3, ±2, ±1,±1/2, ±3/8, ±1/4, ±1/8 and 0.Octaves from Center Frequency: the difference, in octaves, between the selected center frequency and thecurrent input frequency
Relative Attenuation
-120-110-100-90-80-70-60-50-40-30-20-10
0
-4 -3 -2 -1 - 1/2 - 3/8 - 1/4 - 1/8 0 1/8 1/4 3/8 1/2 1 2 3 4
Octaves from Center Frequency
Res
pons
e (d
B)
Minimum Tolerance
Maximum Tolerance
Data Found
Relative Attenuation (Detail)
-6
-4
-2
0
-4 -3 -2 -1 - 1/2 - 3/8 - 1/4 - 1/8 0 1/8 1/4 3/8 1/2 1 2 3 4
Octaves from Center Frequency
Res
pons
e (d
B)
Minimum Tolerance
Maximum Tolerance
Data Found
Page 42 of 64

Calibration Data for831# XXXID# N/A
Odin Metrology, Inc. Odin Metrology, Inc.Report# N/A
March 31, 2011
Octaves from Input DataCenter Freq. Freq. (Hz) Minimum Maximum Found (dB)
-4 29.4 N/A -70.0 -94.99 Pass-3 51.9 N/A -61.0 -86.94 Pass-2 84.2 N/A -42.0 -90.02 Pass-1 122.4 N/A -17.5 -75.89 Pass- 1/2 141.3 -5.0 -2.0 -3.01 Pass- 3/8 145.7 -1.3 0.3 -0.41 Pass- 1/4 150.1 -0.6 0.3 -0.02 Pass- 1/8 154.4 -0.4 0.3 -0.01 Pass0 158.5 -0.3 0.3 0.00 Pass1/8 162.7 -0.4 0.3 -0.02 Pass1/4 167.3 -0.6 0.3 0.00 Pass3/8 172.4 -1.3 0.3 -0.20 Pass1/2 177.8 -5.0 -2.0 -2.97 Pass
1 205.1 N/A -17.5 -95.71 Pass2 298.2 N/A -42.0 -107.62 Pass3 484.0 N/A -61.0 -107.60 Pass4 854.6 N/A -70.0 -107.64 Pass
The attenuation of the filter at the given frequencies shall be within the stated tolerance. The frequencies arecalculated as octaves from the center frequency. The factors defined by IEC 61260 (Table 1) are: ±4, ±3, ±2, ±1,±1/2, ±3/8, ±1/4, ±1/8 and 0.Octaves from Center Frequency: the difference, in octaves, between the selected center frequency and thecurrent input frequencyInput Frequency: the input frequency to the filterTolerance: the acceptable range for what the filter should indicate according to IEC 61260Data Found: the level the sound level meter indicates
1/3 Octave - 160 HzTolerance (dB)
Pass/Fail
Relative Attenuation (IEC 61260 § 5.3)
Relative Attenuation
-120-110-100-90-80-70-60-50-40-30-20-10
0
-4 -3 -2 -1 - 1/2 - 3/8 - 1/4 - 1/8 0 1/8 1/4 3/8 1/2 1 2 3 4
Octaves from Center Frequency
Res
pons
e (d
B)
Minimum Tolerance
Maximum Tolerance
Data Found
Relative Attenuation (Detail)
-6
-4
-2
0
-4 -3 -2 -1 - 1/2 - 3/8 - 1/4 - 1/8 0 1/8 1/4 3/8 1/2 1 2 3 4
Octaves from Center Frequency
Res
pons
e (d
B)
Minimum Tolerance
Maximum Tolerance
Data Found
Page 43 of 64

Calibration Data for831# XXXID# N/A
Odin Metrology, Inc. Odin Metrology, Inc.Report# N/A
March 31, 2011
Octaves from Input DataCenter Freq. Freq. (Hz) Minimum Maximum Found (dB)
-4 37.0 N/A -70.0 -92.28 Pass-3 65.3 N/A -61.0 -86.04 Pass-2 106.0 N/A -42.0 -90.61 Pass-1 154.1 N/A -17.5 -76.30 Pass- 1/2 177.8 -5.0 -2.0 -2.96 Pass- 3/8 183.5 -1.3 0.3 -0.39 Pass- 1/4 189.0 -0.6 0.3 0.02 Pass- 1/8 194.3 -0.4 0.3 0.01 Pass0 199.5 -0.3 0.3 0.00 Pass1/8 204.8 -0.4 0.3 0.03 Pass1/4 210.7 -0.6 0.3 0.02 Pass3/8 217.0 -1.3 0.3 -0.18 Pass1/2 223.9 -5.0 -2.0 -2.90 Pass
1 258.3 N/A -17.5 -96.69 Pass2 375.5 N/A -42.0 -106.64 Pass3 609.3 N/A -61.0 -107.38 Pass4 1,075.8 N/A -70.0 -106.59 Pass
The attenuation of the filter at the given frequencies shall be within the stated tolerance. The frequencies arecalculated as octaves from the center frequency. The factors defined by IEC 61260 (Table 1) are: ±4, ±3, ±2, ±1,±1/2, ±3/8, ±1/4, ±1/8 and 0.Octaves from Center Frequency: the difference, in octaves, between the selected center frequency and thecurrent input frequencyInput Frequency: the input frequency to the filterTolerance: the acceptable range for what the filter should indicate according to IEC 61260Data Found: the level the sound level meter indicates
1/3 Octave - 200 HzTolerance (dB)
Pass/Fail
Relative Attenuation (IEC 61260 § 5.3)
Relative Attenuation
-120-110-100-90-80-70-60-50-40-30-20-10
0
-4 -3 -2 -1 - 1/2 - 3/8 - 1/4 - 1/8 0 1/8 1/4 3/8 1/2 1 2 3 4
Octaves from Center Frequency
Res
pons
e (d
B)
Minimum Tolerance
Maximum Tolerance
Data Found
Relative Attenuation (Detail)
-6
-4
-2
0
-4 -3 -2 -1 - 1/2 - 3/8 - 1/4 - 1/8 0 1/8 1/4 3/8 1/2 1 2 3 4
Octaves from Center Frequency
Res
pons
e (d
B)
Minimum Tolerance
Maximum Tolerance
Data Found
Page 44 of 64

Calibration Data for831# XXXID# N/A
Odin Metrology, Inc. Odin Metrology, Inc.Report# N/A
March 31, 2011
Octaves from Input DataCenter Freq. Freq. (Hz) Minimum Maximum Found (dB)
-4 46.6 N/A -70.0 -92.84 Pass-3 82.3 N/A -61.0 -86.10 Pass-2 133.5 N/A -42.0 -89.30 Pass-1 194.1 N/A -17.5 -75.92 Pass- 1/2 223.9 -5.0 -2.0 -2.94 Pass- 3/8 231.0 -1.3 0.3 -0.39 Pass- 1/4 237.9 -0.6 0.3 -0.01 Pass- 1/8 244.7 -0.4 0.3 0.01 Pass0 251.2 -0.3 0.3 0.00 Pass1/8 257.9 -0.4 0.3 -0.03 Pass1/4 265.2 -0.6 0.3 0.01 Pass3/8 273.2 -1.3 0.3 -0.21 Pass1/2 281.8 -5.0 -2.0 -2.97 Pass
1 325.1 N/A -17.5 -96.03 Pass2 472.7 N/A -42.0 -105.93 Pass3 767.0 N/A -61.0 -106.56 Pass4 1,354.4 N/A -70.0 -105.65 Pass
The attenuation of the filter at the given frequencies shall be within the stated tolerance. The frequencies arecalculated as octaves from the center frequency. The factors defined by IEC 61260 (Table 1) are: ±4, ±3, ±2, ±1,±1/2, ±3/8, ±1/4, ±1/8 and 0.Octaves from Center Frequency: the difference, in octaves, between the selected center frequency and thecurrent input frequencyInput Frequency: the input frequency to the filterTolerance: the acceptable range for what the filter should indicate according to IEC 61260Data Found: the level the sound level meter indicates
1/3 Octave - 250 HzTolerance (dB)
Pass/Fail
Relative Attenuation (IEC 61260 § 5.3)
Relative Attenuation
-120-110-100-90-80-70-60-50-40-30-20-10
0
-4 -3 -2 -1 - 1/2 - 3/8 - 1/4 - 1/8 0 1/8 1/4 3/8 1/2 1 2 3 4
Octaves from Center Frequency
Res
pons
e (d
B)
Minimum Tolerance
Maximum Tolerance
Data Found
Relative Attenuation (Detail)
-6
-4
-2
0
-4 -3 -2 -1 - 1/2 - 3/8 - 1/4 - 1/8 0 1/8 1/4 3/8 1/2 1 2 3 4
Octaves from Center Frequency
Res
pons
e (d
B)
Minimum Tolerance
Maximum Tolerance
Data Found
Page 45 of 64

Calibration Data for831# XXXID# N/A
Odin Metrology, Inc. Odin Metrology, Inc.Report# N/A
March 31, 2011
Octaves from Input DataCenter Freq. Freq. (Hz) Minimum Maximum Found (dB)
-4 58.6 N/A -70.0 -92.44 Pass-3 103.6 N/A -61.0 -85.66 Pass-2 168.1 N/A -42.0 -90.09 Pass-1 244.3 N/A -17.5 -75.87 Pass- 1/2 281.8 -5.0 -2.0 -3.04 Pass- 3/8 290.8 -1.3 0.3 -0.43 Pass- 1/4 299.5 -0.6 0.3 -0.06 Pass- 1/8 308.0 -0.4 0.3 -0.04 Pass0 316.2 -0.3 0.3 0.00 Pass1/8 324.7 -0.4 0.3 -0.02 Pass1/4 333.9 -0.6 0.3 0.00 Pass3/8 343.9 -1.3 0.3 -0.20 Pass1/2 354.8 -5.0 -2.0 -2.98 Pass
1 409.3 N/A -17.5 -95.45 Pass2 595.1 N/A -42.0 -104.71 Pass3 965.6 N/A -61.0 -103.87 Pass4 1,705.1 N/A -70.0 -105.17 Pass
Input Frequency: the input frequency to the filterTolerance: the acceptable range for what the filter should indicate according to IEC 61260
Relative Attenuation (IEC 61260 § 5.3)
Data Found: the level the sound level meter indicates1/3 Octave - 315 Hz
Tolerance (dB)Pass/Fail
The attenuation of the filter at the given frequencies shall be within the stated tolerance. The frequencies arecalculated as octaves from the center frequency. The factors defined by IEC 61260 (Table 1) are: ±4, ±3, ±2, ±1,±1/2, ±3/8, ±1/4, ±1/8 and 0.Octaves from Center Frequency: the difference, in octaves, between the selected center frequency and thecurrent input frequency
Relative Attenuation
-120-110-100-90-80-70-60-50-40-30-20-10
0
-4 -3 -2 -1 - 1/2 - 3/8 - 1/4 - 1/8 0 1/8 1/4 3/8 1/2 1 2 3 4
Octaves from Center Frequency
Res
pons
e (d
B)
Minimum Tolerance
Maximum Tolerance
Data Found
Relative Attenuation (Detail)
-6
-4
-2
0
-4 -3 -2 -1 - 1/2 - 3/8 - 1/4 - 1/8 0 1/8 1/4 3/8 1/2 1 2 3 4
Octaves from Center Frequency
Res
pons
e (d
B)
Minimum Tolerance
Maximum Tolerance
Data Found
Page 46 of 64

Calibration Data for831# XXXID# N/A
Odin Metrology, Inc. Odin Metrology, Inc.Report# N/A
March 31, 2011
Octaves from Input DataCenter Freq. Freq. (Hz) Minimum Maximum Found (dB)
-4 73.8 N/A -70.0 -91.32 Pass-3 130.4 N/A -61.0 -84.63 Pass-2 211.6 N/A -42.0 -88.89 Pass-1 307.6 N/A -17.5 -76.19 Pass- 1/2 354.8 -5.0 -2.0 -2.98 Pass- 3/8 366.1 -1.3 0.3 -0.36 Pass- 1/4 377.1 -0.6 0.3 0.03 Pass- 1/8 387.8 -0.4 0.3 0.02 Pass0 398.1 -0.3 0.3 0.00 Pass1/8 408.7 -0.4 0.3 0.01 Pass1/4 420.3 -0.6 0.3 0.01 Pass3/8 432.9 -1.3 0.3 -0.19 Pass1/2 446.7 -5.0 -2.0 -2.92 Pass
1 515.3 N/A -17.5 -96.16 Pass2 749.1 N/A -42.0 -103.36 Pass3 1,215.7 N/A -61.0 -104.14 Pass4 2,146.6 N/A -70.0 -103.72 Pass
The attenuation of the filter at the given frequencies shall be within the stated tolerance. The frequencies arecalculated as octaves from the center frequency. The factors defined by IEC 61260 (Table 1) are: ±4, ±3, ±2, ±1,±1/2, ±3/8, ±1/4, ±1/8 and 0.Octaves from Center Frequency: the difference, in octaves, between the selected center frequency and thecurrent input frequencyInput Frequency: the input frequency to the filterTolerance: the acceptable range for what the filter should indicate according to IEC 61260Data Found: the level the sound level meter indicates
1/3 Octave - 400 HzTolerance (dB)
Pass/Fail
Relative Attenuation (IEC 61260 § 5.3)
Relative Attenuation
-120-110-100-90-80-70-60-50-40-30-20-10
0
-4 -3 -2 -1 - 1/2 - 3/8 - 1/4 - 1/8 0 1/8 1/4 3/8 1/2 1 2 3 4
Octaves from Center Frequency
Res
pons
e (d
B)
Minimum Tolerance
Maximum Tolerance
Data Found
Relative Attenuation (Detail)
-6
-4
-2
0
-4 -3 -2 -1 - 1/2 - 3/8 - 1/4 - 1/8 0 1/8 1/4 3/8 1/2 1 2 3 4
Octaves from Center Frequency
Res
pons
e (d
B)
Minimum Tolerance
Maximum Tolerance
Data Found
Page 47 of 64

Calibration Data for831# XXXID# N/A
Odin Metrology, Inc. Odin Metrology, Inc.Report# N/A
March 31, 2011
Octaves from Input DataCenter Freq. Freq. (Hz) Minimum Maximum Found (dB)
-4 93.0 N/A -70.0 -91.11 Pass-3 164.1 N/A -61.0 -85.07 Pass-2 266.3 N/A -42.0 -88.41 Pass-1 387.2 N/A -17.5 -76.34 Pass- 1/2 446.7 -5.0 -2.0 -2.95 Pass- 3/8 460.9 -1.3 0.3 -0.40 Pass- 1/4 474.7 -0.6 0.3 0.02 Pass- 1/8 488.2 -0.4 0.3 0.01 Pass0 501.2 -0.3 0.3 0.00 Pass1/8 514.6 -0.4 0.3 0.00 Pass1/4 529.1 -0.6 0.3 0.01 Pass3/8 545.0 -1.3 0.3 -0.21 Pass1/2 562.3 -5.0 -2.0 -2.92 Pass
1 648.7 N/A -17.5 -96.57 Pass2 943.1 N/A -42.0 -102.93 Pass3 1,530.5 N/A -61.0 -103.91 Pass4 2,702.4 N/A -70.0 -103.15 Pass
The attenuation of the filter at the given frequencies shall be within the stated tolerance. The frequencies arecalculated as octaves from the center frequency. The factors defined by IEC 61260 (Table 1) are: ±4, ±3, ±2, ±1,±1/2, ±3/8, ±1/4, ±1/8 and 0.Octaves from Center Frequency: the difference, in octaves, between the selected center frequency and thecurrent input frequencyInput Frequency: the input frequency to the filterTolerance: the acceptable range for what the filter should indicate according to IEC 61260Data Found: the level the sound level meter indicates
1/3 Octave - 500 HzTolerance (dB)
Pass/Fail
Relative Attenuation (IEC 61260 § 5.3)
Relative Attenuation
-120-110-100-90-80-70-60-50-40-30-20-10
0
-4 -3 -2 -1 - 1/2 - 3/8 - 1/4 - 1/8 0 1/8 1/4 3/8 1/2 1 2 3 4
Octaves from Center Frequency
Res
pons
e (d
B)
Minimum Tolerance
Maximum Tolerance
Data Found
Relative Attenuation (Detail)
-6
-4
-2
0
-4 -3 -2 -1 - 1/2 - 3/8 - 1/4 - 1/8 0 1/8 1/4 3/8 1/2 1 2 3 4
Octaves from Center Frequency
Res
pons
e (d
B)
Minimum Tolerance
Maximum Tolerance
Data Found
Page 48 of 64

Calibration Data for831# XXXID# N/A
Odin Metrology, Inc. Odin Metrology, Inc.Report# N/A
March 31, 2011
Octaves from Input DataCenter Freq. Freq. (Hz) Minimum Maximum Found (dB)
-4 117.0 N/A -70.0 -90.81 Pass-3 206.6 N/A -61.0 -84.62 Pass-2 335.3 N/A -42.0 -89.07 Pass-1 487.5 N/A -17.5 -76.32 Pass- 1/2 562.3 -5.0 -2.0 -2.95 Pass- 3/8 580.2 -1.3 0.3 -0.38 Pass- 1/4 597.6 -0.6 0.3 0.02 Pass- 1/8 614.6 -0.4 0.3 0.03 Pass0 631.0 -0.3 0.3 0.00 Pass1/8 647.8 -0.4 0.3 0.03 Pass1/4 666.1 -0.6 0.3 0.01 Pass3/8 686.1 -1.3 0.3 -0.19 Pass1/2 707.9 -5.0 -2.0 -2.95 Pass
1 816.7 N/A -17.5 -96.41 Pass2 1,187.3 N/A -42.0 -102.23 Pass3 1,926.7 N/A -61.0 -102.23 Pass4 3,402.1 N/A -70.0 -102.05 Pass
The attenuation of the filter at the given frequencies shall be within the stated tolerance. The frequencies arecalculated as octaves from the center frequency. The factors defined by IEC 61260 (Table 1) are: ±4, ±3, ±2, ±1,±1/2, ±3/8, ±1/4, ±1/8 and 0.Octaves from Center Frequency: the difference, in octaves, between the selected center frequency and thecurrent input frequencyInput Frequency: the input frequency to the filterTolerance: the acceptable range for what the filter should indicate according to IEC 61260Data Found: the level the sound level meter indicates
1/3 Octave - 630 HzTolerance (dB)
Pass/Fail
Relative Attenuation (IEC 61260 § 5.3)
Relative Attenuation
-120-110-100-90-80-70-60-50-40-30-20-10
0
-4 -3 -2 -1 - 1/2 - 3/8 - 1/4 - 1/8 0 1/8 1/4 3/8 1/2 1 2 3 4
Octaves from Center Frequency
Res
pons
e (d
B)
Minimum Tolerance
Maximum Tolerance
Data Found
Relative Attenuation (Detail)
-6
-4
-2
0
-4 -3 -2 -1 - 1/2 - 3/8 - 1/4 - 1/8 0 1/8 1/4 3/8 1/2 1 2 3 4
Octaves from Center Frequency
Res
pons
e (d
B)
Minimum Tolerance
Maximum Tolerance
Data Found
Page 49 of 64

Calibration Data for831# XXXID# N/A
Odin Metrology, Inc. Odin Metrology, Inc.Report# N/A
March 31, 2011
Octaves from Input DataCenter Freq. Freq. (Hz) Minimum Maximum Found (dB)
-4 147.3 N/A -70.0 -90.79 Pass-3 260.1 N/A -61.0 -84.92 Pass-2 422.1 N/A -42.0 -89.11 Pass-1 613.7 N/A -17.5 -76.05 Pass- 1/2 707.9 -5.0 -2.0 -3.02 Pass- 3/8 730.4 -1.3 0.3 -0.41 Pass- 1/4 752.4 -0.6 0.3 -0.02 Pass- 1/8 773.7 -0.4 0.3 -0.02 Pass0 794.3 -0.3 0.3 0.00 Pass1/8 815.5 -0.4 0.3 -0.03 Pass1/4 838.6 -0.6 0.3 0.01 Pass3/8 863.8 -1.3 0.3 -0.22 Pass1/2 891.3 -5.0 -2.0 -2.99 Pass
1 1,028.2 N/A -17.5 -95.07 Pass2 1,494.7 N/A -42.0 -101.46 Pass3 2,425.6 N/A -61.0 -100.99 Pass4 4,283.0 N/A -70.0 -100.84 Pass
Input Frequency: the input frequency to the filterTolerance: the acceptable range for what the filter should indicate according to IEC 61260
Relative Attenuation (IEC 61260 § 5.3)
Data Found: the level the sound level meter indicates1/3 Octave - 800 Hz
Tolerance (dB)Pass/Fail
The attenuation of the filter at the given frequencies shall be within the stated tolerance. The frequencies arecalculated as octaves from the center frequency. The factors defined by IEC 61260 (Table 1) are: ±4, ±3, ±2, ±1,±1/2, ±3/8, ±1/4, ±1/8 and 0.Octaves from Center Frequency: the difference, in octaves, between the selected center frequency and thecurrent input frequency
Relative Attenuation
-120-110-100-90-80-70-60-50-40-30-20-10
0
-4 -3 -2 -1 - 1/2 - 3/8 - 1/4 - 1/8 0 1/8 1/4 3/8 1/2 1 2 3 4
Octaves from Center Frequency
Res
pons
e (d
B)
Minimum Tolerance
Maximum Tolerance
Data Found
Relative Attenuation (Detail)
-6
-4
-2
0
-4 -3 -2 -1 - 1/2 - 3/8 - 1/4 - 1/8 0 1/8 1/4 3/8 1/2 1 2 3 4
Octaves from Center Frequency
Res
pons
e (d
B)
Minimum Tolerance
Maximum Tolerance
Data Found
Page 50 of 64

Calibration Data for831# XXXID# N/A
Odin Metrology, Inc. Odin Metrology, Inc.Report# N/A
March 31, 2011
Octaves from Input DataCenter Freq. Freq. (Hz) Minimum Maximum Found (dB)
-4 185.5 N/A -70.0 -91.04 Pass-3 327.5 N/A -61.0 -84.39 Pass-2 531.4 N/A -42.0 -89.02 Pass-1 772.6 N/A -17.5 -76.23 Pass- 1/2 891.3 -5.0 -2.0 -3.01 Pass- 3/8 919.6 -1.3 0.3 -0.41 Pass- 1/4 947.2 -0.6 0.3 0.00 Pass- 1/8 974.0 -0.4 0.3 -0.04 Pass0 1,000.0 -0.3 0.3 0.00 Pass1/8 1,026.7 -0.4 0.3 0.00 Pass1/4 1,055.8 -0.6 0.3 -0.02 Pass3/8 1,087.5 -1.3 0.3 -0.23 Pass1/2 1,122.0 -5.0 -2.0 -2.95 Pass
1 1,294.4 N/A -17.5 -95.33 Pass2 1,881.7 N/A -42.0 -100.43 Pass3 3,053.7 N/A -61.0 -100.75 Pass4 5,391.9 N/A -70.0 -100.74 Pass
The attenuation of the filter at the given frequencies shall be within the stated tolerance. The frequencies arecalculated as octaves from the center frequency. The factors defined by IEC 61260 (Table 1) are: ±4, ±3, ±2, ±1,±1/2, ±3/8, ±1/4, ±1/8 and 0.Octaves from Center Frequency: the difference, in octaves, between the selected center frequency and thecurrent input frequencyInput Frequency: the input frequency to the filterTolerance: the acceptable range for what the filter should indicate according to IEC 61260Data Found: the level the sound level meter indicates
1/3 Octave - 1 kHzTolerance (dB)
Pass/Fail
Relative Attenuation (IEC 61260 § 5.3)
Relative Attenuation
-120-110-100-90-80-70-60-50-40-30-20-10
0
-4 -3 -2 -1 - 1/2 - 3/8 - 1/4 - 1/8 0 1/8 1/4 3/8 1/2 1 2 3 4
Octaves from Center Frequency
Res
pons
e (d
B)
Minimum Tolerance
Maximum Tolerance
Data Found
Relative Attenuation (Detail)
-6
-4
-2
0
-4 -3 -2 -1 - 1/2 - 3/8 - 1/4 - 1/8 0 1/8 1/4 3/8 1/2 1 2 3 4
Octaves from Center Frequency
Res
pons
e (d
B)
Minimum Tolerance
Maximum Tolerance
Data Found
Page 51 of 64

Calibration Data for831# XXXID# N/A
Odin Metrology, Inc. Odin Metrology, Inc.Report# N/A
March 31, 2011
Octaves from Input DataCenter Freq. Freq. (Hz) Minimum Maximum Found (dB)
-4 233.5 N/A -70.0 -91.00 Pass-3 412.3 N/A -61.0 -83.82 Pass-2 669.0 N/A -42.0 -87.77 Pass-1 972.6 N/A -17.5 -76.20 Pass- 1/2 1,122.0 -5.0 -2.0 -2.96 Pass- 3/8 1,157.7 -1.3 0.3 -0.40 Pass- 1/4 1,192.4 -0.6 0.3 0.02 Pass- 1/8 1,226.2 -0.4 0.3 0.02 Pass0 1,258.9 -0.3 0.3 0.00 Pass1/8 1,292.5 -0.4 0.3 0.02 Pass1/4 1,329.1 -0.6 0.3 0.04 Pass3/8 1,369.0 -1.3 0.3 -0.19 Pass1/2 1,412.5 -5.0 -2.0 -2.94 Pass
1 1,629.5 N/A -17.5 -95.25 Pass2 2,369.0 N/A -42.0 -99.44 Pass3 3,844.3 N/A -61.0 -98.74 Pass4 6,788.1 N/A -70.0 -99.50 Pass
The attenuation of the filter at the given frequencies shall be within the stated tolerance. The frequencies arecalculated as octaves from the center frequency. The factors defined by IEC 61260 (Table 1) are: ±4, ±3, ±2, ±1,±1/2, ±3/8, ±1/4, ±1/8 and 0.Octaves from Center Frequency: the difference, in octaves, between the selected center frequency and thecurrent input frequencyInput Frequency: the input frequency to the filterTolerance: the acceptable range for what the filter should indicate according to IEC 61260Data Found: the level the sound level meter indicates
1/3 Octave - 1.25 kHzTolerance (dB)
Pass/Fail
Relative Attenuation (IEC 61260 § 5.3)
Relative Attenuation
-120-110-100-90-80-70-60-50-40-30-20-10
0
-4 -3 -2 -1 - 1/2 - 3/8 - 1/4 - 1/8 0 1/8 1/4 3/8 1/2 1 2 3 4
Octaves from Center Frequency
Res
pons
e (d
B)
Minimum Tolerance
Maximum Tolerance
Data Found
Relative Attenuation (Detail)
-6
-4
-2
0
-4 -3 -2 -1 - 1/2 - 3/8 - 1/4 - 1/8 0 1/8 1/4 3/8 1/2 1 2 3 4
Octaves from Center Frequency
Res
pons
e (d
B)
Minimum Tolerance
Maximum Tolerance
Data Found
Page 52 of 64

Calibration Data for831# XXXID# N/A
Odin Metrology, Inc. Odin Metrology, Inc.Report# N/A
March 31, 2011
Octaves from Input DataCenter Freq. Freq. (Hz) Minimum Maximum Found (dB)
-4 293.9 N/A -70.0 -92.49 Pass-3 519.0 N/A -61.0 -84.44 Pass-2 842.3 N/A -42.0 -88.46 Pass-1 1,224.4 N/A -17.5 -75.92 Pass- 1/2 1,412.5 -5.0 -2.0 -3.01 Pass- 3/8 1,457.4 -1.3 0.3 -0.41 Pass- 1/4 1,501.2 -0.6 0.3 -0.03 Pass- 1/8 1,543.7 -0.4 0.3 -0.02 Pass0 1,584.9 -0.3 0.3 0.00 Pass1/8 1,627.2 -0.4 0.3 -0.02 Pass1/4 1,673.3 -0.6 0.3 0.00 Pass3/8 1,723.5 -1.3 0.3 -0.20 Pass1/2 1,778.3 -5.0 -2.0 -2.97 Pass
1 2,051.4 N/A -17.5 -94.04 Pass2 2,982.3 N/A -42.0 -98.22 Pass3 4,839.7 N/A -61.0 -98.63 Pass4 8,545.7 N/A -70.0 -98.27 Pass
The attenuation of the filter at the given frequencies shall be within the stated tolerance. The frequencies arecalculated as octaves from the center frequency. The factors defined by IEC 61260 (Table 1) are: ±4, ±3, ±2, ±1,±1/2, ±3/8, ±1/4, ±1/8 and 0.Octaves from Center Frequency: the difference, in octaves, between the selected center frequency and thecurrent input frequencyInput Frequency: the input frequency to the filterTolerance: the acceptable range for what the filter should indicate according to IEC 61260Data Found: the level the sound level meter indicates
1/3 Octave - 1.6 kHzTolerance (dB)
Pass/Fail
Relative Attenuation (IEC 61260 § 5.3)
Relative Attenuation
-120-110-100-90-80-70-60-50-40-30-20-10
0
-4 -3 -2 -1 - 1/2 - 3/8 - 1/4 - 1/8 0 1/8 1/4 3/8 1/2 1 2 3 4
Octaves from Center Frequency
Res
pons
e (d
B)
Minimum Tolerance
Maximum Tolerance
Data Found
Relative Attenuation (Detail)
-6
-4
-2
0
-4 -3 -2 -1 - 1/2 - 3/8 - 1/4 - 1/8 0 1/8 1/4 3/8 1/2 1 2 3 4
Octaves from Center Frequency
Res
pons
e (d
B)
Minimum Tolerance
Maximum Tolerance
Data Found
Page 53 of 64

Calibration Data for831# XXXID# N/A
Odin Metrology, Inc. Odin Metrology, Inc.Report# N/A
March 31, 2011
Octaves from Input DataCenter Freq. Freq. (Hz) Minimum Maximum Found (dB)
-4 370.0 N/A -70.0 -92.25 Pass-3 653.4 N/A -61.0 -85.00 Pass-2 1,060.3 N/A -42.0 -88.48 Pass-1 1,541.5 N/A -17.5 -76.27 Pass- 1/2 1,778.3 -5.0 -2.0 -2.96 Pass- 3/8 1,834.8 -1.3 0.3 -0.39 Pass- 1/4 1,889.9 -0.6 0.3 0.02 Pass- 1/8 1,943.4 -0.4 0.3 0.01 Pass0 1,995.3 -0.3 0.3 0.00 Pass1/8 2,048.5 -0.4 0.3 0.03 Pass1/4 2,106.5 -0.6 0.3 0.02 Pass3/8 2,169.8 -1.3 0.3 -0.18 Pass1/2 2,238.7 -5.0 -2.0 -2.90 Pass
1 2,582.6 N/A -17.5 -94.41 Pass2 3,754.5 N/A -42.0 -97.37 Pass3 6,092.8 N/A -61.0 -97.03 Pass4 10,758.4 N/A -70.0 -96.49 Pass
Input Frequency: the input frequency to the filterTolerance: the acceptable range for what the filter should indicate according to IEC 61260
Relative Attenuation (IEC 61260 § 5.3)
Data Found: the level the sound level meter indicates1/3 Octave - 2 kHz
Tolerance (dB)Pass/Fail
The attenuation of the filter at the given frequencies shall be within the stated tolerance. The frequencies arecalculated as octaves from the center frequency. The factors defined by IEC 61260 (Table 1) are: ±4, ±3, ±2, ±1,±1/2, ±3/8, ±1/4, ±1/8 and 0.Octaves from Center Frequency: the difference, in octaves, between the selected center frequency and thecurrent input frequency
Relative Attenuation
-120-110-100-90-80-70-60-50-40-30-20-10
0
-4 -3 -2 -1 - 1/2 - 3/8 - 1/4 - 1/8 0 1/8 1/4 3/8 1/2 1 2 3 4
Octaves from Center Frequency
Res
pons
e (d
B)
Minimum Tolerance
Maximum Tolerance
Data Found
Relative Attenuation (Detail)
-6
-4
-2
0
-4 -3 -2 -1 - 1/2 - 3/8 - 1/4 - 1/8 0 1/8 1/4 3/8 1/2 1 2 3 4
Octaves from Center Frequency
Res
pons
e (d
B)
Minimum Tolerance
Maximum Tolerance
Data Found
Page 54 of 64

Calibration Data for831# XXXID# N/A
Odin Metrology, Inc. Odin Metrology, Inc.Report# N/A
March 31, 2011
Octaves from Input DataCenter Freq. Freq. (Hz) Minimum Maximum Found (dB)
-4 465.9 N/A -70.0 -92.15 Pass-3 822.6 N/A -61.0 -84.75 Pass-2 1,334.9 N/A -42.0 -86.71 Pass-1 1,940.6 N/A -17.5 -75.92 Pass- 1/2 2,238.7 -5.0 -2.0 -2.94 Pass- 3/8 2,309.9 -1.3 0.3 -0.39 Pass- 1/4 2,379.2 -0.6 0.3 -0.01 Pass- 1/8 2,446.6 -0.4 0.3 0.01 Pass0 2,511.9 -0.3 0.3 0.00 Pass1/8 2,578.9 -0.4 0.3 -0.03 Pass1/4 2,651.9 -0.6 0.3 0.01 Pass3/8 2,731.6 -1.3 0.3 -0.21 Pass1/2 2,818.4 -5.0 -2.0 -2.97 Pass
1 3,251.3 N/A -17.5 -93.25 Pass2 4,726.7 N/A -42.0 -96.27 Pass3 7,670.4 N/A -61.0 -95.52 Pass4 13,544.0 N/A -70.0 -94.39 Pass
The attenuation of the filter at the given frequencies shall be within the stated tolerance. The frequencies arecalculated as octaves from the center frequency. The factors defined by IEC 61260 (Table 1) are: ±4, ±3, ±2, ±1,±1/2, ±3/8, ±1/4, ±1/8 and 0.Octaves from Center Frequency: the difference, in octaves, between the selected center frequency and thecurrent input frequencyInput Frequency: the input frequency to the filterTolerance: the acceptable range for what the filter should indicate according to IEC 61260Data Found: the level the sound level meter indicates
1/3 Octave - 2.5 kHzTolerance (dB)
Pass/Fail
Relative Attenuation (IEC 61260 § 5.3)
Relative Attenuation
-120-110-100-90-80-70-60-50-40-30-20-10
0
-4 -3 -2 -1 - 1/2 - 3/8 - 1/4 - 1/8 0 1/8 1/4 3/8 1/2 1 2 3 4
Octaves from Center Frequency
Res
pons
e (d
B)
Minimum Tolerance
Maximum Tolerance
Data Found
Relative Attenuation (Detail)
-6
-4
-2
0
-4 -3 -2 -1 - 1/2 - 3/8 - 1/4 - 1/8 0 1/8 1/4 3/8 1/2 1 2 3 4
Octaves from Center Frequency
Res
pons
e (d
B)
Minimum Tolerance
Maximum Tolerance
Data Found
Page 55 of 64

Calibration Data for831# XXXID# N/A
Odin Metrology, Inc. Odin Metrology, Inc.Report# N/A
March 31, 2011
Octaves from Input DataCenter Freq. Freq. (Hz) Minimum Maximum Found (dB)
-4 586.5 N/A -70.0 -92.54 Pass-3 1,035.6 N/A -61.0 -85.02 Pass-2 1,680.5 N/A -42.0 -84.66 Pass-1 2,443.1 N/A -17.5 -75.83 Pass- 1/2 2,818.4 -5.0 -2.0 -3.04 Pass- 3/8 2,908.0 -1.3 0.3 -0.44 Pass- 1/4 2,995.3 -0.6 0.3 -0.07 Pass- 1/8 3,080.1 -0.4 0.3 -0.04 Pass0 3,162.3 -0.3 0.3 0.00 Pass1/8 3,246.6 -0.4 0.3 -0.02 Pass1/4 3,338.6 -0.6 0.3 0.00 Pass3/8 3,438.8 -1.3 0.3 -0.20 Pass1/2 3,548.1 -5.0 -2.0 -2.99 Pass
1 4,093.2 N/A -17.5 -92.66 Pass2 5,950.5 N/A -42.0 -95.11 Pass3 9,656.5 N/A -61.0 -93.83 Pass4 17,050.8 N/A -70.0 -91.89 Pass
The attenuation of the filter at the given frequencies shall be within the stated tolerance. The frequencies arecalculated as octaves from the center frequency. The factors defined by IEC 61260 (Table 1) are: ±4, ±3, ±2, ±1,±1/2, ±3/8, ±1/4, ±1/8 and 0.Octaves from Center Frequency: the difference, in octaves, between the selected center frequency and thecurrent input frequencyInput Frequency: the input frequency to the filterTolerance: the acceptable range for what the filter should indicate according to IEC 61260Data Found: the level the sound level meter indicates
1/3 Octave - 3.15 kHzTolerance (dB)
Pass/Fail
Relative Attenuation (IEC 61260 § 5.3)
Relative Attenuation
-120-110-100-90-80-70-60-50-40-30-20-10
0
-4 -3 -2 -1 - 1/2 - 3/8 - 1/4 - 1/8 0 1/8 1/4 3/8 1/2 1 2 3 4
Octaves from Center Frequency
Res
pons
e (d
B)
Minimum Tolerance
Maximum Tolerance
Data Found
Relative Attenuation (Detail)
-6
-4
-2
0
-4 -3 -2 -1 - 1/2 - 3/8 - 1/4 - 1/8 0 1/8 1/4 3/8 1/2 1 2 3 4
Octaves from Center Frequency
Res
pons
e (d
B)
Minimum Tolerance
Maximum Tolerance
Data Found
Page 56 of 64

Calibration Data for831# XXXID# N/A
Odin Metrology, Inc. Odin Metrology, Inc.Report# N/A
March 31, 2011
Octaves from Input DataCenter Freq. Freq. (Hz) Minimum Maximum Found (dB)
-4 738.3 N/A -70.0 -91.08 Pass-3 1,303.7 N/A -61.0 -85.23 Pass-2 2,115.6 N/A -42.0 -83.88 Pass-1 3,075.7 N/A -17.5 -76.13 Pass- 1/2 3,548.1 -5.0 -2.0 -2.98 Pass- 3/8 3,660.9 -1.3 0.3 -0.36 Pass- 1/4 3,770.8 -0.6 0.3 0.03 Pass- 1/8 3,877.6 -0.4 0.3 0.02 Pass0 3,981.1 -0.3 0.3 0.00 Pass1/8 4,087.3 -0.4 0.3 0.01 Pass1/4 4,203.0 -0.6 0.3 0.01 Pass3/8 4,329.2 -1.3 0.3 -0.19 Pass1/2 4,466.8 -5.0 -2.0 -2.92 Pass
1 5,153.0 N/A -17.5 -92.35 Pass2 7,491.3 N/A -42.0 -93.78 Pass3 12,156.8 N/A -61.0 -92.60 Pass4 21,465.7 N/A -70.0 -90.49 Pass
The attenuation of the filter at the given frequencies shall be within the stated tolerance. The frequencies arecalculated as octaves from the center frequency. The factors defined by IEC 61260 (Table 1) are: ±4, ±3, ±2, ±1,±1/2, ±3/8, ±1/4, ±1/8 and 0.Octaves from Center Frequency: the difference, in octaves, between the selected center frequency and thecurrent input frequencyInput Frequency: the input frequency to the filterTolerance: the acceptable range for what the filter should indicate according to IEC 61260Data Found: the level the sound level meter indicates
1/3 Octave - 4 kHzTolerance (dB)
Pass/Fail
Relative Attenuation (IEC 61260 § 5.3)
Relative Attenuation
-120-110-100-90-80-70-60-50-40-30-20-10
0
-4 -3 -2 -1 - 1/2 - 3/8 - 1/4 - 1/8 0 1/8 1/4 3/8 1/2 1 2 3 4
Octaves from Center Frequency
Res
pons
e (d
B)
Minimum Tolerance
Maximum Tolerance
Data Found
Relative Attenuation (Detail)
-6
-4
-2
0
-4 -3 -2 -1 - 1/2 - 3/8 - 1/4 - 1/8 0 1/8 1/4 3/8 1/2 1 2 3 4
Octaves from Center Frequency
Res
pons
e (d
B)
Minimum Tolerance
Maximum Tolerance
Data Found
Page 57 of 64

Calibration Data for831# XXXID# N/A
Odin Metrology, Inc. Odin Metrology, Inc.Report# N/A
March 31, 2011
Octaves from Input DataCenter Freq. Freq. (Hz) Minimum Maximum Found (dB)
-4 929.5 N/A -70.0 -90.32 Pass-3 1,641.3 N/A -61.0 -85.60 Pass-2 2,663.4 N/A -42.0 -82.18 Pass-1 3,872.0 N/A -17.5 -76.27 Pass- 1/2 4,466.8 -5.0 -2.0 -2.95 Pass- 3/8 4,608.8 -1.3 0.3 -0.41 Pass- 1/4 4,747.2 -0.6 0.3 0.02 Pass- 1/8 4,881.7 -0.4 0.3 0.01 Pass0 5,011.9 -0.3 0.3 0.00 Pass1/8 5,145.6 -0.4 0.3 0.01 Pass1/4 5,291.3 -0.6 0.3 0.01 Pass3/8 5,450.2 -1.3 0.3 -0.21 Pass1/2 5,623.4 -5.0 -2.0 -2.92 Pass
1 6,487.2 N/A -17.5 -91.52 Pass2 9,431.0 N/A -42.0 -92.17 Pass3 15,304.5 N/A -61.0 -89.42 Pass4 27,023.8 N/A -70.0 -90.32 Pass
Input Frequency: the input frequency to the filterTolerance: the acceptable range for what the filter should indicate according to IEC 61260
Relative Attenuation (IEC 61260 § 5.3)
Data Found: the level the sound level meter indicates1/3 Octave - 5 kHz
Tolerance (dB)Pass/Fail
The attenuation of the filter at the given frequencies shall be within the stated tolerance. The frequencies arecalculated as octaves from the center frequency. The factors defined by IEC 61260 (Table 1) are: ±4, ±3, ±2, ±1,±1/2, ±3/8, ±1/4, ±1/8 and 0.Octaves from Center Frequency: the difference, in octaves, between the selected center frequency and thecurrent input frequency
Relative Attenuation
-120-110-100-90-80-70-60-50-40-30-20-10
0
-4 -3 -2 -1 - 1/2 - 3/8 - 1/4 - 1/8 0 1/8 1/4 3/8 1/2 1 2 3 4
Octaves from Center Frequency
Res
pons
e (d
B)
Minimum Tolerance
Maximum Tolerance
Data Found
Relative Attenuation (Detail)
-6
-4
-2
0
-4 -3 -2 -1 - 1/2 - 3/8 - 1/4 - 1/8 0 1/8 1/4 3/8 1/2 1 2 3 4
Octaves from Center Frequency
Res
pons
e (d
B)
Minimum Tolerance
Maximum Tolerance
Data Found
Page 58 of 64

Calibration Data for831# XXXID# N/A
Odin Metrology, Inc. Odin Metrology, Inc.Report# N/A
March 31, 2011
Octaves from Input DataCenter Freq. Freq. (Hz) Minimum Maximum Found (dB)
-4 1,170.2 N/A -70.0 -89.79 Pass-3 2,066.2 N/A -61.0 -85.44 Pass-2 3,353.1 N/A -42.0 -80.85 Pass-1 4,874.6 N/A -17.5 -76.20 Pass- 1/2 5,623.4 -5.0 -2.0 -2.95 Pass- 3/8 5,802.1 -1.3 0.3 -0.38 Pass- 1/4 5,976.4 -0.6 0.3 0.02 Pass- 1/8 6,145.6 -0.4 0.3 0.03 Pass0 6,309.6 -0.3 0.3 0.00 Pass1/8 6,477.9 -0.4 0.3 0.05 Pass1/4 6,661.4 -0.6 0.3 0.02 Pass3/8 6,861.4 -1.3 0.3 -0.18 Pass1/2 7,079.5 -5.0 -2.0 -2.94 Pass
1 8,166.9 N/A -17.5 -90.11 Pass2 11,872.9 N/A -42.0 -90.03 Pass3 19,267.2 N/A -61.0 -88.40 Pass4 34,020.9 N/A -70.0 -91.73 Pass
The attenuation of the filter at the given frequencies shall be within the stated tolerance. The frequencies arecalculated as octaves from the center frequency. The factors defined by IEC 61260 (Table 1) are: ±4, ±3, ±2, ±1,±1/2, ±3/8, ±1/4, ±1/8 and 0.Octaves from Center Frequency: the difference, in octaves, between the selected center frequency and thecurrent input frequencyInput Frequency: the input frequency to the filterTolerance: the acceptable range for what the filter should indicate according to IEC 61260Data Found: the level the sound level meter indicates
1/3 Octave - 6 kHzTolerance (dB)
Pass/Fail
Relative Attenuation (IEC 61260 § 5.3)
Relative Attenuation
-120-110-100-90-80-70-60-50-40-30-20-10
0
-4 -3 -2 -1 - 1/2 - 3/8 - 1/4 - 1/8 0 1/8 1/4 3/8 1/2 1 2 3 4
Octaves from Center Frequency
Res
pons
e (d
B)
Minimum Tolerance
Maximum Tolerance
Data Found
Relative Attenuation (Detail)
-6
-4
-2
0
-4 -3 -2 -1 - 1/2 - 3/8 - 1/4 - 1/8 0 1/8 1/4 3/8 1/2 1 2 3 4
Octaves from Center Frequency
Res
pons
e (d
B)
Minimum Tolerance
Maximum Tolerance
Data Found
Page 59 of 64

Calibration Data for831# XXXID# N/A
Odin Metrology, Inc. Odin Metrology, Inc.Report# N/A
March 31, 2011
Octaves from Input DataCenter Freq. Freq. (Hz) Minimum Maximum Found (dB)
-4 1,473.2 N/A -70.0 -88.66 Pass-3 2,601.2 N/A -61.0 -86.41 Pass-2 4,221.3 N/A -42.0 -80.32 Pass-1 6,136.8 N/A -17.5 -75.96 Pass- 1/2 7,079.5 -5.0 -2.0 -3.02 Pass- 3/8 7,304.5 -1.3 0.3 -0.41 Pass- 1/4 7,523.8 -0.6 0.3 -0.02 Pass- 1/8 7,736.9 -0.4 0.3 -0.02 Pass0 7,943.3 -0.3 0.3 0.00 Pass1/8 8,155.2 -0.4 0.3 -0.03 Pass1/4 8,386.2 -0.6 0.3 0.01 Pass3/8 8,638.0 -1.3 0.3 -0.22 Pass1/2 8,912.5 -5.0 -2.0 -2.99 Pass
1 10,281.6 N/A -17.5 -88.47 Pass2 14,947.1 N/A -42.0 -86.35 Pass3 24,256.0 N/A -61.0 -89.79 Pass4 42,829.8 N/A -70.0 -82.58 Pass
The attenuation of the filter at the given frequencies shall be within the stated tolerance. The frequencies arecalculated as octaves from the center frequency. The factors defined by IEC 61260 (Table 1) are: ±4, ±3, ±2, ±1,±1/2, ±3/8, ±1/4, ±1/8 and 0.Octaves from Center Frequency: the difference, in octaves, between the selected center frequency and thecurrent input frequencyInput Frequency: the input frequency to the filterTolerance: the acceptable range for what the filter should indicate according to IEC 61260Data Found: the level the sound level meter indicates
1/3 Octave - 8 kHzTolerance (dB)
Pass/Fail
Relative Attenuation (IEC 61260 § 5.3)
Relative Attenuation
-120-110-100-90-80-70-60-50-40-30-20-10
0
-4 -3 -2 -1 - 1/2 - 3/8 - 1/4 - 1/8 0 1/8 1/4 3/8 1/2 1 2 3 4
Octaves from Center Frequency
Res
pons
e (d
B)
Minimum Tolerance
Maximum Tolerance
Data Found
Relative Attenuation (Detail)
-6
-4
-2
0
-4 -3 -2 -1 - 1/2 - 3/8 - 1/4 - 1/8 0 1/8 1/4 3/8 1/2 1 2 3 4
Octaves from Center Frequency
Res
pons
e (d
B)
Minimum Tolerance
Maximum Tolerance
Data Found
Page 60 of 64

Calibration Data for831# XXXID# N/A
Odin Metrology, Inc. Odin Metrology, Inc.Report# N/A
March 31, 2011
Octaves from Input DataCenter Freq. Freq. (Hz) Minimum Maximum Found (dB)
-4 1,854.6 N/A -70.0 -87.96 Pass-3 3,274.8 N/A -61.0 -87.00 Pass-2 5,314.3 N/A -42.0 -82.04 Pass-1 7,725.7 N/A -17.5 -75.96 Pass- 1/2 8,912.5 -5.0 -2.0 -3.01 Pass- 3/8 9,195.8 -1.3 0.3 -0.41 Pass- 1/4 9,471.9 -0.6 0.3 0.00 Pass- 1/8 9,740.2 -0.4 0.3 -0.04 Pass0 10,000.0 -0.3 0.3 0.00 Pass1/8 10,266.7 -0.4 0.3 0.00 Pass1/4 10,557.5 -0.6 0.3 -0.02 Pass3/8 10,874.6 -1.3 0.3 -0.23 Pass1/2 11,220.2 -5.0 -2.0 -2.97 Pass
1 12,943.7 N/A -17.5 -84.66 Pass2 18,817.3 N/A -42.0 -88.70 Pass3 30,536.5 N/A -61.0 -88.27 Pass4 53,919.5 N/A -70.0 -94.87 Pass
The attenuation of the filter at the given frequencies shall be within the stated tolerance. The frequencies arecalculated as octaves from the center frequency. The factors defined by IEC 61260 (Table 1) are: ±4, ±3, ±2, ±1,±1/2, ±3/8, ±1/4, ±1/8 and 0.Octaves from Center Frequency: the difference, in octaves, between the selected center frequency and thecurrent input frequencyInput Frequency: the input frequency to the filterTolerance: the acceptable range for what the filter should indicate according to IEC 61260Data Found: the level the sound level meter indicates
1/3 Octave - 10 kHzTolerance (dB)
Pass/Fail
Relative Attenuation (IEC 61260 § 5.3)
Relative Attenuation
-120-110-100-90-80-70-60-50-40-30-20-10
0
-4 -3 -2 -1 - 1/2 - 3/8 - 1/4 - 1/8 0 1/8 1/4 3/8 1/2 1 2 3 4
Octaves from Center Frequency
Res
pons
e (d
B)
Minimum Tolerance
Maximum Tolerance
Data Found
Relative Attenuation (Detail)
-6
-4
-2
0
-4 -3 -2 -1 - 1/2 - 3/8 - 1/4 - 1/8 0 1/8 1/4 3/8 1/2 1 2 3 4
Octaves from Center Frequency
Res
pons
e (d
B)
Minimum Tolerance
Maximum Tolerance
Data Found
Page 61 of 64

Calibration Data for831# XXXID# N/A
Odin Metrology, Inc. Odin Metrology, Inc.Report# N/A
March 31, 2011
Octaves from Input DataCenter Freq. Freq. (Hz) Minimum Maximum Found (dB)
-4 2,334.8 N/A -70.0 -86.22 Pass-3 4,122.7 N/A -61.0 -84.98 Pass-2 6,690.3 N/A -42.0 -82.96 Pass-1 9,726.1 N/A -17.5 -75.64 Pass- 1/2 11,220.2 -5.0 -2.0 -2.94 Pass- 3/8 11,576.8 -1.3 0.3 -0.38 Pass- 1/4 11,924.4 -0.6 0.3 0.03 Pass- 1/8 12,262.2 -0.4 0.3 0.03 Pass0 12,589.3 -0.3 0.3 0.00 Pass1/8 12,925.1 -0.4 0.3 0.01 Pass1/4 13,291.2 -0.6 0.3 0.02 Pass3/8 13,690.3 -1.3 0.3 -0.22 Pass1/2 14,125.4 -5.0 -2.0 -2.97 Pass
1 16,295.2 N/A -17.5 -87.23 Pass2 23,689.5 N/A -42.0 -89.49 Pass3 38,443.2 N/A -61.0 -84.53 Pass4 67,880.6 N/A -70.0 -84.67 Pass
Input Frequency: the input frequency to the filterTolerance: the acceptable range for what the filter should indicate according to IEC 61260
Relative Attenuation (IEC 61260 § 5.3)
Data Found: the level the sound level meter indicates1/3 Octave - 12.5 kHz
Tolerance (dB)Pass/Fail
The attenuation of the filter at the given frequencies shall be within the stated tolerance. The frequencies arecalculated as octaves from the center frequency. The factors defined by IEC 61260 (Table 1) are: ±4, ±3, ±2, ±1,±1/2, ±3/8, ±1/4, ±1/8 and 0.Octaves from Center Frequency: the difference, in octaves, between the selected center frequency and thecurrent input frequency
Relative Attenuation
-120-110-100-90-80-70-60-50-40-30-20-10
0
-4 -3 -2 -1 - 1/2 - 3/8 - 1/4 - 1/8 0 1/8 1/4 3/8 1/2 1 2 3 4
Octaves from Center Frequency
Res
pons
e (d
B)
Minimum Tolerance
Maximum Tolerance
Data Found
Relative Attenuation (Detail)
-6
-4
-2
0
-4 -3 -2 -1 - 1/2 - 3/8 - 1/4 - 1/8 0 1/8 1/4 3/8 1/2 1 2 3 4
Octaves from Center Frequency
Res
pons
e (d
B)
Minimum Tolerance
Maximum Tolerance
Data Found
Page 62 of 64

Calibration Data for831# XXXID# N/A
Odin Metrology, Inc. Odin Metrology, Inc.Report# N/A
March 31, 2011
Octaves from Input DataCenter Freq. Freq. (Hz) Minimum Maximum Found (dB)
-4 2,939.4 N/A -70.0 -84.65 Pass-3 5,190.2 N/A -61.0 -83.71 Pass-2 8,422.5 N/A -42.0 -82.56 Pass-1 12,244.5 N/A -17.5 -75.44 Pass- 1/2 14,125.4 -5.0 -2.0 -2.95 Pass- 3/8 14,574.3 -1.3 0.3 -0.36 Pass- 1/4 15,012.0 -0.6 0.3 0.01 Pass- 1/8 15,437.2 -0.4 0.3 0.00 Pass0 15,848.9 -0.3 0.3 0.00 Pass1/8 16,271.7 -0.4 0.3 -0.04 Pass1/4 16,732.6 -0.6 0.3 -0.04 Pass3/8 17,235.0 -1.3 0.3 -0.26 Pass1/2 17,782.8 -5.0 -2.0 -3.07 Pass
1 20,514.4 N/A -17.5 -88.45 Pass2 29,823.4 N/A -42.0 -88.73 Pass3 48,397.1 N/A -61.0 -90.41 Pass4 85,456.6 N/A -70.0 -81.20 Pass
The attenuation of the filter at the given frequencies shall be within the stated tolerance. The frequencies arecalculated as octaves from the center frequency. The factors defined by IEC 61260 (Table 1) are: ±4, ±3, ±2, ±1,±1/2, ±3/8, ±1/4, ±1/8 and 0.Octaves from Center Frequency: the difference, in octaves, between the selected center frequency and thecurrent input frequencyInput Frequency: the input frequency to the filterTolerance: the acceptable range for what the filter should indicate according to IEC 61260Data Found: the level the sound level meter indicates
1/3 Octave - 16 kHzTolerance (dB)
Pass/Fail
Relative Attenuation (IEC 61260 § 5.3)
Relative Attenuation
-120-110-100-90-80-70-60-50-40-30-20-10
0
-4 -3 -2 -1 - 1/2 - 3/8 - 1/4 - 1/8 0 1/8 1/4 3/8 1/2 1 2 3 4
Octaves from Center Frequency
Res
pons
e (d
B)
Minimum Tolerance
Maximum Tolerance
Data Found
Relative Attenuation (Detail)
-6
-4
-2
0
-4 -3 -2 -1 - 1/2 - 3/8 - 1/4 - 1/8 0 1/8 1/4 3/8 1/2 1 2 3 4
Octaves from Center Frequency
Res
pons
e (d
B)
Minimum Tolerance
Maximum Tolerance
Data Found
Page 63 of 64

Calibration Data for831# XXXID# N/A
Odin Metrology, Inc. Odin Metrology, Inc.Report# N/A
March 31, 2011
Octaves from Input DataCenter Freq. Freq. (Hz) Minimum Maximum Found (dB)
-4 3,700.4 N/A -70.0 -80.95 Pass-3 6,534.0 N/A -61.0 -83.51 Pass-2 10,603.4 N/A -42.0 -84.57 Pass-1 15,414.9 N/A -17.5 -75.56 Pass- 1/2 17,782.8 -5.0 -2.0 -2.81 Pass- 3/8 18,348.0 -1.3 0.3 -0.26 Pass- 1/4 18,898.9 -0.6 0.3 0.11 Pass- 1/8 19,434.2 -0.4 0.3 0.05 Pass0 19,952.6 -0.3 0.3 0.00 Pass1/8 20,484.8 -0.4 0.3 -0.02 Pass1/4 21,065.1 -0.6 0.3 -0.08 Pass3/8 21,697.6 -1.3 0.3 -0.38 Pass1/2 22,387.2 -5.0 -2.0 -3.33 Pass
1 25,826.2 N/A -17.5 -88.04 Pass2 37,545.4 N/A -42.0 -86.59 Pass3 60,928.4 N/A -61.0 -79.80 Pass4 107,583.5 N/A -70.0 -77.84 Pass
The attenuation of the filter at the given frequencies shall be within the stated tolerance. The frequencies arecalculated as octaves from the center frequency. The factors defined by IEC 61260 (Table 1) are: ±4, ±3, ±2, ±1,±1/2, ±3/8, ±1/4, ±1/8 and 0.Octaves from Center Frequency: the difference, in octaves, between the selected center frequency and thecurrent input frequencyInput Frequency: the input frequency to the filter
Relative Attenuation (IEC 61260 § 5.3)
Tolerance: the acceptable range for what the filter should indicate according to IEC 61260Data Found: the level the sound level meter indicates
1/3 Octave - 20 kHzTolerance (dB)
Pass/Fail
Relative Attenuation
-120-110-100-90-80-70-60-50-40-30-20-10
0
-4 -3 -2 -1 - 1/2 - 3/8 - 1/4 - 1/8 0 1/8 1/4 3/8 1/2 1 2 3 4
Octaves from Center Frequency
Res
pons
e (d
B)
Minimum Tolerance
Maximum Tolerance
Data Found
Relative Attenuation (Detail)
-6
-4
-2
0
-4 -3 -2 -1 - 1/2 - 3/8 - 1/4 - 1/8 0 1/8 1/4 3/8 1/2 1 2 3 4
Octaves from Center Frequency
Res
pons
e (d
B)
Minimum Tolerance
Maximum Tolerance
Data Found
Page 64 of 64