certification in r programming - imarticus...
TRANSCRIPT

Certification In R Programming
Introduction to Analytics and R
In this session, you will gain answers to:
Overview of Analytics•
Careers in Analytics•
Why Use R?•
Introduction to R •
What Lies Ahead

Introduction to Analytics

BIGDATA
Data that is TOO LARGE & TOO COMPLEX for conventional data tools
to capture, store and analyze.
Shares traded on US Stock Markets each
day:
7 Billion
Data generated in one flight from NY
to London:
10 Terabytes
Number of tweets per day on Twitter:
400 Million
Number of ‘Likes’ each day on Facebook:
3 Billion
The 3V’s of Big Data
VOLUME VARIETY VELOCITY90% OF THE WORLD’S
DATA WAS GENERATED IN THE LAST TWO YEARS
Data Overload
What is Analytics?
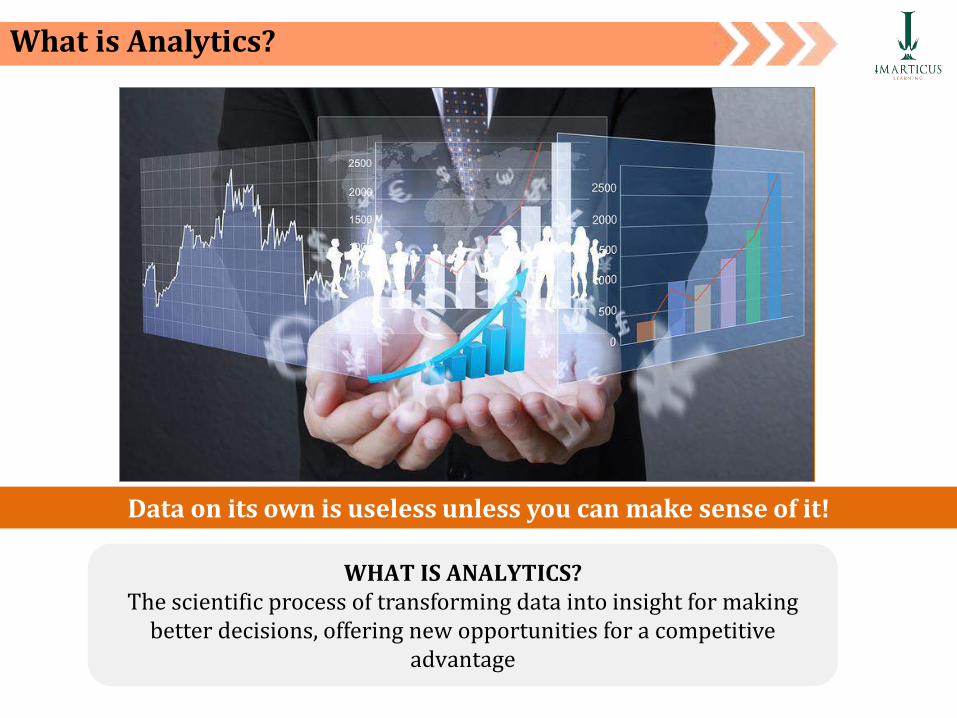
Data on its own is useless unless you can make sense of it!
WHAT IS ANALYTICS?The scientific process of transforming data into insight for making
better decisions, offering new opportunities for a competitive advantage
What is Business Analytics?
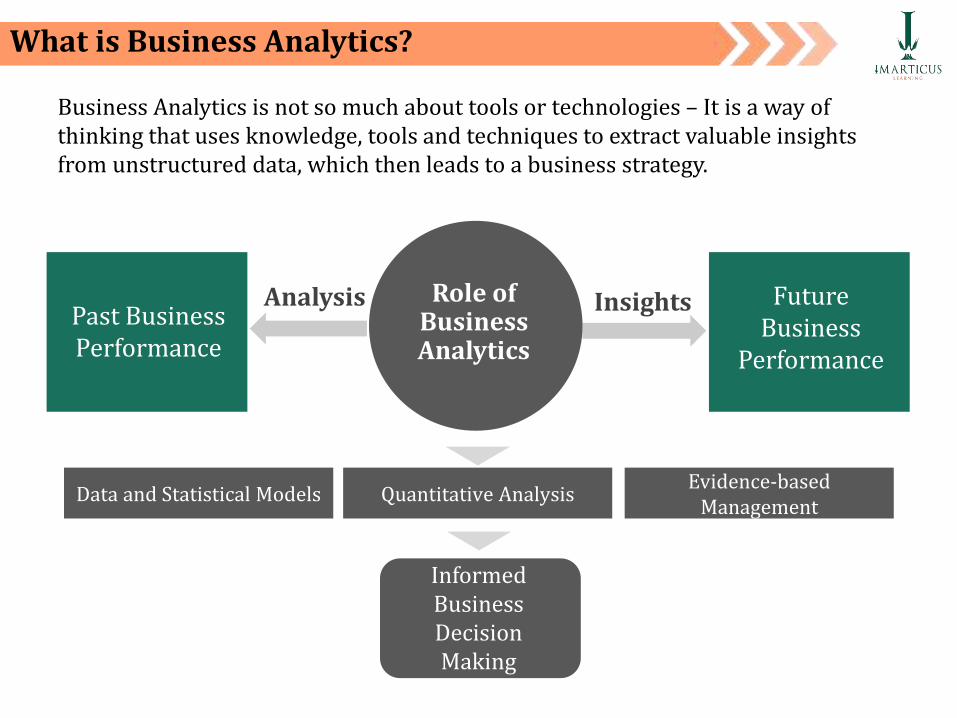
Past Business Performance
Data and Statistical Models
Analysis Role of Business Analytics
Future Business
Performance
Insights
Quantitative AnalysisEvidence-based
Management
Informed Business Decision Making
Business Analytics is not so much about tools or technologies – It is a way of thinking that uses knowledge, tools and techniques to extract valuable insights from unstructured data, which then leads to a business strategy.
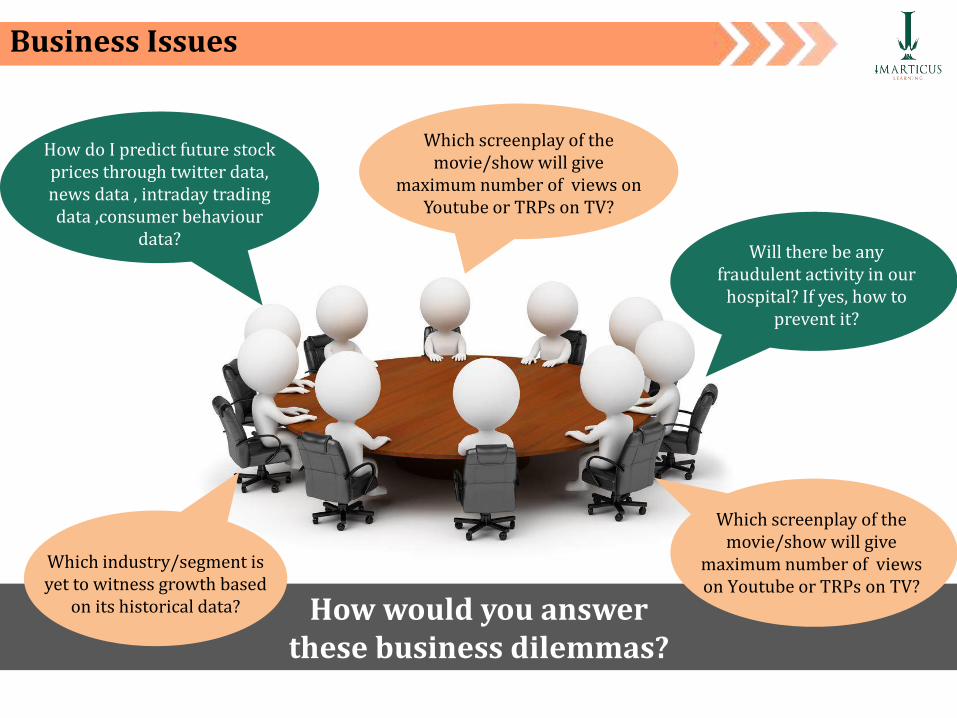
How would you answer these business dilemmas?
Business Issues
How do I predict future stock prices through twitter data, news data , intraday trading data ,consumer behaviour
data?
Which screenplay of the movie/show will give
maximum number of views on Youtube or TRPs on TV?
Which screenplay of the movie/show will give
maximum number of views on Youtube or TRPs on TV?
Will there be any fraudulent activity in our
hospital? If yes, how to prevent it?
Which industry/segment is yet to witness growth based
on its historical data?
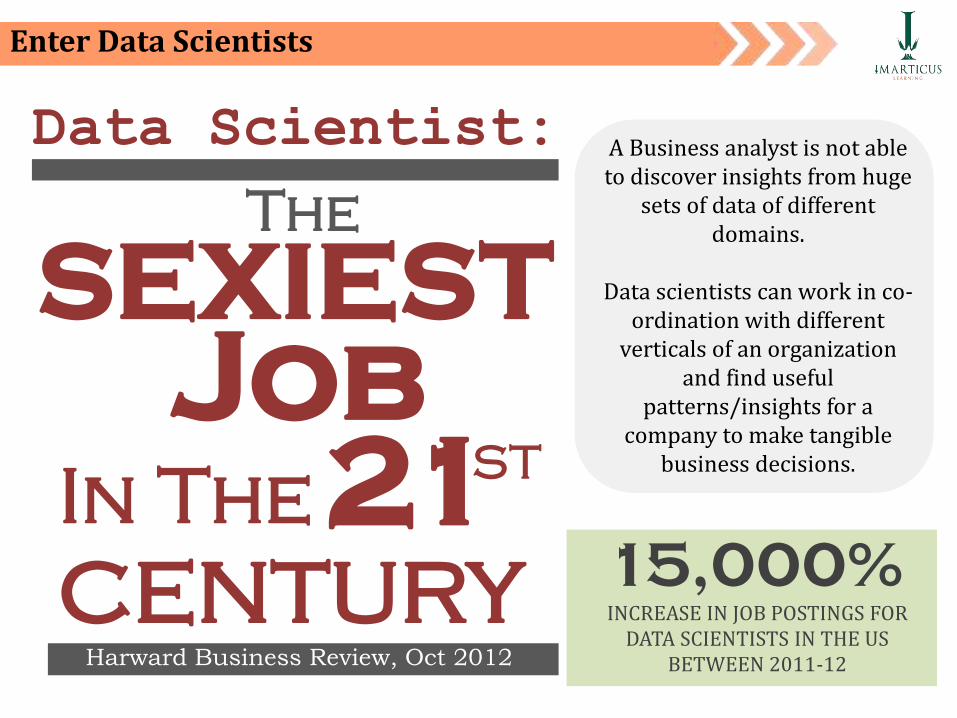
Enter Data Scientists
Data Scientist:
The
SEXIEST
Job
In The 21ST
centuryHarward Business Review, Oct 2012
A Business analyst is not able to discover insights from huge
sets of data of different domains.
Data scientists can work in co-ordination with different
verticals of an organization and find useful
patterns/insights for a company to make tangible
business decisions.
INCREASE IN JOB POSTINGS FOR DATA SCIENTISTS IN THE US
BETWEEN 2011-12
15,000%
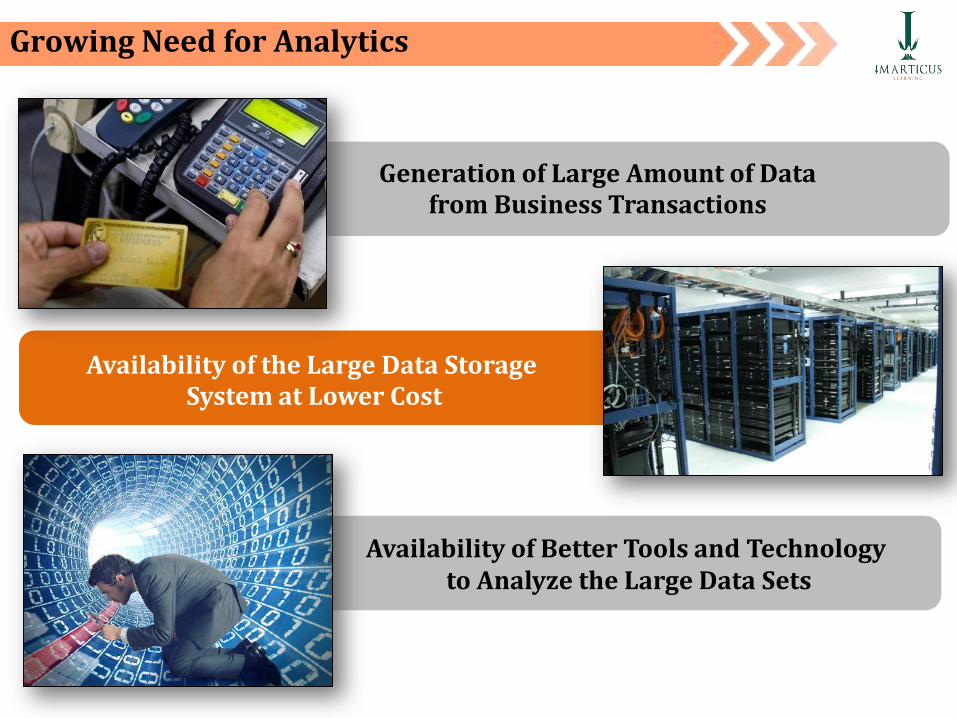
Growing Need for Analytics
Generation of Large Amount of Data
Availability of Better Tools and Technologyto Analyze the Large Data Sets
Generation of Large Amount of Data from Business Transactions
Availability of the Large Data StorageSystem at Lower Cost

Growing Need for Analytics (Contd.)
DATA HARNESSING
Companies store each piece of information
generated during the business
operations and customer
interactions.
DATA VOLUMESData is generated.
Learning from the data is used in the decision
making and process optimization.
Data is analyzed. 1.22010
2012
2014
2.4
5
Volumes in Trillion GB
DIDYOUKNOW
?
Generation of Large Amount of Data from Business Transactions
4
Billion
Number of
transactions
every year900
Number
of Stores
Number
of SKUs10000
-1 lakh

The Case for Business Analytics
• The Business environment today is more complex than ever before.
• Businesses are expected to be diligently responsive to the increasing demands of customers, various stakeholders and even regulators.
• Organizations have been turning to the use of analytics.
• More than 83% of Global CIOs surveyed by IBM in 2010 singled out Business Intelligence and Analytics as one of their visionary plans for enhancing competitiveness.
In most cases the primary objective of an organization that seeks to turn to analytics is:
Revenue/Profit growth •
Optimize expenditure•
SOLUTION
BUSINESS NEED
GOAL

Types of Analytics
12
1
32
Analytics
Prescriptive Analytics
Descriptive analytics Predictive analytics
Enabling smart decisions based on data
What should we do?
Mining data to providebusiness insights
What has happened?
Predicting the future based on historical patternsWhat could happen?

Types of Analytics
Prescriptive Analytics
advice on possible outcomes
Predictive Analytics
understanding the future
DescriptiveAnalytics
insight into the past
Why do airline prices
change every hour?
How do grocery cashiers
know to hand you coupons
you might actually use?
How does Netflix
frequently recommend
just the right movie?

Careers in Analytics
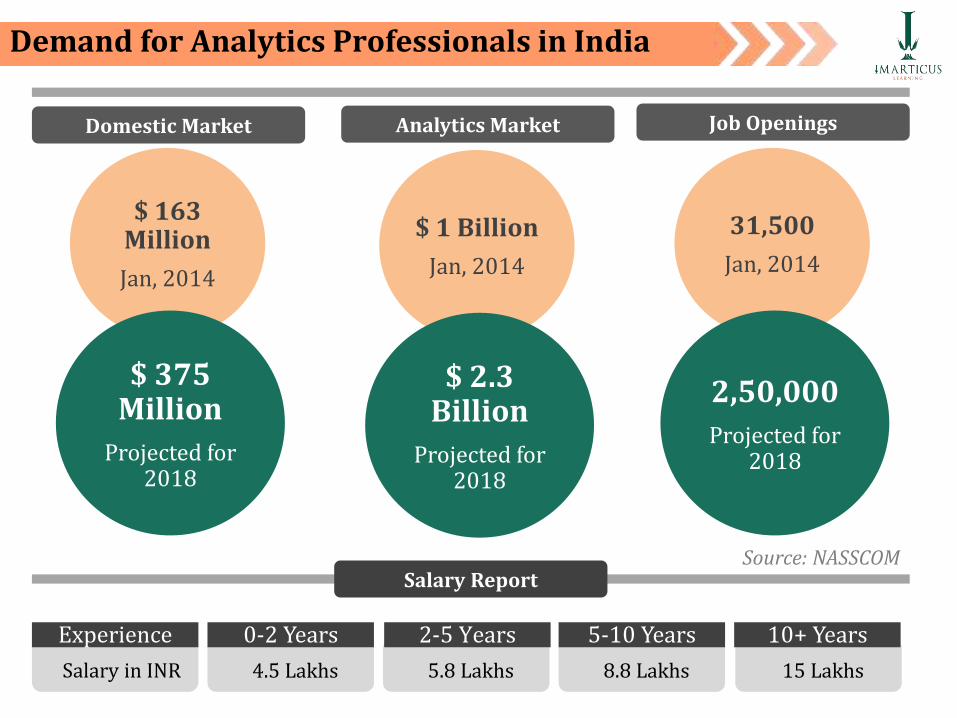
Demand for Analytics Professionals in India
$ 1 Billion
Jan, 2014
$ 2.3 Billion
Projected for 2018
Analytics Market
$ 163 Million
Jan, 2014
$ 375 Million
Projected for 2018
Domestic Market
31,500
Jan, 2014
2,50,000
Projected for 2018
Job Openings
Source: NASSCOMSalary Report
Experience
Salary in INR
0-2 Years
4.5 Lakhs
2-5 Years
5.8 Lakhs
5-10 Years
8.8 Lakhs 15 Lakhs
10+ Years

New Analytics Jobs By Industry
ANALYTICS SERVICES
BANKING
TOTAL NUMBER OF JOBS
PHARMA
Analytics Services and Pharma lead the pack in the highest percentage of Analytics jobs being created in developing nations.
US
INSURANCE
OIL & GAS
COMMUNICATIONS TECHNOLOGIES
INDIA CHINA UK BRAZIL JAPAN SINGAPORE
11%
14%
39%
20%
14%
2%
38,700 31,500 30,500 7,000 6,200 2,400 1,300
54%
24%
7%
11%
3%
1%
25%
32%
8%
22%
10%
3%
9%
19%
32%
25%
13%
2%
14%
30%
11%
19%
23%
3%
6%
44%
27%
14%
8%
1%
9%
26%
24%
25%
9%
7%

Employment Landscape in India
Large IT Companies who
have an Analytics Practice
Analytics KPOs
In-house Analytics Units of Large Corporates
Niche Analytics Firms

Global Clients
And Many More…

Career Options in Analytics
FIELDS IN ANALYTICS
TARGET AUDIENCE
• Data management • Data Exploration • MIS and report
creation • Automation of
reports
• Segmentation • Customer profiling• Portfolio Analysis• Trend Analysis• Forecasting
• Probability models• Classification and
regression trees• Time series
models
• Neural networks• Multi-layer
Perceptron• Geospatial models• Associative rule
learning• Inductive logic
programming
INDICATIVE JOB ROLES
KEY FEATURES
No matter what your educational background or aspirations, you have a fulfilling career in one of the many fields of Business Analytics.
MIS REPORTING
NON-PREDICTIVE ANALYTICS
PREDICTIVE ANALYTICS
MACHINE LEARNING
• BCom• B.E• BTech
MIS AnalystData Analyst
Strategy AnalystCost Analyst
Data ScientistStatistician
Advanced Analytics – Team ManagerMarket / Global Research Analyst
Analytics Manager
• BCom• B.E• BTech• MBAs
B.E•
BTech•
MSc (Statistics)•
MBAs•
MCA•
• B.E• BTech• MSc (Statistics)• MBAs• MCA
Tools for AnalyticsR
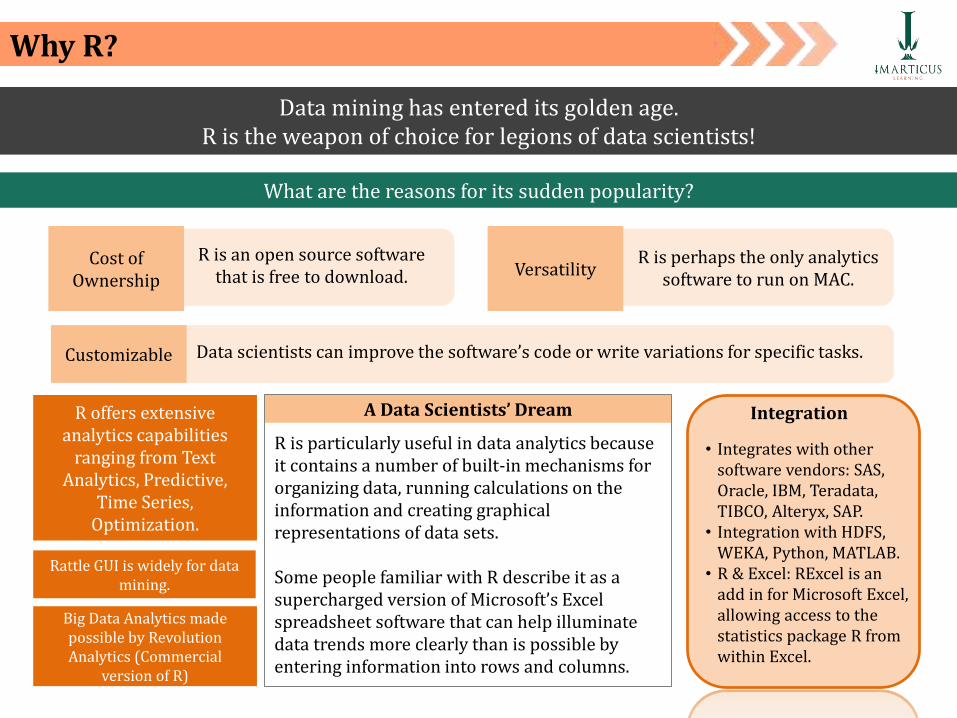
Why R?
Cost of Ownership
R is an open source software that is free to download. Versatility
R is perhaps the only analytics software to run on MAC.
Data mining has entered its golden age. R is the weapon of choice for legions of data scientists!
What are the reasons for its sudden popularity?
A Data Scientists’ Dream
R is particularly useful in data analytics because it contains a number of built-in mechanisms for organizing data, running calculations on the information and creating graphical representations of data sets.
Some people familiar with R describe it as a supercharged version of Microsoft’s Excel spreadsheet software that can help illuminate data trends more clearly than is possible by entering information into rows and columns.
R offers extensive analytics capabilities
ranging from Text Analytics, Predictive,
Time Series, Optimization.
Rattle GUI is widely for data mining.
Big Data Analytics made possible by Revolution Analytics (Commercial
version of R)
• Integrates with other software vendors: SAS, Oracle, IBM, Teradata, TIBCO, Alteryx, SAP.
• Integration with HDFS, WEKA, Python, MATLAB.
• R & Excel: RExcel is an add in for Microsoft Excel, allowing access to the statistics package R from within Excel.
Integration
Customizable Data scientists can improve the software’s code or write variations for specific tasks.
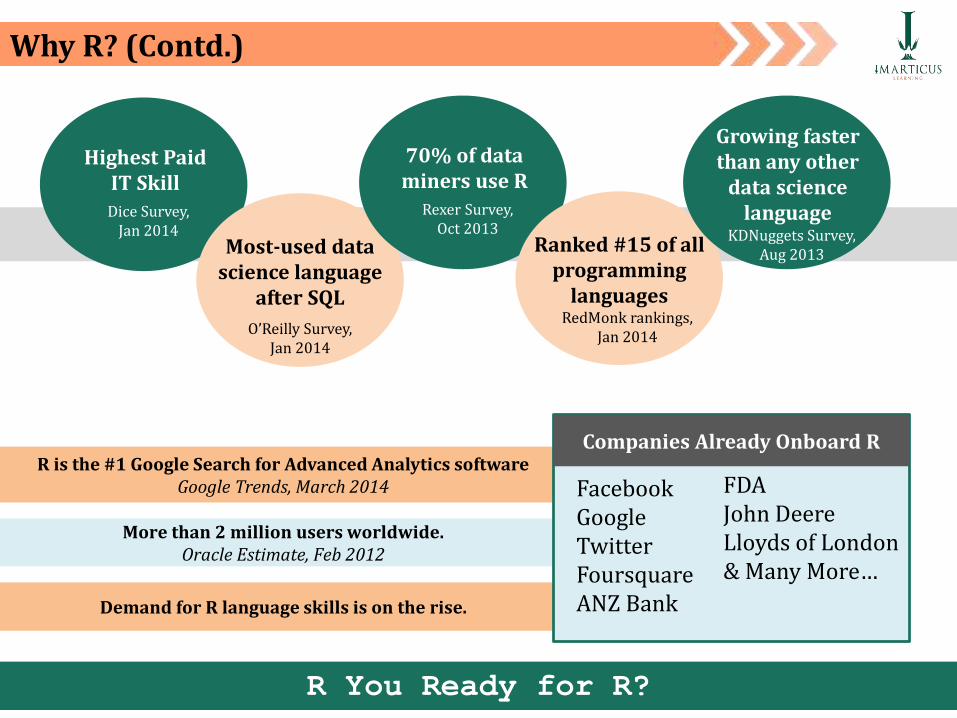
Why R? (Contd.)
R You Ready for R?
R is the #1 Google Search for Advanced Analytics software Google Trends, March 2014
Highest Paid IT Skill
Dice Survey, Jan 2014
Most-used data science language
after SQL
O’Reilly Survey, Jan 2014
70% of data miners use R
Rexer Survey, Oct 2013
Ranked #15 of all programming
languages RedMonk rankings,
Jan 2014
Growing faster than any other
data science language
KDNuggets Survey, Aug 2013
More than 2 million users worldwide. Oracle Estimate, Feb 2012
Demand for R language skills is on the rise.
FacebookGoogleTwitterFoursquareANZ Bank
FDAJohn DeereLloyds of London& Many More…
Companies Already Onboard R
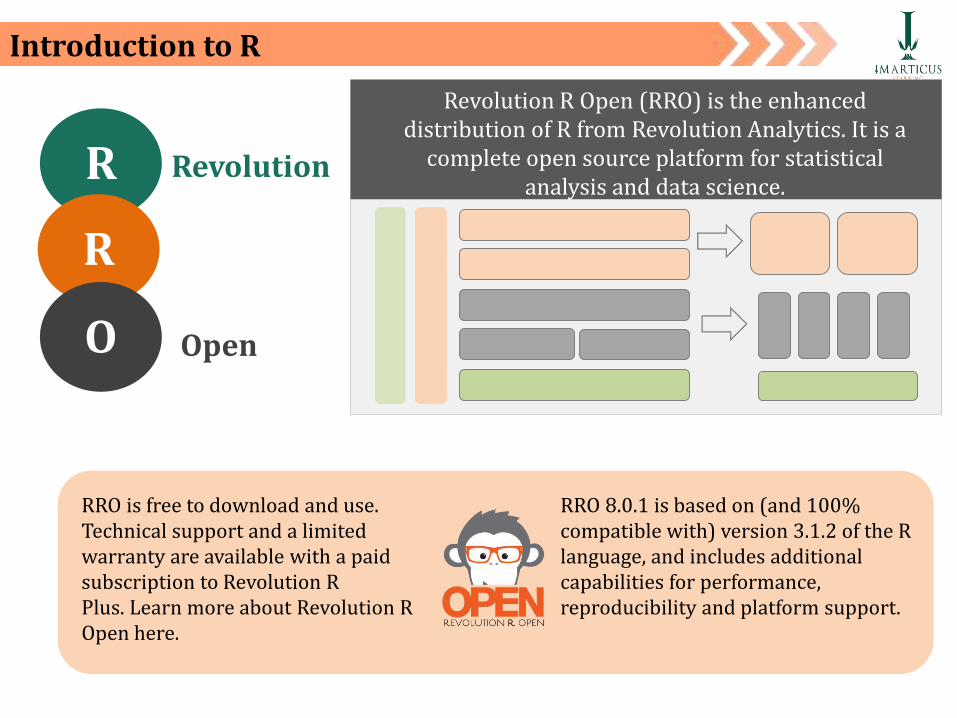
Introduction to R
R
R
O
Revolution
Open
Revolution R Open (RRO) is the enhanced distribution of R from Revolution Analytics. It is a
complete open source platform for statistical analysis and data science.
RRO 8.0.1 is based on (and 100% compatible with) version 3.1.2 of the R language, and includes additional capabilities for performance, reproducibility and platform support.
RRO is free to download and use. Technical support and a limited warranty are available with a paid subscription to Revolution R Plus. Learn more about Revolution R Open here.

sqldf
install.packages("sqldf")
forecastinstall.packages("forecast")
plyr
install.packages("plyr")
stringr
install.packages("stringr")
reshape2
install.packages("reshape2")
ggplot2
install.packages("ggplot2")
lubridateinstall.packages("lubridate")
The database driver package of your choice
Top 8 Packages in R
install.packages(c("sqldf", "forecast", "plyr","stringr", "lubridate" “ggplot2", "reshape2"))

&Thank You
For Your
Attention