certification report the certification of the mass...
TRANSCRIPT

CERTIFICATION REPORT
The certification of the mass fraction of the total content of As, Cd, Cu, Hg, Pb, Se and Zn
in Bladderwrack (Fucus vesiculosus): ERM- CD200
EU
R 26525 E
N - 2014

JRC-IRMM promotes a common and reliable European measurement system in support of EU policies. The primary task of JRC-IRMM is to build confidence in the comparability of measurement results by the production and dissemination of internationally accepted quality assurance tools. JRC-IRMM develops and validates testing methods, produces reference materials, organises measurement evaluation programmes, and provides reference measurements. European Commission Joint Research Centre Institute for Reference Materials and Measurements Contact information Reference materials sales Retieseweg 111 B-2440 Geel, Belgium E-mail: [email protected] Tel.: +32 (0)14 571 705 Fax: +32 (0)14 590 406 http://irmm.jrc.ec.europa.eu/ http://www.jrc.ec.europa.eu/ Legal Notice Neither the European Commission nor any person acting on behalf of the Commission is responsible for the use which might be made of this publication. Europe Direct is a service to help you find answers to your questions about the European Union Freephone number (*): 00 800 6 7 8 9 10 11 (*) Certain mobile telephone operators do not allow access to 00 800 numbers or these calls may be billed. A great deal of additional information on the European Union is available on the Internet. It can be accessed through the Europa server http://europa.eu/ JRC 88010 EUR 26525 EN ISBN 978-92-79-35531-8 (pdf) ISSN 1831-9424 (online) doi:10.2787/89880 Luxembourg: Publications Office of the European Union © European Union, 2014 Reproduction is authorised provided the source is acknowledged Printed in Belgium
CERTIFICATION REPORT
The certification of the mass fraction of the total content of As, Cd, Cu, Hg, Pb, Se and Zn in Bladderwrack
(Fucus vesiculosus): ERM- CD200
Anna Santoro, James Snell, Håkan Emteborg, Marie-France Tumba-Tshilumba, Andrea Held
European Commission, Joint Research Centre Institute for Reference Materials and Measurements (IRMM)
Geel, Belgium

Disclaimer Certain commercial equipment, instruments, and materials are identified in this paper to specify adequately the experimental procedure. In no case does such identification imply recommendation or endorsement by the European Commission, nor does it imply that the material or equipment is necessarily the best available for the purpose.

1
Summary
This report describes the production of ERM-CD200, a powdered bladderwrack material (species Fucus vesiculosus) certified for the mass fraction of the total content of As, Cd, Cu, Hg, Pb, Se and Zn. The material was produced following ISO Guide 34:2009 [1].
Approximately 60 kg of brown algae seaweed (bladderwrack, Fucus vesiculosus) was collected in Galway (Ireland) and processed at IRMM (Belgium) to produce a certified reference material (CRM) of seaweed powder. The produced vials containing the processed seaweed were carefully capped, sealed and stored for further certification studies.
Between-unit homogeneity was quantified as well as stability during dispatch and storage in accordance with ISO Guide 35:2006 [2]. Within-unit homogeneity was also quantified to determine the minimum sample intake.
The material was characterised by an inter-laboratory comparison among laboratories of demonstrated competence and adhering to ISO/IEC 17025. Technically invalid results were removed but no outlier was eliminated on statistical grounds only.
Uncertainties of the certified values were calculated in compliance with the Guide to the Expression of Uncertainty in Measurement (GUM) [3] including uncertainty contribution related to possible heterogeneity and instability of the material as well as to the characterisation.
The material is intended for the quality control and assessment of method performance. As any reference material, it can also be used for control charts or validation studies.
The CRM is available in amber glass vials containing approximately 5 g of dried powder, placed in aluminized polythene sachet closed under a nitrogen atmosphere.
The minimum amount of sample to be used is 200 mg.
The CRM was accepted as European Reference Material (ERM®) after peer evaluation by the partners of the European Reference Materials consortium.
The following values were assigned: Certified values
Mass fraction
Certified value 1,2) [mg/kg]
Uncertainty 3)
[mg/kg] As Cd Cu Hg Pb Se Zn
55 0.95 1.71
0.0186 0.51
0.088 25.3
4 0.06 0.18
0.0016 0.06 0.010 1.7
1) Unweighted mean value of the means of accepted sets of data, each set being obtained in a different laboratory and/or with a different method of determination. The certified value and its uncertainty are traceable to the International System of Units (SI).
2) Certified mass fractions are corrected for the water content of the material (and expressed as dry mass), determined as described in the section "Instructions for use".
3) The uncertainty is expanded with a coverage factor k = 2 corresponding to a level of confidence of about 95 % estimated in accordance with ISO/IEC Guide 98-3, Guide to the Expression of Uncertainty in Measurement (GUM:1995), ISO, 2008.

2

3
1 Table of content Summary ………………………………………………………………………...……………….…1 1 Table of content ......................................................................................................... 3 2 Glossary .................................................................................................................... 4 1 Introduction ................................................................................................................ 7 1.1 Background: need for the CRM .................................................................................. 7 1.2 Choice of the material ................................................................................................ 7 1.3 Design of the project .................................................................................................. 7 2 Participants ................................................................................................................ 7 2.1 Project management and evaluation .......................................................................... 7 2.2 Collection of material and Processing ........................................................................ 7 2.3 Homogeneity study .................................................................................................... 7 2.4 Stability study (alphabetic order) ................................................................................ 8 2.5 Characterisation (alphabetic order) ............................................................................ 8 2.6 Additional material information ................................................................................... 8 3 Material processing and process control .................................................................... 9 3.1 Origin and processing of the material ......................................................................... 9 3.2 Process control .......................................................................................................... 9 4 Assessment of homogeneity .....................................................................................10 4.1 Between-unit homogeneity........................................................................................10 4.2 Within-unit homogeneity and minimum sample intake...............................................12 5 Stability .....................................................................................................................13 5.1 Short-term stability study ..........................................................................................13 5.2 Long-term stability study ...........................................................................................14 5.3 Estimation of uncertainties ........................................................................................15 6 Characterisation study ..............................................................................................16 6.1 Selection of participants ............................................................................................16 6.2 Study setup ...............................................................................................................16 6.3 Methods used ...........................................................................................................17 6.4 Evaluation of results .................................................................................................17 6.4.1 Technical evaluation .................................................................................................17 6.4.2 Statistical evaluation .................................................................................................18 7 Value Assignment .....................................................................................................19 7.1 Certified values and their uncertainties .....................................................................19 7.2 Additional material information ..................................................................................20 8 Metrological traceability and commutability ...............................................................21 8.1 Metrological traceability ............................................................................................21 8.2 Commutability ...........................................................................................................21 9 Instructions for use ...................................................................................................22 9.1 Storage conditions ....................................................................................................22 9.2 Safety and protection for the environment .................................................................22 9.3 Preparation and use of the material ..........................................................................22 9.4 Minimum sample intake ............................................................................................22 9.5 Dry mass correction ..................................................................................................22 9.6 Use of the certified value ..........................................................................................22 10 Acknowledgments .....................................................................................................23 11 References ...............................................................................................................23 Annexes ...............................................................................................................................24

4
2 Glossary
AAS Atomic absorption spectrometry AFS Atomic fluorescence spectrometry ANOVA Analysis of variance b Slope in the equation of linear regression y = a + bx BCR® Trademarks of CRMs owned by the European Commission; formerly
Community Bureau of Reference CI Confidence interval CRM Certified reference material CV-AAS Cold vapour atomic absorption spectrometry CV-AFS Cold vapour atomic fluorescence spectrometry DMA Direct Mercury Analyzer EC European Commission ERM® Trademark of European Reference Materials EU European Union ET-AAS Electrothermal atomic absorption spectrometry FAAS Flame atomic absorption spectrometry GUM Guide to the Expression of Uncertainty in Measurements
[ISO/IEC Guide 98-3:2008] ICP Inductively coupled plasma ICP-MS Inductively coupled plasma-mass spectrometry ICP-SFMS ICP-Sector-field mass spectrometry ID Isotope dilution (I)NAA (Instrumental) neutron activation analysis IRMM Institute for Reference Materials and Measurements of the JRC ISO International Organization for Standardization JRC Joint Research Centre of the European Commission LOD Limit of detection k Coverage factor k0-NAA k0-Neutron Activation Analysis KFT Karl Fischer titration MS Mass spectrometry MSbetween Mean of squares between-unit from an ANOVA MSwithin Mean of squares within-unit from an ANOVA MW Microwave n Number of replicates per unit N Number of samples (units) analysed n.a. Not applicable n.c. Not calculated OES Optical emission spectrometry p Number of independent observations PSA Particle size analysis PT Proficiency testing QC Quality control rel Index for 'relative' RM Reference material RSD Relative standard deviation r2 Coefficient of determination of the linear regression s Standard deviation sbb
Between-unit standard deviation sbetween Standard deviation between groups as obtained from ANOVA SF-MS Sector-field mass spectrometry SI International System of Units
5
smeas Standard deviation of measurement data swithin Standard deviation within groups as obtained from ANOVA swb Within-unit standard deviation T Temperature t Time ti Time point for each replicate tsl Proposed shelf life u Standard uncertainty U Expanded uncertainty u*
bb Standard uncertainty related to a maximum between-unit heterogeneity that could be hidden by method repeatability
ubb Standard uncertainty related to a possible between-unit heterogeneity uc Combined standard uncertainty ucal Standard uncertainty of calibration uchar Standard uncertainty of the material characterisation uCRM Combined standard uncertainty of the certified value UCRM Expanded uncertainty of the certified value u∆ Combined standard uncertainty of measurement result and certified
value ults Standard uncertainty of the long-term stability um Standard uncertainty of the measurement Umeas Expanded uncertainty of the measurement urec Standard uncertainty related to possible between-unit heterogeneity
modelled as rectangular distribution usts Standard uncertainty of the short-term stability UV Ultraviolet V Volume Vis Visible WFD Water Framework Directive x Arithmetic mean α significance level ∆m Absolute difference between mean measured value and the certified
value νsmeas Degrees of freedom for the determination of the standard deviation smeas
MSwithinν Degrees of freedom of MSwithin

6

7
1 Introduction 1.1 Background: need for the CRM
The certified reference material ERM-CD200 has been developed to satisfy the demands of laboratories dealing with environmental and food safety analyses. In particular, the European Water Framework Directive 2000/60/EC, although not providing metal concentration limits in algae, suggests the use of (macro)algae as an indicator of water quality [4]. ERM-CD200 is intended mainly for verification of the accuracy of trace element measurement in algae and similar matrices.
1.2 Choice of the material
Among the three groups of algae (red, green, brown), brown algae demonstrated to be an efficient class of biosorbents, especially for Cd, Cu, Zn, Pb, Cr and Hg in water and wastewater; due to their higher uptake capacity compared to red and green algae.
Fucus vesiculosus together with Ascophillum nodosus are increasingly used for the purpose of environmental monitoring, especially for water quality control [5]. Some European countries (mainly Finland, Sweden, Germany and the UK) used macroalgae (and in particular Fucus vesiculosus) as a marine bioindicator.
Furthermore, brown algae are used in the preparation of foods, cosmetics and medicines for their nutritional and therapeutic properties, which makes them of interest to analysts and scientists concerned with monitoring levels of trace elements [6].
1.3 Design of the project
ERM-CD200 has been certified for its total content of As, Cd, Cu, Hg, Pb, Se and Zn through the results of an inter-laboratory comparison.
2 Participants
2.1 Project management and evaluation European Commission, Joint Research Centre, Institute for Reference Materials and Measurements (IRMM), Geel (BE) (accredited to ISO Guide 34 for production of certified reference materials, BELAC No 268-RM)
2.2 Collection of material and Processing European Commission, Joint Research Centre, Institute for Reference Materials and Measurements (IRMM), Geel, BE) (accredited to ISO Guide 34 for production of certified reference materials, BELAC No 268-RM)
Martin Ryan Institute, Galway, IE)
2.3 Homogeneity study European Commission, Joint Research Centre, Institute for Reference Materials and Measurements (IRMM), Geel, BE) (accredited to ISO Guide 34 for production of certified reference materials, BELAC No 268-RM)
ALS Scandinavia AB, Luleå, SE) (Measurements performed under the scope of ISO/IEC 17025 accreditation, SWEDAC-1087)

8
2.4 Stability study (alphabetic order) European Commission, Joint Research Centre, Institute for Reference Materials and Measurements (IRMM), Geel (BE) (accredited to ISO Guide 34 for production of certified reference materials, BELAC No 268-RM)
ALS Scandinavia AB, Luleå (SE) (Measurements performed under ISO/IEC 17025 accreditation; SWEDAC 1087)
ChemService S.r.l. Controlli e ricerche, Milano (IT) (Measurements performed under the scope of ISO/IEC 17025 accreditation; SINAL-0004)
Umweltbundesamt, Umweltanalytik & Chemikalien, Wien (AT) (Measurements performed under the scope of ISO/IEC 17025 accreditation, BMWA-92.714/0518-I)
2.5 Characterisation (alphabetic order) European Commission, Joint Research Centre, Institute for Reference Materials and Measurements (IRMM), Geel (BE) (accredited to ISO Guide 34 for production of certified reference materials, BELAC No 268-RM)
ALS Scandinavia AB, Luleå (SE) (Measurements performed under the scope of ISO/IEC 17025 accreditation, SWEDAC-2030) Ceinal, S.A. (Silliker), Área Análisis Físico-Químicos, Barcelona (ES) (Measurements performed under ISO/IEC 17025 accreditation; ENAC 257/LE413)
Centre for Environment, Fisheries and Aquaculture Science, Lowestoft (UK) (Measurements performed under ISO/IEC 17025 accreditation; UKAS 1875)
Comisión Nacional de Energía Atómica (CNEA), Bariloche, Laboratorio de Análisis por Activación Neutrónica, Argentina (AR) Fødevareinstituttet, Danmarks Tekniske Universitet, Søborg (DK) (Measurements performed under the scope of ISO/IEC 17025 accreditation, DANAK-350)
The Food and Environment Research Agency, York (UK) (Measurements performed under ISO/IEC 17025 accreditation; UKAS 1642)
Institut "Jozef Stefan" (IJS), Department of Environmental Sciences, Ljubljana (SI) (Measurements performed under the scope of ISO/IEC 17025 accreditation, Slovenka Akreditacija-LP090)
INRIM – Unità di Radiochimica e Spettroscopia, Dipartimento di Chimica, Pavia (IT) MTT – Agrifood Research Finland, Jokioinen (FI) (Measurements performed under the scope of ISO/IEC 17025 accreditation, FINAS-T024)
Studiecentrum voor Kernenergie (SCK), Mol (BE) (Measurements performed under the scope of under ISO/IEC 17025 accreditation; BELAC, 015-TEST)
TÜBITAK – UME, Gebze Yerleşkesi, Gebze/Kocaeli, Turkey (TR) Umweltbundesamt, Umweltanalytik & Chemikalien, Wien (AT) (Measurements performed under the scope of ISO/IEC 17025 accreditation, BMWA-92.714/0518-I)
Vlaamse instelling voor technologisch onderzoek (VITO), Mol (BE) (Measurements performed under the scope of ISO/IEC 17025 accreditation; BELAC, 045-TEST)
2.6 Additional material information European Commission, Joint Research Centre, Institute for Reference Materials and Measurements (IRMM), Geel, BE (accredited to ISO Guide 34 for production of certified reference materials, BELAC No 268-RM)
Sympatec Benelux, Clausthal-Zellerfeld, DE

9
3 Material processing and process control
3.1 Origin and processing of the material
The material used for the production of ERM-CD200 is brown algae bladderwrack (Fucus vesiculosus), a large olive-brown coloured seaweed, which can grow up to 2m in length. It can be found on the middle-shore, where it grows attached to rocky substrates, often associated with knotted wrack (Ascophyllum nodosum). Fucus vesiculosus occurs around the coastline of Britain, Ireland, the Baltic Sea, Norway, the Atlantic coast of France, Spain and Morocco, as well as Greenland, and the eastern coasts of Canada and the USA.
The raw material used for the production of ERM-CD200 originates from Galway, in Ireland.
Sixty kg of brown algae seaweed were collected at two sites, in Silver Strand beach and Spiddal (IE). Plants were cut above the holdfast by using a sharp knife, immediately rinsed with seawater to remove debris and sand and then collected in bags. In the laboratory, plants were checked for large epiphytes and other animal material, briefly rinsed in freshwater and immediately frozen at - 20 °C.
Afterwards, the frozen raw material was transported to the IRMM (BE) in order to be processed under controlled humidity and temperature conditions.
At the processing sector of IRMM (BE), the frozen algae was slowly defrosted at room temperature, washed with deionised water to eliminate excess sand, dried in a drying cabinet (Elbanton, Kerkdriel, NL) at 25 ± 5 °C and milled with a cryo-grinding vibrating mill (Palla mill, KHD, Humboldt-Wedag, Köln, DE) which was previously cooled to about -190 °C. The dried material was sieved at 125 µm and finally mixed for several hours using a DynaMix CM200 mixer (WAB, Basel, CH). The mixed powder was filled into 5 g portions into acid washed 30 mL amber glass bottles using an automatic filling machine (Allfill, Sandy, UK). Bottles were then labelled and capped using an assembly from Bausch & Ströbel (Ilshofen, DE) and BBK (Beerfelden, DE).
3.2 Process control
Particle size distribution was checked from the beginning to the end of the processing by using a Sympatec Helos particle analyser (Clausthal-Zellerfeld, DE) on randomly selected units. The resulting material showed an average particle size of ca. 100 µm (Figure 1). An inter-comparison study on PSA was also performed and details are given in section 7.3.
Figure 1: Average particle size distribution obtained using 2-propanol as dispersant (3 replicates)
10
The moisture level was decreased to a final value of 2.5 % by vacuum drying the milled algae before bottling. A batch of about 1200 vials (units) was then produced and each unit was placed in aluminized polythene sachets flushed with nitrogen gas.
All units were sterilised by gamma irradiation (Isotron B.V., NL) with a minimum radiation dose of 15 kGy.
4 Assessment of homogeneity
A key requirement for any reference material is the equivalence between the various units. In this respect, it is not relevant whether the variation between units is significant compared to the analytical variation, but whether this variation is significant to the certified uncertainty. Consequently, ISO Guide 34 requires RM producers to quantify the between unit variation. This aspect is covered in between-unit homogeneity studies. The within-unit homogeneity does not influence the uncertainty of the certified value when the minimum sample intake is respected, but determines the minimum size of an aliquot that is representative for the whole unit. Quantification of within-unit homogeneity is therefore necessary to determine the minimum sample intake. 'Unit' is defined as an individual glass bottle of ERM-CD200.
4.1 Between-unit homogeneity
The between-unit homogeneity was evaluated to ensure that the certified values of the CRM are valid for all 1200 units, within the stated uncertainty.
For the between-unit homogeneity test, 11 units were selected using a random stratified sampling scheme covering the whole batch, which was divided into 11 groups (with about 110 units per group). One unit was randomly selected from each group. Three independent aliquots were taken from each unit and were digested in concentrated HNO3 at elevated temperature and pressure, using a microwave apparatus. All elements were measured by ICP-SFMS. The measurements were performed under repeatability conditions, and in a randomised manner to be able to separate a potential analytical drift from a trend in the filling sequence. The results were corrected for the water content determined in each bottle number (see section 9.5). All results are reported in Annex A.
Regression analyses were performed to evaluate potential trends in the analytical sequence as well as trends in the filling sequence. No trends in the filling or analytical sequences were detectable for any of the measured elements at the 99 % confidence level. The datasets were also tested for consistency using Grubbs outlier tests on a confidence level of 99 % on individual results and unit means. Some outlying unit means were detected. However, as no technical reason for the outliers could be identified, all data were retained for the final statistical analysis.
Quantification of between-unit heterogeneity was done by analysis of variance (ANOVA), which can separate the between-unit variation (sbb) from the within-unit variation (swb). The latter is equivalent to the method repeatability if the individual aliquots are representative for the whole unit.
Evaluation by ANOVA requires that the unit means should follow at least a unimodal distribution and results for each unit should also follow at least unimodal distribution with approximately the same standard deviations. Minor deviations of the individual values from

11
unimodality do not affect the estimate of between-unit standard deviations. Distribution of the unit averages was tested using histograms and normal probability plots. The results of all statistical evaluations are given in Table 1.
Table 1: Results of the homogeneity study for ERM-CD200
Element Trends Outliers Distribution
Analytical sequence
Filling sequence
Individual results
Unit means Individual results
Unit means
As no no - 1 unimodal unimodal
Cd no no - - unimodal unimodal
Cu no no - 1 normal unimodal
Hg no no - - normal normal
Pb no no - - normal normal
Se no no - - normal unimodal
Zn no no - - normal normal
Method repeatability (swb,rel), between–unit standard deviation (sbb,rel) and u*bb,rel were
calculated as
y within
rel,wb
MSs =
yn
MSMS
s
withinbetween
rel,bb
−
=
sbb,rel and swb,rel are estimates of the true standard deviations and are therefore subject to random fluctuations. Therefore, the mean square between groups (MSbetween) can be smaller than the mean squares within groups (MSwithin), resulting in negative arguments under the square root used for the estimation of the between-unit variation, whereas the true variation cannot be lower than zero. In this case, u*
bb, the maximum heterogeneity that could be hidden by method repeatability, was calculated as described by Linsinger et al. [7]. u*
bb is comparable to the limit of detection of an analytical method, yielding the maximum inhomogeneity that might be undetected by the given study setup.
y
νn
MS
u MSwithin
within
*rel,bb
42
=
MSwithin mean square within a unit from an ANOVA
MSbetween: mean squares between-unit from an ANOVA
y average of all results of the homogeneity study
n: average number of replicates per unit

12
MSwithinν : degrees of freedom of MSwithin
A different approach was adopted for As and Cu for which outlying unit averages were detected. In these cases, as the presence of outlying individual values do not exactly reflects the real distribution of these elements in the material, between-unit heterogeneity was modelled as a rectangular distribution limited by the largest outlying unit average, and the rectangular standard uncertainty of homogeneity was estimated by
y
youtlieru relrec ⋅
−=
3,
where:
y = average of all results of the homogeneity study
The results of the evaluation of the between-unit variation are summarised in Table 2.
Table 2: Results of the homogeneity study; n.c.: cannot be calculated as MSbetween < MSwithin
n.a.: not applicable
Element swb,rel [%]
sbb,rel [%]
u*bb,rel
[%] urec,rel [%] ubb,rel
[%]
As 1.95 1.55 0.62 2.83 2.83
Cd 1.66 n.c. 0.53 n.a. 0.53
Cu 2.57 1.97 0.81 3.74 3.74
Hg 3.64 2.55 1.16 n.a. 2.55
Pb 2.88 1.99 0.91 n.a. 1.99
Se 4.58 2.31 1.45 n.a. 2.31
Zn 2.45 0.92 0.78 n.a. 0.92
The homogeneity study showed no trends in the filling sequence and no outlying unit means for Cd, Hg, Pb, Se and Zn. Thus, the between-unit standard deviation for these elements can be used as estimate of ubb. As u*
bb sets the limit of the detection for the homogeneity study, the larger value of sbb and u*
bb is adopted as uncertainty contribution to account for potential heterogeneity. Two outlying unit means were found for As and Cu and the inhomogeneity was quantified as urec, taking the outlying values into account. For these elements, urec was used as estimate of ubb. When combined as described in section 7.1 to give the uncertainties on the certified values, UCRM, these were still found to be suitably low to allow the material to be used as intended, for method validation.
4.2 Within-unit homogeneity and minimum sample intake
The within-unit homogeneity is closely correlated to the minimum sample intake. Due to the intrinsic heterogeneity, individual aliquots of a material will not contain the same amount of analyte. The minimum sample intake is the minimum amount of sample that is representative for the whole unit and thus can be used in an analysis. Sample sizes equal or above the minimum sample intake guarantee the certified value within its stated uncertainty.

13
In this study, the minimum sample intake was assessed by using the method information supplied by the laboratories participating in the characterisation study. The smallest sample intake that still yielded results with acceptable trueness to be included in the respective studies was taken as minimum sample intake. Almost half the laboratories used a sample intake of between 200 and 300 mg. For each set of measurements from these laboratories, the measurement RSD lay well below the assigned UCRM,rel for each of the elements. Therefore the minimum sample intake is set to 200 mg for all elements.
For Hg, one laboratory used a technique with a mean sample intake of 36 mg. This returned measurement RSD of 7 %, in comparison with the UCRM,rel of 8 %. This indicates that sample intakes of this level may be suitable for Hg measurement. However, as this could not be confirmed by measurement with other techniques, the minimum sample intake for Hg was also set to 200 mg.
5 Stability Stability testing is necessary to establish conditions for dispatching ERM-CD200 to customers (short-term stability) as well as conditions for storage (long-term stability).
Time, temperature and light were regarded as the most relevant influences on stability of the materials. The influence of light was minimised by the choice of the container that eliminates most of the incoming light (i.e. amber bottles placed in aluminized sachet). In addition, materials are stored and dispatched in the dark, thus practically eliminating the possibility of degradation by light. Therefore, only the influences of time and temperature needed to be investigated. During transport, especially in summer time, temperatures up to 60 °C could be reached and stability under these conditions must be demonstrated if transport at ambient temperature will be applied.
The stability studies for ERM-CD200 were carried out using an isochronous design [8]. In this approach, selected units are stored for a certain time at different temperature conditions. Afterwards, the units are moved to conditions where further degradation can be assumed to be negligible ("reference conditions"), effectively "freezing" the degradation status of the materials. At the end of the isochronous storage, the units are analysed simultaneously under repeatability conditions; improving in this way the sensitivity of the stability tests.
5.1 Short-term stability study
A specific number of units were selected using a random stratified sampling scheme from the whole batch produced and stored for time periods of 0, 1, 2 and 4 weeks at two different temperatures, 18 °C and 60 °C (test conditions). The reference temperature was set to -20°C. Two units were stored for each time/temperature combination, with the exception of time point 0 for which only 2 bottles were set aside. The total number of units reserved for this study was 14. All units were analysed in triplicate at the end of the study providing a total of 6 results per time/temperature combination. Each unit was digested by using a mixture of HNO3 and HCl for As, Cd, Cu, Pb and Zn or HNO3, H2O2 and HF for Hg and Se. The measurements were performed by means of an ICP-OES for As, Cd, Cu, Pb and Zn and ETAAS or CV-AAS for Se and Hg, respectively. The measurements were performed under repeatability conditions, and in a randomised manner to be able to separate a potential analytical drift from a trend over storage time. The results were corrected for the water content determined in each unit by using the procedure in section 9.5.
The obtained data were evaluated individually for each temperature (18 °C and 60 °C). The results were screened for outliers using the single and double Grubbs test. No outlying values were evidenced by single or double Grubbs test at the 99 % confidence level. Regression lines of mass fraction against storage time were calculated. The slopes were

14
then tested for statistical significance (which indicates loss/increase due to shipping conditions). In all cases the slopes of the regression lines were not significantly different from zero at 18 °C and 60 °C.
The results of the measurements are shown in Annex B, while the results of the statistical evaluation of the short-term stability are summarised in Table 3.
Table 3: Results of the short-term stability tests
Element Number of individual outlying results
Significance of the trend at a 99% confidence level
18 ºC 60 ºC 18 ºC 60 ºC
As none none no no
Cd none none no no
Cu none none no no
Hg none none no no
Pb none none no no
Se none none no no
Zn none none no no
No outliers were observed and no trend was statistically significant at a 99 % confidence level for any of the temperatures. As the material showed no sign of degradation at 60 ºC, it may be transported at ambient conditions without further precautions.
5.2 Long-term stability study
For the long-term stability study, units were selected from the whole batch produced by a random stratified sampling scheme and stored for 0, 8, 16 and 24 months at 18 °C. The reference temperature was set to -20 °C. Two units were stored for each time/temperature combination, with the exception of 2 units for time point 0. From each unit, three aliquots were digested in HNO3 and H2O2 using a microwave system. Measurements were performed under repeatability conditions using ICP-MS, and in a randomised manner to be able to separate a potential analytical drift from a trend over storage time. The results were corrected for the water content determined in each unit as described in section 9.5.
The data obtained were evaluated and screened for outliers using the single and double Grubbs test, and no outlying individual results were found significant at a 99 % confidence interval (Table 4). Regression lines of mass fraction against storage time were calculated. The slopes of the regression lines were then tested for statistical significance (which indicates loss/increase due to storage conditions). For all elements, the slopes of the regression lines were not significantly different from 0 (on 99 % confidence level) for the 18 °C test condition.
The results of the measurements are shown in Annex C, and the results of the statistical evaluation of the long-term stability study are summarised in Table 4.

15
Table 4: Results of the long-term stability tests for ERM-CD200
Element Number of individual outlying results
Significance of the trend on a 99% confidence level
18 ºC 18 ºC
As none no
Cd none no
Cu none no
Hg none no
Pb none no
Se none no
Zn none no
No technically unexplained outliers were observed and none of the trends was statistically significant at a 99 % confidence level for any of the temperatures. The material can therefore be stored at 18 ± 5 °C.
5.3 Estimation of uncertainties
Due to the intrinsic variation of measurement results, no study can rule out degradation of materials completely, even in the absence of statistically significant trends. It is therefore necessary to quantify the potential degradation that could be hidden by the method repeatability, i.e. to estimate the uncertainty of stability. This means, even under ideal conditions, the outcome of a stability study can only be "degradation is 0 ± x % per time". Uncertainties of stability during dispatch and storage were estimated as described in [9] for each element. In this approach, the uncertainty of the linear regression line with a slope of zero is calculated and the uncertainty contributions usts and ults are then estimated as the product of the chosen shelf life and the uncertainty of the regression lines as:
( ) tt2i
rel,sts txx
RSDu ⋅
−=∑
( ) sl
i
rel,lts txx
RSDu ⋅
−=∑
2
RSD relative standard deviation of all results of the stability study
xi result at time point i
x mean results for all time points
ttt chosen transport time (1 week at 60 ºC)
tsl chosen shelf life (24 months at 18 ºC)
The following uncertainties were estimated: • usts,rel, the uncertainty of degradation during dispatch was estimated from the 60 °C
studies for a time of 0.25 months (1 week). The uncertainty therefore describes the possible change during a dispatch at 60 °C lasting for one week.

16
• ults,rel, the uncertainty of the stability during storage was estimated from the study at 18 °C. The uncertainty contribution therefore describes the possible degradation for 24 months (2 years) at 18°C.
The results of these evaluations are summarised in Table 5. Table 5: Uncertainties of stability during storage and dispatch. usts,rel was calculated for a temperature of 60 °C and 1 week; ults,rel was calculated for a storage temperature of 18 °C and 2 years (24 months).
Element usts ,rel [%], 60 ºC ults,rel [%], 18 ºC
As 1.31 1.43
Cd 1.88 1.08
Cu 2.34 1.39
Hg 0.68 1.66
Pb 2.46 0.91
Se 0.64 3.15
Zn 1.68 1.25 After the certification campaign, the material will be subjected to IRMM's regular stability monitoring programme to further control its stability.
6 Characterisation study
The characterisation of the material was based on an inter-laboratory comparison study. The mass fractions of As, Cd, Cu, Hg, Pb, Se and Zn in ERM-CD200 were determined in different laboratories applying different measurement procedures to demonstrate the absence of measurement bias. This approach aims at randomisation of laboratory bias, which reduces the combined uncertainty.
6.1 Selection of participants
Thirteen laboratories were selected based on criteria that comprised both technical competence and quality management aspects. Each participant was required to operate a quality system and to deliver documented evidence of its laboratory proficiency in the field of trace element measurements in algae or similar matrices by submitting results for inter-laboratory comparison exercises or method validation reports. Having a formal accreditation was not mandatory, but meeting the requirements of ISO/IEC 17025 was obligatory. Whereas measurements are covered by the scope of accreditation, the accreditation number is stated in the list of participants (section 2).
Some participants were able to measure one or more elements by two or more independent techniques. Such measurements were listed under separate lab codes as independent measurement results.
6.2 Study setup
The units for this study were selected using a randomly stratified sampling scheme covering the whole batch produced. Each laboratory received a minimum of 2 units (depending on the methods used) of ERM-CD200 and was requested to provide three independent results per

17
unit. The measurements, including sample preparation (when needed), had to be spread over at least two days to ensure intermediate precision conditions. The water content had to be determined in each unit and results had to be reported on dry mass basis (section 9.5). Each participant also received a bottle of BCR-279 (Seaweed) as a blind quality control (QC) sample. The results for BCR-279 were used to support the evaluation of the characterisation results. Laboratories were also requested to give estimations of the expanded uncertainties of the mean value of the six results. No approach for the estimation of measurement uncertainty was prescribed, with top-down and bottom-up approaches regarded as equally valid.
6.3 Methods used
A variety of digestion procedures (using HNO3, H2O2 and HF amongst other reagents) with different quantification steps (AAS, ICP-OES and ICP-MS, amongst others) as well as methods without sample preparation (for example, pyrolysis AAS and k0-NAA) were used to characterise the material. The combination of results from methods based on completely different principles mitigates undetected method bias. All methods used during the characterisation study are summarised in Annex D. The laboratory code (e.g. L01) is a random number and does not correspond to the order of laboratories in section 2.
6.4 Evaluation of results
The characterisation campaign resulted in between 8 and 14 laboratory means per element. All individual results of the participants, grouped per element are displayed in tabular and graphical form in Annex E.
6.4.1 Technical evaluation The obtained data were first checked for compliance with the requested analysis protocol and for their validity based on technical reasons. The following criteria were considered during the evaluation:
- appropriate validation of the measurement procedure
- compliance with the analysis protocol: sample preparations and measurements performed on two days, the order of analysis and water content determination.
- absence of values given as below the limit of quantification - method performance; relative standard deviation (RSD) within and between bottle or
day of measurement (≤ 20 %), agreement of the measurement results with the assigned value of the QC sample BCR-279 [12]
Some datasets were rejected as not technically valid, based on the abovementioned criteria. One laboratory measured all samples on one day only, and their results were therefore excluded. A detailed description of the technical evaluation of the data from the remaining labs is given, by element, in Table 6.
Table 6: Datasets that showed non-compliances with the analysis protocol and technical specifications, and action taken

18
Element Lab code Description of problem Action taken
As L07 Technical problem due to As
concentration higher than method working range
Value not used for evaluation
Cd L02, L04 Results < LOQ Values not used
for evaluation
Cu L02 L11
Results < LOQ Difference between days > 20 %
Values not used for evaluation
Hg L02 L11
Difference between days > 20 % Measurements of QC sample did not agree with assigned values
Values not used for evaluation
Pb L13 Difference between days > 20 % Value not used for evaluation
Se L07, L11, L13
L04
Measurements of QC sample did not agree with assigned values
Results < LOQ
Values not used for evaluation
Zn L02 Measurements of QC sample did not agree with assigned values
Value not used for evaluation
6.4.2 Statistical evaluation The datasets accepted on technical grounds were tested for normality of dataset means using kurtosis/skewness tests and normal probability plots and were tested for outlying means using the Grubbs test and using the Cochran test for outlying standard deviations, (both at a 99 % confidence level). Standard deviations within (swithin) and between (sbetween) laboratories were calculated using one-way ANOVA. The results of these evaluations are shown in Table 7.
Table 7: Statistical evaluation of the technically accepted datasets for ERM-CD200. p: number of technically valid datasets
Element p
Outliers Normally
distributed
Statistical parameters
Means Variances Average
[mg/kg]
s
[mg/kg]
sbetween
[mg/kg]
swithin
[mg/kg]
As 14 0 0 yes 55.15 2.46 2.38 1.49
Cd 11 0 0 yes 0.945 0.069 0.069 0.021
Cu 9 1 0 no 1.713 0.098 0.094 0.065
Hg 8 0 0 yes 0.0186 0.0014 0.0013 0.0013
Pb 9 0 0 yes 0.509 0.064 0.062 0.032
Se 8 0 0 yes 0.0882 0.0083 0.0080 0.0060
Zn 13 0 0 yes 25.34 2.10 2.06 1.04
The laboratory means follow normal distributions for most elements and the data does not contain outlying means or variances. The dataset of Cu was not normally distributed because one laboratory mean was found to be an outlier by the statistical tests. However, the outlier agrees with the dataset mean, within the combined uncertainties on the mean and the

19
measurement. The datasets for all elements are therefore consistent and the means of laboratory means are good estimates of the true value. Standard deviations among laboratories are considerably larger than the standard deviation within laboratories. This shows that confidence intervals of replicate measurements are generally unsuitable as estimates of measurement uncertainty.
In addition to the statistical tests, the agreement of individual laboratories' results with the dataset means was tested according to ERM Application Note 1 [12]. For As, Cd, Cu, Pb and Zn, one or more results did not agree with the dataset within the combined UCRM and reported measurement uncertainty, Um. The Um is expected to differ depending on the technique applied. However, large differences were observed in the levels of Um reported by different labs using similar techniques. Approaches to uncertainty estimation also differ, and it is possible that some labs do not include all sources of uncertainty in their budgets. As a consequence, if a lab’s result disagrees with the dataset mean within their reported Um, it is not possible to conclude that either the result is genuinely different, or the uncertainty was underestimated. To assess the agreement of individual results with dataset means, an attempt was made to estimate realistic Um by element and technique. However, it was not possible to estimate the expected Um in cases where only two labs reported results by a similar technique, for a particular element’s dataset. Therefore, an arbitrary value of 20 % was considered to represent an acceptable level of Um for inclusion of a result in the dataset, for each element. Consequently, in testing the agreement of measurement results with the assigned value for the QC sample, and the agreement of results for the samples of ERM-CD200 with the dataset means, Um of 20 % were used in calculation. The uncertainty related to the characterisation is estimated as the standard error of the mean of laboratory means. Uncertainties are listed by element, before rounding, in Table 8. Individual results for the characterisation study together with the uncertainty stated by the laboratories are reported in Annex E.
7 Value Assignment
Certified values were assigned, and additional material information is provided in this report. Certified values are values that fulfil the highest standards of accuracy. Procedures at IRMM require generally pooling of not less than 6 datasets to assign certified values. Full uncertainty budgets in accordance with the Guide to the expression of uncertainty in measurement [3] must be established. Additional material information refers to values that were obtained in the course of the study. For example, results reported from only one or two laboratories in cases where individual measurement uncertainty is high, would fall under this category.
7.1 Certified values and their uncertainties
The unweighted mean of the means of the accepted datasets as shown in Table 8 was assigned as certified value for each element.
uchar was estimated as the standard deviation of laboratory means, i.e. p
s=charu with s and
p taken from Table 8.
The assigned uncertainty consists of uncertainties related to characterisation, uchar (section 6), potential between-unit heterogeneity, ubb (section 4) and potential degradation during transport (usts) and long-term storage, ults (section 5). These different contributions were

20
combined to estimate the expanded, relative uncertainty of the certified value (UCRM, rel) with a coverage factor k as
2rel lts,
2rel sts,
2rel bb,
2rel char,rel CRM, uuuukU +++⋅= .
• uchar was estimated as described in section 6.4.2
• ubb was estimated as described in section 4.
• usts and ults were estimated as described in section 5.3. Because of the sufficient numbers of the degrees of freedom of the different uncertainty contributions, a coverage factor k of 2 was applied, to obtain the expanded uncertainties. The certified values and their uncertainties are summarised in Table 8. Table 8: Certified values and their uncertainties for ERM-CD200
Element Certified value (1)
[mg/kg] uchar, rel
[%] ubb, rel
[%] usts, rel
[%] ults, rel
[%] UCRM, rel
[%] UCRM
(2) [mg/kg]
As 55 1.19 2.83 1.31 1.43 7.3 4
Cd 0.95 2.20 0.53 1.88 1.08 6.3 0.06
Cu 1.71 1.91 3.74 2.34 1.39 10.0 0.18
Hg 0.0186 2.70 2.55 0.68 1.66 8.3 0.0016
Pb 0.51 4.18 1.99 2.46 0.91 10.6 0.06
Se 0.088 3.34 2.31 0.64 3.15 10.4 0.010
Zn 25.3 2.30 0.92 1.68 1.25 6.5 1.7 1) reported on dry mass basis (see section 9.5) 2) expanded (k = 2) and rounded uncertainty
7.2 Additional material information
Water content and activity
Water content was determined by Karl-Fischer titration and by an oven drying method, shortly after the filling of the material into glass bottles. The results evaluated as mean values ± standard deviation of separate measurements were 2.8 ± 0.2 g/100 g (n = 10) and 2.4 ± 0.1 g/100 g (n = 6), respectively.
Water activity was determined by using a water activity meter (Aqualab CX3, Decagon, USA) and resulted <0.07 (n = 3).
The water content determined by the laboratories within the characterisation study was in the range of 0.8 % to 4.1 %, and the results within each laboratory were consistent.
Inter-comparison study on particle size analysis (PSA)
Two units of ERM-CD200 were randomly selected from the whole batch produced and measured in duplicate at IRMM (BE) and in triplicate at Sympatec (Clausthal-Zellerfeld, DE). At IRMM, the material was dispersed in 2-propanol and analysed by using a Sympatec Helos F system (IRMM), fitted with a R5 lens. At Sympatec, the material was dispersed in a Quixel system and analysed by mean of a Helos R system using two different instrumental set ups: with a R5 lens system (Sympatec B) and with an extended measurement range where lenses R3 and R5 are combined (Sympatec C). The combination of R5 and R3 lenses was found to allow the easier identification of differences in < 10 µm particles. The optical

21
concentration of the dispersed powder was within 15-25 %. The results of this study are summarised in Table 9.
Table 9: Cumulative particle size distribution, expressed as average particle size (µm) ± s (µm) of 4 and 18 replicate measurements for IRMM, Sympatec B and C, respectively.
Size class / % X10 X16 X50 X84 X90
IRMM 10.86 ± 0.61 16.74 ± 0.69 56.42 ± 1.83 112.59 ± 2.53 128.26 ± 3.21
Sympatec B 8.77 ± 0.14 14.59 ± 0.26 53.75 ± 0.79 108.59 ± 1.10 123.81 ± 0.83 Sympatec C 8.01 ± 0.15 13.60 ± 0.22 50.98 ± 0.92 105.45 ± 2.02 121.89 ± 2.29
8 Metrological traceability and commutability
8.1 Metrological traceability
Identity
The measurands are clearly defined total element mass fractions. The participants used different methods for the sample preparation as well as for the final determination, demonstrating absence of measurement bias. The measurands are therefore structurally defined and independent of the measurement method.
Quantity value
Only validated methods were used for the determination of the assigned values. Different calibration standards of known purity and specified traceability of their assigned values were used and all relevant input parameters were calibrated. The individual results are therefore traceable to the SI. This is also confirmed by the agreement among the technically accepted datasets. As the assigned values are combinations of agreeing results individually traceable to the SI, the assigned quantity values themselves are also traceable to the SI.
8.2 Commutability
Many measurement procedures include one or more steps, which select specific (or specific groups of) analytes from the sample for the subsequent steps of the measurement process. Often the complete identity of these 'intermediate analytes' is not fully known or taken into account. Therefore, it is difficult to mimic all the analytically relevant properties of real samples within a CRM. The degree of equivalence in the analytical behaviour of real samples and a CRM with respect to various measurement procedures (methods) is summarised in a concept called 'commutability of a reference material'. There are various definitions expressing this concept. For instance, the CSLI Guideline C-53A [11] recommends the use of the following definition for the term commutability:
"The equivalence of the mathematical relationships among the results of different measurement procedures for an RM and for representative samples of the type intended to be measured."
The commutability of a CRM defines its fitness for use and, thus, is a crucial characteristic in case of the application of different measurement methods. When commutability of a CRM is not established in such cases, the results from routinely used methods cannot be legitimately
22
compared with the certified value to determine whether a bias does not exist in calibration, nor can the CRM be used as a calibrant.
ERM-CD200 is a natural seaweed material. The analytical behaviour will be the same as for a routine sample of dried seaweed. For samples other than seaweed, the commutability has to be assessed.
9 Instructions for use
9.1 Storage conditions
The material shall be stored at 18 °C ± 5 °C in the dark. Care shall be taken to avoid change of the moisture content once the vial is open, as the material is hygroscopic. Storage in a desiccator is recommended.
Please note that the European Commission cannot be held responsible for changes that happen during storage of the material at the customer's premises, especially of opened vials.
9.2 Safety and protection for the environment
The usual laboratory safety measures apply.
9.3 Preparation and use of the material
The vial shall be shaken by turning upside down for at least 2 minutes before opening to ensure re-homogenisation of the material.
9.4 Minimum sample intake
The minimum sample intake is 200 mg for all elements.
9.5 Dry mass correction
Dry mass determination shall be carried out on a separate portion of at least 0.4 g of material by drying in an oven at 105 °C ± 2 °C until constant mass (separate weighing should not differ by more than 0.2 mg). Weighing of the samples for dry mass determination and weighing for the analysis shall be done at the same time to avoid differences due to possible take up of moisture by the material.
9.6 Use of the certified value
The main purpose of the material is to assess method performance, i.e. for checking accuracy of analytical results/calibration. As any reference material, it can also be used for control charts or validation studies.
Comparing an analytical result with the certified value
A result is unbiased if the combined uncertainty of measurement and certified value covers the difference between the certified value and the measurement result (see also ERM Application Note 1, www.erm-crm.org [12]. For assessing the method performance, the measured values of the CRMs are compared with the certified values. The procedure is described here in brief:
23
o Calculate the absolute difference between mean measured value and the certified value (∆m).
o Combine measurement uncertainty (um) with the uncertainty of the certified value (uCRM): 22
CRMm uuu +=∆
o Calculate the expanded uncertainty (U∆) from the combined uncertainty (u∆,) using an appropriate coverage factor, corresponding to a level of confidence of approximately 95 %
o If ∆m ≤ U∆ then there is no significant difference between the measurement result and the certified value, at a confidence level of about 95 %.
Use as a calibrant
It is not recommended to use ERM-CD200 as calibrant. If used nevertheless, the uncertainty of the certified value shall be taken into account in the estimation of the measurement uncertainty.
Use in quality control charts
The material ERM-CD200 can be used for quality control charts. Different CRM-units will give the same result as heterogeneity was included in the uncertainties of the certified values.
10 Acknowledgments
The authors would like to thank Håkan Emteborg and Yannic Ramaye (IRMM) for reviewing the certification report; as well as the experts of the Certification Advisory Panel "Elements", Peter Vermaercke (Studiecentrum voor Kernenergie, BE), Thomas Prohaska (University of Natural Resources and Life Sciences, AT) and Steve Balsley (International Atomic Energy Agency, AT) for their constructive comments.
The authors would also like to acknowledge Sympatec Benelux for the participation in the PSA proficiency testing.
11 References
1 ISO Guide 34, General requirements for the competence of reference materials producers, International Organization for Standardization, Geneva, Switzerland, 2009
2 ISO Guide 35, Reference materials – General and statistical principles for certification, International Organization for Standardization, Geneva, Switzerland, 2006
3 ISO/IEC Guide 98, Guide to the Expression of Uncertainty in Measurement, (GUM 1995), International Organization for Standardization, Geneva, Switzerland, 2009
4 Directive 2000/60/EC of the European Parliament and of the Council of 23 October 2000 establishing a framework for Community action in the field of water policy, 2000
5 Amer, H. A., Ostapczuk, P., Emons, H., Quality assurance in measuring the elemental composition of the alga Fucus vesiculosus. Journal of Environmental Monitoring, 1, pp. 97-102, 1999.
24
6 Daka, E.R., Allen, J. R., Hawkins, S. J., “Heavy metal contamination in sediment and biomonitors from sites around the Isle of Man.” Marine Pollution Bulletin, 46 (6), pp. 784-791, 2003
7 Linsinger, T.P.J., Pauwels, J., van der Veen, A.M.H., Schimmel, H., Lamberty, A., “Homogeneity and stability of reference materials”, Accred. Qual. Assur. 6: 20-25, 2001
8 Lamberty, A., Schimmel, H., Pauwels, J., “The study of the stability of reference materials by isochronous measurements”, Fres. J. Anal. Chem. 360: 359-361, 1998
9 Linsinger, T.P.J., Pauwels, J., Lamberty, A., Schimmel, H., van der Veen, A.M.H. ., Siekmann, L., “Estimating the Uncertainty of Stability for Matrix CRMs”, Fres. J. Anal. Chem. 370: 183-188, 2001
10 ISO Guide 99, International vocabulary of metrology -- Basic and general concepts and associated terms (VIM), International Organization for Standardization, Geneva, Switzerland, 2007
11 Vesper, Emons, H., Gnezda, M., Jain, C. P., Miller, W. G., Rej, R., Schumann, G., Tate, J., Thienpont, l., Vaks, J. E., Characterization and Qualification of Commutable Reference Materials for Laboratory Medicine; Approved Guideline, CLSI document C53-A, Clinical and Laboratory Standards Institute, Wayne, PA, USA, 2010
12 Linsinger, T.P.J., ERM Application Note 1: Comparison of a measurement result with the certified value, www.erm-crm.org, retrieved 01/10/2013.
Annexes
Annex A: Results of the homogeneity measurements
Annex B: Results of the short-term stability measurements
Annex C: Results of the long-term stability measurements
Annex D: Summary of methods used in the characterisation study
Annex E: Results of the characterisation measurements

25
CERTIFICATION REPORT: The certification of the mass fraction of the total content of As, Cd, Cu, Hg, Pb, Se and Zn in Bladderwrack (Fucus vesiculosus): ERM-CD200 Annex A: Results of the homogeneity measurements
Graphs present mass fractions of bottle means relative to the grand mean, against bottle number, and individual measurement replicates, against sequence number. Vertical bars are a confidence interval of 95 % derived from swb of the homogeneity study.
Figure A1: As
Figure A2: Cd
Figure A3: Cu

26
Figure A4: Hg
Figure A5: Pb
Figure A6: Se

27
Figure A7: Zn

28
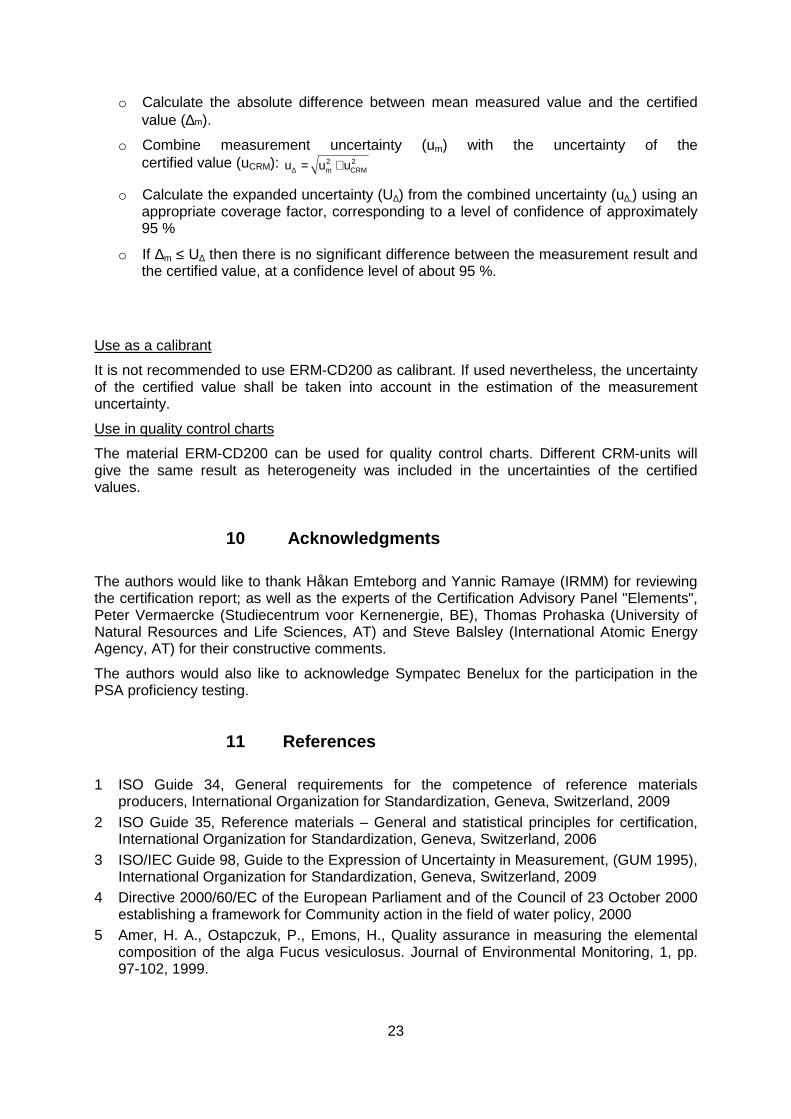
CERTIFICATION REPORT: The certification of the mass fraction of the total content of As, Cd, Cu, Hg, Pb, Se and Zn in Bladderwrack (Fucus vesiculosus): ERM-CD200 Annex B: Results of the short-term stability measurements Graphs present the mean mass fractions measured at each time-point relative to the mean at time zero, against the time that the samples were held at 18 ºC or 60 ºC. Vertical bars represent the 95 % confidence interval of the measurements, based on the variance of measurements for each time-point calculated by ANOVA. Dotted lines represent the uncertainty associated to short-term stability, uSTS. Figure B1: As
18 ºC 60 ºC
Figure B2: Cd
18 ºC 60 ºC
29
Figure B3: Cu
18 ºC 60 ºC
Figure B4: Hg
18 ºC 60 ºC
Figure B5: Pb
18 ºC 60 ºC

30
Figure B6: Se
18 ºC 60 ºC
Figure B7: Zn
18 ºC 60 ºC
31
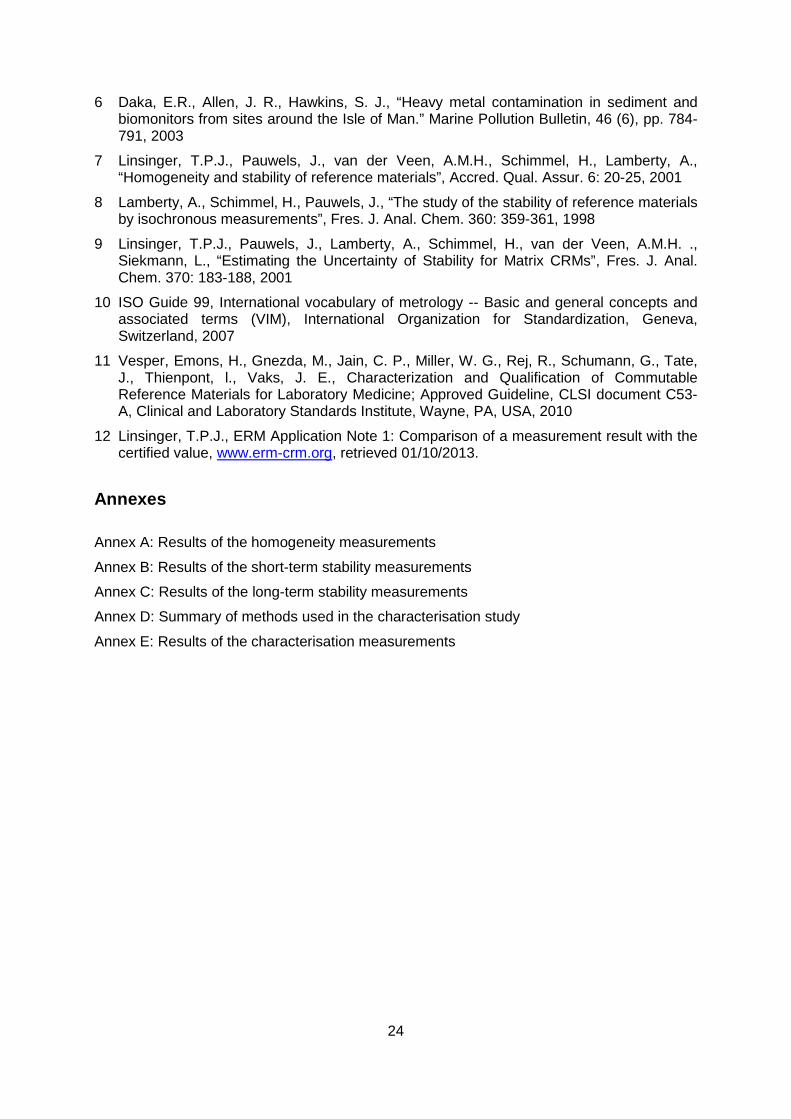
CERTIFICATION REPORT: The certification of the mass fraction of the total content of As, Cd, Cu, Hg, Pb, Se and Zn in Bladderwrack (Fucus vesiculosus): ERM-CD200 Annex C: Results of the long-term stability measurements Graphs present the mean mass fractions measured at each time-point relative to the mean at time zero, against the time that the samples were held at 18 ºC. Vertical bars represent the 95 % confidence interval of the measurements, based on the variance of measurements for each time-point calculated by ANOVA. Dotted lines represent the uncertainty associated to long-term stability, uLTS. Figure C1: As
Figure C2: Cd
Figure C3: Cu
Figure C4: Hg

32
Figure C5: Pb
Figure C6: Se
Figure C7: Zn

33
CERTIFICATION REPORT The certification of the mass fraction of the total content of As, Cd, Cu, Hg, Pb, Se and Zn in Bladderwrack (Fucus vesiculosus): ERM- CD200 Annex D: Summary of methods used in the characterisation Note that measurement methods are given as reported by the laboratories, and may not follow the terminology of the Guide to the Expression of Uncertainty in Measurements, [ISO/IEC Guide 98-3:2008], or the International Vocabulary of Metrology – Basic and General Concepts and Associated Terms, [ISO/IEC Guide 99:2007]. Table D1: Summary of the methods used for the homogeneity study
Parameter (measurement
method) Sample mass (g) Sample preparation Calibration Instrumentation
As, Cd, Cu,Hg, Pb, Se, Zn (ICP-
SFMS) 0.5
Closed MW –assisted digestion (CEM-MARS5) with 5 mL HNO3 + 0.1mL HF.
Dilution with 10% HNO3
2-points external calibration after internal correction, with Ultra Scientific
(USA) standards Thermo Electron Corp. Cetac
Table D2: Summary of the methods used for the short term stability study
Parameter (measurement
method) Sample mass (g) Sample preparation Calibration Instrumentation
As, Cd, Cu, Pb, Zn (ICP-OES) 1 Method EPA3052 Minimum 5-points external calibration,
with Ultra Scientific (USA) standards Varian Vista-MPX
Hg (CV-AAS) Se (ET-AAS) 0.5
Closed MW –assisted digestion (Paar Multiwave 3000) with 4mL HNO3 + 2mL
H2O2 + 0.5mL HF
Minimum 6-points external calibration, with Ultra Scientific (USA) standards
Perkin Elmer FIMS 400 (CV-AAS); Perkin Elmer FIMS 400 coupled to
Perkin Elmer AA800 (ET-AAS) Table D3: Summary of the methods used for the long term stability study
Parameter (measurement
method) Sample mass (g) Sample preparation Calibration Instrumentation
As, Cd, Cu,Hg, Pb, Se, Zn (ICP-
MS) 0.5 Closed MW –assisted digestion with 8mL
HNO3 + 2mL H2O2 6-points external calibration, with NIST
(USA) high purity standards Agilent 7500ce

34
Table D4: Summary of the methods used for the characterisation study
Lab/Method code
Parameter (measurement
method) Sample mass (g) Sample preparation Calibration Instrumentation
L00 As, Zn (k0-NAA) 0.4 n.a. IRMM-530R k0-NAA
L01 As, Cd, Cu, Hg, Pb, Se, Zn (ICP-SFMS) 0.3
Closed MW –assisted digestion (Milestone-MARS5) with 5 mL HNO3 + 0.05 mL HF. Dilution with 10% HNO3
2-points external calibration after internal correction, with
Ultra Scientific (USA) standards
Thermo Scientific Element 2
L02 As, Cd, Cu, Hg, Se, Zn (INAA) 0.2 n.a.
Calibration of the HPGe detector made by using
calibrated gamma-ray sources HPGe detectors (Ortec)
L03 As, Cd, Hg, Pb (ICP-MS) 0.5
Closed MW –assisted digestion (Multiwave 3000) with5 mL HNO3.
Dilution with milli-Q water
Standard addition by using SCP Science standards Agilent 7500ce
L04 As, Cd, Se, Zn (k0-NAA) 0.25 n.a. IRMM-530R
TRIGA Mark II reactor (GA), HPGe detector 40%
(Ortec)
L05 Hg (DMA) 0.03 Thermal combustion integrated at
650 °C 10-points external calibration
by using JSI standards Milestone DMA
L06 As, Se, Zn (INAA) 0.2 n.a. Calibration with Inorganic
Ventures standards Triga Mark II Nuclear
Reactor
L07 As, Cd, Cu, Pb, Zn
(ICP-MS) Se (ETAAS)
0.5 (As, Cd, Cu, Pb, Zn) 0.1 (Se)
Open digestion block with 10 mL HNO3 for As, Cd, Cu, Pb, Zn. Digestion with a mixture of HNO3, H2SO4 and HClO4 in 5 mL organic solvent. Dilution with milli-Q
water
3-points external calibration by using AccuStandard Inc.
standards
Perkin Elmer Elan 6000 (ICP-MS)
Varian AA280Z (ETAAS)
L08 As, Cd, Cu, Hg, Pb, Se, Zn (ICP-SFMS) 0.2
Closed MW –assisted digestion (CEM-MARS Express) with 2 mL HNO3 + 0.5 mL H2O2 and 0.5 mL HF. Dilution with
milli-Q water
6-points external calibration by using NIST standards
Thermo Scientific Element 2
L09 Cd, Cu, Pb, Se and
Zn (ID-ICP-MS) Hg (DMA)
0.8 (Cd, Cu, Pb, Se, Zn) 0.2 (Hg)
High pressure asher (ANTON PAAR HPA-S) with 4 mL HNO3 + 0.5 mL H2O2. Solutions were spiked with
isotopic enriched spike solutions for the different metals.
Calibration by using Merck, Spex or Alfa Aesar standards
Thermo Scientific (ID-ICP-MS)
Milestone DMA-80 (DMA)

35
Lab/Method code
Parameter (measurement
method) Sample mass (g) Sample preparation Calibration Instrumentation
L10 As, Cd, Cu, Pb, Se and Zn (ICP-MS)
1
High pressure asher (ANTON PAAR HPA-S) with 4 mL HNO3 + 0.5 mL
H2O2.
5-points external calibration by using Spex standards
Thermo Scientific (ICP-MS)
L11 As, Cd, Cu, Pb, Se and Zn (ICP-MS) 0.5 Microwave digestion using nitric acid.
External Calibration (range 0.5-100ug/L), using linear
regression line. Sample conc = (soln conc-blk conc)*dilution/weight, Stock mixed elements 1000mg/L
calibration solution was purchased from SPEX
Certiprep, Reference Material Producer CERT # 2495.01
ICP-MS
L12 As, Cd, Cu, Pb, Se and Zn (ICP-MS) 0.25
0.25 g digested in 0.4 ml HCl + 1.6 ml HNO3 using PTFE vessels in a
pressure vessel, microwave heating
External calibration, (seven calibrants spanning three
orders of magnitude), VWR (BDH, Prolabo) standard
(Traceable to NIST)
Agilent 7700x ICP-MS [helium mode]
L13 As, Cd, Cu, Pb (GFAAS) 0.2
Sample is digested in microwave (high pressure and temperature), with concentrated nitric acid and hydrogen peroxide. After digestion, sample is diluted to 10ml with water. Measurements made with 2 matrix modifiers: Pd (1000mg/l) and Magnesium nitrate (1000 mg/l) for As, Cu and DHPA (1%l) and Magnesium nitrate (1000 mg/l) for Cd, Pb
external calibration curves with 4 standards, Arsenic (1000
mg/l): Fluka 11082, Cadmium (1000 mg/l): Fluka 20895, Copper (1000 mg/l): Fluka 61147, Lead (1000 mg/l):
Fluka 16595
Graphite furnace
L13 Se (HGAAS) 0.2
Sample is digested in microwave (high pressure and temperature), with concentrated nitric acid and hydrogen peroxide. After digestion, sample is transferred to muffle (1h, 450ºC) with Magnesium nitrate solution. After ashes are white, they are transferred and diluted to 10ml with diluted HCl.
external calibration curve with 4 standards (1 to 10 ug/l),
Selenium (1000 mg/l): Fluka 84896
Hydride generation Wavelength: 196,0nm

36
Lab/Method code
Parameter (measurement
method) Sample mass (g) Sample preparation Calibration Instrumentation
L13 Zn (FAAS) 0.2
Sample is digested in microwave (high pressure and temperature), with concentrated nitric acid and hydrogen peroxide. After digestion, sample is diluted to 10ml with 2% lithium solution
external calibration curve with 4 standards (0,1 to 2,5 mg/l), Zinc (1000 mg/l): Fluka 6457
Flame atomic absorption. Wavelength: 213,9nm
L14 As, Cd, Cu, Hg, Se (AAS) 0.5
Closed microwave digestion (Multiwave 3000); 4 mL HNO3 (68% subboiled) + 2 mL H2O2 (30% p.a.) + 0.5 mL HF (40% suprapur)
external calibration with Baker Instra Analyzed ICP Standards
(traceable to NIST SRMs)
As, Cd and Cu by GFAAS, Hg by CVAAS and Se by
HGAAS
L15 As, Cd, Cu, Pb and Zn (ICP-MS) 0.5
Closed microwave digestion (Multiwave 3000); 4 mL HNO3 (68% subboiled) + 2 mL H2O2 (30% p.a.) + 0.5 mL HF (40% suprapur)
external calibration with Baker Instra Analyzed ICP Standards
(traceable to NIST SRMs) ICP-MS
L16 As, Zn (ICP-OES) 0.5
Closed microwave digestion (Multiwave 3000); 4 mL HNO3 (68% subboiled) + 2 mL H2O2 (30% p.a.) + 0.5 mL HF (40% suprapur)
external calibration with Baker Instra Analyzed ICP Standards
(traceable to NIST SRMs) ICP-OES

37
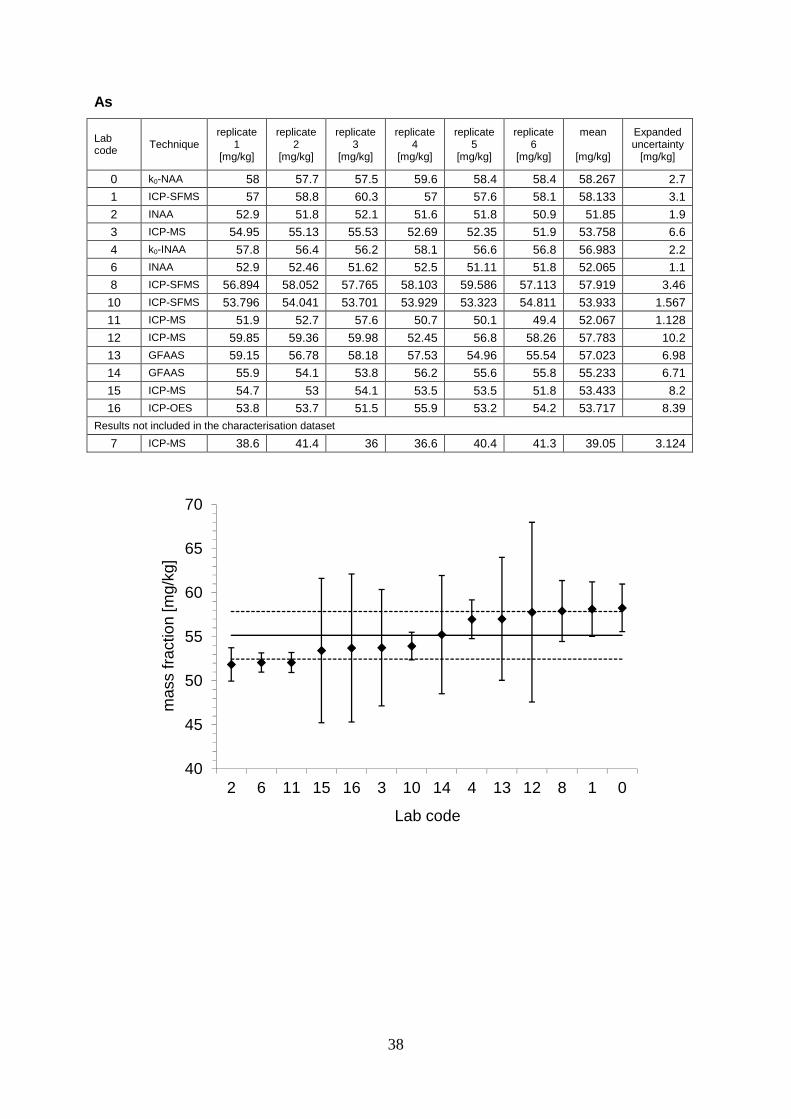
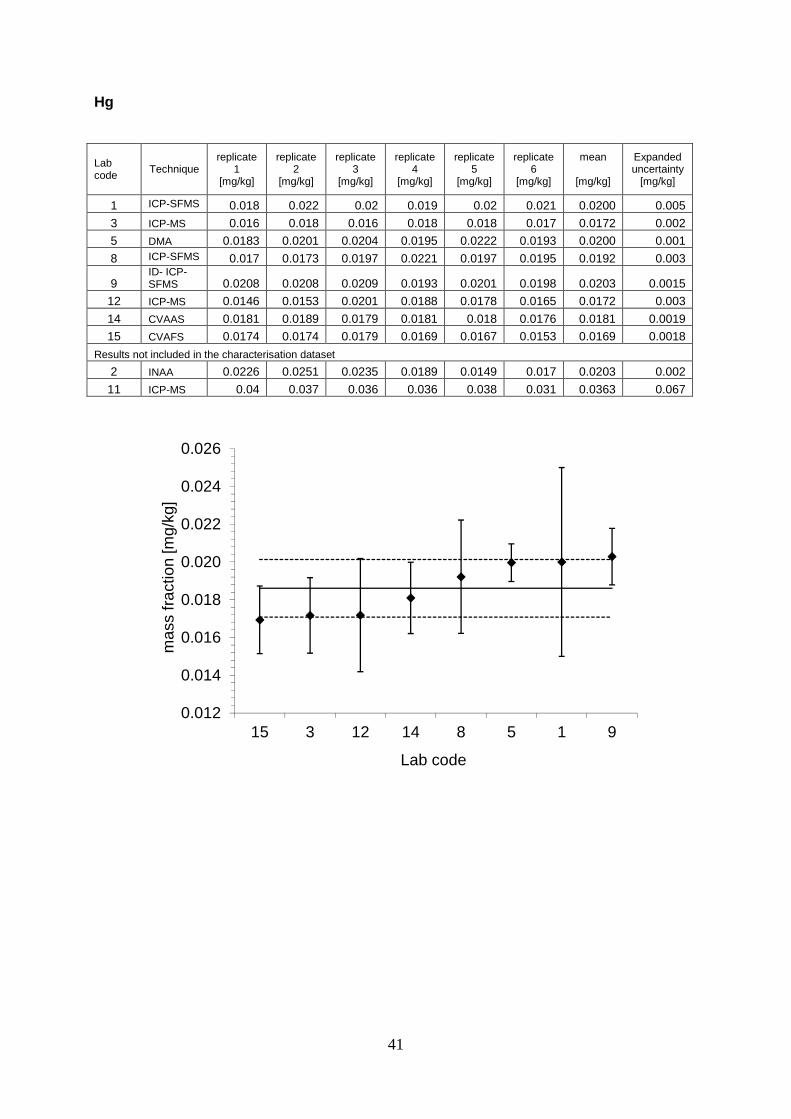
CERTIFICATION REPORT The certification of the mass fraction of the total content of As, Cd, Cu, Hg, Pb, Se and Zn in Bladderwrack (Fucus vesiculosus): ERM-CD200 Annex E: Results of the characterisation measurements
Tables present the results of characterisation measurements (corrected to dry mass) and the estimated uncertainties of the measurements, as reported by participants. Some reported values were rounded for formatting reasons. Graphs show expanded uncertainties as stated by the laboratories, the certified value indicated by a solid line, and the expanded uncertainty on the certified value indicated by dotted lines.
38
As
Lab code Technique
replicate 1
[mg/kg]
replicate 2
[mg/kg]
replicate 3
[mg/kg]
replicate 4
[mg/kg]
replicate 5
[mg/kg]
replicate 6
[mg/kg]
mean
[mg/kg]
Expanded uncertainty
[mg/kg]
0 k0-NAA 58 57.7 57.5 59.6 58.4 58.4 58.267 2.7
1 ICP-SFMS 57 58.8 60.3 57 57.6 58.1 58.133 3.1
2 INAA 52.9 51.8 52.1 51.6 51.8 50.9 51.85 1.9
3 ICP-MS 54.95 55.13 55.53 52.69 52.35 51.9 53.758 6.6
4 k0-INAA 57.8 56.4 56.2 58.1 56.6 56.8 56.983 2.2
6 INAA 52.9 52.46 51.62 52.5 51.11 51.8 52.065 1.1
8 ICP-SFMS 56.894 58.052 57.765 58.103 59.586 57.113 57.919 3.46
10 ICP-SFMS 53.796 54.041 53.701 53.929 53.323 54.811 53.933 1.567
11 ICP-MS 51.9 52.7 57.6 50.7 50.1 49.4 52.067 1.128
12 ICP-MS 59.85 59.36 59.98 52.45 56.8 58.26 57.783 10.2
13 GFAAS 59.15 56.78 58.18 57.53 54.96 55.54 57.023 6.98
14 GFAAS 55.9 54.1 53.8 56.2 55.6 55.8 55.233 6.71
15 ICP-MS 54.7 53 54.1 53.5 53.5 51.8 53.433 8.2
16 ICP-OES 53.8 53.7 51.5 55.9 53.2 54.2 53.717 8.39 Results not included in the characterisation dataset
7 ICP-MS 38.6 41.4 36 36.6 40.4 41.3 39.05 3.124
40
45
50
55
60
65
70
2 6 11 15 16 3 10 14 4 13 12 8 1 0
mas
s fr
actio
n [m
g/kg
]
Lab code

39
Cd
Lab code Technique
replicate 1
[mg/kg]
replicate 2
[mg/kg]
replicate 3
[mg/kg]
replicate 4
[mg/kg]
replicate 5
[mg/kg]
replicate 6
[mg/kg]
mean
[mg/kg]
Expanded uncertainty
[mg/kg]
1 ICP-SFMS 1.04 1.02 1.03 1.03 1.02 1.02 1.0267 0.07
3 ICP-MS 0.96 0.95 0.97 1 0.98 0.96 0.9700 0.13
7 ICP-MS 0.881 0.856 0.828 0.836 0.825 0.813 0.8398 0.0672
8 ICP-SFMS 0.941 0.958 0.935 0.965 0.94 0.955 0.9490 0.044
9 ID- ICP-SFMS 0.8702 0.9252 0.8171 0.8283 0.8502 0.8511 0.8570 0.0991
10 ICP-SFMS 1.0266 1.0259 1.0467 1.0533 1.0399 1.0267 1.0365 0.135
11 ICP-MS 0.842 0.857 0.919 0.879 0.914 0.847 0.8763 0.32
12 ICP-MS 1.0057 0.9864 0.9764 0.9705 0.9883 1.0233 0.9918 0.1944
13 GFAAS 1.04 1.01 1.02 1.01 0.97 0.98 1.005 0.12
14 GFAAS 0.892 0.894 0.883 0.902 0.895 0.892 0.8930 0.107
15 ICP-MS 0.958 0.966 0.959 0.952 0.941 0.95 0.9543 0.116 Results not included in the characterisation dataset
2 INAA < 12 < 12 < 11 < 13 < 11 < 11
4 k0-INAA < 1.3 < 1.1 < 1.0 < 1.2 < 1.3 < 1.1
0.4
0.5
0.6
0.7
0.8
0.9
1.0
1.1
1.2
1.3
7 9 11 14 8 15 3 12 13 1 10
mas
s fr
actio
n [m
g/kg
]
Lab code

40
Cu
Lab code
Technique replicate
1 [mg/kg]
replicate 2
[mg/kg]
replicate 3
[mg/kg]
replicate 4
[mg/kg]
replicate 5
[mg/kg]
replicate 6
[mg/kg]
mean
[mg/kg]
Expanded uncertainty
[mg/kg]
1 ICP-SFMS 1.69 1.65 1.76 1.67 1.71 1.7 1.6967 0.12
7 ICP-MS 2.01 2.16 1.84 1.81 1.98 1.85 1.9417 0.1553
8 ICP-SFMS 1.713 1.682 1.643 1.744 1.651 1.701 1.689 0.126
9 ID- ICP-SFMS 1.6750 1.6650 1.6841 1.5933 1.6744 1.6832 1.6625 0.0991
10 ICP-SFMS 1.6737 1.7110 1.7537 1.6484 1.7994 1.7641 1.7250 0.226
12 ICP-MS 1.688 1.665 1.652 1.628 1.718 1.755 1.6843 0.193
13 GFAAS 1.69 1.69 1.71 1.8 1.86 1.86 1.7683 0.19
14 GFAAS 1.65 1.54 1.55 1.58 1.56 1.67 1.5917 0.251
15 ICP-MS 1.67 1.67 1.71 1.65 1.61 1.66 1.6617 0.167 Results not included in the characterisation dataset
2 INAA < 120 < 120 < 120 < 120 < 120 < 120
11 ICP-MS 1.45 1.48 1.65 1.89 2 1.9 1.7283 2.626
1.0
1.2
1.4
1.6
1.8
2.0
2.2
2.4
14 15 9 12 8 1 10 13 7
mas
s fr
actio
n [m
g/kg
]
Lab code
41
Hg
Lab code
Technique replicate
1 [mg/kg]
replicate 2
[mg/kg]
replicate 3
[mg/kg]
replicate 4
[mg/kg]
replicate 5
[mg/kg]
replicate 6
[mg/kg]
mean
[mg/kg]
Expanded uncertainty
[mg/kg]
1 ICP-SFMS 0.018 0.022 0.02 0.019 0.02 0.021 0.0200 0.005
3 ICP-MS 0.016 0.018 0.016 0.018 0.018 0.017 0.0172 0.002
5 DMA 0.0183 0.0201 0.0204 0.0195 0.0222 0.0193 0.0200 0.001
8 ICP-SFMS 0.017 0.0173 0.0197 0.0221 0.0197 0.0195 0.0192 0.003
9 ID- ICP-SFMS 0.0208 0.0208 0.0209 0.0193 0.0201 0.0198 0.0203 0.0015
12 ICP-MS 0.0146 0.0153 0.0201 0.0188 0.0178 0.0165 0.0172 0.003
14 CVAAS 0.0181 0.0189 0.0179 0.0181 0.018 0.0176 0.0181 0.0019
15 CVAFS 0.0174 0.0174 0.0179 0.0169 0.0167 0.0153 0.0169 0.0018
Results not included in the characterisation dataset
2 INAA 0.0226 0.0251 0.0235 0.0189 0.0149 0.017 0.0203 0.002
11 ICP-MS 0.04 0.037 0.036 0.036 0.038 0.031 0.0363 0.067
0.012
0.014
0.016
0.018
0.020
0.022
0.024
0.026
15 3 12 14 8 5 1 9
mas
s fr
actio
n [m
g/kg
]
Lab code

42
Pb
Lab code
Technique replicate
1 [mg/kg]
replicate 2
[mg/kg]
replicate 3
[mg/kg]
replicate 4
[mg/kg]
replicate 5
[mg/kg]
replicate 6
[mg/kg]
mean
[mg/kg]
Expanded uncertainty
[mg/kg]
1 ICP-SFMS 0.585 0.59 0.584 0.592 0.582 0.573 0.5843 0.035
3 ICP-MS 0.59 0.49 0.52 0.58 0.6 0.66 0.5733 0.12
7 ICP-MS 0.492 0.5 0.482 0.501 0.497 0.488 0.4933 0.0839
8 ICP-SFMS 0.53 0.575 0.528 0.517 0.523 0.559 0.5387 0.083
9 ID- ICP-SFMS 0.4328 0.4561 0.4251 0.4134 0.4297 0.4476 0.4341 0.0341
10 ICP-SFMS 0.4673 0.4115 0.4390 0.4370 0.4814 0.4338 0.4450 0.072
11 ICP-MS 0.357 0.374 0.383 0.476 0.497 0.409 0.416 0.04
12 ICP-MS 0.5271 0.5191 0.5288 0.5694 0.5644 0.5363 0.5409 0.074
15 ICP-MS 0.556 0.56 0.564 0.558 0.539 0.56 0.5562 0.0677
Results not included in the characterisation dataset
13 GFAAS 0.347 0.357 0.378 0.295 0.305 0.275 0.3262 0.045
0.30
0.40
0.50
0.60
0.70
0.80
11 9 10 7 8 12 15 3 1
mas
s fr
actio
n [m
g/kg
]
Lab code

43
Se
Lab code Technique
replicate 1
[mg/kg]
replicate 2
[mg/kg]
replicate 3
[mg/kg]
replicate 4
[mg/kg]
replicate 5
[mg/kg]
replicate 6
[mg/kg]
mean
[mg/kg]
Expanded uncertainty
[mg/kg]
1 ICP-SFMS 0.098 0.103 0.099 0.098 0.105 0.094 0.09950 0.016
2 INAA 0.076 0.09 0.075 0.088 0.082 0.085 0.08267 0.0086
6 INAA 0.089 0.096 0.084 0.098 0.105 0.093 0.09417 0.015
8 ICP-SFMS 0.0869 0.0885 0.0859 0.0876 0.0905 0.09 0.08823 0.003
9 ID- ICP-SFMS 0.07997 0.08349 0.08485 0.07913 0.08252 0.08399 0.08233 0.00504
10 ICP-SFMS 0.08330 0.08539 0.08346 0.08416 0.08755 0.08742 0.08521 0.0069
12 ICP-MS 0.1007 0.0865 0.0802 0.1074 0.1027 0.1099 0.09790 0.0176
14 HG-AAS 0.0779 0.0771 0.0797 0.0661 0.0767 0.0771 0.07577 0.012
Results not included in the characterisation dataset
4 k0-INAA < 0.10 < 0.09 < 0.09 < 0.08 < 0.11 < 0.09
7 ICP-MS 0.068 0.074 0.075 0.062 0.061 0.06 0.06667 0.01
11 ICP-MS 0.394 0.561 0.353 0.323 0.284 0.346 0.37683 0.6
13 HG-AAS 0.061 0.062 0.059 0.07 0.073 0.078 0.06717 0.012
0.05
0.06
0.07
0.08
0.09
0.10
0.11
0.12
14 9 2 10 8 6 12 1
mas
s fr
actio
n [m
g/kg
]
Lab code

44
Zn
Lab code Technique
replicate 1
[mg/kg]
replicate 2
[mg/kg]
replicate 3
[mg/kg]
replicate 4
[mg/kg]
replicate 5
[mg/kg]
replicate 6
[mg/kg]
mean
[mg/kg]
Expanded uncertainty
[mg/kg]
0 k0-NAA 25.5 26.4 25.9 25.5 26 25.6 25.82 1.3
1 ICP-SFMS 27.9 27.9 27.5 27.4 27.2 26.7 27.43 2
4 k0-INAA 23 23.1 23.3 24.6 23.5 24.1 23.60 1
6 INAA 25.1 25.44 24.87 25.59 25.31 25.02 25.22 0.5
7 ICP-MS 29.3 30.7 28.4 28.9 30 32.1 29.90 2.392
8 ICP-SFMS 26.194 25.741 25.261 26.511 25.171 26.026 25.82 1.69
9 ID- ICP-SFMS 23.003 23.658 24.290 25.240 24.902 24.226 24.22 1.287
10 ICP-SFMS 24.562 25.418 29.908 25.960 28.936 29.517 27.38 5.62
11 ICP-MS 23.2 23.4 24 21.1 21.1 20.4 22.20 6.748
12 ICP-MS 26.47 26.52 27.05 22.83 24.95 25.44 25.54 4.06
13 FAAS 22.35 22.12 22.72 22.15 22.42 22.64 22.40 2.27
15 ICP-MS 25.8 24.9 25.3 25.5 25.2 25 25.28 3.09
16 ICP-OES 24.4 24.2 24.2 25.5 24.9 24.6 24.63 3.83
Results not included in the characterisation dataset
2 INAA 30.1 29.2 29.7 29.1 29.2 29.5 29.47 1.2
10
15
20
25
30
35
11 13 4 9 16 6 15 12 0 8 10 1 7
mas
s fr
actio
n [m
g/kg
]
Lab code

European Commission EUR 26525 EN – Joint Research Centre – Institute fo r Reference Materials and Measurements Title: The certification of the mass fraction of the total content of As, Cd, Cu, Hg, Pb, Se and Zn in
Bladderwrack (Fucus vesiculosus): ERM - CD200 Author(s): Anna Santoro, James Snell, Håkan Emteborg, Marie-France Tumba-Tshilumba, Andrea Held Luxembourg: Publications Office of the European Union 2014 – 44 pp. – 21.0 x 29.7 cm EUR – Scientific and Technical Research series – ISSN 1831-9424 ISBN 978-92-79-35531-8 doi:10.2787/89880 Abstract This report describes the production of ERM-CD200, a powdered bladderwrack material (Fucus vesiculosus) certified for the mass fraction of the total content of As, Cd, Cu, Hg, Pb, Se and Zn. The material was produced following ISO Guide 34:2009 [1]. Approximately 60 kg of brown algae seaweed (bladderwrack, Fucus vesiculosus) was collected in Galway (Ireland) and processed at IRMM (Belgium) to produce a certified reference material (CRM) of seaweed powder. The produced vials containing the processed seaweed were carefully capped, sealed and stored for further certification studies. Between-unit homogeneity was quantified as well as stability during dispatch and storage in accordance with ISO Guide 35:2006 [2]. Within-unit homogeneity was also quantified to determine the minimum sample intake. The material was characterised by an inter-laboratory comparison among laboratories of demonstrated competence and adhering to ISO/IEC 17025. Technically invalid results were removed but no outlier was eliminated on statistical grounds only. Uncertainties of the certified values were calculated in compliance with the Guide to the Expression of Uncertainty in Measurement (GUM) [3] including uncertainty contribution related to possible heterogeneity and instability of the material as well as to the characterisation. The material is intended for the quality control and assessment of method performance. As any reference material, it can also be used for control charts or validation studies. The CRM is available in amber glass vials containing approximately 5 g of dried powder, placed in aluminized polythene sachet closed under a nitrogen atmosphere. The minimum amount of sample to be used is 200 mg. The CRM was accepted as European Reference Material (ERM®) after peer evaluation by the partners of the European Reference Materials consortium.

As the Commission's in-house science service, the Joint Research Centre's mission is to provide EU policies with independent, evidence-based scientific and technical support throughout the whole policy cycle. Working in close cooperation with policy Directorates-General, the JRC addresses key societal challenges while stimulating innovation through developing new methods, tools and standards, and sharing its know-how with the Member States, the scientific community and international partners. Key policy areas include: environment and climate change; energy and transport; agriculture and food security; health and consumer protection; information society and digital agenda; safety and security, including nuclear; all supported through a cross-cutting and multi-disciplinary approach.
LA
-NA
-26525-EN
-N
ISBN: 978-92-79-35531-8