cf final ppt
DESCRIPTION
,n,m.TRANSCRIPT


Flow of the presentation
• Indian oil and gas industry • Profile of the concerned organizations• And their dividend policies in brief • Introduction of “event study”• Discussion of the event study results• Discriminant Analysis

Oil and Gas industry
• India has total reserves (proved & indicated) of 1,201 million metric tonnes (MMT) of crude oil and 1,437 billion cubic metres (BCM) of natural gas as on April 1, 2010.
• Growth rate was 2.2% for the 2009-10 financial year.
• Total dividend payout by the industry was Rs 178 Billion.

Industry profilePublic Sector Undertakings (PSU's):ONGC - Oil & Natural Gas Corp (exploration and production)OIL - Oil India Limited (exploration & production)IOC - Indian Oil Corporation (refining & marketing)BPCL - Bharat Petroleum Corporation Ltd (refining and marketing)HPCL - Hindustan Petroleum (refining & marketing)GSPC - Gujarat State Petroleum CorpPrivate Oil & Gas companies in IndiaRIL - Reliance Industries Limited (Indian Oil & gas company)ESSAR (Indian Oil & Gas company)Cairns Energy IndiaBG energyNiko (upstream exploration & production)Shell OilBPTotal (downstream exploration & production, chemicals)

Overview of the Industry

Companies Profile

IOCLMar '10
Sources Of Funds in RS. CrTotal Share Capital 2,427.95
Equity Share Capital 2,427.95Share Application
Money 0Preference Share
Capital 0Reserves 48,124.88
Revaluation Reserves 0.00Equity 50,552.83
Secured Loans 18,292.45Unsecured Loans 26,273.80
Total Debt 44,566.25
47%53%
IOCLTotal Debt Equity

IOCL Share holding Pattern

RIL Capital structure
Mar '10
Sources Of Funds in RS. CrTotal Share Capital 3,270.37
Equity Share Capital 3,270.37Share Application
Money 0Preference Share Capital 0
Reserves 1,25,095.97Revaluation Reserves 8,804.27
Equity 1,37,170.61Secured Loans 11,670.50
Unsecured Loans 50,824.19Total Debt 62,494.69
31%
69%
Reliance
Total Debt Equity

RIL

Capital Structure
16%
84%
ONGCTotal Debt Equity
ONGCMar '10
Sources Of Funds in RS. CrTotal Share Capital 2,138.89
Equity Share Capital 2,138.89Share Application Money 0Preference Share Capital 0
Reserves 85,143.72Revaluation Reserves 0.00
Equity 87,282.61Secured Loans 0.00
Unsecured Loans 16,405.64Total Debt 16,405.64

ONGC Share holding pattern

Dividend History(ONGC)
1st April, 2009 to
31st March, 2010
1st April, 2008 to
31st March, 2009
1st April, 2007 to
31st March, 2008
1st April, 2006
to 31st March, 2007
1st April, 2005 to
31st March, 2006
1st April, 2004 to
31st March 2005
1st April, 2003 to
31st March 2004
1st April, 2002 to
31st March 2003
Face Value of equity shares (Rs. per share)
10 10 10 10 10 10 10 10
Dividend(Rs. in millions)
70,583 68,444 68,444 66,305 64,167 57,037 34,222 42,778
Dividend rate 330% 320% 320% 310% 450% 400% 240% 300%
Dividend Payout Ratio
42.09% 42.44% 40.98% 42.39% 44.47% 43.90% 39.50% 40.60%
Dividend tax(Rs. in millions)
11,616 11,632 11,632 10,125 9,000 7,763 4,385 2,375

HPCL Capital Structure
65%
35%
HPCLTotal Debt Equity
HPCLMar '10
Sources Of Fundsin RS. CrTotal Share Capital 339.01Equity Share Capital 339.01Share Application Money 0Preference Share Capital 0Reserves 11,218.96Revaluation Reserves 0.00Equity 11,557.97
Secured Loans 1,375.88Unsecured Loans 19,926.49
Total Debt 21,302.37

HPCL Share holding pattern

Financial Year
2008-09
2007-08 2006-07 2005-06 2004-05 2003-04 2002-03 2001-02
Interim Dividend
% 0 - 60 - 50 60 20 -
Final Dividend % 52.50 30 120 30 100 160 180 100
Total % 52.50 30 180 30 150 220 200 100
Dividend Amount
Rs. Cr.
177.78
101.59 610.8 101.8 509 746.81 678.66 339.33
Tax on Dividend
Rs. Cr.
30.21 17.27 97.75 14.28 71.15 95.65 78.26 -
Total Rs. Cr207.9
9118.86 708.55 116.08 580.15 842.46 756.92 339.33
Dividend Payout (As % of PAT)
% 36.17 10.47 45.1 28.62 45.42 44.25 49.24 43.06
Related Information
Profit after Tax
Rs.Cr.574.9
81134.88 1571.17 405.63 1277.33 1903.94 1537.36 787.98
EPS Rs.Cr. 16.98 33.51 46.35 11.97 37.69 56.18 45.37 23.26
Book Value/Share
Rs.Cr.316.8
8311.59 283.19 257.74 249.04 228.47 197.12 174.07
Dividend History( HPCL)

NTPC Capital structure
NTPCMar '10
Sources Of Funds in RS. CrTotal Share Capital 8,245.50
Equity Share Capital 8,245.50Share Application
Money 0Preference Share
Capital 0Reserves 55,478.60
Revaluation Reserves 0.00Equity 63,724.10
Secured Loans 9,079.90Unsecured Loans 28,717.10
Total Debt 37,797.00
37%
63%
NTPCTotal Debt Equity

NTPC share holding pattern

Event study
• An Event study is a statistical method to assess the impact of an event on the value of a firm.
• Here we take dividend payout as an event.

Abnormal Return

Constant Return Model

Market Model

Economical model
• Most appropriate model is Capital Asset Pricing Model(CAPM).
Re = Rf + B(Rm – Rf)
Rm = Average market return
Rf = risk free return
B = Sensitivity of the asset returns to the market returns.

CAPM
ModelE(Re) = 7.14 + B(12.59-7.14) +E(Re) = 7.14 + B(5.44)

Normally distribute

Hypothesis
Ho: The dividend payout has no impact on the behavior of returns.

Hypothesis Testing

Estimation and Absorption Period
90 days 15 days

Methodology
Step 1. a) Test market model b) if found significant use Paired T-TestStep 2. a) if market model is not capable in
explaining the behavior of the security, use CAPM model.
b) impact analysis by expected actual(returns)

Step 1. ONGC Regression Model
Model Summaryb
Model R R Square Adjusted R SquareStd. Error of the
Estimate1 .562a .315 .308 .022
a. Predictors: (Constant), Pre event Market return
b. Dependent Variable: Pre event Company return
Coefficientsa
Model
Unstandardized Coefficients
Standardized
Coefficients
t Sig.B Std. Error Beta1 (Constant) .000 .002 -.313 .755
Pre event Market .676 .106 .562 6.405 .000
a. Dependent Variable: Pre event Company return

Step 1.b)
• Regression model says that market returns are significantly influencing the security returns.
• Market model is able to explain the variation in the security returns.
• We decided to go with “Market Model”
Model
E(Re) = -0007+ .562(Rm)

ONGC Dividend Impact
There is no significant impact by the dividend payout.
Paired Samples Test
Paired Differences
t dfSig. (2-tailed)Mean
Std. Deviatio
n
Std. Error Mean
95% Confidence Interval of the
Difference
Lower UpperExpected – Post E .003 .019 .005 -.008 .013 .514 14 .616

RIL Regression model
Model Summaryb
Model R R Square Adjusted R SquareStd. Error of the
Estimate Durbin-Watson1
.175a .031 .020 .025 2.067
a. Predictors: (Constant), preMb. Dependent Variable: preC
Coefficientsa
Model
Unstandardized Coefficients
Standardized
Coefficientst Sig.B Std. Error Beta
1 (Constant) .005 .003 1.987 .050preM -.531 .316 -.175 -1.681 .096
a. Dependent Variable: preC

Step 2
• Regression model is not able to explain behavior of the security returns by market returns.
• So we decided to use CAPM model. ModelE(Re) = 7.14 + 5.44*1.06 ( annual)E(Re) = 12.906 % (annual)

Impact
Impact = Actual return( 15 days)-Expected return( 15 days)
=( -0.03432) -.57 = -.6075 There is negative impact by dividend payout.

HPCLDividend pay out impact using CAPM
Dividend payout year Dividend percent CAR (Cumulative abnormal returns)
interpretation
2010120%
0.0532 positive
200952.5%
-0.229207 negative
200830%
-0.013256 negative
2007120%
-0.002501 negative
200660%
-0.018701 negative

ONGCImpact analysis
Dividend payout year
Dividend percent CAR( cumulative abnormal return)
2010320%
0.00355
2009 180%
-0.037789
2008140%
0.03189
2007180%
-0.01367644
2006140%
-0.038502621

IOCL
Dividend payout year Dividend percent impact
2010 130.00 -0.051887564
2009 75.00 0.0391
2008 55.00 0.06857
2007 130.00 -0.021772
2006 60.00 0.11149384

NTPC
Dividend payout year Dividend percent impact
2010 30%
-0.001326
200928%
-0.000613
200827%
0.00067
200724%
-0.006835
200620%
0.00056

RIL
Dividend payout year Dividend percent impact
201070%
-0.60
2009130%
-0.08275
2008130%
-0.034412
2007100%
0.21406

Discriminant analysis
Objective:- 1. To evaluate the dividend payout decision.
2. To identify the variables, which affect the dividend payout decision.
Sample size = 88 companies from various industries.

Study reliability
Eigenvalues
Function Eigenvalue % of Variance Cumulative %Canonical Correlation
11.365a 100.0 100.0 .760

Wilks' Lambda
Test of Function(s) Wilks' Lambda Chi-square df Sig.1
.423 68.435 13 .000

Decision Criteria
Functions at Group Centroids
Paid or Not Paid
Function
1Not Paid -1.784
Paid .748

Decision Function
-1.784 .784

Influencing factors
Canonical Discriminant Function Coefficients
Function
1
Return On Equity .065Age .011PE Ratio .000Current Ratio -.070Credit Rating -.079Adjusted Cash Margin .011
Adjusted Cash Flow Times .004
Industry -.075ROE/Ke -.434market cap -.133(Constant) -1.740
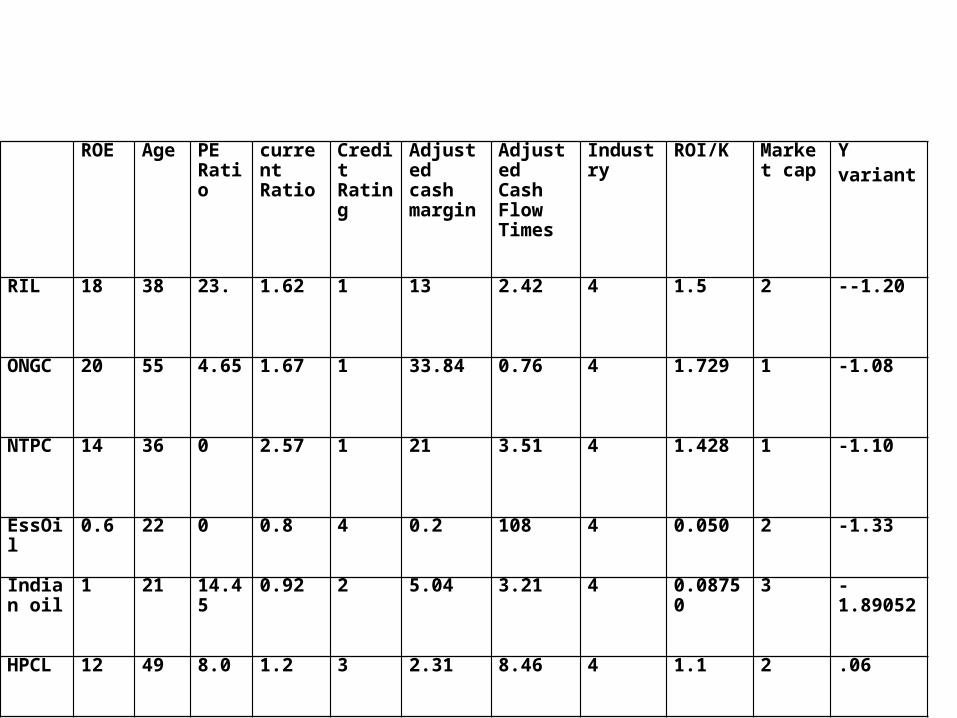
ROE Age PE Ratio
current Ratio
Credit Rating
Adjusted cash margin
Adjusted Cash Flow Times
Industry ROI/K Market cap
Yvariant
RIL
18 38 23. 1.62 1 13 2.42 4 1.5 2 --1.20
ONGC
20 55 4.65 1.67 1 33.84 0.76 4 1.729 1 -1.08
NTPC
14 36 0 2.57 1 21 3.51 4 1.428 1 -1.10
EssOil
0.6 22 0 0.8 4 0.2 108 4 0.050 2 -1.33
Indian oil
1 21 14.45 0.92 2 5.04 3.21 4 0.08750 3 -1.89052
HPCL
12 49 8.0 1.2 3 2.31 8.46 4 1.1 2 .06
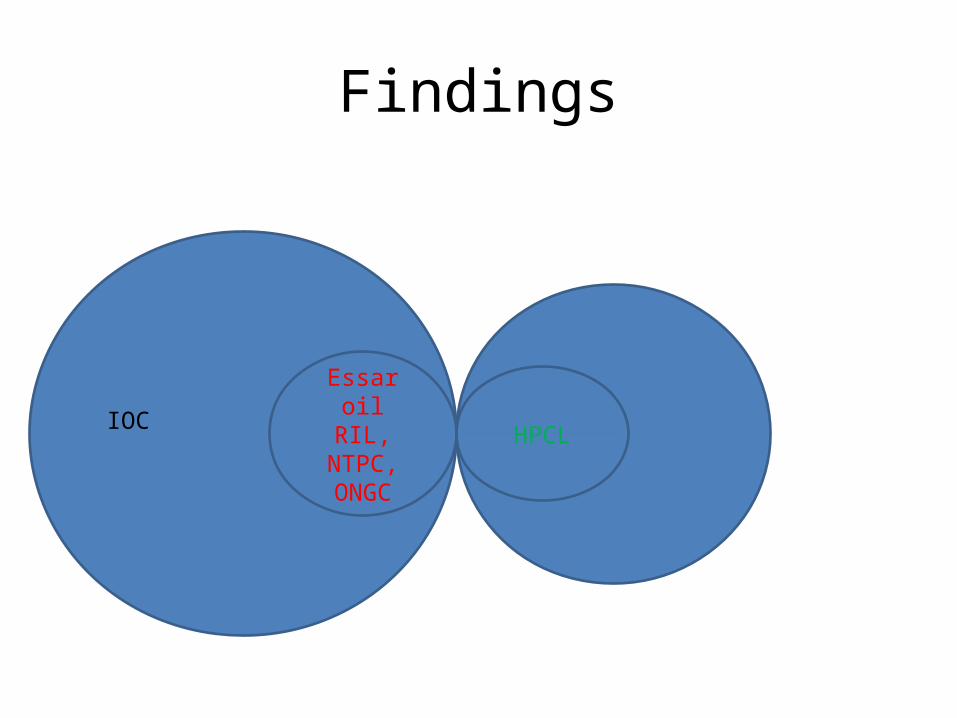
Findings
IOC Essar oil
RIL, NTPC, ONGC
HPCL

Thank You