cfd analysis of_centrifugal_pump
DESCRIPTION
CFD AnalysisTRANSCRIPT
CFD ANALYSIS OF CFD ANALYSIS OF CENTRIFUGAL PUMPCENTRIFUGAL PUMP
By: Dipak Pandey 10BME025
Pavan Patel 10BME031
Pujan Shah 10BME039
Guided By: Prof. S.V. Jain
Outline of PresentationOutline of Presentation
• Introduction• Objectives of Present Studies• Solid and Fluid Model• Meshing• Result and Discussion• Grid In-dependency• Cavitation Analysis
ObjectiveObjective
• CFD analysis of Centrifugal Pump in pump mode for different flow conditions in Fluent and Ansys CFX.• To plot the characteristics curves and compare it with
the model testing results.• CFD analysis of Centrifugal Pump in pump mode with
cavitation.
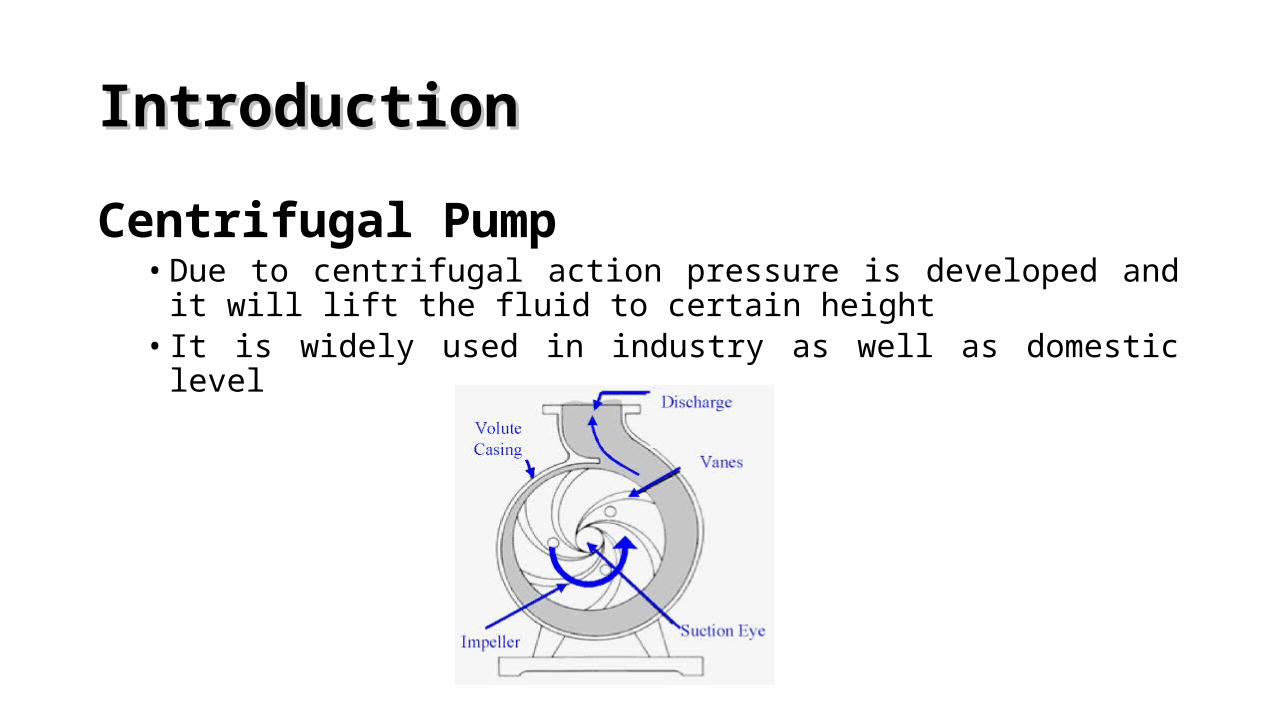
IntroductionIntroduction
Centrifugal Pump• Due to centrifugal action pressure is developed and it will lift
the fluid to certain height• It is widely used in industry as well as domestic level
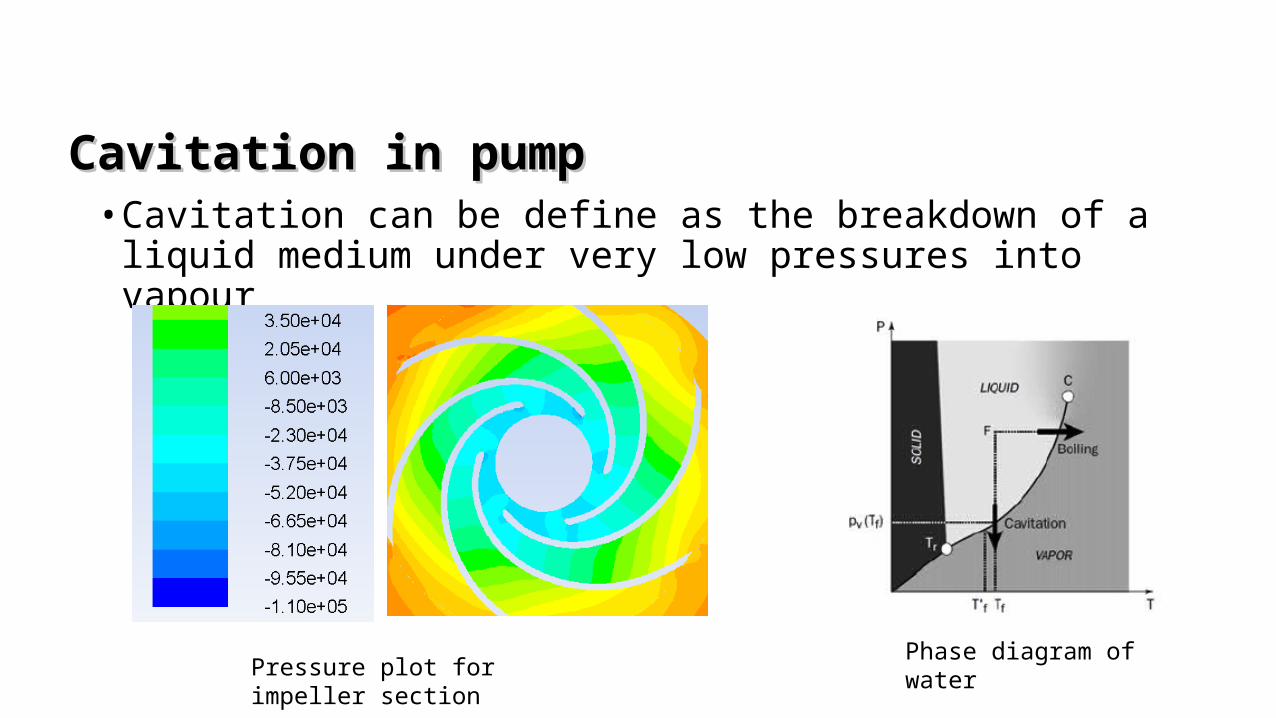
Cavitation in pumpCavitation in pump• Cavitation can be define as the breakdown of a liquid
medium under very low pressures into vapour
Phase diagram of waterPressure plot for impeller section
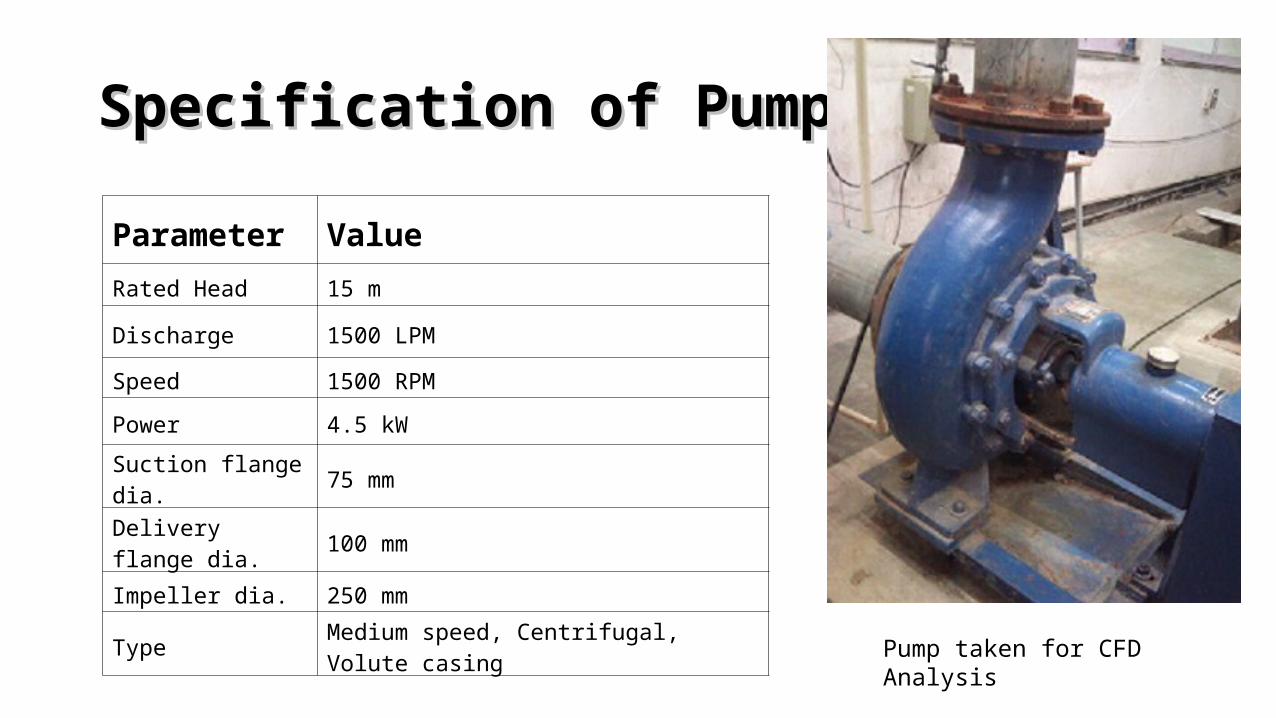
Specification of PumpSpecification of Pump
Parameter Value
Rated Head 15 m
Discharge 1500 LPM
Speed 1500 RPM
Power 4.5 kW
Suction flange dia.
75 mm
Delivery flange dia.
100 mm
Impeller dia. 250 mm
TypeMedium speed, Centrifugal, Volute casing
Pump taken for CFD Analysis
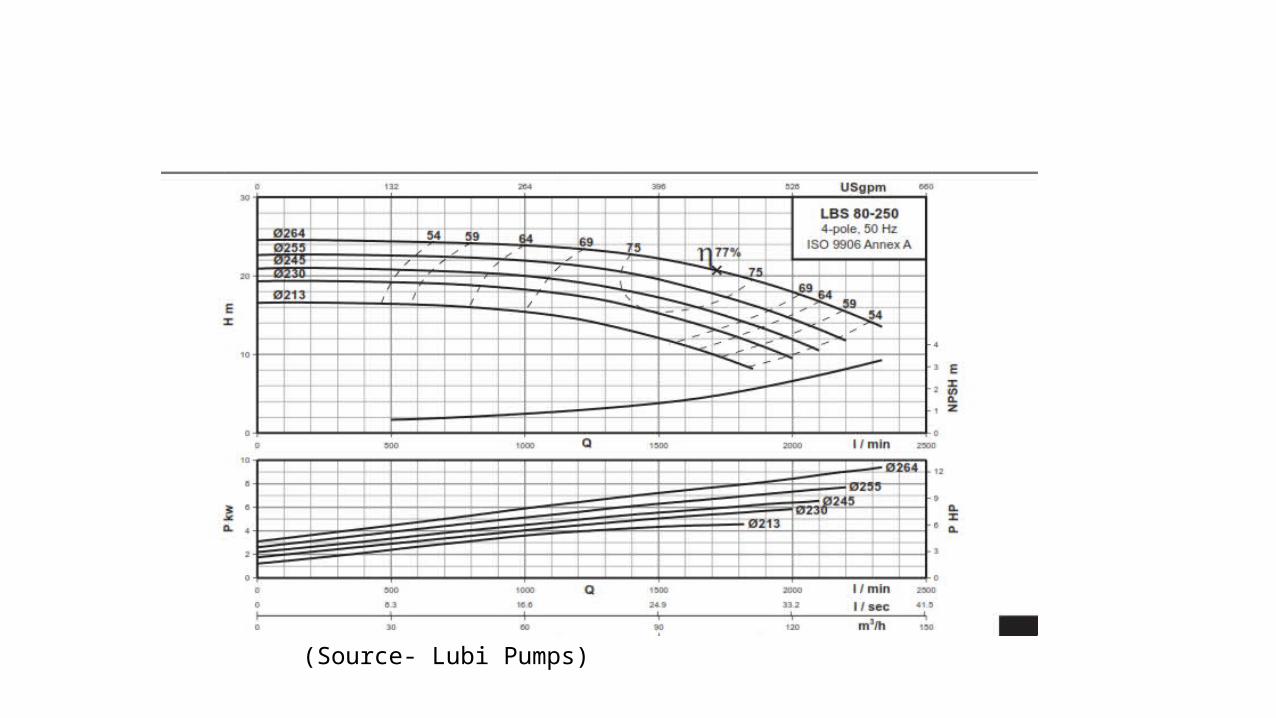
(Source- Lubi Pumps)
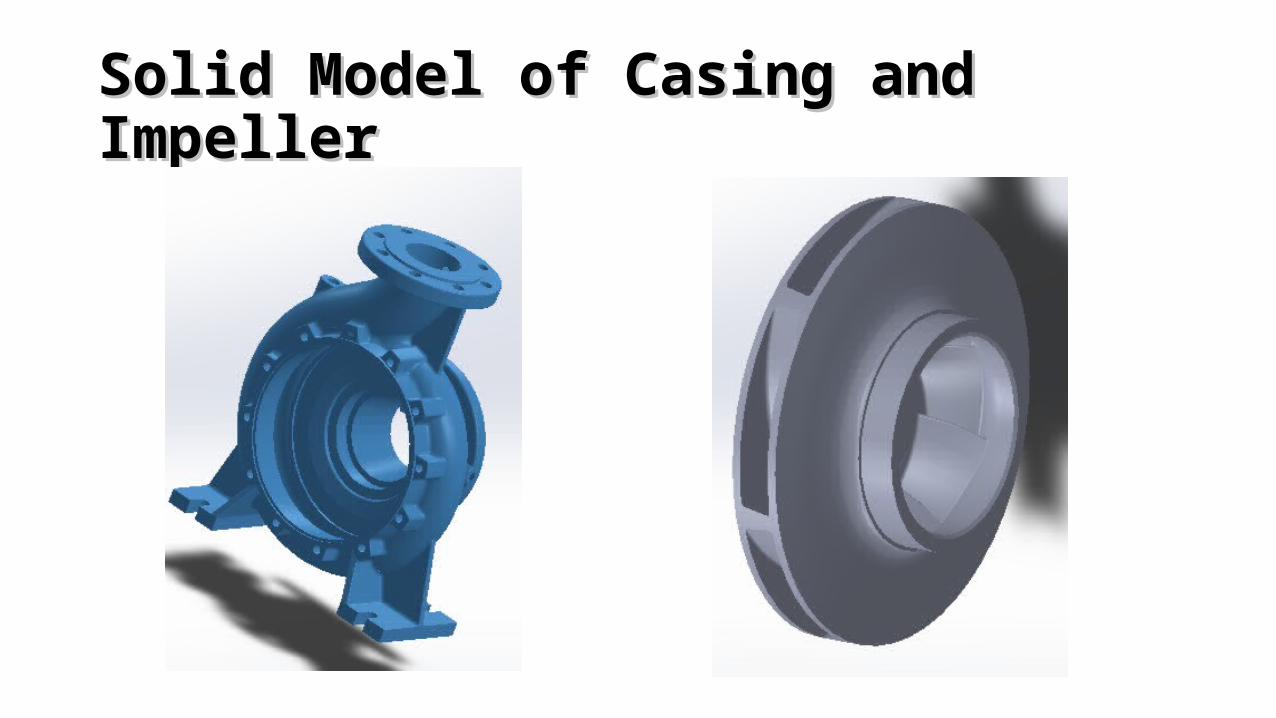
Solid Model of Casing and Solid Model of Casing and ImpellerImpeller
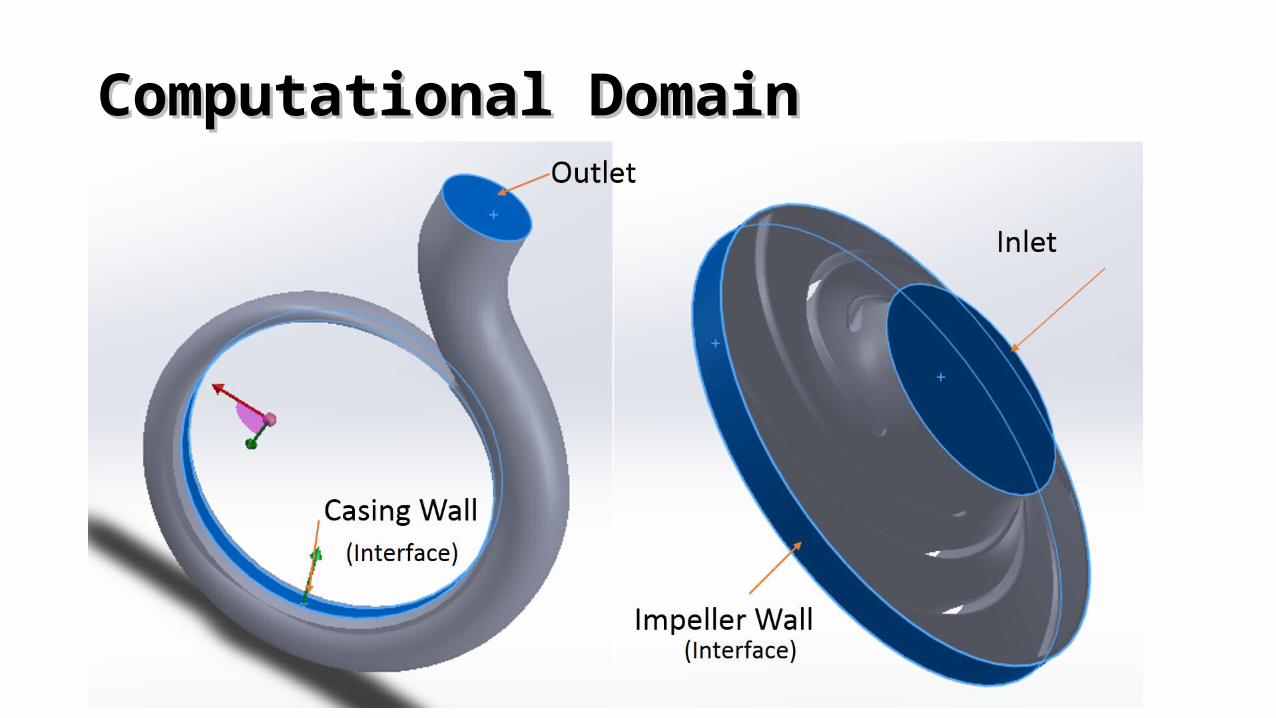
Computational DomainComputational Domain
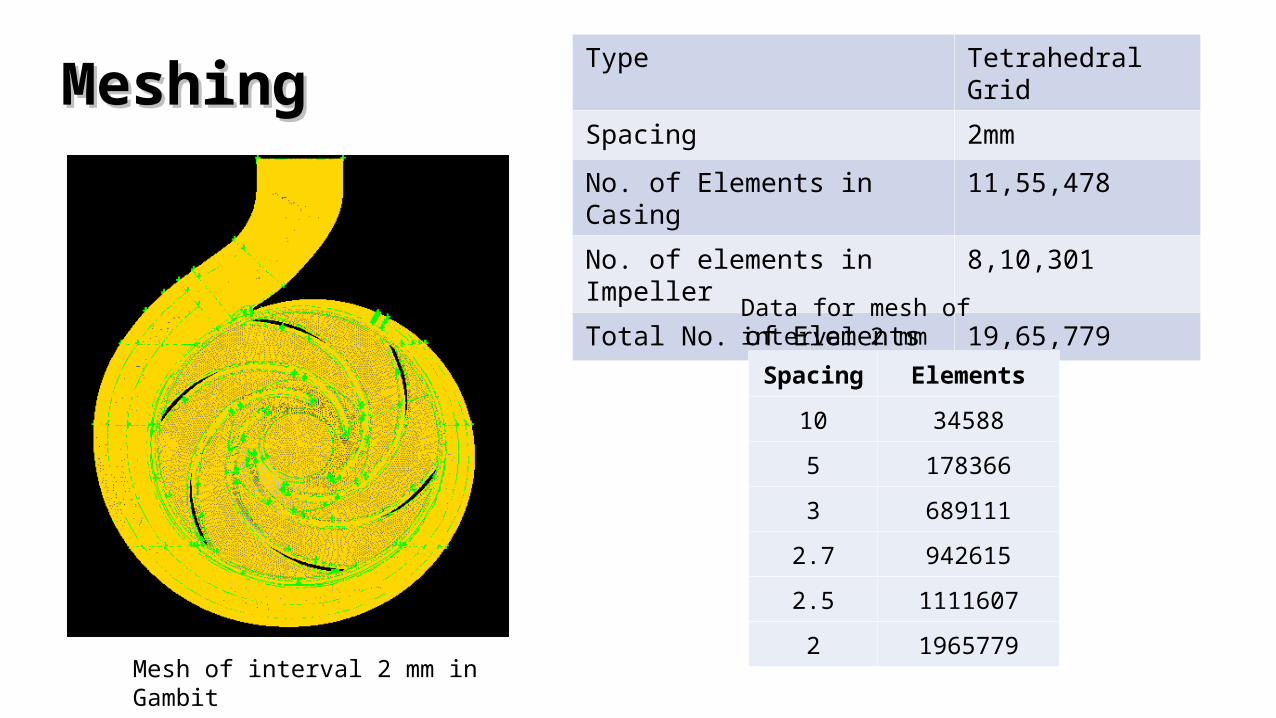
MeshingMeshingType Tetrahedral Grid
Spacing 2mm
No. of Elements in Casing 11,55,478
No. of elements in Impeller
8,10,301
Total No. of Elements 19,65,779
Spacing Elements
10 34588
5 178366
3 689111
2.7 942615
2.5 1111607
2 1965779
Data for mesh of interval 2 mm
Mesh of interval 2 mm in Gambit
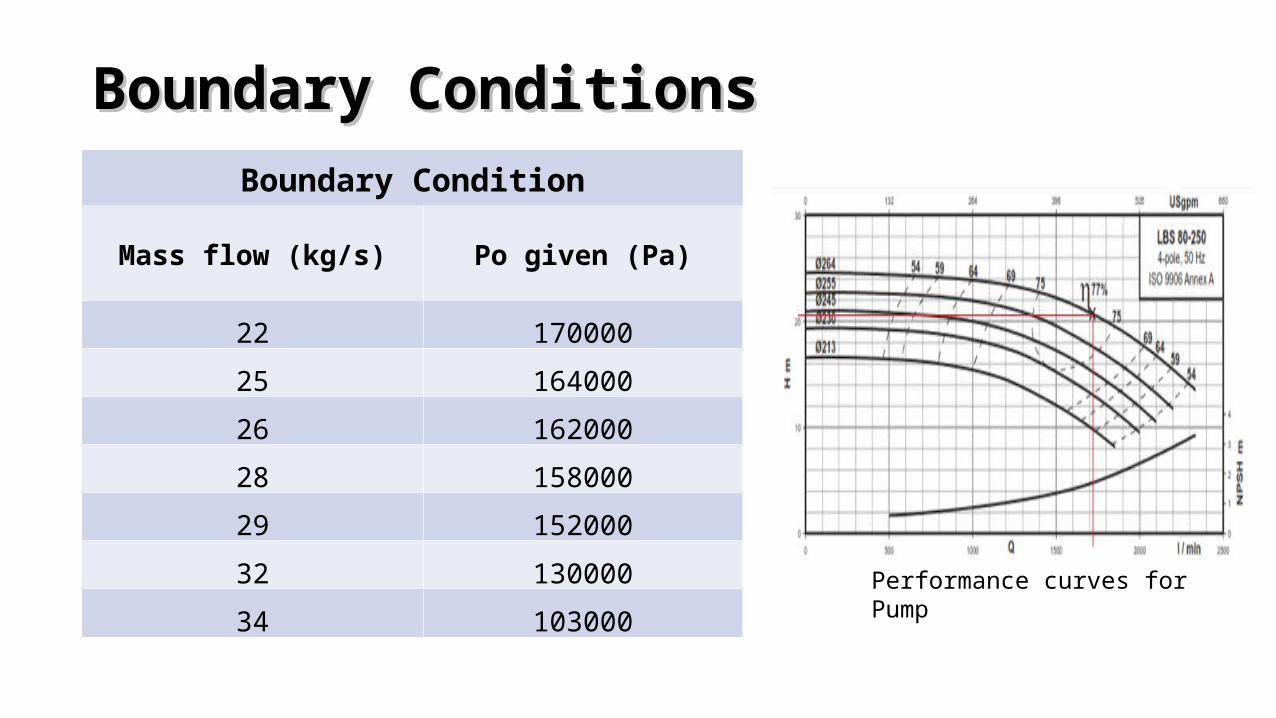
Boundary ConditionsBoundary ConditionsBoundary Condition
Mass flow (kg/s) Po given (Pa)
22 170000
25 164000
26 162000
28 158000
29 152000
32 130000
34 103000
Performance curves for Pump
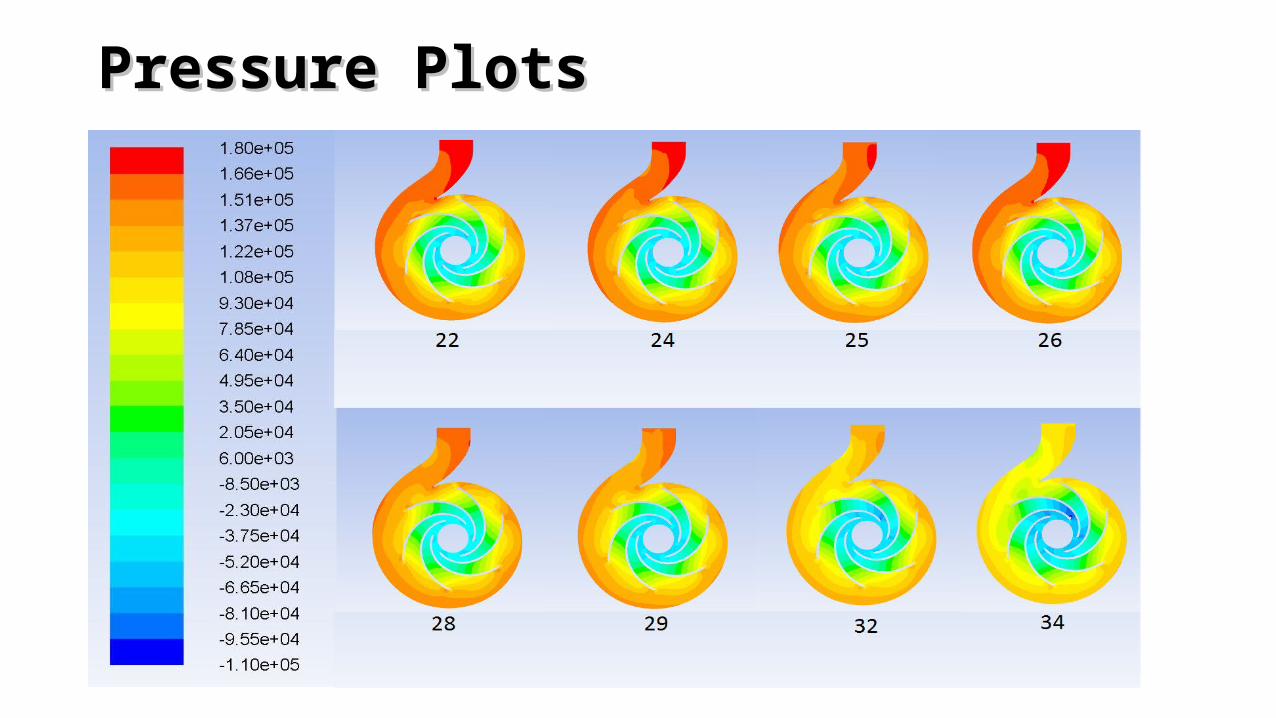
Pressure PlotsPressure Plots
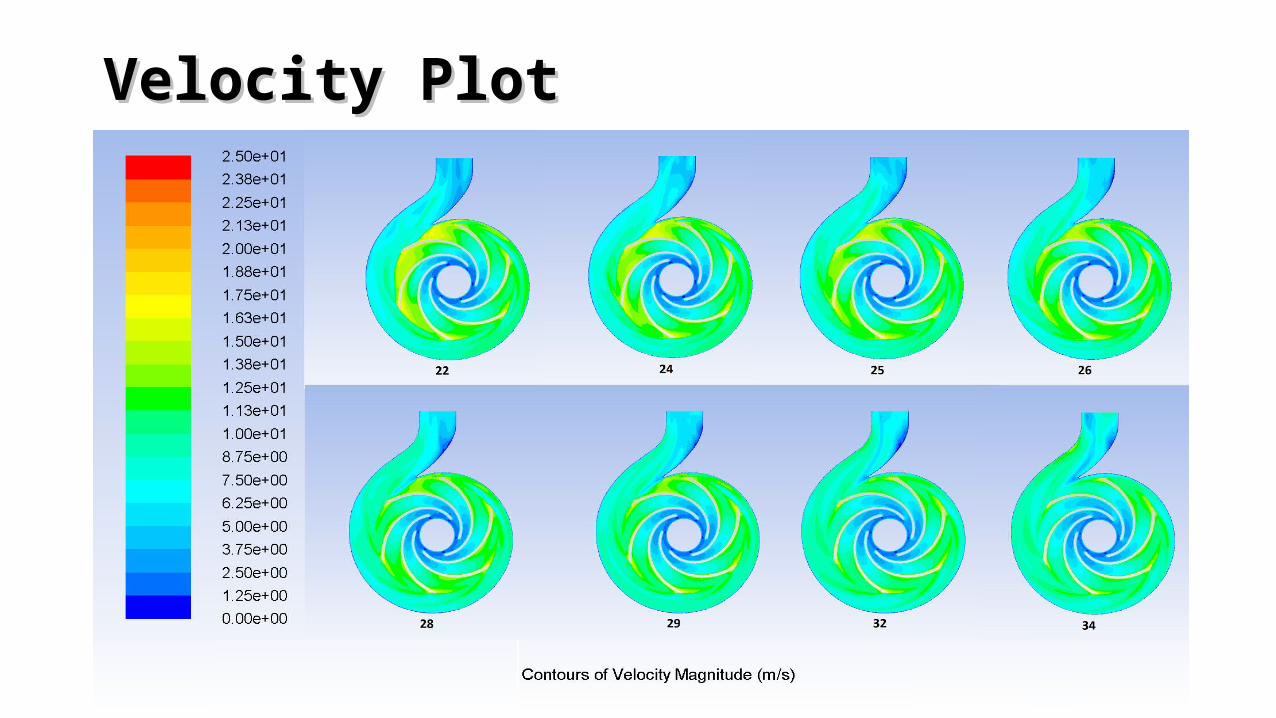
Velocity PlotVelocity Plot
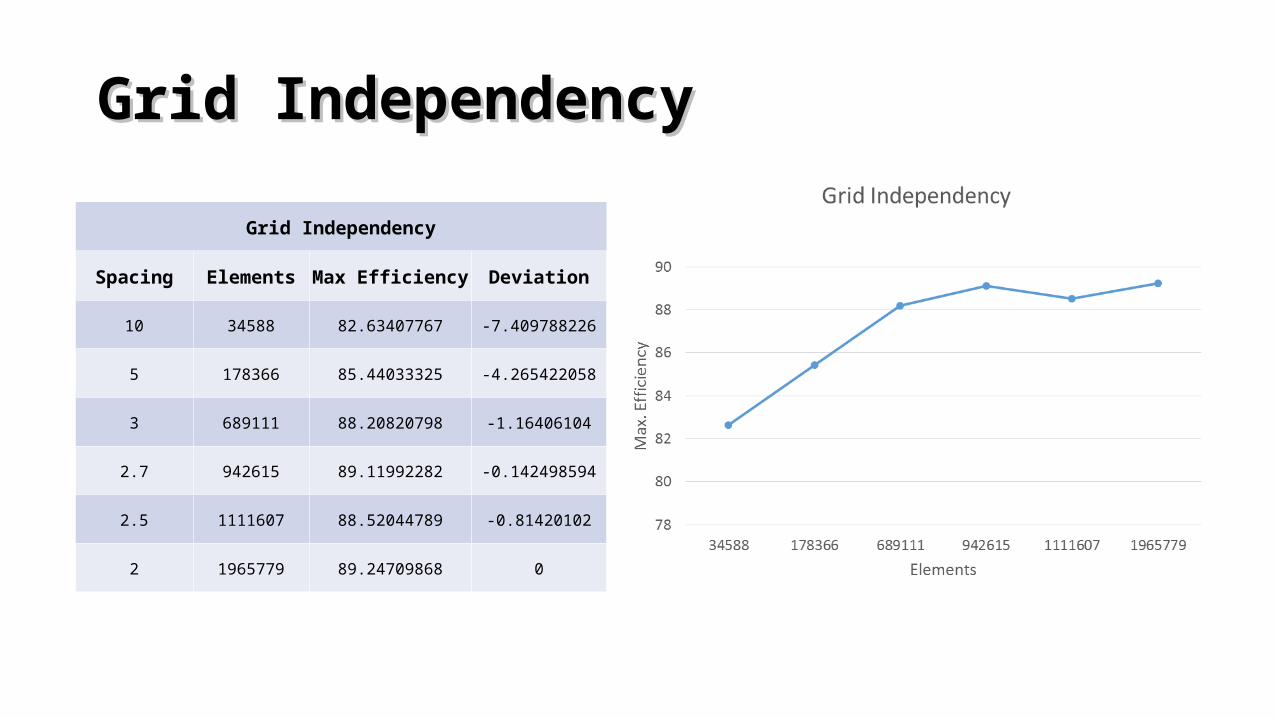
Grid IndependencyGrid Independency
Grid Independency
Spacing Elements Max Efficiency Deviation
10 34588 82.63407767 -7.409788226
5 178366 85.44033325 -4.265422058
3 689111 88.20820798 -1.16406104
2.7 942615 89.11992282 -0.142498594
2.5 1111607 88.52044789 -0.81420102
2 1965779 89.24709868 0
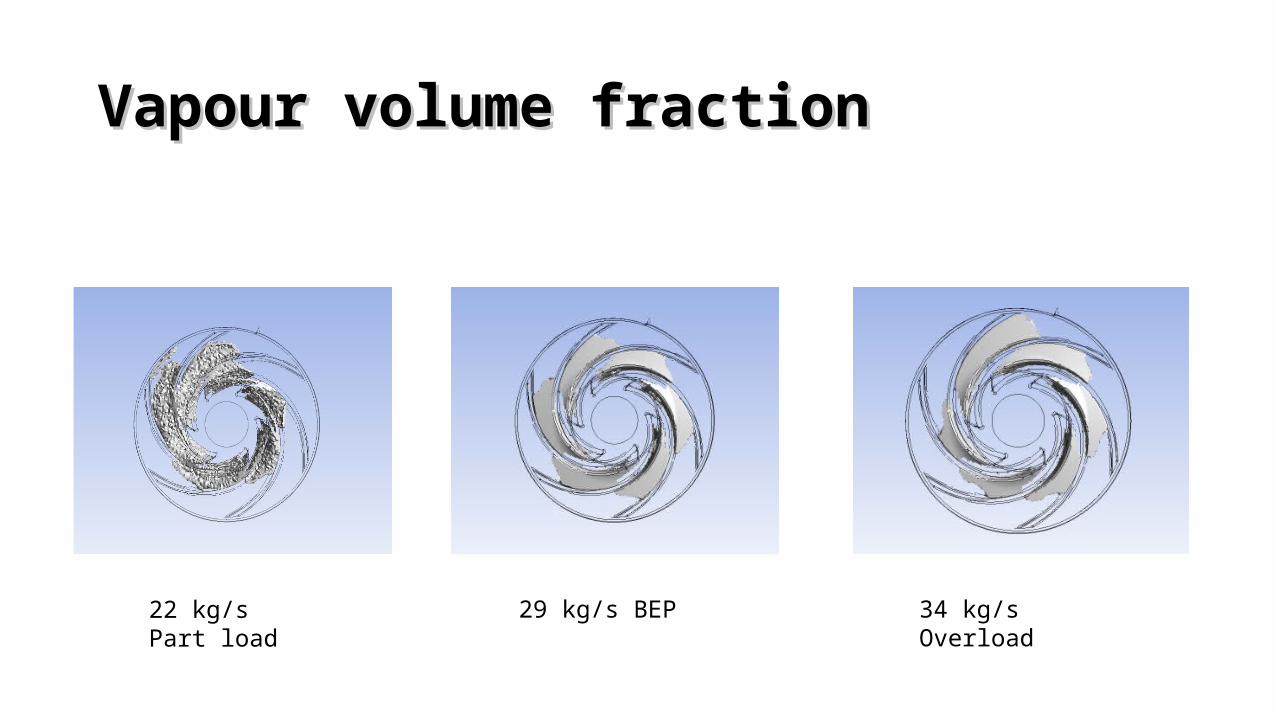
Vapour volume fractionVapour volume fraction
29 kg/s BEP22 kg/s Part load 34 kg/s Overload
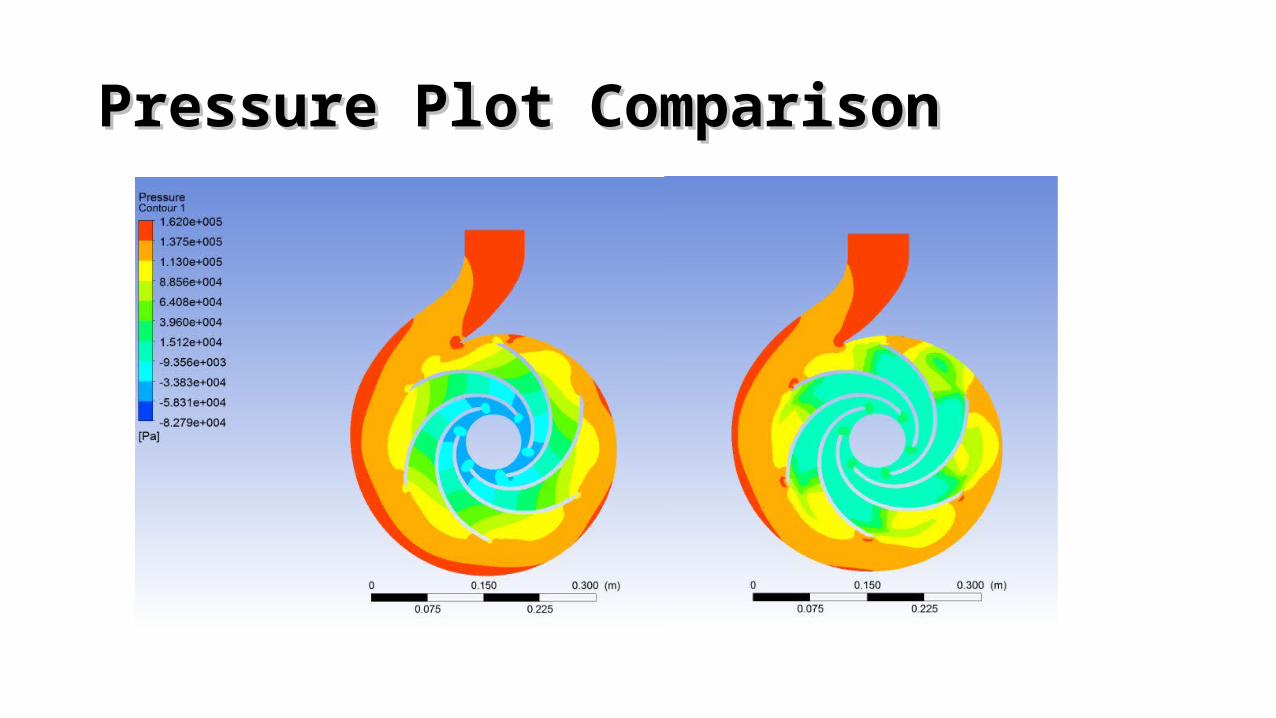
Pressure Plot ComparisonPressure Plot Comparison
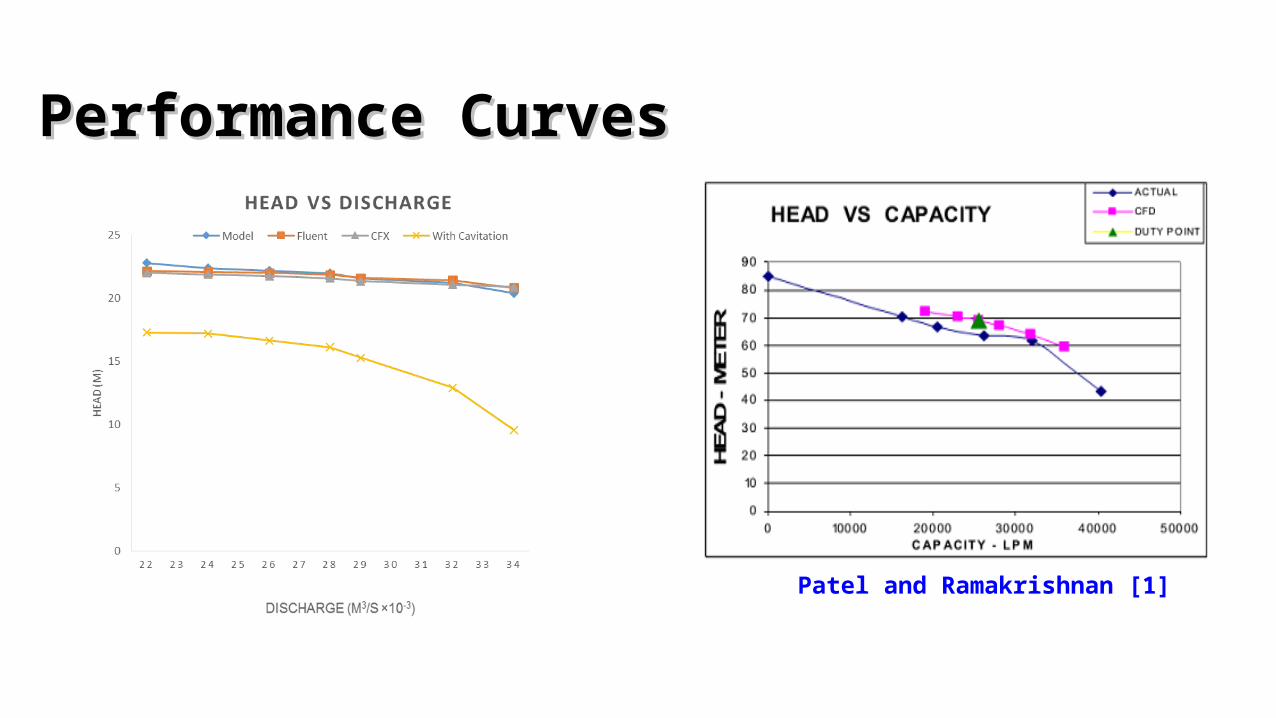
Performance CurvesPerformance Curves
Patel and Ramakrishnan [1]
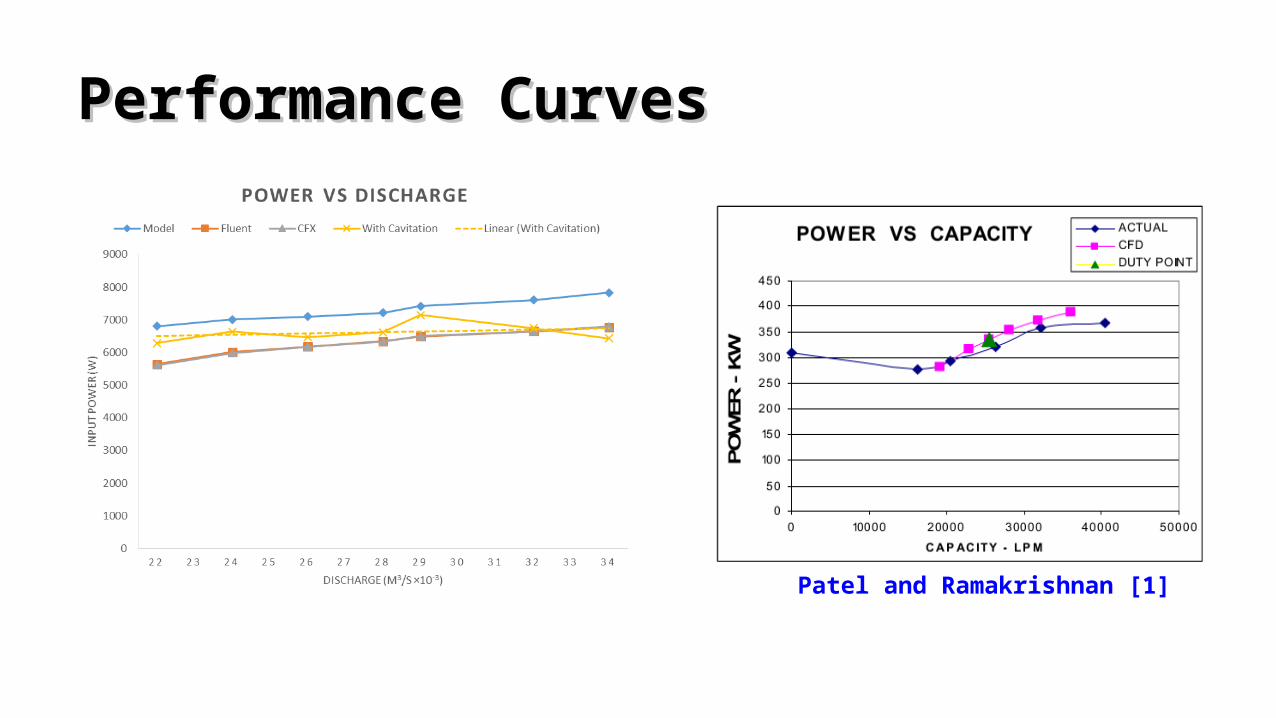
Performance CurvesPerformance Curves
Patel and Ramakrishnan [1]
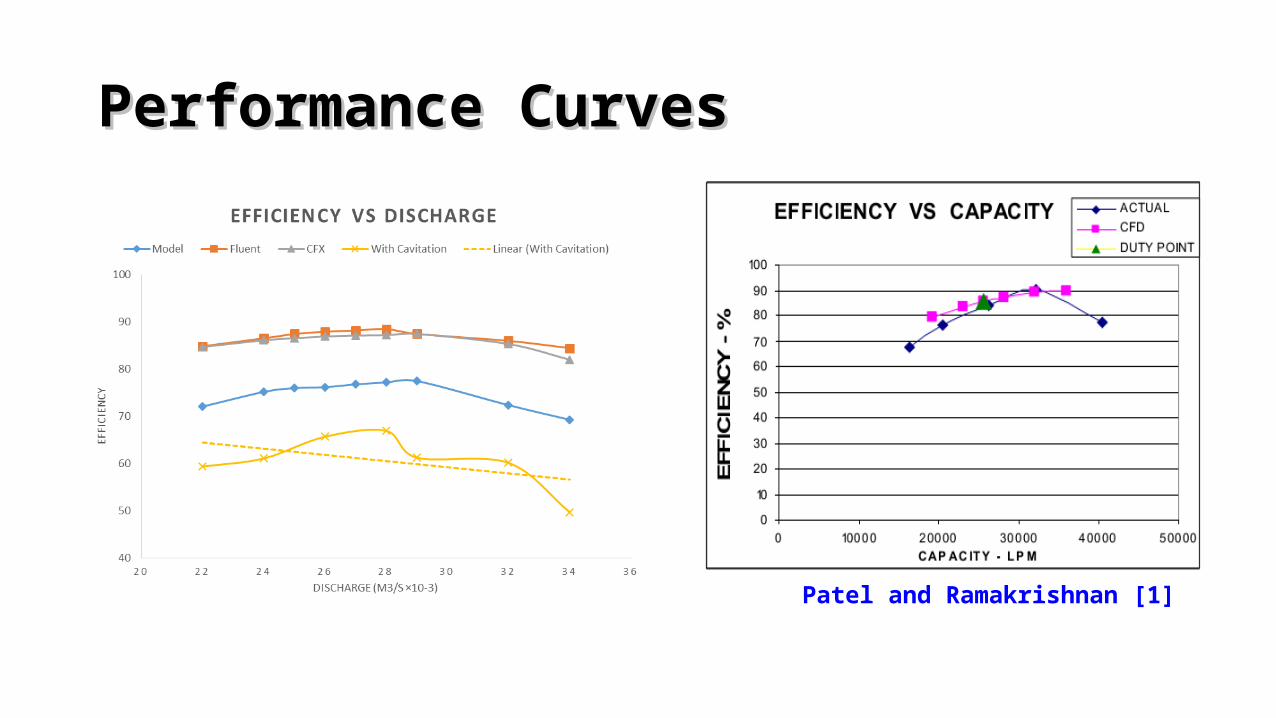
Performance CurvesPerformance Curves
Patel and Ramakrishnan [1]
ConclusionsConclusions
• For backward curved vanes centrifugal pump increase in mass flow rate Head decreases, Input and Output power increases
• Efficiency first increases with discharge, reach maximum efficiency at rated discharge and then decreases
• Input power required in CFD is less than model testing because leakage and friction loss are not considered.
• Maximum efficiency is found at 0.029 m3/s which is 89.24%.• In cavitation mode efficiency is 66.95%• Due to cavitation efficiency of pump reduces because for pumping of vapour more
power is required• Also due to cavitation head developed by pump is less because vapour has less density
than water

ReferencesReferences
1. Patel K and Ramakrishnan N, “CFD Analysis of Mixed Flow Pump”

Thank YouThank You