cfg custom portfolio corporation - croftgroup.com financial statements... · interest received...
TRANSCRIPT

CFG Custom Portfolio Corporation
Financial Statements
Years ended July 30, 2018 and 2017

Independent Auditors’ Report
To the Shareholders of the following funds of CFG Custom Portfolio Corporation, including:Class A-3 Conservative Equity,Class D-3 Income,Class E-3 Balance,Class F-3 Balance Growth,Class H-3 Alternative StrategiesClass I-3 Option Writing, andClass J-3 Enhanced Global Income:
We have audited the accompanying financial statements of each of the funds of CFG Custom Portfolio Corporation,including Class A-3 Conservative Equity, Class D-3 Income, Class E-3 Balance, Class F-3 Balance Growth, Class H-3Alternative Strategies, Class I-3 Option Writing and Class J-3 Enhanced Global Income, which comprise the statements offinancial position as at July 30, 2018 and 2017, and the statements of comprehensive income, changes in net assetsattributable to holders of redeemable shares, and cash flows for the years then ended, and a summary of significantaccounting policies and other explanatory information.
Management’s Responsibility for the Financial Statements
Management is responsible for the preparation and fair presentation of these financial statements in accordance withInternational Financial Reporting Standards, and for such internal control as management determines is necessary toenable the preparation of financial statements that are free from material misstatement, whether due to fraud or error.
Auditors' Responsibility
Our responsibility is to express an opinion on these financial statements based on our audits. We conducted our audits inaccordance with Canadian generally accepted auditing standards. Those standards require that we comply with ethicalrequirements and plan and perform the audit to obtain reasonable assurance about whether the financial statements arefree from material misstatement.
An audit involves performing procedures to obtain audit evidence about the amounts and disclosures in the financialstatements. The procedures selected depend on the auditors’ judgment, including the assessment of the risks of materialmisstatement of the financial statements, whether due to fraud or error. In making those risk assessments, the auditorconsiders internal control relevant to the entity’s preparation and fair presentation of the financial statements in order todesign audit procedures that are appropriate in the circumstances, but not for the purpose of expressing an opinion on theeffectiveness of the entity’s internal control. An audit also includes evaluating the appropriateness of accounting policiesused and the reasonableness of accounting estimates made by management, as well as evaluating the overall presentationof the financial statements.
We believe that the audit evidence we have obtained in our audits is sufficient and appropriate to provide a basis for ouraudit opinion.
Opinion
In our opinion, the financial statements present fairly, in all material respects, the financial position of each of the funds ofCFG Custom Portfolio Corporation, including Class A-3 Conservative Equity, Class D-3 Income, Class E-3 Balance, ClassF-3 Balance Growth, Class H-3 Alternative Strategies, Class I-3 Option Writing and Class J-3 Enhanced Global Income asat July 30, 2018 and 2017 and its financial performance and its cash flows of each of the foregoing funds for the years thenended in accordance with International Financial Reporting Standards.
Mississauga, Ontario Chartered Professional Accountants
October 29, 2018 Licensed Public Accountants

CFG Custom Portfolio CorporationTable of ContentsYears ended July 30, 2018 and 2017
Page
Class A-3 Conservative Equity Statement of Financial Position 4
Statement of Comprehensive Income 5
Statement of Changes in Net Assets Attributable to
Holders of Redeemable Shares 6
Schedule of Investment Portfolio 7
Statement of Cash Flows 9
Class D-3 Income Statement of Financial Position 10
Statement of Comprehensive Income 11
Statement of Changes in Net Assets Attributable to
Holders of Redeemable Shares 12
Schedule of Investment Portfolio 13
Statement of Cash Flows 15
Class E-3 Balanced Statement of Financial Position 16
Statement of Comprehensive Income 17
Statement of Changes in Net Assets Attributable to
Holders of Redeemable Shares 18
Schedule of Investment Portfolio 19
Statement of Cash Flows 21
Class F-3 Balanced Growth Statement of Financial Position 22
Statement of Comprehensive Income 23
Statement of Changes in Net Assets Attributable to
Holders of Redeemable Shares 24
Schedule of Investment Portfolio 25
Statement of Cash Flows 27
Class H-3 Alternative Strategies Statement of Financial Position 28
Statement of Comprehensive Income 29
Statement of Changes in Net Assets Attributable to
Holders of Redeemable Shares 30
Statement of Cash Flows 31
Class I-3 Option Writing Statement of Financial Position 32
Statement of Comprehensive Income 33
Statement of Changes in Net Assets Attributable to
Holders of Redeemable Shares 34
Schedule of Investment Portfolio 35
2

Statement of Cash Flows 38
Class J-3 Enhanced Global Income Statement of Financial Position 39
Statement of Comprehensive Income 40
Statement of Changes in Net Assets Attributable to
Holders of Redeemable Shares 41
Schedule of Investment Portfolio 42
Statement of Cash Flows 45
Notes to the Financial Statements 46 - 83
3

CFG Custom Portfolio CorporationClass A-3 Conservative EquityStatement of Financial PositionAs at July 30
2018 2017
AssetsCurrent assets
Investments (Schedule of investment portfolio) $ 62,943,559 $ 60,420,835Cash and cash equivalents (Note 4) 5,548,876 7,660,805Accrued interest 93,685 -Accrued dividends 96,631 80,380Subscriptions receivable 9,032 280,882Prepaid income taxes 159,466 157,794
Total assets 68,851,249 68,600,696
LiabilitiesCurrent liabilities
Accrued liabilities (Note 7) 88,600 32,370Redemptions payable 16,000 56,282Derivative liabilities (Schedule of investment portfolio) 689,654 179,399
Total liabilities (excluding net assets attributableto holders of redeemable shares) 794,254 268,051
Net assets attributable to holders of redeemable shares $ 68,056,995 $ 68,332,645
Series Net Assets Attributable to Holders ofRedeemable Shares
Series A $ 57,379,777 $ 6,024,739Series D 10,677,218 14,272,751Series I - 48,035,155
$ 68,056,995 $ 68,332,645
Number of Shares Outstanding (Note 5)Series A 2,869,647 289,564Series D 655,958 827,837Series I - 2,649,646
Net Assets Attributable to Holders of RedeemableShares per Share
Series A $ 20.00 $ 20.81Series D $ 16.28 $ 17.24Series I $ - $ 18.13
The accompanying notes are an integral part of these financial statements.
Approved on behalf of the Board of the R. N. Croft Financial Group Inc.
Signed: "Chris Croft" Director
4

CFG Custom Portfolio CorporationClass A-3 Conservative EquityStatement of Comprehensive IncomeFor the years ended July 30
2018 2017
Income
Interest $ 140,098 $ 6,497Dividends 1,051,622 973,368Foreign withholding taxes (22,229) (28,002)Income trust distribution 35,589 6,970Realized gain on sale of investments 7,093,754 8,118,850Unrealized depreciation of investments (497,849) (1,507,608)Exchange on foreign currencies 646,933 (71,563)
8,447,918 7,498,512
Expenses
Management fees (Note 7) 224,625 123,918Harmonized sales tax 53,998 42,274Bank charges and interest 2,175 1,316General operating expenses 466,271 416,520
747,069 584,028
Increase in net assets attributable to holders of redeemable shares $ 7,700,849 $ 6,914,484
Increase in net assets attributable to holders ofredeemable shares
Series A $ 1,822,903 $ 846,887Series D 1,589,476 532,233Series I 4,288,470 5,535,364
$ 7,700,849 $ 6,914,484
Increase in net assets attributable to holders of redeemableshares per share (Note 13)
Series A $ 1.11 $ 2.30Series D $ 1.82 $ 0.86Series I $ 3.12 $ 2.07
The accompanying notes are an integral part of these financial statements.
5

CFG Custom Portfolio CorporationClass A-3 Conservative EquityStatement of Changes in Net Assets Attributable to Holders of Redeemable SharesFor the years ended July 30
Series A Series D Series I Total
2018 2017 2018 2017 2018 2017 2018 2017
Net assets attributable to holders ofredeemable shares, beginning of year $ 6,024,739 $ 7,229,722 $ 14,272,751 $ 6,160,188 $ 48,035,155 $ 41,476,860 $ 68,332,645 $ 54,866,770
Operations:Increase in net assets attributable to holdersof redeemable shares 1,822,903 846,887 1,589,476 532,233 4,288,470 5,535,364 7,700,849 6,914,484
Redeemable share transactionsProceeds from issuance of shares 76,487,004 4,231,760 6,572,497 16,865,997 10,511,446 19,499,688 93,570,947 40,597,445
Reinvested distributions 1,820,701 86,905 2,061,396 123,557 6,127,744 556,386 10,009,841 766,848
Redemptions (26,947,485) (6,282,560) (11,753,870) (9,285,400) (62,821,231) (18,474,942) (101,522,586) (34,042,902)
51,360,220 (1,963,895) (3,119,977) 7,704,154 (46,182,041) 1,581,132 2,058,202 7,321,391
Distribution to Shareholders (Note 6) (1,828,085) (87,975) (2,065,032) (123,824) (6,141,584) (558,201) (10,034,701) (770,000)
Net (decrease) increase in net assets attributable to holders of redeemable shares for the year 51,355,038 (1,204,983) (3,595,533) 8,112,563 (48,035,155) 6,558,295 (275,650) 13,465,875
Net assets attributable to holders ofredeemable shares, end of year $ 57,379,777 $ 6,024,739 $ 10,677,218 $ 14,272,751 $ - $ 48,035,155 $ 68,056,995 $ 68,332,645
The accompanying notes are an integral part of these financial statements.
6

CFG Custom Portfolio CorporationClass A-3 Conservative EquitySchedule of Investment PortfolioAs at July 30, 2018
Description Quantity $Cost $Fair Value
FIXED INCOME- Long
Ford Credit Canada Co 3.7 8/2/2018 3,420,000 3,436,847 3,421,317
TMX Group Ltd 3.253 10/3/2018 3,000,000 3,008,140 3,006,030
Total FIXED INCOME-Long 6,444,987 6,427,347
CANADIAN EQUITY- Long
Alimentation Couche Tard Inc 48,400 2,416,343 2,887,543
BMO Laddered Preferred Share Index ETF 200,000 2,315,130 2,338,000
Brookfield Asset Management Inc Class A 43,700 1,992,259 2,372,036
CCL Industries Inc 47,100 1,785,104 3,088,818
Dollarama Inc 58,400 2,879,224 2,706,840
Hardwoods Distribution Income Fund 148,800 2,700,572 2,449,248
Intertape Polymer Group Inc 114,800 2,642,235 1,944,712
Manulife Financial Corp 113,300 2,798,990 2,705,604
National Bank of Canada 43,600 1,966,533 2,780,372
NFI Group Inc 62,500 2,861,759 3,081,875
Open Text Corp 62,700 2,653,410 3,019,005
Premium Brands Holdings Corp 27,000 3,069,889 2,771,010
Richelieu Hardware Ltd 100,500 3,102,583 2,752,695
Sleep Country Canada Holdings Inc 65,500 2,056,054 1,967,620
Toronto-Dominion Bank 34,800 1,811,411 2,674,380
Whitecap Resources Inc 285,700 2,927,567 2,491,304
Total CANADIAN EQUITY-Long 39,979,062 42,031,062
FOREIGN EQUITY- Long
Broadcom Inc 9,100 2,991,418 2,668,096
CVS Caremark Corp 35,600 3,413,480 3,125,461
DocuSign Inc 14,900 1,026,260 1,003,164
Facebook Inc 10,300 2,340,152 2,294,017
Alphabet Inc Class A 1,500 1,816,402 2,402,268
Visa Inc 16,800 1,432,661 2,985,309
Total FOREIGN EQUITY-Long 13,020,373 14,478,315
7

CFG Custom Portfolio CorporationClass A-3 Conservative EquitySchedule of Investment Portfolio (continued)As at July 30, 2018
Description Quantity $Cost $Fair Value
DERIVATIVE ASSETS- Long
General Dynamics Corp 8/17/2018 Call 205 7,000 24,258 6,836
Total DERIVATIVE ASSETS- Long 24,258 6,836
Total Investment Assets 59,468,681 62,943,559
DERIVATIVE LIABILITIES-Short
Alibaba Group Holding Ltd 8/17/2018 Put 200 (7,600) (163,664) (157,828)
Google Inc.-CL A 08/17/18 Call 1300 (1,500) (13,222) (7,812)
Bank of America 08/17/18 Put 32 (72,500) (321,885) (84,955)
DocuSign Inc 08/17/18 Put 50 (16,200) (45,540) (35,224)
DocuSign Inc 08/17/18 Put 52.5 (4,200) (18,234) (16,241)
Facebook Inc 08/17/18 Put 180 (1,500) (14,559) (20,077)
General Dynamics Corp 08/17/18 Put 215 (7,800) (211,018) (183,818)
General Dynamics Corp 09/21/18 Put 215 (2,500) (53,707) (57,288)
UnitedHealth Group Inc 6/21/2019 Put 240 (7,600) (191,558) (126,411)
Total DERIVATIVE LIABILITIES-Short (1,033,387) (689,654)
Total Investment Portfolio 58,435,294 62,253,905
Other Net Assets 5,803,090
Net Assets Attributable to Holders of Redeemable Shares 68,056,995
The accompanying notes are an integral part of these financial statements.
8

CFG Custom Portfolio CorporationClass A-3 Conservative EquityStatement of Cash FlowsFor the years ended July 30
2018 2017
Cash flows from operating activitiesIncrease in net assets attributable to holders of redeemableshares $ 7,700,849 $ 6,914,484Adjustments for:
Purchase of investments (86,634,909) (48,485,900)Proceeds on disposition of investments 91,218,345 40,626,164Net realized gain on sale of investments (7,093,754) (8,118,850)Increase in accrued interest (93,685) -Increase in accrued dividends (16,252) (9,489)Increase in prepaid income taxes (1,672) (122,806)Increase (decrease) in accrued liabilities 56,231 (40,591)Unrealized depreciation of investments 497,849 1,507,608
Net cash provided by (used in) operating activities 5,633,002 (7,729,380)
Cash flows from financing activitiesProceeds from issue of shares 93,570,947 40,597,445Decrease in subscriptions receivable 271,850 437,264Redemption of shares (101,522,586) (34,042,902)Decrease in redemptions payable (40,282) (41,073)Cash distributions (24,860) (3,152)
Net cash flows (used in) provided by financing activities (7,744,931) 6,947,582
Decrease in cash (2,111,929) (781,798)
Cash, beginning of year 7,660,805 8,442,603
Cash and cash equivalents, end of year $ 5,548,876 $ 7,660,805
Interest received 46,414 6,497Dividends and distributions received, net of withholding taxes 1,048,730 942,846Interest paid 1,772 699
The accompanying notes are an integral part of these financial statements.
9

CFG Custom Portfolio CorporationClass D-3 IncomeStatement of Financial PositionAs at July 30
2018 2017
AssetsCurrent assets
Investments (Schedule of investment portfolio) $ 71,841,648 $ 58,239,892Cash and cash equivalents (Note 4) 4,616,348 4,260,574Accrued interest 261,460 33,166Accrued dividends 216,111 209,015Subscriptions receivable 6,108 785,177Prepaid income taxes 106,932 105,199
Total assets 77,048,607 63,633,023
LiabilitiesCurrent liabilities
Accrued liabilities (Note 7) 85,861 28,082Distributions payable 10 -Redemptions payable - 99,626Derivative liabilities (Schedule of investment portfolio) 902,412 440,014
Total liabilities (excluding net assets attributable to holders of redeemable shares) 988,283 567,722
Net assets attributable to holders of redeemable shares $ 76,060,324 $ 63,065,301
Series Net Assets Attributable to Holders ofRedeemable Shares
Series A $ 66,796,211 $ 6,253,088Series D 9,264,113 12,018,650Series I - 44,793,563
$ 76,060,324 $ 63,065,301
Number of Shares Outstanding (Note 5)Series A 5,488,776 515,445Series D 780,551 1,002,597Series I - 3,537,440
Net Assets Attributable to Holders of Redeemable Shares per Share
Series A $ 12.17 $ 12.13Series D $ 11.87 $ 11.99Series I $ - $ 12.66
The accompanying notes are an integral part of these financial statements.Approved on behalf of the Board of the R. N. Croft Financial Group Inc.
Signed: "Chris Croft" Director
10

CFG Custom Portfolio CorporationClass D-3 IncomeStatement of Comprehensive IncomeFor the years ended July 30
2018 2017
Income
Interest $ 443,439 $ 260,621Dividends 1,870,316 1,329,899Foreign withholding taxes (34,833) (14,944)Income trust distribution 486,244 620,840Realized gain on sale of investments 1,834,770 2,282,961Unrealized appreciation (depreciation) of investments 964,763 (222,432)Exchange on foreign currencies 120,204 94,635
5,684,903 4,351,580
Expenses
Management fees (Note 7) 205,452 102,939Harmonized sales tax 47,800 37,948Bank charges and interest 6,702 2,201General operating expenses 432,487 365,305
692,441 508,393
Increase in net assets attributable to holders of redeemable shares $ 4,992,462 $ 3,843,187
Increase in net assets attributable to holders ofredeemable shares
Series A $ 2,358,187 $ 355,852Series D 598,776 282,711Series I 2,035,499 3,204,624
$ 4,992,462 $ 3,843,187
Increase in net assets attributable to holders ofredeemable shares per share (Note 13)
Series A $ 0.81 $ 0.81Series D $ 0.59 $ 0.37Series I $ 1.16 $ 0.92
The accompanying notes are an integral part of these financial statements.
11

CFG Custom Portfolio CorporationClass D-3 IncomeStatement of Changes in Net Assets Attributable to Holders of Redeemable SharesFor the years ended July 30
Series A Series D Series I Total
2018 2017 2018 2017 2018 2017 2018 2017
Net assets attributable to holders of redeemable shares, beginning of year $ 6,253,088 $ 4,938,949 $ 12,018,650 $ 5,652,742 $ 44,793,563 $ 39,756,688 $ 63,065,301 $ 50,348,379
Operations:Increase in net assets attributableto holders of redeemable shares 2,358,187 355,852 598,776 282,711 2,035,499 3,204,624 4,992,462 3,843,187
Redeemable share transactionsProceeds from issuance of shares 74,528,089 4,245,698 6,060,549 14,625,353 11,058,281 18,258,782 91,646,919 37,129,833
Reinvested distributions 11,141 112,835 762,600 192,218 1,828,768 939,095 2,602,509 1,244,148
Redemptions (14,547,024) (3,287,368) (9,408,588) (8,539,737) (57,883,724) (16,423,141) (81,839,336) (28,250,246)
59,992,206 1,071,165 (2,585,439) 6,277,834 (44,996,675) 2,774,736 12,410,092 10,123,735
Distributions to shareholders (Note 6) (1,807,270) (112,878) (767,874) (194,637) (1,832,387) (942,485) (4,407,531) (1,250,000)
Net increase (decrease) in net assets attributable to holders of redeemable shares for the year 60,543,123 1,314,139 (2,754,537) 6,365,908 (44,793,563) 5,036,875 12,995,023 12,716,922
Net assets attributable to holders of redeemable shares, end of year $ 66,796,211 $ 6,253,088 $ 9,264,113 $ 12,018,650 $ - $ 44,793,563 $ 76,060,324 $ 63,065,301
The accompanying notes are an integral part of these financial statements.
12

CFG Custom Portfolio CorporationClass D-3 IncomeSchedule of Investment PortfolioAs at July 30, 2018Description Quantity $Cost $Fair Value
FIXED INCOME- Long
Bank of Nova Scotia 3.036 10/18/2024 379,000 389,309 380,633
Capital Desjardins Inc 4.954 12/15/2026 342,000 386,323 363,001
Constellation Software Float 3/31/2040 1,611,200 1,875,136 2,054,280
Dollarama Inc 3.095 11/5/2018 3,432,000 3,449,857 3,440,597
Ford Credit Canada Co 3.7 8/2/2018 2,930,000 2,942,900 2,931,128
Loblaw Companies Ltd 3.748 03/12/19 4,500,000 4,544,100 4,540,095
Morneau Shepell Inc 4.75 6/30/2021 265,000 275,507 310,050
Premium Brands Hldgs Cor 4.6 12/31/2023 700,000 700,000 791,000
Premium Brands Hldgs Cor 4.65 4/30/2021 1,170,000 1,193,146 1,509,885
Royal Bank of Canada 2.77 12/11/2018 4,433,000 4,453,434 4,445,856
Royal Bank of Canada 2.99 12/6/2024 380,000 389,196 381,577
Shell International Fin 4.3 9/22/2019 1,600,000 2,112,906 2,118,354
TMX Group Ltd 3.253 10/3/2018 3,432,000 3,448,870 3,438,898
Total FIXED INCOME-Long 26,160,684 26,705,354
CANADIAN EQUITY- Long
AG Growth International Inc 32,500 1,737,225 1,817,400
Algonquin Power & Utilities Co 172,500 2,068,927 2,208,000
Bank of Montreal 4.85% PFD 47,100 1,212,787 1,245,324
BMO Laddered Preferred Share Index ETF 228,100 2,577,898 2,666,489
Bank of Nova Scotia 4.85% PFD 46,900 1,200,169 1,230,656
Brookfield Asset Mgmt Float PFD 98,000 1,020,866 1,719,900
Brookfield Infrastructure Partners LP 50,800 2,628,240 2,708,656
Brookfield Renewable Par 5% PFD 49,100 1,227,057 1,237,320
Capital Power Corp 5.75% PFD 25,000 627,803 640,000
Chartwell Seniors Housing Real Estate Investment Trust 121,100 1,865,345 1,845,564
Cineplex Inc 68,400 2,414,625 1,959,660
Enbridge Inc 5.15% PFD 48,900 1,230,251 1,250,862
EnerCare Inc 122,100 2,234,778 2,297,922
Exchange Income Corp 59,000 2,018,747 1,943,460
Financial 15 Split Corp 5.5% PFD 259,356 2,618,680 2,601,341
Intact Financial Corp 4.9% PFD 30,000 750,000 752,400
iShares S&P/TSX Canadian Preferred Share Index Fund 288,400 3,812,064 4,103,932
Premium Income Corp 5.75% PFD 221,436 3,382,190 3,365,827
SIR Royalty Income Fund 97,500 1,317,001 1,497,600
Toronto-Dominion Bank 4.85% PFD 49,500 1,265,561 1,289,970
13

CFG Custom Portfolio CorporationClass D-3 IncomeSchedule of Investment Portfolio (continued)As at July 30, 2018Description Quantity $Cost $Fair Value
CANADIAN EQUITY- Long (continued)
Tricon Capital Group Inc 202,400 2,185,141 2,155,560
WPT Industrial Real Estate Investment Trust 85,722 1,397,291 1,541,334
Total CANADIAN EQUITY-Long 40,792,646 42,079,177
FOREIGN EQUITY- Long
Blackstone Group LP/The 56,000 2,312,899 2,549,003
Total FOREIGN EQUITY-Long 2,312,899 2,549,003
REAL ESTATE- Long
Greater Edmonton Retail Ltd Partnership 10 300,000 330,000
Total REAL ESTATE-Long 300,000 330,000
DERIVATIVE ASSETS- Long
SPDR S&P 500 ETF Trust 1/18/2019 Put 270 20,000 238,329 178,114
Total DERIVATIVE ASSETS- Long 238,329 178,114
Total Investment Assets 69,804,557 71,841,648
DERIVATIVE LIABILITIES-Short
Alibaba Group Holding Ltd 08/17/18 Put 185 (13,500) (98,573) (93,861)
Blackrock Inc 08/17/18 Put 520 (3,800) (90,531) (106,373)
Blackstone Group LP/The 9/21/2018 Call 34 (56,000) (38,866) (129,054)
Broadcom Ltd 08/17/18 Put 220 (8,900) (137,938) (42,875)
Cineplex Inc 8/17/2018 Call 32 (68,400) (68,400) (4,104)
Constellation Brands Inc 08/17/18 Put 215 (11,000) (56,961) (100,970)
Ebay 08/03/18 Put 35 (72,500) (77,991) (132,153)
iShares 20+ Year Treasury Bond 08/17/18 Put 118 (28,500) (25,680) (23,748)
Micron Technology Inc 09/21/18 Put 50 (48,500) (99,761) (121,874)
Northrop Grumman 08/17/18 Put 300 (8,000) (74,750) (59,059)
Royal Caribbean Cruises Ltd 08/17/18 Put 110 (23,000) (134,480) (88,341)
Total DERIVATIVE LIABILITIES-Short (903,931) (902,412)
Total Investment Portfolio 68,900,626 70,939,236
Other Net Assets 5,121,088
Net Assets Attributable to Holders of Redeemable Shares 76,060,324
The accompanying notes are an integral part of these financial statements.
14

CFG Custom Portfolio CorporationClass D-3 IncomeStatement of Cash FlowsFor the years ended July 30
2018 2017
Cash flows from operating activitiesIncrease in net assets attributable to holders of redeemableshares $ 4,992,462 $ 3,843,187Adjustments for:
Purchase of investments (110,897,705) (68,305,922)Proceeds on disposition of investments 101,559,440 60,558,272Net realized gain on investments (1,834,770) (2,282,961)(Increase) decrease in accrued interest (228,293) 4,554Increase in accrued dividends (7,096) (159,532)Increase in prepaid income taxes (1,733) (105,199)Increase (decrease) in accrued liabilities 57,781 (37,586)Unrealized (appreciation) depreciation of investments (964,763) 222,432
Net cash used in operating activities (7,324,677) (6,262,755)
Cash flows from financing activitiesProceeds from issue of shares 91,646,919 37,129,833Decrease (increase) in subscriptions receivable 779,068 (423,226)Redemption of shares (81,839,336) (28,250,246)(Decrease) increase in redemptions payable (99,626) 49,280Cash distributions (1,805,022) (5,852)Increase in distributions payable 10 -
Net cash flows provided by financing activities 8,682,013 8,499,789
Increase in cash 1,357,336 2,237,034
Cash, beginning of year 3,259,012 2,023,540
Cash and cash equivalents, end of year $ 4,616,348 $ 4,260,574
Interest received 215,145 265,172Dividends and distributions received, net of withholding taxes 2,314,631 1,776,263Interest paid 6,321 1,732
The accompanying notes are an integral part of these financial statements.
15

CFG Custom Portfolio CorporationClass E-3 BalancedStatement of Financial PositionAs at July 30
2018 2017
AssetsCurrent assets
Investments (Schedule of investment portfolio) $ 14,171,067 $ 13,167,722Cash and cash equivalents (Note 4) 2,892,572 2,868,439Accrued interest 32,695 1,224Accrued dividends 41,957 44,696Prepaid income taxes 36,419 36,013
Total assets 17,174,710 16,118,094
LiabilitiesCurrent liabilities
Accrued liabilities (Note 7) 18,108 7,884Redemptions payable - 4,491Derivative liabilities (Schedule of investment portfolio) 147,255 4,579
Total liabilities (excluding net assets attributableto holders of redeemable shares) 165,363 16,954
Net assets attributable to holders of redeemable shares $ 17,009,347 $ 16,101,140
Series Net Assets Attributable to Holders of Redeemable Shares
Series A $ 16,415,810 $ 15,939,222Series D $ 593,537 $ 161,918
$ 17,009,347 $ 16,101,140
Number of Shares Outstanding (Note 5)
Series A 1,068,869 1,038,622Series D 56,496 15,139
Net Assets Attributable to Holders of RedeemableShares per Share
Series A $ 15.36 $ 15.35Series D $ 10.51 $ 10.70
The accompanying notes are an integral part of these financial statements.
Approved on behalf of the Board of the R. N. Croft Financial Group Inc.
Signed: "Chris Croft" Director
16

CFG Custom Portfolio CorporationClass E-3 BalancedStatement of Comprehensive IncomeFor the years ended July 30
2018 2017
Income
Interest $ 67,103 $ 21,554Dividends 395,091 307,876Foreign withholding taxes (6,383) (8,141)Income trust distribution 123,019 185,421Realized gain on sale of investments 1,167,167 751,284Unrealized (depreciation) appreciation of investments (413,283) 67,140Exchange on foreign currencies (54,589) (111,457)
1,278,125 1,213,677
Expenses
Management fees (Note 7) 45,800 38,531Harmonized sales tax 6,675 5,769Bank charges and interest 929 174General operating expenses 81,022 70,559
134,426 115,033
Increase in net assets attributable to holders of redeemable shares $ 1,143,699 $ 1,098,644
Increase in net assets attributable to holders ofredeemable shares
Series A $ 1,133,715 $ 1,094,355Series D $ 9,984 $ 4,289
$ 1,143,699 $ 1,098,644
Increase in net assets attributable to holders of redeemable shares per share (Note 13)
Series A $ 1.05 $ 1.12Series D $ 0.22 $ 0.41
The accompanying notes are an integral part of these financial statements.
17

CFG Custom Portfolio CorporationClass E-3 BalancedStatement of Changes in Net Assets Attributable to Holders of Redeemable SharesFor the years ended July 30
Series A Series D Total
2018 2017 2018 2017 2018 2017
Net assets attributable to holders of redeemable shares, beginning of year $ 15,939,222 $ 13,220,751 $ 161,918 $ 30,864 $ 16,101,140 $ 13,251,615
Operations:Increase in net assets attributable to holdersof redeemable shares 1,133,715 1,094,355 9,984 4,289 1,143,699 1,098,644
Redeemable share transactionsProceeds from issuance of shares 1,516,712 3,090,168 696,721 209,200 2,213,433 3,299,368
Reinvested distributions 690,137 277,912 21,418 2,316 711,555 280,228
Redemptions (1,782,671) (1,436,280) (275,086) (82,435) (2,057,757) (1,518,715)
424,178 1,931,800 443,053 129,081 867,231 2,060,881
Distributions to shareholders (Note 6) (1,081,305) (307,684) (21,418) (2,316) (1,102,723) (310,000)
Net increase in net assets attributable to holders of redeemable sharesfor the year 476,588 2,718,471 431,619 131,054 908,207 2,849,525
Net assets attributable to holders of redeemable shares, end of year $ 16,415,810 $ 15,939,222 $ 593,537 $ 161,918 $ 17,009,347 $ 16,101,140
The accompanying notes are an integral part of these financial statements.
18

CFG Custom Portfolio CorporationClass E-3 BalancedSchedule of Investment PortfolioAs at July 30, 2018Description Quantity $Cost $Fair Value
FIXED INCOME- Long
AG Growth International 4.5 12/31/2022 430,000 425,700 434,300
Bank of America Corp 2.6 1/15/2019 550,000 695,158 716,365
Coca-Cola Co/The 1.375 5/30/2019 550,000 687,179 709,437
Constellation Software Float 3/31/2040 203,700 239,662 259,718
Exchange Income Corp 5.25 12/31/2022 430,000 430,068 437,525
Ford Credit Canada Co 3.7 8/2/2018 826,000 827,809 826,318
TMX Group Ltd 3.253 10/3/2018 1,000,000 1,004,200 1,002,010
Total FIXED INCOME-Long 4,309,776 4,385,673
CANADIAN EQUITY- Long
Algonquin Power & Utilities Co 40,500 493,025 518,400
Bank of Montreal 4.85% PFD 16,300 429,039 430,972
Bank of Nova Scotia 4.85% PFD 16,300 427,838 427,712
Brookfield Asset Mgmt Float PFD 25,244 337,987 443,032
Brookfield Infrastructure Partners LP 10,000 518,054 533,200
Brookfield Renewable Par 5% PFD 17,000 425,602 428,400
Capital Power Corp 5.75% PFD 16,500 424,017 422,400
Cineplex Inc 34,000 1,107,251 974,100
Enbridge Inc 5.15% PFD 17,000 434,194 434,860
EnerCare Inc 28,200 516,707 530,724
Financial 15 Split Corp 5.5% PFD 85,800 862,371 860,574
Intact Financial Corp 4.9% PFD 17,200 427,507 431,376
iShares S&P/TSX Canadian Preferred Share Index Fund 102,800 1,249,020 1,462,844
Premium Income Corp 5.75% PFD 56,064 852,852 852,173
SIR Royalty Income Fund 33,800 488,136 519,168
Tricon Capital Group Inc 48,400 517,679 515,460
Total CANADIAN EQUITY-Long 9,511,279 9,785,395
Total Investment Assets 13,821,055 14,171,067
19

CFG Custom Portfolio CorporationClass E-3 BalancedSchedule of Investment Portfolio (continued)As at July 30, 2018Description Quantity $Cost $Fair Value
DERIVATIVE LIABILITIES-Short
Alibaba Group Holding Ltd 08/17/18 Put 180 (3,500) (16,495) (14,810)
Blackrock Inc 08/17/18 Put 510 (1,200) (20,455) (21,718)
Broadcom Ltd 08/17/18 Put 210 (2,700) (29,064) (4,570)
Cineplex Inc 08/17/18 Call 30 (34,000) (23,960) (8,500)
Constellation Brands Inc 08/17/18 Put 210 (3,000) (9,980) (15,624)
Ebay 08/03/18 Put 35 (18,500) (19,901) (33,722)
General Dynamics Corp 8/17/2018 Put 200 (1,200) (10,243) (8,046)
Goldman Sachs Group Inc/The 9/21/2018 Put 240 (2,200) (31,393) (19,850)
iShares 20+ Year Treasury Bond 08/17/18 Put 118 (11,000) (9,911) (9,166)
Royal Caribbean Cruises Ltd 08/17/18 Put 105 (6,000) (18,508) (11,249)
Total DERIVATIVE LIABILITIES-Short (189,910) (147,255)
Total Investment Portfolio 13,631,145 14,023,814
Other Net Assets 2,985,533
Net Assets Attributable to Holders of Redeemable Shares 17,009,347
The accompanying notes are an integral part of these financial statements.
20

CFG Custom Portfolio CorporationClass E-3 BalancedStatement of Cash FlowsFor the years ended July 30
2018 2017
Cash flows from operating activitiesIncrease in net assets attributable to holders of redeemableshares $ 1,143,699 $ 1,098,644Adjustments for:
Purchase of investments (27,442,296) (11,591,380)Proceeds on disposition of investments 27,335,511 11,967,422Net realized gain on sale of investments (1,167,167) (751,284)Increase in accrued interest (31,471) (4)Decrease (increase) in accrued dividends 2,739 (23,799)Increase in prepaid income taxes (406) (36,013)Increase (decrease) in accrued liabilities 10,224 (10,927)Unrealized depreciation (appreciation) of
investments 413,283 (67,140)
Net cash provided by operating activities 264,116 585,519
Cash flows from financing activitiesProceeds from issue of shares 2,213,433 3,299,368Redemption of shares (2,057,757) (1,518,715)(Decrease) increase in redemptions payable (4,491) 4,491Cash distributions (391,168) (29,772)
Net cash flows (used in) provided by financing activities (239,983) 1,755,372
Increase in cash 24,133 2,340,891
Cash, beginning of year 2,868,439 527,548
Cash and cash equivalents, end of year $ 2,892,572 $ 2,868,439
Interest received 35,631 21,549Dividends and distributions received, net of withholding taxes 514,465 461,359Interest paid 860 123
The accompanying notes are an integral part of these financial statements.
21

CFG Custom Portfolio CorporationClass F-3 Balanced GrowthStatement of Financial PositionAs at July 30
2018 2017
AssetsCurrent liabilities
Investments (Schedule of investment portfolio) $ 23,235,314 $ 19,477,234Cash 1,523,872 2,130,988Accrued dividends 51,600 40,430Subscriptions receivable 106 106Prepaid income taxes 47,420 46,843
Total assets 24,858,312 21,695,601
LiabilitiesCurrent liabilities
Accrued liabilities (Note 7) 25,484 10,414Redemptions payable 129,252 30,025Derivative liabilities (Schedule of investment portfolio) 44,268 34,461
Total liabilities (excluding net assets attributable to holders of redeemable shares 199,004 74,900
Net assets attributable to holders of redeemable shares $ 24,659,308 $ 21,620,701
Series Net Assets Attributable to Holders ofRedeemable Shares
Series A $ 24,315,133 $ 21,571,293Series D 344,175 49,408
$ 24,659,308 $ 21,620,701
Number of Shares Outstanding (Note 5)Series A 1,370,118 1,284,283Series D 31,509 4,695
Net Assets Attributable to Holders of RedeemableShares per Share
Series A $ 17.75 $ 16.80Series D $ 10.92 $ 10.52
The accompanying notes are an integral part of these financial statements.
Approved on behalf of the Board of the R. N. Croft Financial Group Inc.
Signed: "Chris Croft" Director
22

CFG Custom Portfolio CorporationClass F-3 Balanced GrowthStatement of Comprehensive IncomeFor the years ended July 30
2018 2017
Income
Interest $ 13,161 $ 2,199Dividends 393,313 305,425Foreign withholding taxes (16,457) (14,994)Income trust distribution 159,670 144,132Realized gain on sale of investments 509,235 1,358,227Unrealized appreciation (depreciation) of investments 2,121,609 (60,299)Exchange on foreign currencies 73,888 (56,284)
3,254,419 1,678,406
Expenses
Management fees (Note 7) 60,136 50,700Harmonized sales tax 9,042 7,634Bank charges and interest 40 977General operating expenses 107,473 93,169
176,691 152,480
Increase in net assets attributable to holders of redeemable shares $ 3,077,728 $ 1,525,926
Increase in net assets attributable to holders ofredeemable shares
Series A $ 3,055,974 $ 1,522,750Series D $ 21,754 $ 3,176
$ 3,077,728 $ 1,525,926
Increase in net assets attributable to holders of redeemable shares per share (Note 13)
Series A $ 2.26 $ 1.27Series D $ 0.89 $ 0.65
The accompanying notes are an integral part of these financial statements.
23

CFG Custom Portfolio CorporationClass F-3 Balanced GrowthStatement of Changes in Net Assets Attributable to Holders of Redeemable SharesFor the years ended July 30
Series A Series D Total
2018 2017 2018 2017 2018 2017
Net assets attributable to holders of redeemable shares, beginning of year $ 21,571,293 $ 17,704,222 $ 49,408 $ 40,773 $ 21,620,701 $ 17,744,995
Operations:Increase in net assets attributable to holdersof redeemable shares 3,055,974 1,522,750 21,754 3,176 3,077,728 1,525,926
Redeemable share transactionsProceeds from issuance of shares 2,037,753 3,808,897 428,455 55,590 2,466,208 3,864,487
Reinvested distributions 1,310,033 296,023 8,952 781 1,318,985 296,804
Redemptions (1,982,611) (1,456,380) (155,442) (50,131) (2,138,053) (1,506,511)
1,365,175 2,648,540 281,965 6,240 1,647,140 2,654,780
Distributions to shareholders (Note 6) (1,677,309) (304,219) (8,952) (781) (1,686,261) (305,000)
Net increase in net assets attributable to holders of redeemable shares for the year 2,743,840 3,867,071 294,767 8,635 3,038,607 3,875,706
Net assets attributable to holders of redeemable shares, end of year $ 24,315,133 $ 21,571,293 $ 344,175 $ 49,408 $ 24,659,308 $ 21,620,701
The accompanying notes are an integral part of these financial statements.
24

CFG Custom Portfolio CorporationClass F-3 Balanced GrowthSchedule of Investment PortfolioAs at July 30, 2018Description Quantity $Cost $Fair Value
CANADIAN EQUITY- Long
AG Growth International Inc 13,000 559,221 726,960
AGT Food & Ingredients Inc 32,000 491,161 577,280
BMO Laddered Preferred Share Index ETF 172,000 1,635,720 2,010,680
Boyd Group Income Fund 6,700 691,299 788,322
Brookfield Asset Management Inc Class A 8,600 400,755 466,808
Brookfield Asset Mgmt Float PFD 19,056 199,556 334,433
Canadian Imperial Bank of Commerce/Canada 6,400 724,350 758,912
CCL Industries Inc 12,000 446,861 786,960
Dream Industrial Real Estate Investment Trust 66,500 585,894 682,955
Enbridge Income Fund Holdings Inc 23,400 663,633 758,862
Exchange Income Corp 21,200 717,249 698,328
National Bank of Canada 11,400 503,870 726,978
NFI Group Inc 13,400 729,319 660,754
Rogers Communications Inc 7,500 361,870 493,200
SIR Royalty Income Fund 31,000 441,049 476,160
Superior Plus Corp 59,000 743,400 761,690
Toronto-Dominion Bank 9,300 499,543 714,705
Westjet Airlines Ltd 36,000 727,084 718,200
Total CANADIAN EQUITY-Long 11,121,834 13,142,187
FOREIGN EQUITY- Long
Amazon.Com Inc 525 644,956 1,216,185
Apple Inc 3,100 684,985 766,515
Bank of America Corp 24,200 559,381 986,528
Bright Horizons Family Solutions 5,700 674,360 793,199
Broadcom Inc 3,600 979,705 1,055,510
CVS Caremark Corp 8,800 710,019 772,586
DocuSign Inc 9,200 740,625 619,403
Intercontinental Exchange Inc 10,000 1,007,816 967,256
JPMorgan Chase & Co 5,700 617,753 866,300
NIKE Inc 5,500 476,390 543,950
Tyson Foods Inc 9,700 910,381 741,598
Visa Inc 4,300 539,141 764,097
Total FOREIGN EQUITY-Long 8,545,512 10,093,127
Total Investment Assets 19,667,346 23,235,314
25

CFG Custom Portfolio CorporationClass F-3 Balanced GrowthSchedule of Investment Portfolio (continued)As at July 30, 2018Description Quantity $Cost $Fair Value
DERIVATIVE LIABILITIES-Short
Intercontinental Exchange 08/17/18 Call 72.5 (10,000) (59,886) (44,268)
Total DERIVATIVE LIABILITIES-Short (59,886) (44,268)
Total Investment Portfolio 19,607,460 23,191,046
Other Net Assets 1,468,262
Net Assets Attributable to Holders of Redeemable Shares 24,659,308
The accompanying notes are an integral part of these financial statements.
26

CFG Custom Portfolio CorporationClass F-3 Balanced GrowthStatement of Cash FlowsFor the years ended July 30
2018 2017
Cash flows from operating activitiesIncrease in net assets attributable to holders of redeemableshares $ 3,077,728 $ 1,525,926Adjustments for:
Purchase of investments (24,165,817) (25,688,553)Proceeds on disposition of investments 23,048,388 22,411,540Net realized gain on investments (509,235) (1,358,227)Increase in accrued dividends (11,170) (7,006)Increase in prepaid income taxes (577) (46,843)Increase (decrease) in accrued liabilities 15,070 (14,867)Unrealized (appreciation) depreciation of
investments (2,121,609) 60,299
Net cash used in operating activities (667,222) (3,117,731)
Cash flows from financing activitiesProceeds from issue of shares 2,466,208 3,864,487Redemption of shares (2,138,053) (1,506,511)Increase in redemptions payable 99,227 30,025Cash distributions (367,276) (8,196)
Net cash flows provided by financing activities 60,106 2,379,805
Decrease in cash (607,116) (737,926)
Cash, beginning of year 2,130,988 2,868,914
Cash, end of year $ 1,523,872 $ 2,130,988
Interest received 13,161 2,199Dividends and distributions received, net of withholding taxes 525,357 427,557Interest paid - 869
The accompanying notes are an integral part of these financial statements.
27

CFG Custom Portfolio CorporationClass H-3 Alternative StrategiesStatement of Financial PositionAs at July 30
2018 2017
AssetsCurrent Assets
Cash $ 4,605 $ 4,605Prepaid income taxes 4,133 4,133
Total assets 8,738 8,738
LiabilitiesCurrent Liabilities
Accrued liabilities (Note 7) 2,113 2,113Redemptions payable 9,032 9,032
Total liabilities (excluding net assets attributable to holders of redeemable shares) 11,145 11,145
Net assets attributable to holders of redeemable shares $ (2,407) $ (2,407)
Series Net Assets Attributable to Holders ofRedeemable Shares
Series A $ 60 $ 60Series D (2,467) (2,467)
$ (2,407) $ (2,407)
Number of Shares Outstanding (Note 5)Series A - -Series D - -
Net Asset Attributable to Holders of RedeemableShares per Share
Series A $ - $ -Series D $ - $ -
The accompanying notes are an integral part of these financial statements.
Approved on behalf of the Board of the R. N. Croft Financial Group Inc.
Signed: "Chris Croft" Director
28

CFG Custom Portfolio CorporationClass H-3 Alternative StrategiesStatement of Comprehensive IncomeFor the years ended July 30
2018 2017
Income
Dividends $ - $ 563Foreign withholding taxes - (68)Realized (loss) on sale of investments - (62,505)Unrealized appreciation of investments - 55,952Exchange on foreign currencies - 2,115Income trust distribution - 884
- (3,059)
Expenses
Management fees (Note 7) - 3,502Harmonized sales tax - 591Bank charges and interest - 105General operating expenses - 3,405
- 7,603
Decrease in net assets attributable to holders of redeemable shares $ - $ (10,662)
(Decrease) in net assets attributable to holders ofredeemable shares
Series A $ - $ (2,988)Series D - (7,674)
$ - $ (10,662)
Decrease in net assets attributable to holders ofredeemable shares per share (Note 13)
Series A $ - $ (0.09)Series D $ - $ (0.15)
The accompanying notes are an integral part of these financial statements.
29

CFG Custom Portfolio CorporationClass H-3 Alternative StrategiesStatement of Changes in Net Assets Attributable to Holders of Redeemable SharesFor the years ended July 30
Series A Series D Total
2018 2017 2018 2017 2018 2017
Net assets attributable to holders of redeemable shares, beginning of year $ 60 $ 295,437 $ (2,467) $ 581,481 $ (2,407) $ 876,918
Operations:Increase (decrease) in net assets attributableto holders of redeemable shares - (2,988) - (7,674) - (10,662)
Redeemable share transactionsProceeds from issuance of shares - 31,480 - 13,000 - 44,480
Redemptions - (323,869) - (589,274) - (913,143)
- (292,389) - (576,274) - (868,663)
Net increase (decrease) in net assets attributable to holders of redeemable shares for the year - (295,377) - (583,948) - (879,325)
Net assets attributable to holders of redeemable shares, end of year $ 60 $ 60 $ (2,467) $ (2,467) $ (2,407) $ (2,407)
The accompanying notes are an integral part of these financial statements.
30

CFG Custom Portfolio CorporationClass H-3 Alternative StrategiesStatement of Cash FlowsFor the years ended July 30
2018 2017
Cash flows from operating activitiesDecrease in net assets attributable to holders of redeemableshares $ - $ (10,662)Adjustments for:
Purchase of investments - (459,506)Proceeds on disposition of investments - 699,536Net realized loss on sale of investments - 62,505Increase in prepaid income taxes - (4,133)Decrease in accrued liabilities - (607)Unrealized (appreciation) of investments - (55,952)
Net cash (used in) provided by operating activities - 231,181Cash flows from investing activities
Cash flows from financing activitiesProceeds from issue of shares - 44,480Redemption of shares - (913,143)(Decrease) in redemptions payable - (90,586)
Net cash flows used in financing activities - (959,249)
Decrease in cash - (728,068)
Cash, beginning of year 4,605 732,673
Cash, end of year $ 4,605 $ 4,605
Dividends and distributions received, net of withholding taxes - 495Interest paid - 104
The accompanying notes are an integral part of these financial statements.
31

CFG Custom Portfolio CorporationClass I-3 Option WritingStatement of Financial PositionAs at July 30
2018 2017
AssetsCurrent assets
Investments (Schedule of investment portfolio) $ 45,769,080 $ 22,067,609Cash 4,895,467 2,312,821Accrued dividends 121,425 94,565Subscriptions receivable 139,252 238,892Prepaid income taxes 29,961 28,847
Total assets 50,955,185 24,742,734
LiabilitiesCurrent liabilities
Accrued liabilities (Note 7) 54,943 8,651Redemptions payable - 7,765Derivative liabilities (Schedule of investment portfolio) 883,178 538,906Tax withheld on distribution 6,136 2,364
Total liabilities (excluding net assets attributable to holders of redeemable shares) 944,257 557,686
Net assets attributable to holders of redeemable shares $ 50,010,928 $ 24,185,048
Number of Shares Outstanding (Note 5) 4,294,410 2,089,083
Net Assets Attributable to Holders of Redeemable Shares per Share $ 11.65 $ 11.58
The accompanying notes are an integral part of these financial statements.
Approved on behalf of the Board of the R. N. Croft Financial Group Inc.
Signed: "Chris Croft" Director
32

CFG Custom Portfolio CorporationClass I-3 Option WritingStatement of Comprehensive IncomeFor the years ended July 30
2018 2017
Income
Interest $ 24,541 $ 5,122Dividends 711,378 481,564Foreign withholding taxes (1,993) (742)Income trust distribution 444,018 138,947Realized gain on sale of investments 3,638,132 1,415,149Unrealized depreciation of investments (1,617,359) 144,071Exchange on foreign currencies 217,437 (6,444)
3,416,154 2,177,667
Expenses
Management fees (Note 7) 93,591 41,764Harmonized sales tax 32,657 14,989Bank charges and interest 11,470 280General operating expenses 168,464 75,174Portfolio transaction costs - 132
306,182 132,339
Increase in net assets attributable to holders of redeemable shares $ 3,109,972 $ 2,045,328
Increase in net assets attributable to holders ofredeemable shares per share (Note 13) $ 0.96 $ 1.36
The accompanying notes are an integral part of these financial statements.
33

CFG Custom Portfolio CorporationClass I-3 Option WritingStatement of Changes in Net Assets Atrributable to Holders of Redeemable SharesFor the years ended July 30
Series A Total
2018 2017 2018 2017
Net assets attributable to holders of redeemable shares, beginning of year $ 24,185,048 $ 9,827,984 $ 24,185,048 $ 9,827,984
Operations:Increase in net assets attributable to holders of redeemable shares 3,109,972 2,045,328 3,109,972 2,045,328
Redeemable share transactionsProceeds from issuance of shares 30,421,696 16,609,913 30,421,696 16,609,913
Reinvested distributions 622,973 22,534 622,973 22,534
Redemptions (5,454,317) (3,307,434) (5,454,317) (3,307,434)
25,590,352 13,325,013 25,590,352 13,325,013
Distributions to shareholders (Note 6) (2,874,444) (1,013,277) (2,874,444) (1,013,277)
Net increase in net assets attributable to holders of redeemable shares for the year 25,825,880 14,357,064 25,825,880 14,357,064
Net assets attributable to holders of redeemable shares, end of year $ 50,010,928 $ 24,185,048 $ 50,010,928 $ 24,185,048
The accompanying notes are an integral part of these financial statements.
34
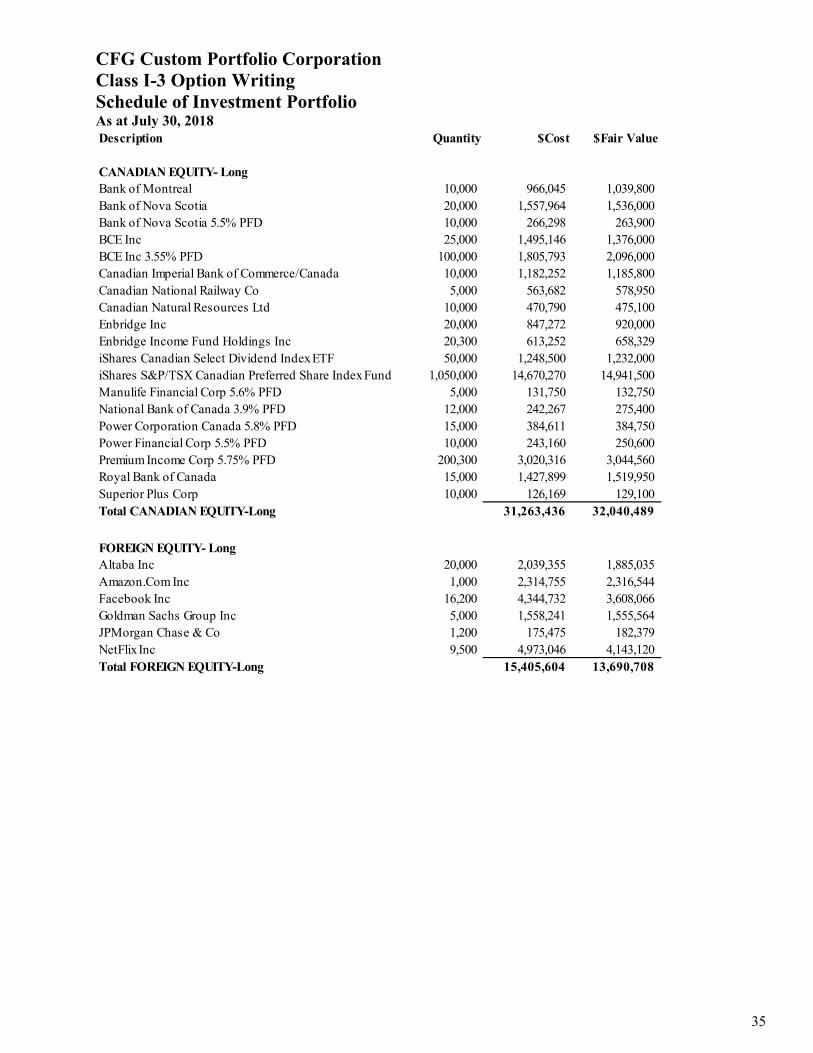
CFG Custom Portfolio CorporationClass I-3 Option WritingSchedule of Investment PortfolioAs at July 30, 2018Description Quantity $Cost $Fair Value
CANADIAN EQUITY- Long
Bank of Montreal 10,000 966,045 1,039,800
Bank of Nova Scotia 20,000 1,557,964 1,536,000
Bank of Nova Scotia 5.5% PFD 10,000 266,298 263,900
BCE Inc 25,000 1,495,146 1,376,000
BCE Inc 3.55% PFD 100,000 1,805,793 2,096,000
Canadian Imperial Bank of Commerce/Canada 10,000 1,182,252 1,185,800
Canadian National Railway Co 5,000 563,682 578,950
Canadian Natural Resources Ltd 10,000 470,790 475,100
Enbridge Inc 20,000 847,272 920,000
Enbridge Income Fund Holdings Inc 20,300 613,252 658,329
iShares Canadian Select Dividend Index ETF 50,000 1,248,500 1,232,000
iShares S&P/TSX Canadian Preferred Share Index Fund 1,050,000 14,670,270 14,941,500
Manulife Financial Corp 5.6% PFD 5,000 131,750 132,750
National Bank of Canada 3.9% PFD 12,000 242,267 275,400
Power Corporation Canada 5.8% PFD 15,000 384,611 384,750
Power Financial Corp 5.5% PFD 10,000 243,160 250,600
Premium Income Corp 5.75% PFD 200,300 3,020,316 3,044,560
Royal Bank of Canada 15,000 1,427,899 1,519,950
Superior Plus Corp 10,000 126,169 129,100
Total CANADIAN EQUITY-Long 31,263,436 32,040,489
FOREIGN EQUITY- Long
Altaba Inc 20,000 2,039,355 1,885,035
Amazon.Com Inc 1,000 2,314,755 2,316,544
Facebook Inc 16,200 4,344,732 3,608,066
Goldman Sachs Group Inc 5,000 1,558,241 1,555,564
JPMorgan Chase & Co 1,200 175,475 182,379
NetFlix Inc 9,500 4,973,046 4,143,120
Total FOREIGN EQUITY-Long 15,405,604 13,690,708
35

CFG Custom Portfolio CorporationClass I-3 Option WritingSchedule of Investment Portfolio (continued)As at July 30, 2018Description Quantity $Cost $Fair Value
DERIVATIVE ASSETS- Long
Advanced Micro Devices Inc 8/17/2018 Put 12 30,000 5,987 781
Bank of America 08/10/18 Call 31 20,000 11,051 16,667
BCE Inc 8/17/2018 Put 50 10,000 2,000 450
Square Inc 08/17/18 Call 70 5,000 19,479 12,564
Square Inc 8/17/2018 Put 55 10,000 11,442 7,421
Total DERIVATIVE ASSETS- Long 49,959 37,883
Total Investment Assets 46,718,999 45,769,080
DERIVATIVE LIABILITIES-Short
Altaba Inc 08/17/18 Call 75 (20,000) (58,141) (33,852)
Amazon Inc. 08/03/18 Call 1820 (1,000) (21,938) (8,463)
Apple Inc 08/17/18 Put 190 (10,000) (57,213) (67,834)
Bank of America 08/10/18 Put 31 (20,000) (16,576) (7,812)
BCE Inc 11/16/2018 Call 54 (20,000) (26,180) (33,400)
BCE Inc 11/16/2018 Call 56 (5,000) (2,750) (3,075)
BCE Inc 8/17/2018 Put 56 (10,000) (13,100) (10,600)
Bank of Montreal 10/19/18 Call 105 (5,000) (8,350) (6,400)
Bank of Nova Scotia/The 10/19/2018 Call 76 (10,000) (19,200) (20,350)
Bank of Nova Scotia/The 12/21/2018 Call 76 (10,000) (52,200) (26,750)
Canadian National Railway Company 08/03/18 Call 112.5 (5,000) (8,750) (17,250)
Canadian Natural Resources 08/24/18 Call 47.5 (10,000) (11,900) (10,800)
Canadian Pacific Railway Limited 08/17/18 Put 250 (5,000) (16,750) (8,000)
Enbridge Inc 10/19/18 Call 46 (20,000) (36,600) (25,000)
Enbridge Income Fund 10/19/18 Call 32 (10,000) (8,000) (8,500)
Enbridge Income Fund Holdings 10/19/2018 Call 29 (2,300) (1,553) (7,935)
Enbridge Income Fund Holdings 10/19/2018 Call 30 (8,000) (4,000) (20,400)
Facebook Inc 08/17/18 Call 175 (15,000) (93,885) (60,543)
Facebook Inc 08/17/18 Put 215 (3,800) (35,606) (217,694)
Goldman Sachs 08/03/18 Call 232.5 (5,000) (14,537) (44,138)
H&E Equipment Services Inc 8/17/2018 Put 40 (10,000) (38,658) (55,335)
iShares Canadian Select Divide 8/17/2018 Call 25 (5,000) (750) (275)
36

CFG Custom Portfolio CorporationClass I-3 Option WritingSchedule of Investment Portfolio (continued)As at July 30, 2018
Description Quantity $Cost $Fair Value
DERIVATIVE LIABILITIES-Short (continued)
JP Morgan Chase & Co. 08/10/18 Call 115 (1,200) (1,421) (4,187)
JP Morgan Chase & Co. 08/10/18 Put 115 (18,800) (74,199) (21,296)
Netflix Inc. 08/03/18 Call 340 (2,000) (20,441) (10,234)
Netflix Inc. 08/03/18 Call 350 (6,500) (28,157) (11,002)
Netflix Inc. 08/03/18 Call 370 (1,000) (10,712) (143)
Royal Bank of Canada 8/17/2018 Call 103 (15,000) (7,800) (2,700)
Superior Plus Corp 10/19/18 Call 13 (10,000) (2,500) (2,500)
Square Inc 08/03/18 Put 70 (10,000) (39,164) (72,261)
Square Inc 8/17/2018 Put 65 (15,000) (119,981) (64,449)
Total DERIVATIVE LIABILITIES-Short (851,012) (883,178)
Total Investment Portfolio 45,867,987 44,885,902
Other Net Assets 5,125,026
Net Assets Attributable to Holders of Redeemable Shares 50,010,928
The accompanying notes are an integral part of these financial statements.
37

CFG Custom Portfolio CorporationClass I-3 Option WritingStatement of Cash FlowsFor the years ended July 30
2018 2017
Cash flows from operating activitiesIncrease in net assets attributable to holders of redeemableshares $ 3,109,972 $ 2,045,328Adjustments for:
Purchase of investments (181,487,487) (36,896,904)Proceeds on disposition of investments 160,151,060 26,195,893Net realized gain on investments (3,638,132) (1,415,149)Increase in accrued dividends (26,860) (62,627)(Increase) in prepaid income taxes (1,115) (28,847)Increase (decrease) in accrued liabilities 46,294 (2,917)Increase in tax withheld on distribution 3,772 2,364Unrealized depreciation (appreciation) in value of
investments 1,617,359 (144,071)
Net cash used in operating activities (20,225,137) (10,306,930)
Cash flows from financing activitiesProceeds from issue of shares 30,421,696 16,609,913Decrease (increase) in subscriptions receivable 99,640 (177,892)Redemption of shares (5,454,317) (3,307,434)(Decrease) in redemptions payable (7,765) (21,978)Cash distributions (2,251,471) (990,743)
Net cash flows provided by financing activities 22,807,783 12,111,866
Increase in cash 2,582,646 1,804,936
Cash, beginning of year 2,312,821 507,885
Cash, end of year $ 4,895,467 $ 2,312,821
Interest received 24,541 5,122Dividends and distributions received, net of withholding taxes 1,126,544 557,141Interest paid 11,154 -
The accompanying notes are an integral part of these financial statements.
38

CFG Custom Portfolio CorporationClass J-3 Enhanced Global IncomeStatement of Financial PositionAs at July 30
2018 2017
AssetsCurrent assets
Investments (Schedule of investment portfolio) $ 5,648,137 $ -Cash 1,131,983 -Accrued dividends 10,689 -Prepaid income taxes 143 -
Total assets 6,790,952 -
LiabilitiesCurrent liabilities
Accrued liabilities (Note 7) 6,301 -Distributions payable 580 -Derivative liabilities (Schedule of investment portfolio) 326,874 -
Total liabilities (excluding net assets attributable to holders of redeemable shares) 333,755 -
Net assets attributable to holders of redeemable shares $ 6,457,197 $ -
Number of Shares Outstanding (Note 5) 631,586 -
Net Assets Attributable to Holders of Redeemable Shares per Share $ 10.22 $ -
The accompanying notes are an integral part of these financial statements.
Approved on behalf of the Board of the R. N. Croft Financial Group Inc.
Signed: "Chris Croft" Director
39

CFG Custom Portfolio CorporationClass J-3 Enhanced Global IncomeStatement of Comprehensive IncomeFor the years ended July 30
2018 2017
Income
Interest $ 4,948 $ -Dividends 101,752 -Income trust distribution 29,558 -Realized gain on sale of investments 348,607 -Unrealized depreciation of investments (143,326) -Exchange on foreign currencies (25,613) -
315,926 -
Expenses
Management fees (Note 7) 11,331 -Harmonized sales tax 1,929 -Bank charges and interest 27,512 -General operating expenses 20,394 -Investment Transaction Costs 3 -
61,169 -
Increase in net assets attributable to holders of redeemable shares $ 254,757 $ -
Increase in net assets attributable to holders ofredeemable shares per share (Note 13) $ 0.55 $ -
The accompanying notes are an integral part of these financial statements.
40

CFG Custom Portfolio CorporationClass J-3 Enhanced Global IncomeStatement of Changes in Net Assets Atrributable to Holders of Redeemable SharesFor the years ended July 30
Total
2018 2017 2018 2017
Operations:Increase in net assets attributable to holders of redeemable shares $ 254,757 $ - - - - - $ 254,757 $ -
Redeemable share transactionsProceeds from issuance of shares 6,654,199 - - - - - 6,654,199 -
Redemptions (309,221) - - - - - (309,221) -
6,344,978 - - - - - 6,344,978 -
Distributions to shareholders (Note 6) (142,538) - - - - - (142,538) -
Net increase in net assets attributable to holders of redeemable shares for the year 6,457,197 - - - - - 6,457,197 -
Net assets attributable to holders of redeemable shares, end of year $ 6,457,197 $ - - - - - $ 6,457,197 $ -
The accompanying notes are an integral part of these financial statements.
41

CFG Custom Portfolio CorporationClass J-3 Enhanced Global IncomeStatement of Investment PortfolioAs at July 30, 2018Description Quantity $Cost $Fair Value
CANADIAN EQUITY- Long
Alimentation Couche Tard Inc 3,900 223,456 232,674
Crescent Point Energy Corp 30,000 312,513 265,200
Emera Inc 7,000 311,591 296,100
EnerCare Inc 12,600 241,359 237,132
Manulife Financial Corp 5,700 149,967 136,116
PowerShares 1-3 Year Laddered FR ETF 22,000 438,680 437,580
PowerShares 1-5 Year Laddered Corp Bond Index ETF 37,500 684,728 669,000
PowerShares Canadian Preferred Share Index ETF 32,800 549,400 544,480
PowerShares S&P Global EX Canada 11,100 225,510 226,884
PowerShares Senior Loan Index 26,500 481,770 498,068
Total CANADIAN EQUITY-Long 3,618,974 3,543,234
FOREIGN EQUITY- Long
Expedia Group Inc 1,500 225,935 263,284
General Electric Co 6,000 140,279 102,806
Hanesbrands Inc 8,000 213,682 228,631
iShares Silver Trust 1,900 37,891 36,068
MGM Resorts International 3,500 148,815 140,219
Newell Brands Inc 5,800 212,159 197,927
ProShares Short VIX Short-Term Futures ETF 5,400 94,606 95,267
SPDR S&P MidCap 400 ETF Trust 400 189,364 186,321
UnitedHealth Group Inc 500 149,057 165,250
Verizon Communications Inc 2,400 144,264 164,021
Total FOREIGN EQUITY-Long 1,556,052 1,579,794
DERIVATIVE ASSETS- Long
Bank of America Corp 1/18/2019 Call 32 15,000 62,129 30,857
Electronic Arts Inc 1/18/2019 Call 135 600 9,735 5,468
Genworth MI Canada Inc 1/18/2019 Put 40 8,000 36,615 17,800
Home Capital Group Inc 12/21/2018 Put 15 16,000 36,045 19,120
Invesco QQQ Trust Series 1 10/19/18 Call 180 7,500 55,847 34,178
Invesco QQQ Trust Series 1 10/19/18 Put 180 7,500 57,919 78,901
42

CFG Custom Portfolio CorporationClass J-3 Enhanced Global IncomeStatement of Investment Portfolio (continued)As at July 30, 2018
Description Quantity $Cost $Fair Value
DERIVATIVE ASSETS- Long (continued)
Johnson & Johnson 01/17/20 Call 95 1,500 59,547 75,190
Netflix Inc 1/18/2019 Call 350 300 12,955 11,156
Procter & Gamble Co/The 1/17/2020 Call 70 1,800 26,399 29,119
SPDR Dow Jones Industrial Average 09/21/18 Put 245 10,000 95,791 29,555
SPDR S&P 500 ETF TRUST 01/18/19 Call 274 5,000 77,687 92,116
SPDR S&P 500 ETF Trust 01/18/19 Put 274 5,000 76,241 51,104
Starbucks Corp 01/17/20 Call 47 4,000 34,440 45,049
UnitedHealth Group Inc 1/18/2019 Put 210 1,000 9,646 3,066
Verizon Communications Inc 1/18/2019 Put 42 4,000 6,797 1,407
Wynn Resorts Ltd 1/18/2019 Call 210 500 11,371 1,023
Total DERIVATIVE ASSETS- Long 669,164 525,109
Total Investment Assets 5,844,190 5,648,137
DERIVATIVE LIABILITIES-Short
Alimentation Couche Tard Inc. 08/17/18 Call 60 (3,900) (1,209) (3,081)
Crescent Point Energy Corp 09/21/18 Call 10 (30,000) (12,600) (5,100)
CVS Health Corp 08/17/18 Put 65 (400) (874) (479)
Expedia Group In 09/21/18 Put 125 (1,000) (7,373) (1,706)
Expedia Group Inc 10/19/18 Call 135 (1,500) (7,110) (10,839)
Genworth MI Canada Inc 1/18/2019 Put 32 (8,000) (13,600) (6,000)
Hanesbrands Inc 1/18/2019 Call 20 (8,000) (5,212) (30,988)
Home Capital Group Inc 12/21/2018 Put 11 (16,000) (8,845) (4,480)
Johnson & Johnson 01/17/20 Put 150 (1,500) (56,983) (42,282)
McDonald's Corp. 01/18/19 Put 150 (1,500) (8,846) (7,812)
MGM Resorts International 1/18/2019 Put 38 (3,000) (23,954) (29,393)
Netflix 01/18/19 Put 360 (300) (11,337) (17,889)
Newell Brands Inc 9/21/2018 Call 29 (5,800) (10,374) (3,021)
Newell Rubbermaid Inc 09/21/18 Put 27 (3,000) (4,766) (7,304)
PayPal Holdings Inc 01/18/19 Put 90 (2,000) (14,677) (27,342)
Procter & Gamble Co/The 1/17/2020 Put 95 (1,200) (28,847) (25,037)
Qualcomm Inc 01/18/19 Put 55 (3,000) (12,581) (7,031)
Seagate Technology 09/21/18 Put 55 (4,000) (16,931) (20,520)
SPDR Dow Jones Industrial Average 09/21/18 Put 233 (10,000) (45,926) (12,890)
43

CFG Custom Portfolio CorporationClass J-3 Enhanced Global IncomeStatement of Investment Portfolio (continued)As at July 30, 2018Description Quantity $Cost $Fair Value
DERIVATIVE LIABILITIES-Short (continued)
Starbucks Corp 01/17/20 Put 60 (2,000) (33,125) (26,626)
Under Armour CL A 01/18/19 Put 20 (8,000) (21,597) (22,603)
UnitedHealth Group Inc 1/18/2019 Put 260 (500) (20,186) (10,155)
Verizon Communications Inc 1/18/2019 Put 50 (2,000) (12,648) (4,296)
Total DERIVATIVE LIABILITIES-Short (379,601) (326,874)
Total Investment Portfolio 5,464,589 5,321,259
Other Net Assets 1,135,938
Net Assets Attributable to Holders of Redeemable Shares 6,457,197
The accompanying notes are an integral part of these financial statements.
44

CFG Custom Portfolio CorporationClass J-3 Enhanced Global IncomeStatement of Cash FlowsFor the years ended July 30
2018 2017
Cash flows from operating activitiesIncrease in net assets attributable to holders ofredeemable shares $ 254,757 $ -Adjustments for:
Purchase of investments (13,966,367) -Proceeds on disposition of investments 8,850,385 -Net realized (gain) on investments (348,607) -(Increase) in accrued dividends (10,689) -Increase in prepaid income taxes (143) -Increase in accrued liabilities 6,301 -Increase in distribution payable 580 -Unrealized depreciation in value of investments 143,326 -
Net cash used in operating activities (5,070,457) -
Cash flows from financing activitiesProceeds from issue of shares 6,654,199 -Redemption of shares (309,221) -Cash distributions (142,538) -
Net cash flows provided by financing activities 6,202,440 -
Increase in cash 1,131,983 -
Cash, end of year $ 1,131,983 $ -
Interest received 4,948 -Dividends and distributions received, net of withholding taxes 120,621 -Interest paid 27,454 -
The accompanying notes are an integral part of these financial statements.
45

CFG Custom Portfolio CorporationNotes To Financial StatementsAs at July 30, 2018 and 2017
1. THE CORPORATION
The CFG Custom Portfolio Corporation (the "Corporation") is an open-ended mutual fundcorporation, incorporated on August 18, 2006 under the laws of Canada, which commencedoperations on October 19, 2006. Each class of shares of the Corporation represents a separatesegregated investment fund with its own investment objective. An investment in a class isrepresented by shares of that class. R.N. Croft Financial Group Inc. is the manager (the"Manager") of the Corporation.
The investment objective of each class of shares is as follows:
Class A-3 - The investment objective of the CFG Custom Portfolio Corporation, Equity ShareClass (the “Class”) is to generate reliable capital growth by investing in an equityportfolio that is well-diversified across the major sectors of the Canadian and, asappropriate, U.S. and international financial markets. The achieve the statedobjectives, the Investment Committee (IRC) may invest the Class in large-to-mid-capitalization common shares and equities with both low systematic risk and higherexpected returns through capital appreciation, dividend income, or a combination ofboth. The IRC may also invest the Class in exchange traded funds, convertiblesecurities and/or various option strategies to gain exposure across geographic regionsand sectors. To optimize the Class portfolio for current market conditions, the IRCmay change sector and geographic regions and sectors. To optimize the Classportfolio for current market conditions, the IRC may change sector and geographicallocations, as well as tactical approach and investment style. Tactically, the IRCmay sell covered call options on securities held directly in the Class portfolio or thatcan be acquired through various derivative strategies, buy puts to hedge againstdownside market movements, write cash-secured puts to acquire shares, or buy callsas a stock replacement strategy. The Class may also utilize leverage to a maximum of20% in aggregate (at the time of incurring leverage) of the portfolio’s asset value.
Class D-3 - The investment objective of the CFG Custom Portfolio Corporation, Income ShareClass (the “Class”) is to generate a stable stream of income and maintain moderate,reliable capital growth by investing in a portfolio that is well-diversified across themajor sectors and asset classes of the Canadian and, as appropriate, U.S. andinternational markets. To achieve the stated objectives, the Investment Committee(IRC) may invest the Class in cash equivalents, bonds, convertible debentures,preferred shares, income trusts, real estate investment trusts, dividend payingcommon shares, income producing exchange traded funds and stable equities withlow systematic risk. To optimize the Class portfolio for current market conditions,the IRC may change asset, sector and geographic allocations, as well as tacticalapproach and investment style. Tactically, the IRC may sell covered call options onsecurities held directly in the Class portfolio or that can be acquired through variousderivative strategies, buy puts to hedge against downside market movements, writecash-secured puts to acquire shares, or buy calls as a stock replacement strategy. TheClass may also utilize leverage to a maximum of 20% in aggregate (at the time ofincurring leverage) of the portfolio’s asset value.
Class E-3 - The investment objective of the CFG Custom Portfolio Corporation, Morris BalancedIncome Class (the “Class”) is to strike a balance between safety of principal,enhanced income strategies and capital appreciation. The Class will hold cash,investment grades, preferred shares, blue chip stocks that typically pay out aboveaverage dividends, real estate investment trusts (REITs), income trusts and exchange
46

CFG Custom Portfolio CorporationNotes To Financial StatementsAs at July 30, 2018 and 2017
1. THE CORPORATION - continued
traded funds across all geographic regions and sectors. The Investment Committeemay utilize speculative strategies where the maximum exposure does not exceed 5%of the asset value of the portfolio and can extend the use of leverage to a maximumof 20% in aggregate (at the time of incurring leverage) of the Class’s asset value.The Class may write covered call options to generate tax advantaged income, buyputs to hedge against adverse market movements, write cash secured puts to acquireshares, or buy calls as a stock replacement strategy. This Class is actively managedand intends to meet its objectives by investing in the following securities: investmentgrade government and corporate bonds; mortgage backed securities; preferredshares; individual equities diversified by sector, geographic region and style;exchange traded index funds (equity and income); and real estate investment trusts(REITs). The Class will utilize various option strategies designed to reduce risk andgenerate income. Speculative strategies include leveraged exchange traded funds,small cap stocks (market capitalization less than $1 billion) and micro-cap stocks(market capitalization less than $100 million).
Class F-3 - The objective of the CFG Custom Portfolio Corporation, Morris Balanced GrowthClass (the “Class”) is to seek out long term capital appreciation complimented withenhanced income strategies. The Class may hold cash, investment grade bonds,preferred shares, blue chip and/or small capitalization stocks, real estate investmenttrusts (REITs), income trusts and exchange traded funds. The Class may engage inspeculative strategies where the maximum exposure does not exceed 10% of theClass’s asset value at the time the speculative positions were purchased. The Classmay write covered call options in respect of all or part of the securities in itsportfolio and may from time to time, buy puts to hedge against downside marketmovements, write puts to acquire shares and/or buy calls as stock replacementstrategy. The Class may utilize leverage to a maximum of 20% in aggregate (at thetime of incurring leverage) of the Class’s asset value. The Class intends to achieveits investment objective by investing in a diversified portfolio that may include cash,fixed income assets, preferred shares, income trusts, individual equities, exchangetraded funds (equity, income, sector and specialty). The Class will seek opportunitiesacross all asset classes, geographic regions and sectors. The Class may use variousoption strategies to enhance income, hedge against adverse market movements and toleverage upside capital appreciation. Speculative strategies may include investmentsin aggressive small cap exchange traded funds, small capitalization stocks (marketcap less than $1 billion) and micro-cap stocks (market cap less than $100 million).
Class H-3 - The objective of the CFG Custom Portfolio Corporation, Alternative Strategies Class(the "Class") is to generate returns that generally have a low correlation withtraditional asset classes and market trends. The Class intends to hold long and/orshort positions in Canadian, U.S. and other foreign securities and from time to timeutilize volatility based strategies during periods of heightened risk. The targetedoverall allocation at any given time is approximately two-thirds exposure tolong/short positions that are sector-hedged to remove the majority of systematic risk,and one-third exposure to pure tactical and market opportunities.
Class I-3 - The investment objective of the CFG Custom Portfolio Corporation, Option WritingClass (the “Class”) is to generate above average cash flow by investing in a portfolioof common and/or convertible securities combined with the sale of options. The
47

CFG Custom Portfolio CorporationNotes To Financial StatementsAs at July 30, 2018 and 2017
1. THE CORPORATION - continued
Class expects to receive both dividend and/or distribution income from theunderlying securities as well as premium from the sale of call and/or put options. Toachieve the stated objectives, the Class may be invested in large-to-mid-capitalization common shares, dividend-paying equities and other Canadian and, asappropriate, U.S. and international securities such as EFTs with both lowersystematic risk and higher expected returns through capital appreciation, dividendincome, or a combination of both. To optimize the Class portfolio for current marketconditions, the portfolio manager may change sector and geographic allocations, aswell as tactical approach and investment style. Tactically, the portfolio manager willtypically sell covered call options on securities held directly in the Class portfolio orthat can be acquired through various derivative strategies, but may also buy puts tohedge against downside market movements, write cash-secured puts to acquireshares, or buy calls as a stock replacement strategy. The Class may also utilizeleverage to a maximum of 20% in aggregate (at the time of incurring leverage) of theportfolio’s asset value.
Class J-3 - The objective of the CFG Custom Portfolio Corporation, Enhanced Global IncomeClass (the “Class”) is to achieve better risk-adjusted returns than a passive, low-cost,diversified portfolio benchmark (The Real World Growth Index). The Class aims toachieve this objective by holding in client accounts three Share Classes in targetproportions of 25% Class D-3, Income Share Class, 65% Class A-3, Equity ShareClass and 10% Class I-3, Option Writing Share Class. Croft Financial Group willrebalance back to this target at least annually. In addition, rebalancing takes placewithin each share class on a more frequent basis to manage market risk, takeadvantage of market opportunity, and manage cash positions.
The address of the Corporation's registered office is 218 Steeles Avenue East, Thornhill, OntarioL3T 1A6.
2. BASIS OF PRESENTATION
These financial statements have been prepared in compliance with International FinancialReporting Standards ("IFRS") as published by the International Accounting Standards Board("IASB") and interpretations of the IFRS Interpretations Committee (“IFRIC”).
The currency of presentation for these financial statements is the Canadian dollar.
The financial statements were approved by R.N. Croft Financial Group Inc. (the "Manager") andauthorized for issue on October 29, 2018.
48
CFG Custom Portfolio CorporationNotes To Financial StatementsAs at July 30, 2018 and 2017
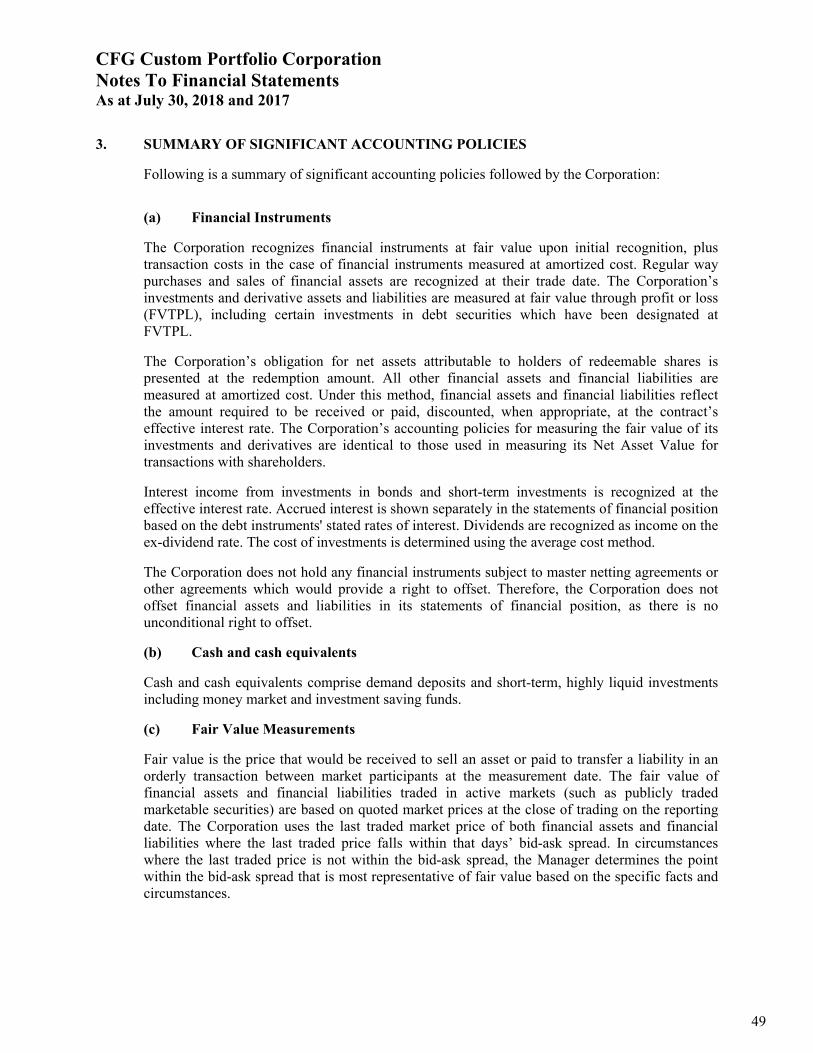
3. SUMMARY OF SIGNIFICANT ACCOUNTING POLICIES
Following is a summary of significant accounting policies followed by the Corporation:
(a) Financial Instruments
The Corporation recognizes financial instruments at fair value upon initial recognition, plustransaction costs in the case of financial instruments measured at amortized cost. Regular waypurchases and sales of financial assets are recognized at their trade date. The Corporation’sinvestments and derivative assets and liabilities are measured at fair value through profit or loss(FVTPL), including certain investments in debt securities which have been designated atFVTPL.
The Corporation’s obligation for net assets attributable to holders of redeemable shares ispresented at the redemption amount. All other financial assets and financial liabilities aremeasured at amortized cost. Under this method, financial assets and financial liabilities reflectthe amount required to be received or paid, discounted, when appropriate, at the contract’seffective interest rate. The Corporation’s accounting policies for measuring the fair value of itsinvestments and derivatives are identical to those used in measuring its Net Asset Value fortransactions with shareholders.
Interest income from investments in bonds and short-term investments is recognized at theeffective interest rate. Accrued interest is shown separately in the statements of financial positionbased on the debt instruments' stated rates of interest. Dividends are recognized as income on theex-dividend rate. The cost of investments is determined using the average cost method.
The Corporation does not hold any financial instruments subject to master netting agreements orother agreements which would provide a right to offset. Therefore, the Corporation does notoffset financial assets and liabilities in its statements of financial position, as there is nounconditional right to offset.
(b) Cash and cash equivalents
Cash and cash equivalents comprise demand deposits and short-term, highly liquid investmentsincluding money market and investment saving funds.
(c) Fair Value Measurements
Fair value is the price that would be received to sell an asset or paid to transfer a liability in anorderly transaction between market participants at the measurement date. The fair value offinancial assets and financial liabilities traded in active markets (such as publicly tradedmarketable securities) are based on quoted market prices at the close of trading on the reportingdate. The Corporation uses the last traded market price of both financial assets and financialliabilities where the last traded price falls within that days’ bid-ask spread. In circumstanceswhere the last traded price is not within the bid-ask spread, the Manager determines the pointwithin the bid-ask spread that is most representative of fair value based on the specific facts andcircumstances.
49

CFG Custom Portfolio CorporationNotes To Financial StatementsAs at July 30, 2018 and 2017
3. SUMMARY OF SIGNIFICANT ACCOUNTING POLICIES - continued
The fair values established for the Corporation’s investments are classified into three levels thatreflect the significance and observability of the inputs to the valuation techniques used in makingthe fair value measurements. When securities are valued using unadjusted quoted market pricesfor identical assets, they are classified as Level 1. The fair values determined using valuationmodels or techniques that require the use of inputs and assumptions based on observable marketdata including volatility and other applicable rates or prices are classified as Level 2. In thelimited circumstances that fair values are determined using valuation techniques that are notsupported by observable market data, they are classified as Level 3. Changes in valuationmethods may result in transfers into or out of an investment’s assigned level. The Corporation’spolicy is to recognize transfers into and out of the fair value hierarchy levels as of the date of theevent or change in circumstances giving rise to the transfer Except for an investment in a limitedpartnership which is classified as Level 3, all of the Corporation's investments are classified asLevel 1.
(d) Designation of Financial Assets and Liabilities
For the purpose of measuring and recognizing financial assets and liabilities shown on theStatements of Financial Position, each financial asset and financial liability is designated asfollows. All investments, including derivatives, are initially recorded at fair value and aredesignated as FVTPL. Cash, accrued income and subscriptions receivable are designated as loansand receivables and reported at amortized cost. Similarly, redemptions payable and accruedliabilities are designated as other financial liabilities and recorded at amortized cost.
(e) Impairment of Financial Assets
At each reporting date, the Corporation assesses whether there is objective evidence that afinancial asset at amortized cost is impaired. If such evidence exists, the Corporation recognizesan impairment loss as the difference between the amortized cost of the financial asset and thepresent value of the estimated future cash flows, discounted using the instrument’s originaleffective interest rate. Impairment losses on financial asset at amortized cost are reversed insubsequent periods if the amount of the loss decreases and the decrease can be relatedobjectively to an event occurring after the impairment was recognized.
(f) Valuation of Share Classes
A different net asset value is calculated for each class of shares. Investments and cash areallocated to the specific class of shares to which they relate. Other assets and liabilities areallocated to the class of shares they relate to as applicable, or to all classes of shares on a pro-ratabasis. The net asset value for each class of shares is calculated by subtracting the liabilitiesspecifically related to that class from the specific assets of that class, and adjusting this amountfor the proportionate share of the assets and liabilities that are not specifically related to anyclass. Revenues and expenses directly attributed to a class of share are charged directly to thatshare class. Other expenses are allocated proportionately to each class based upon the relativenet assets of each class.
50

CFG Custom Portfolio CorporationNotes To Financial StatementsAs at July 30, 2018 and 2017
3. SUMMARY OF SIGNIFICANT ACCOUNTING POLICIES - continued
(g) Investment Transactions and Income
Investment transactions are accounted for as of the trade date. Interest income is accrued daily atthe effective interest rate. Interest receivable is shown separately in the statement of financialposition based on the debt instruments’ stated rates of interest. Dividend income is recognized asincome on the ex dividend date. The cost of investments is determined using the average costmethod.
(h) Transaction Costs
Transaction costs, such as brokerage commissions, incurred on the purchase and sales of asecurity are charged as an expense for the period and shown as transaction costs on theStatements of Comprehensive Income.
(i) Translation of Foreign Currencies
Portfolio securities and other assets and liabilities denominated in foreign currencies aretranslated into Canadian dollars at the exchange rates prevailing on each valuation day.Purchases and sales of investments, income and expenses are translated into Canadian dollars atthe exchange rates prevailing on the respective dates of such transactions. Realized andunrealized foreign exchange gains (losses) on investments, assets and liabilities, are included in"realized gain (loss) on sale of investments" and "unrealized exchange on foreign currencies andother net assets", respectively and recorded in the Statements of Comprehensive Income.
(j) Critical Accounting Estimates and Judgments
The preparation of financial statements in accordance with IFRS requires management to usejudgment in applying its accounting policies and to make estimates and assumptions about thefuture. Actual results may differ from these estimates. Estimates and underlying assumptionsare reviewed on an ongoing basis. Revisions to estimates are recognized prospectively. Themost significant accounting judgment and estimate that the Corporation has made in preparingthe financial statements is determining the fair value measurement of investments not quoted inan active market, if any.
(k) Increase (Decrease) in Net Assets Attributable to Holders of Redeemable Sharesper Share
The increase (decrease) in net assets attributable to holders of redeemable shares per share in theStatements of Comprehensive Income represents the increase (decrease) in net assets attributableto holders of redeemable shares divided by the weighted average number of shares of thatrespective class outstanding during the year.
(l) Future Accounting Changes
The following new standards and amendments to existing standards were issued by theInternational Accounting Standards Board (“IASB”):
IFRS 9 - Financial Instruments - uses a single approach to determine whether a financial asset ismeasured at amortized cost or fair value, and replaces the multiple rules in IAS 39. The approachin IFRS 9 focuses on how an entity manages its financial instruments in the context of itsbusiness model, as well as the contractual cash and cash equivalents flow characteristics of thefinancial assets. The new standard also requires a single impairment method to be used, replacing
51
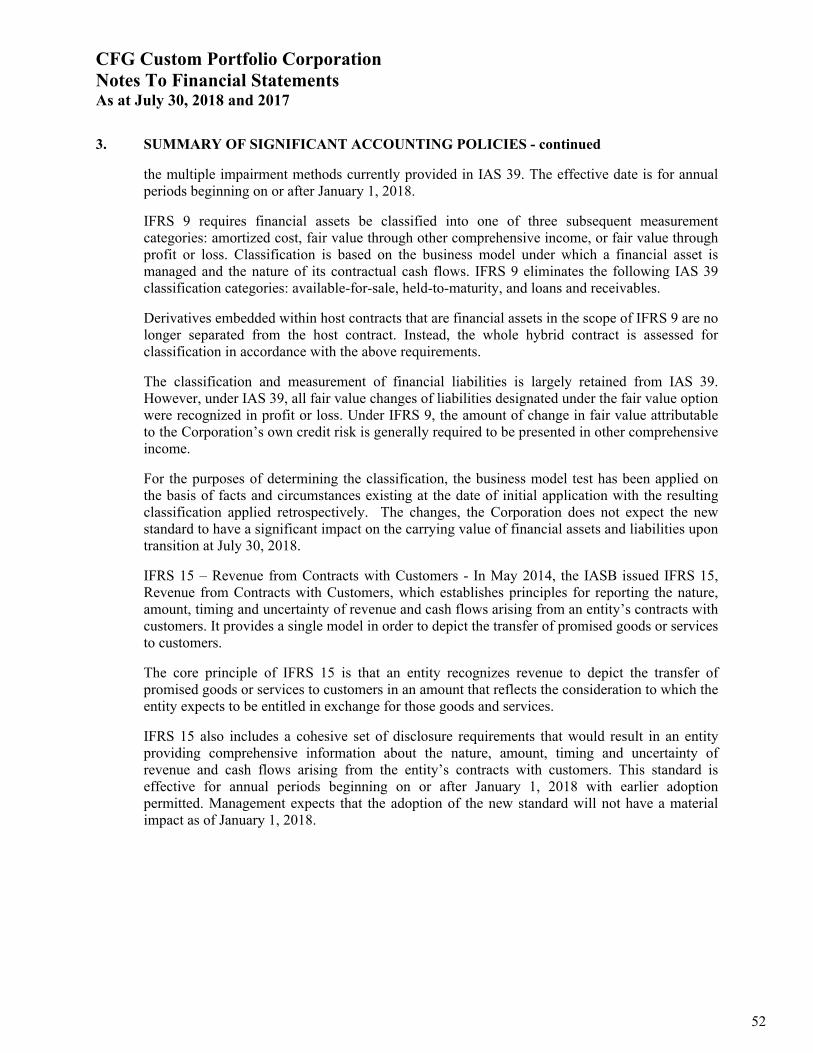
CFG Custom Portfolio CorporationNotes To Financial StatementsAs at July 30, 2018 and 2017
3. SUMMARY OF SIGNIFICANT ACCOUNTING POLICIES - continued
the multiple impairment methods currently provided in IAS 39. The effective date is for annualperiods beginning on or after January 1, 2018.
IFRS 9 requires financial assets be classified into one of three subsequent measurementcategories: amortized cost, fair value through other comprehensive income, or fair value throughprofit or loss. Classification is based on the business model under which a financial asset ismanaged and the nature of its contractual cash flows. IFRS 9 eliminates the following IAS 39classification categories: available-for-sale, held-to-maturity, and loans and receivables.
Derivatives embedded within host contracts that are financial assets in the scope of IFRS 9 are nolonger separated from the host contract. Instead, the whole hybrid contract is assessed forclassification in accordance with the above requirements.
The classification and measurement of financial liabilities is largely retained from IAS 39.However, under IAS 39, all fair value changes of liabilities designated under the fair value optionwere recognized in profit or loss. Under IFRS 9, the amount of change in fair value attributableto the Corporation’s own credit risk is generally required to be presented in other comprehensiveincome.
For the purposes of determining the classification, the business model test has been applied onthe basis of facts and circumstances existing at the date of initial application with the resultingclassification applied retrospectively. The changes, the Corporation does not expect the newstandard to have a significant impact on the carrying value of financial assets and liabilities upontransition at July 30, 2018.
IFRS 15 – Revenue from Contracts with Customers - In May 2014, the IASB issued IFRS 15,Revenue from Contracts with Customers, which establishes principles for reporting the nature,amount, timing and uncertainty of revenue and cash flows arising from an entity’s contracts withcustomers. It provides a single model in order to depict the transfer of promised goods or servicesto customers.
The core principle of IFRS 15 is that an entity recognizes revenue to depict the transfer ofpromised goods or services to customers in an amount that reflects the consideration to which theentity expects to be entitled in exchange for those goods and services.
IFRS 15 also includes a cohesive set of disclosure requirements that would result in an entityproviding comprehensive information about the nature, amount, timing and uncertainty ofrevenue and cash flows arising from the entity’s contracts with customers. This standard iseffective for annual periods beginning on or after January 1, 2018 with earlier adoptionpermitted. Management expects that the adoption of the new standard will not have a materialimpact as of January 1, 2018.
52

CFG Custom Portfolio CorporationNotes To Financial StatementsAs at July 30, 2018 and 2017
4. CASH AND CASH EQUIVALENTS
The following tables detail Class A-3, D-3 and E-3's cash and cash equivalents at July 30, 2018and July 30, 2017.
Class A-3:
2018 2017
Cash 1,093,682 7,660,805
ALT CSH PERFM-F/NL/N'FRAC 2,447,413 -
MLF BK INV SV-F/NL/N'FRAC 2,007,781 -
Total - - 5,548,876 7,660,805
Class D-3:
2018 2017
Cash 2,608,567 3,259,012
MLF BK INV SV-F/NL/N'FRAC 2,007,781 1,001,562
Total - - 4,616,348 4,260,574
Class E-3:
2018 2017
Cash 884,717 2,868,439
MLF BK INV SV-F/NL/N'FRAC 2,007,855 -
Total - - 2,892,572 2,868,439
There were no cash equivalents in Class F-3, I-3 and J-3.
5. REDEEMABLE SHARES
The Corporation is authorized to issue an unlimited number of shares in each class of shares. Theclasses and shares offered are:
Common SharesClass A-3 Shares (Canadian Conservative Equity shares)Class D-3 Shares (Income shares)Class E-3 Shares (Balanced shares)Class F-3 Shares (Balanced Growth shares)Class H-3 Shares (Alternative Strategies shares)Class I-3 Shares (Option Writing shares)Class J-3 Shares (Enhanced Global Income)
Each of the Class A, D, E, F, H, I and J Shares (cumulatively the "Share Classes") are issuable inseries, with 50 series of these shares currently authorized.
The common shares are voting and entitled to dividends as declared at the discretion of the Board
53
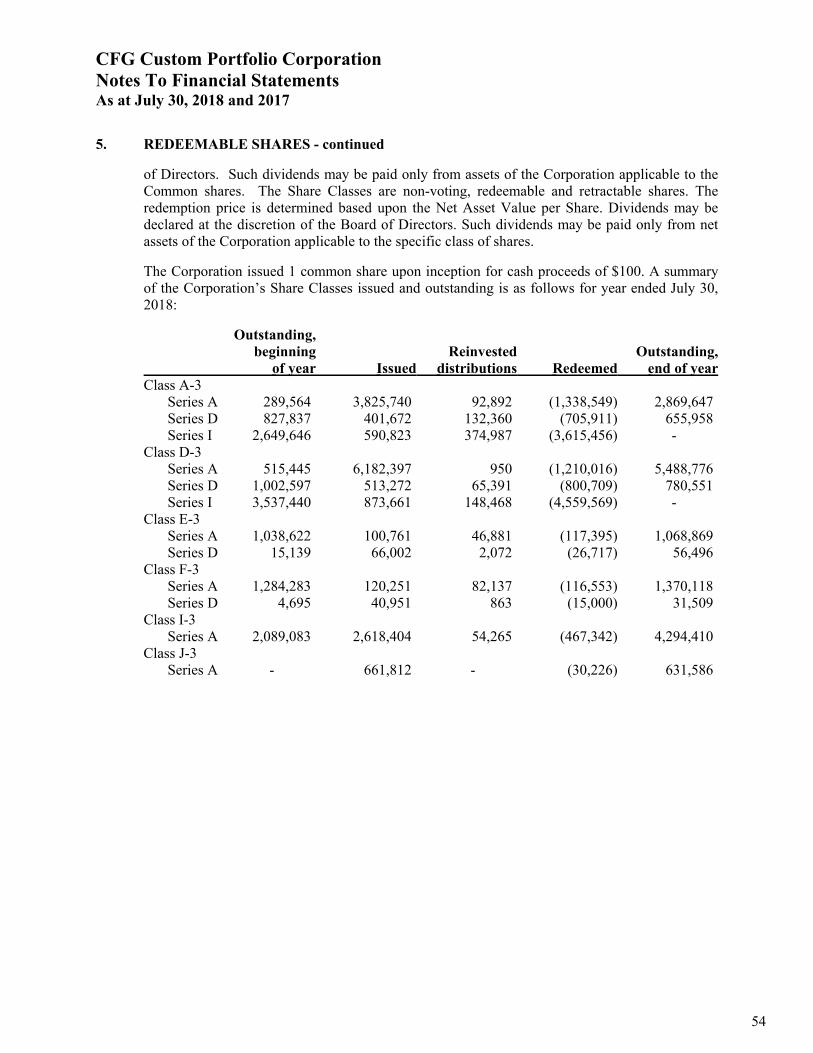
CFG Custom Portfolio CorporationNotes To Financial StatementsAs at July 30, 2018 and 2017
5. REDEEMABLE SHARES - continued
of Directors. Such dividends may be paid only from assets of the Corporation applicable to theCommon shares. The Share Classes are non-voting, redeemable and retractable shares. Theredemption price is determined based upon the Net Asset Value per Share. Dividends may bedeclared at the discretion of the Board of Directors. Such dividends may be paid only from netassets of the Corporation applicable to the specific class of shares.
The Corporation issued 1 common share upon inception for cash proceeds of $100. A summaryof the Corporation’s Share Classes issued and outstanding is as follows for year ended July 30,2018:
Outstanding,beginning Reinvested Outstanding,
of year Issued distributions Redeemed end of yearClass A-3
Series A 289,564 3,825,740 92,892 (1,338,549) 2,869,647Series D 827,837 401,672 132,360 (705,911) 655,958Series I 2,649,646 590,823 374,987 (3,615,456) -
Class D-3Series A 515,445 6,182,397 950 (1,210,016) 5,488,776Series D 1,002,597 513,272 65,391 (800,709) 780,551Series I 3,537,440 873,661 148,468 (4,559,569) -
Class E-3Series A 1,038,622 100,761 46,881 (117,395) 1,068,869Series D 15,139 66,002 2,072 (26,717) 56,496
Class F-3Series A 1,284,283 120,251 82,137 (116,553) 1,370,118Series D 4,695 40,951 863 (15,000) 31,509
Class I-3Series A 2,089,083 2,618,404 54,265 (467,342) 4,294,410
Class J-3Series A - 661,812 - (30,226) 631,586
54

CFG Custom Portfolio CorporationNotes To Financial StatementsAs at July 30, 2018 and 2017
5. REDEEMABLE SHARES - continued
A summary of the Corporation’s Share Classes issued and outstanding is as follows for yearended July 30, 2017:
Outstanding,beginning Reinvested Outstanding,
of year Issued distributions Redeemed end of yearClass A-3
Series A 382,980 211,210 4,133 (308,759) 289,564Series D 388,804 1,000,558 7,091 (568,616) 827,837Series I 2,535,399 1,119,431 30,371 (1,035,555) 2,649,646
Class D-3Series A 428,849 351,129 9,299 (273,832) 515,445Series D 489,366 1,236,079 16,036 (738,884) 1,002,597Series I 3,295,254 1,477,363 74,148 (1,309,325) 3,537,440
Class E-3Series A 911,365 201,563 18,090 (92,396) 1,038,622Series D 3,015 19,542 216 (7,634) 15,139
Class F-3Series A 1,126,830 225,511 17,541 (85,599) 1,284,283Series D 4,057 5,261 74 (4,697) 4,695
Class H-3Series A 31,764 3,593 - (35,357) -Series D 61,830 1,382 - (63,212) -
Class I-3Series A 908,701 1,474,425 1,952 (295,995) 2,089,083
55

CFG Custom Portfolio CorporationNotes To Financial StatementsAs at July 30, 2018 and 2017
6. DISTRIBUTIONS (DIVIDENDS) PAID TO SHAREHOLDERS
The Board of Directors of the Corporation may declare dividends, at its discretion, payable onany class of the Corporation. Distributions paid to shareholders are calculated on a per sharebasis. Unless stated in writing in advance of the dividend date, dividends are automaticallyreinvested in shares of the Corporation.
During the year, the Corporation declared and paid $3,422,196 (2017 - $3,115,863) in Canadiandividends and $10,021,519 (2017 - $532,414) in capital gains dividends and $6,804,483 (2017 -$nil) in return of capital. A breakdown is as follows:
2018 2017Capital gains Canadian Return of Capital gains Canadian Return of
dividends dividends Capital dividends dividends Capital Class A-3 $ 6,054,728 $ 816,871 $3,163,102 $ - $ 770,000 $ -Class D-3 1,740,735 1,353,683 1,313,113 - 1,250,000 -Class E-3 582,768 307,761 212,194 - 310,000 -Class F-3 1,021,736 299,729 364,796 - 305,000 -Class H-3 - - - - - -Class I-3 621,552 604,996 1,647,896 532,414 480,863 -Class J-3 - 39,156 103,382 - - -Total $10,021,519 $3,422,196 $6,804,483 $ 532,414 $3,115,863 $ -
56

CFG Custom Portfolio CorporationNotes To Financial StatementsAs at July 30, 2018 and 2017
7. RELATED PARTY TRANSACTIONS
(a) Management Fees and Performance Bonus
In consideration for management services and investment advice provided to the Corporation,each class pays a management fee to the Manager per annum which is calculated and accruedmonthly. A breakdown is as follows:
Management Unpaid/Accrued Management Unpaid/Accrued
Rate (2) Fees Management Fees (1) Fees Management Fees (1)
Class A-3
Series A 0.25% 79,689$ 12,157$ 18,704$ 1,141$
Series D 0.85% 144,936 9,147 105,214 11,095
Class D-3
Series A 0.25% 84,721 13,979 13,024 1,030
Series D 0.85% 120,731 7,850 89,916 9,268
Class E-3
Series A 0.25% 41,070 4,620 37,417 4,171
Series D 0.85% 4,730 500 1,114 125
Class F-3
Series A 0.25% 57,563 6,657 50,186 5,660
Series D 0.85% 2,572 289 514 38
Class H-3
Series A 0.50% - - 591 -
Series D 1.50% - - 2,911 -
Class I-3 0.25% 93,591 10,716 41,764 4,459
Class J-3 0.25% 11,331 1,335 - -
Total 640,934$ 67,250$ 361,355$ 36,987$
2018 2017
(1) Included in accrued liabilities for financial statement presentation purposes.(2) Rate is applicable for Series A and D only. The other series charge $nil or insignificant
management fees.
(b) Operating Expenses
The Corporation bears all of the costs and expenses relating to the operation of the business andaffairs of the Corporation including all audit, registrar and transfer agency fees, taxes andbrokerage commissions. The Manager pays certain of these expenses on behalf of theCorporation and is then reimbursed by the Corporation. The Manager may waive or absorbcertain expenses of the Corporation. The decision to do so is reviewed annually and determinedat the sole discretion of the Manager.
57

CFG Custom Portfolio CorporationNotes To Financial StatementsAs at July 30, 2018 and 2017
8. INCOME TAXES
The Corporation qualified as a mutual fund corporation under the Income Tax Act (Canada).Accordingly, all interest and foreign dividends, net of applicable expenses, are taxed at fullcorporate rates with credits, subject to certain limitations, for foreign taxes paid.
As a mutual fund corporation, taxable dividends received from Canadian corporations andforeign affiliates are subject to a tax of 38.33%. Such taxes are fully refundable upon payment oftaxable dividends to its shareholders at a rate of 38.33% of each $1 of dividends paid. As at July30, 2018, all refundable taxes paid on such income was fully offset based on taxable dividendsdeclared and paid during the year.
The Corporation is generally subject to tax at full corporate rates on 50% of its net realizedcapital gains. This tax can be eliminated by "capital gains redemptions" as defined by income taxlegislation, out of the Corporation’s realized and undistributed capital gains within 60 days of theend of its fiscal year, making payment to its shareholders of a "capital gains dividend" out of theCorporation’s realized and undistributed capital gains, or by a combination of both. As a result,no provision for income taxes with respect to capital gains is made in these financial statements.
All interest and foreign dividends, net of applicable expenses, are taxed at full corporate rateswith credits, subject to certain limitations, for foreign taxes paid.
9. CAPITAL MANAGEMENT
R.N. Croft Financial Group Inc., as the fund manager, is responsible for managing theCorporation's assets and liabilities in line with each Class of shares' mandate and the businessaffairs of the Corporation. The Corporation's dividend policy is to declare and pay suchdividends equal to the excess of revenues that would otherwise be taxable over expensesapplicable to each Class of shares.
58

CFG Custom Portfolio CorporationNotes To Financial StatementsAs at July 30, 2018 and 2017
10. FINANCIAL INSTRUMENTS BY CATEGORY
The following tables present the carrying amounts of the Corporation's financial instruments bycategory as at July 30, 2018 and July 30, 2017.
Class A-3:
July 30, 2018
Assets
Financial assets at
FVTPL
Financial assets at
amortized cost Total
Non-derivative financial assets -
investments 62,936,723 - 62,936,723
Cash 5,548,876 - 5,548,876
Subscriptions receivable - 9,032 9,032
Accrued interest - 93,685 93,685
Accrued dividends - 96,631 96,631
Derivative assets 6,836 - 6,836
Total 68,492,435 199,348 68,691,783
Liabilities
Financial liabilities
at FVTPL Total
Redemptions payable - 16,000 16,000
Accrued liabilities - 88,600 88,600
Derivative liabilities -investments 689,654 - 689,654
Total 689,654 104,600 794,254
Financial liabilities
at amortized cost
59
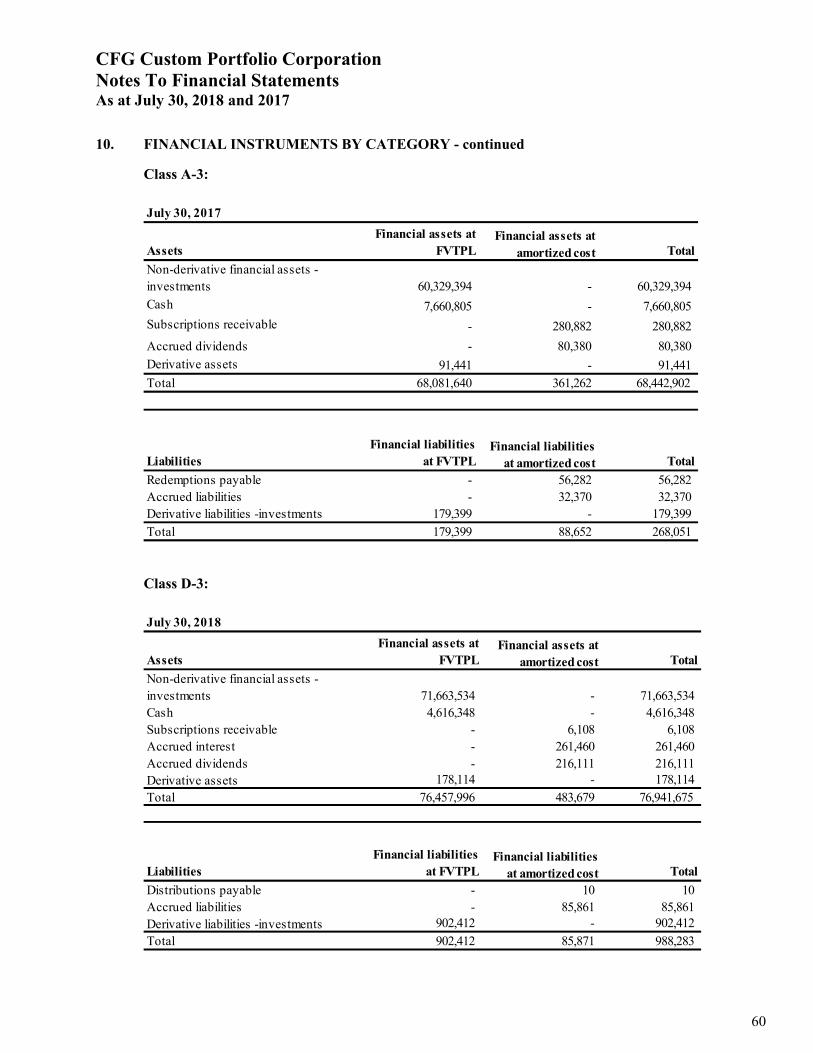
CFG Custom Portfolio CorporationNotes To Financial StatementsAs at July 30, 2018 and 2017
10. FINANCIAL INSTRUMENTS BY CATEGORY - continued
Class A-3:
July 30, 2017
Assets
Financial assets at
FVTPL Total
Non-derivative financial assets -
investments 60,329,394 - 60,329,394
Cash 7,660,805 - 7,660,805
Subscriptions receivable - 280,882 280,882
Accrued dividends - 80,380 80,380
Derivative assets 91,441 - 91,441
Total 68,081,640 361,262 68,442,902
Liabilities
Financial liabilities
at FVTPL Total
Redemptions payable - 56,282 56,282
Accrued liabilities - 32,370 32,370
Derivative liabilities -investments 179,399 - 179,399
Total 179,399 88,652 268,051
Financial assets at
amortized cost
Financial liabilities
at amortized cost
Class D-3:
July 30, 2018
Assets
Financial assets at
FVTPL Total
Non-derivative financial assets -
investments 71,663,534 - 71,663,534
Cash 4,616,348 - 4,616,348
Subscriptions receivable - 6,108 6,108
Accrued interest - 261,460 261,460
Accrued dividends - 216,111 216,111
Derivative assets 178,114 - 178,114
Total 76,457,996 483,679 76,941,675
Liabilities
Financial liabilities
at FVTPL Total
Distributions payable - 10 10
Accrued liabilities - 85,861 85,861
Derivative liabilities -investments 902,412 - 902,412
Total 902,412 85,871 988,283
Financial assets at
amortized cost
Financial liabilities
at amortized cost
60

CFG Custom Portfolio CorporationNotes To Financial StatementsAs at July 30, 2018 and 2017
10. FINANCIAL INSTRUMENTS BY CATEGORY - continued
Class D-3:
July 30, 2017
Assets
Financial assets at
FVTPL Total
Non-derivative financial assets -
investments 58,141,001 - 58,141,001
Cash 4,260,574 - 4,260,574
Subscriptions receivable - 785,177 785,177
Accrued interest - 33,166 33,166
Accrued dividends - 209,015 209,015
Derivative assets 98,891 - 98,891
Total 62,500,466 1,027,358 63,527,824
Liabilities
Financial liabilities
at FVTPL Total
Redemptions payable - 99,626 99,626
Accrued liabilities - 28,082 28,082
Derivative liabilities -investments 440,014 - 440,014
Total 440,014 127,708 567,722
Financial assets at
amortized cost
Financial liabilities
at amortized cost
Class E-3:
July 30, 2018
Assets
Financial assets at
FVTPL Total
Non-derivative financial assets -
investments 14,171,067 - 14,171,067
Cash 2,892,572 - 2,892,572
Accrued interest - 32,695 32,695
Accrued dividends - 41,957 41,957
Total 17,063,639 74,652 17,138,291
Liabilities
Financial liabilities
at FVTPL Total
Accrued liabilities - 18,108 18,108
Derivative liabilities -investments 147,255 - 147,255
Total 147,255 18,108 165,363
Financial assets at
amortized cost
Financial liabilities
at amortized cost
61

CFG Custom Portfolio CorporationNotes To Financial StatementsAs at July 30, 2018 and 2017
10. FINANCIAL INSTRUMENTS BY CATEGORY - continued
Class E-3:
July 30, 2017
Assets
Financial assets at
FVTPL Total
Non-derivative financial assets -
investments 13,147,997 - 13,147,997
Cash 2,868,439 - 2,868,439
Accrued interest - 1,224 1,224
Accrued dividends - 44,696 44,696
Derivative assets 19,725 - 19,725
Total 16,036,161 45,920 16,082,081
Liabilities
Financial liabilities
at FVTPL Total
Redemptions payable - 4,491 4,491
Accrued liabilities - 7,884 7,884
Derivative liabilities -investments 4,579 - 4,579
Total 4,579 12,375 16,954
Financial assets at
amortized cost
Financial liabilities
at amortized cost
Class F-3:
July 30, 2018
Assets
Financial assets at
FVTPL Total
Non-derivative financial assets -
investments 23,235,314 - 23,235,314
Cash 1,523,872 - 1,523,872
Subscriptions receivable - 106 106
Accrued dividends - 51,600 51,600
Total 24,759,186 51,706 24,810,892
Liabilities
Financial liabilities
at FVTPL Total
Redemptions payable - 129,252 129,252
Accrued liabilities - 25,484 25,484
Derivative liabilities -investments 44,268 - 44,268
Total 44,268 154,736 199,004
Financial assets at
amortized cost
Financial liabilities
at amortized cost
62

CFG Custom Portfolio CorporationNotes To Financial StatementsAs at July 30, 2018 and 2017
10. FINANCIAL INSTRUMENTS BY CATEGORY - continued
Class F-3:
July 30, 2017
Assets
Financial assets at
FVTPL Total
Non-derivative financial assets -
investments 19,464,614 - 19,464,614
Cash 2,130,988 - 2,130,988
Subscriptions receivable - 106 106
Accrued dividends - 40,430 40,430
Derivative assets 12,620 - 12,620
Total 21,608,222 40,536 21,648,758
Liabilities
Financial liabilities
at FVTPL Total
Redemptions payable - 30,025 30,025
Accrued liabilities - 10,414 10,414
Derivative liabilities -investments 34,461 - 34,461
Total 34,461 40,439 74,900
Financial assets at
amortized cost
Financial liabilities
at amortized cost
63

CFG Custom Portfolio CorporationNotes To Financial StatementsAs at July 30, 2018 and 2017
10. FINANCIAL INSTRUMENTS BY CATEGORY - continued
Class H-3:
July 30, 2017
Assets
Financial assets at
FVTPL Total
Non-derivative financial assets -
investments - - -
Cash 4,605 - 4,605
Derivative assets - - -
Total 4,605 - 4,605
Liabilities
Financial liabilities
at FVTPL Total
Redemptions payable - 9,032 9,032
Accrued liabilities - 2,113 2,113
Derivative liabilities -investments - - -
Total - 11,145 11,145
Financial assets at
amortized cost
Financial liabilities
at amortized cost
Class I-3:
July 30, 2018
Assets
Financial assets at
FVTPL Total
Non-derivative financial assets -
investments 45,731,197 - 45,731,197
Cash 4,895,467 - 4,895,467
Subscriptions receivable - 139,252 139,252
Accrued dividends - 121,425 121,425
Derivative assets 37,883 - 37,883
Total 50,664,547 260,677 50,925,224
Liabilities
Financial liabilities
at FVTPL Total
Accrued liabilities - 54,943 54,943
Derivative liabilities -investments 883,178 - 883,178
Total 883,178 54,943 938,121
Financial assets at
amortized cost
Financial liabilities
at amortized cost
64

CFG Custom Portfolio CorporationNotes To Financial StatementsAs at July 30, 2018 and 2017
10. FINANCIAL INSTRUMENTS BY CATEGORY - continued
Class I-3:
July 30, 2017
Assets
Financial assets at
FVTPL Total
Non-derivative financial assets -
investments 22,033,054 - 22,033,054
Cash 2,312,821 - 2,312,821
Subscriptions receivable - 238,892 238,892
Accrued dividends - 94,565 94,565
Derivative assets 34,555 - 34,555
Total 24,380,430 333,457 24,713,887
Liabilities
Financial liabilities
at FVTPL Total
Redemptions payable - 7,765 7,765
Accrued liabilities - 8,651 8,651
Derivative liabilities -investments 538,906 - 538,906
Total 538,906 16,416 555,322
Financial assets at
amortized cost
Financial liabilities
at amortized cost
Class J-3:
July 30, 2018
Assets
Financial assets at
FVTPL Total
Non-derivative financial assets -
investments 5,123,028 - 5,123,028
Cash 1,131,983 - 1,131,983
Accrued dividends - 10,689 10,689
Derivative assets 525,109 - 525,109
Total 6,780,120 10,689 6,790,809
Liabilities
Financial liabilities
at FVTPL Total
Distributions payable - 580 580
Accrued liabilities - 6,301 6,301
Derivative liabilities -investments 326,874 - 326,874
Total 326,874 6,881 333,755
Financial assets at
amortized cost
Financial liabilities
at amortized cost
65
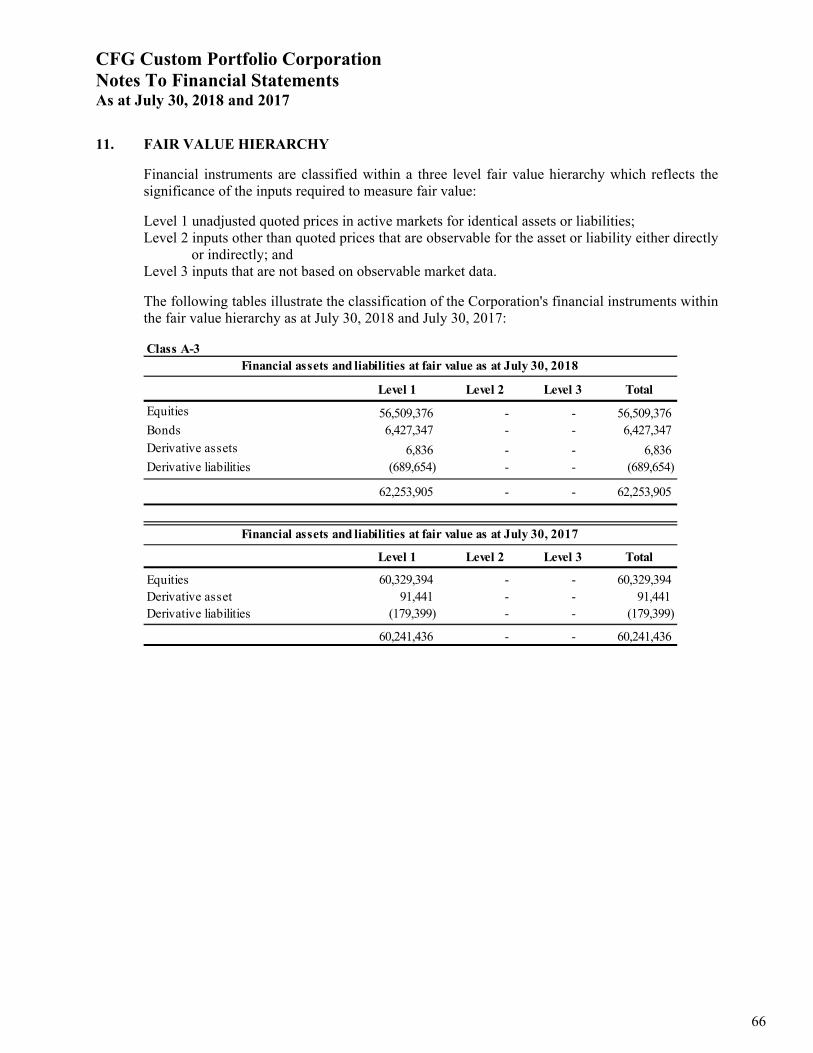
CFG Custom Portfolio CorporationNotes To Financial StatementsAs at July 30, 2018 and 2017
11. FAIR VALUE HIERARCHY
Financial instruments are classified within a three level fair value hierarchy which reflects thesignificance of the inputs required to measure fair value:
Level 1 unadjusted quoted prices in active markets for identical assets or liabilities;Level 2 inputs other than quoted prices that are observable for the asset or liability either directly
or indirectly; andLevel 3 inputs that are not based on observable market data.
The following tables illustrate the classification of the Corporation's financial instruments withinthe fair value hierarchy as at July 30, 2018 and July 30, 2017:
Class A-3
Level 1 Level 2 Level 3 Total
Equities 56,509,376 - - 56,509,376
Bonds 6,427,347 - - 6,427,347
Derivative assets 6,836 - - 6,836
Derivative liabilities (689,654) - - (689,654)
62,253,905 - - 62,253,905 -
Level 1 Level 2 Level 3 Total
Equities 60,329,394 - - 60,329,394
Derivative asset 91,441 - - 91,441
Derivative liabilities (179,399) - - (179,399)
60,241,436 - - 60,241,436
Financial assets and liabilities at fair value as at July 30, 2017
Financial assets and liabilities at fair value as at July 30, 2018
66

CFG Custom Portfolio CorporationNotes To Financial StatementsAs at July 30, 2018 and 2017
11. FAIR VALUE HIERARCHY - continued
Class D-3
Level 1 Level 2 Level 3 Total
Equities 44,628,180 - - 44,628,180
Bonds 26,705,354 - - 26,705,354
Derivative assets 178,114 - - 178,114
Derivative liabilities (902,412) - - (902,412)
Private investments - - 330,000 330,000
70,609,236 - 330,000 70,939,236 -
Level 1 Level 2 Level 3 Total
Equities 52,305,986 - - 52,305,986
Short-term investments 1,001,562 - - 1,001,562
Bonds 5,505,015 - - 5,505,015
Derivative assets 98,891 - - 98,891
Derivative liabilities (440,014) - - (440,014)
Private investments - - 330,000 330,000
58,471,440 - 330,000 58,801,440
Financial assets and liabilities at fair value as at July 30, 2017
Financial assets and liabilities at fair value as at July 30, 2018
Class E-3
Level 1 Level 2 Level 3 Total
Equities 9,785,395 - - 9,785,395
Bonds 4,385,672 - - 4,385,672
Derivative liabilities (147,255) - - (147,255)
14,023,812 - - 14,023,812 -
Level 1 Level 2 Level 3 Total
Equities 12,909,159 - - 12,909,159
Bonds 238,838 - - 238,838
Derivative assets 19,725 - - 19,725
Derivative liabilities (4,579) - - (4,579)
13,163,143 - - 13,163,143
Financial assets and liabilities at fair value as at July 30, 2017
Financial assets and liabilities at fair value as at July 30, 2018
67

CFG Custom Portfolio CorporationNotes To Financial StatementsAs at July 30, 2018 and 2017
11. FAIR VALUE HIERARCHY - continued
Class F-3
Level 1 Level 2 Level 3 Total
Equities 23,235,314 - - 23,235,314
Derivative liabilities (44,268) - - (44,268)
23,191,046 - - 23,191,046 -
Level 1 Level 2 Level 3 Total
Equities 19,464,614 - - 19,464,614
Derivative assets 12,620 - - 12,620
Derivative liabilities (34,461) - - (34,461)
19,442,773 - - 19,442,773
Financial assets and liabilities at fair value as at July 30, 2017
Financial assets and liabilities at fair value as at July 30, 2018
Class I-3
Level 1 Level 2 Level 3 Total
Equities 45,731,197 - - 45,731,197
Derivative assets 37,883 - - 37,883
Derivative liabilities (883,178) - - (883,178)
44,885,902 - - 44,885,902 -
Level 1 Level 2 Level 3 Total
Equities 22,033,054 - - 22,033,054
Derivative assets 34,555 - - 34,555
Derivative liabilities (538,906) - - (538,906)
21,528,703 - - 21,528,703
Financial assets and liabilities at fair value as at July 30, 2017
Financial assets and liabilities at fair value as at July 30, 2018
Class J-3
Level 1 Level 2 Level 3 Total
Equities 5,123,028 - - 5,123,028
Derivative assets 525,109 - - 525,109
Derivative liabilities (326,874) - - (326,874)
5,321,263 - - 5,321,263 -
Financial assets and liabilities at fair value as at July 30, 2018
68

CFG Custom Portfolio CorporationNotes To Financial StatementsAs at July 30, 2018 and 2017
11. FAIR VALUE HIERARCHY - continued
There were no transfers between levels in either 2018 or 2017.
The Corporation's equity and bond positions are classified as Level 1 when the security isactively traded and a reliable price is observable. Where certain of the Corporation's equities donot trade frequently and therefore observable prices may not be available, the fair value isdetermined using observable market data (e.g., transactions for similar securities of the sameissuer) and the fair value is classified as Level 2, unless the determination of fair value requiressignificant unobservable data, in which case the measurement is classified as Level 3.
12. CERTAIN RISK FACTORS ASSOCIATED WITH FINANCIAL INSTRUMENTS
Class Risk
Mutual fund corporations sometimes issue different classes of shares of the same mutual fundcorporation. Each class has its own fees and expenses, which the mutual fund tracks separately.However, if one is unable to meet its financial obligations, the other classes are legallyresponsible for making up the difference.
Investment/Market Risk
The value of Shares and any income and gains associated with them can fluctuate significantlyand may be quite volatile. Subscribers should be aware that they may not achieve theiranticipated returns and may, in fact, suffer significant loss. It is therefore prudent and necessaryto consider the use of such pools within an appropriately balanced investment portfolio.
i) Equity Risk
The Classes invest in equity securities (also called stocks or shares). The value of theClasses will be affected by changes in the market price of those securities. The securitiesbusiness is speculative, prices are volatile and market movements are difficult to predict.The price of a stock is affected by individual company developments and by generaleconomic and financial conditions in those countries where the issuer of the stock islocated or where the stock is listed for trading.
ii) Foreign Currency Risk
The Canadian dollar value of a Class’s investments in foreign securities is affected bychanges in the value of the Canadian dollar relative to those securities. While theManager may employ currency hedging when it believes that currency exposure presentssignificant risk, there is no assurance that it will do so in any particular circumstance.Premiums paid for over the counter currency options purchased by a Class may reduce aClass’s return.
The classes' foreign currency holdings at July 30, 2018 were:
Class 2018
Class A-3 %21.3
69

CFG Custom Portfolio CorporationNotes To Financial StatementsAs at July 30, 2018 and 2017
12. CERTAIN RISK FACTORS ASSOCIATED WITH FINANCIAL INSTRUMENTS - continued
Class D-3 %7.3Class E-3 %11.9Class F-3 %42.7Class I-3 %24.4Class J-3 %1.7
Sensitivity Analysis
At July 30, 2018 had the Canadian dollar strengthened or weakened by 1% in relation tothe U.S. Dollar, with all other variables held constant, net assets attributable to theholders of redeemable shares and the change in net assets attributable to holders ofredeemable shares per the statements of financial position would have increased ordecreased by the amounts shown below. In practice, the actual trading results may differfrom this sensitivity analysis and the difference could be material.
Class 2018
Class A-3 $ 145,080Class D-3 $ 55,546Class E-3 $ 20,197Class F-3 $ 105,380Class I-3 $ 121,980Class J-3 $ 1,111
iii) Interest Rate Fluctuations
In the case of interest rate sensitive securities, the value of a security may change as thegeneral level of interest rates fluctuates. When interest rates decline, the value of suchsecurities can be expected to rise. Conversely, when interest rates rise, the value of suchsecurities can be expected to decline.
Sensitivity Analysis
The majority of the Corporation's investments are non-interest bearing assets. Currentlyonly the Class A-3, D-3 and E-3 Series Funds have direct exposure to interest rates.
The sensitivity of the Class A-3 Series Fund to interest rate movements, measured byModified Duration is 0.09. An increase / decrease in interest rates by 100 bps will resultin a decrease / increase of the bond portfolio by approximately 9 bps. This affectsapproximately $6.4 Million of the total value of the Class A-3 Series Fund at the time ofreporting.
The sensitivity of the Class D-3 Series Fund to interest rate movements, measured byModified Duration is 0.91. An increase / decrease in interest rates by 100 bps will resultin a decrease / increase of the bond portfolio by approximately 91 bps. This affectsapproximately $25.6 Million of the total value of the Class D-3 Series Fund at the timeof reporting.
The sensitivity of the Class E-3 Series Fund to interest rate movements, measured by
70

CFG Custom Portfolio CorporationNotes To Financial StatementsAs at July 30, 2018 and 2017
12. CERTAIN RISK FACTORS ASSOCIATED WITH FINANCIAL INSTRUMENTS - continued
Modified Duration is 0.72. An increase / decrease in interest rates by 100 bps will resultin a decrease / increase of the bond portfolio by approximately 72 bps. This affectsapproximately $6.4 Million of the total value of the Class E-3 Series Fund at the time ofreporting.
No other share classes had interest rate sensitivity at this time.
iv) Other Price Risk
Other price risk is the risk that value of the instruments will fluctuate as a result of thechanges in market prices (other than those arising from interest rate risk or currencyrisk), whether caused by factors specific to an individual investment or its issuer, orfactors affecting all instruments traded in the market. All securities present a risk of lossof capital. Some of these risks include:
a) Credit risk
Credit risk represents the potential loss that the Corporation would incur if theissuer of a financial instrument failed to perform in accordance with the terms oftheir obligations to the Corporation. The term credit risk is generally associatedwith bonds and discount notes, and the risk that the issuer will default in thepayments of either principal or interest. Class F-3, I-3 and J-3 did not hold anyfixed-income instruments. The following table details Class A-3, D-3 and E-3'scredit risk exposure by credit rating at July 30, 2018 and July 30, 2017.
71

CFG Custom Portfolio CorporationNotes To Financial StatementsAs at July 30, 2018 and 2017
12. CERTAIN RISK FACTORS ASSOCIATED WITH FINANCIAL INSTRUMENTS - continued
Class A-3:
AA A BBB- not rated
Ford Credit Canada Co 3.7 08/02/18 3,421,317
TMX Group Ltd 3.253 10/03/18 3,006,030
Total - - 3,421,317 3,006,030
As of July 30, 2018
Class A-3 did not hold any fixed-income instruments as at July 30, 2017.
Class D-3:
Aa2 A2 AA- A+
Capital Desjardins Inc 4.954 12/15/26 363,001
Royal Bank of Canada 2.77 12/11/18 4,445,856
Royal Bank of Canada 2.99 12/06/24 381,577
Shell International Fin 4.3 9/22/2019 2,118,354
Total 381,577 363,001 4,445,856 2,118,354
Baa1 BBB BBB- not rated
Bank of Nova Scotia 3.036 10/18/2024 380,633
Constellation Software Float 03/31/40 2,054,280
Dollarama Inc 3.095 11/05/18 3,440,597
Ford Credit Canada Co 3.7 08/02/18 2,931,128
Loblaw Companies Ltd 3.748 03/12/19 4,540,095
Morneau Shepell Inc 4 3/4 06/30/21 310,050
Premium Brands Hldgs Corp 4.6 12/31/23 791,000
Premium Brands Hldgs Corp 4.65 04/30/21 1,509,885
TMX Group Ltd 3.253 10/03/18 3,438,898
Total 380,633 4,540,095 4,985,408 9,490,430
As of July 30, 2018
72

CFG Custom Portfolio CorporationNotes To Financial StatementsAs at July 30, 2018 and 2017
12. CERTAIN RISK FACTORS ASSOCIATED WITH FINANCIAL INSTRUMENTS - continued
AA A BBB- not rated
Bank of Nova Scotia 3.036 10/18/24 386,500
Capital Desjardins Inc 4.954 12/15/26 375,784
Constellation Software Float 03/31/40 1,889,132
Morneau Shepell Inc 4 3/4 06/30/21 279,575
Premium Brands Hldgs Corp 4.6 12/31/23 759,500
Premium Brands Hldgs Corp 4.65 04/30/21 1,365,975
Royal Bank of Canada 2.99 12/06/24 387,589
Rogers Sugar Inc 5 12/31/24 60,960
Total 1,149,873 - 1,889,132 2,466,010
As of July 30, 2017
Class E-3:
A+ A- BBB- not rated
AG Growth International 4 1/2 12/31/22 434,300
Bank of America Corp 2.6 01/15/19 716,365
Coca-Cola Co/The 1.375 05/30/19 709,437
Constellation Software Float 03/31/40 259,718
Exchange Income Corp 5 1/4 12/31/22 437,525
Ford Credit Canada Co 3.7 08/02/18 826,318
TMX Group Ltd 3.253 10/03/18 1,002,010
Total 709,437 716,365 1,086,036 1,873,835
As of July 30, 2018
AA A BBB- not rated
Constellation Software Float 03/31/40 238,838
Total - - 238,838 -
As of July 30, 2017
73

CFG Custom Portfolio CorporationNotes To Financial StatementsAs at July 30, 2018 and 2017
12. CERTAIN RISK FACTORS ASSOCIATED WITH FINANCIAL INSTRUMENTS - continued
b) Liquidity risk
Liquidity risk is the risk that the Corporation will encounter difficulty in meetingobligations associated with financial liabilities. The Corporation is exposed todaily cash redemptions, however, the Corporation maintains sufficient cash onhand to fund anticipated redemptions.
The Corporation may invest in derivatives, debt securities and unlisted equityinvestments that are not traded in an active market. As a result, the Corporationmay not be able to quickly liquidate its investments in these instruments atamounts which approximate their fair values, or be able to respond to specificevents such as deteriration in the creditworthiness of any particular issuer. TheManager monitors the Corporation's liquidity position on a daily basis.
The current liabilities of each Class are generally payable in less than 90 days oforigination. Maturities of derivative liabilities vary as indicated on the applicableschedule of investment portfolio.
Redeemable units are redeemable on demand at the holder's option. However,the Manager does not expect that the contractual maturity disclosed above willbe representative of the actual cash outflows, as holders of these instrumentstypically retain them for a longer period.
c) Foreign Security Risk
Some Classes invest a substantial portion of their assets in foreign securities.The value of foreign securities may be influenced by foreign governmentpolicies, lack of information about foreign companies, political or socialinstability and the possible levy of foreign withholding tax. There may be lowerstandards of government supervision and regulation in foreign financial markets.Foreign stock markets may also be less liquid and more volatile. In addition, thesecurities markets of many countries have at times in the past moved relativelyindependently of one another due to different economic, financial, political andsocial factors. This may reduce gains which a Class has derived from movementsin a particular market. A Class that holds foreign securities may have difficultyenforcing legal rights in jurisdictions outside Canada.
d) Industry and Geographic Concentration Risk
The Corporation’s investment philosophy may cause the Classes to focus onspecific industries and to avoid others. Moreover, the Corporation will beauthorized to allocate the Class’s assets without limitation among geographicregions and individual countries. As a result, a Class may from time to time,have greater exposure to particular industries, countries, or regions than othersimilar Classes.
74

CFG Custom Portfolio CorporationNotes To Financial StatementsAs at July 30, 2018 and 2017
12. CERTAIN RISK FACTORS ASSOCIATED WITH FINANCIAL INSTRUMENTS - continued
e) American Depository Securities and Receipt Risk
In some cases, rather than directly holding securities of non-Canadian and non-U.S, companies, a Class may hold these securities through an AmericanDepository Security and Receipt (an "ADR"). An ADR is issued by a U.S. bankor trust company to evidence its ownership of securities of a non-U.S.corporation. The currency of an ADR may be U.S. dollars rather than thecurrency of the non-U.S. corporation to which it relates. The value of an ADRwill not be equal to the value of the underlying non-U.S. securities to which theADR relates as a result of a number of factors. These factors include the fees andexpenses associated with holding an ADR, the currency exchange rate relating tothe conversion of foreign dividends and other foreign cash distributions into U.S.dollars, and tax considerations such as withholding tax and different tax ratesbetween the jurisdictions. In addition, the rights of the Class, as a holder of anADR, may be different than the rights of holders of the underlying securities towhich the ADR relates, and the market for an ADR may be less liquid than thatof the underlying securities. The foreign exchange risk will also affect the valueof the ADR and, as a consequence, the performance of the Class if it holds theADR.
f) Portfolio Turnover Risk
The operation of a Class may result in a high annual portfolio turnover rate. TheClasses have not placed any limit on the rate of portfolio turnover and portfoliosecurities may be sold without regard to the time they have been held when, inthe opinion of the Corporation, investment considerations warrant such action. Ahigh rate of portfolio turnover involves correspondingly greater expenses than alower rate (e.g., greater transaction costs such as brokerage fees) and mayinvolve different tax consequences.
g) Broad Authority of R.N. Croft Financial Group Inc. Risk
The Corporation, through its manager, has broad discretion over the conduct of aClass’s undertaking, selection of the specific companies in which a Class investsand over the types of transactions in which a Class engages.
h) Legal, Tax and Regulatory Risks
Legal, tax and regulatory changes to laws or administrative practice could occurduring the term of a Class which may adversely affect the Class. For example,the regulatory or tax environment for derivative instruments is evolving, andchanges in the regulation or taxation of derivative instruments may adverselyaffect the value of derivative instruments held by a Class and the ability of theClass to pursue its investment strategies. Interpretation of the law oradministrative practice may affect the characterization of a Class’s earnings ascapital gains or income which may increase the level of tax borne by investors asa result of increased dividend paid by the Class.
75

CFG Custom Portfolio CorporationNotes To Financial StatementsAs at July 30, 2018 and 2017
12. CERTAIN RISK FACTORS ASSOCIATED WITH FINANCIAL INSTRUMENTS - continued
i) Conflicts of lnterest Risk
The Corporation may be subject to conflicts of interest due to the fact that R.N.Croft also provides discretionary portfolio management services to other clientswho do not hold shares of one or more Classes. The Corporation’s investmentdecisions for a Class are made independently of those made for other clients.R.N. croft makes all reasonable efforts to price and allocate securities fairly iftraded for both the Corporation and other clients. In all cases, R.N. Croft haspolicies to ensure it allocates trades in a fair and reasonable manner for allclients, including the Corporation. The decision to use the same or differentsecurities for other client accounts and one or more Class of the Corporation isbased on the investment objectives, risk tolerances, and constraints identified asidentified by R.N. Croft when discharging its fiduciary obligations for all clientsand the Corporation, including its individual Classes.
j) Regulatory Risk
Some industries, such as financial services, healthcare and telecommunications,are heavily regulated and may receive government funding. Investments in thesesectors may be substantially affected by changes in government policy, such asincreased regulation, ownership restrictions, deregulation or reduced governmentfunding. The value of a Class that buys these investments may rise and fallsubstantially due to changes in these factors.
k) Derivative Risk
The Classes may use derivatives as permitted by the Canadian securitiesregulatory authorities. A derivative is an instrument, the value of which isderived from the value of other securities or from the movement of interest rates,exchange rates, or market indices. Derivatives are often used for hedging againstthe risk of potential losses, such as losses due to changes in interest or foreignexchange rates. Derivatives also allow mutual funds to realize the benefits ofchanges in the value of a security without having to invest directly in thatsecurity. This is especially useful since it is often less expensive to purchase aderivative instrument than the actual security. There are also certain instanceswhere holding a derivative is less risky than holding the underlying security.
Derivatives have their own special risks. Here are some of the common risks:
Using derivatives to hedge against risk may not always work and while
the use of derivatives may reduce losses, they could also limit potential
gains.
The price of a derivative may not accurately reflect the value of the
underlying currency or security.
There is no guarantee that an investor can close a derivative contract
when it wants to. If an exchange imposes trading limits, it could also
affect the ability of an investor to close out its positions in derivatives.
These events could prevent an investor from making a profit or limiting
its losses.
76

CFG Custom Portfolio CorporationNotes To Financial StatementsAs at July 30, 2018 and 2017
12. CERTAIN RISK FACTORS ASSOCIATED WITH FINANCIAL INSTRUMENTS - continued
The other party to a derivative contract may not be able to live up to its
agreement to complete the transaction.
l) Use of Options Risk
A Class may purchase and write exchange-traded and over-the-counter put andcall options on debt and equity securities, commodities, currencies and indices(both narrow-based and broad-based). A put option on securities or currenciesgives the purchaser of the option, upon payment of a premium, the right todeliver a specified amount of the securities or currencies to the writer of theoption on or before a fixed date at a predetermined price. A put option on asecurities index gives the purchaser of the option, upon payment of a premium,the right to a cash payment from the writer of the option if the index drops belowa predetermined level on or before a fixed date.
A call option on securities or currencies gives the purchaser of the option, uponpayment of a premium, the right to call upon the writer to deliver a specifiedamount of the securities or currencies on or before a fixed date at apredetermined price. A call option on a securities index gives the purchaser ofthe option, upon payment of a premium, the right to a cash payment from thewriter of the option if the index rises above a predetermined level on or before afixed date.
A Class’s ability to close out its position as a purchaser or seller of a listed put orcall option is dependent, in part, upon the liquidity of the option market. Over-the-counter ("OTC") options are purchased from or sold to securities dealers,financial institutions or other parties (the "Counterparty") through direct bilateralagreements with the Counterparty. In contrast to exchange listed options, whichgenerally have standardized terms and performance mechanics, all the terms ofan OTC option, including such terms as method of settlement, term, exerciseprice, premium, guarantees and security, are set by the negotiation of the parties.Unless the parties provide for it, there is no central clearing or guaranteefunction in an OTC option. As a result, if the Counterparty fails to make or takedelivery of the security, currency or other instrument underlying an OTC optionit has entered into with the Class or fails to make a cash settlement payment duein accordance with the terms of that option, the Class will lose any premium itpaid for the option as well as any anticipated benefit of the transaction.
77

CFG Custom Portfolio CorporationNotes To Financial StatementsAs at July 30, 2018 and 2017
12. CERTAIN RISK FACTORS ASSOCIATED WITH FINANCIAL INSTRUMENTS - continued
Call options may be purchased to provide exposure to increases in the market(e.g., with respect to temporary cash positions) or to hedge against an increase inthe price of securities or other investments that a Class intends to purchase.Similarly, put options may be purchased to hedge against a decrease in themarket generally or in the price of securities or other investments held by theClass. Buying options may reduce the Class’s returns, but by no more than theamount of the premiums paid for the options. Writing covered call options. (i.e.,where the Class owns the security or other investment that is subject to the call)may limit the Class’s gain on portfolio investments if the option is exercisedbecause the Class will have to sell the underlying investments below the currentmarket price. Also, writing put options may require the Class to buy theunderlying investment at a disadvantageous price above the current market price.Writing uncovered call options (i.e., where the Class does not own the securityor other investment that is subject to the call) entails the risk that the price of theunderlying investment at the time the option is exercised theoretically could haverisen without limit. The risk of loss of uncovered put options written by the Classis limited in the exercise price of the option less the premium received.Purchasing and writing put and call options are highly specialized activities andentail greater than ordinary market risks.
m) Counterparty Risk
Due to the nature of some of the investments that a Class may undertake, a Classrelies on the ability of the counterparty to the transaction to perform itsobligations. In the event that counterparty fails to complete its obligations, theClass bears the risk of loss of the amount expected to be received under options,forward contracts or securities lending agreements in the event of the default orbankruptcy of counterparty.
n) Securities Lending, Repurchase and Reverse Repurchase Transactions Risk
The Classes may engage in securities lending, repurchase and reverse repurchasetransactions in order to earn additional returns. Securities lending is anagreement whereby a Class lends securities through an authorized agent inexchange for a fee and some form of acceptable collateral. Under a repurchasetransaction, a Class agrees to sell securities for cash while, at the same time,assumes an obligation to repurchase the same securities for cash (usually at ahigher price) at a later date. A reverse repurchase transaction is an agreementwhere by a Class buys securities for cash while, at the same time, agrees to resellthe same securities (usually at a higher price) at a later date.
78

CFG Custom Portfolio CorporationNotes To Financial StatementsAs at July 30, 2018 and 2017
12. CERTAIN RISK FACTORS ASSOCIATED WITH FINANCIAL INSTRUMENTS - continued
The risks associated with securities lending, repurchase and reverse repurchasetransactions arise when the counterparty to such transaction defaults under theinvestment agreement and the Class is forced to make a claim in order to recoverits investment. In securities lending or a repurchase transaction, the Class couldincur a loss if the value of the securities loaned or sold by the Class hasincreased in value relative to the value of the collateral held by the Class. In thecase of a reverse repurchase transaction, the Class could incur a loss if the valueof the securities purchased by the Class decreases in value relative to the valueof the collateral held by the Class. The Classes generally manage the risksassociated with these types of investments by:
a. holding collateral equal to a minimum of 102% of the market value ofthe securities loaned (for securities lending transactions), sold (forrepurchase transactions) or purchased (for reverse repurchasetransactions) as the case may be; adjusting the amount to the collateraleach business day to ensure the collateral’s value relative to the marketvalue of the securities loaned, sold or purchased remains within a 102%limit; and
b. limiting the aggregate value of all securities loaned or sold throughsecurities lending and repurchase transactions to under 50% of the totalassets (without including the collateral) of the Class.
79

CFG Custom Portfolio CorporationNotes To Financial StatementsAs at July 30, 2018 and 2017
13. INCREASE IN NET ASSETS ATTRIBUTABLE TO HOLDERS OF REDEEMABLESHARES PER SHARE
The increase in net assets attributable to holders of redeemable shares per share for the yearsended July 30, 2018 and 2017 is calculated as follows:
Class A-3: Series A
2018 2017
Increase in net assets attributable to holders of redeemableshares $ 1,822,903 $ 846,887
Weighted average shares outstanding during the year 1,637,325 367,761
Increase in net assets attributable to holders of redeemableshares per share $ 1.11 $ 2.30
Series D2018 2017
Increase in net assets attributable to holders of redeemableshares $ 1,589,476 $ 532,233
Weighted average shares outstanding during the year 873,154 621,587
Increase in net assets attributable to holders of redeemableshares per share $ 1.82 $ 0.86
Series I2018 2017
Increase in net assets attributable to holders of redeemableshares $ 4,288,470 $ 5,535,364
Weighted average shares outstanding during the year 1,372,618 2,677,442
Increase in net assets attributable to holders of redeemableshares per share $ 3.12 $ 2.07
Class D-3: Series A
2018 2017
Increase in net assets attributable to holders of redeemableshares $ 2,358,187 $ 355,852
Weighted average shares outstanding during the year 2,919,132 438,140
Increase in net assets attributable to holders of redeemableshares per share $ 0.81 $ 0.81
80

CFG Custom Portfolio CorporationNotes To Financial StatementsAs at July 30, 2018 and 2017
13. INCREASE (DECREASE) IN NET ASSETS ATTRIBUTABLE TO HOLDERS OFREDEEMABLE SHARES PER SHARE - continued
Class D-3:Series D
2018 2017
Increase in net assets attributable to holders of redeemableshares $ 598,776 $ 282,711
Weighted average shares outstanding during the year 1,010,792 760,079
Increase in net assets attributable to holders of redeemableshares per share $ 0.59 $ 0.37
Series I2018 2017
Increase in net assets attributable to holders of redeemableshares $ 2,035,499 $ 3,204,624
Weighted average shares outstanding during the year 1,757,870 3,488,246
Increase in net assets attributable to holders of redeemableshares per share $ 1.16 $ 0.92
Class E-3:Series A
2018 2017
Increase in net assets attributable to holders of redeemableshares $ 1,133,715 $ 1,094,355
Weighted average shares outstanding during the year 1,078,488 979,677
Increase in net assets attributable to holders of redeemableshares per share $ 1.05 $ 1.12
Series D2018 2017
Increase in net assets attributable to holders of redeemableshares $ 9,984 $ 4,289
Weighted average shares outstanding during the year 45,278 10,530
Increase in net assets attributable to holders of redeemableshares per share $ 0.22 $ 0.41
81

CFG Custom Portfolio CorporationNotes To Financial StatementsAs at July 30, 2018 and 2017
13. INCREASE (DECREASE) IN NET ASSETS ATTRIBUTABLE TO HOLDERS OFREDEEMABLE SHARES PER SHARE - continued
Class F-3:Series A
2018 2017
Increase in net assets attributable to holders of redeemableshares $ 3,055,974 $ 1,522,750
Weighted average shares outstanding during the year 1,352,044 1,201,314
Increase in net assets attributable to holders of redeemableshares per share $ 2.26 $ 1.27
Series D2018 2017
Increase in net assets attributable to holders of redeemableshares $ 21,754 $ 3,176
Weighted average shares outstanding during the year 24,392 4,857
Increase in net assets attributable to holders of redeemableshares per share $ 0.89 $ 0.65
Class H-3:Series A
2018 2017
Increase in net assets attributable to holders of redeemableshares $ - $ (2,988)
Weighted average shares outstanding during the year - 33,758
Increase in net assets attributable to holders of redeemableshares per share $ - $ (0.09)
Series D2018 2017
Increase in net assets attributable to holders of redeemableshares - (7,674)
Weighted average shares outstanding during the year - 51,019
Increase in net assets attributable to holders of redeemableshares per share $ - $ (0.15)
Class I-3
82

CFG Custom Portfolio CorporationNotes To Financial StatementsAs at July 30, 2018 and 2017
13. INCREASE (DECREASE) IN NET ASSETS ATTRIBUTABLE TO HOLDERS OFREDEEMABLE SHARES PER SHARE - continued
2018 2017
Increase in net assets attributable to holders of redeemableshares $ 3,109,972 $ 2,045,328
Weighted average shares outstanding during the year 3,240,653 1,501,147
Increase in net assets attributable to holders of redeemableshares per share $ 0.96 $ 1.36
Class J-32018 2017
Increase in net assets attributable to holders of redeemableshares $ 254,757 $ -
Weighted average shares outstanding during the year 462,039 -
Increase in net assets attributable to holders of redeemableshares per share $ 0.55 $ -
14. IMPLEMENTATION OF NATIONAL INSTRUMENT 81-106
The Corporation is relying on the exemption in section 2.11 of National Instrument 81-106 -Investment Fund Continuous Disclosure not to publicly file its financial statements for the yearended July 30, 2018.
83